Article

Non-Destructive Detection of Water Content in Pork Based on NIR Spatially Resolved Spectroscopy

College of Agricultural Engineering, Shanxi Agricultural University, Jinzhong 030801, China
*
Author to whom correspondence should be addressed.
Agriculture 2023, 13(11), 2114; https://doi.org/10.3390/agriculture13112114
Submission received: 25 October 2023 / Revised: 2 November 2023 / Accepted: 7 November 2023 / Published: 8 November 2023
(This article belongs to the Section Agricultural Product Quality and Safety)

Abstract

:
Water is one of the important factors affecting pork quality. In this study, near-infrared (NIR) spatially resolved (SR) spectroscopy was used to detect the water content of pork. The SR spectra of 150 pork samples were collected within the light source–detector (LS-D) distance range of 4–20 mm (distance interval 1 mm). Models were established based on single-point SR spectra of 17 different LS-D distances and combination SR spectra. The results indicated that combination SR spectra achieved better model performance than the single-point SR spectra, and the LS-D distance significantly affected the model accuracy. The optimal LS-D distance combination of 5, 7, 10, and 12 mm provided the best detection model with the calibration determination coefficient (R2C) of 0.915 and prediction determination coefficient (R2P) of 0.878. Using the competitive adaptive reweighted sampling (CARS) algorithm, 24 characteristic wavelengths were selected. The model built with the characteristic wavelengths also exhibited good detection accuracy, with a R2C of 0.909 and a R2P of 0.867, and the number of wavelengths was greatly reduced compared to the full-wavelength model. This study demonstrated that SR spectroscopy combined with the optimized LS-D distances and screened characteristic wavelengths can be a powerful tool for detecting the water content of pork.

1. Introduction

Pork is one of the main sources of animal fat and protein for people. As an important part of the human diet, pork accounts for about 30% of the world’s meat consumption, ahead of beef and chicken [1]. Water content is an important index that affects the processing, storage, and edible quality of pork. If the water content is too high, then bacterial growth is accelerated, causing pork deterioration and endangering the health of consumers. Meanwhile, a low moisture content affects the flavor, tenderness, and other aspects of pork quality, leads to reduced nutritional value, and causes serious economic losses [2]. The general approaches for moisture determination include direct drying and distillation [3]. Although these methods can give accurate results, they are time-consuming, destructive, and laborious and cannot meet the large-scale detection requirements of the meat industry and market regulation. Therefore, rapid and non-destructive detection methods of pork water content are urgently needed.
Over the past two decades, near-infrared (NIR) spectroscopy has been extensively researched and applied for meat quality and composition detection due to its fast, easy-to-perform, and non-destructive advantages to the samples [4]. Guo et al. [5] quantitatively analyzed the total volatile basic nitrogen value of pork using NIR spectroscopy and established a prediction model using partial least squares regression (PLS) after the sample spectra were pretreated using the methods of the first derivative, multiplicative scattering correction, and the standard normal variate. Zhang et al. [6] investigated the relationship between the water content in fresh pork and NIR spectra in the range of 1000–1680 nm and established two kinds of models with correlation coefficients of 0.839 and 0.810, respectively, using the multiple linear regression (MLR) and PLS methods, and demonstrating the potential of NIR spectroscopy for the non-destructive detection of water content.
However, conventional NIR spectroscopy mostly adopts the single-point reflectance mode. Spectral data acquired in this mode mainly contain the surface information of the tested samples but cannot provide deep tissue information at different depths [7]. Pork comprises heterogeneous biological tissues, and the amount of its components, such as protein, water, and fat, varies spatially or with depth. Differences in water content are observed between pork’s surface and deep tissues. Existing studies mainly focused on spectral data processing and modeling algorithms to mine as much information as possible [8,9,10]. However, using only the surface spectral information to calculate the overall average moisture content of pork samples inevitably decreases the performance of the detection model. Therefore, obtaining more sample spatial information at multiple depths must be a priority.
Compared with conventional NIR spectroscopy, spatially resolved (SR) spectroscopy can acquire sample tissue information of different depths by measuring the diffuse reflected light at multiple points apart from the illumination point of the light source [11]. Monte Carlo simulation results show that the propagation path of light in biological tissues is similar to a ”banana” shape, as shown in Figure 1 [12]. The depth of light propagation in biological tissues is related to the distance between the light source and the detector. The farther the distance, the deeper the light propagation path. The SR spectra of the small light source–detector (LS-D) distance can provide information about the shallow tissues of the sample, but the SR spectra of a large LS-D distance carry information about the deep tissues. Hence, SR spectra carry more spatial information and can comprehensively reflect the sample properties, which is beneficial for improving the model performance. SR spectroscopy can analyze the composition of heterogeneous biological tissues and has been explored in the non-invasive measurement of human tissues and non-destructive detection of agricultural product quality. The measurement of cerebral oxygen saturation during one-lung ventilation was conducted by Tanaka N. et al. using SR spectroscopy [13]. Bogomolov A. et al. [14] applied SR spectroscopy to determine the fat and protein content in milk, with root mean square errors of less than 0.10% and 0.08%, respectively.
Studies concerned with SR spectroscopy showed that the LS-D distance is a key factor affecting the measurement accuracy in SR spectral detection [15]. Increasing this distance helps extend the light propagation path and penetration depth to extract information about the deep tissues of the samples. On the other hand, the intensity of the diffuse reflectance light will decrease, and the signal-to-noise of spectral data may be reduced with the increasing LS-D distance because the light exiting the sample at a large distance travels longer and has a higher chance of being absorbed or scattered [16]. Therefore, comprehensively considering the depth of light transmission and the quality of spectra data, an optimal LS-D distance or distance combination for a specific tissue component should be determined to obtain satisfactory detection models. However, only a few studies have focused on optimizing the LS-D distance, and the optimal distance for detecting the water content of pork has not been confirmed.
Therefore, the overall objective of this study was to explore the feasibility of SR spectroscopy for detecting water content in pork. The specific objectives were as follows: (1) acquire the SR spectra of 150 pork samples within the LS-D distance range of 4–20 mm using a moving-fiber SR spectra measurement system; (2) determine the optimal LS-D distances for water detection to improve the detection accuracy and efficiency, by comparing the performance of the developed models; and (3) extract the characteristic wavelengths using the competitive adaptive reweighted sampling (CARS) algorithm to reduce irrelevant spectral variables and simplify the model. This study should provide a basis for designing a portable SR detection instrument for pork moisture based on optimized LS-D distances and discrete wavelength components, such as light-emitting diode (LED) light sources.

2. Materials and Methods

2.1. Sample Preparation

A total of 150 pieces of fresh pork (pork longissimus dorsi muscle, an important part for evaluating pork quality) were purchased randomly from local markets and transported to the laboratory under refrigeration. A total of 150 pork samples were prepared, which were cut down from each piece of pork and trimmed to the size of 6 cm × 5 cm × 2 cm (length × width × thickness) after removing the superficial fascia. The prepared samples were packaged in plastic film bags and stored at 2 °C in the refrigerator. Forty samples were taken out daily for the SR spectral collection and water content measurement. The experiment was conducted continuously for 4 days.

2.2. SR Spectral Measurement

The SR spectra of the pork samples were acquired using a moving-fiber SR spectra measurement system shown in Figure 2. A supercontinuum laser (WL-MICRO, Fianium Company, Southampton, UK) with a total output power of 200 mW was used as the light source. The light source vertically irradiated the pork sample through the incident fiber 2 cm away from the sample surface. The detection fiber was in close contact with the sample surface. A NIR spectrometer (Filed Spec3, ASD company, West Hollywood, CA, USA) with a wavelength resolution of 1 nm was used to collect the spectral data from 350 nm to 2500 nm. The LS-D distance was defined as the distance between the centers of the incident and the detection fiber. The minimum LS-D distance was 4 mm when the two fibers were in close contact (the diameters of the two fibers were 5 and 3 mm, respectively). An electrically controlled micro-displacement platform (uksa200, Zolix Company, Beijing, China) was used to drive the incident fiber to move horizontally at a distance interval of 1 mm. The SR spectra of the pork samples were collected within the LS-D distance range of 4–20 mm (including 17 different LS-D distances). In this study, when collecting SR spectra, each sample was scanned three times in different regions, and each scan obtained 17 single-point SR spectra of different LS-D distances. Then, the three single-point SR spectra with the same LS-D distance were averaged to obtain the final SR spectra of 17 different LS-D distances.

2.3. Measurement of Water Content

After spectral collection, the water contents of pork samples were measured via direct drying in accordance with the provisions of GB/T5009.3-2010 (China National Standard, 2010) [17]. When measuring the water content of a sample, the sample was divided into three sections. The water content of each section was measured, and the average was taken as the measured value of the water content of the sample.

2.4. Spectral Preprocessing

Prior to model establishment, spectral preprocessing was performed using wavelet transform to reduce the influence of spectral noise and improve the signal-to-noise ratio. This method has been widely applied in spectral signal compression, denoising, and smoothing [18]. It can effectively separate high-frequency noise and low-frequency signals through multiscale decomposition. In this study, db5 was used as the wavelet base function to denoise the original spectra with the five-level decomposition and soft threshold method.

2.5. Model Construction and Optimization of the LS-D Distance

Partial least squares regression (PLS) was used to establish the water detection models for each of the 17 groups of single-point SR spectra acquired at different LS-D distances to determine the optimal LS-D distance. PLS is one of the most commonly used regression algorithms in VIS/NIR spectroscopy [19]. The indicators of model performance include the determination coefficient (R2C) and root mean square error (RMSEC) of the calibration set and the determination coefficient (R2P) and root mean square error (RMSEP) of the prediction set. The calibration set was used to build the models, and the validation set was employed to evaluate their predictive capability. Leave-one-out cross-validation was adopted to determine the optimal number of latent variables (nLV) based on the minimum root mean squared error of cross-validation (RMSECV). A good model generally has high R2C and R2P (close to 1) but low RMSEC and RMSEP. These parameters were determined using Equations (1) and (2).
R ( C , P ) 2 = 1 i = 1 n y ^ i y i 2 i = 1 n y i y c 2
R M S E ( C , V , C V ) = 1 n i = 1 n y ^ i y i 2
where n is the number of samples in the data set; y ^ i and y i are, respectively, the predicted and measured values of the ith sample; and y c is the average of all samples.
The synergy interval partial least squares algorithm (SiPLS) was applied to select the optimal combination of LS-D distances. The SiPLS is an effective characteristic region selection algorithm based on the interval partial least squares regression [20]. First, each sample’s single-point SR spectra of 17 different LS-D distances were connected sequentially into a 2D arrangement from SR1 to SR17. Second, the connected spectra were equally divided into 17 intervals (each interval corresponded to a group of single-point SR spectra of an LS-D distance), and the PLS models were built with all possible combinations of two, three, or four different intervals. Finally, the interval combination with the lowest RMSECV was selected as the optimal interval combination, and the corresponding optimal combination of LS-D distances was determined.

2.6. Characteristic Wavelength Selection

SR spectra carry more sample information but could also contain irrelevant and redundant information in the full-wavelength range; the latter type of information inevitably has an adverse impact on the complexity and accuracy of the detection model. Therefore, the characteristic wavelengths should be screened using variable selection algorithms to eliminate the redundant spectral information and simplify the model. In this study, characteristic wavelength selection was carried out with the CARS algorithm. CARS is a variable selection method based on the principle of “survival of the fittest”, coupled with Monte Carlo sampling and PLS regression. The exponential decreasing function and adaptive reweighted sampling were adopted to retain the wavelengths with large absolute values of regression coefficients in the PLS model and eliminate wavelengths with small weights. Cross-validation was performed to choose the variable subset with the lowest RMSECV and determine the optimal combination of characteristic wavelengths [21].

2.7. Software

All algorithms used MATLAB R2015b (MathWorks, Natick, MA, USA).

3. Results and Discussion

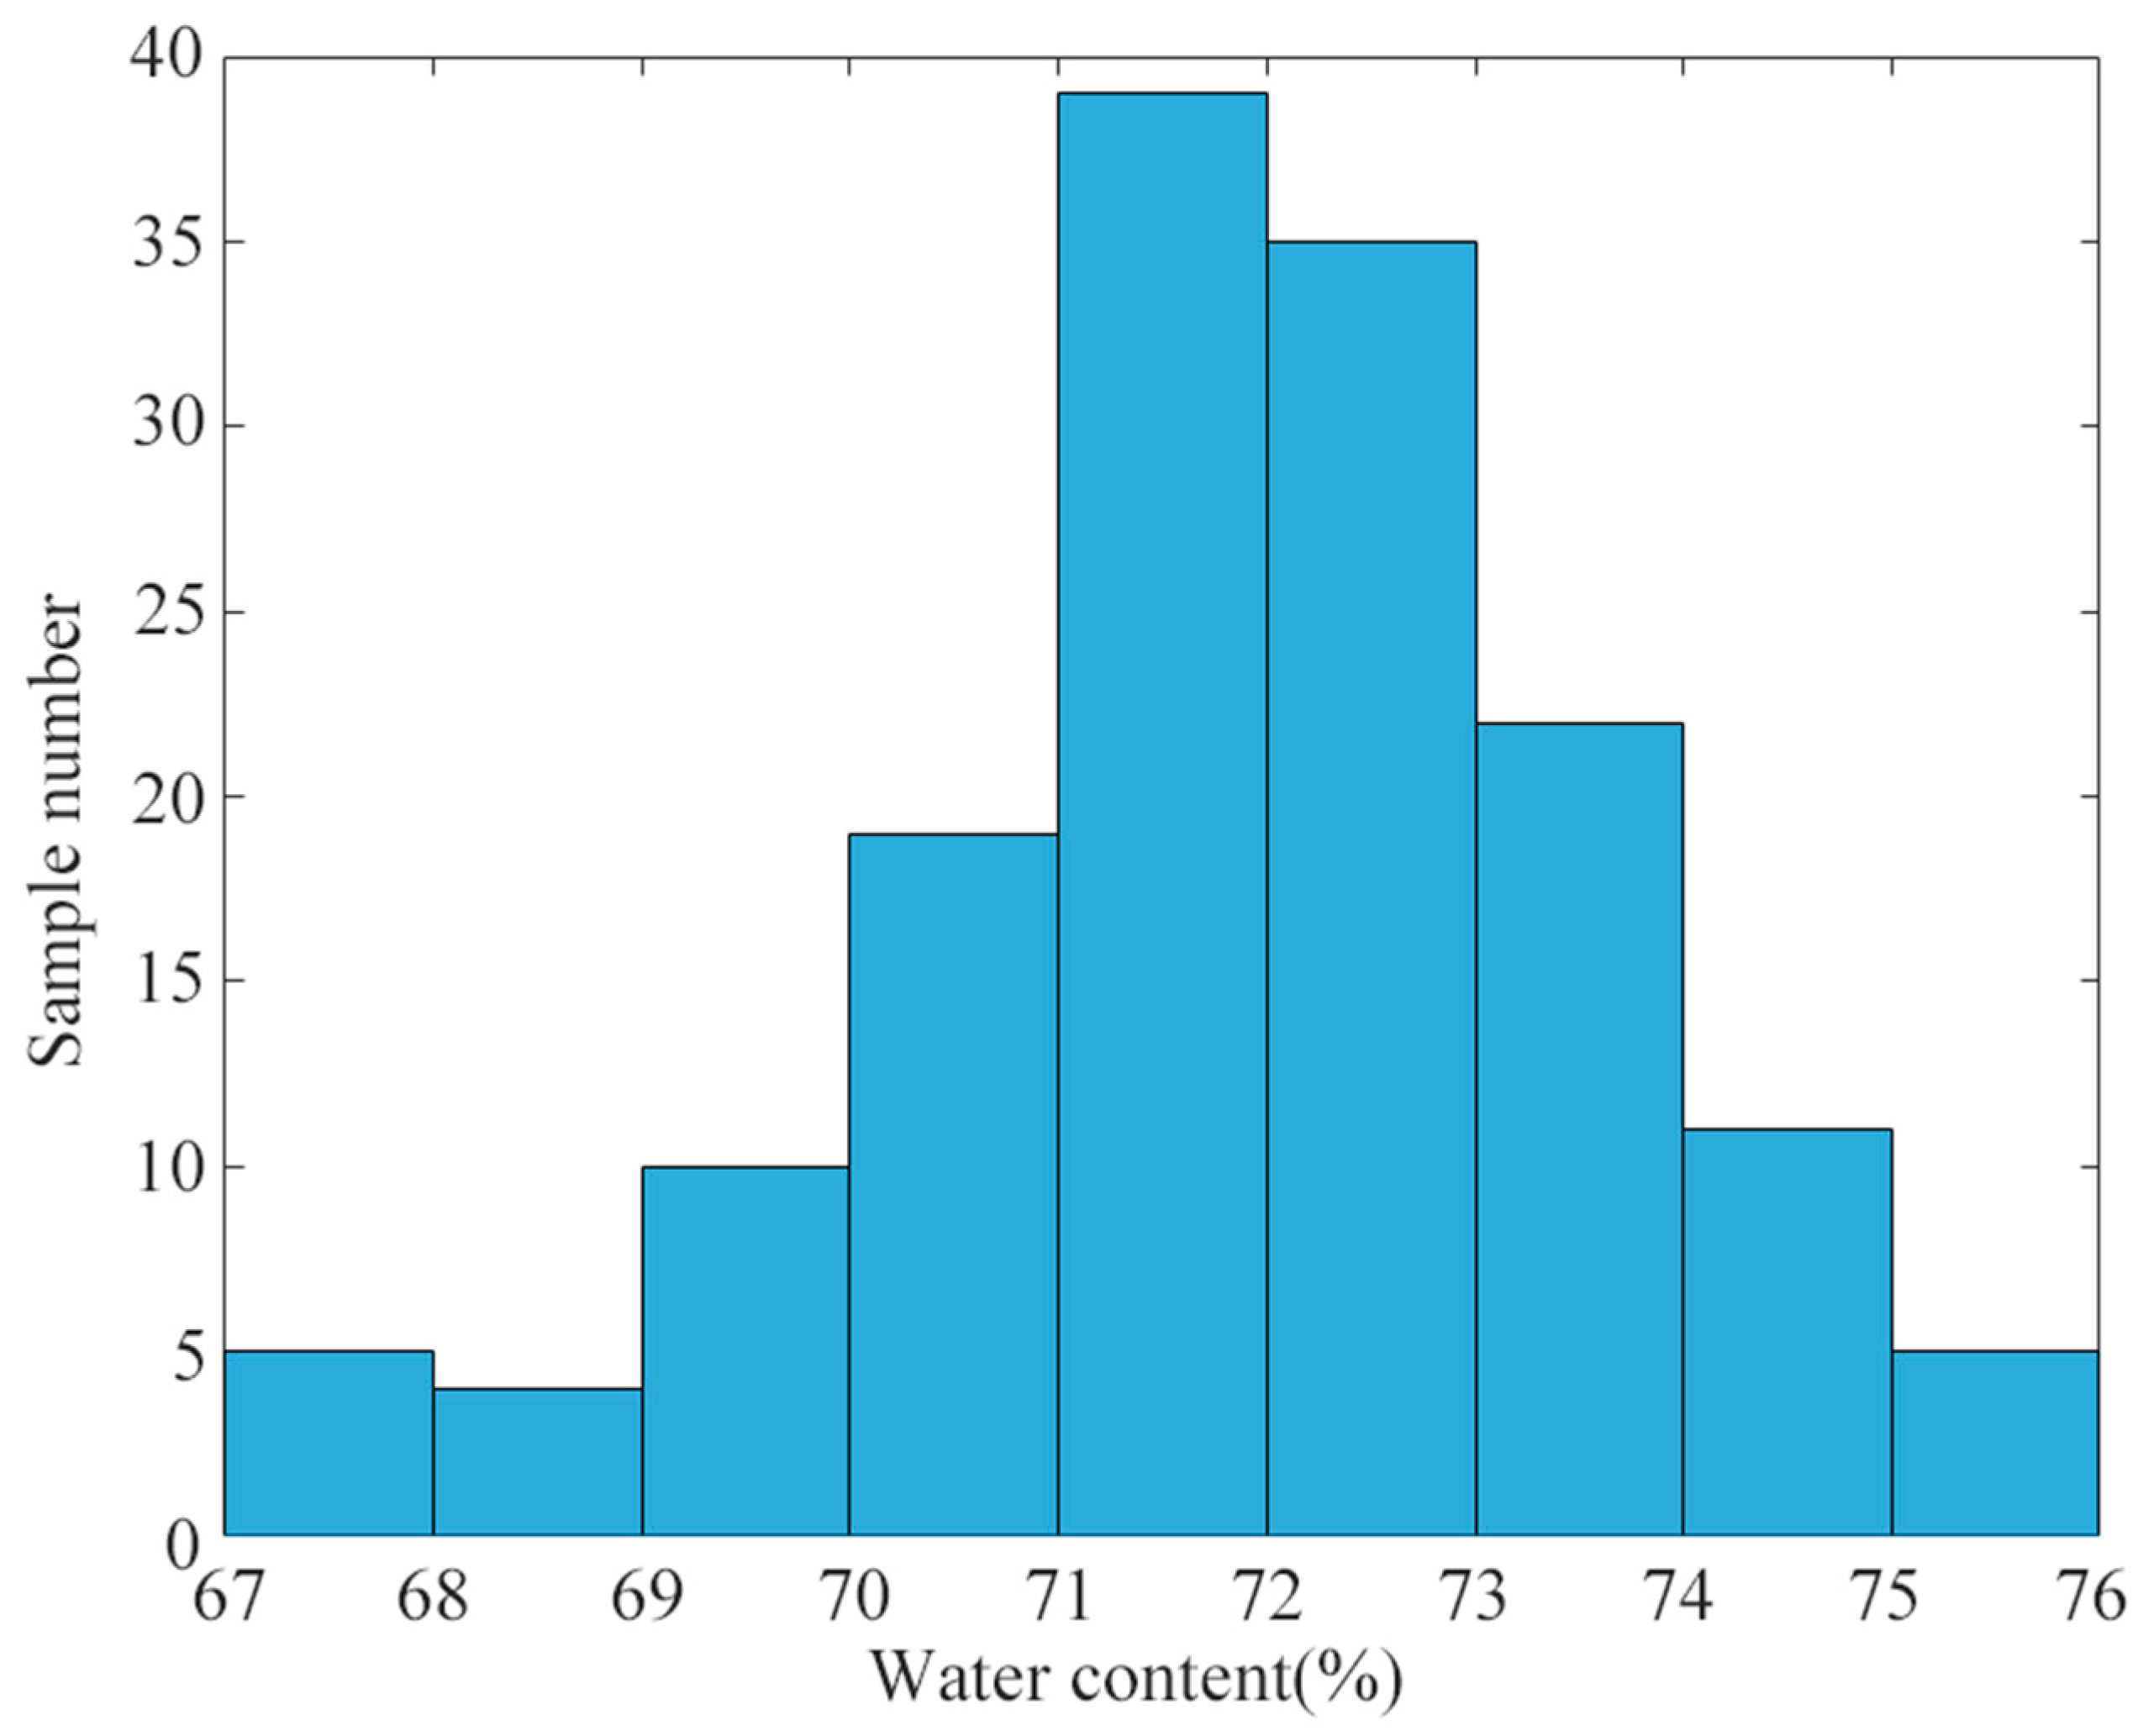
3.1. Statistics of Measured Water Content

Figure 3 presents the approximately normal distribution of water contents measured via direct drying for all 150 pork samples. Table 1 shows the statistics of the water contents. The maximum and minimum water contents were 75.91% and 67.42%, respectively, with a mean value of 71.91% and a standard deviation of 1.72%. All 150 pork samples were ranked according to the water content, and then, the middle sample of every three samples was grouped into the prediction set, while the remaining two were grouped into the calibration set. The calibration and prediction sets contained 100 and 50 samples, respectively, and the corresponding statistical data are also shown in Table 1.

3.2. Spectral Characteristics of Pork Samples

Figure 4 shows the averaged SR spectra of all pork samples in 3D form after preprocessing using wavelet transform, with the coordinate axes representing the wavelength, LS-D distance, and reflectance intensity. The wavelength range of 400–1430 nm (including 1031 wavelengths) was chosen for further analysis because the spectral data above 1430 nm or below 400 nm were close to zero and regarded as invalid information. The LS-D distance was from 4 mm to 20 mm. Figure 5 shows the SR spectra in 2D form for the 17 different LS-D distances. As displayed in Figure 4 and Figure 5, the spectral intensity decreased with the increase in LS-D distance. When the LS-D distance increases, the propagation path of light becomes long, the penetration depth becomes deep, and more light can be absorbed or scattered by the pork sample, thus weakening the outgoing light intensity. Therefore, SR spectra of different LS-D distances should contain sample information at different depths, suggesting that single-point SR spectra at each LS-D distance may provide different model performances for water detection. The main spectral absorption bands were observed at 760, 980, 1067, 1140, and 1168 nm, corresponding to the troughs in Figure 5. The absorption band at around 760 nm may be related to the absorption of water or deoxyhemoglobin [22,23]. The absorption band around 980 nm is related to the O-H second overtone, which is mainly associated with water absorption [24]. The band around 1068 nm may be the second O-H overtone or the second N-H overtone [25]. The bands around 1140 and 1168 nm might be associated with the second C-H overtone, which is related to meat fat [25].

3.3. Modelling Construction and Optimization of the LS-D Distance

Table 2 presents the results of the PLS models based on single-point SR spectra of different LS-D distances. The determination coefficients of the calibration and prediction sets were 0.697–0.855 (R2C) and 0.670–0.831 (R2P). This finding demonstrates that the LS-D distance significantly impacts the performance of the detection models, and the SR spectra of different LS-D distances carry different information.
Overall, the calibration and prediction determination coefficients showed an upward trend with the increase in LS-D distance until the distance reached 10 mm. This phenomenon may have occurred because the SR spectra at large LS-D distances contain more sample information than those at short LS-D distances due to the long propagation distance and deep penetration depth of light in pork tissues. When the LS-D distance was larger than 10 mm, the performance of the models decreased gradually. This may be because the spectral signals are weakened, and the signal-to-noise ratio decreases at LS-D distances longer than 10 mm. Therefore, the optimal LS-D distance of single-point SR spectra was 10 mm, with the model’s R2C and R2P of 0.855 and 0.831, respectively.
Table 3 shows the selection results of the optimal combination of SR spectra using the SiPLS with combinations of two, three, or four different intervals (each spectral interval corresponds to a group of single-point SR spectra of an LS-D distance).
For the combination of two intervals, the combination of SR7 and SR8 (corresponding to LS-D distances of 10 and 11 mm, respectively) was selected as the optimal combination of SR spectra. This combination led to a 2.81% improvement in R2C and a 2.65% improvement in the R2P of the water detection model compared with the optimal single-point SR spectra. For the combination of three intervals, the combination of SR3, SR7, and SR9 (corresponding to LS-D distances of 6, 10, and 12 mm, respectively) was selected as the optimal combination of SR spectra. This combination led to 3.39% and 3.25% increases for R2C and R2P, respectively. For the combination of four intervals, the combination of SR2, SR4, SR7, and SR9 (corresponding to LS-D distances of 5, 7, 10, and 12 mm, respectively) was selected as the optimal combination of SR spectra. This combination provided the best model performance with 7.02% and 5.66% increases for R2C and R2P, respectively. All these results showed that the models built with the combinations of SR spectra performed better than those based on single-point SR spectra. This is because the combinations of SR spectra can provide more information about the composition and structure of the detected sample compared with the single-point spectra. The optimal LS-D distance combination of 5, 7, 10, and12 mm (corresponding to the combination of SR2, SR4, SR7, and SR9 shown in Figure 6) covered the distance range of 5–12 mm, where the SR spectra can provide the shallow and deep tissue information of the sample.

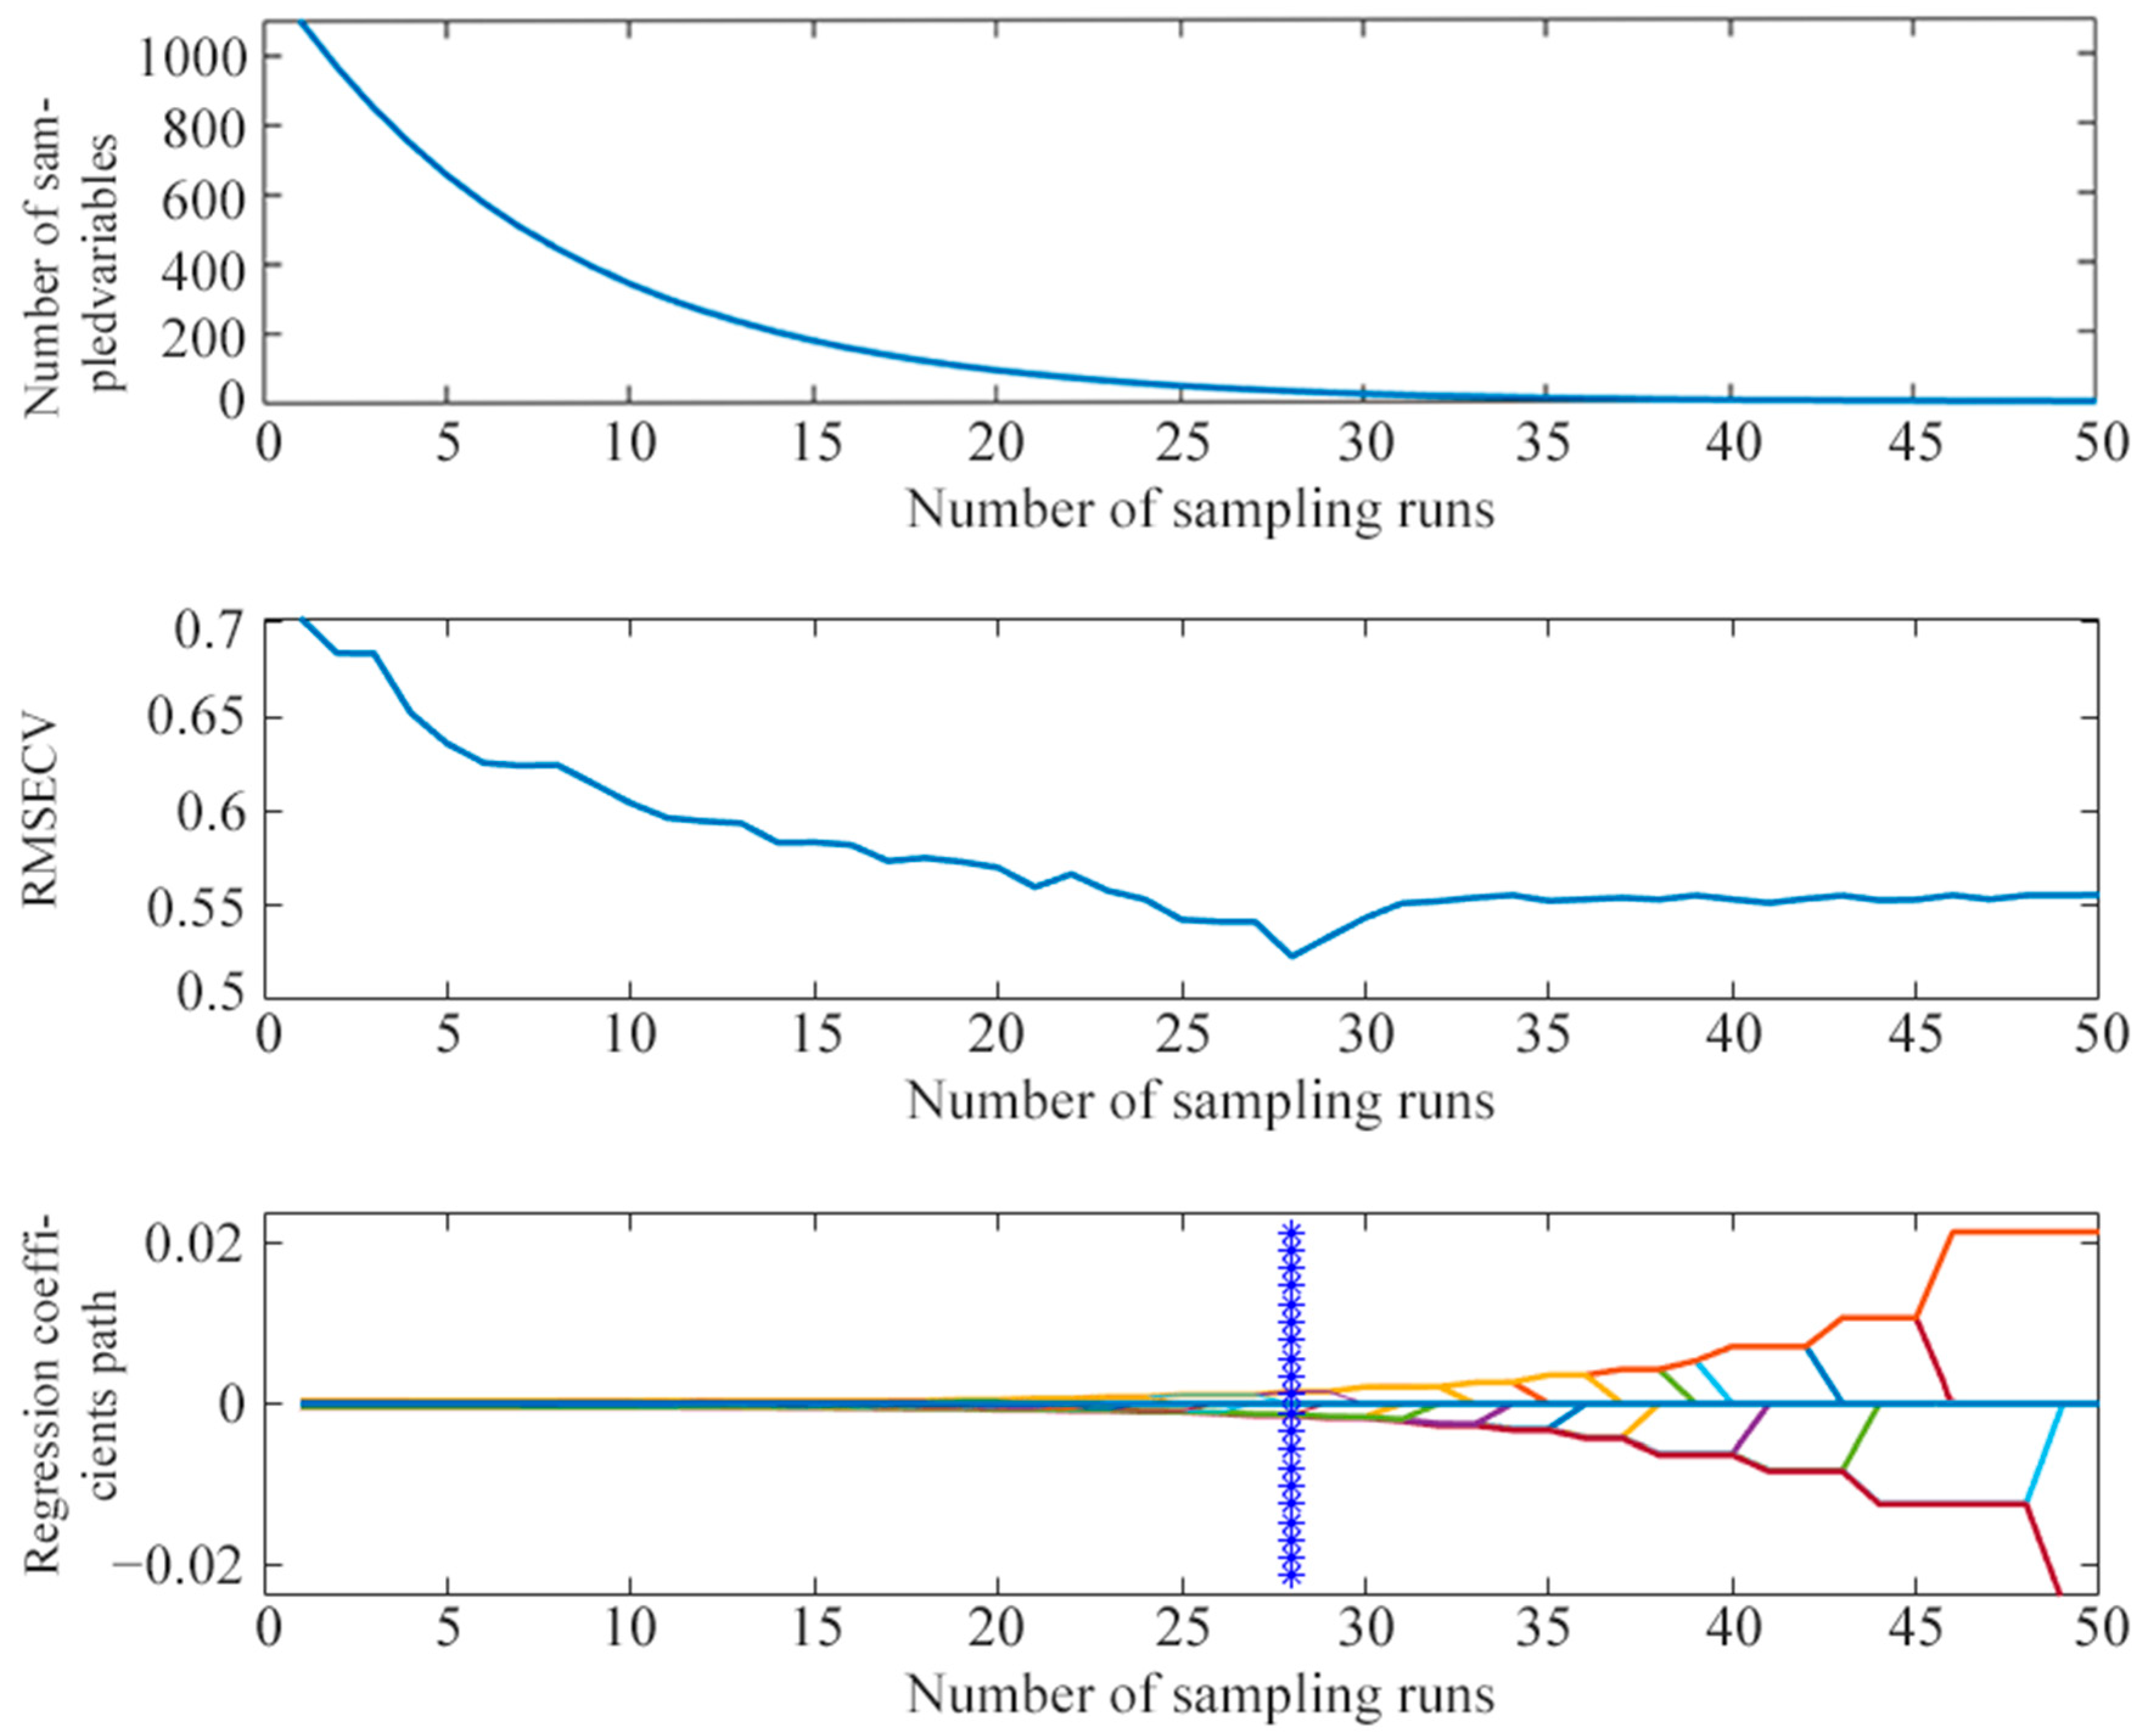
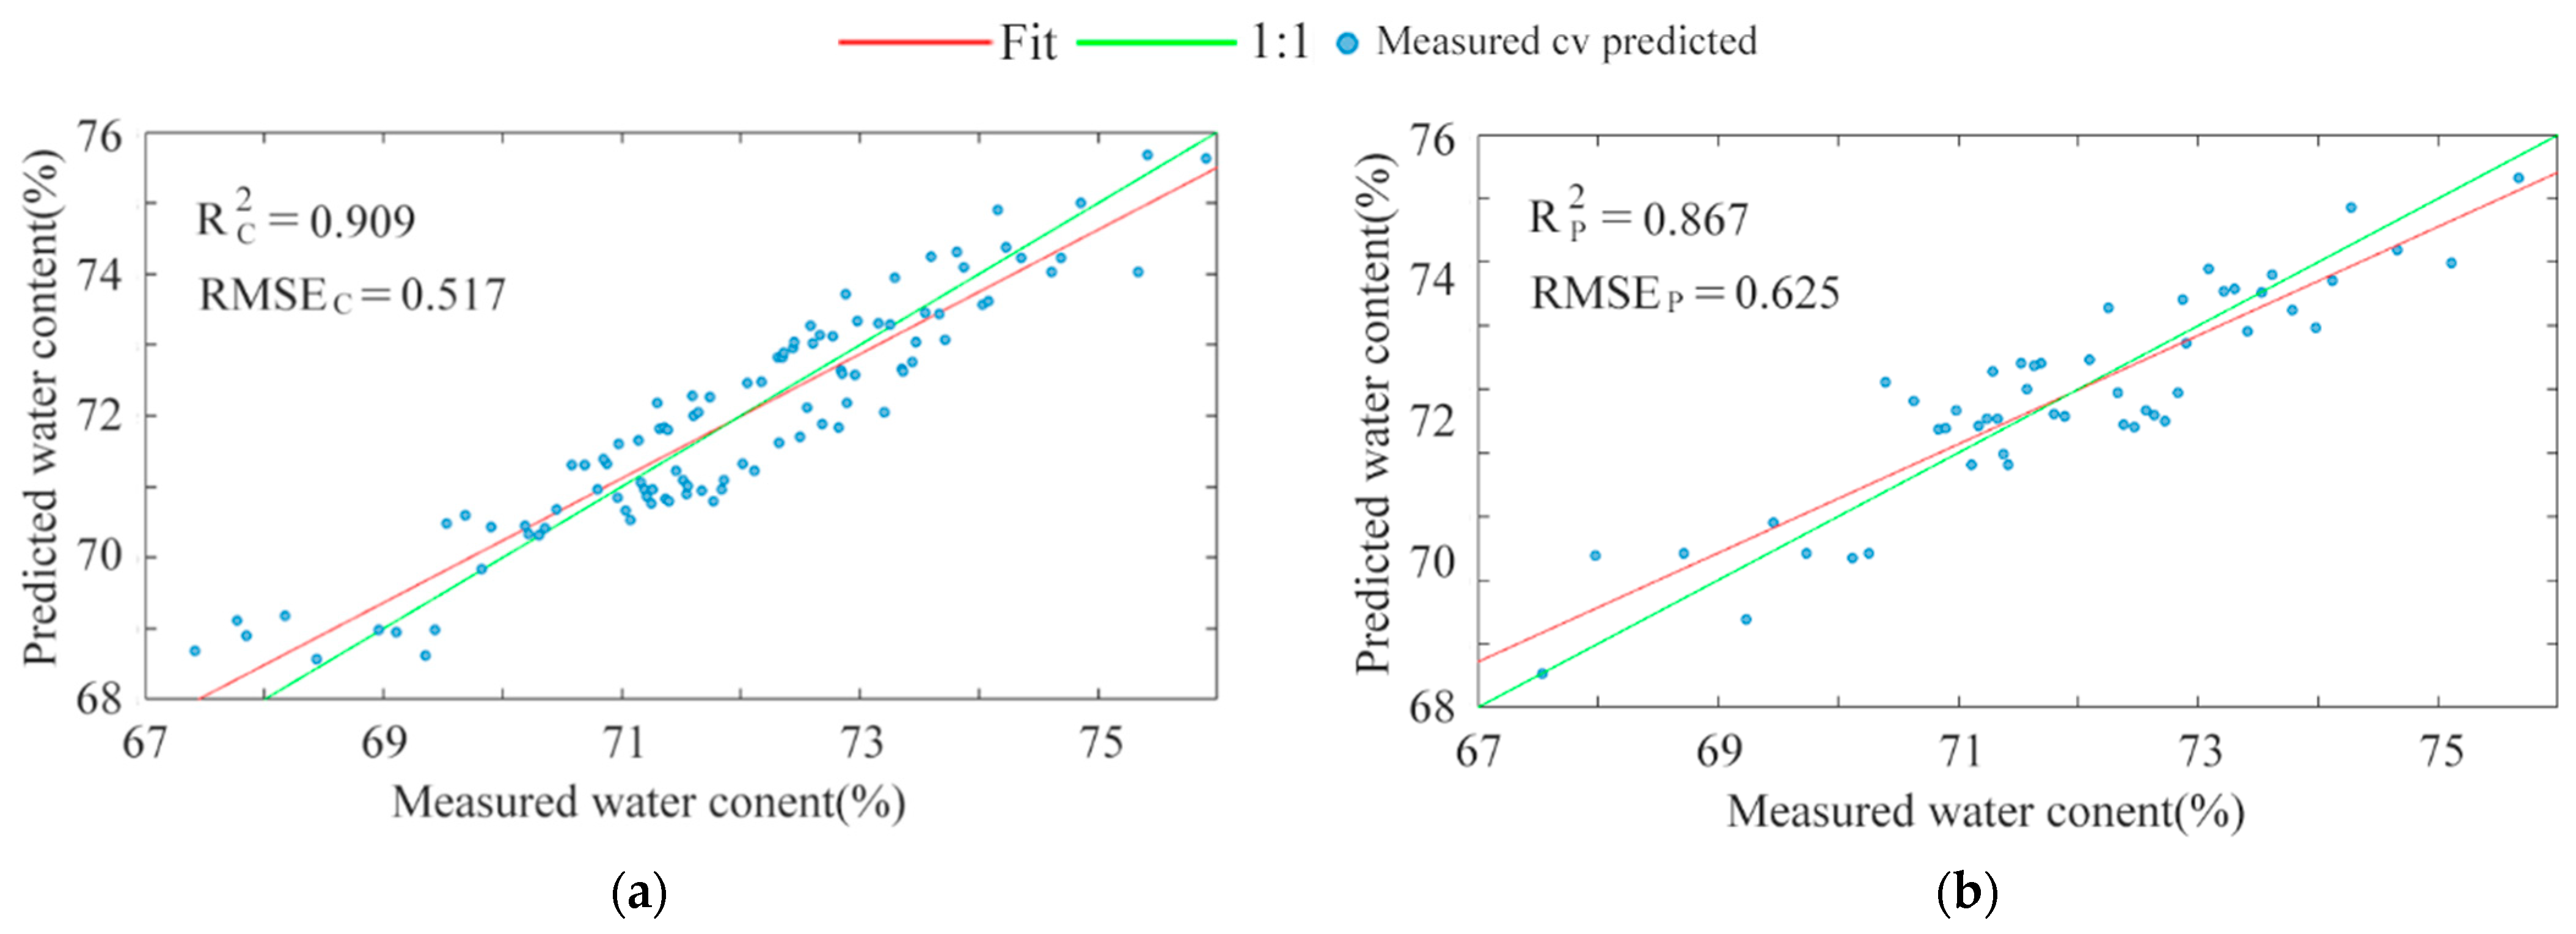
3.4. Characteristic Wavelength Selection

The CARS algorithm was applied to select the characteristic wavelengths based on the averaged spectra of the optimal combination of SR spectra. The selection process of characteristic wavelength is shown in Figure 7.
The number of sampled variables (i.e., the number of wavelengths) decreased rapidly during the first 15 sampling runs and then slowed down gradually, corresponding to the two selection phases of CARS: “fast selection” and “refined selection”. The RMSECV decreased gradually to the minimum value at the 28th sampling run, indicating that the variables unrelated to the water content were eliminated. After the 28th sampling run, the RMSECV slightly increased due to the loss of information caused by removing some water-related variables. Therefore, 24 variables corresponding to the minimum RMSECV were selected as the characteristic wavelengths at the 28th sampling run, which were located at 575, 692, 694, 705, 751, 753, 756, 762, 765, 964, 970, 974, 981, 985, 987, 990, 1058, 1072, 1135, 1139, 1168, 1172, 1174, and 1248 nm. Most of the characteristic wavelengths were located around 760 nm (751, 753, 756, 762, and 765 nm) and 980 nm (964, 970, 974, 981, 987, and 990 nm), indicating that they might be associated with water content. The characteristic wavelengths of 1135, 1139, 1168, 1172, and 1174 nm were around 1140 nm and 1168 nm, indicating that they might be related to meat fat content and that the presence of fat has an impact on the detection of water content [26]. In summary, the selected characteristic wavelengths were consistent with the main absorption band.
The selected characteristic wavelengths were used to build the PLS detection model of the water content based on the average of the optimal combination of SR spectra. The results are shown in Table 4. The performance of the model based on the characteristic wavelengths was better than that of the full-wavelength model of the optimal single-point SR spectra; the R2C and R2P increased from 0.855 to 0.909 and from 0.831 to 0.867, respectively, and the wavelength number decreased from 1031 to 24. Meanwhile, the performance of the model based on the characteristic wavelengths was slightly poorer than that of the full-wavelength model of the optimal combination of SR spectra, with the wavelength number decreasing from 4124 to 24. Figure 8 shows that a good linear relationship existed between the measured and predicted values of water content. Therefore, the selection of characteristic wavelengths can effectively reduce the number of wavelengths while maintaining the good performance of the model.

4. Conclusions

This study reported the detection of water content in pork using near-infrared SR spectroscopy. Detection models based on the single-point SR spectra of 17 different LS-D distances and the combination SR spectra were built, respectively, and noticeable differences in the performance of the models were observed. The results indicated that LS-D distance significantly impacts the detection models, and the combinations of SR spectra provided better models than single-point SR spectra. The optimal LS-D distance of single-point SR spectra was 10 mm, with the model’s R2C and R2P of 0.855 and 0.831, respectively. The LS-D distance combination of 5, 7, 10, and 12 mm provides the best model performance, with the R2C and R2P of 0.915 and 0.878, respectively. Choosing the optimal LS-D distances not only improved the model accuracy but also reduced the movement times of the incident fiber, increasing the detection efficiency. A total of 24 characteristic wavelengths related to water detection were selected using the CARS algorithm. The PLS model based on the characteristic wavenumbers was established and compared with the full-wavelength models. It is evident that the selection of a characteristic wavelength can not only effectively compress the variables but also achieve satisfactory detection results.

Author Contributions

Conceptualization, methodology, writing—original draft, writing—review and editing, Z.Z.; data curation, S.W.; investigation, Y.Z.; funding acquisition, Z.Z. All authors have read and agreed to the published version of the manuscript.

Funding

This research was funded by the Applied Basic Research Program of Shanxi Province, China, grant number 201701D121103, the Key Research and Development Program of Shanxi Province, China, grant number 202102020101012, and the Science and Technology Innovation Fund of Shanxi Agricultural University, China, grant number 2015YJ24.

Institutional Review Board Statement

Not applicable.

Data Availability Statement

Available upon request from the corresponding author. The data are not publicly available due to copyright implications.

Acknowledgments

The authors would like to thank the technical editor and anonymous reviewers for their constructive comments and suggestions on this study.

Conflicts of Interest

The authors declare no conflict of interest.

References

  1. Chernukha, I.; Kotenkova, E.; Pchelkina, V.; Ilyin, N.; Utyanov, D.; Kasimova, T.; Surzhik, A.; Fedulova, L. Pork fat and meat: A balance between consumer expectations and nutrient composition of four pig breeds. Foods 2023, 12, 690. [Google Scholar] [CrossRef]
  2. Xu, Y.; Zhang, D.; Xie, F.; Li, X.; Schroyen, M.; Li, C.; Hou, C. Changes in water holding capacity of chilled fresh pork in controlled freezing-point storage assisted by different modes of electrostatic field action. Meat Sci. 2023, 204, 109269. [Google Scholar] [CrossRef]
  3. Liu, P.; Li, J. Three methods of detecting moisture content in pork. Meat Ind. 2018, 443, 33–35. [Google Scholar]
  4. Prieto, N.; Pawluczyk, O.; Dugan, M.E.R.; Aalhus, J.L. A review of the principles and applications of near-infrared spectroscopy to characterize meat, fat, and meat products. Appl. Spectrosc. 2017, 71, 1403–1426. [Google Scholar] [CrossRef]
  5. Guo, Q.; Peng, Y.; Li, Y.; Tian, W.; Qiao, X. Design and test of optical sensor for meat non-destructive detection. Trans. Chin. Soc. Agric. Mach. 2020, 51, 484–490. [Google Scholar]
  6. Zhang, H.-Y.; Peng, Y.-K.; Wang, W. Rapid non-destructive detection of water content in fresh pork. J. Food Saf. Qual. 2012, 3, 23–26. [Google Scholar]
  7. Igne, B.; Talwar, S.; Feng, H.; Drennen, J.K.; Anderson, C.A. Near-Infrared spatially resolved spectroscopy for tablet quality determination. J. Pharm. Sci. 2015, 104, 4074–4081. [Google Scholar] [CrossRef]
  8. Zheng, X.; Chen, L.; Lin, X.; Zhang, D. Non-Destructive detection of meat quality based on multiple spectral dimension reduction methods by near-infrared spectroscopy. Foods 2023, 12, 300. [Google Scholar] [CrossRef]
  9. Mishra, P.; Verkleij, T.; Klont, R. Improved prediction of minced pork meat chemical properties with near-infrared spectroscopy by a fusion of scatter-correction techniques. Infrared Phys. Technol. 2021, 113, 103643. [Google Scholar] [CrossRef]
  10. Qiao, L.; Lu, B.; Dong, J.; Li, B.; Zhao, B.; Tang, X. Total volatile basic nitrogen content in duck meat of different varieties based on calibration maintenance and transfer by use of a near-infrared spectrometric model. Spectrosc. Lett. 2020, 53, 44–54. [Google Scholar] [CrossRef]
  11. Yuan, H.; Liu, C.; Wang, H.; Wang, L.; Dai, L. Early pregnancy diagnosis of rabbits: A non-invasive approach using NIR spatially resolved spectroscopy. Spectrochim. Acta Part A Mol. Biomol. Spectrosc. 2022, 264, 120251. [Google Scholar] [CrossRef]
  12. Wen, X.; Wang, Z.; Huang, L. Measurement of myoglobin in pork meat by using steady spatially-resolved spectroscopy. Trans. CSAE 2010, 26, 375–379. [Google Scholar]
  13. Tanaka, N.; Katoh, I.R.; Yamamoto, M.; Hoshino, K.; Morimoto, Y.; Ito, Y.M.; Kato, T. Changes in cerebral oxygen saturation during one-lung ventilation determined using spatially resolved spectroscopy and contributing factors. J. Clin. Anesth. 2020, 59, 99–100. [Google Scholar] [CrossRef]
  14. Bogomolov, A.; Belikova, V.; Galyanin, V.; Melenteva, A.; Meyer, H. Reference-free spectroscopic determination of fat and protein in milk in the visible and near infrared region below 1000nm using spatially resolved diffuse reflectance fiber probe. Talanta 2017, 167, 563–572. [Google Scholar] [CrossRef]
  15. Beers, R.V.; Aernouts, B.; Gutiérrez, L.L.; Erkinbaev, C.; Rutten, K.; Schenk, A.; Nicolaï, B.; Saeys, W. Optimal illumination-detection distance and detector size for predicting braeburn apple maturity from VIS/NIR laser reflectance measurements. Food Bioprocess Technol. 2015, 8, 2123–2126. [Google Scholar] [CrossRef]
  16. Zhang, L.; Sun, M.; Wang, Z.; Li, H.; Li, Y.; Li, G.; Lin, L. Noncontact blood species identification method based on spatially resolved near-infrared transmission spectroscopy. Infrared Phys. Technol. 2017, 85, 32–38. [Google Scholar] [CrossRef]
  17. GB5009.3-2010; Determination of Moisture in Foods. Ministry of Health of the People’s Republic of China: Beijing, China, 2010.
  18. Wang, M.; An, H.; Cai, W.; Shao, X. Wavelet Transform Makes Water an Outstanding Near-Infrared Spectroscopic Probe. Chemosensors 2023, 11, 37. [Google Scholar] [CrossRef]
  19. Rukundo, I.R.; Danao, M.-G.C.; Mitchell, R.B.; Weller, C.L. Evaluation of predictive performance of PLS regression models after being transferred from benchtop to handheld NIR spectrometers. Biosyst. Eng. 2022, 218, 245–255. [Google Scholar] [CrossRef]
  20. Yan, X.; Xie, Y.; Chen, J.; Yuan, T.; Leng, T.; Chen, Y.; Xie, J.; Yu, Q. NIR spectrometric approach for geographical origin identification and taste related compounds content prediction of lushan yunwu tea. Foods 2022, 11, 2976. [Google Scholar] [CrossRef]
  21. Li, Y.; Yang, X. Quantitative analysis of near infrared spectroscopic data based on dual-band transformation and competitive adaptive reweighted sampling. Spectrochim. Acta Part A Mol. Biomol. Spectrosc. 2023, 285, 121924. [Google Scholar] [CrossRef]
  22. Cozzolino, D.; Murray, I. Identification of animal meat muscles by visible and near infrared reflectance spectroscopy. LWT 2004, 37, 447–452. [Google Scholar] [CrossRef]
  23. Cozzolino, D.; Murray, I. Effect of sample presentation and animal muscle species on the analysis of meat by near infrared reflectance spectroscopy. J. Near Infrared Spectrosc. 2002, 10, 37–44. [Google Scholar] [CrossRef]
  24. Barbin, D.; Elmasry, G.; Sun, D.-W.; Allen, P. Near-infrared hyperspectral imaging for grading and classification of pork. Meat Sci. 2012, 90, 259–268. [Google Scholar] [CrossRef]
  25. Stuart, B. Infrared Spectroscopy: Fundamentals and Applications; Wiley: New York, NY, USA, 2004; pp. 71–94. [Google Scholar]
  26. Huang, Y.; Chen, G.; Xia, J.; Yu, H. Status and trends of nondestructive detection technology for water-injected meat. Trans. Chin. Soc. Agric. Mach. 2015, 46, 207–215. [Google Scholar]
Figure 1. Approximate propagation path of light in biological tissue.
Agriculture 13 02114 g001
Figure 2. Schematic of the SR spectra measurement system.
Agriculture 13 02114 g002
Figure 3. Distribution of measured water content.
Agriculture 13 02114 g003
Figure 4. SR spectra of a pork sample in 3D form.
Agriculture 13 02114 g004
Figure 5. SR spectra of a pork sample in 2D form (SR1-SR17 represent, respectively, the single-point SR spectra of 17 different LS-D distances, the same as below).
Agriculture 13 02114 g005
Figure 6. The optimal combination of SR spectra selected using the SiPLS.
Agriculture 13 02114 g006
Figure 7. Process of wavelength selection using CARS.
Agriculture 13 02114 g007
Figure 8. Scatter plot of model based on characteristic wavelengths: (a) calibration set and (b) prediction set.
Agriculture 13 02114 g008
Table 1. Statistical result of measured water content.
DatasetSample NumberMinimumMaximumMeanSTD
Sample set15067.42%75.91%71.91%1.72%
Calibration set10067.42%75.91%71.92%1.72%
Prediction set5067.54%75.67%71.91%1.73%
Table 2. The results of models based on single-point SR spectra.
Single-Point SR SpectraLS-D Distance (mm)nLVR2CRMSECR2PRMSEP
SR1470.7950.7750.7510.855
SR2570.8300.7050.8100.747
SR3660.8140.7380.8040.758
SR4770.8470.6700.8230.720
SR5870.8420.6810.8150.737
SR6970.8510.6630.8290.708
SR71070.8550.6510.8310.704
SR81170.8460.7360.8300.707
SR91270.8470.6670.8250.717
SR101370.8240.7200.8080.751
SR111470.8070.7530.7970.771
SR121570.8050.7560.7860.792
SR131670.7890.7850.7400.873
SR141760.7770.8080.7560.815
SR151870.7790.8060.7230.901
SR161960.7490.8580.6910.952
SR172060.6970.9420.6700.983
Table 3. The results of models based on the combination of SR spectra.
Number of SR SpectraOptimal Combination of SR SpectraOptimal Combination of LS-D Distance (mm)nLVR2CRMSECR2PRMSEP
2SR7, SR810, 1170.8790.5980.8530.657
3SR3, SR7, SR96, 10, 1280.8840.5850.8580.645
4SR2, SR4, SR7, SR95, 7, 10, 1280.9150.5010.8780.598
Table 4. Results of PLS models based on different types of wavelength.
Type of Model WavelengthWavelength NumbernLVR2CRMSECR2PRMSEP
Full wavelength (the optimal single-point SR spectra)103170.8550.6510.8310.704
Full wavelength (the optimal combination of SR spectra)412480.9150.5010.8780.598
Characteristic wavelength2470.9090.5170.8670.625
Disclaimer/Publisher’s Note: The statements, opinions and data contained in all publications are solely those of the individual author(s) and contributor(s) and not of MDPI and/or the editor(s). MDPI and/or the editor(s) disclaim responsibility for any injury to people or property resulting from any ideas, methods, instructions or products referred to in the content.

