
Milk Yield Prediction and Economic Analysis of Optimized Rearing Environment in a Cold Region Using Neural Network Model

Abstract
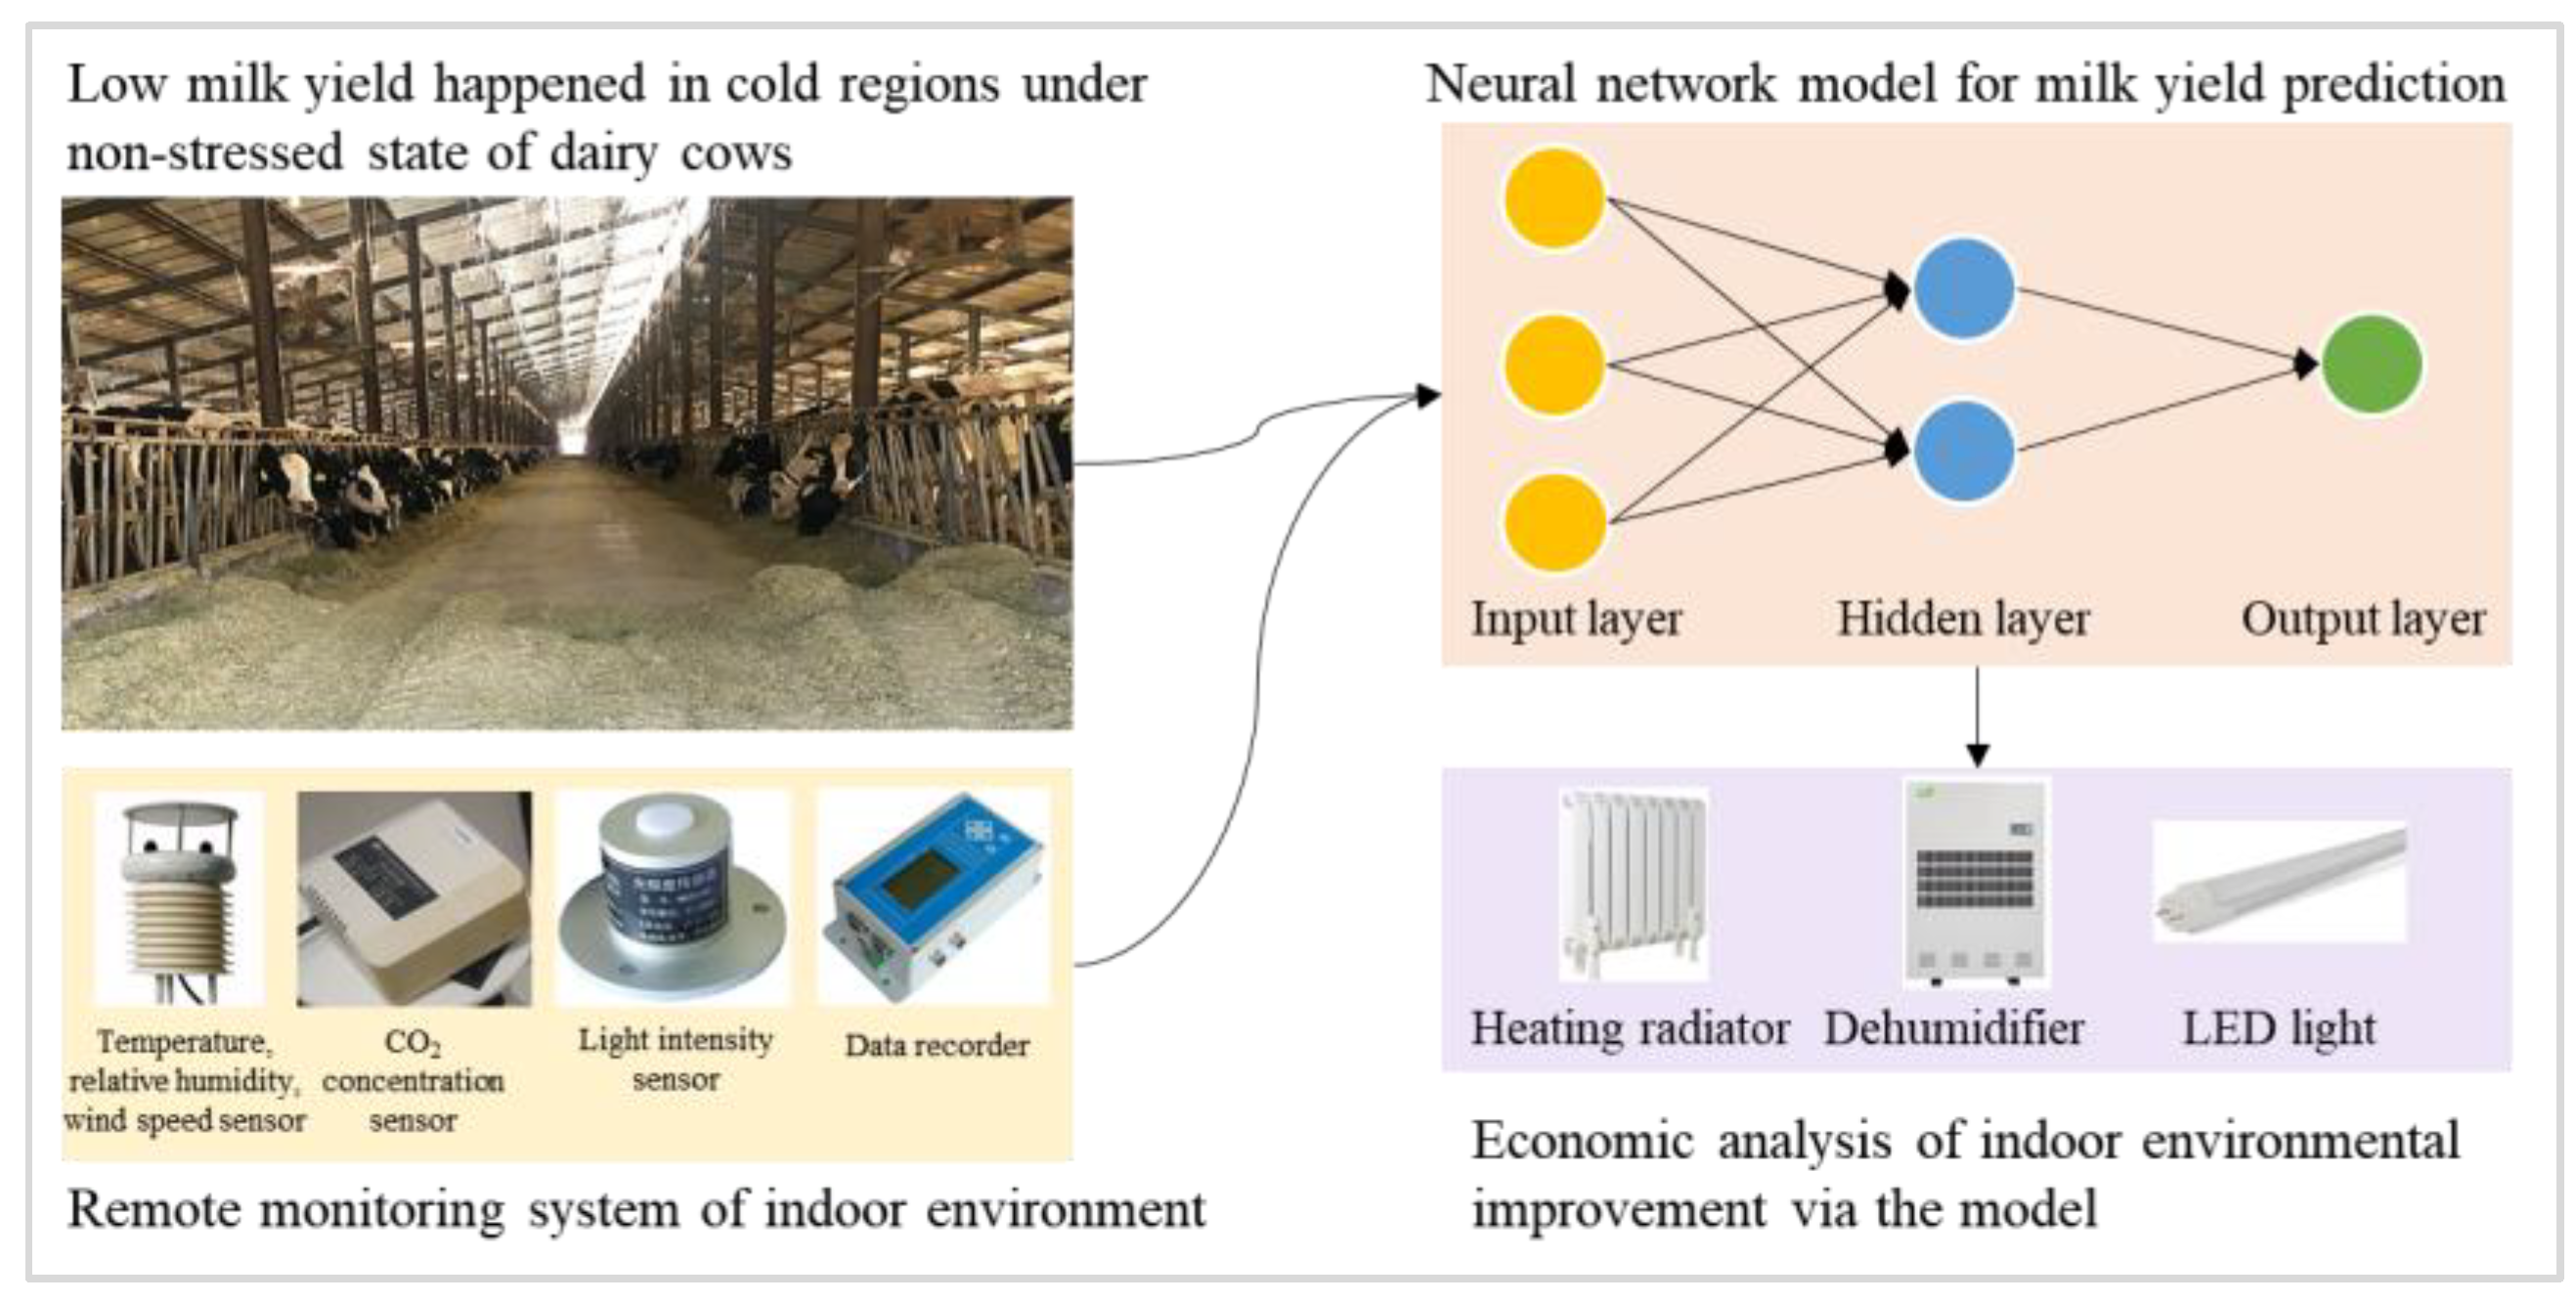
:1. Introduction
2. Materials and Methods
2.1. Experiment Location
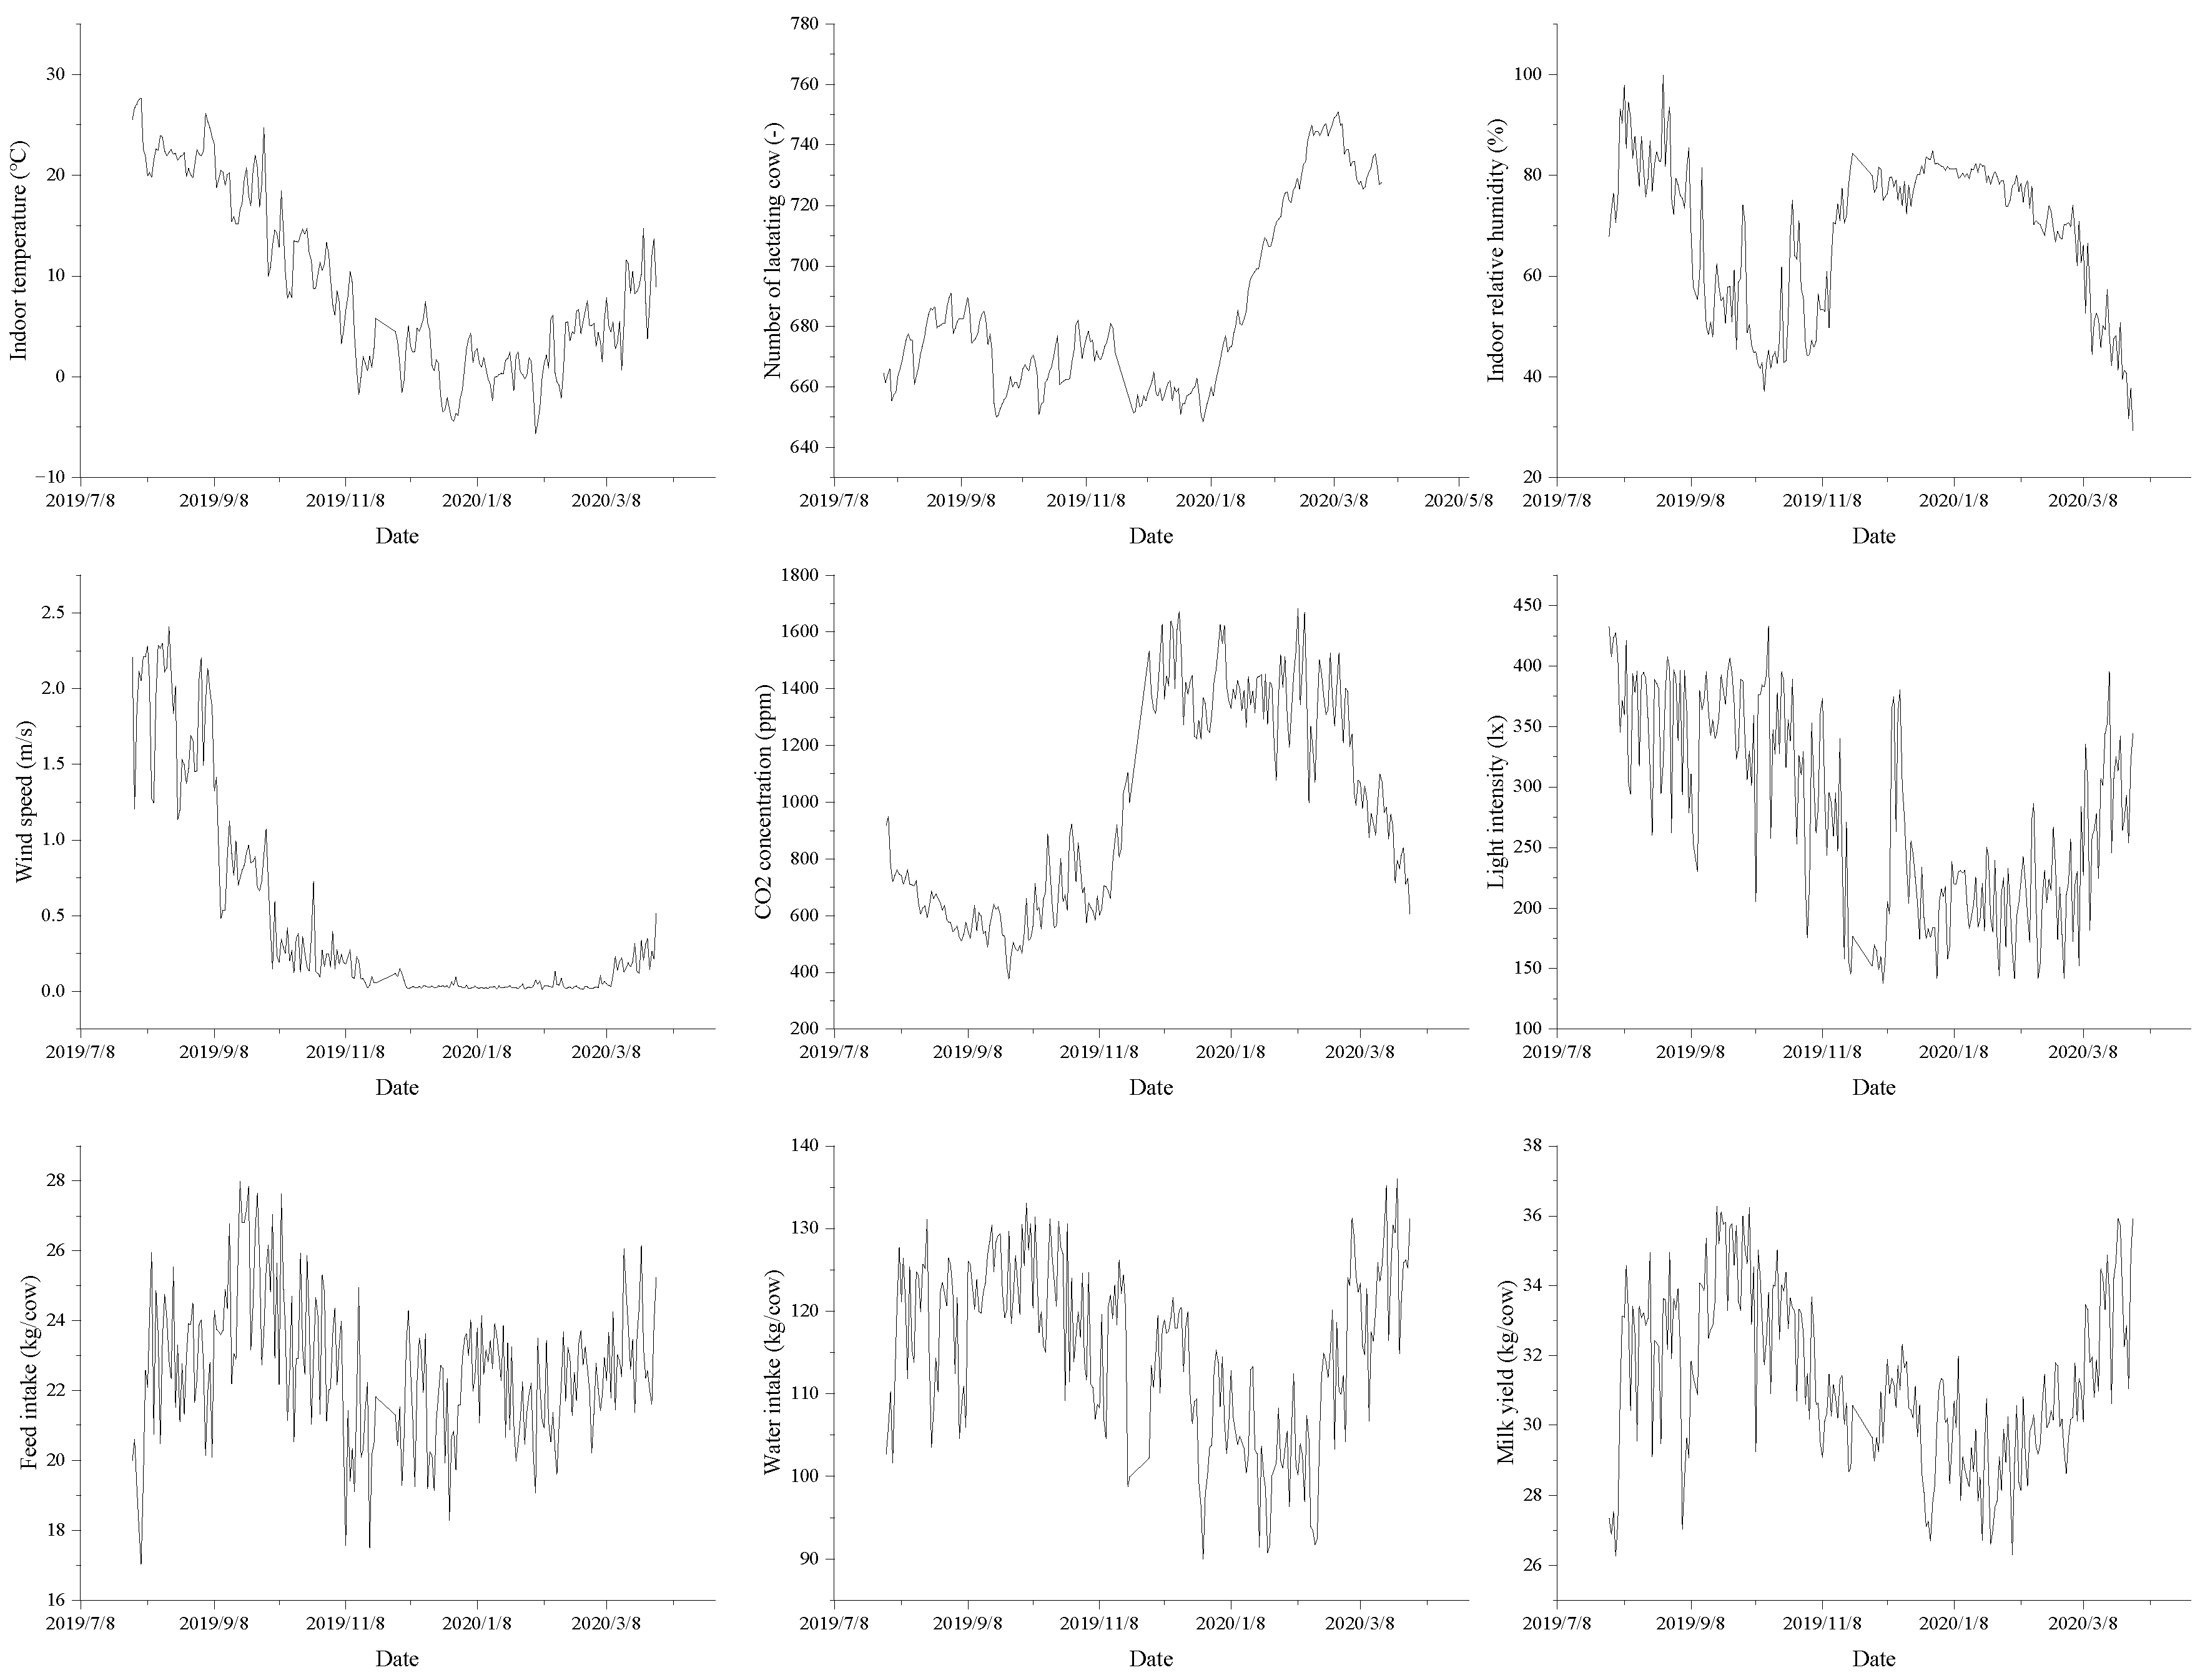
2.2. Environmental Factors and Milk Yield Measurements
2.3. Data Analysis
2.4. Data Preprocessing
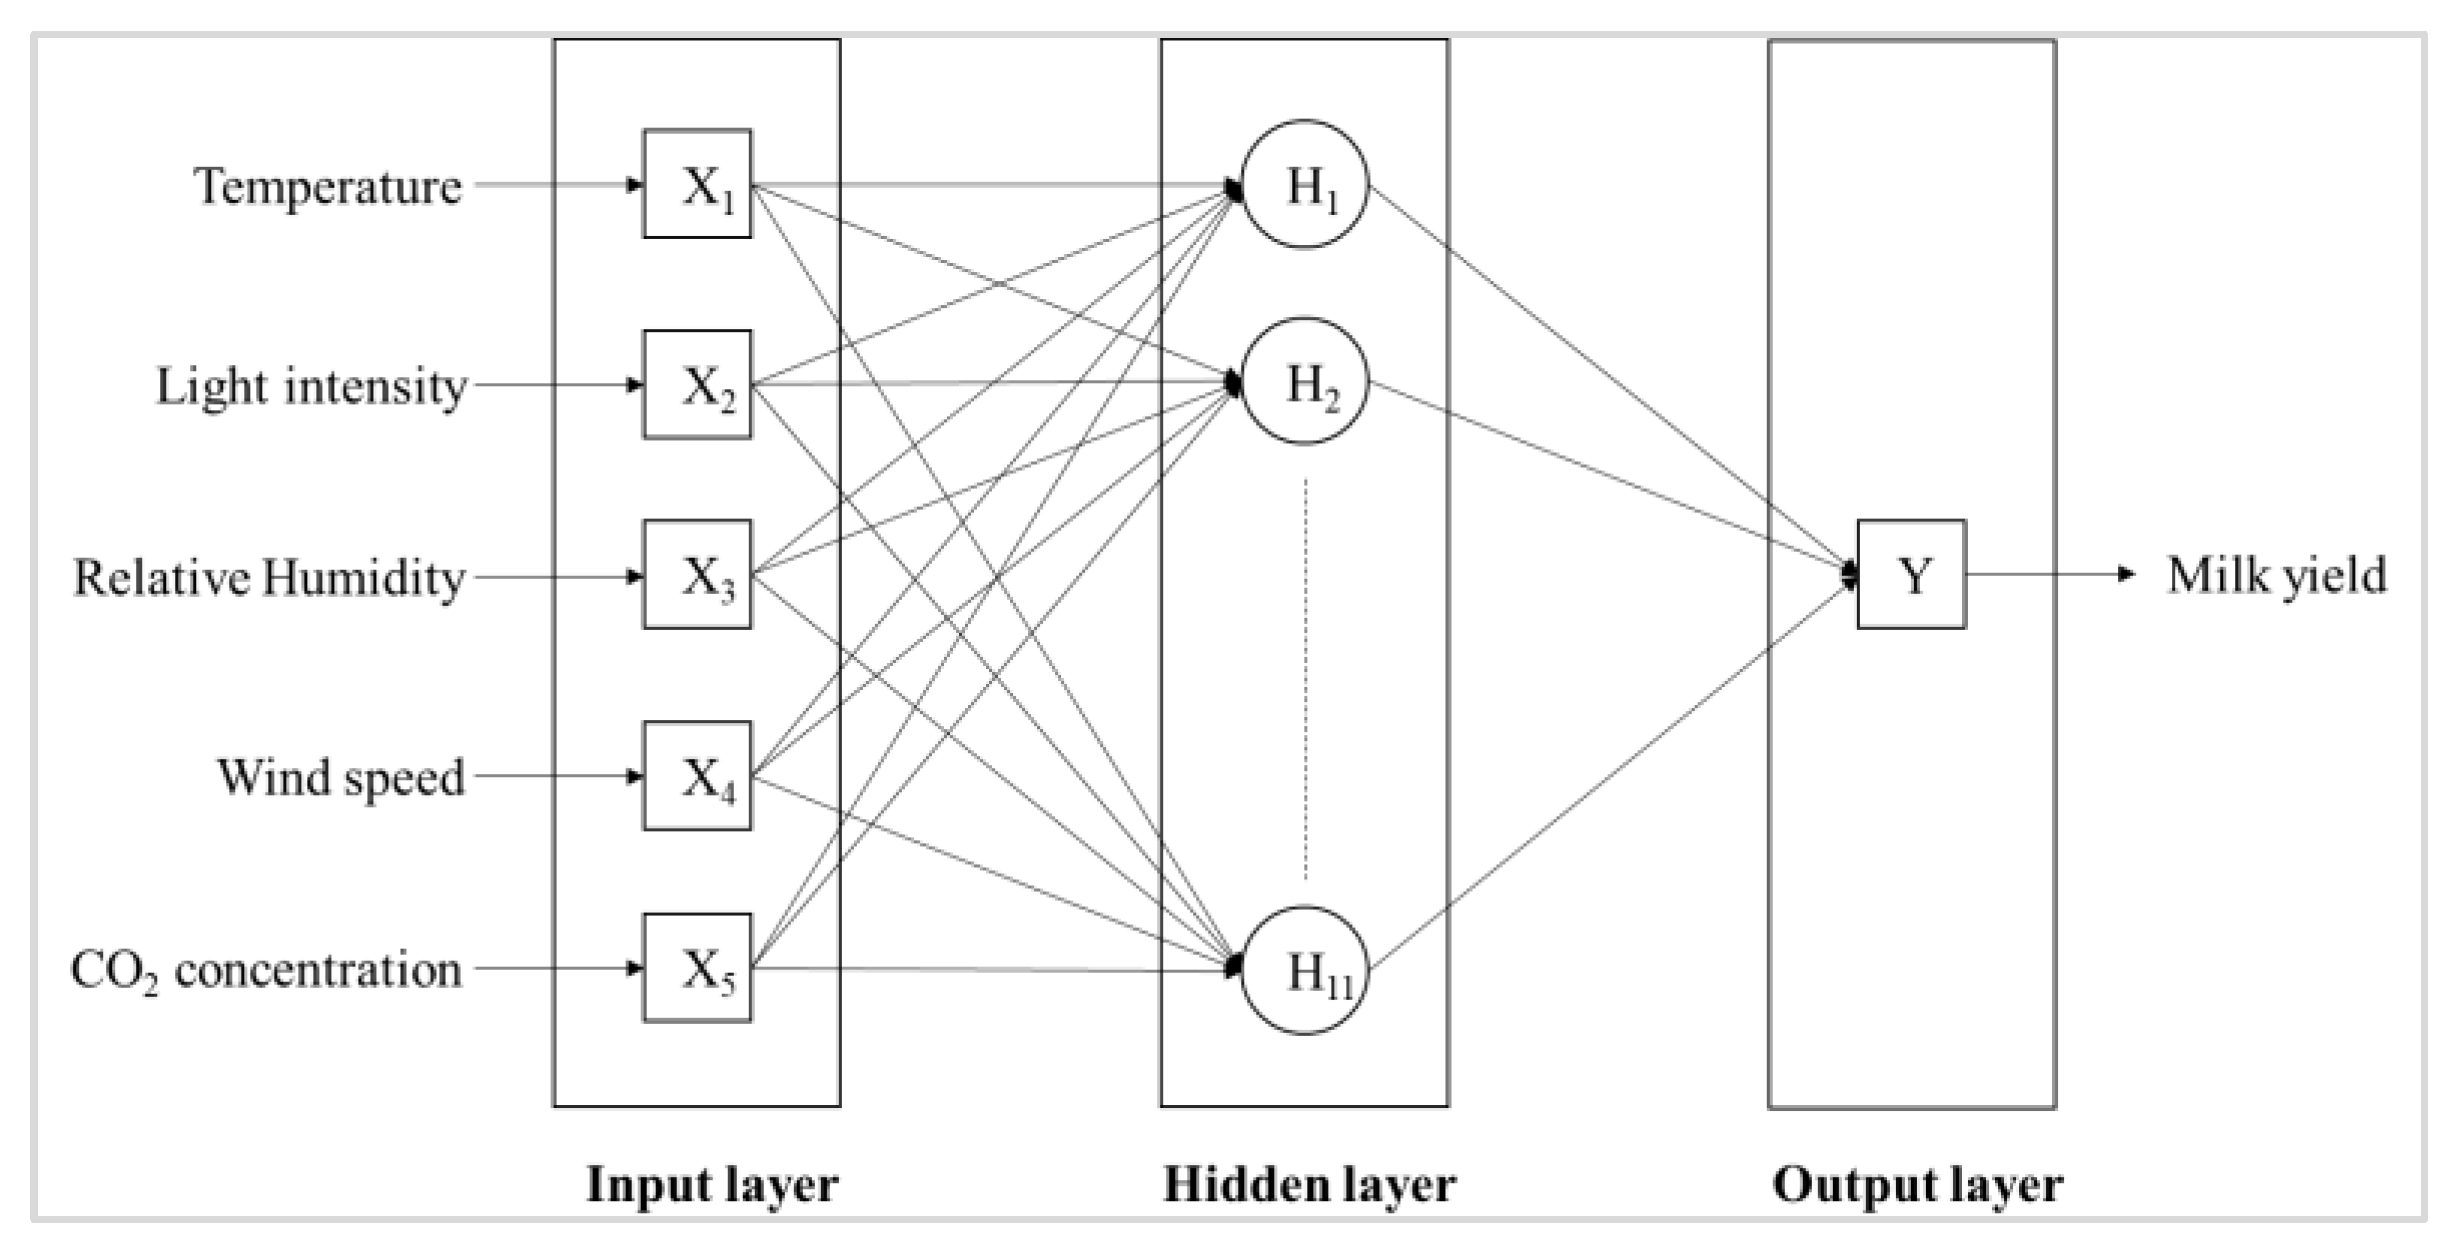
2.5. Artificial Neural Networks
2.6. Model Performance Evaluation
2.7. Devices and Equipment to Improve Environmental Conditions
3. Results and Discussion
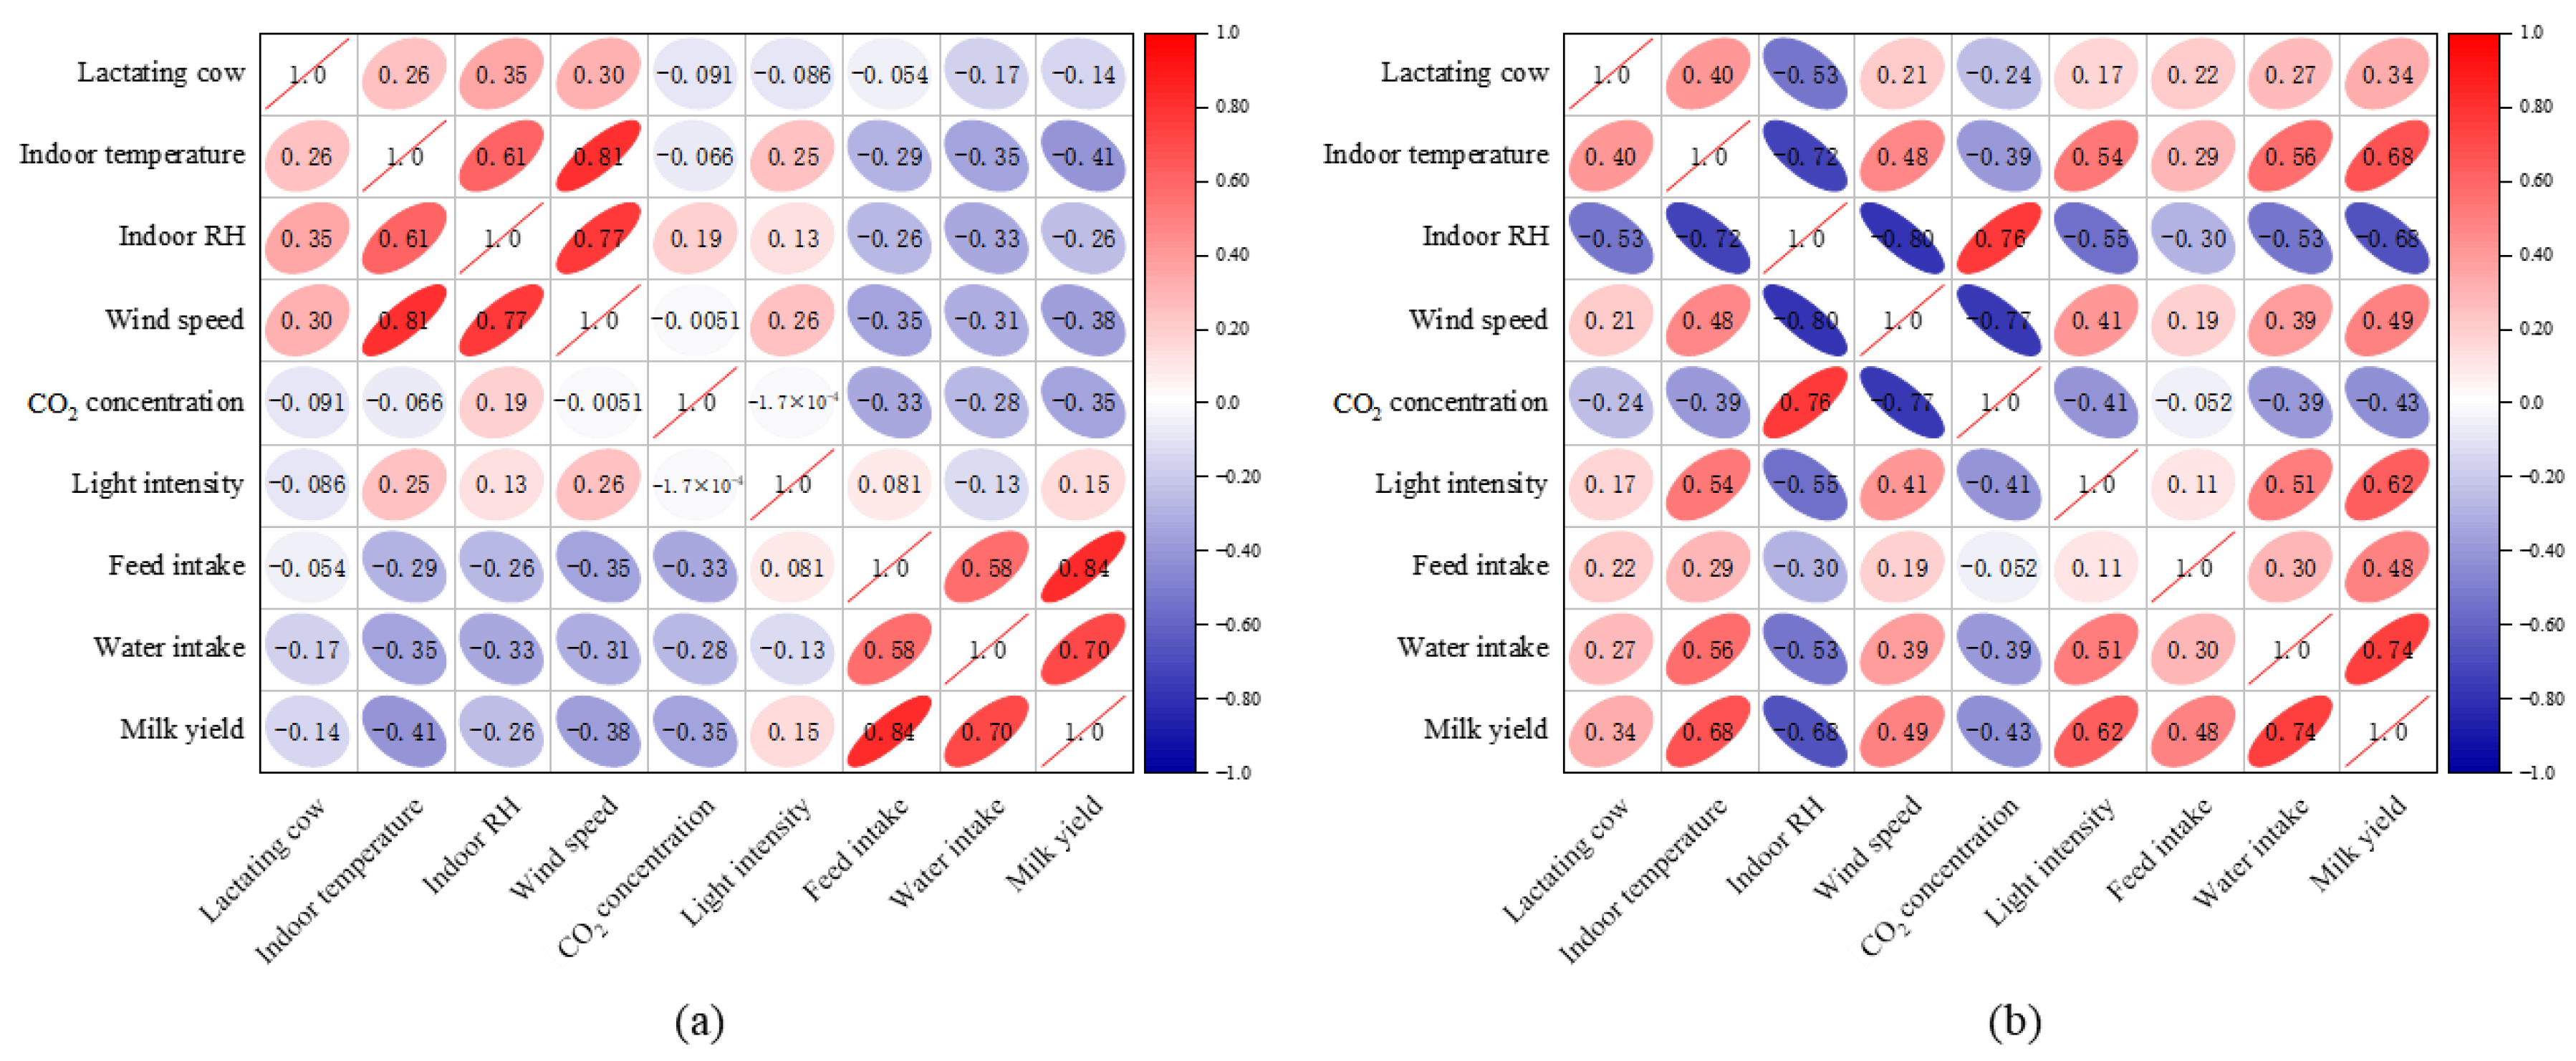
3.1. Correlation Analysis
3.2. Neural Network Milk Yield Prediction Model Based on Environmental Variables
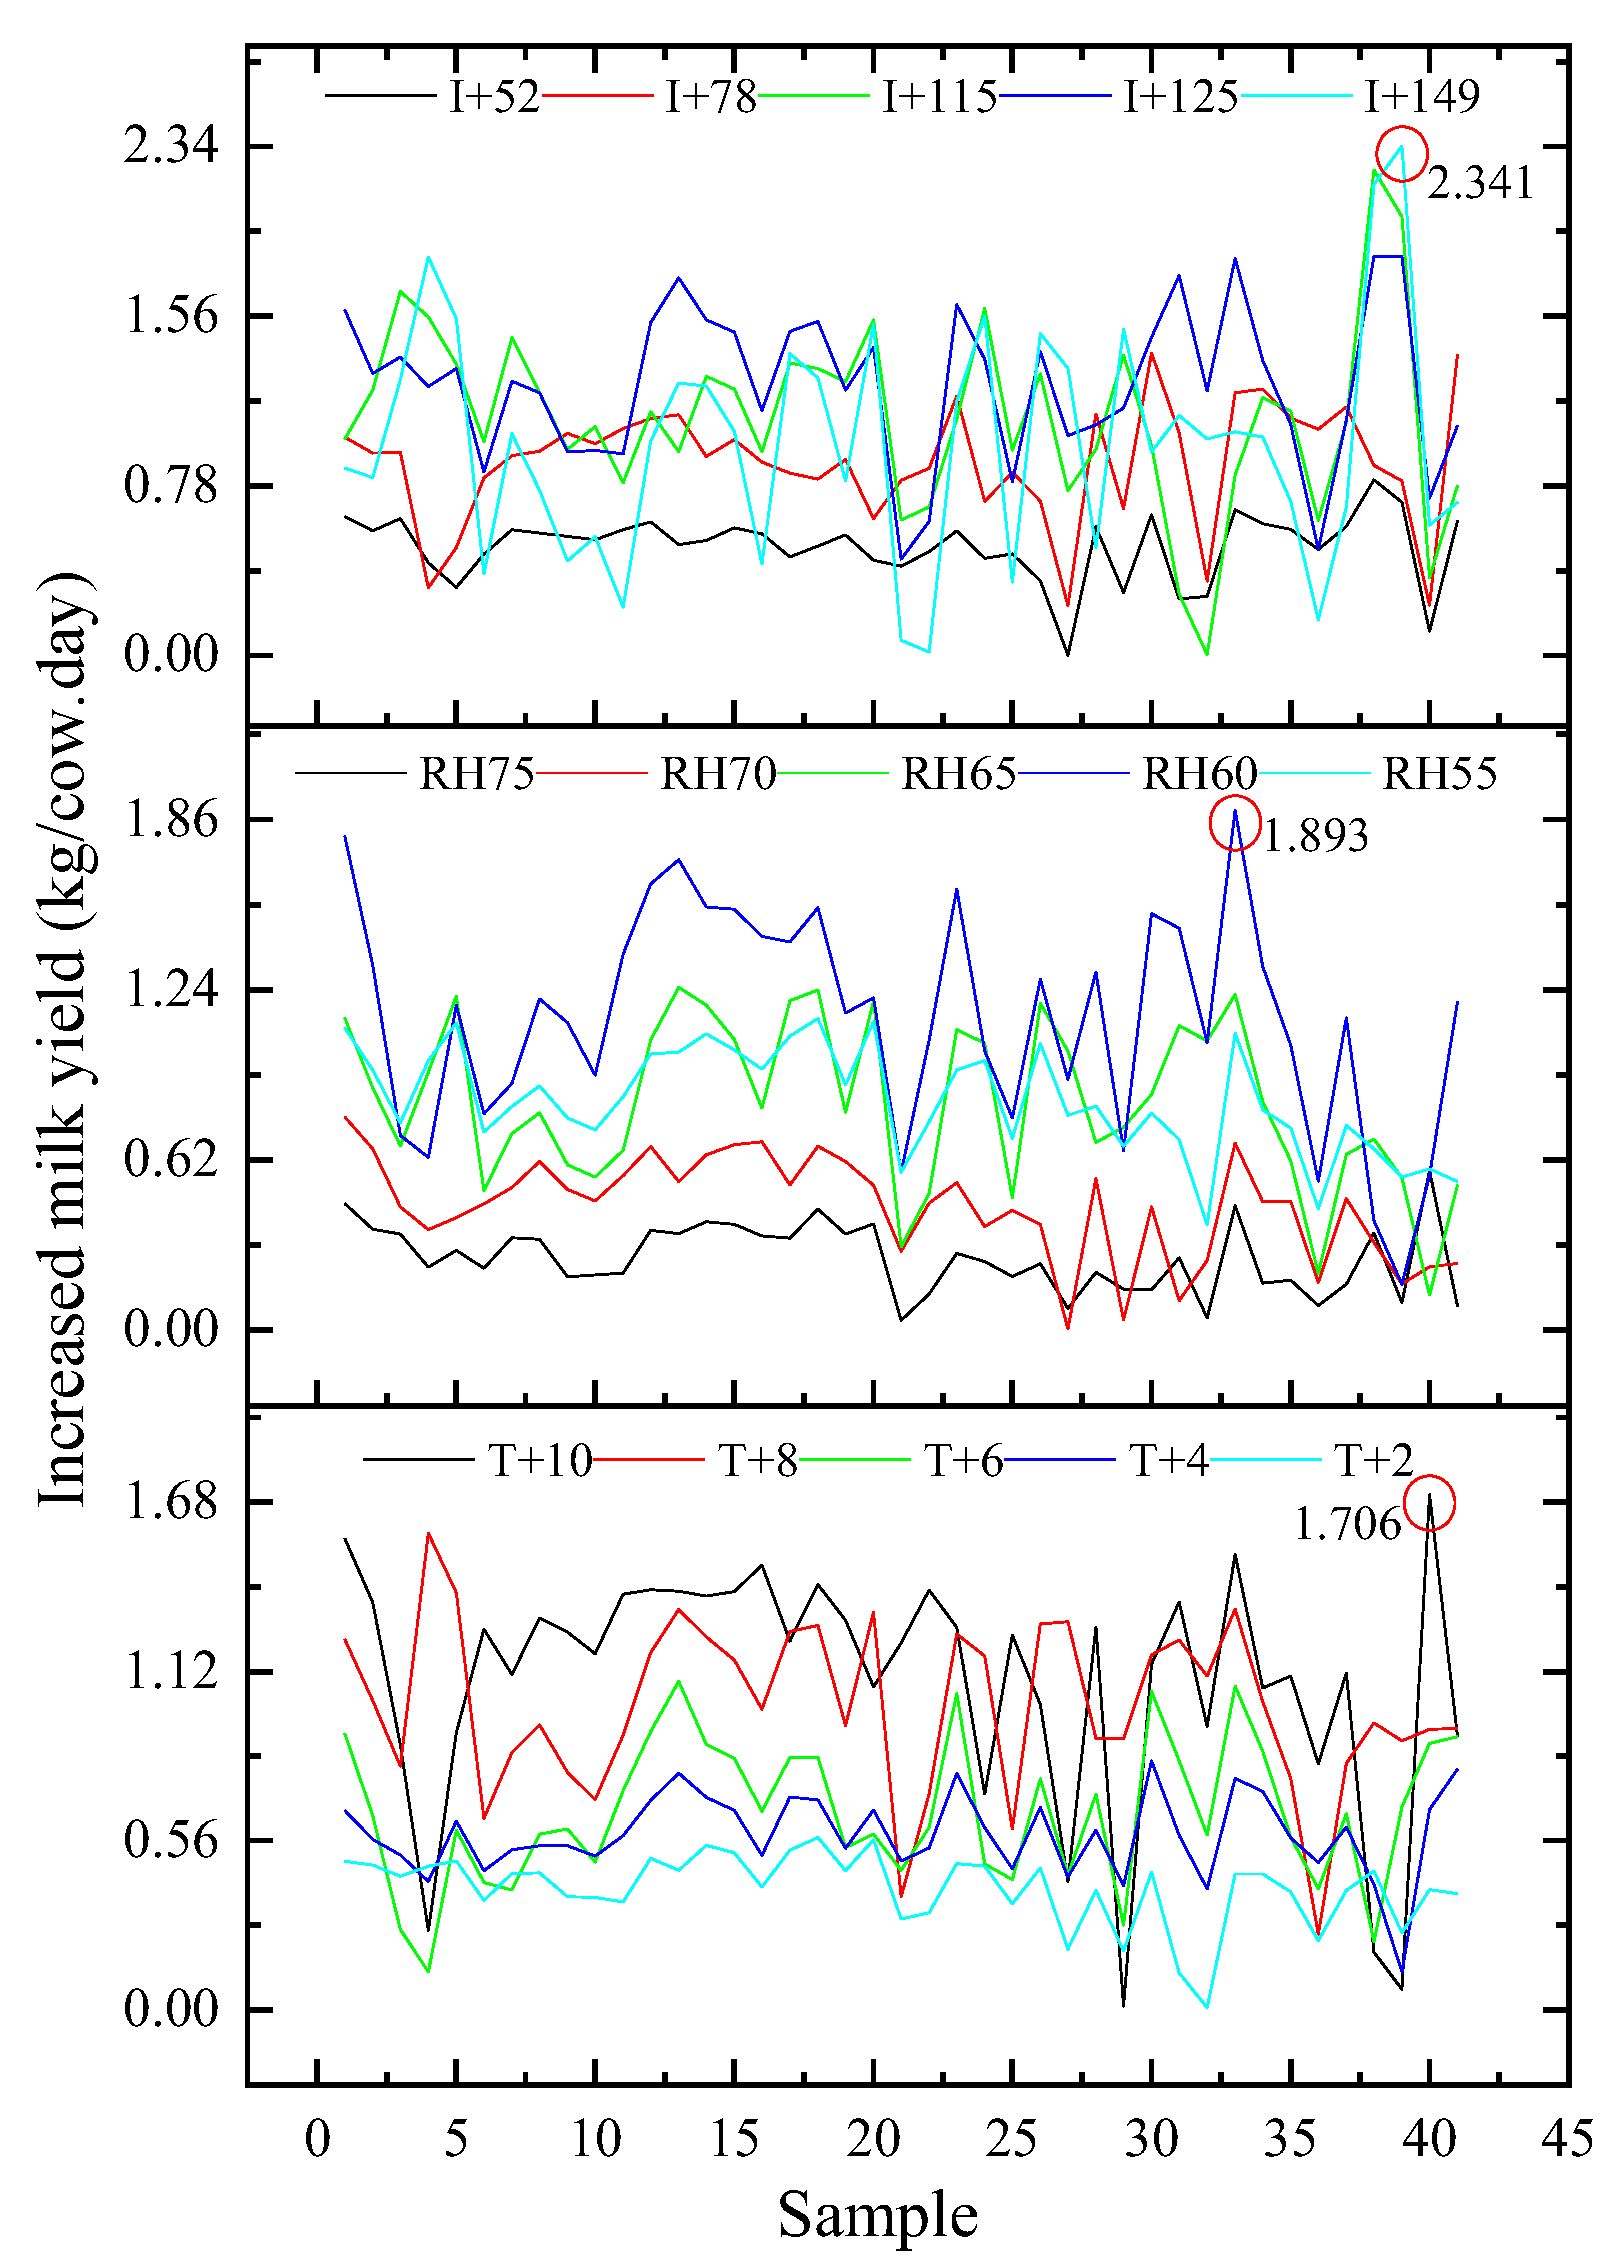
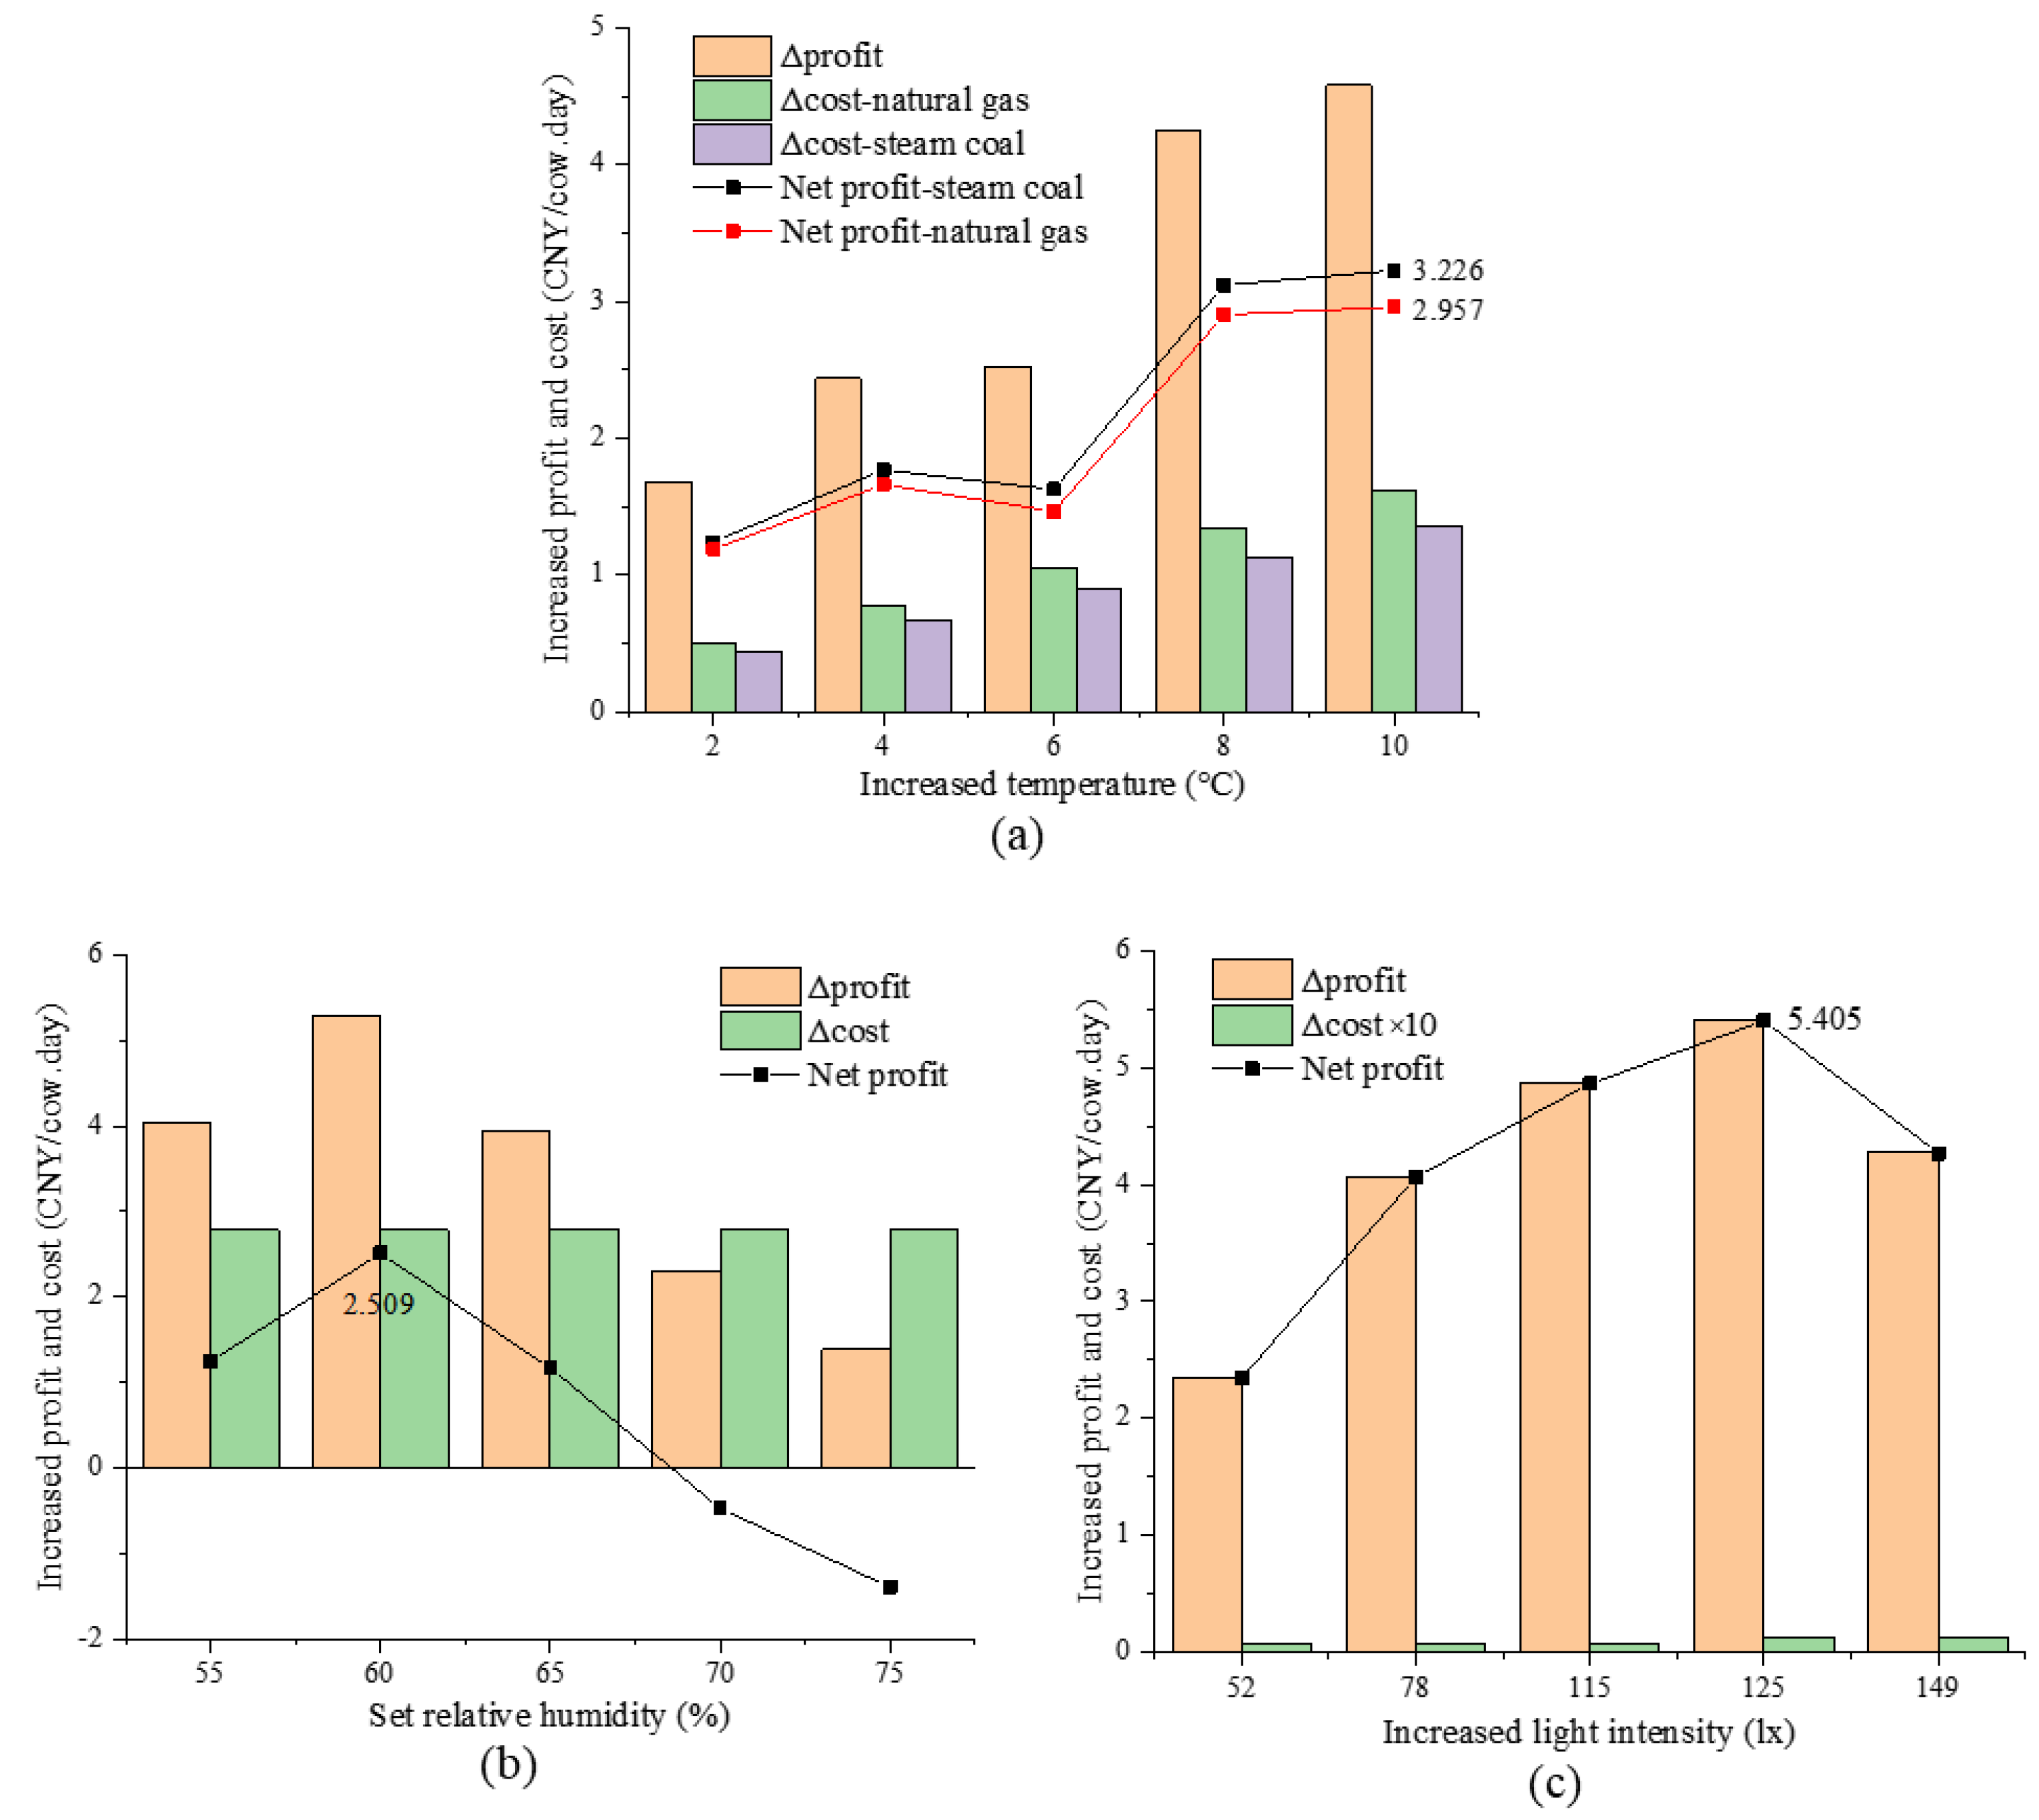
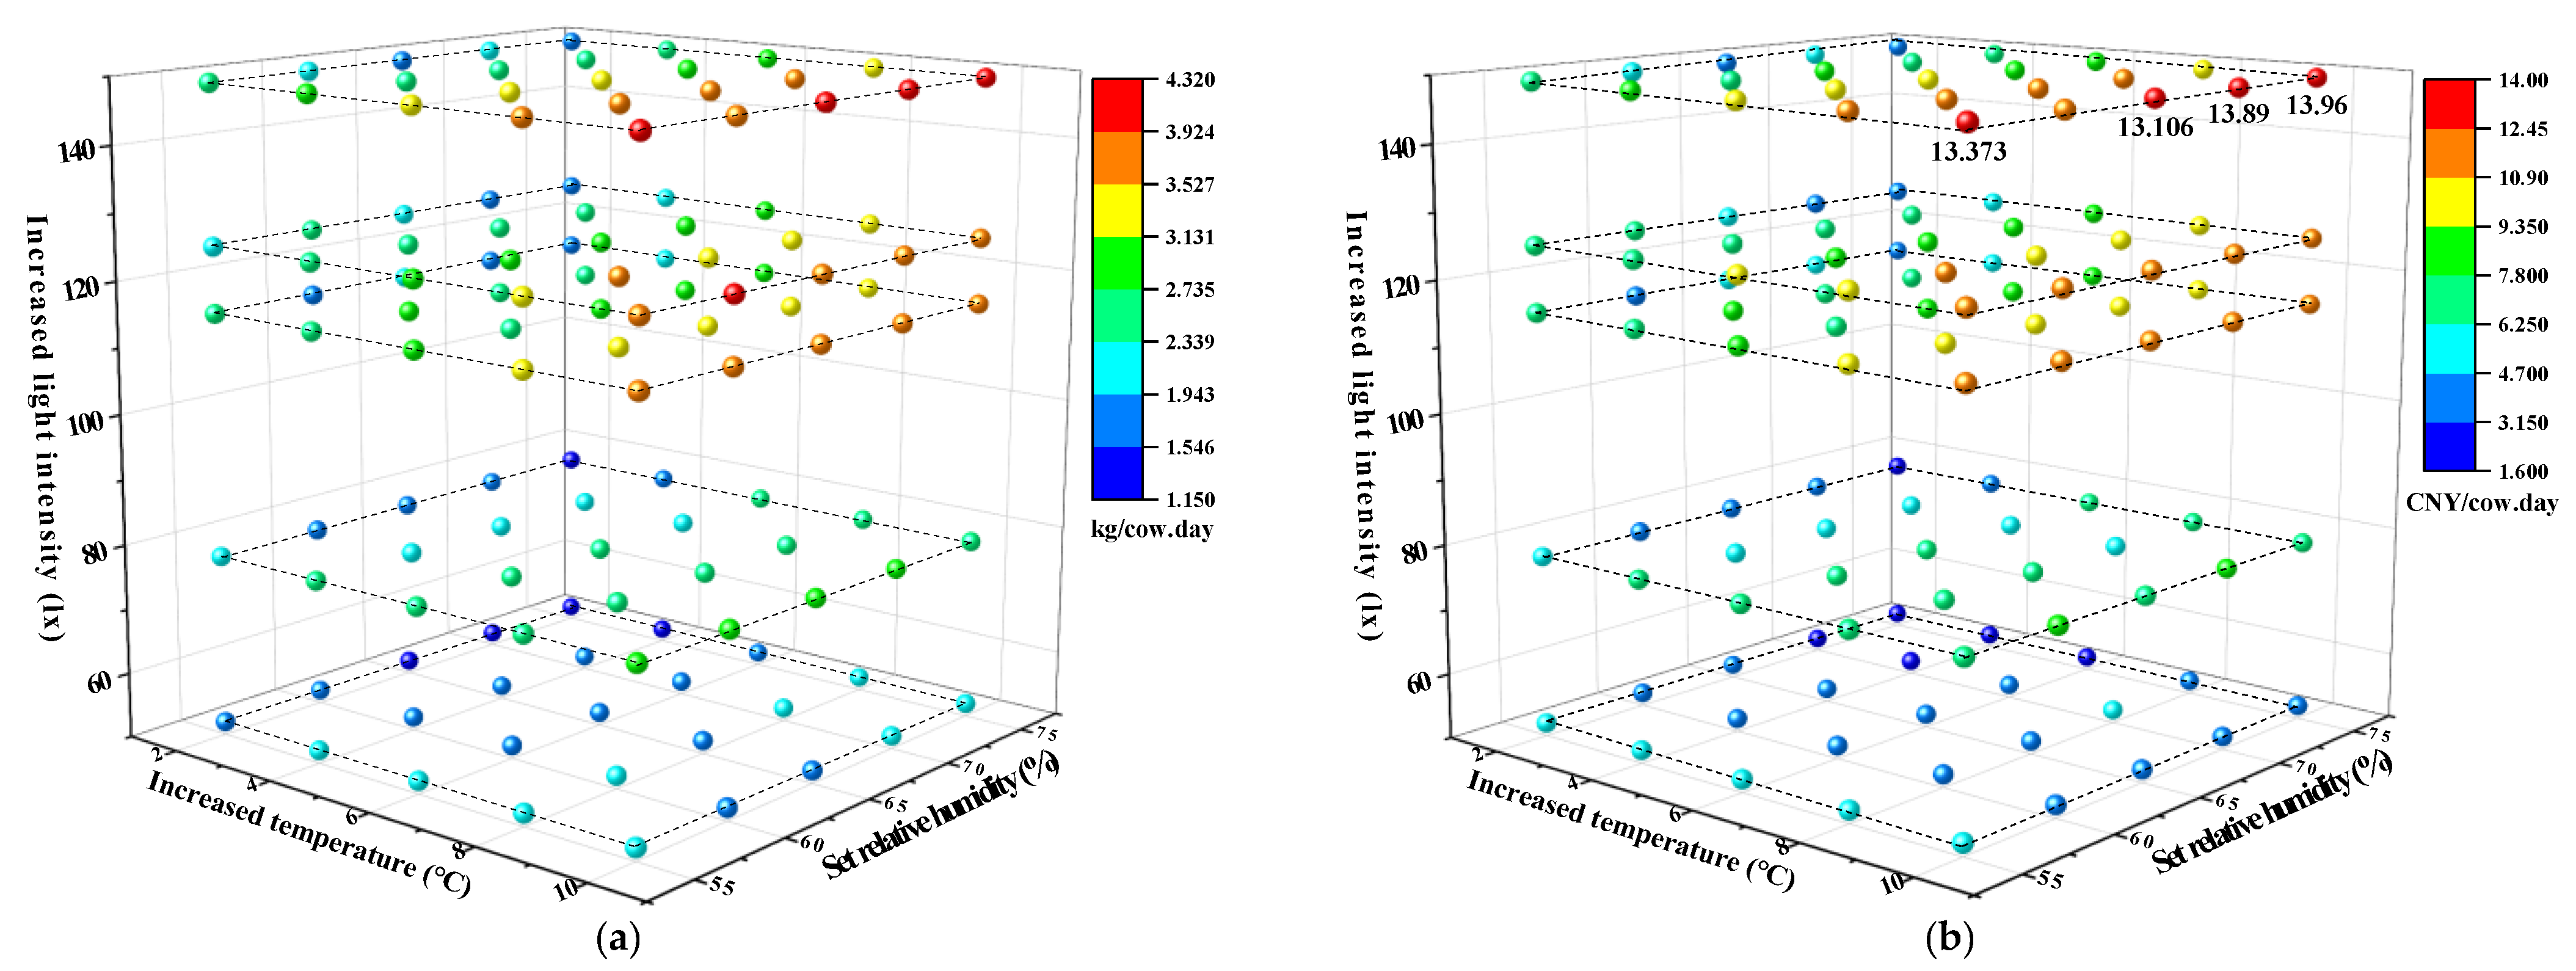
3.3. Economic Benefits of Improving Environmental Quality
4. Conclusions
Author Contributions
Funding
Institutional Review Board Statement
Data Availability Statement
Conflicts of Interest
References
- Könyves, T.; Zlatkovic, N.; Memisi, N.; Lukac, D.; Puvaca, N.; Stojsin, M.; Halász, A.; Miscevic, B. Relationship of temperature-humidity index with milk production and feed intake of holstein-frisian cows in different year seasons. Thai J. Vet. Med. 2017, 47, 15. [Google Scholar] [CrossRef]
- Ravagnolo, O.; Misztal, I.; Hoogenboom, G. Genetic component of heat stress in dairy cattle, development of heat index function. J. Dairy Sci. 2000, 83, 2120–2125. [Google Scholar] [CrossRef]
- Yang, Y.; Ye, B.; Liu, H. Occurrence, Danger, Prevention and Treatment of Heat Stress in Dairy Cattle. China Cattle Sci. 2010, 36, 63–66. [Google Scholar]
- Baumgard, L.; Rhoads, R. Ruminant nutrition symposium: Ruminant production and metabolic responses to heat stress. J. Anim. Sci. 2012, 90, 1855–1865. [Google Scholar] [CrossRef]
- DeShazer, J.A.; Hahn, G.L.; Xin, H. Basic principles of the thermal environment and livestock energetics. In Livestock Energetics and Thermal Environment Management; American Society of Agricultural and Biological Engineers: St. Joseph, MI, USA, 2009; pp. 1–22. [Google Scholar]
- Guo, S.; Meng, F.; Xu, X.; Yang, J.; Li, Y.; Wang, X.; Wang, H. Effects of the Cold Stress on Production in Dairy Cow and Its Prevention and Control Measures. Tianjin Agric. Sci. 2021, 27, 61–64. [Google Scholar]
- Liu, G.; Wang, J.; Liu, W.; Zhang, X.; Yuan, Y.; Bu, D.; Wang, J. Study on heat stress and cold Stress of dairy cows in different regions of China. China Dairy Cattle 2009, 08, 66–69. [Google Scholar]
- Zhang, L. Evaluation of Thermal Design Parameters for the Envelopes of Dairy Barns in Cold Climate and Its Database Design; China Agricultural University: Beijing, China, 2015. [Google Scholar]
- Zhang, M.; Wang, X.; Yi, J. Research Progress of Barn Microclimate on Dairy Cow Production and Health. Acta Ecol. Anim. Domastici 2018, 39, 6–11. [Google Scholar]
- Zhang, Y.; Ao, R.; Wang, C.; Jiang, J.; Zhao, C.; Wu, H. Effects of Cold Stress on Maintenance Behavior and Antioxidative Function in Holstein Cows and Sanhe Cattle. Prog. Vet. Med. 2016, 37, 73–77. [Google Scholar]
- Forbes, J. Effects of lighting pattern on growth, lactation and food intake of sheep, cattle and deer. Livest. Prod. Sci. 1982, 9, 361–374. [Google Scholar] [CrossRef]
- Hill, D.L.; Wall, E. Dairy cattle in a temperate climate: The effects of weather on milk yield and composition depend on management. Animal 2015, 9, 138–149. [Google Scholar] [CrossRef]
- Ministry of Agriculture and Rural Affairs of the People’s Republic of China. Agricultural Statistics of China; China Agriculture Press: Beijing, China, 2018. [Google Scholar]
- Ding, T.; Jiang, L.; Shi, Z.; Zhao, Y.; Ma, H. Relationship between Environmental Factors and Milk Yield of Dairy Cow House in Cold Region Based on Random Forest. Trans. Chin. Soc. Agric. Mach. 2021, 52, 378–385. [Google Scholar]
- Yuan, L.; Xu, J. Effect of Variation of Temperature and Humidity on Dairy Cow Lactating Performance in Urumqi. China Cattle Sci. 2017, 43, 28–32. [Google Scholar]
- Wei, C. The Epidemiological Research of Subclincial Mastitis in Some Dairy Farms in Haerbin and Study on the Traditional Chinses Medicine Treatment. Master’s Thesis, Northeast Agricultural University, Harbin, China, 2010. [Google Scholar]
- Xu, M.; Liu, G.; Yao, X. Effect of Temperature Decrease on Dairy Performance of Dairy Cows in Winter. China Dairy Cattle 2017, 02, 10–14. [Google Scholar]
- Lim, D.-H.; Kim, T.-I.; Park, S.-M.; Ki, K.S.; Kim, Y. Effects of photoperiod and light intensity on milk production and milk composition of dairy cows in automatic milking system. J. Anim. Sci. Technol. 2021, 63, 626–639. [Google Scholar] [CrossRef] [PubMed]
- Song, J.; Yu, Q.; Wang, X.; Wang, Y.; Zhang, Y.; Sun, Y. Relationship between microclimate and cow behavior and milk yield under low-temperature and high-humidity conditions. Front. Ecol. Evol. 2023, 11, 1058147. [Google Scholar] [CrossRef]
- Liakos, K.G.; Busato, P.; Moshou, D.; Pearson, S.; Bochtis, D. Machine learning in agriculture: A review. Sensors 2018, 18, 2674. [Google Scholar] [CrossRef]
- Fang, Q.; Hanna, M.; Haque, E.; Spillman, C. Neural network modeling of energy requirements for size reduction of wheat. Trans. ASAE 2000, 43, 947. [Google Scholar] [CrossRef]
- Hsieh, C.-L.; Hung, C.-Y.; Kuo, C.-Y. Quantization of adulteration ratio of raw cow milk by least squares support vector machines (LS-SVM) and visible/near infrared spectroscopy. In Engineering Applications of Neural Networks: 12th INNS EANN-SIG International Conference, EANN 2011 and 7th IFIP WG 12.5 International Conference, AIAI 2011, Corfu, Greece, 15–18 September 2011, Proceedings Part I; Springer: Berlin/Heidelberg, Germany, 2011; pp. 130–139. [Google Scholar]
- Fenlon, C.; O’Grady, L.; Dunnion, J.; Shalloo, L.; Butler, S.; Doherty, M.L. A Comparison of Machine Learning Techniques for Predicting Insemination Outcome in Irish Dairy Cows. In Proceedings of the 24th Irish Conference on Artificial Intelligence and Cognitive Science, AICS 2016, Dublin, Ireland, 20–21 September 2016. [Google Scholar]
- Grzesiak, W.; Zaborski, D.; Szatkowska, I.; Królaczyk, K. Lactation milk yield prediction in primiparous cows on a farm using the seasonal auto-regressive integrated moving average model, nonlinear autoregressive exogenous artificial neural networks and Wood’s model. Anim. Biosci. 2021, 34, 770. [Google Scholar] [CrossRef]
- Ji, B.; Banhazi, T.; Phillips, C.J.C.; Wang, C.; Li, B. A machine learning framework to predict the next month’s daily milk yield, milk composition and milking frequency for cows in a robotic dairy farm. Biosyst. Eng. 2022, 216, 186–197. [Google Scholar] [CrossRef]
- Craninx, M.; Fievez, V.; Vlaeminck, B.; De Baets, B. Artificial neural network models of the rumen fermentation pattern in dairy cattle. Comput. Electron. Agric. 2008, 60, 226–238. [Google Scholar] [CrossRef]
- Shadpour, S.; Chud, T.C.S.; Hailemariam, D.; Oliveira, H.R.; Plastow, G.; Stothard, P.; Lassen, J.; Baldwin, R.; Miglior, F.; Baes, C.F.; et al. Predicting dry matter intake in Canadian Holstein dairy cattle using milk mid-infrared reflectance spectroscopy and other commonly available predictors via artificial neural networks. J. Dairy Sci. 2022, 105, 8257–8271. [Google Scholar] [CrossRef] [PubMed]
- Skapura, D.M. Building Neural Networks; Addison-Wesley Professional: New York, NY, USA, 1996. [Google Scholar]
- Lek, S.; Guégan, J.-F. Artificial neural networks as a tool in ecological modelling, an introduction. Ecol. Model. 1999, 120, 65–73. [Google Scholar] [CrossRef]
- Plumb, A.P.; Rowe, R.C.; York, P.; Brown, M. Optimisation of the predictive ability of artificial neural network (ANN) models: A comparison of three ANN programs and four classes of training algorithm. Eur. J. Pharm. Sci. 2005, 25, 395–405. [Google Scholar] [CrossRef]
- Kang, L. Application Research of Particle Swarm Optimization BP Neural Network on Emergency Resource Demand Forecasting; Lanzhou Jiaotong University: Lanzhou, China, 2013. [Google Scholar]
- Zhong, T.; Zhang, D.; Chen, Z.; Zou, C.; Zhu, J.; Zhao, F.; LIang, Y. Insulin evaluation and prediction model based on back-propagation neural network. Chin. J. Med. Phys. 2018, 35, 1318–1323. [Google Scholar]
- Wang, Y.; Li, B. Analysis and experiment on thermal insulation performance of outer building envelope for closed layer house in winter. Trans. Chin. Soc. Agric. Eng. 2017, 33, 190–196. [Google Scholar]


| S | Hidden Layer | Output Layer | R2 | RE/% | RMSE | Error < 0.5 kg/% | Error < 1 kg/% |
|---|---|---|---|---|---|---|---|
| Node tests | |||||||
| 3 | tansig | purelin | 0.733 | 2.9 | 1.18 | 38.3 | 60.9 |
| 4 | tansig | purelin | 0.748 | 2.8 | 1.14 | 38.7 | 61.4 |
| 5 | tansig | purelin | 0.764 | 2.7 | 1.11 | 39.1 | 61.6 |
| 6 | tansig | purelin | 0.776 | 2.6 | 1.06 | 39.5 | 62.4 |
| 7 | tansig | purelin | 0.787 | 2.6 | 1.06 | 40.8 | 63.1 |
| 8 | tansig | purelin | 0.781 | 2.7 | 1.07 | 40.2 | 62.1 |
| 9 | tansig | purelin | 0.785 | 2.6 | 1.06 | 39.0 | 67.2 |
| 10 | tansig | purelin | 0.789 | 2.7 | 1.05 | 40.1 | 67.5 |
| 11 | tansig | purelin | 0.802 | 2.5 | 1.02 | 45.6 | 68.7 |
| 12 | tansig | purelin | 0.801 | 2.6 | 1.02 | 44.6 | 63.9 |
| 13 | tansig | purelin | 0.798 | 2.6 | 1.03 | 45.0 | 68.4 |
| Function tests | |||||||
| 11 | tansig | tansig | 0.789 | 2.6 | 1.05 | 38.2 | 60.2 |
| 11 | tansig | logsig | 0.434 | 4.4 | 1.72 | 20.9 | 39.7 |
| 11 | tansig | purelin | 0.802 | 2.5 | 1.02 | 45.6 | 68.7 |
| 11 | logsig | tansig | 0.794 | 2.6 | 1.04 | 41.1 | 65.6 |
| 11 | logsig | logsig | 0.440 | 4.4 | 1.71 | 19.7 | 38.2 |
| 11 | logsig | purelin | 0.789 | 2.6 | 1.05 | 40.9 | 62.3 |
| 11 | purelin | tansig | 0.495 | 3.9 | 1.63 | 21.5 | 40.2 |
| 11 | purelin | logsig | 0.235 | 5.2 | 2.00 | 13.4 | 24.6 |
| 11 | purelin | purelin | 0.494 | 3.9 | 1.63 | 22.2 | 42.6 |
| Device | Price (CNY/m2) | Life Span (Years) | Source | Price | Calorific Value (kcal/m3) | Combustion Efficiency |
|---|---|---|---|---|---|---|
| Heating Radiator | 65 | 30 | Natural gas | 2.8 CNY/m3 | 9310 | 92% |
| Steam coal | 1.2 CNY/m3 | 5500 | 82% | |||
| Dehumidifier | 18.7 | 10 | Electricity | 0.48 CNY/kWh | - | - |
| LED lights | 0.15 (5 W) 0.17 (10 W) | 10 | Electricity | 0.48 CNY/kWh | - | - |
| Variable | Set Point of Environmental Improvement | ||||
|---|---|---|---|---|---|
| Temperature | +2 °C | +4 °C | +6 °C | +8 °C | +10 °C |
| Relative humidity | 55% | 60% | 65% | 70% | 75% |
| Light intensity | +52 lx | +78 lx | +115 lx | +125 lx | +149 lx |
Disclaimer/Publisher’s Note: The statements, opinions and data contained in all publications are solely those of the individual author(s) and contributor(s) and not of MDPI and/or the editor(s). MDPI and/or the editor(s) disclaim responsibility for any injury to people or property resulting from any ideas, methods, instructions or products referred to in the content. |
© 2023 by the authors. Licensee MDPI, Basel, Switzerland. This article is an open access article distributed under the terms and conditions of the Creative Commons Attribution (CC BY) license (https://creativecommons.org/licenses/by/4.0/).
Share and Cite
Zhang, J.; Liu, Z.; Shi, Z.; Jiang, L.; Ding, T. Milk Yield Prediction and Economic Analysis of Optimized Rearing Environment in a Cold Region Using Neural Network Model. Agriculture 2023, 13, 2206. https://doi.org/10.3390/agriculture13122206
Zhang J, Liu Z, Shi Z, Jiang L, Ding T. Milk Yield Prediction and Economic Analysis of Optimized Rearing Environment in a Cold Region Using Neural Network Model. Agriculture. 2023; 13(12):2206. https://doi.org/10.3390/agriculture13122206
Chicago/Turabian StyleZhang, Jingfu, Zhiwei Liu, Zhengxiang Shi, Leisheng Jiang, and Tao Ding. 2023. "Milk Yield Prediction and Economic Analysis of Optimized Rearing Environment in a Cold Region Using Neural Network Model" Agriculture 13, no. 12: 2206. https://doi.org/10.3390/agriculture13122206
APA StyleZhang, J., Liu, Z., Shi, Z., Jiang, L., & Ding, T. (2023). Milk Yield Prediction and Economic Analysis of Optimized Rearing Environment in a Cold Region Using Neural Network Model. Agriculture, 13(12), 2206. https://doi.org/10.3390/agriculture13122206