Article

Study on Dissipation Law of Pesticides in Cauliflower Based on Hyperspectral Image Technique

1
Tianjin Key Laboratory of Refrigeration Technology, Tianjin University of Commerce, Tianjin 300134, China
2
Vegetable Research Institute, Tianjin Academy of Agricultural Sciences, Tianjin 300384, China
*
Author to whom correspondence should be addressed.
Agriculture 2023, 13(12), 2254; https://doi.org/10.3390/agriculture13122254
Submission received: 21 October 2023 / Revised: 27 November 2023 / Accepted: 4 December 2023 / Published: 8 December 2023
(This article belongs to the Section Agricultural Product Quality and Safety)

Abstract

:
In order to rapidly and non-destructively detect the residual rate of emamectin benzoate+indoxacarb pesticides on cauliflower, a study was conducted using hyperspectral technology to investigate the dissipation law of this pesticide over time. Hyperspectral imaging was employed to capture spectral data from cauliflower samples with and without the pesticide, focusing on the region of interest. The spectral data, consisting of 216 bands (ranging from 950 nm to 1666 nm), were preprocessed using techniques such as Savitzky–Golay convolution smoothing (S-G), multivariate scattering correction (MSC), and standard normal variate (SNV). Next, characteristic spectra for each pesticide were extracted using the competitive adaptive reweighted sampling algorithm (CARS). This study utilized the partial least squares (PLS) algorithm to construct a discriminative model aimed at identifying pesticide residues on cauliflower. The accuracy of the hyperspectral imaging technique was validated by comparing the results with those obtained through chromatography. The PLS model, optimized using the SNV method, exhibited the highest discriminant accuracy, achieving a recognition rate of 100%. The residual rate of indoxacarb detected through hyperspectral technology closely corresponded to the results obtained through chromatography. It was found that the discrepancy in the half-life of pesticides as detected by hyperspectral and chromatographic methods is a mere 0.14 days. These findings highlight the potential of hyperspectral imaging technology for studying pesticide dissipation on cauliflower and detecting pesticide residues.

1. Introduction

Cauliflower is highly appreciated worldwide for its delectable taste and numerous nutritional benefits [1,2,3]. However, achieving optimal cauliflower yields often involves the use of pesticides, which can inadvertently result in the presence of excessive pesticide residues in the vegetable. Hence, it is of utmost importance to detect and monitor pesticide residues in order to guarantee food safety.
The detection of pesticide residue in vegetables is commonly conducted using chromatographic methods, which offer high accuracy and repeatability. However, these methods have drawbacks such as time-consuming sample preparation, expensive detection instruments, and long detection times. Jia et al. investigated a liquid chromatography-tandem mass spectrometry method for determining the content of pymetrozine in cauliflower, revealing that pymetrozine rapidly dissipates in cauliflower with a half-life of less than four days [4]. Nevertheless, the process itself was cumbersome and time-consuming. On the other hand, spectral technology allows for the qualitative or quantitative analysis of target substances by examining various spectral properties of the molecular structure [5]. This method presents several advantages over chromatographic detection, including rapid detection, low cost, and a wide range of applications. Previous studies have introduced research on using spectral technology to detect pesticide residues in agricultural products. Bian et al. modeled and analyzed fluorescence spectral data of four commonly found pesticide residues in fruits and vegetables using the back-propagation neural network algorithm, accurately predicting pesticide concentrations [6]. Alsammarraie et al. applied surface-enhanced Raman spectroscopy to detect carbaryl pesticide concentrations in orange juice, grapefruit juice, and milk, achieving correlation coefficients between actual and predicted values of 0.91, 0.88, and 0.95, respectively, according to the pesticide residue prediction model [7]. Jamshidi et al. utilized optical fiber visible/near-infrared spectroscopy to classify cucumbers into safe and unsafe samples based on diazinon content below and above the maximum residue limit [8]. Gonzalez-Martin et al. determined pesticide residues in original propolis using gas chromatography and then analyzed the residues using near-infrared spectroscopy combined with the partial least squares method, achieving a determination coefficient of 0.81 and a root mean square error of 0.36 [9].
In recent years, the integration of hyperspectral technology with machine learning and neural networks has enhanced the testing precision of hyperspectral techniques. Ye et al. detected pesticide residue levels in grapes using hyperspectral imaging with machine learning. Results showed that the use of hyperspectral imaging technology combined with machine learning can effectively detect the level of pesticide residues in grapes [10]. Sun et al. explored the identification of pesticide residues on black tea using fluorescence hyperspectral technology augmented with machine learning techniques. Their findings reveal that the MSC-CARS-SPA-1D CNN-RF model excels as the most effective method for detecting pesticide residues, achieving a 99.05% accuracy rate on the test set [11]. In Jiang et al.’s study, called Identification of Pesticide Residue Types in Chinese Cabbage Based on Hyperspectral and Convolutional Neural Network, it was shown that the combination of discrete wavelet transform and a convolutional neural network shortens the time of classification and identification, significantly improves the classification and identification accuracy, and improves the Hughes phenomenon [12]. Hu et al. detected different pesticide residues on Hami melon surfaces using hyperspectral imaging combined with 1D-CNN and information fusion. This study showed that hyperspectral imaging combined with a classification model could non-destructively detect different pesticide residues on the surface of Hami melons [13]. Zhang et al. recognized pesticide residue levels on cauliflowers using visible/near-infrared spectroscopy combined with chemometrics. Results indicated that the accuracy of the model based on CARS-PLS-DA to identify chlorothalonil at different concentration levels on cauliflower surfaces reached 93.33% [14]. Nazarloo et al. investigated the detection of a pesticide residual (profenofos) in tomatoes by using visible/near-infrared spectroscopy. Different spectral pre-processing methods with partial least squares discriminant analysis (PLS-DA) models were used. The percentages of total correctly classified samples were 90 and 91.66%, respectively, in the calibration and prediction sets [15].
Although previous literature has shown the effectiveness of spectral technology in detecting pesticide residues in agricultural products, there is limited research on using hyperspectral technology for non-destructive detection of pesticide residues and analyzing the dissipation laws of pesticides in agricultural products.
This study aimed to explore the potential of hyperspectral imaging technology as an alternative to traditional pesticide detection methods. Firstly, the spectral curves of the region of interest in both pesticide-containing and pesticide-free cauliflower samples were extracted, and four spectral curve preprocessing algorithms were compared to determine the optimal prediction model for using hyperspectral technology to detect pesticide residues in cauliflower. Secondly, the optimal discriminant model was used to estimate the rate of indoxacarb pesticide residue dissipation in cauliflower over time, while chromatography was employed to determine the actual values of pesticide residues. Finally, the accuracy of the discriminant model was validated by comparing it with the actual residue values. An overview of all experimental processes is provided in Figure 1.

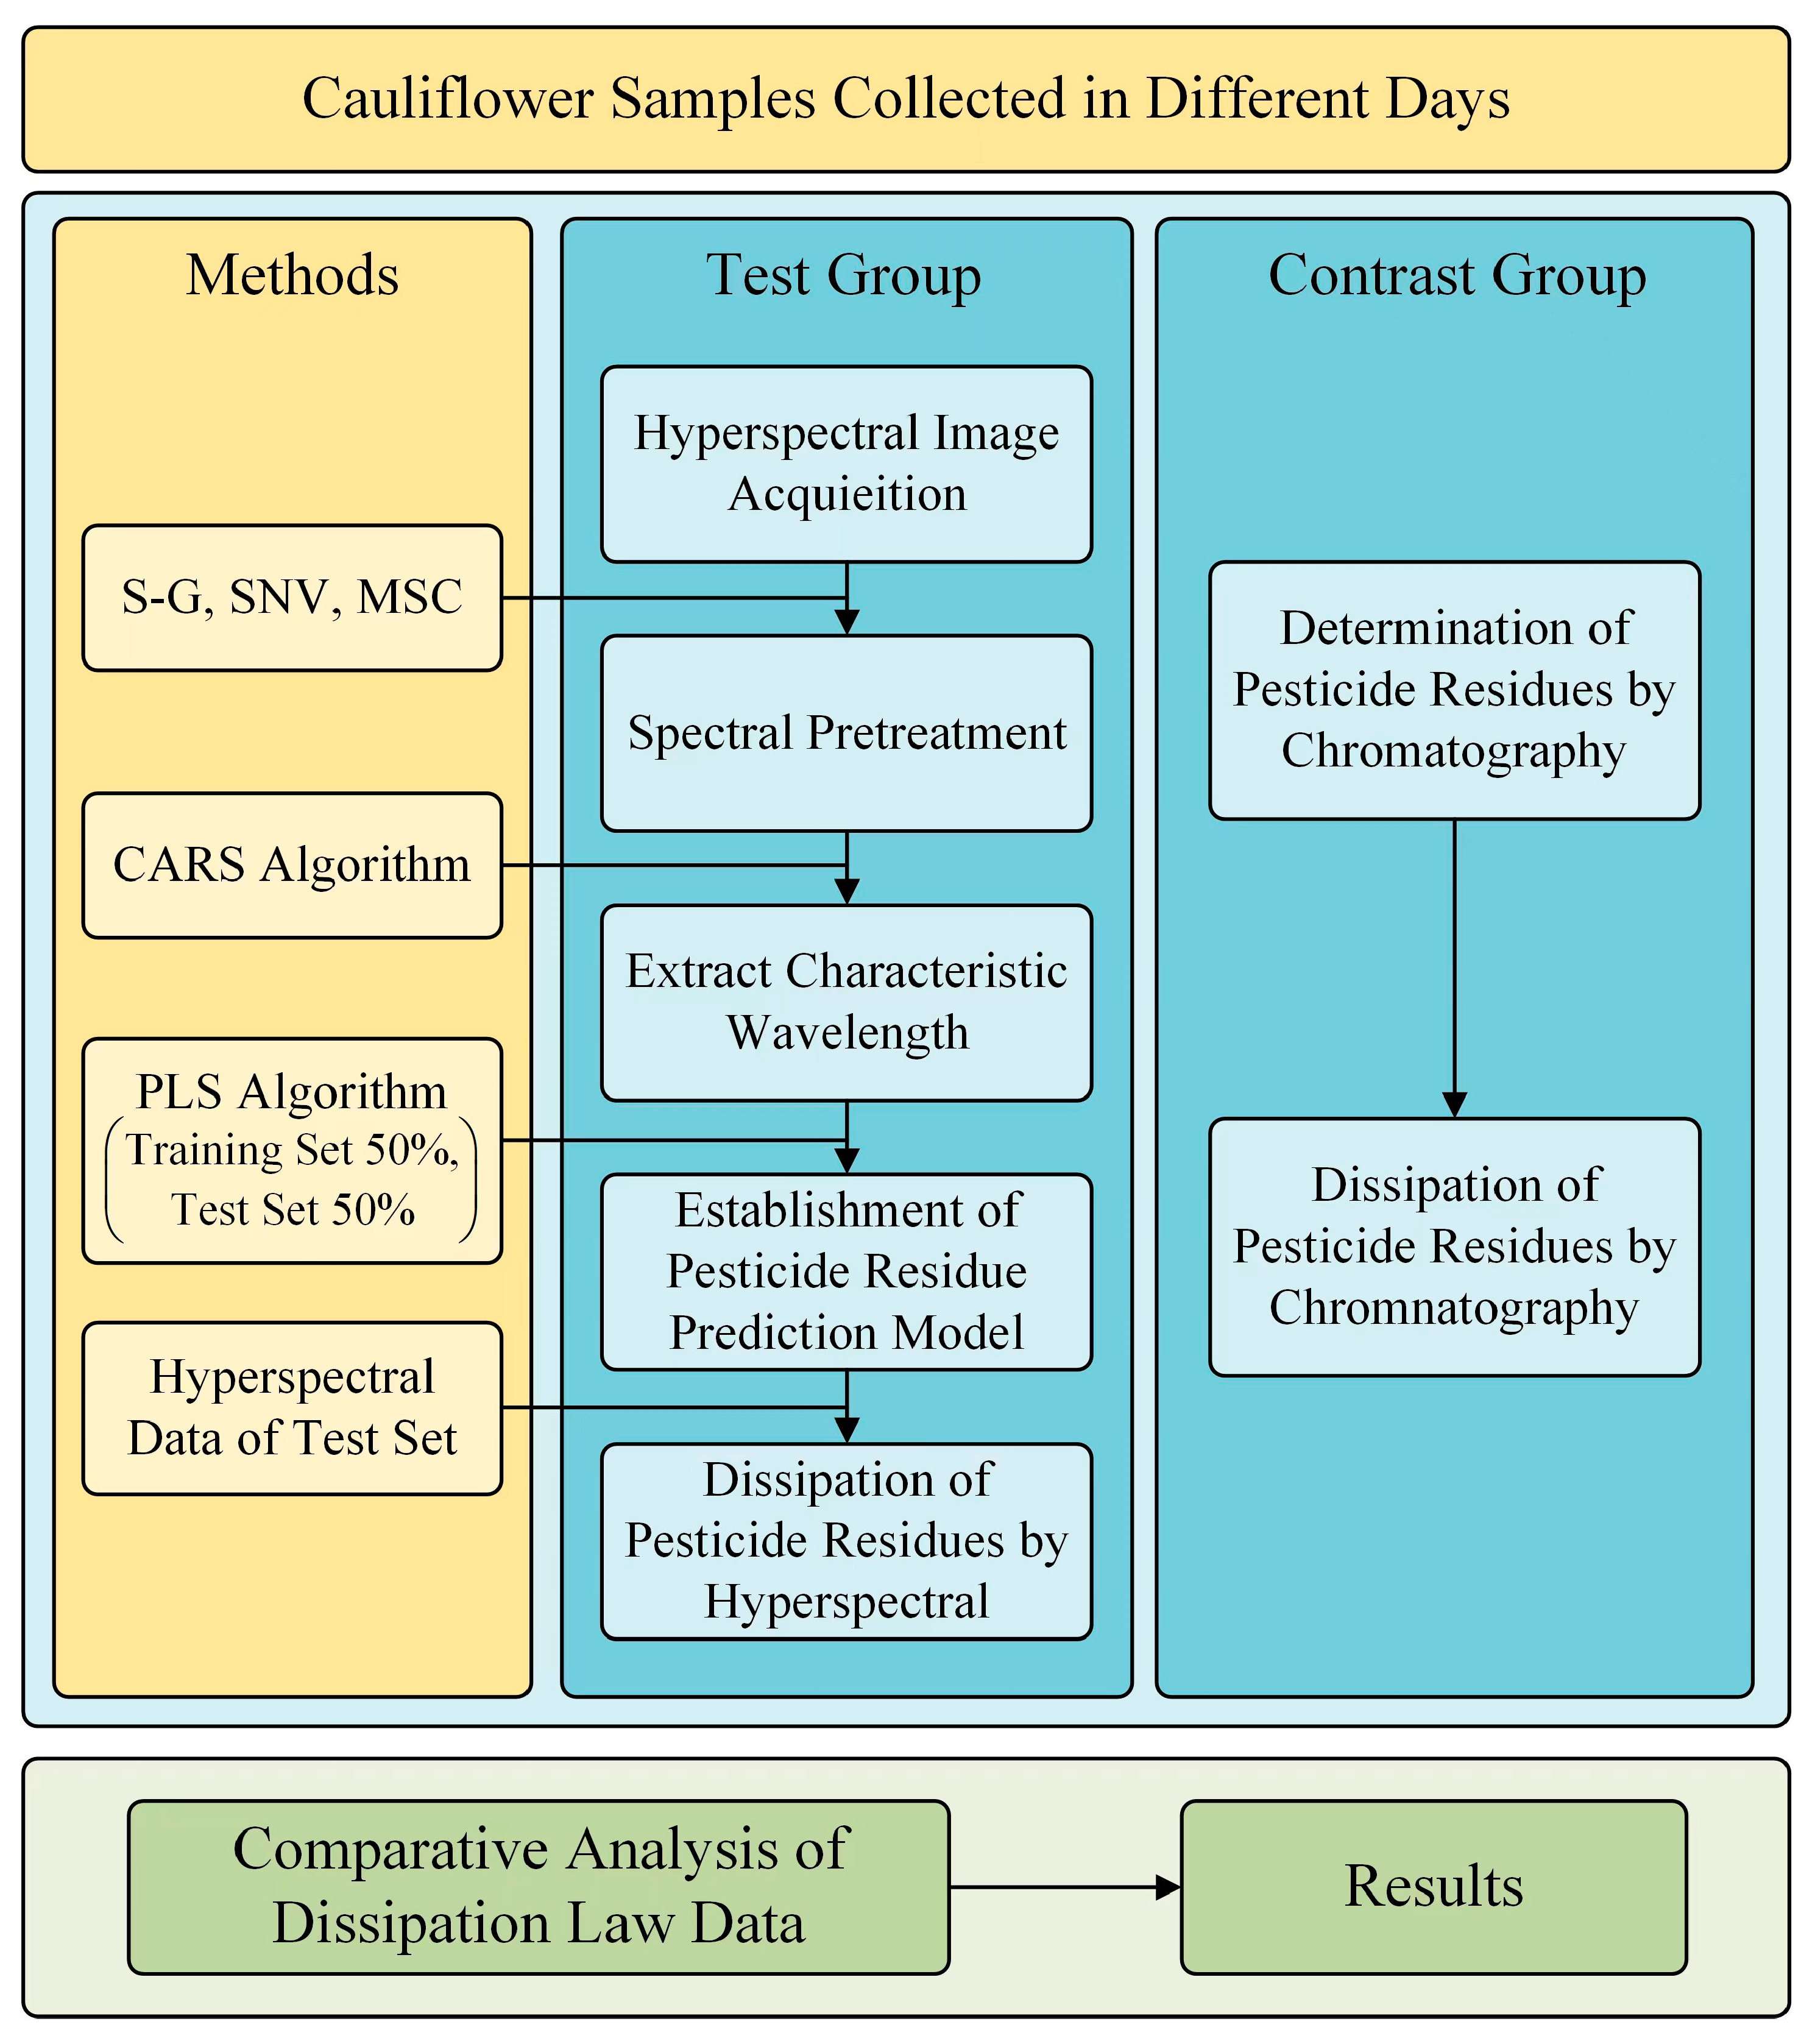
2. Materials and Methods

2.1. Cauliflower Samples

The cauliflower specimens utilized in this study were procured from the Tianjin Jinghai Crop Research Institute Science and Technology Demonstration Base (Tianjin, China), located at 116.973 East Longitude and 38.861 North Latitude, in mid-October 2021. At the time of collection, the cauliflower was in its maturation stage. Two sets of cauliflower samples were prepared: a pesticide-free reference group, consisting of four cauliflower samples that were sprayed evenly with pure water on their surfaces, and a pesticide-containing group, consisting of 24 subsamples collected on six different days, i.e., Day 0, Day 1, Day 3, Day 5, Day 7, and Day 9. To guarantee precise testing for pesticide residues, the pesticides (with a total effective component of 11%, including 1.5% emamectin benzoate and 9.5% indoxacarb, produced by Tianjin Huayu Pesticide Co., Ltd. (Tianjin, China)) were applied in a single instance at a quantity quadruple that of the suggested dosage outlined in the instructions. The first set of samples, including four pesticide-free reference samples and four pesticide-containing cauliflower samples, were collected two hours after pesticide spraying. Hyperspectral imaging was performed on these eight samples immediately after collection using Imspector N17 (Spectral Imaging Ltd., Oulu, Finland, as shown in Figure 2) in the laboratory. The spectral range of the system was 900–1700 nm with 256 spectral channels and an approximately 3.3 nm channel interval.
Owing to the presence of dark current in the system and the variability in the illumination system’s uniformity, both a black and a white calibration image were captured to calibrate the hyperspectral data prior to acquiring the sample’s hyperspectral imagery. The white reference image exhibiting 99% reflectivity was obtained using a polytetrafluoroethylene calibration plate positioned beneath the camera. In contrast, the black reference image was captured by switching off the light source and shielding the lens with the camera cap. The calibrated image (I) was subsequently computed using Equation (1):
I = I r I d I w I d
where Ir is the raw hyperspectral image, Id is the dark reflectance image, and Iw is the white reflectance image.
Following image acquisition, surface samples weighing 300 g were collected from four pesticide-free cauliflower samples and four pesticide-containing cauliflower samples, labeled, and stored at −18 °C to prevent pesticide dissipation. On the second day after pesticide spraying, four independent cauliflower samples with pesticide residue were collected, imaged using hyperspectral imaging, and refrigerated. Subsequently, on Day 3, Day 5, Day 7, and Day 9, four samples were selected each day for image acquisition and cold storage. Finally, the 24 refrigerated surface samples were analyzed for pesticide residue using chromatography at the Tianjin Agricultural Product Quality Supervision and Inspection Center to determine the actual pesticide residues in each sample.

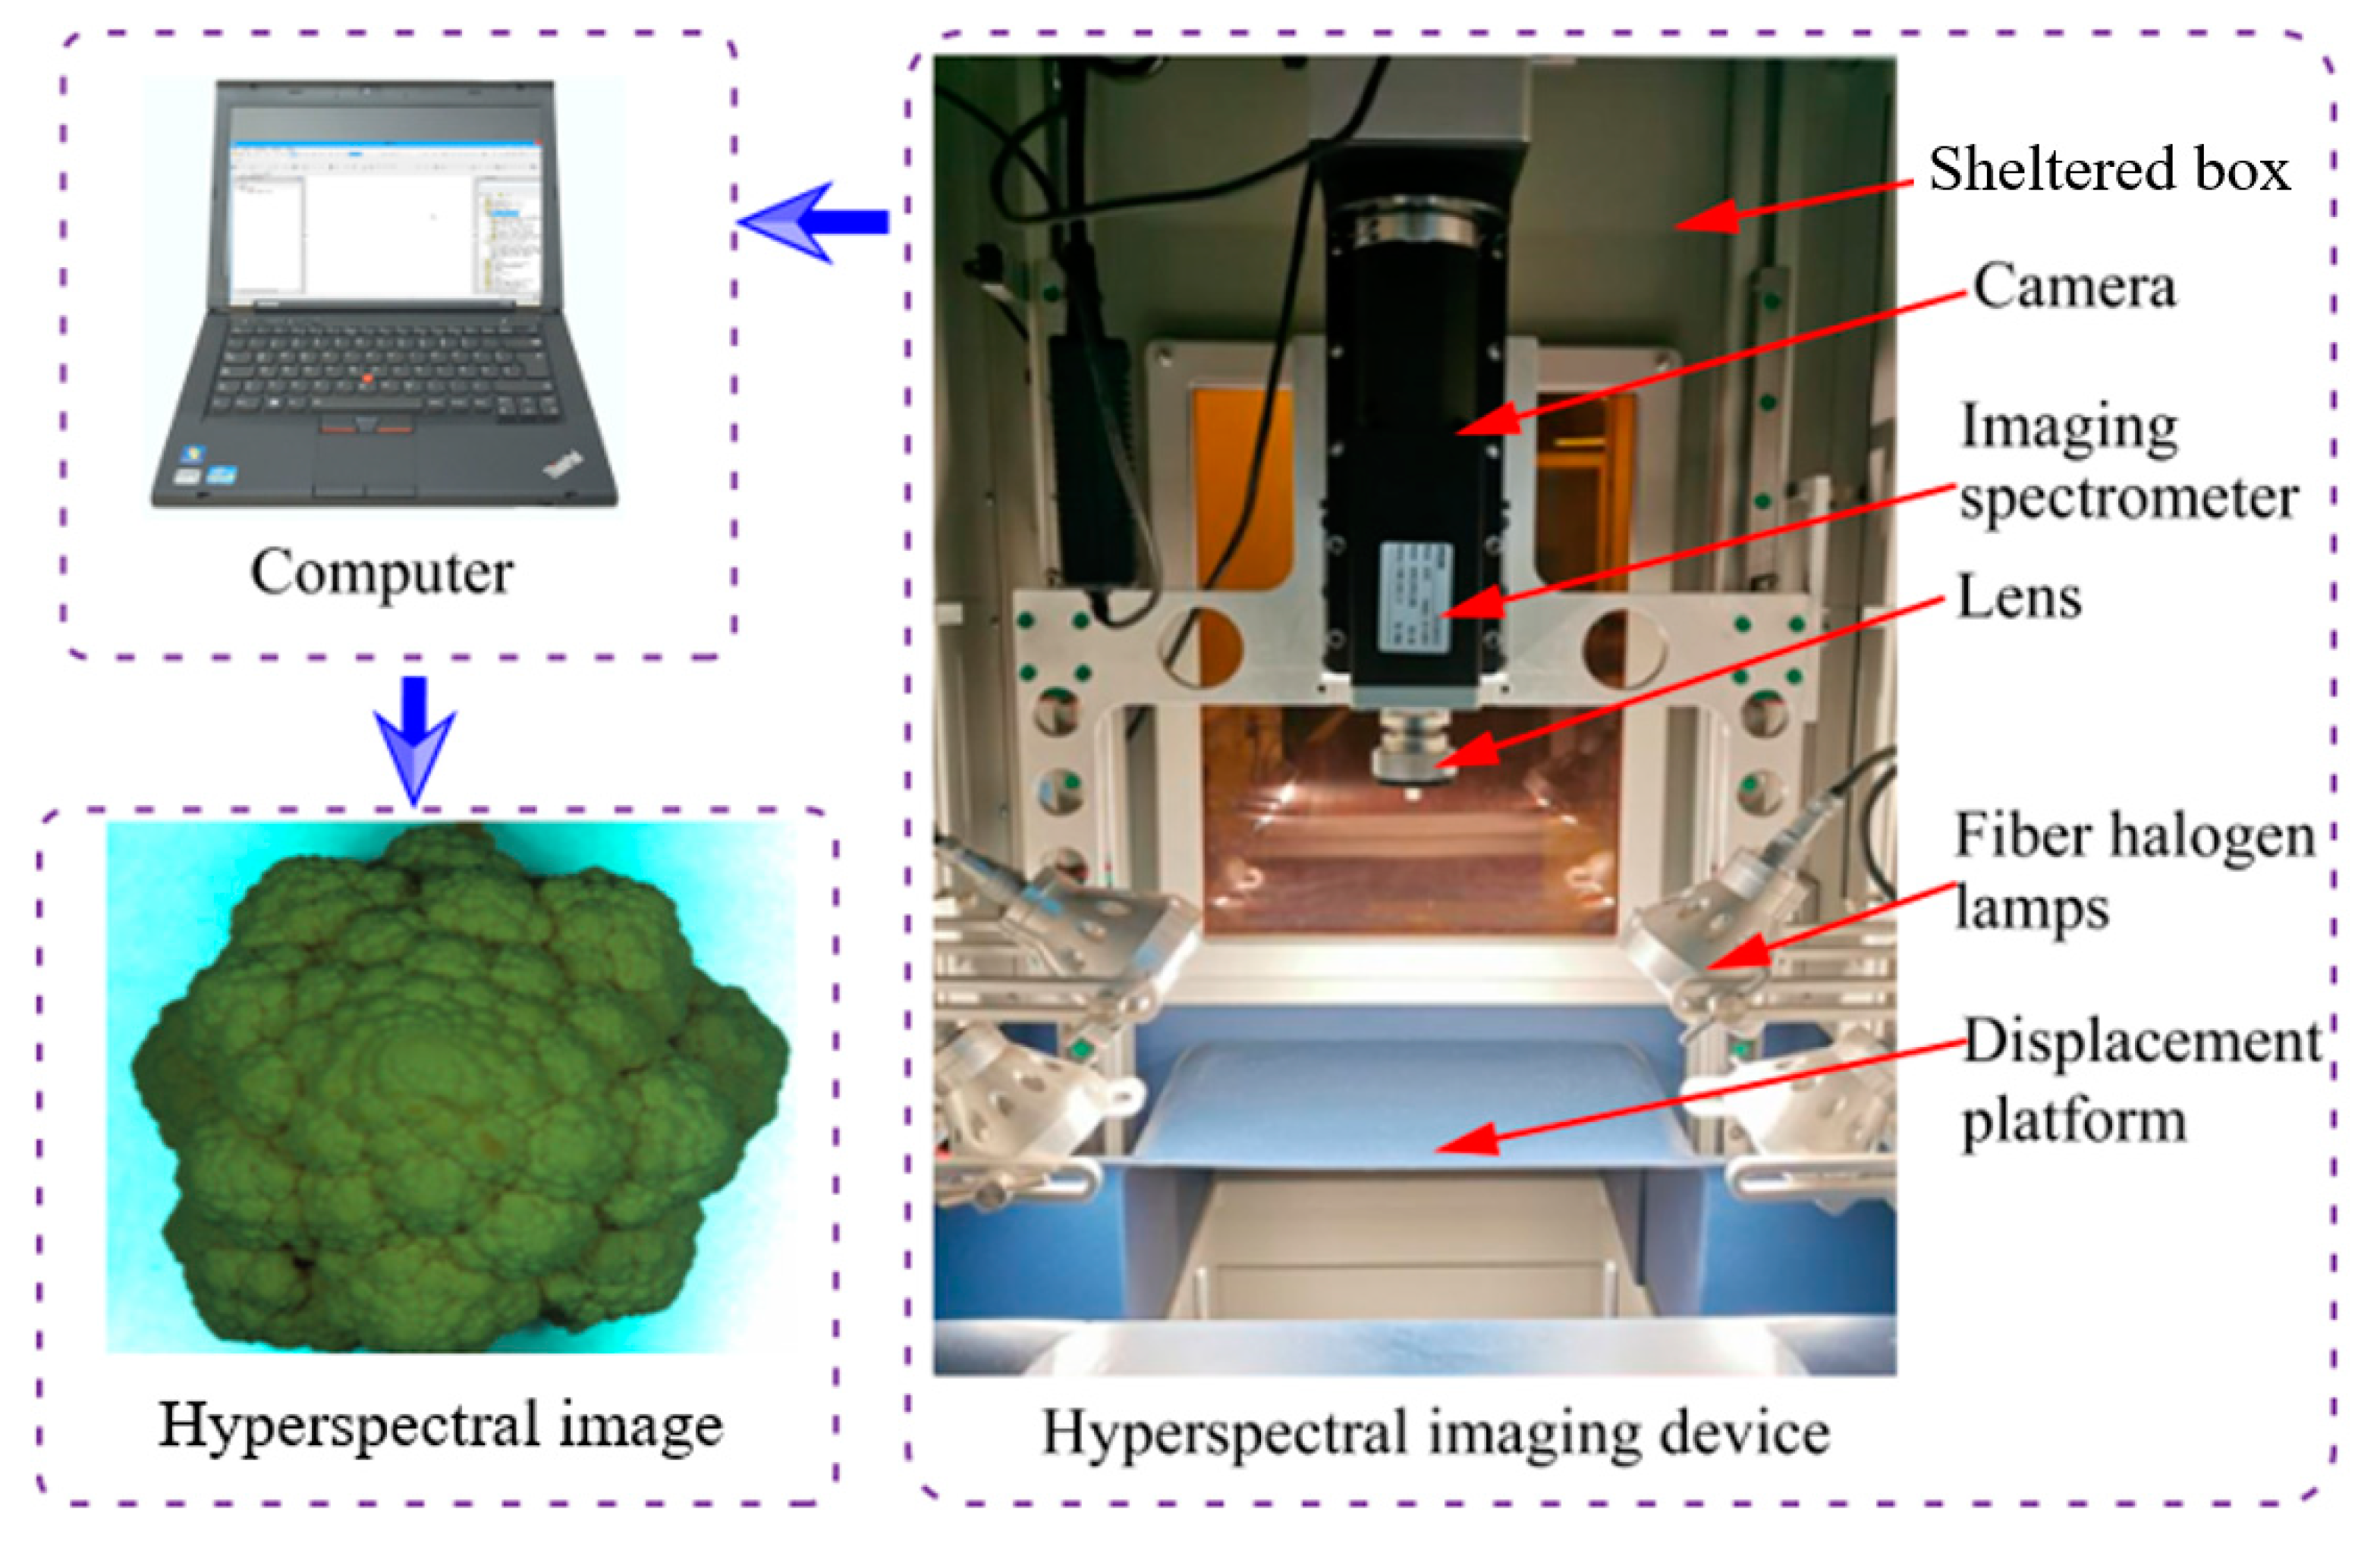
2.2. Extraction of Spectral Data

The regions of interest (ROIs) in the hyperspectral images were extracted using ENVI software Ver 5.1 (Exelis Visual Information Solutions, Boulder, CO, USA). Each selected region had dimensions of 50 pixels × 50 pixels, and ten ROI were extracted from the central area of the spectral image of each sample. As a result, there were 40 pesticide-containing regions in each sample, totaling 240 pesticide-containing regions in the six samples, along with 40 pesticide-free regions. According to the calculations in ENVI software, the average spectrum of each group consisted of 256 bands, spanning a wavelength range from 900 to 1700 nm. However, some noise was present in the collected spectral data, mainly arising from the uneven distribution of light source intensity and dark current from the spectral instrument, particularly at the beginning and end of the spectral data.
The consistency in selecting ROIs in the selection process is critical for achieving robust results. In this study, the use of ENVI software for ROI extraction helped standardize this process, as the same dimensions and location criteria were consistently applied. However, it is important to note that biases can still arise from the inherent subjectivity in defining what constitutes an ROI. The competitive adaptive reweighted sampling (CARS) algorithm employed in this study objectively identifies the most pertinent wavelengths for analysis based on their statistical significance, rather than relying on subjective selection. This approach diminishes the possibility of selectively choosing data that could inadvertently bias the outcomes.

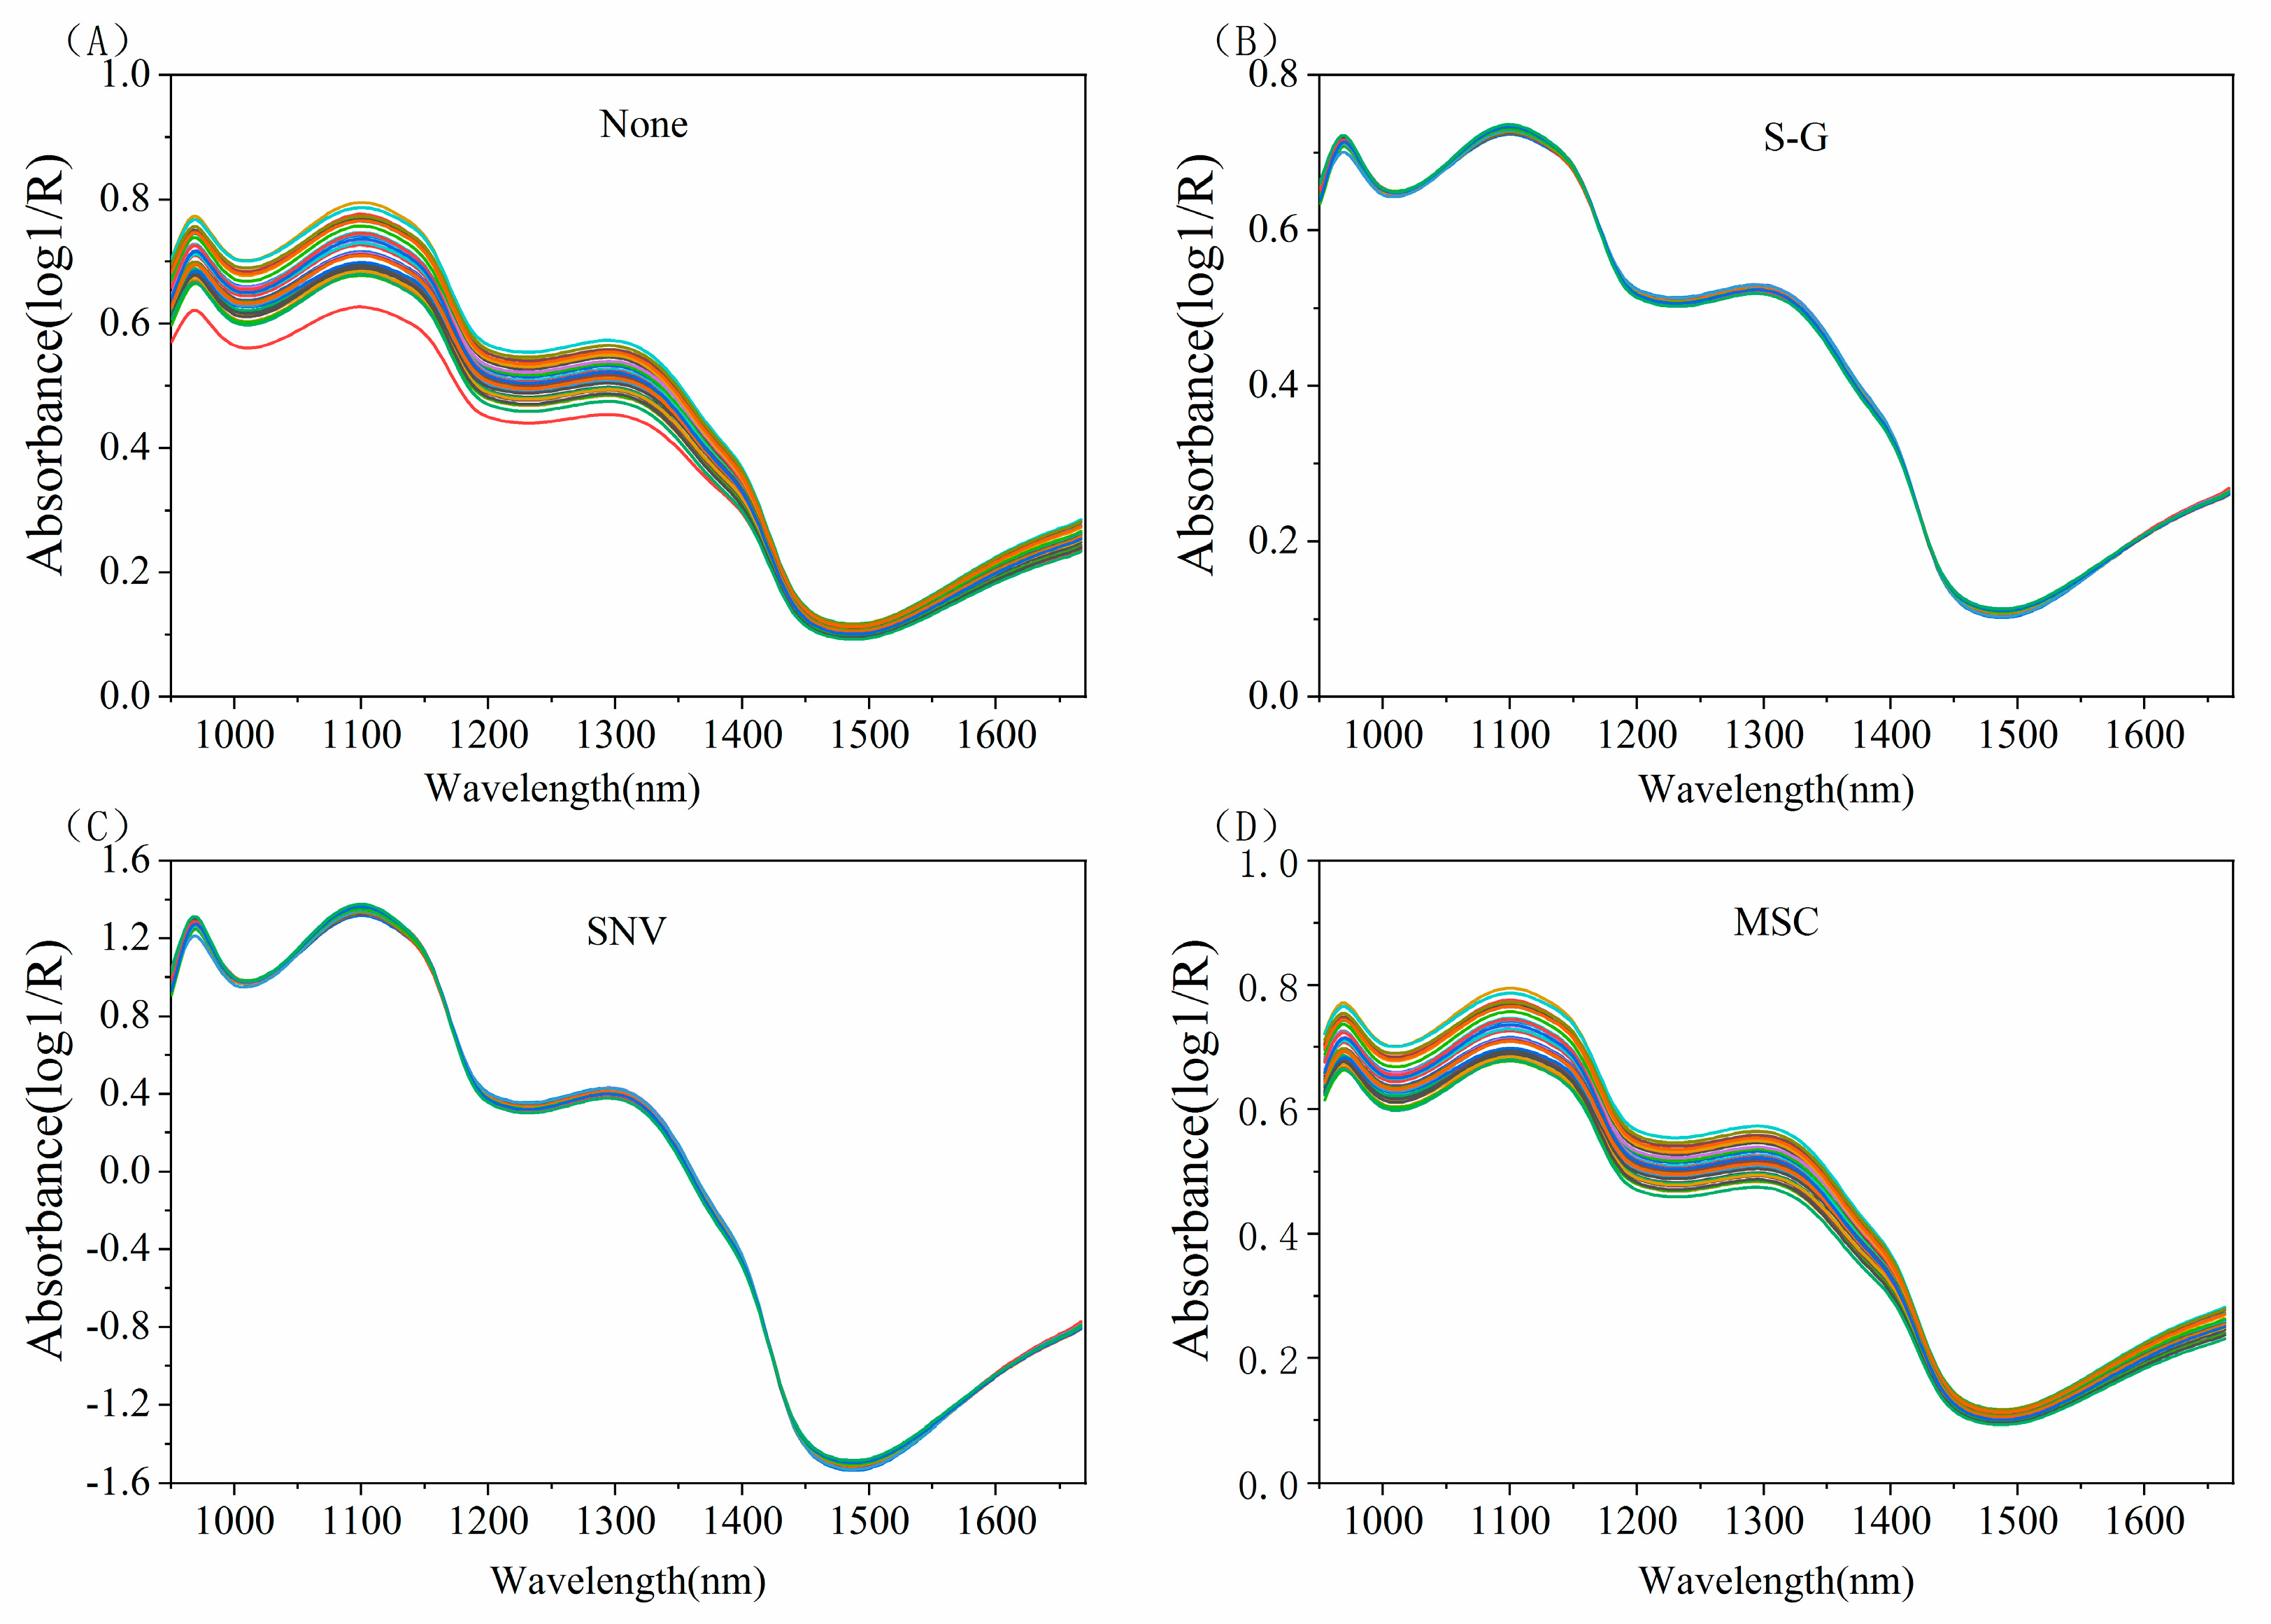
2.3. Spectral Data Preprocessing

To enhance the speed and accuracy of model identification, it is necessary to preprocess the raw spectral data obtained from the samples. In the literature, several spectral data preprocessing methods have been described, including convolution smoothing (S-G) [16], multiplicative scatter correction (MSC) [17], and standard normal variable (SNV) [18]. The S-G smoothing method utilizes the least square fitting coefficient to establish a filtering function that fits the spectral data within a specific range near the smoothing point. In this study, the S-G smoothing filter was implemented using a window size of 5 along with a second-order polynomial. The SNV algorithm normalizes each spectral data set to correct scattering-induced spectral data errors. The MSC algorithm effectively eliminates the influence of scattering, reduces spectral differences, and preserves the essential information of the raw spectrum, thereby enhancing the absorption information and signal-to-noise ratio of the spectrum. These three methods are widely employed in chemometrics for multi-wavelength calibration modeling. Figure 3 depicts the raw spectral data of the pesticide samples obtained two hours after picking, as well as the preprocessed data after applying these three algorithms.
Spectral preprocessing has been established as an effective method for mitigating the effects of spectral noise and astigmatism in spectral imaging. Nonetheless, for the swift identification of pesticide spectra, the selection of pertinent characteristic spectra from the preprocessed spectral data is essential. These characteristic spectra are instrumental to predictive models, as they decrease the dimensionality of the spectral data while retaining the maximum amount of original information. Such a process significantly enhances the computational efficiency of pesticide discrimination [19].
In this study, the spectral data of indoxacarb pesticides were imported into MATLAB software Ver 2021a (The MathWorks, Inc., Natick, MA, USA), and the competitive adaptive reweighted sampling (CARS) algorithm [20] was utilized to extract the characteristic spectrum of the pesticide. The CARS algorithm mimics Darwin’s theory of evolution by using the absolute value of the regression coefficient in the partial least squares regression (PLS) model [21] as an index of the variable importance. It selects the optimal combination of effective variables across the entire spectrum. Thirteen distinct spectra were obtained after 50 samplings at wavelengths of 1067.15, 1070.48, 1140.41, 1143.74, 1167.05, 1213.67, 1236.98, 1246.97, 1270.28, 1336.88, 1340.21, 1343.54, and 1356.86 nm. The characteristic wavelength extraction results are presented in Figure 4. Finally, the spectral data processed using the three methods described above, along with the raw spectral data, were inputted into the model to determine the best optimization algorithm.

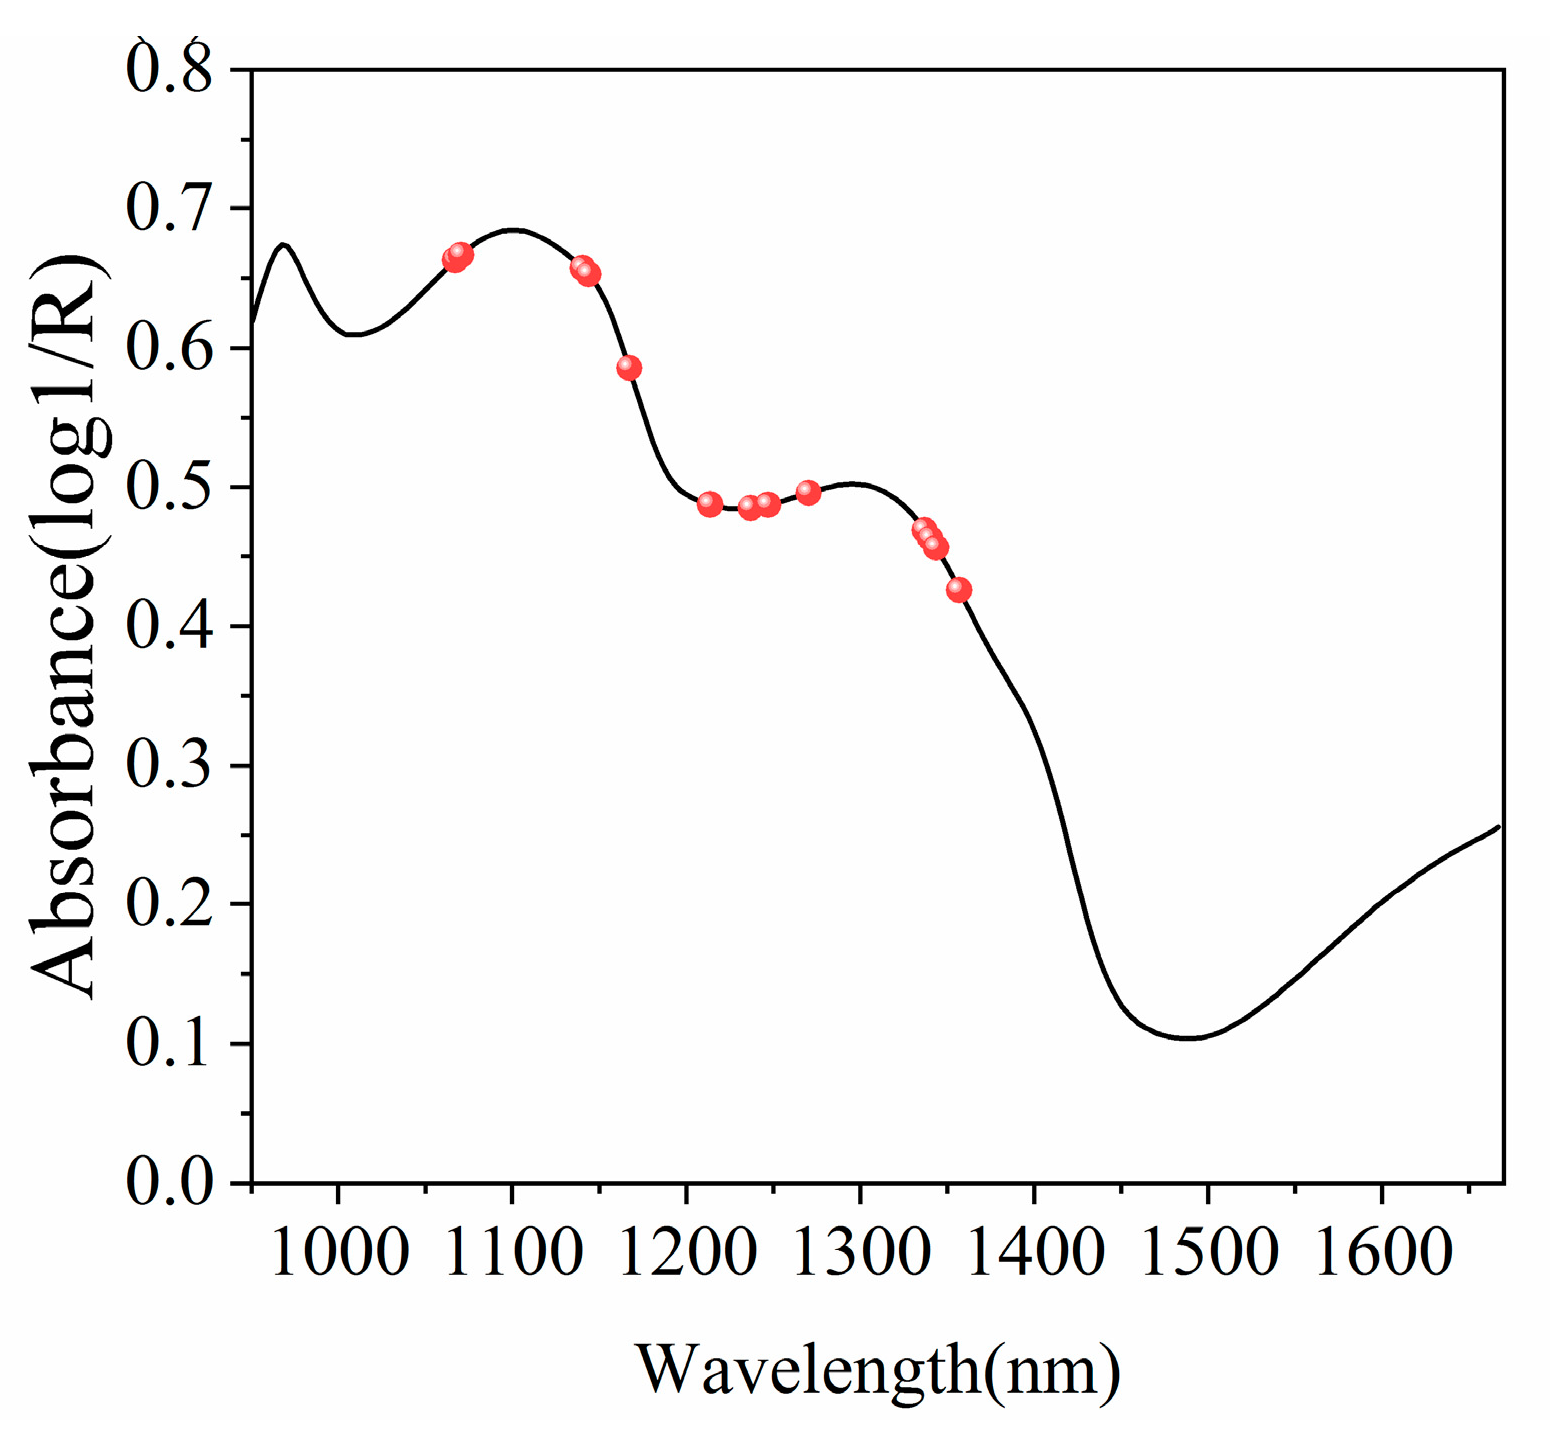
3. Results and Discussion

3.1. Model Selection

The spectral curves of cauliflower with and without pesticide residues on the surface exhibited significant differences, as depicted in Figure 4. The signal-to-noise ratio of the spectral curve considerably improved, particularly after preprocessing. For the discriminant analysis of pesticide presence or absence, the partial least squares (PLS) method was utilized [22,23], which is a widely used multivariate statistical method for developing spectral detection models [21]. This algorithm performs principal component analysis on both the spectral matrix X and the concentration matrix Y, incorporating factor analysis and regression analysis to identify potential variables and find the best function that matches a set of data by minimizing the sum of squared errors. In the development of the PLS model, a full cross-validation approach [24] was employed. For this research, the completely randomized design (CRD) model was employed. Among the 40 cauliflower samples contaminated with pesticides, 20 were assigned to the training set, and the remaining 20 were assigned to the test set. Similarly, 20 out of the 40 pesticide-free cauliflower samples were designated as the training set, and the remaining 20 were assigned to the test set. Discriminant models were constructed using the 40 pesticide-containing and pesticide-free samples as the training sets, and the remaining 40 samples were used to evaluate the discriminant performance. The spectral data, spanning wavelengths from 950 nm to 1666 nm, served as the independent variable X, while the presence of pesticides served as the dependent variable Y. Table 1 presents the discriminant performance of the test set after applying the three preprocessing algorithms and the untreated raw spectral data. To assess the prediction performance of the model, the R2 (coefficient of determination) and RMSE (root mean square error) metrics [25] were employed. The discriminant accuracy of the model improved as the R2 approached 1 and the RMSE approached 0.
In this study, qualitative identification was employed to determine the presence of pesticides on the surface of cauliflower. Hyperspectral imaging was conducted two hours after picking when the pesticide residue rate was still at 100%. Among the various data models that use preprocessing, the model with SNV pretreatment demonstrated a discriminant accuracy of 0.9688 and the smallest error of 0.2648, as indicated in Table 1. By normalizing the spectral data, the SNV algorithm effectively corrected scattering errors and reduced the influence of irregularities on the cauliflower surface. On the other hand, using the raw spectral data directly resulted in poor outcomes due to electrical noise and interference from the sample background, leading to uneliminated errors. Although the S-G smoothing algorithm did not outperform the SNV algorithm, the MSC algorithm retained a substantial amount of raw data and yielded favorable results, albeit with some remaining errors (as depicted in Figure 3D). Ultimately, the SNV-PLS model was selected for detecting pesticide residues in cauliflower. This choice improved operational speed and ensured reliable discriminant results, thanks to the optimization provided by the SNV algorithm.

3.2. Dissipation Law of Pesticides

3.2.1. Pesticide Residues in Cauliflower Detected Using Chromatography

The Tianjin Agricultural Product Quality Supervision and Testing Center conducted measurements of pesticide residues in cauliflower samples containing indoxacarb. Table 2 presents the pesticide residue levels of indoxacarb in cauliflower over a specific period of time. Since the indoxacarb used was a mixed pesticide comprising two types (emamectin benzoate and indoxacarb), liquid chromatography was utilized to detect the residues of both components. For detailed information on recent advancements in sample preparation techniques integrated with high-performance liquid chromatography, please refer to [26]. After a 2 h spraying of indoxacarb, the deposition of emamectin benzoate on cauliflower was found to be 2.7 mg/kg, while the deposition of indoxacarb was measured at 14.79 mg/kg.

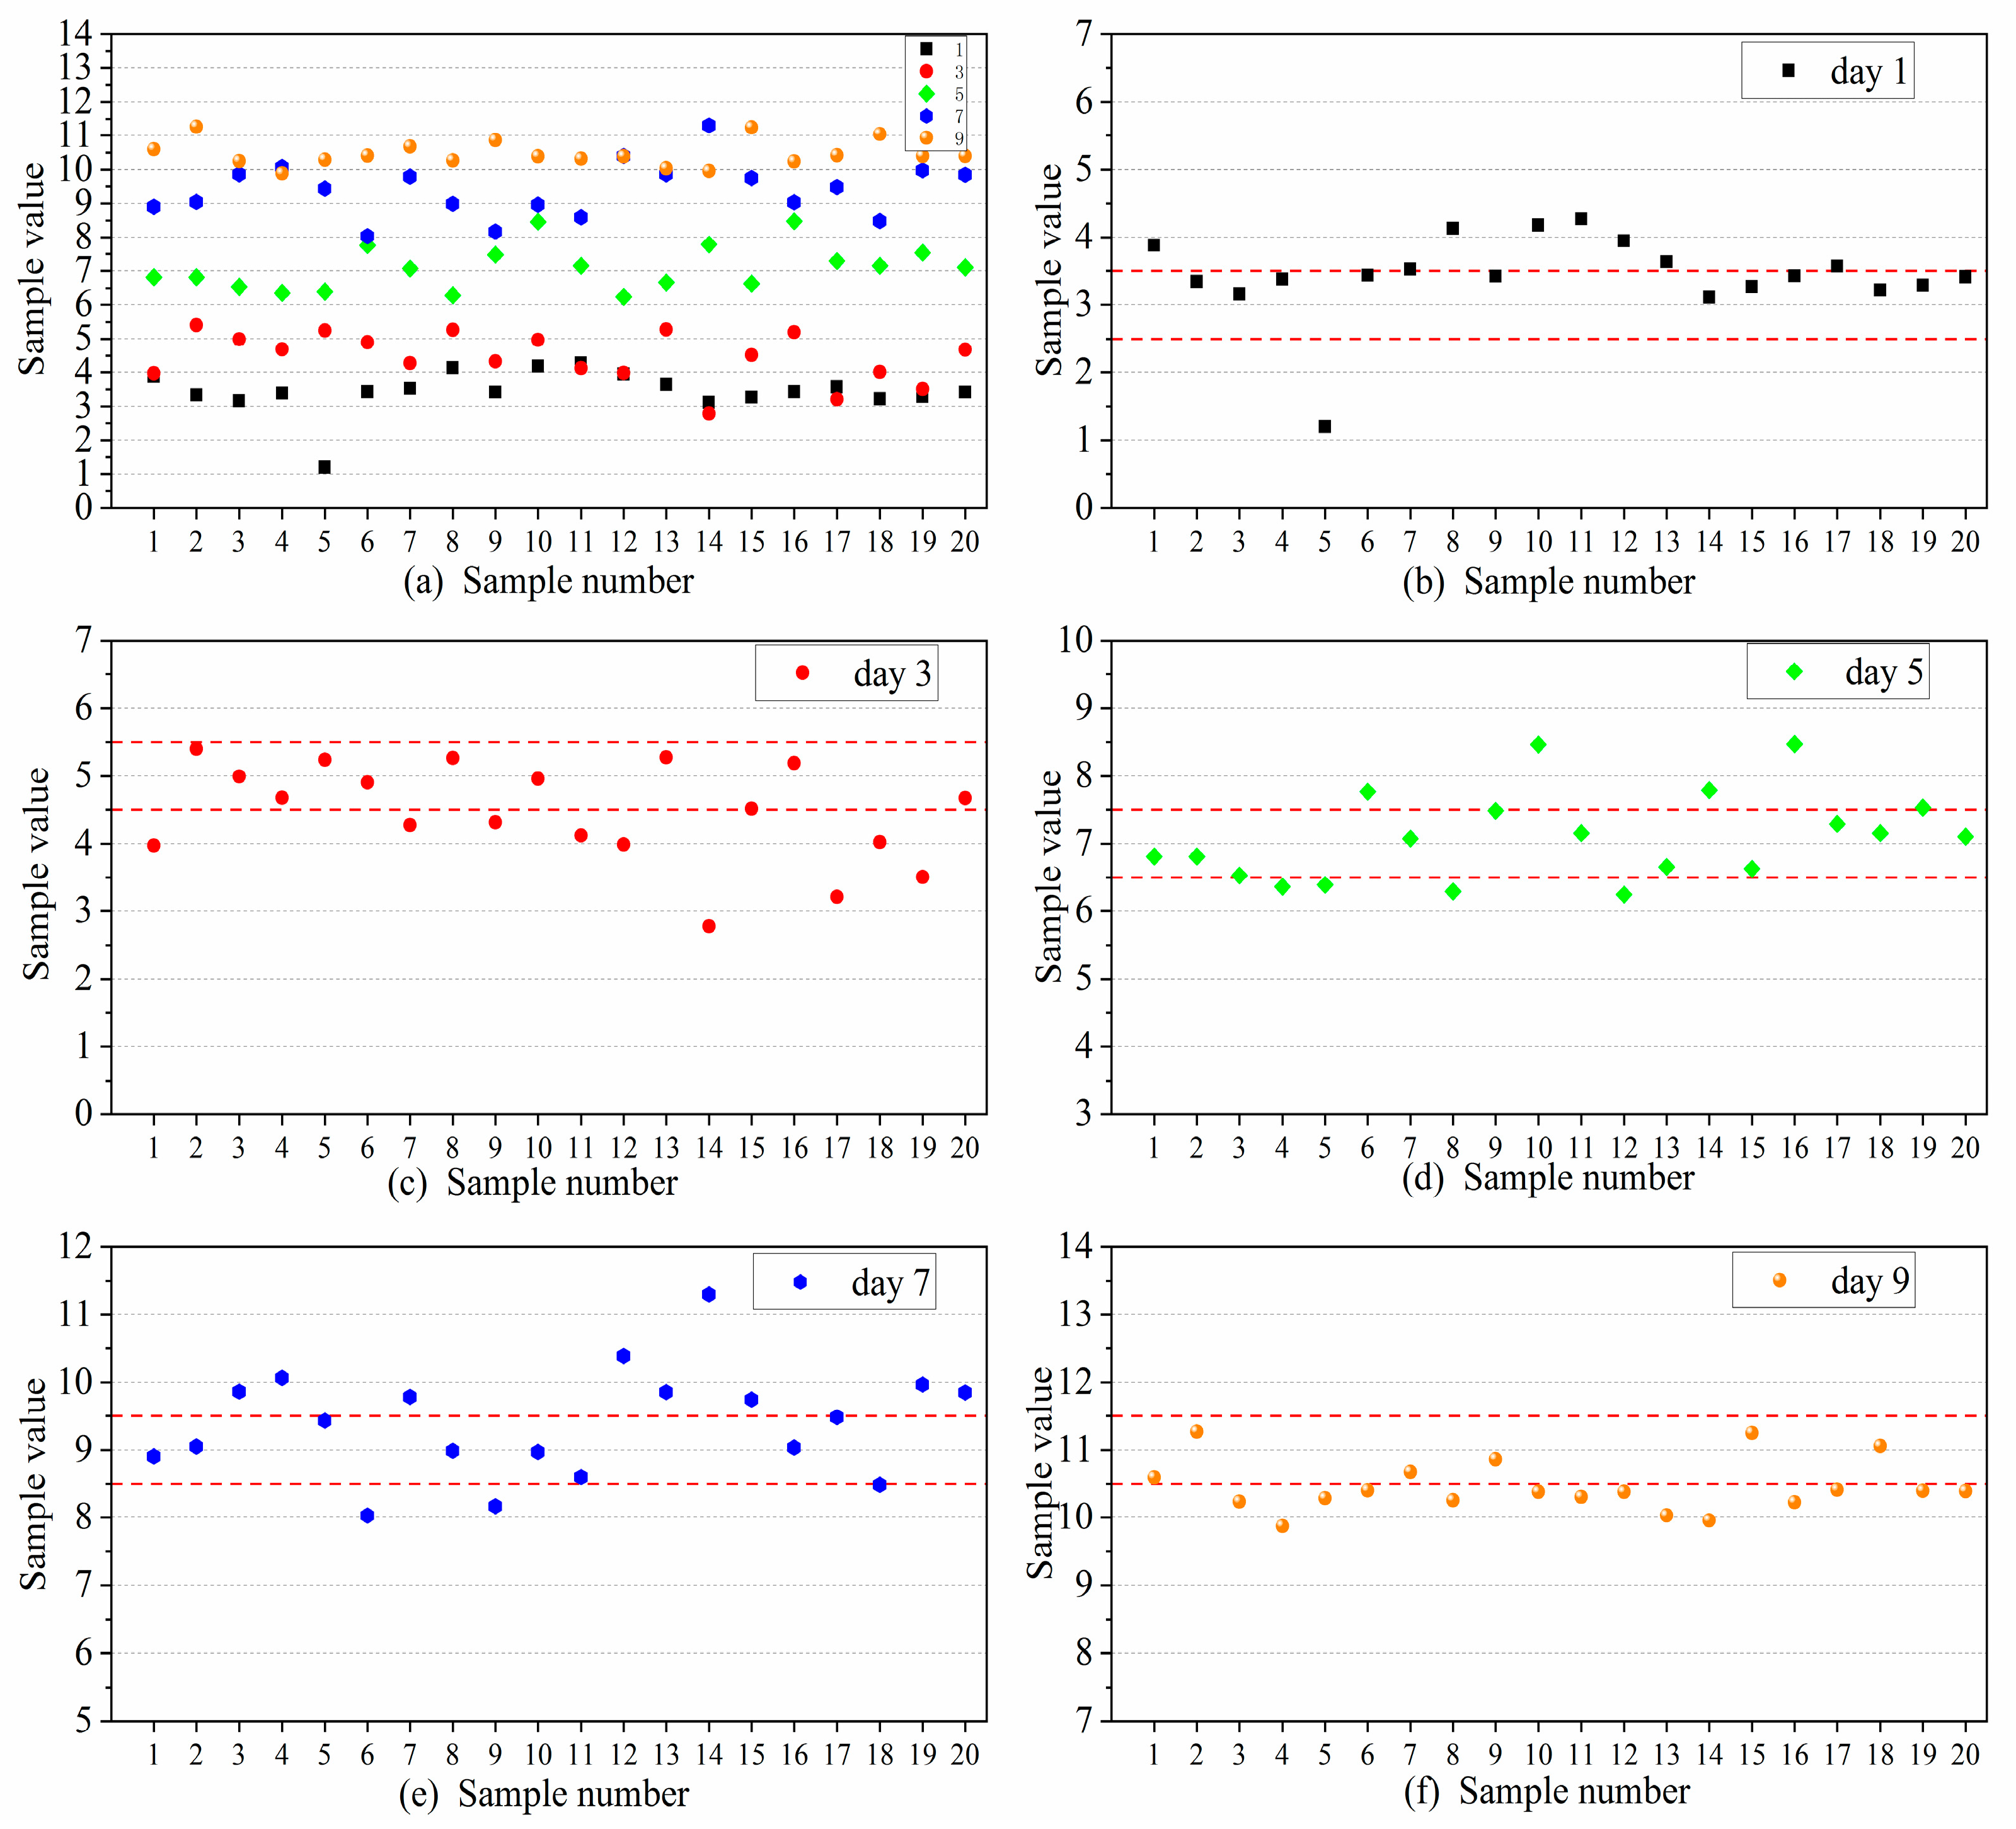
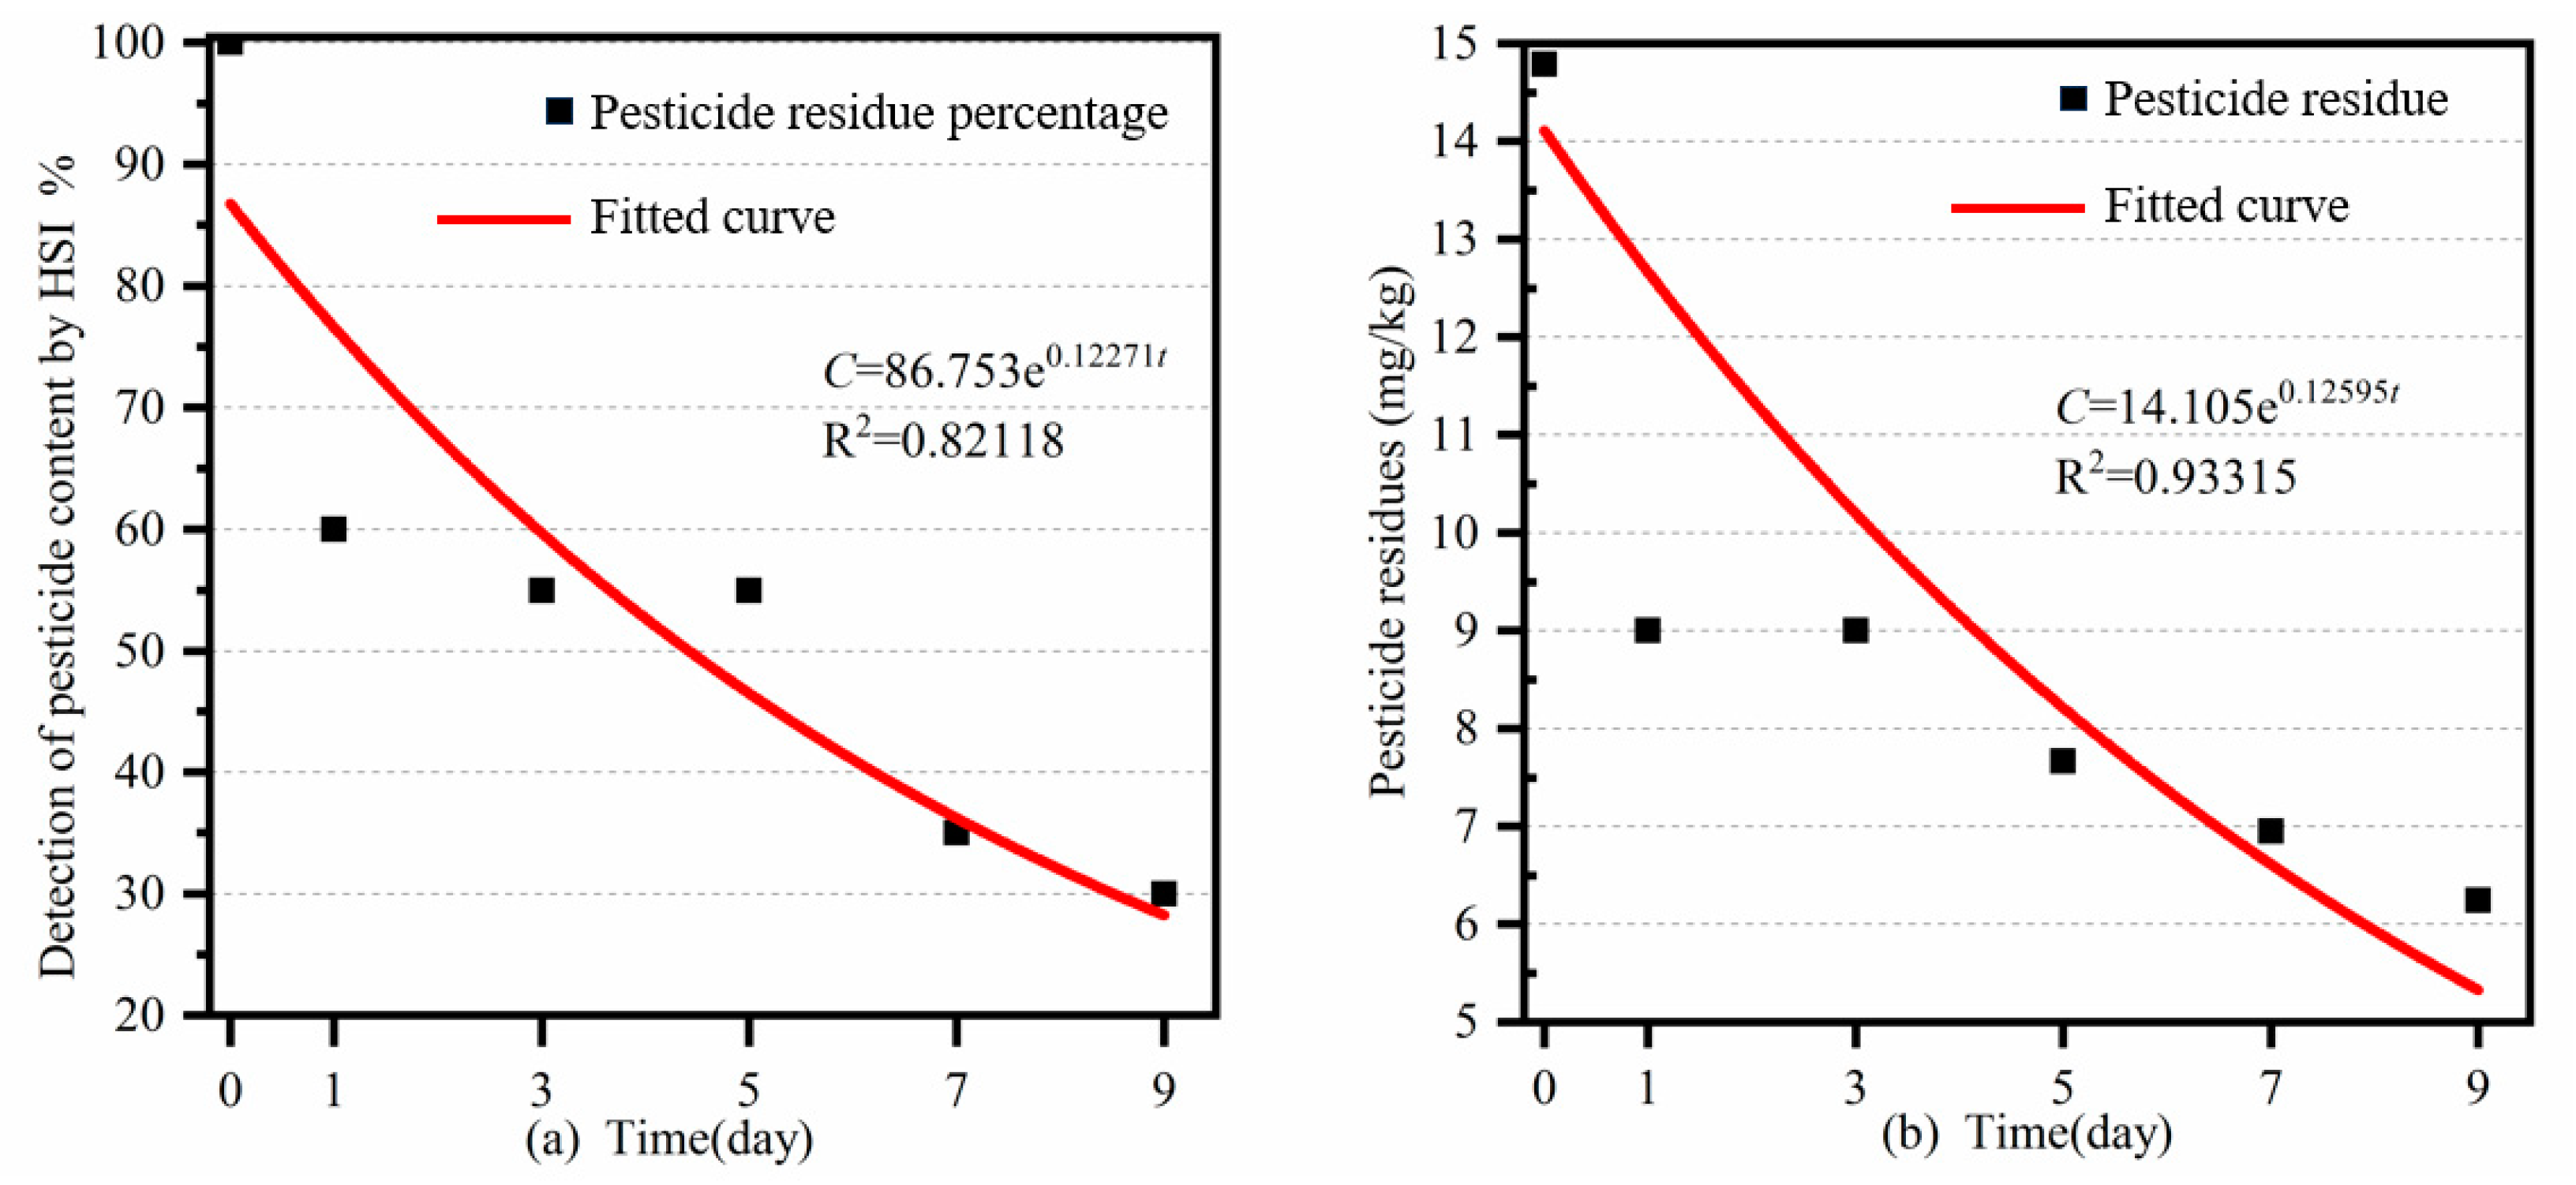
3.2.2. Pesticide Residues in Cauliflower Detected by the Hyperspectral Imaging Method

The best discriminant model was utilized to evaluate cauliflower samples collected over a span of six days. In order to differentiate the pesticide residue values of samples collected on different days, the sample values 3, 5, 7, 9, and 11 represent the pesticide residue values on Day 1, Day 3, Day 5, Day 7, and Day 9, respectively. A specific threshold value was set to determine whether the pesticides had dissipated [27]. In this study, the threshold was set to 0.5. Samples that fell outside the threshold range were considered to have dissipated. The model was trained using the 120 samples collected over the six days, and the remaining 120 test samples were used for discriminant detection. The results of the test are illustrated in Figure 5, in which the dotted line means the boundary of the threshold range.
The initial pesticide residue rate was established at 100% for Day 0. According to Figure 5, the pesticide determination model for cauliflower samples had residue rates of 60% on Day 1, 55% on Day 3, 55% on Day 5, 35% on Day 7, and 30% on Day 9. The actual residue rates of indoxacarb pesticides on cauliflower detected by chromatography were 60.85%, 60.85%, 51.17%, 46.99%, and 42.19%, respectively.

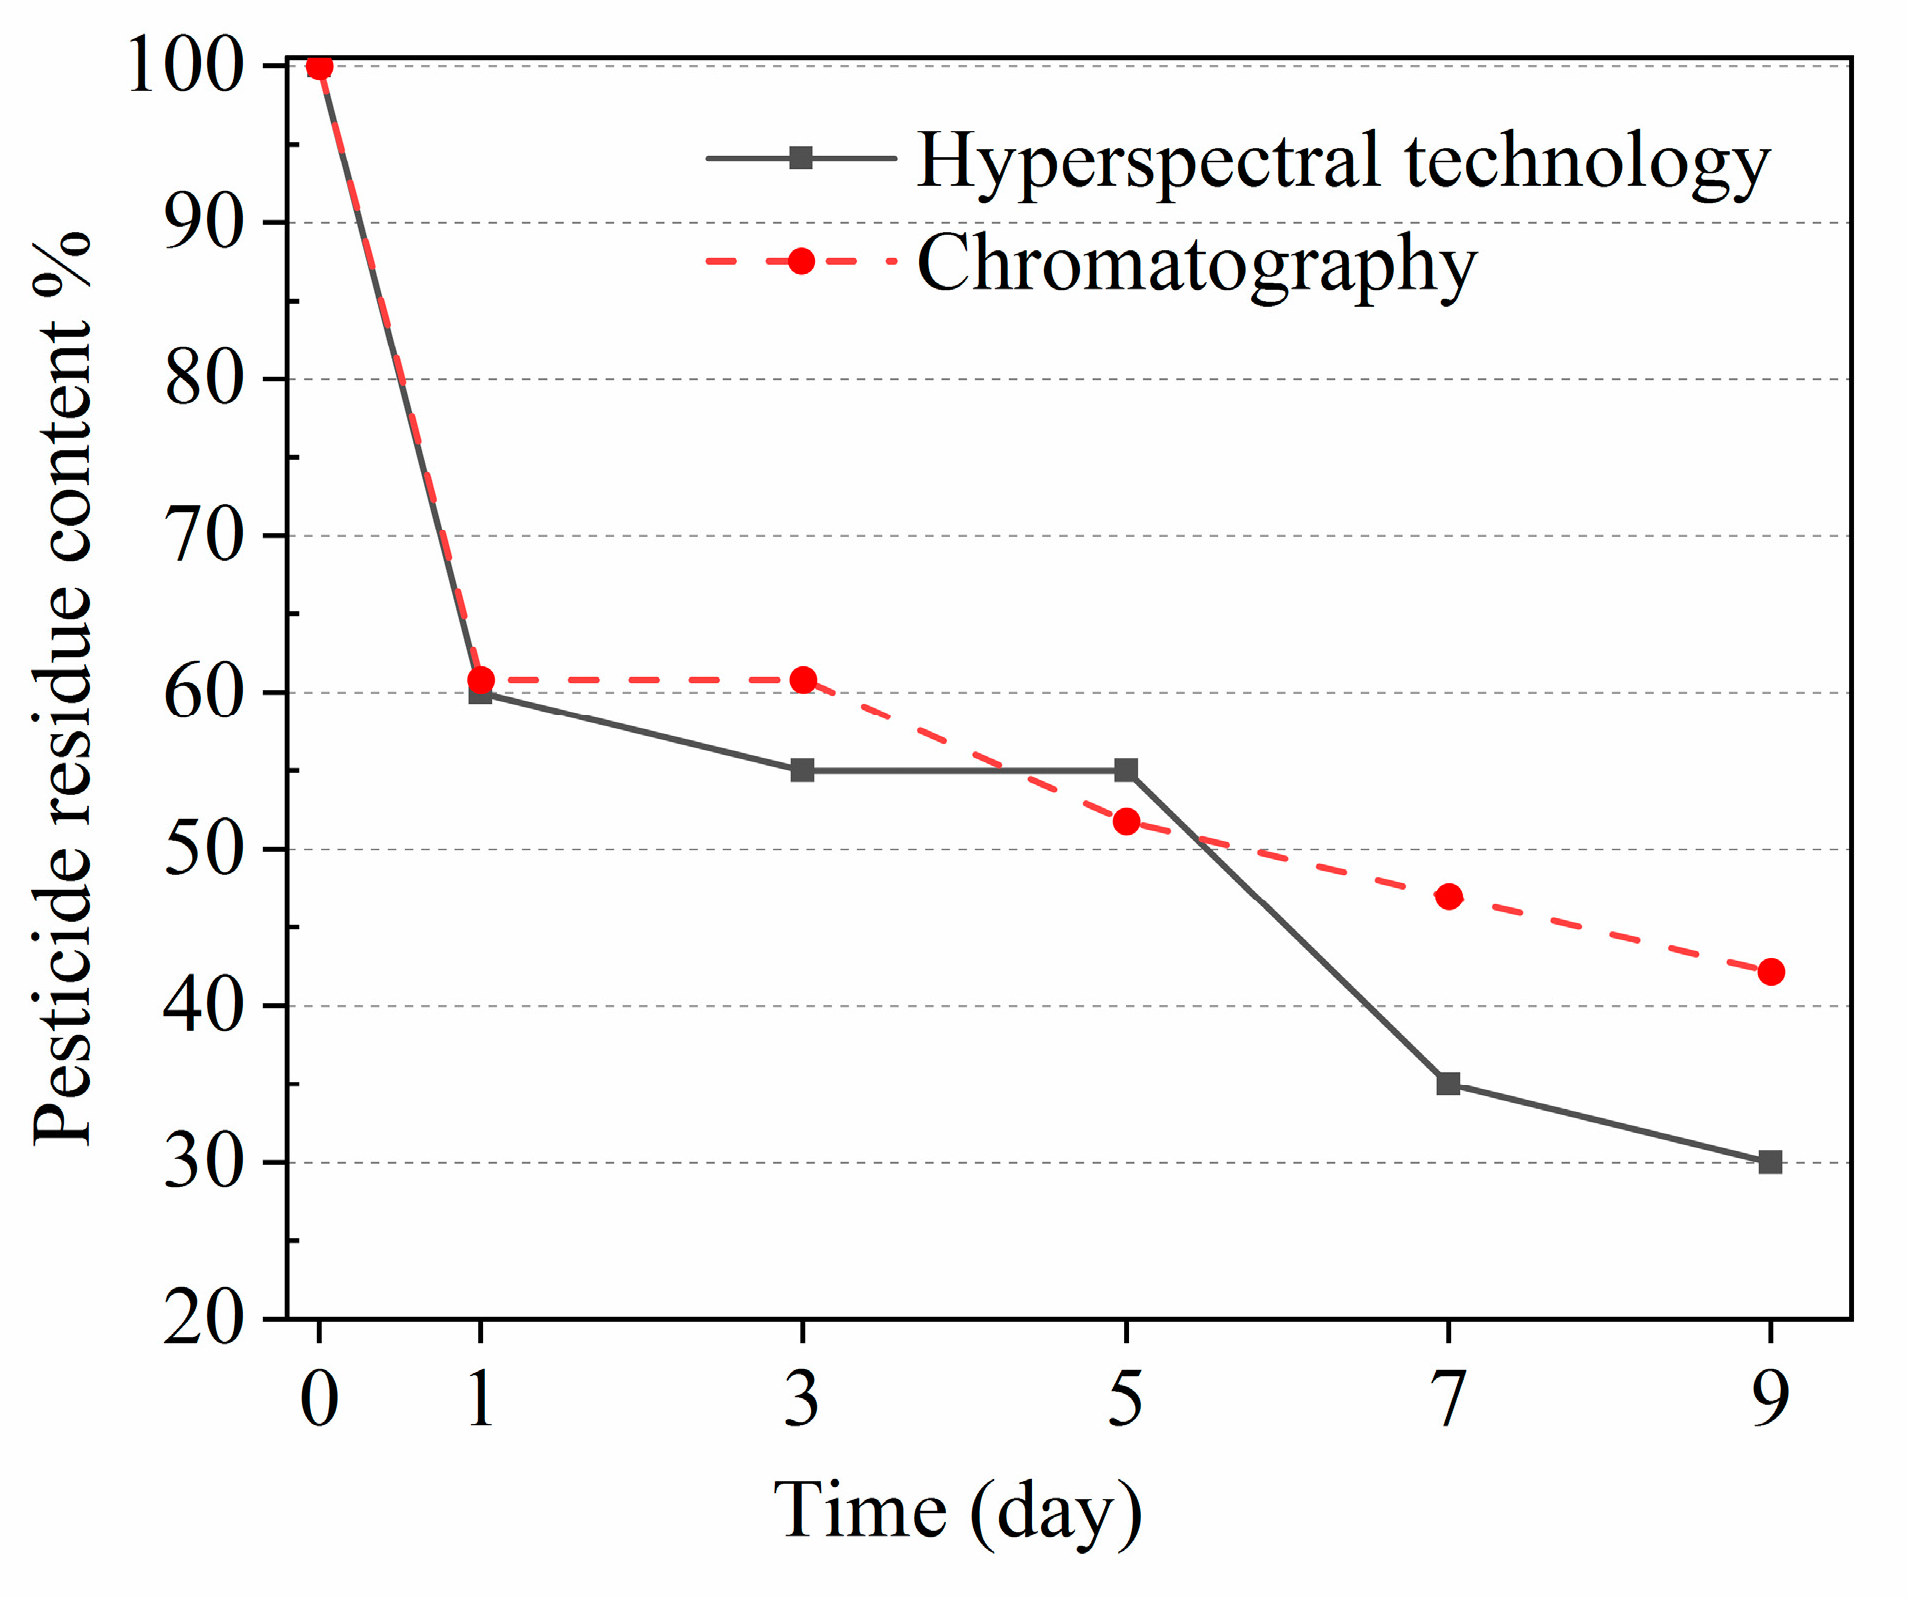
3.2.3. Comparison of Results of Hyperspectral Imaging Method and Chromatography

The pesticide residue rates on cauliflower obtained through hyperspectral technology and the actual indoxacarb pesticide residue rates measured by chromatography were compared, as shown in Figure 6. The observed percentage deviations of hyperspectral technology from chromatography are −1.40%, −9.61%, 7.48%, −25.51%, and −28.89% for Day 1, Day 3, Day 5, Day 7, and Day 9, respectively. Consistent trends have been noted in the results.
To validate the accuracy and reliability of the hyperspectral detection results, an additional data fitting analysis was carried out considering the pesticide half-life as a crucial parameter for pesticide dissipation. The pesticide dissipation pattern was found to follow the first-order kinetic equation [28,29]. To obtain the best curve of pesticide dissipation kinetics, the maximum R2 (the squared correlation coefficients) was determined and used to measure the goodness of fit. By considering the mentioned parameters, the kinetics of pesticides following the first-order rate should be
Ct = C0ekt
where Ct, C0, and k indicate the concentration of the pesticide residue at the time of t, the initial concentration of pesticide after spraying, and the degradation constant, respectively [29]. The half-life t1/2, the time needed to detect pesticide residue, was decreased to 50% of its initial value, and was determined according to
t1/2 = ln2/k
The pesticide detection rate obtained through hyperspectral technology and the pesticide dissipation results obtained from chromatography were both subjected to exponential fitting. The fitting results of the pesticide residue rate on cauliflower using hyperspectral technology and chromatography are depicted in Figure 7.
The dissipation equations for indoxacarb pesticide detection using hyperspectral imaging technology and chromatography are shown in Table 3.
It was found that the discrepancy in the half-life of pesticides as detected by hyperspectral and chromatographic methods is a mere 0.14 days. These results indicate that the dissipation law of the main components of indoxacarb pesticides determined by hyperspectral technology is consistent with the actual dissipation law. Furthermore, the half-life of the pesticides determined by these two methods is similar.
While traditional chromatographic methods are known for their high precision in detection, they are typically time-intensive and necessitate meticulous sample preparation, alongside the utilization of costly equipment. Hyperspectral imaging could potentially circumvent these constraints by offering a quicker, more cost-efficient, and non-destructive alternative for residue detection, negating the need for extensive sample preparation processes. This could significantly mitigate the issues associated with laborious sample preparation, thereby decreasing both the time and cost involved in the entire detection operation [30].
Furthermore, hyperspectral imaging possesses the capability to capture both spatial and spectral information, providing a comprehensive perspective of the sample. This capacity enables the potential identification of residue variation across the cauliflower’s surface, which could provide more detailed information than what is obtainable through non-imaging spectroscopy. Non-imaging spectroscopy may not be able to discern such spatial heterogeneity since it typically delivers the average spectral information of a sample without detailing the specific distribution of residues on the sample’s surface [31].
It is essential to corroborate the hyperspectral imaging method and the comprehensive study outcomes using a recognized and reliable technique. In this research, the juxtaposition of hyperspectral detection outcomes with chromatographic data offered an external point of reference for evaluating the precision and dependability of the hyperspectral methodology.

4. Conclusions

Hyperspectral imaging technology has shown significant potential in the rapid and non-destructive detection of emamectin benzoate + indoxacarb pesticide residues in cauliflower. Through a comparative analysis of discrimination accuracy for pesticide residues, it was determined that the SNV-PLS model exhibited the highest recognition effect, with a determination coefficient of 0.9688 and a root mean square error of 0.2648.
The residual rates of pesticide samples, as determined by hyperspectral imaging technology on Day 1, Day 3, Day 5, Day 7, and Day 9 after spraying, were observed to be 60%, 55%, 55%, 35%, and 30%, respectively. These values were remarkably similar to those obtained by chromatography for the same samples. Hence, hyperspectral technology can provide a reliable method for acquiring pesticide residue data.

Author Contributions

Conceptualization, H.W.; methodology, X.Y.; software, B.S.; validation, H.W.; formal analysis, B.S.; investigation, B.S.; resources, X.Y.; data curation, B.S.; writing—original draft preparation, R.L.; writing—review and editing, R.L.; visualization, B.S.; supervision, H.W.; project administration, H.W.; funding acquisition, H.W. All authors have read and agreed to the published version of the manuscript.

Funding

This research was funded by the National Science Foundation of China (grant number 11772225), the China Agriculture Research System of MOF and MARA: the Modern Agroindustry Technology Research System (grant number CARS-23-A-04), and the Tianjin 131 innovative team construction project (grant number 201923).

Institutional Review Board Statement

Not applicable.

Data Availability Statement

The data will be made available upon reasonable request from corresponding author.

Conflicts of Interest

The authors declare no conflict of interest.

References

  1. Favela-González, K.M.; Hernández-Almanza, A.Y.; De la Fuente-Salcido, N.M. The value of bioactive compounds of cruciferous vegetables (Brassica) as antimicrobials and antioxidants: A review. J. Food Biochem. 2020, 44, 21. [Google Scholar] [CrossRef]
  2. Francisco, M.; Tortosa, M.; Martínez-Ballesta, M.D.; Velasco, P.; García-Viguera, C.; Moreno, D.A. Nutritional and phytochemical value of Brassica crops from the agri-food perspective. Ann. Appl. Biol. 2017, 170, 273–285. [Google Scholar] [CrossRef]
  3. Lo Scalzo, R.; Bianchi, G.; Genna, A.; Summa, C. Antioxidant properties and lipidic profile as quality indexes of cauliflower (Brassica oleracea L. var. botrytis) in relation to harvest time. Food Chem. 2007, 100, 1019–1025. [Google Scholar] [CrossRef]
  4. Jia, G.F.; Zeng, L.R.; Zhao, S.; Ge, S.J.; Long, X.F.; Zhang, Y.P.; Hu, D.Y. Monitoring residue levels and dietary risk assessment of pymetrozine for Chinese consumption of cauliflower. Biomed. Chromatogr. 2019, 33, 8. [Google Scholar] [CrossRef]
  5. Zhang, G.Y.; Tuo, X.G.; Zhai, S.; Zhu, X.M.; Luo, L.; Zeng, X.L. Near-Infrared Spectral Characteristic Extraction and Qualitative Analysis Method for Complex Multi-Component Mixtures Based on TRPCA-SVM. Sensors 2022, 22, 1654. [Google Scholar] [CrossRef]
  6. Bian, H.Y.; Yao, H.; Lin, G.H.; Yu, Y.S.; Chen, R.Q.; Wang, X.Y.; Ji, R.D.; Yang, X.; Zhu, T.Z.; Ju, Y.F. Multiple Kinds of Pesticides Detection Based on Back-Propagation Neural Network Analysis of Fluorescence Spectra. IEEE Photonics J. 2020, 12, 10. [Google Scholar] [CrossRef]
  7. Alsammarraie, F.K.; Lin, M.S. Using Standing Gold Nanorod Arrays as Surface-Enhanced Raman Spectroscopy (SERS) Substrates for Detection of Carbaryl Residues in Fruit Juice and Milk. J. Agric. Food Chem. 2017, 65, 666–674. [Google Scholar] [CrossRef]
  8. Jamshidi, B.; Mohajerani, E.; Jamshidi, J. Developing a Vis/NIR spectroscopic system for fast and non-destructive pesticide residue monitoring in agricultural product. Measurement 2016, 89, 1–6. [Google Scholar] [CrossRef]
  9. González-Martín, M.I.; Revilla, I.; Vivar-Quintana, A.M.; Salcedo, E.V.B. Pesticide residues in propolis from Spain and Chile. An approach using near infrared spectroscopy. Talanta 2017, 165, 533–539. [Google Scholar] [CrossRef] [PubMed]
  10. Ye, W.X.; Yan, T.Y.; Zhang, C.; Duan, L.; Chen, W.; Song, H.; Zhang, Y.F.; Xu, W.; Gao, P. Detection of Pesticide Residue Level in Grape Using Hyperspectral Imaging with Machine Learning. Foods 2022, 11, 1609. [Google Scholar] [CrossRef] [PubMed]
  11. Sun, J.; Hu, Y.; Zou, Y.L.; Geng, J.P.; Wu, Y.L.; Fan, R.S.; Kang, Z.L. Identification of pesticide residues on black tea by fluorescence hyperspectral technology combined with machine learning. Food Sci. Technol. 2022, 42, 9. [Google Scholar] [CrossRef]
  12. Jiang, R.C.; Gu, M.S.; Zhao, Q.H.; Li, X.R.; Shen, J.X.; Su, Z.B. Identification of Pesticide Residue Types in Chinese Cabbage Based on Hyperspectral and Convolutional Neural Network. Spectrosc. Spectr. Anal. 2022, 42, 1385–1392. [Google Scholar] [CrossRef]
  13. Hu, Y.T.; Ma, B.X.; Wang, H.T.; Zhang, Y.J.; Li, Y.J.; Yu, G.W. Detecting different pesticide residues on Hami melon surface using hyperspectral imaging combined with 1D-CNN and information fusion. Front. Plant Sci. 2023, 14, 15. [Google Scholar] [CrossRef] [PubMed]
  14. Zhang, M.Y.; Xue, J.X.; Li, Y.D.; Yin, J.Y.; Liu, Y.; Wang, K.; Li, Z.Z. Non-destructive detection and recognition of pesticide residue levels on cauliflowers using visible/near-infrared spectroscopy combined with chemometrics. J. Food Sci. 2023, 88, 4327–4342. [Google Scholar] [CrossRef]
  15. Nazarloo, A.S.; Sharabiani, V.R.; Gilandeh, Y.A.; Taghinezhad, E.; Szymanek, M.; Sprawka, M. Feasibility of Using VIS/NIR Spectroscopy and Multivariate Analysis for Pesticide Residue Detection in Tomatoes. Processes 2021, 9, 196. [Google Scholar] [CrossRef]
  16. Liu, H.S.; Zhang, Z.W.; Yang, Y.P.; Chen, T.; Zhang, C.L. Identification terahertz spectra for the dyestuffs based on principal component analysis and Savitzky-Golay filter. Optik 2018, 172, 668–673. [Google Scholar] [CrossRef]
  17. Chu, Y.W.; Tang, S.S.; Ma, S.X.; Ma, Y.Y.; Ha, Z.Q.; Gu, Y.M.; Gu, L.B.; Lu, Y.F.; Zeng, X.Y. Accuracy and stability improvement for meat species identification using multiplicative scatter correction and laser-induced breakdown spectroscopy. Opt. Express 2018, 26, 10119–10127. [Google Scholar] [CrossRef]
  18. Guo, Z.M.; Wang, M.M.; Barimah, A.O.; Chen, Q.S.; Li, H.H.; Shi, J.Y.; El-Seedi, H.R.; Zou, X.B. Label-free surface enhanced Raman scattering spectroscopy for discrimination and detection of dominant apple spoilage fungus. Int. J. Food Microbiol. 2021, 338, 9. [Google Scholar] [CrossRef]
  19. Su, W.H.; Sun, D.W.; He, J.G.; Zhang, L.B. Variation analysis in spectral indices of volatile chlorpyrifos and non-volatile imidacloprid in jujube (Ziziphus jujuba Mill.) using near-infrared hyperspectral imaging (NIR-HSI) and gas chromatograph-mass spectrometry (GC-MS). Comput. Electron. Agric. 2017, 139, 41–55. [Google Scholar] [CrossRef]
  20. Kumar, K. Competitive adaptive reweighted sampling assisted partial least square analysis of excitation-emission matrix fluorescence spectroscopic data sets of certain polycyclic aromatic hydrocarbons. Spectrochim. Acta Part A-Mol. Biomol. Spectrosc. 2021, 244, 8. [Google Scholar] [CrossRef]
  21. Li, H.D.; Liang, Y.Z.; Xu, Q.S.; Cao, D.S. Key wavelengths screening using competitive adaptive reweighted sampling method for multivariate calibration. Anal. Chim. Acta 2009, 648, 77–84. [Google Scholar] [CrossRef] [PubMed]
  22. He, J.; Zhang, C.; Zhou, L.; He, Y. Simultaneous determination of five micro-components in Chrysanthemum morifolium (Hangbaiju) using near-infrared hyperspectral imaging coupled with deep learning with wavelength selection. Infrared Phys. Technol. 2021, 116, 8. [Google Scholar] [CrossRef]
  23. Liu, W.J.; Liu, J.; Jiang, J.M.; Li, Y.J. Comparison of partial least squares-discriminant analysis, support vector machines and deep neural networks for spectrometric classification of seed vigour in a broad range of tree species. J. Near Infrared Spectrosc. 2021, 29, 33–41. [Google Scholar] [CrossRef]
  24. Galvao, R.K.H.; Araujo, M.C.U.; José, G.E.; Pontes, M.J.C.; Silva, E.C.; Saldanha, T.C.B. A method for calibration and validation subset partitioning. Talanta 2005, 67, 736–740. [Google Scholar] [CrossRef] [PubMed]
  25. Huang, Z.; Turner, B.J.; Dury, S.J.; Wallis, I.R.; Foley, W.J. Estimating foliage nitrogen concentration from HYMAP data using continuum removal analysis. Remote Sens. Environ. 2004, 93, 18–29. [Google Scholar] [CrossRef]
  26. Kanu, A.B. Recent developments in sample preparation techniques combined with high-performance liquid chromatography: A critical review. J. Chromatogr. A 2021, 1654, 21. [Google Scholar] [CrossRef] [PubMed]
  27. Zhu, F.L.; Zhang, D.R.; He, Y.; Liu, F.; Sun, D.W. Application of Visible and Near Infrared Hyperspectral Imaging to Differentiate Between Fresh and Frozen-Thawed Fish Fillets. Food Bioprocess Technol. 2013, 6, 2931–2937. [Google Scholar] [CrossRef]
  28. Saber, A.N.; Malhat, F.M.; Badawy, H.M.A.; Barakat, D.A. Dissipation dynamic, residue distribution and processing factor of hexythiazox in strawberry fruits under open field condition. Food Chem. 2016, 196, 1108–1116. [Google Scholar] [CrossRef]
  29. Heshmati, A.; Nili-Ahmadabadi, A.; Rahimi, A.; Vahidinia, A.; Taheri, M. Dissipation behavior and risk assessment of fungicide and insecticide residues in grape under open-field, storage and washing conditions. J. Clean. Prod. 2020, 270, 11. [Google Scholar] [CrossRef]
  30. Wang, X.Z.; Liu, J.H.; Chi, W.J.; Wang, W.G.; Ni, Y. Advances in Hyperspectral Image Classification Methods with Small Samples: A Review. Remote Sens. 2023, 15, 3795. [Google Scholar] [CrossRef]
  31. Tette, P.A.S.; Guidi, L.R.; Glória, M.B.D.; Fernandes, C. Pesticides in honey: A review on chromatographic analytical methods. Talanta 2016, 149, 124–141. [Google Scholar] [CrossRef] [PubMed]
Figure 1. An overview of all experimental processes (S-G: Savitzky–Golay convolution smoothing, SNV: standard normal variate, MSC: multivariate scattering correction, CARS: competitive adaptive reweighted sampling algorithm, PLS: partial least squares).
Agriculture 13 02254 g001
Figure 2. Imspector N17 hyperspectral data acquisition equipment.
Agriculture 13 02254 g002
Figure 3. Raw and preprocessed spectra of all the samples at 950–1650 nm. (A) Raw spectra, (B) S-G, (C) SNV, (D) MSC.
Agriculture 13 02254 g003
Figure 4. Characteristic wavelength extraction of samples containing indoxacarb pesticides.
Agriculture 13 02254 g004
Figure 5. Sample discriminant results collected on different days. (a) All days, (b) Day 1, (c) Day 3, (d) Day 5, (e) Day 7, (f) Day 9.
Agriculture 13 02254 g005
Figure 6. Comparison of pesticide residue rates on cauliflower using hyperspectral technology and chromatography.
Agriculture 13 02254 g006
Figure 7. Fitting results of pesticide residue rate on cauliflower using hyperspectral technology and chromatography. (a) Fitting curve of pesticide residues from hyperspectral detection, (b) fitting curve of actual pesticide residues from chromatographic detection.
Agriculture 13 02254 g007
Table 1. Pesticide residue discrimination accuracy after various pretreatment algorithms.
Pretreatment AlgorithmDetection Rate of Pesticide SamplesModel Test Accuracy
R2RMSE
None800.92470.4113
S-G850.96780.2691
MSC850.96730.2710
SNV900.96880.2648
Table 2. Pesticide residues of indoxacarb in cauliflower over time.
Time (Day)Emamectin Benzoate (mg/kg)Indoxacarb (mg/kg)
02.7014.79
11.249.00
31.369.00
50.747.66
70.386.95
90.306.24
Table 3. The dissipation equation for indoxacarb pesticide detection using hyperspectral imaging technology and chromatography.
Hyperspectral Imaging TechnologyChromatography
Dissipation equationCt = 86.753 × 10−0.12271tCt = 14.105 × 10−0.12595t
Half-life t1/25.64 d5.5 d
R20.821180.93315
Disclaimer/Publisher’s Note: The statements, opinions and data contained in all publications are solely those of the individual author(s) and contributor(s) and not of MDPI and/or the editor(s). MDPI and/or the editor(s) disclaim responsibility for any injury to people or property resulting from any ideas, methods, instructions or products referred to in the content.

