Abstract
The evaluation of A. cepa biodiversity provides onion breeders with great prospects to obtain plants with high resistance to environmental factors, remarkable yield, and product quality. Genetic diversity assessment of a collection of nine short- and long-day onion landraces and varieties originated from different Iranian regions, using ISSR markers and UPGMA dendrograms, was carried out for the first time. Short-day landraces (Sarze, Sarkoreh, and Kerman) originated from low latitude and short-day hybrids (Mirela and Soberana) demonstrated high genetic similarity, in terms of physiological responses to day length and temperature during the crop cycle and bulbing stage initiation. Contrarily, high latitude landraces (Azarshahr, White Gorgan, Kurdistan, and Esfahan) showed low biometrical, agronomic and genetic similarity with commercial short-day onions. Specific differences in morphological reactions between these two groups displayed diverse responses of plants to day length and temperature. Long- and short-day cultivars displayed significant differences in the dynamics of leaf and scale number, leaf and root length, dry and fresh weight, and bulbing ratio and bulb diameter, which were in accordance with ISSR data. The local landraces Azarshahr, Kurdistan, and Esfahan had high antioxidant status, suggesting high prospects for their utilization as an alternative to foreign F1 hybrid varieties.
1. Introduction
Onion (Allium cepa L.) is the most widely grown vegetable in the world after tomatoes. This species is characterized by the chromosome number 2n = 16 and a large genome size of ~15,290 Mbps/1C [1]. According to Vavilov [2], Southwest Asia is the primary center of domestication and variability of onion, whose bulb and inflorescence development is adapted to the temperatures and photoperiods prevailing in regions of origin. A huge range of cultivars and landraces have been developed over the centuries, adapted to different climate conditions worldwide [3]. Germplasm identification is an unavoidable requirement for its utilization, especially since modern varieties sold by international seed companies, particularly F1 hybrids, have a narrow genetic base and the old varieties are being replaced by them, even though they contain valuable adaptive genes which are in danger of being lost [4]. This fact reveals the importance of the identification, collection, preservation, and regeneration of these old varieties and landraces [5,6]. As the bulbing phase in A. cepa cultivars occurs in response to daylength and temperature, onion cultivars react differently and, therefore, are categorized as long-day, short-day, or day-neutral. Long-day onions initiate bulb production when the day length reaches 14–16 h; short-day cultivars at 12–14 h, being suitable for the tropics; and day-neutral genotypes are suitable for higher latitudes [7]. Day neutral varieties can grow at all latitudes and are usually planted in spring and late summer [8], whereas short-day onion harvesting is different from long-day cultivars at higher latitudes. In the USA, i.e., Texas, Georgia, and New Mexico, short-day onions are planted in autumn and harvested in late spring or early summer, when plants show about 50–80% leaf collapse and air temperatures often exceed 38 °C [9,10]. In Iran, onion is grown from North to South and Northwest, differing in terms of bulb production and flowering in response to local day length and temperature. Some of the traditional onion landraces showing high quality are still grown in some regions of Iran, but other local landraces have already disappeared or are grown at a small extent [11].
Over time, lacking wild relatives has caused a poor representation of genetic resource collections [12], thus hindering the asexual or seed maintenance of A. cepa germplasm. So, there is the basic need for a deeper understanding of the available genetic resources to better maintain and exploit the landraces [13]. An ISSR marker is a semi-random marker that has primers with repetitive nucleotides such as GT, AC, and AG. The ISSR technique does not require prior knowledge of the genome sequence and creates multiple polymorphic patterns. Ourang et al. [14] reported that ISSR markers can be effectively used to study the genetic diversity of melon and cantaloupe biomasses, and among the primers used, the most suitable primer for subsequent studies (AC) i.e., 8 G, was identified. Commercial onion varieties are short-day varieties providing higher yield than local varieties and are suitable for the tropics as they originated from low latitude. South regions of Iran have a tropical climate and the local varieties grown in these areas for several years have adapted to their climatic conditions.
The objective of this study was to assess the effects of day length on the vegetative parameters of nine onion varieties to explore the genetic similarities between commercial short-day onions and local accessions, using ISSR markers to cluster the cultivars, and to evaluate the implications of these study findings for future breeding and gene bank management programs related to onion germplasm collection and preservation.
2. Materials and Methods
2.1. Growing Conditions and Experimental Design
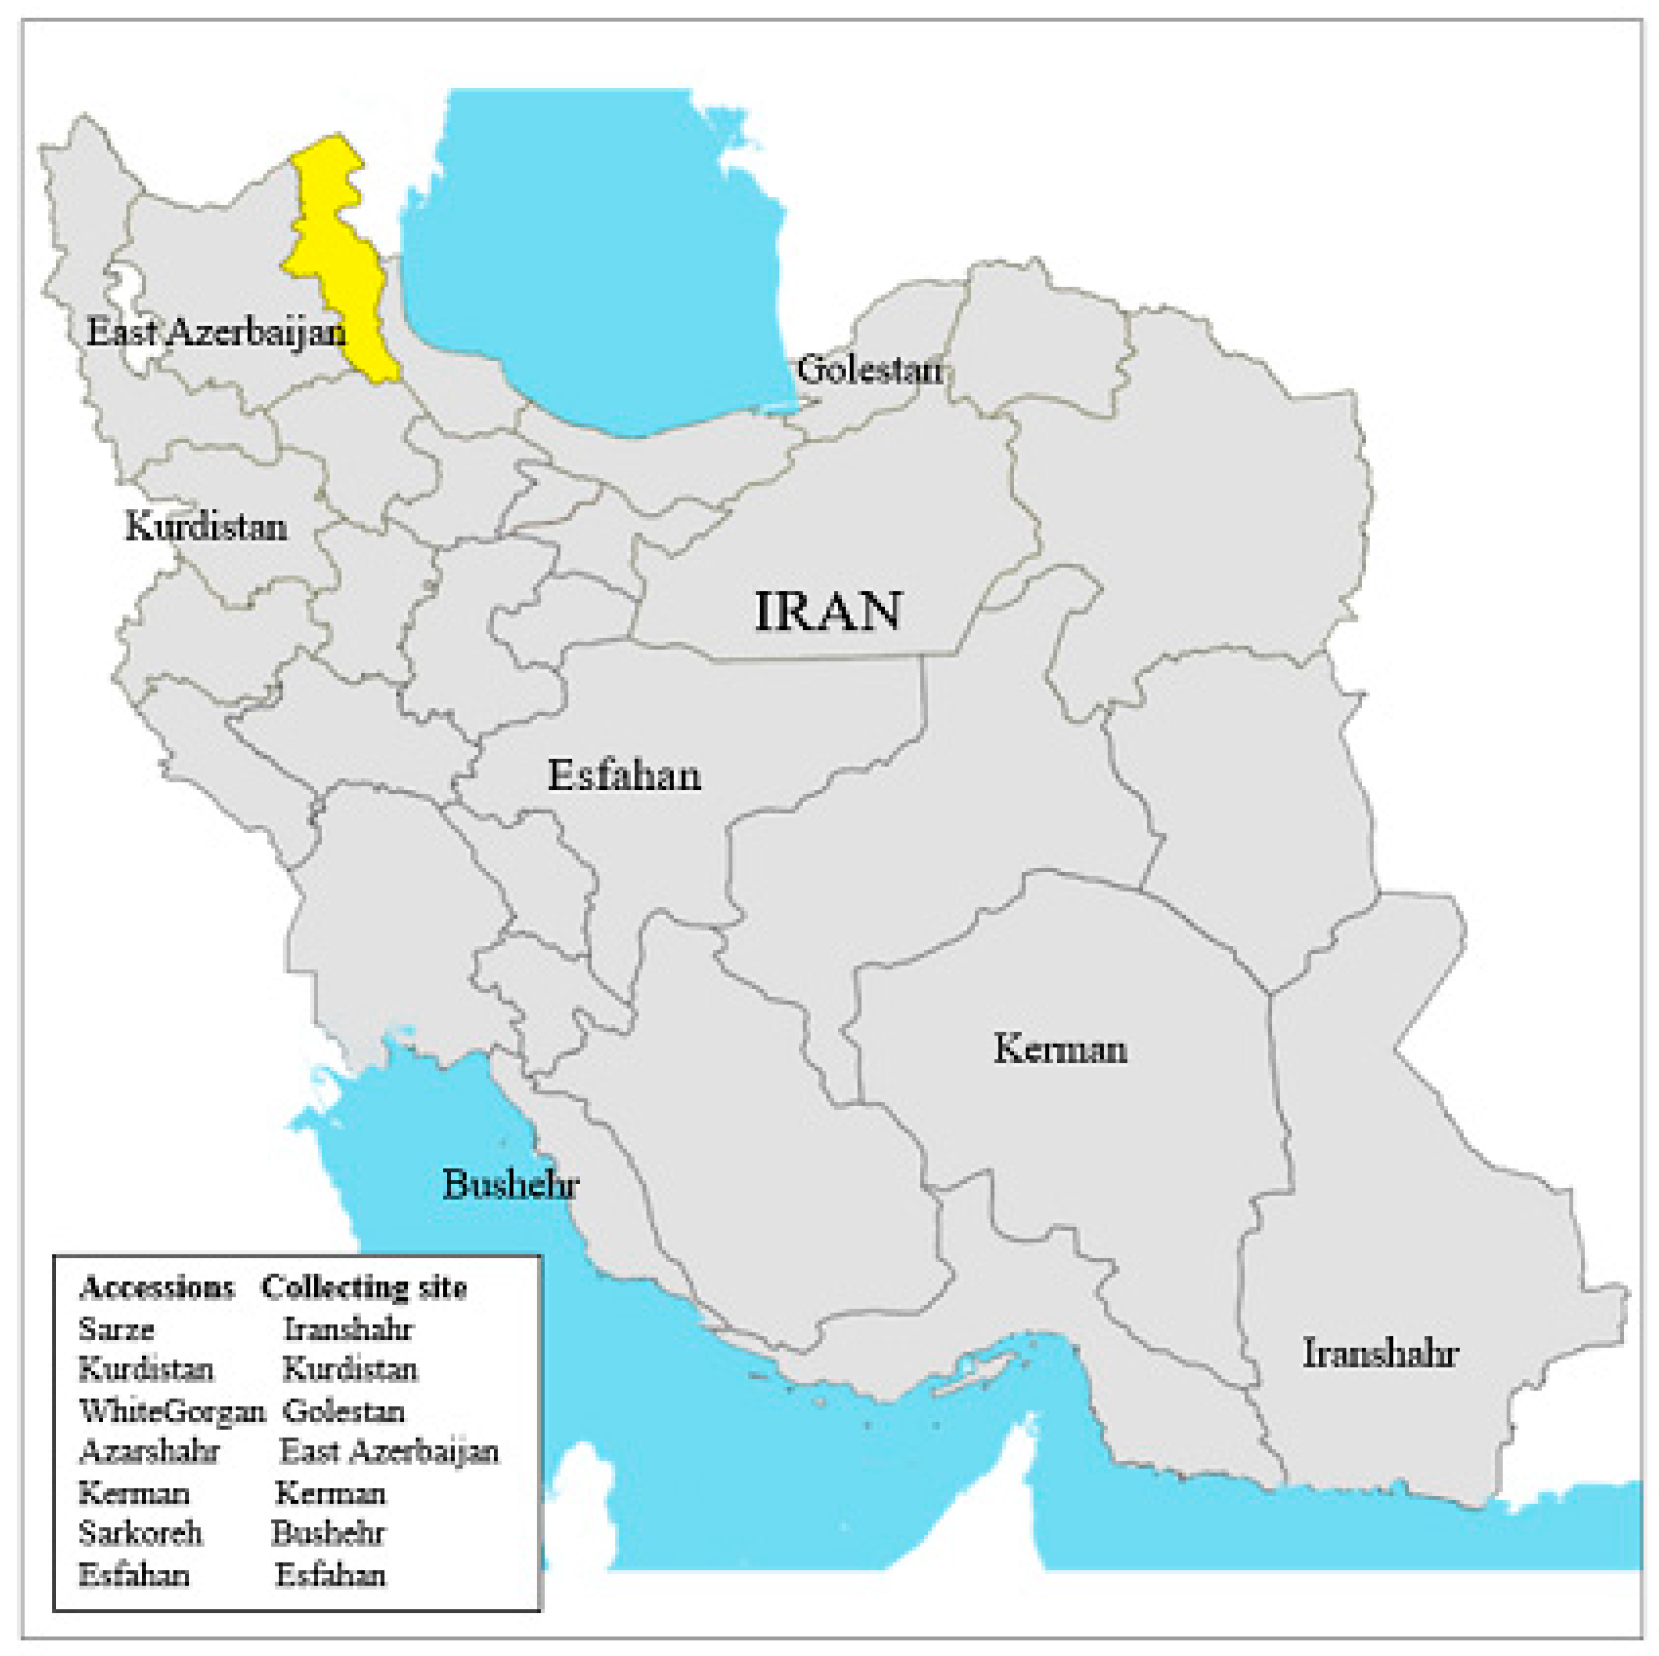
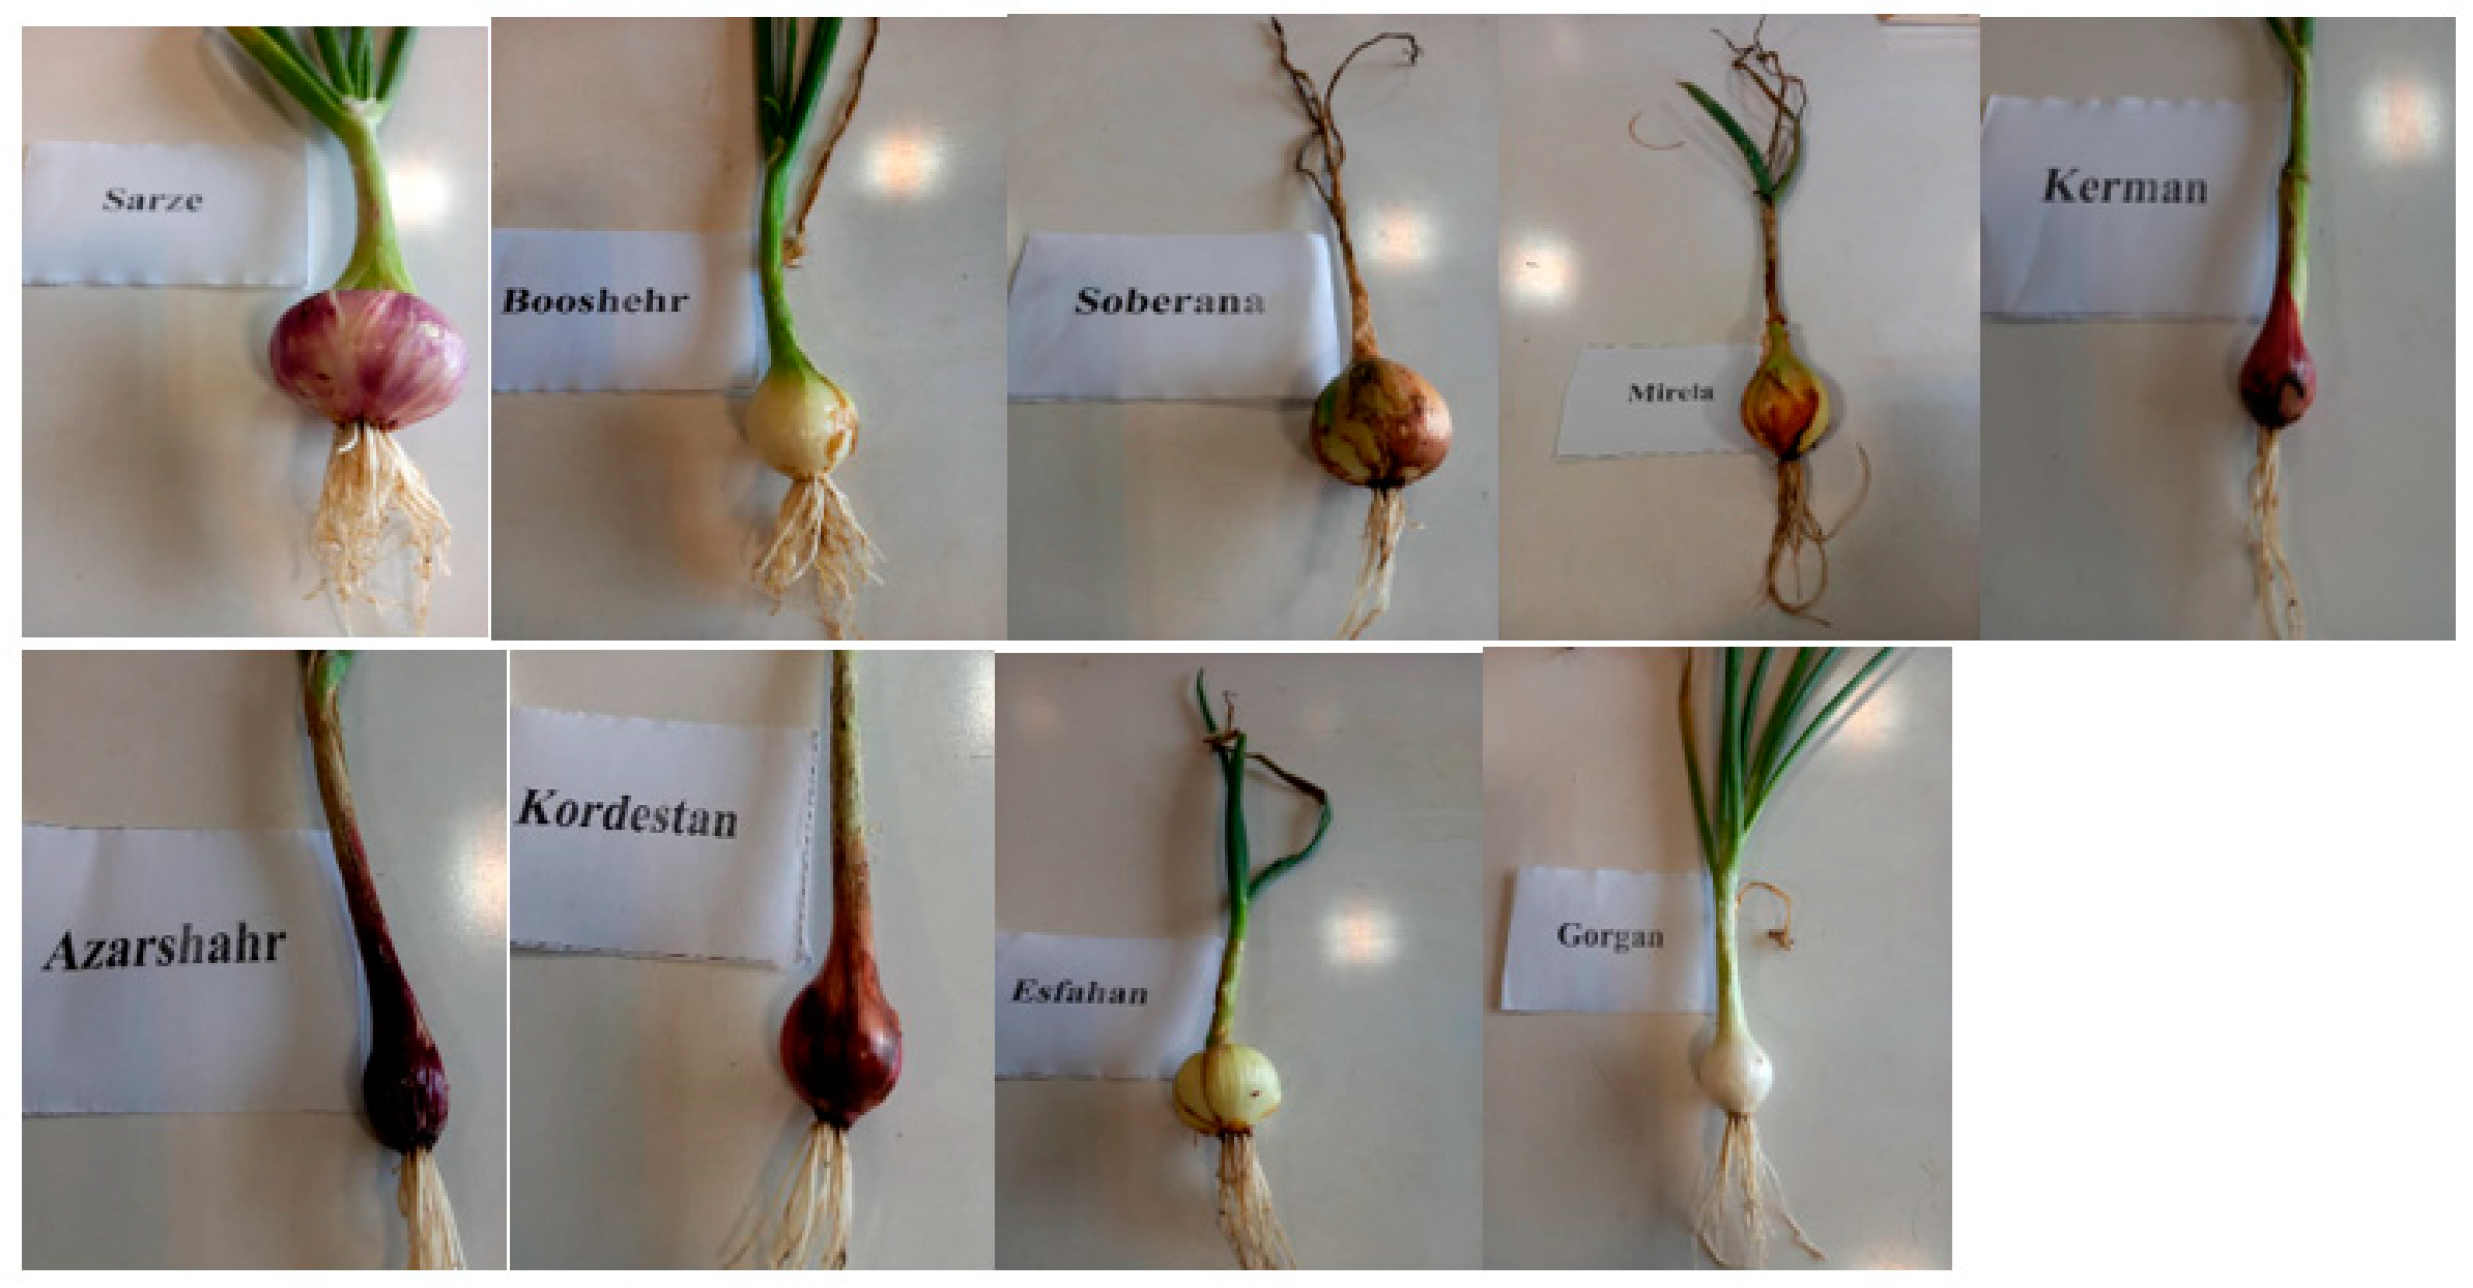
Research was carried out to assess seven Iranian onion (A. cepa L.) landraces: three short-day (Sarze, Sarkoreh, Kerman), four long-day (Esfahan, Azarshahrr, White gorgane, Kurdistan), and two short-day hybrids (Mirela, Soberana), as described in Table 1, using a randomized complete block design for their distribution in the field with 3 replications (Figure 1 and Figure 2).

Table 1.
List of onion cultivars, place of origin, and main characteristics.
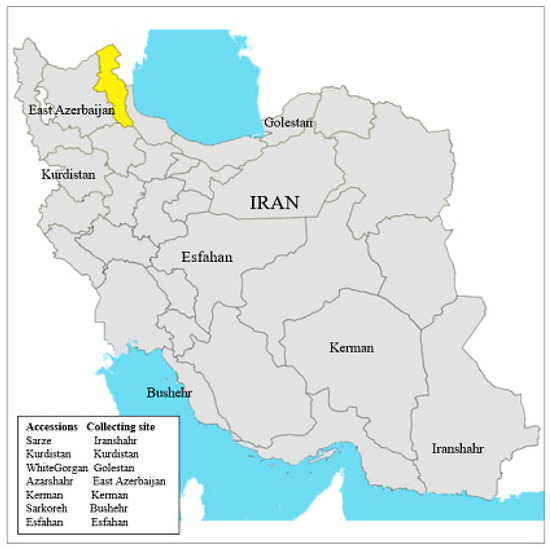
Figure 1.
Collecting sites of Allium cepa L. accessions in Iran.
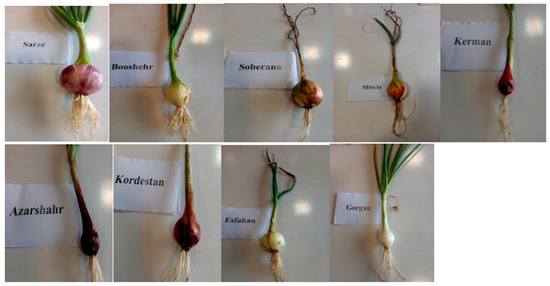
Figure 2.
Onion varieties at third sampling date (day length 14.3 h and GDD 1176 °C).
The experiment was conducted in 2019 and 2020, from April to July, at the Research Farm of Gorgan University of Agricultural Science and Natural Resources (Iran) (54°29′ N, 36°80′ E, 76 m above sea level) in a silty-clay soil composed of 58% silt, 36% clay, and 6% sand, with an electrical conductivity of 0.7 mS·cm−1 and pH 7.6.
On 10 October, onion seeds were sown in 2.5 × 2.5 m plots, with 10 cm spacing along the rows which were 50 cm apart. Irrigation was practiced once a week from the sowing to bulbing stage and then, just once a month. At the stage of three leaves, plants were fertilized with urea (10 g per plot). During the crops, weeds were manually controlled. The seeds germinated 30 days after sowing on average and vegetative parameter measurement began four months later at 30-day intervals (1 January, 1 March, 30 April, 31 May, and 1 July) on 3 randomly selected plants per plot. Cumulative temperature and day length from plant emergence to harvest at each sowing date were calculated using the basal temperature (Tb), 5 °C for onion, at which onion begins to grow. The growing degree days (GDD) (cumulative degree temperature) was estimated according to Lancaster et al. [15]:
GDD = (Tmax + Tmin)/2 − Tb
Day duration and GDD values in 2019–2020 are presented in Table 2.

Table 2.
Values of Day duration and Cumulative degree temperature, i.e., Growing Degree Days (GDD) in 2019–2020.
2.2. Biometrical and Agronomic Parameters
2.2.1. Bulb Dimensions
Bulb and neck diameter (in mm) and leaf and root length (in cm) were measured using a 20 cm digital caliber model (Guanglu HB-102-I HB-102-111; China).
Bulbing ratio was assessed as the ratio of bulb and neck diameter. Values greater than 2 reflected plants turning out into the bulbing stage [16].
2.2.2. Total Fresh and Dry Weight
Total fresh weight was estimated using 3 randomly selected plants in each experimental plot after removing soil particles and washing, and was expressed in g.
Dry weight of the whole plant was assessed via sequential 3 days of storage at 25 °C and drying the samples in an oven at 75 °C for 72 h [17].
2.2.3. Leaf and Scale Number
The number of leaves of 3 randomly selected plants in each plot was calculated.
In order to measure the scale number of bulbs, the bulb was cut horizontally in the middle and then, the number of scales was counted from the outside to the inside of the bulb.
2.3. Chlorophyll Index
The chlorophyll index of 3 leaves per plant of 3 plants per plot was assessed using a portable chlorophyll meter (SPD 502; Japan).
2.4. Genomic DNA Isolation and ISSR Analysis
The total genomic DNA was extracted from 40-day old leaves grown in plots following a CTAB method [18] with minor modifications. The quality and concentration of genomic DNAs was evaluated using a NanoDrop 18 V DC, 50 VA spectrophotometer (Implen, GmbH, Munich, Germany). The final DNA concentrations were adjusted to 10 ng μL−1 with an MTE Buffer (10 mM Tris–HCl, pH 8.0; 1 mM 103 EDTA) for PCR amplifications and stored at −20 °C until used. For ISSR analysis, a set of 8 ISSR primers was used. ISSR primers were selected for their higher polymorphism, according to the studies quoted above. ISSR amplifications were achieved using PCR. The isolated and quantified total genomic DNA were amplified with 10 ISSR primers. The amplifications were individually performed for each ISSR primer. The reaction volume was composed of 20 μL of 10 × 109 PCR buffers (Tris pH 9.0, 10 mM KCl 50 mM, MgCl2 1.5 mM, dNTPs 5 mM, 0.2 U (Taq DNA polymerase), 30 ng DNA, and final make up to ddH2O. For ISSR amplifications, 5 mM ISSR primers were added to the above reaction mixture. Polymerase chain reactions of ISSR primer were performed in Thermocycler (Peqlab, UK), with initial denaturation at 94 °C for 2 min and 30 s; 40 cycles of denaturation at 94 °C for 1 min; primer annealing at 48 °C for 1 min followed by extension at 72 °C for 2 min and final extension at 72 °C for 6–8 min. The amplified products were separated by vertical gel electrophoresis (91300 Massay, France) with polyacrylamide gel (1.5%) in an 1x TBE buffer. The amount of optical absorption of DNA samples was read at wavelengths of 260 and 280 nm using a spectrophotometer and the results showed that the DNA concentrations in DNA samples of different onion varieties was measured at 1.6–1.7, which shows the purity of DNA.
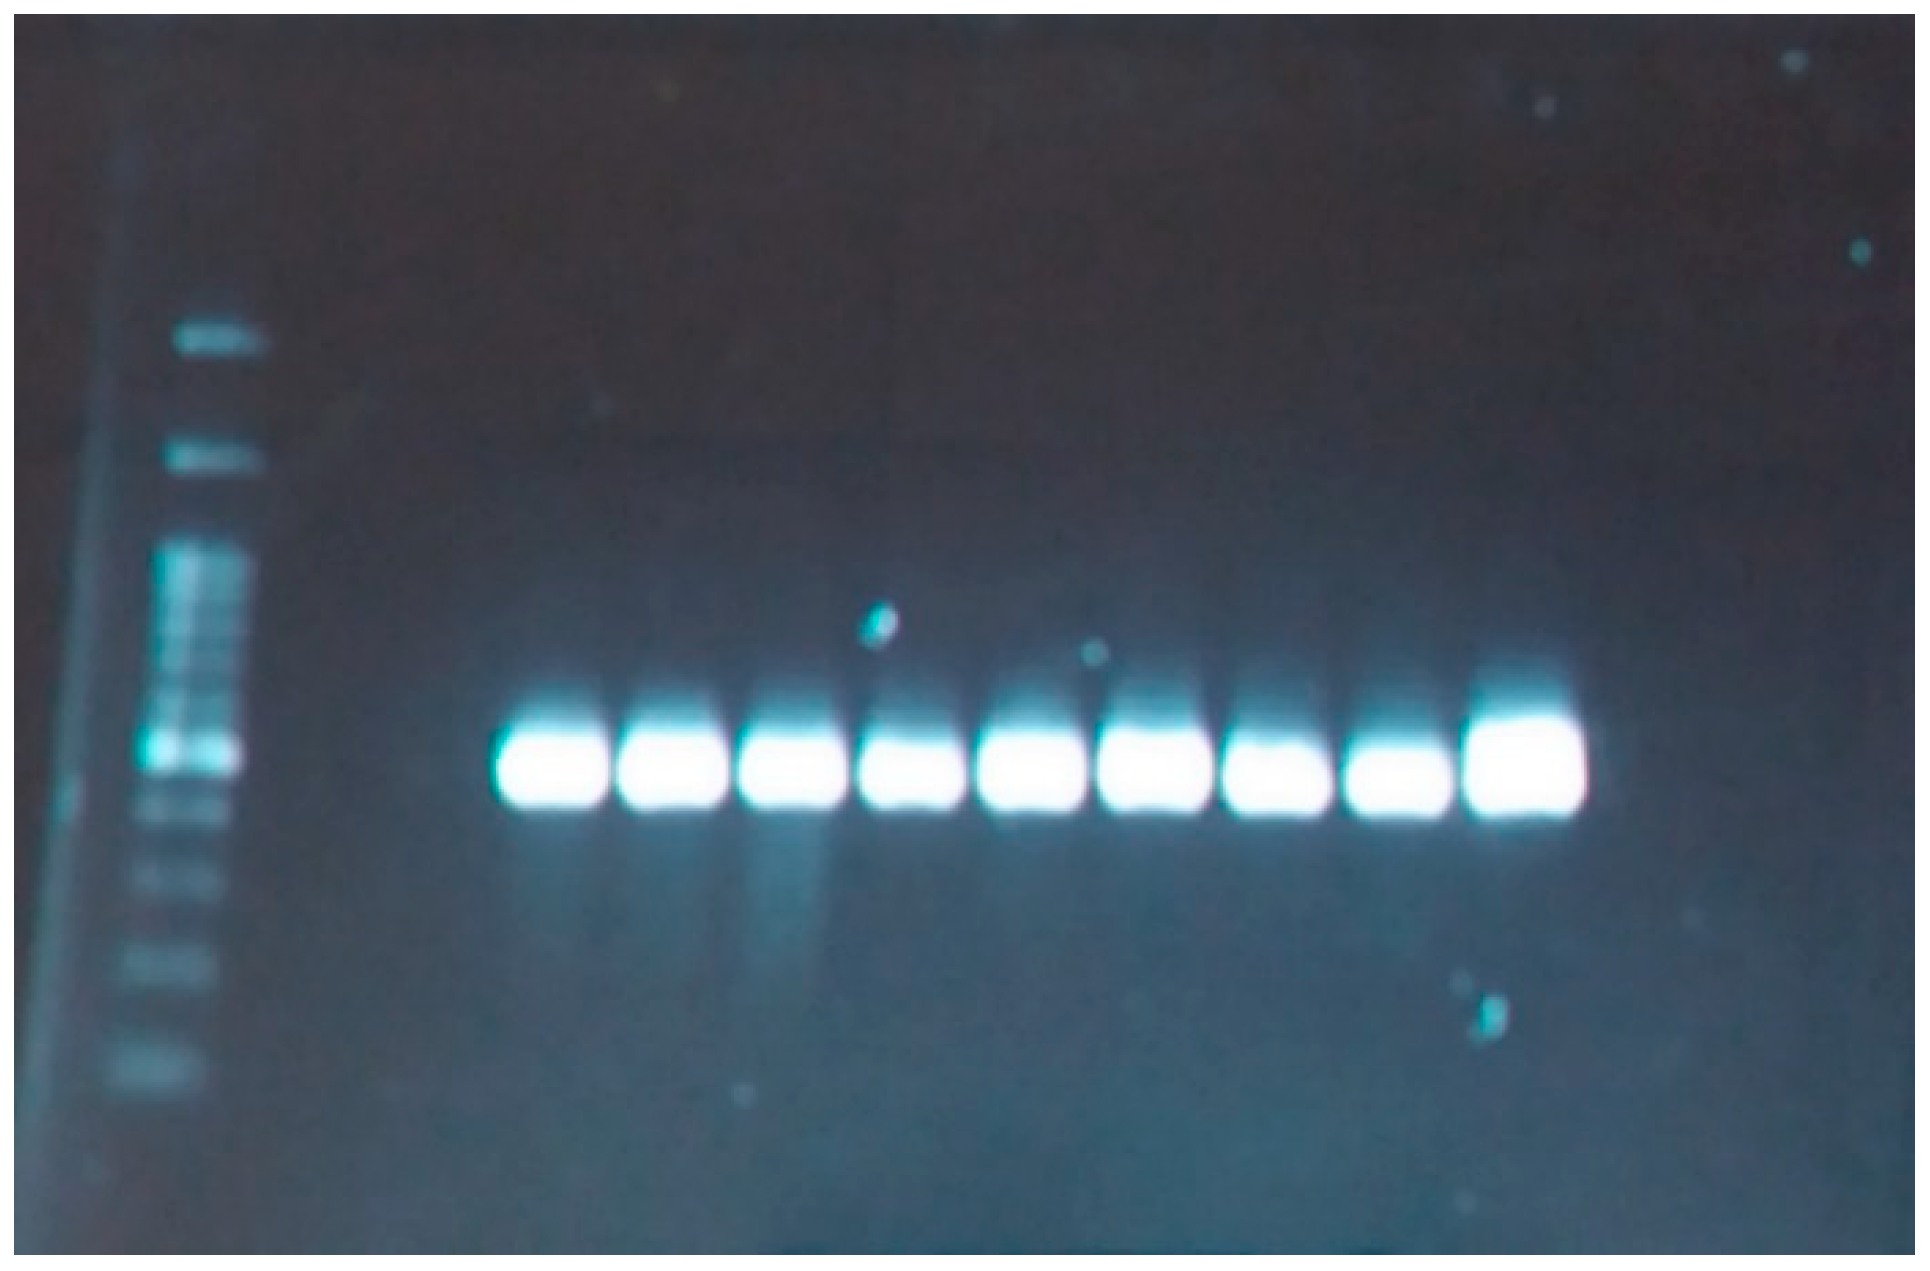
OD260/OD280 = 1.7, 1.6. The results of DNA quality testing using a 254 nm wavelength Gel doc system photographing and recording the image of agarose gel and the bands that appear are shown in Figure 3. After comparing the DNA samples with the control sample (Lambda bacteriophage DNA cutting with two restriction enzymes), the concentration of the DNA samples was determined.
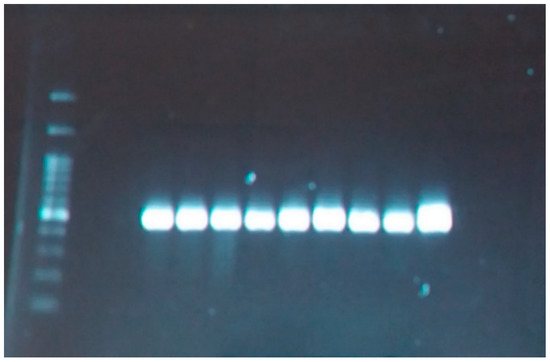
Figure 3.
DNA quality using electrophoresis gel Agarose and vision with Gel documentation.
2.5. Phytochemical Analysis
Three randomly selected plants in each plot were sampled to measure bulb phytochemical content.
2.5.1. Total Polyphenols
Total polyphenol content was assessed according to colorimetric Folin-Ciocalteu method [19]. Briefly, 0.2 g of samples were incubated at room temperature (25 °C) for 24 h with 2.5 mL of 80% (v/v) methanol (containing 0.5% v/v HCl). Ten μL of the extracts obtained after centrifugation (1600× g at 4 °C; 10 min) were mixed with 60 μL of distilled water and 15 μL of 2-fold diluted Folin-Ciocalteu reagent (Sigma-Aldrich Co., Steineheim, Germany) in a microtiter plate. The resulting samples were incubated at 37 °C for 5 min and further mixed with 2 mL of saturated Na2CO3 solution. The volume was brought to 10 mL with distilled water. Two hours later, the solutions were analyzed through spectrophotometers (Unico 2800 UV/VIS, Princeton, NJ, USA) and the concentration of polyphenols was calculated according to the absorption of the reaction mixture at 760 nm. As an external standard, 0.02% gallic acid (Merck) was used. The results were expressed as mg of gallic acid equivalent per g of fresh weight (mg GAE g−1 f.w.).
2.5.2. Total Flavonoids
The total flavonoid content of Allium cepa bulb extract was estimated using the aluminum chloride colorimetric method [20]. Briefly, methanolic onion bulb extracts, produced as described in Section 2.5.1, were separately added to methanol (1 mg/mL) and the reaction mixture (0.5 mL) was dissolved with 1.5 mL of 95% ethanol, 2.8 mL of distilled water, 0.1 mL of 1 M potassium acetate, and 0.1 mL of 10% aluminum chloride. Then, the solution was incubated at 25 °C for 30 min and the absorbance was read at 415 nm. As an external standard, 0.02% quercetin solution (HPLC grade; Merck) was used. The results were expressed as mg of quercetin equivalent per g of fresh weight (mg QE g−1 f.w.).
2.5.3. Anthocyanines
Anthocyanin content was spectrophotometrically assessed at 520 nm using two buffers with pH 3.5 and 1.0 [21]. The results were expressed in µM g−1 f.w.
2.5.4. DPPD Assay
To measure antioxidant capacity, fresh tissue (0.02 g) was completely abraded in a porcelain mortar with 2.5 mL acidic methanol and centrifuged at 1600× g, 4 °C for 10 min.
The evaluation of free radical scavenging activity was performed in 0.2 mL methanol extracts by 2,2-Diphenyl-1-picrylhydrazyl DPPH assay [22]. The extract was mixed with 2 mL of DPPH (Sigma-Aldrich) methanol solution (0.004%) and left at room temperature for 30 min. Light absorption at 520 nm of the resulting solution was assessed using a spectrophotometer (Unico 2800UV/VIS, Princeton, NJ, USA).
Efficient concentration (IC50), a parameter used to measure antioxidant activity, represents the amount of antioxidant necessary to decrease the initial DPPH concentration by 50%. The IC50 was expressed in terms of concentration of sample extract used for the test (mg∙mL−1), from the lower level of IC50 to the higher level of antioxidant activity. Antioxidant activity was expressed against a calibration curve of Trolox standard solutions (10–600 µM), performed following the same procedure as the extracted sample. Determinations were achieved in triplicate.
2.6. Data Analysis
Reproducible amplicons obtained after PCR amplification were recorded in electrophoresis images using scoring bands ‘1’ as presence or ‘0’ as absence of bands. The Polymorphic Information Content (PIC) was calculated by the following formula: PIC = 2f (1 − f), where frequency of polymorphic bands occurs with different primers. Pairwise similarity matrices were created by Jaccard’s coefficient of similarity tool, calculated as per model suggested by Nei and Li [23], and dendrogram was constructed by using UPGMA, and NTSYS-pc 2.02 software [24] in order to reveal the phenotypic representations of genetic relationships with similarity coefficients.
2.7. Statistical Analysis
All biometrical and biochemical data were subjected to analysis of variance through SAS software (ver. 9.1, SAS Institute, Cary, NC, USA). Means were separated using the least significant difference test.
3. Results and Discussion
3.1. Morphological Screening
The main four phenological stages of onion development according to the expanded BBCH scale include: from sowing to germination; from the third to the ninth visible leaf; leaf bases begin to thicken or extend (bulbing stage); flowering [25]. The varieties used in this study differed from a phenological point of view. The morphological characteristics of A. cepa bulbs at harvest (Table 3) indicated significant differences between long- and short-day cultivars regarding most of the studied parameters with the highest coefficient of variation recorded for leaf number (32.0%) and bulbing ratio (23.4%).

Table 3.
Average values of biometrical and agronomic parameters of A. cepa plant and bulb at harvest.
The evaluation of biometrical and agronomic parameters related to A. cepa growth dynamics revealed that the interaction between cultivar and sampling time significantly affected leaf number, bulb diameter, total dry weight, and scale number (p < 0.01) (Table 4).

Table 4.
Results of analysis of variance relevant to the main effects of sowing date, cultivar and sampling time, and their interactions, on biometrical, agronomic and physiological parameters of A. cepa.
3.1.1. Plant Fresh and Dry Weight
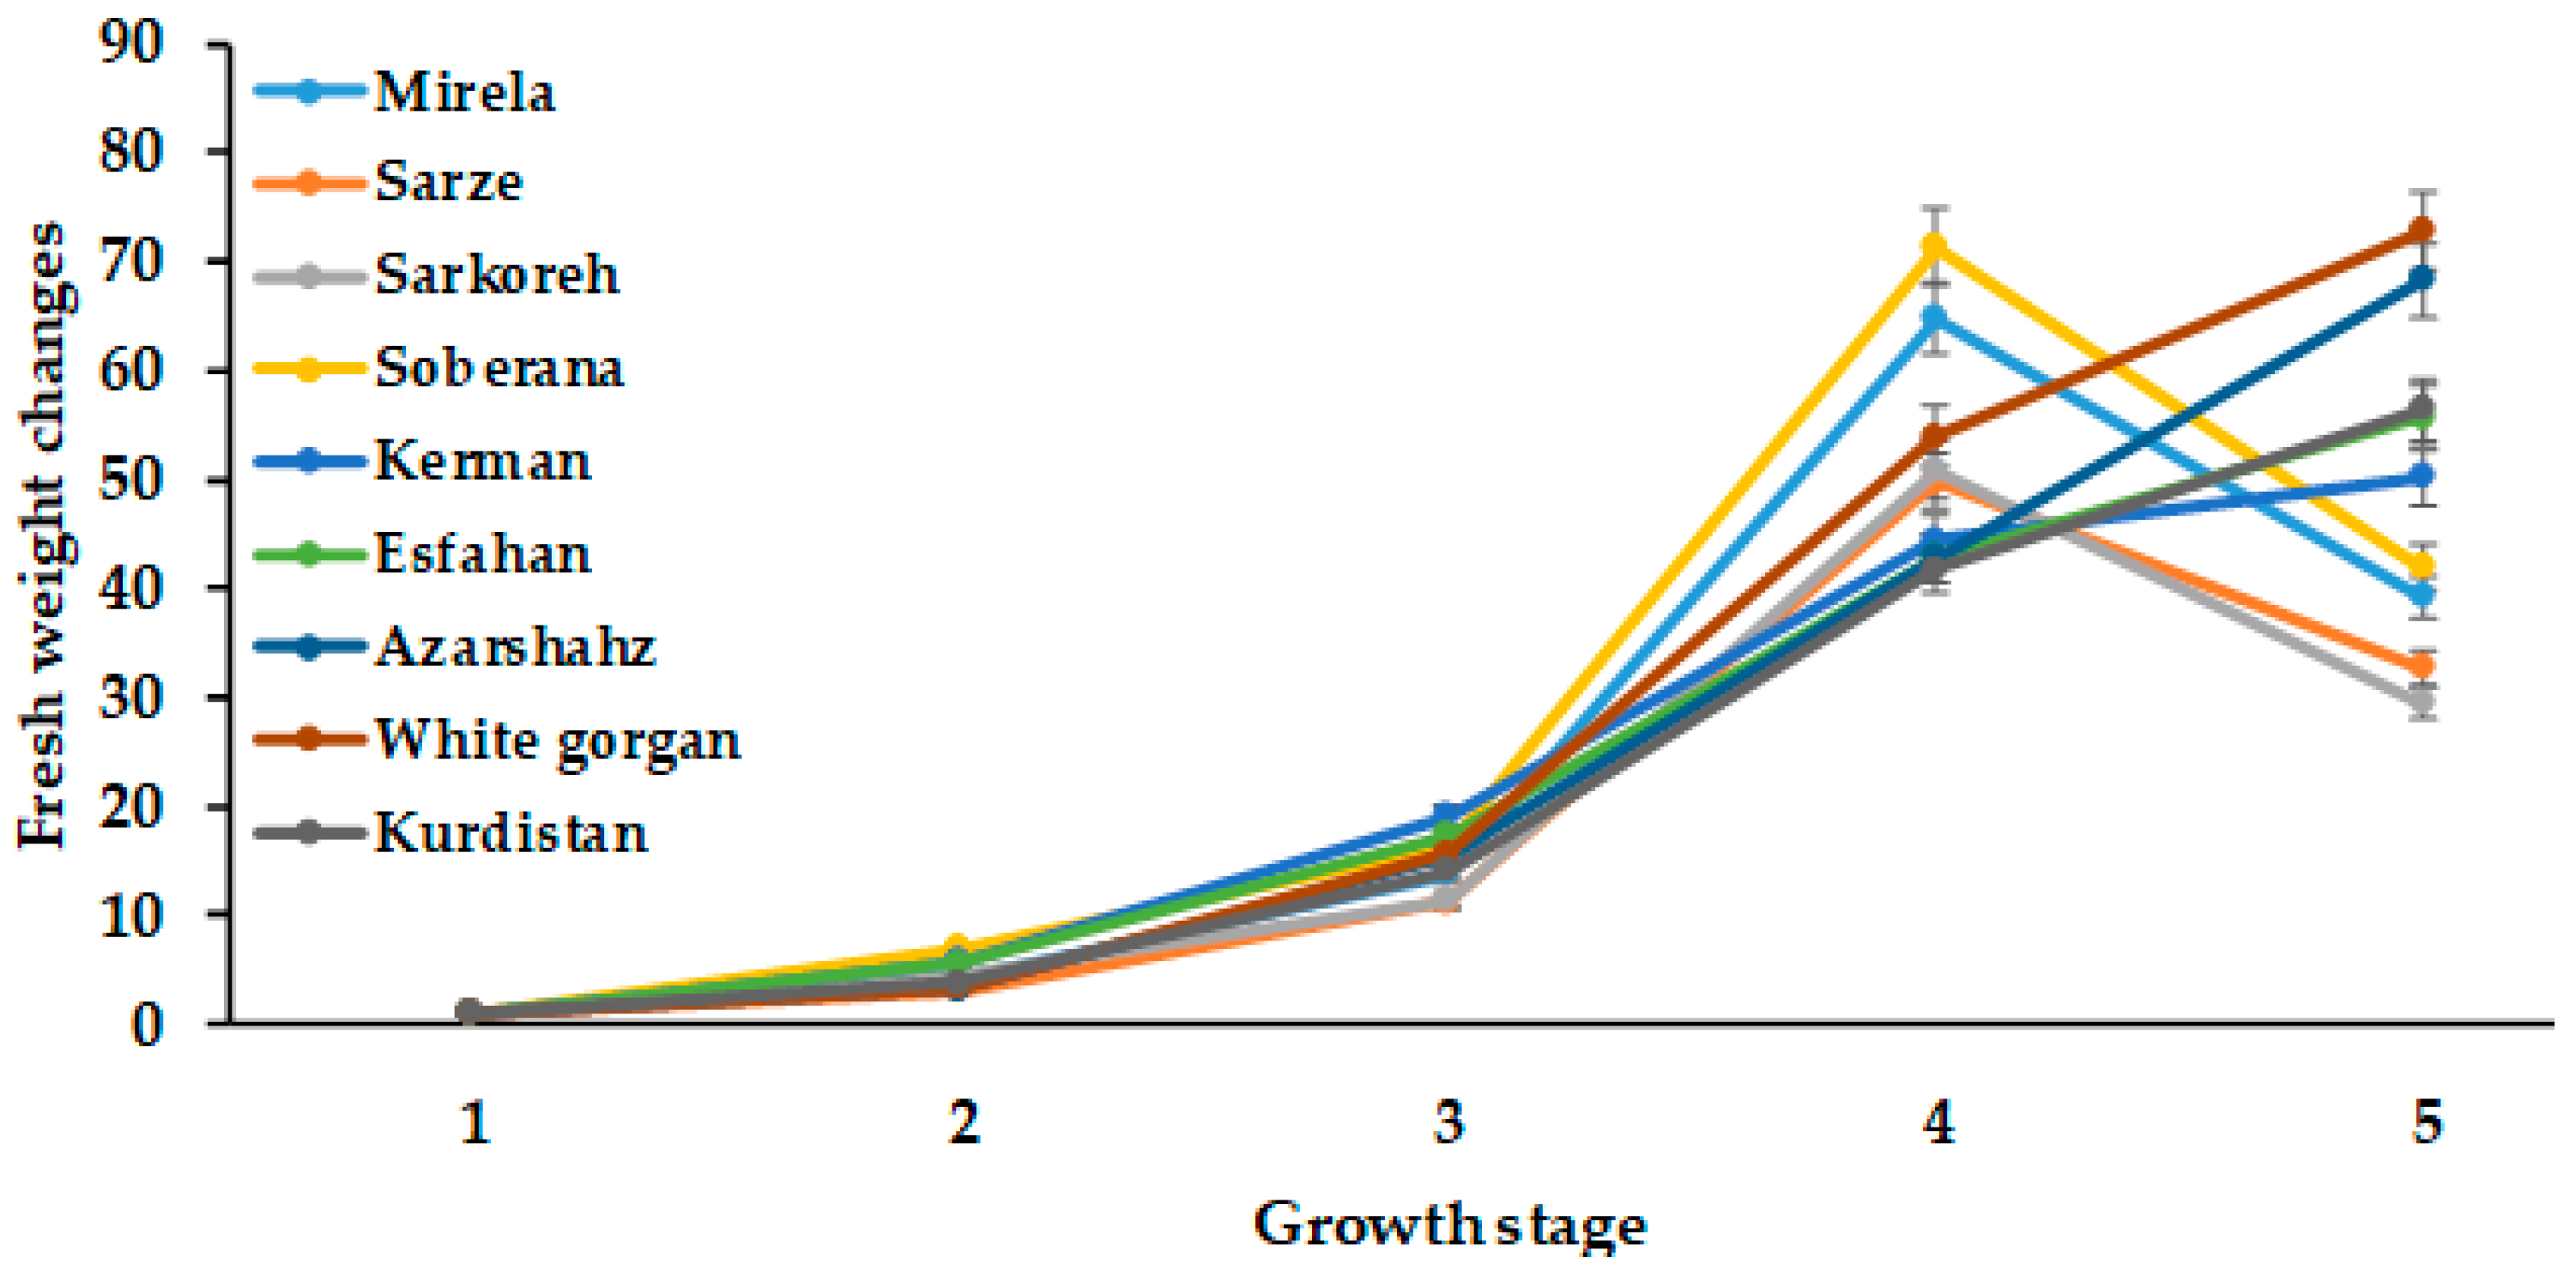
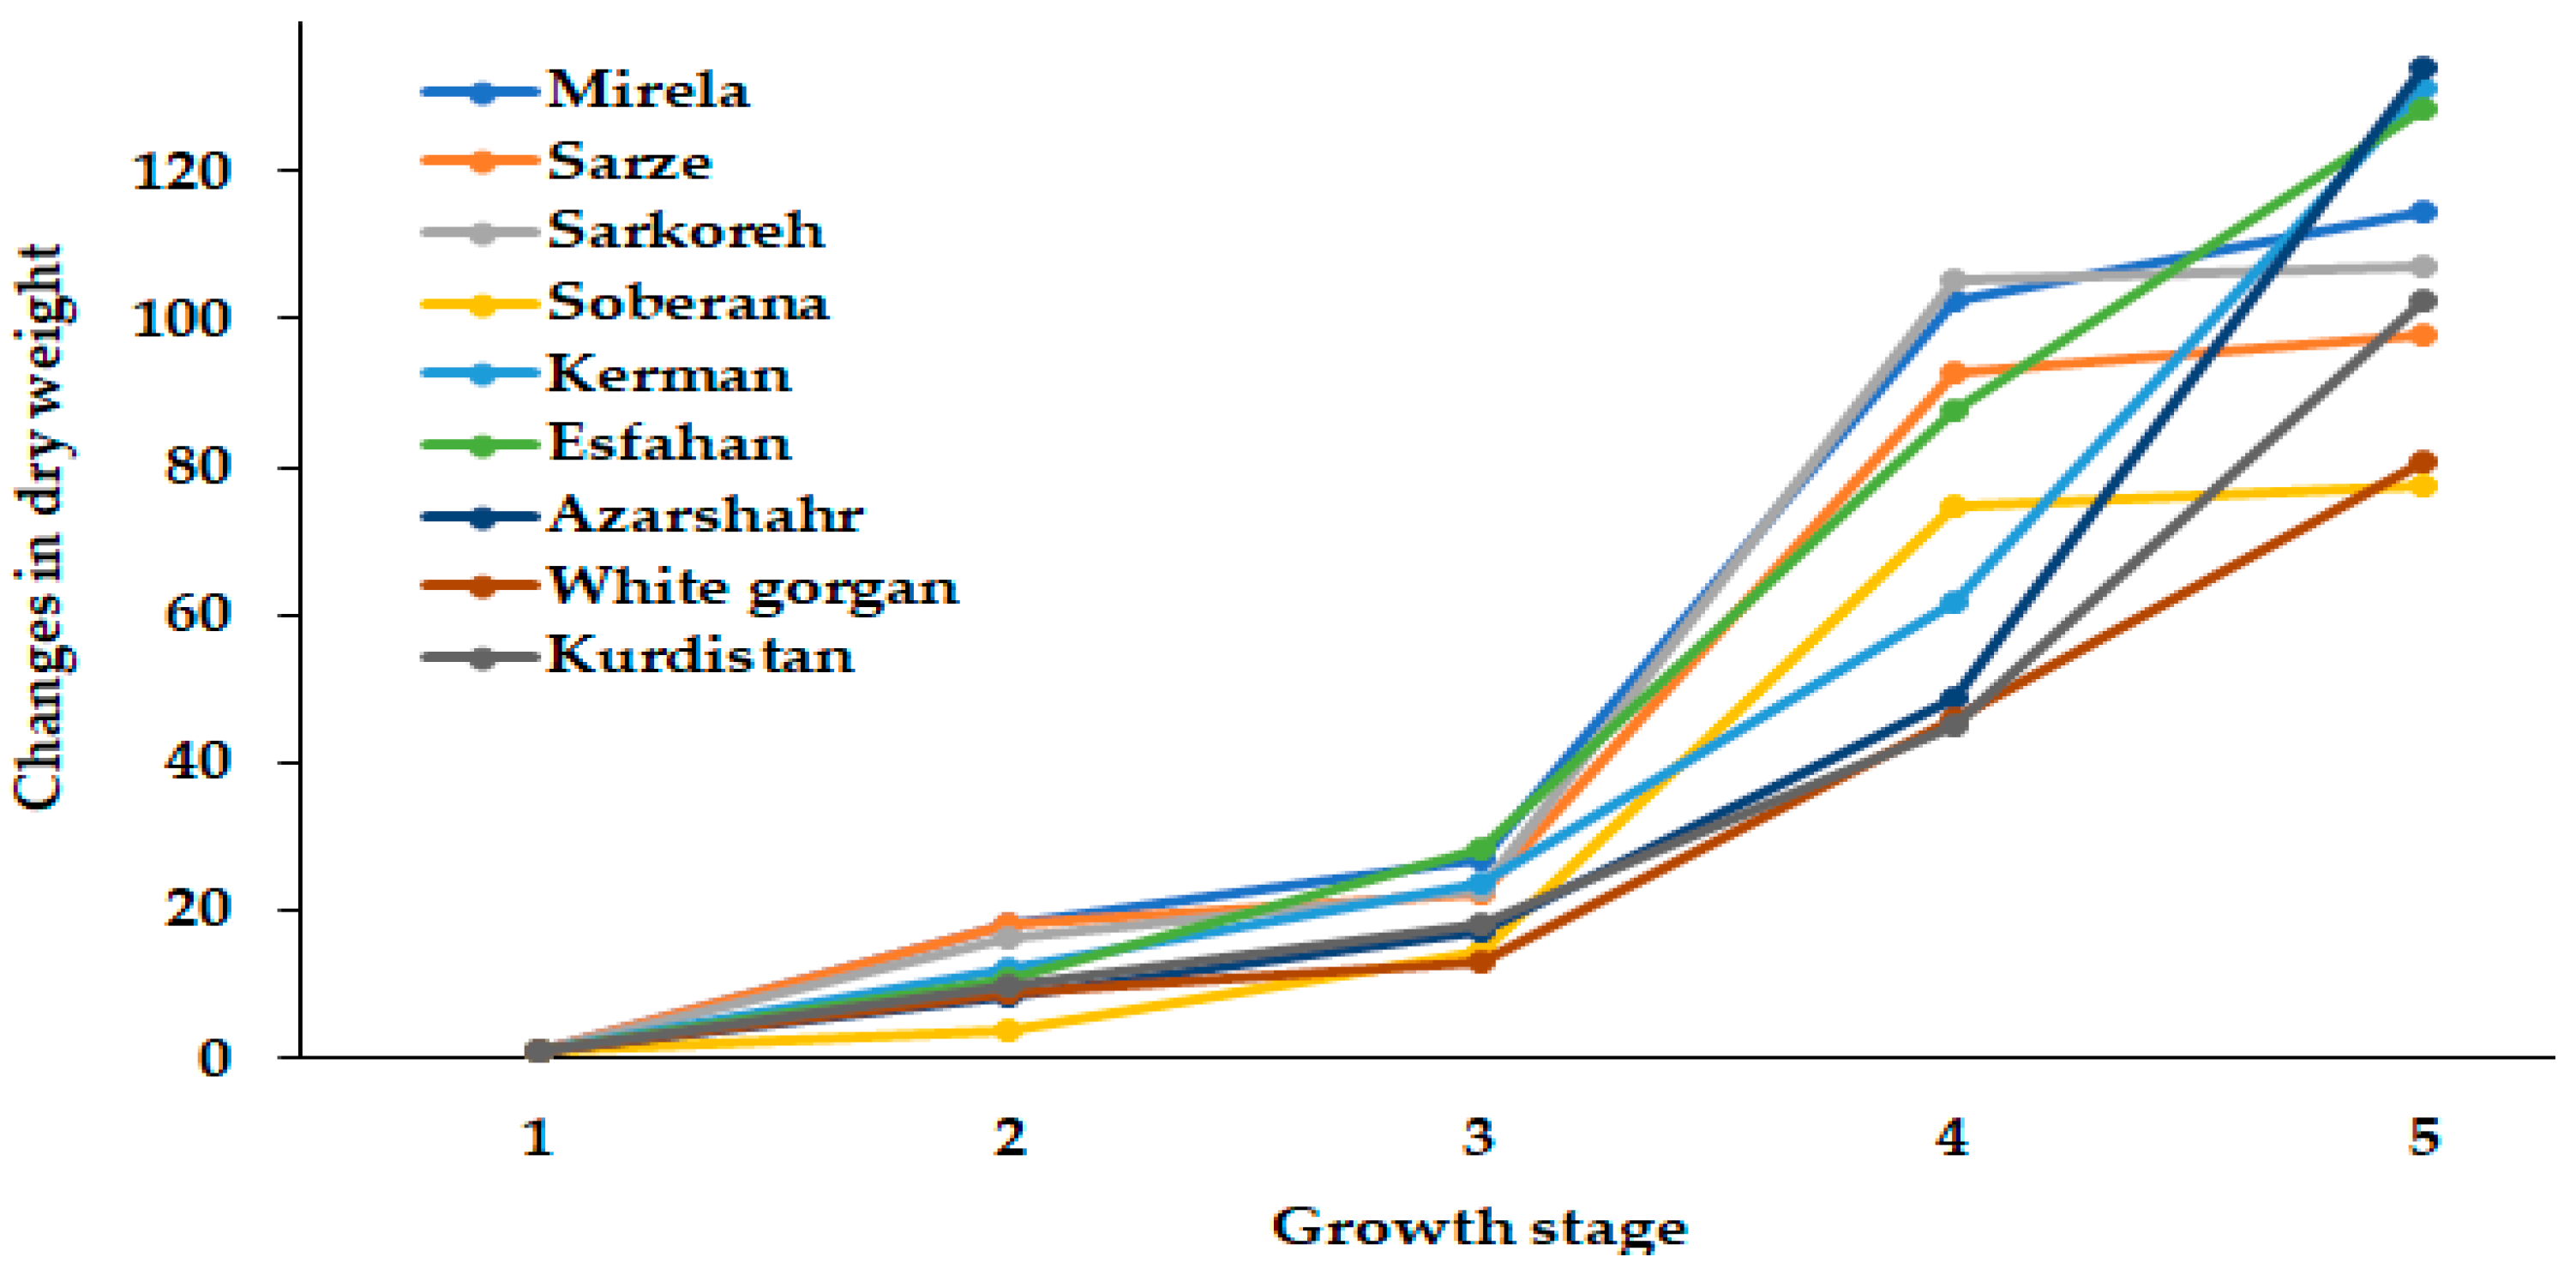
Figure 4 and Figure 5 demonstrate that a significant increase in onion growth and development occurred at a day length of 14.3 h and 1097–1176 GDD values, which is in agreement with the results of Przygocka–Cyna et al. [26]. As can be seen in Figure 3, total plant fresh weight in all cultivars increased with increasing day length to 15 h (Figure 3). Comparatively, the commercial short-day varieties Mirela and Soberana, and landraces Sarze and Sarkoreh showed a similar trend and maximum fresh weight was recorded at 15 h day length and 1634–1735 °C GDD and decreased with longer day length. Contrarily, in long-day varieties (Azarshahr, White Gorgan, Kurdistan, Esfahan), fresh weight increased more with 15.7 h day length and 2331–2571 °C GDD.
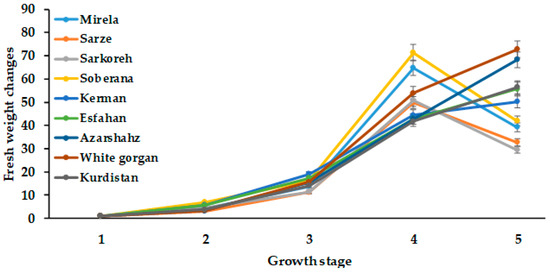
Figure 4.
Changes in bulb fresh weight during onion growth. Day length and GDD values are presented in Table 2.
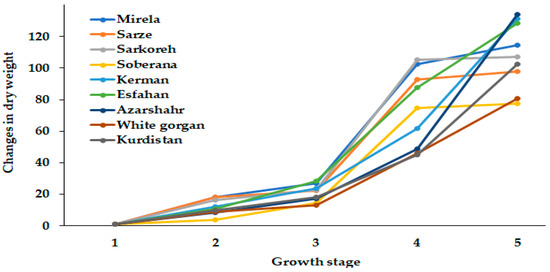
Figure 5.
Dynamics of dry weight changes during onion growth. Day length and GDD values (1–5) are presented in Table 2.
Figure 5 demonstrates the differences in dry weight dynamics between short- and long-day cultivars. The hybrids Soberana and Mirela and short-day landraces Sarkoreh and Sarze reached the maximum dry weight at 15.3 h day length, while dry weight of long-day cultivars increased as day length got longer (up to 15.7 h). It may be supposed that the higher dry weight increase of Sarze and Sarkoreh landraces, compared with the commercial hybrid Soberana, may be useful in future selection. Among the long-day cultivars, Azarshahr showed the highest dry weight.
3.1.2. Bulbing Ratio and Bulb Diameter
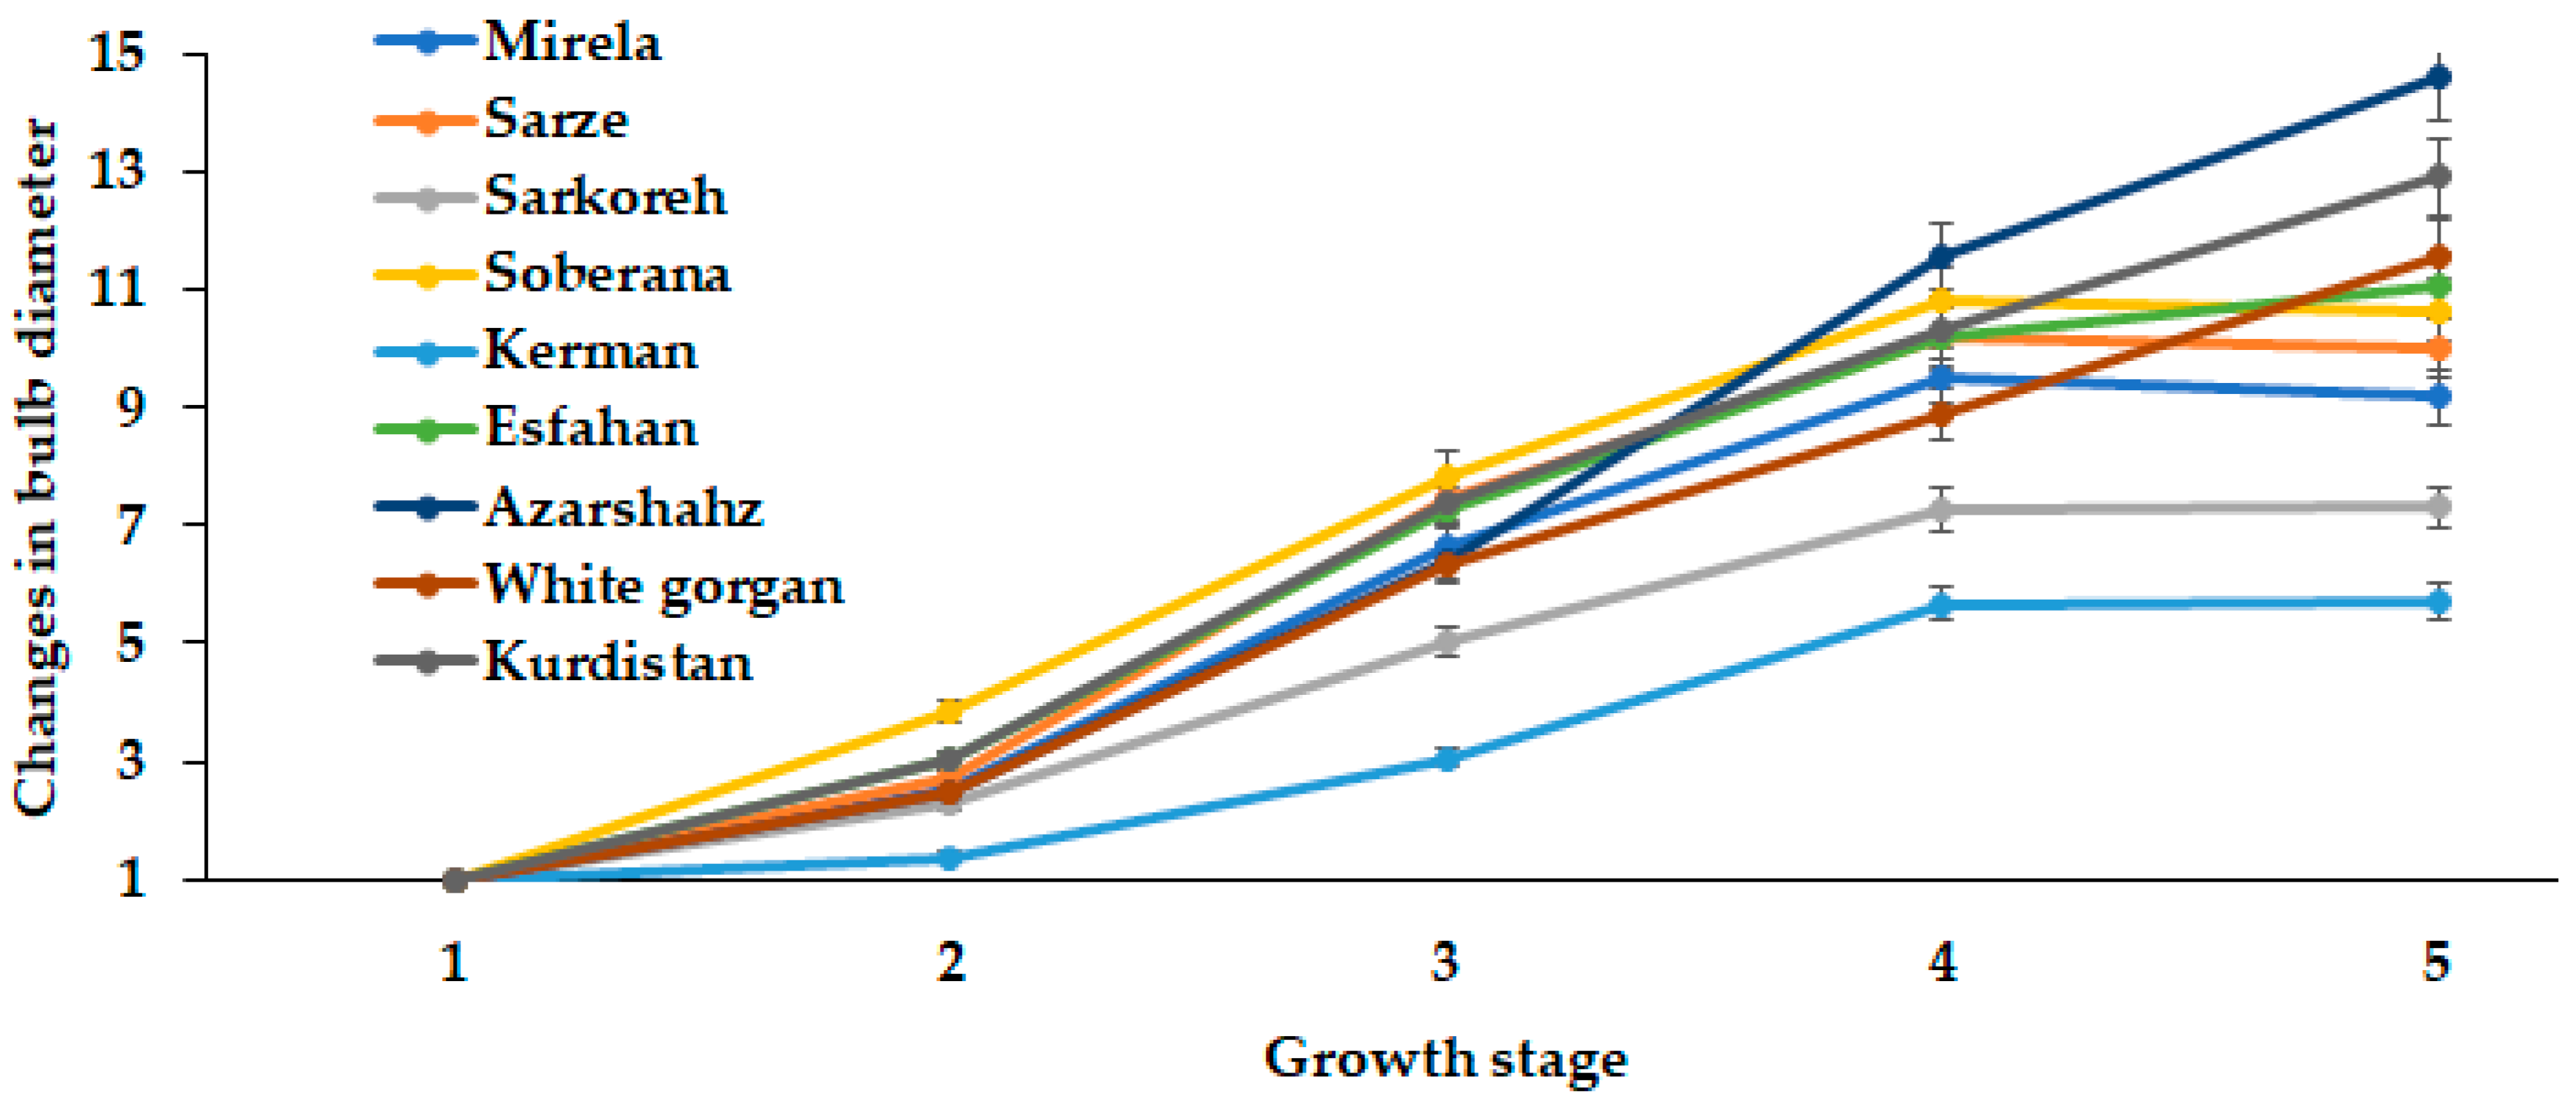
Similar to fresh and dry weight, changes during onion development were observed in bulb diameter dynamics (Figure 6 and Figure 7). Landraces Kerman and Sarkoreh showed the lowest rate of bulb growth.
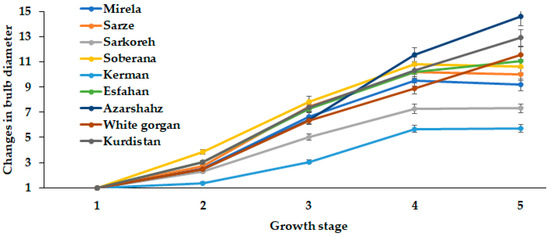
Figure 6.
Dynamics of bulb diameter changes during onion growth. Day length and GDD values (1–5) are presented in Table 2.
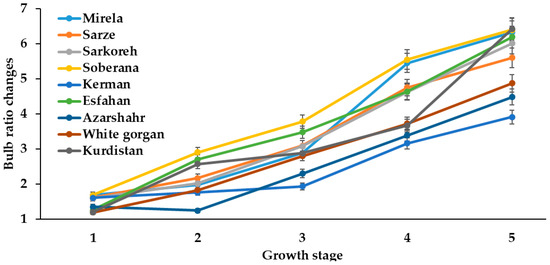
Figure 7.
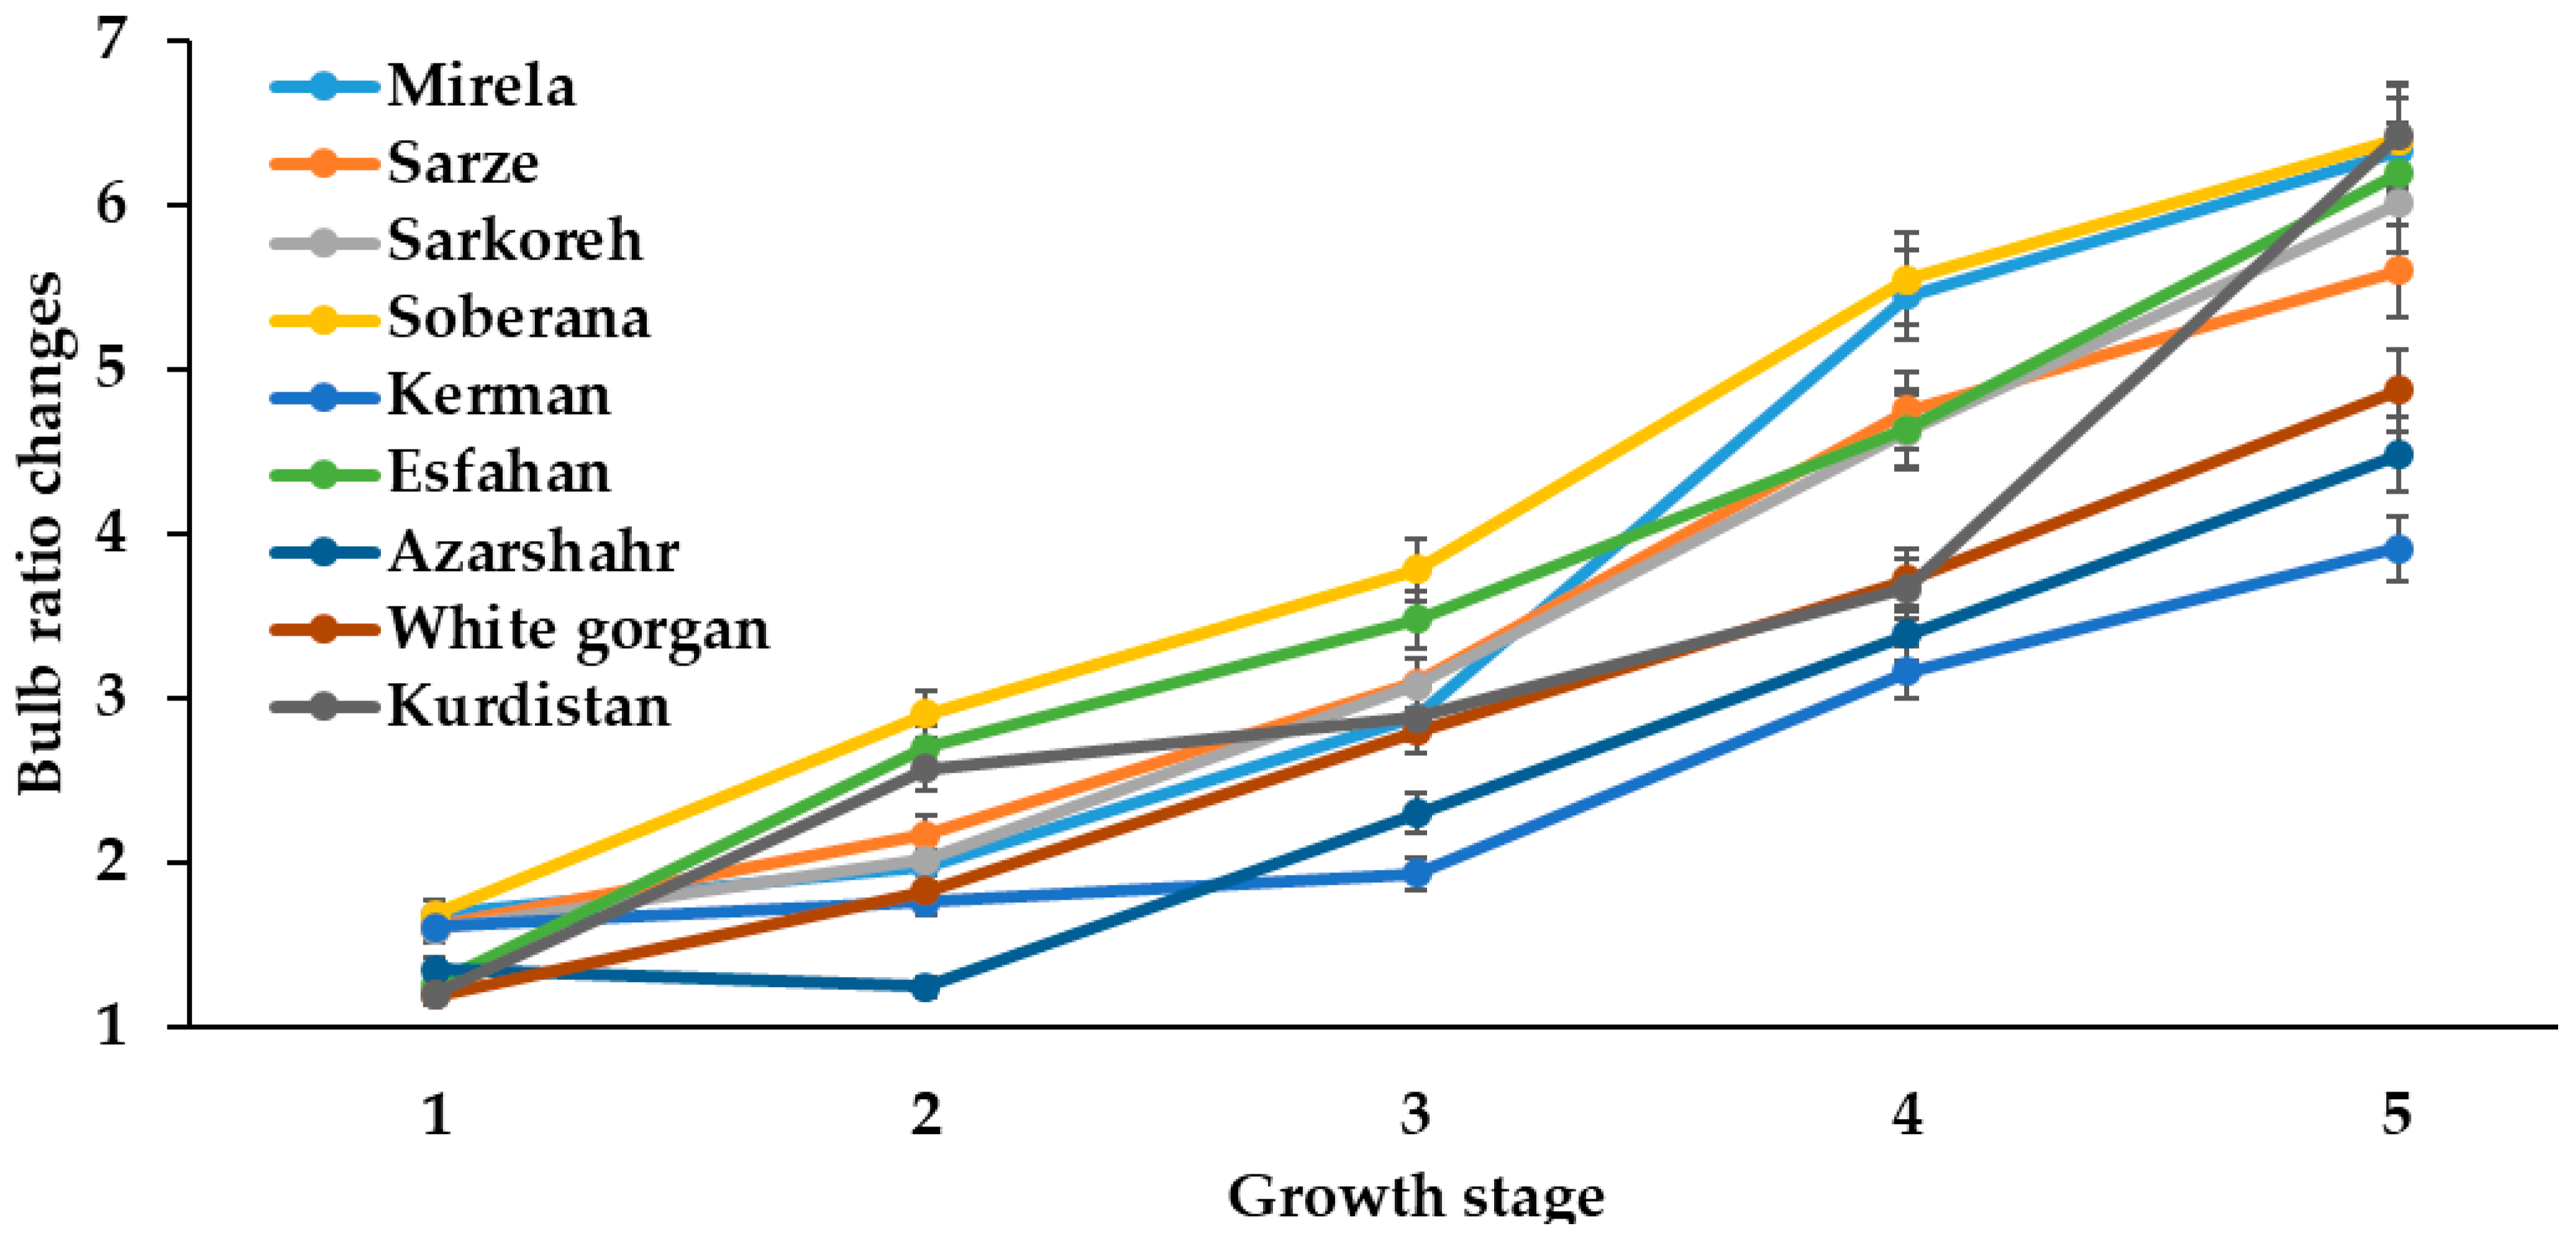
Bulb ratio changes during onion growth. Day length and GDD values (1–5) are presented in Table 2.
The short-day onion varieties, both the hybrids Mirela and Soberana, and the landraces Sarze and Sarkoreh, reached the maximum bulb diameter in late May (15.3 h day length and 1634–1735 °C GDD) (Figure 6), after which it slightly decreased due to the earlier ripening phase of these cultivars. Indeed, the landraces from southern Iran and the commercial short-day varieties showed similar behavior because of the same photoperiodic requirement. Contrarily, the bulb diameters of White Gorgan, Kurdistan, and Azarshahr increased with increasing day length to 15.7 h from mid-June to late July (1735 °C GDD) (Figure 6), which is directly connected with the well known requirement of onion leaves to be constantly exposed to an inductive photoperiod to initiate and complete the bulbing phase.
In the two seasons examined, the bulb diameter of all varieties increased with increasing day length because early low temperatures followed by long-days are crucial for bulb development. Additionally, the increased bulb diameter in long- and short-day onion cultivars is due to their requirement of cooler temperatures in early growth and warmer temperatures during the ripening phase [27]. Figure 5 data indicate a significantly higher growth rate of short-day cultivars (Mirela, Sarze, Sarkoreh, Soberana) compared with long-day cultivars (Esfahan, Azarshahr, White gorgan and Kurdistan).
The bulb/neck diameter ratio, or the so called bulbing ratio, is often used for characterizing onion bulb development, indicating intensive bulb development with a bulb ratio greater than two [28].
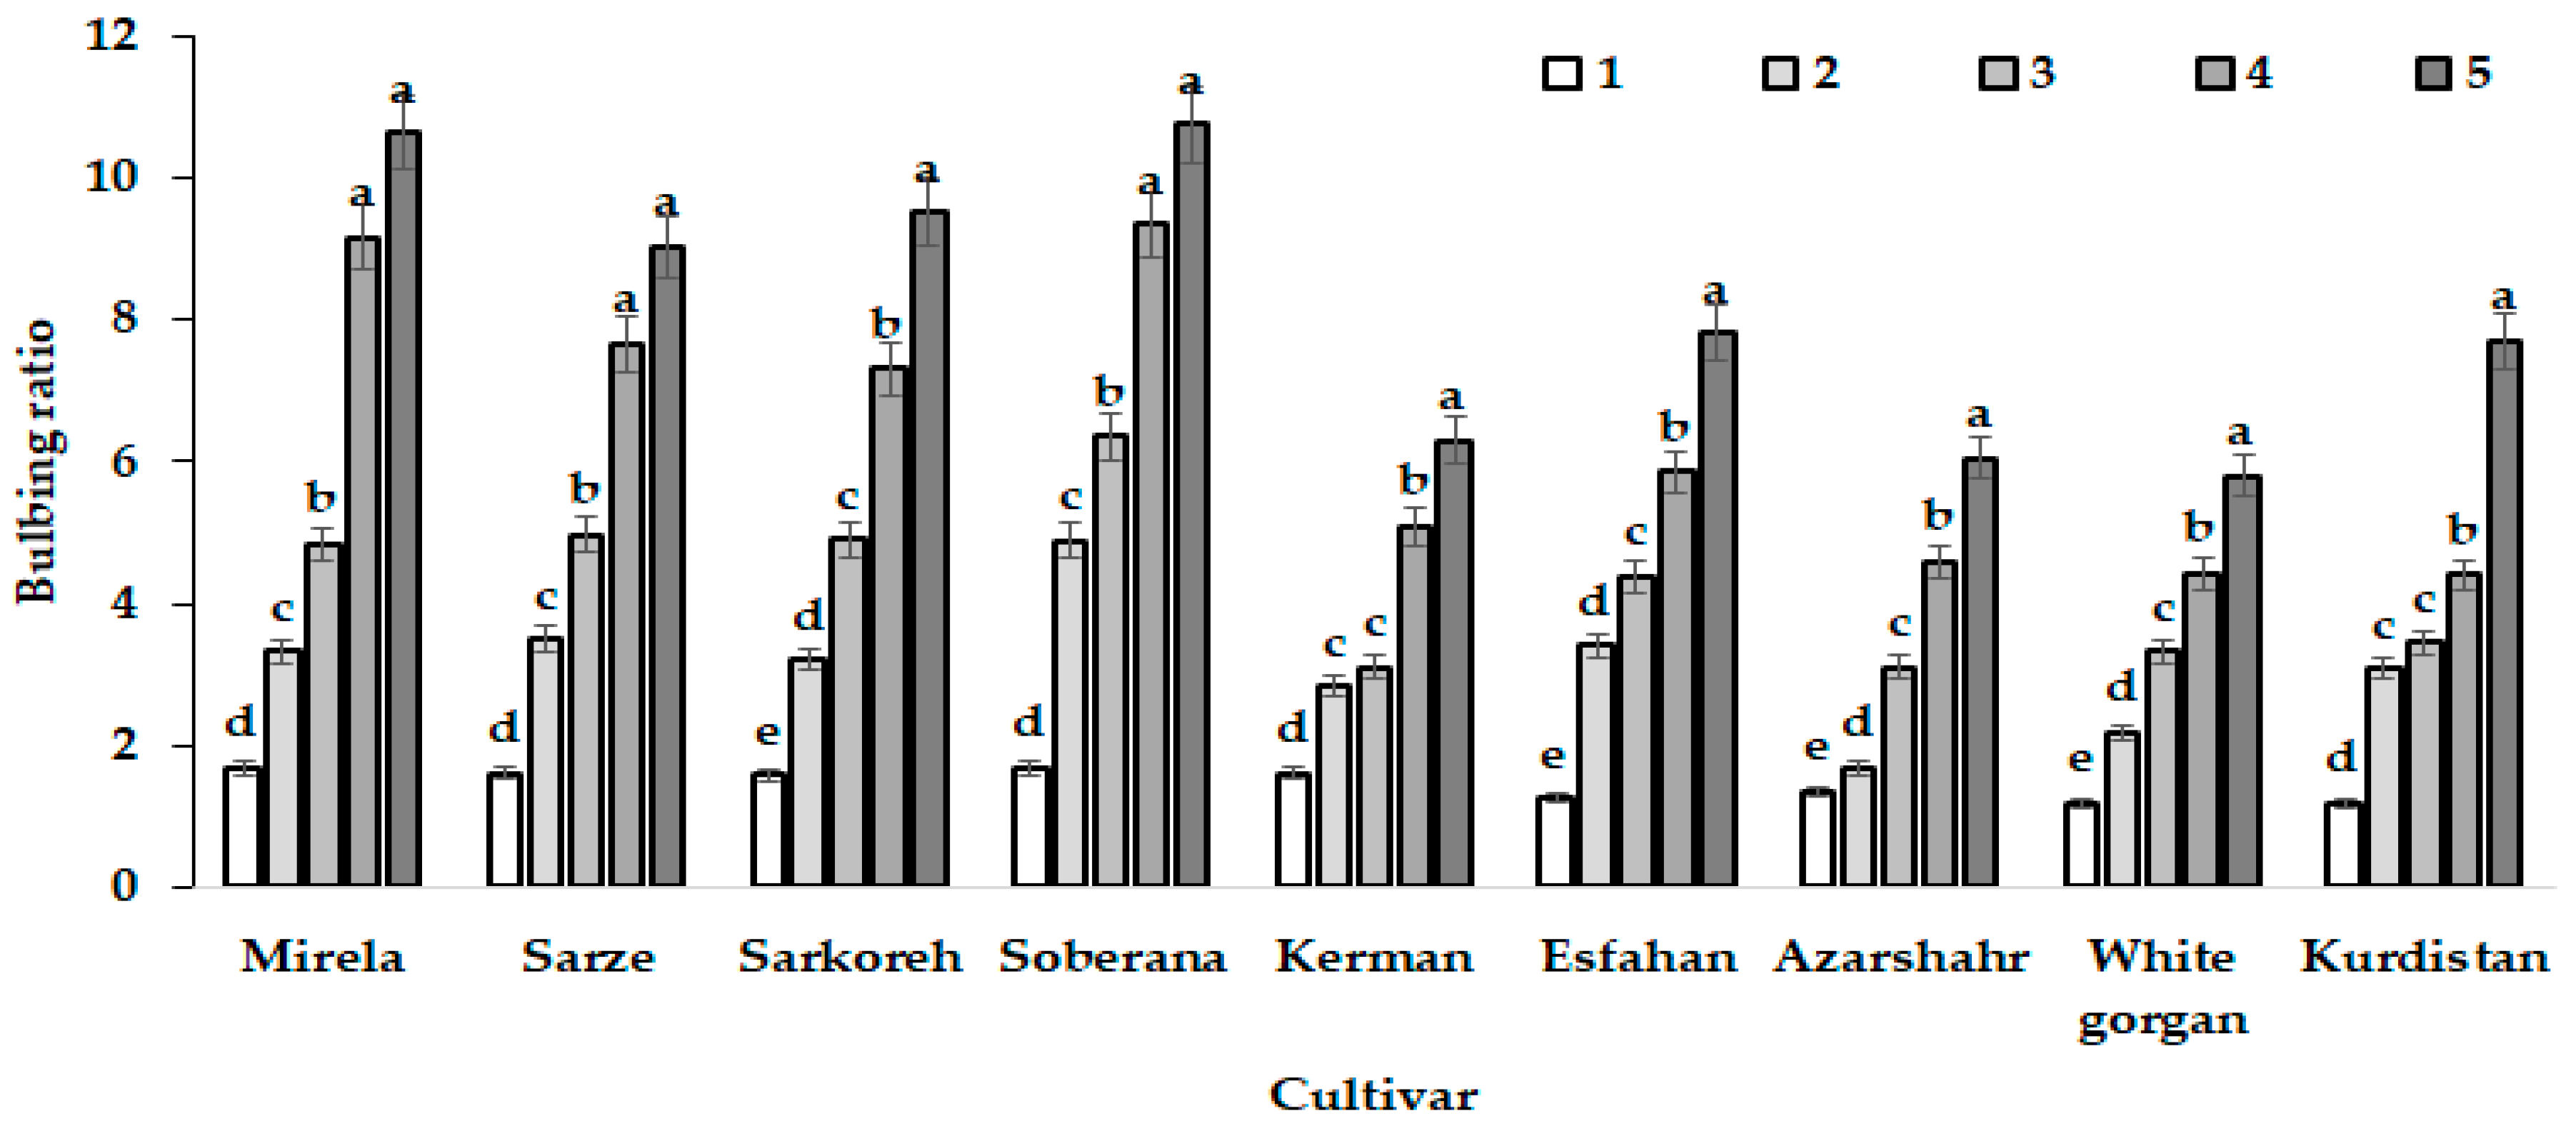
Bulbing ratio increased in all varieties with an increasing day length from January to July at the two sowing dates. However, short-day onions showed a higher bulbing ratio (>2) than long-day varieties (Figure 7 and Figure 8) and, in relation to this phenomenon, Rabiniwich and Currah [29] stated that an increasing air temperature from 6 to 26 °C promotes bulbing ratio and reduces time to bulb maturity.
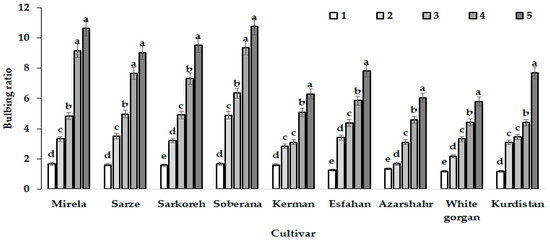
Figure 8.
Patterns of bulbing ratio growth of the nine onion cultivars in response to day length and GDD in different sampling dates based on the triple effect of interaction. Day length and GDD values (1–5) are presented in Table 2. Within each cultivar, values with the same letters do not differ statistically according to Duncan test at p < 0.05.
The intensive increase of bulb diameter at the last development stages of cultivar Azaeshahr resulted in an unusual bulbing ratio increase during this period, reaching the highest value at 15.7 h day length and 1634–1735 °C GDD (Figure 6).
3.1.3. Scale Number
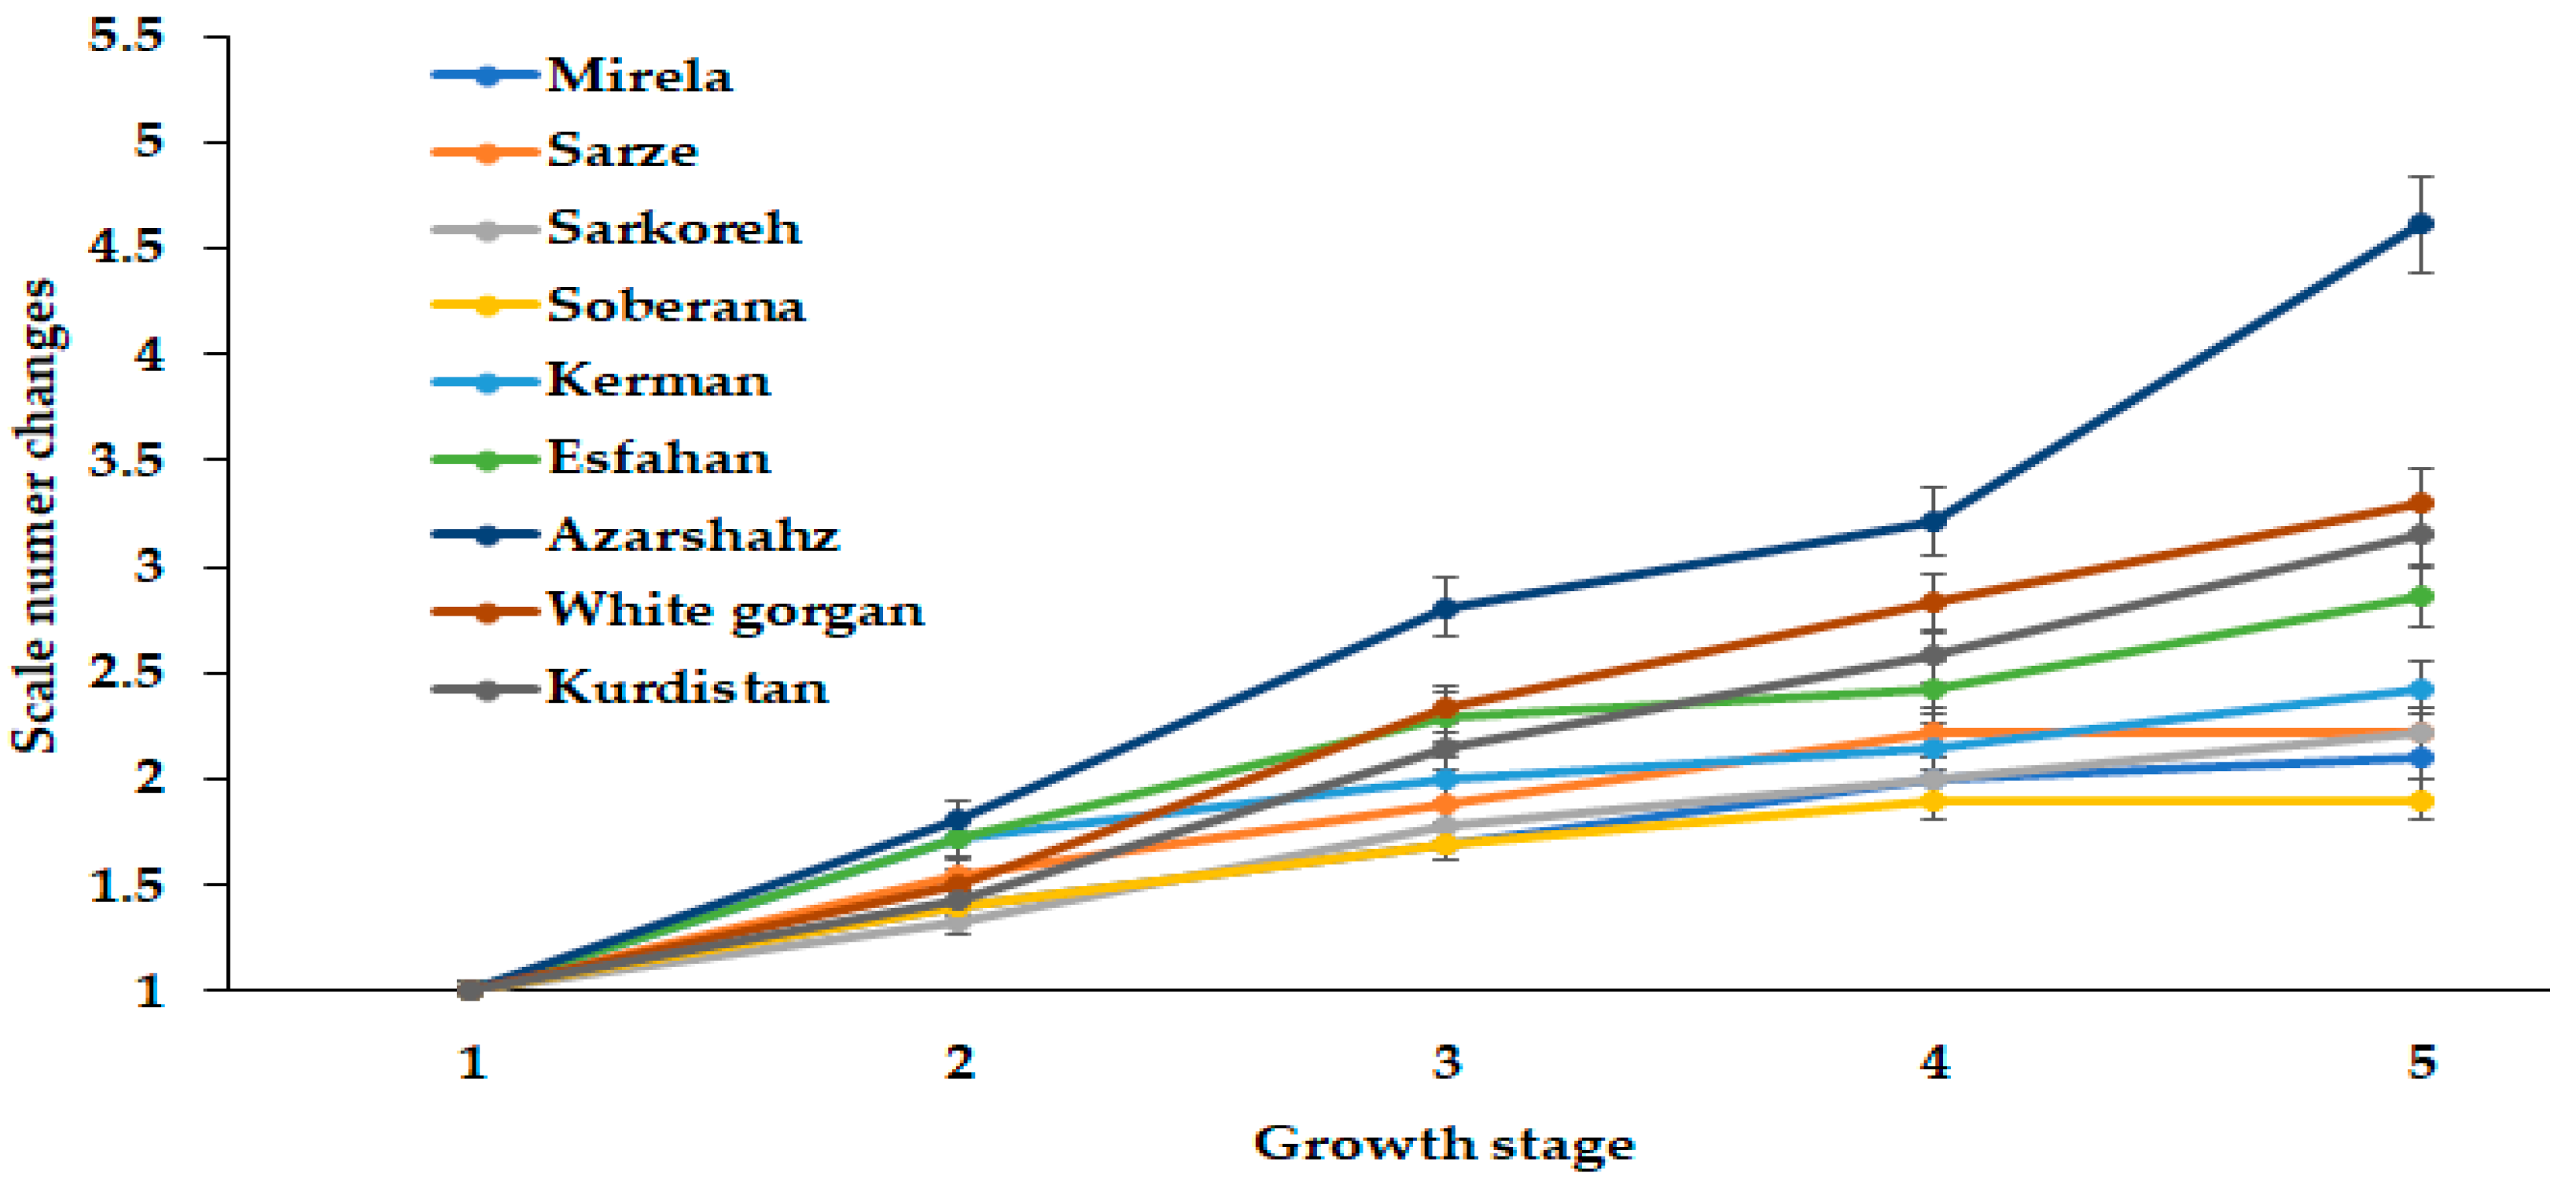
The phenomenon related to bulb diameter is in accordance with the scale number dynamics of cultivar Azarshahr bulbs (Figure 9). So far, onion scale number has not attracted enough attention from researchers. The results presented in Figure 8 indicate an unusually high scale number increase of cultivar Azarshahr at the last stage of development, compared with other cultivars. Indeed, the lowest changes of this parameter were recorded for the commercial short-day varieties Mirela and Soberana and the landraces Sarze, Sarkoreh, and Kerman. The long-day cultivars White Gorgan, Kurdistan, and Esfahan showed higher scale growth, although being evidently far from the Azarshahr ones. The latter cultivar was characterized by the highest rates of fresh and dry weight and bulb diameter changes (Figure 3, Figure 4 and Figure 5), as well as scale number increase (Figure 9) at the highest day length and GDD values.
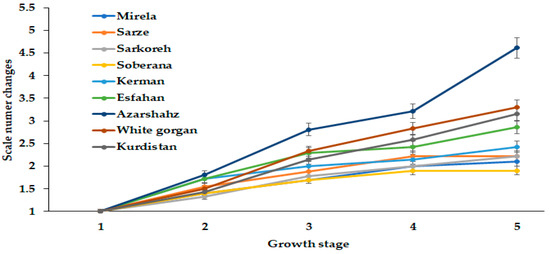
Figure 9.
Dynamics in scale number changes during onion growth. Day length and GDD values (1–5) are presented in Table 2.
3.1.4. Leaf Number and Length
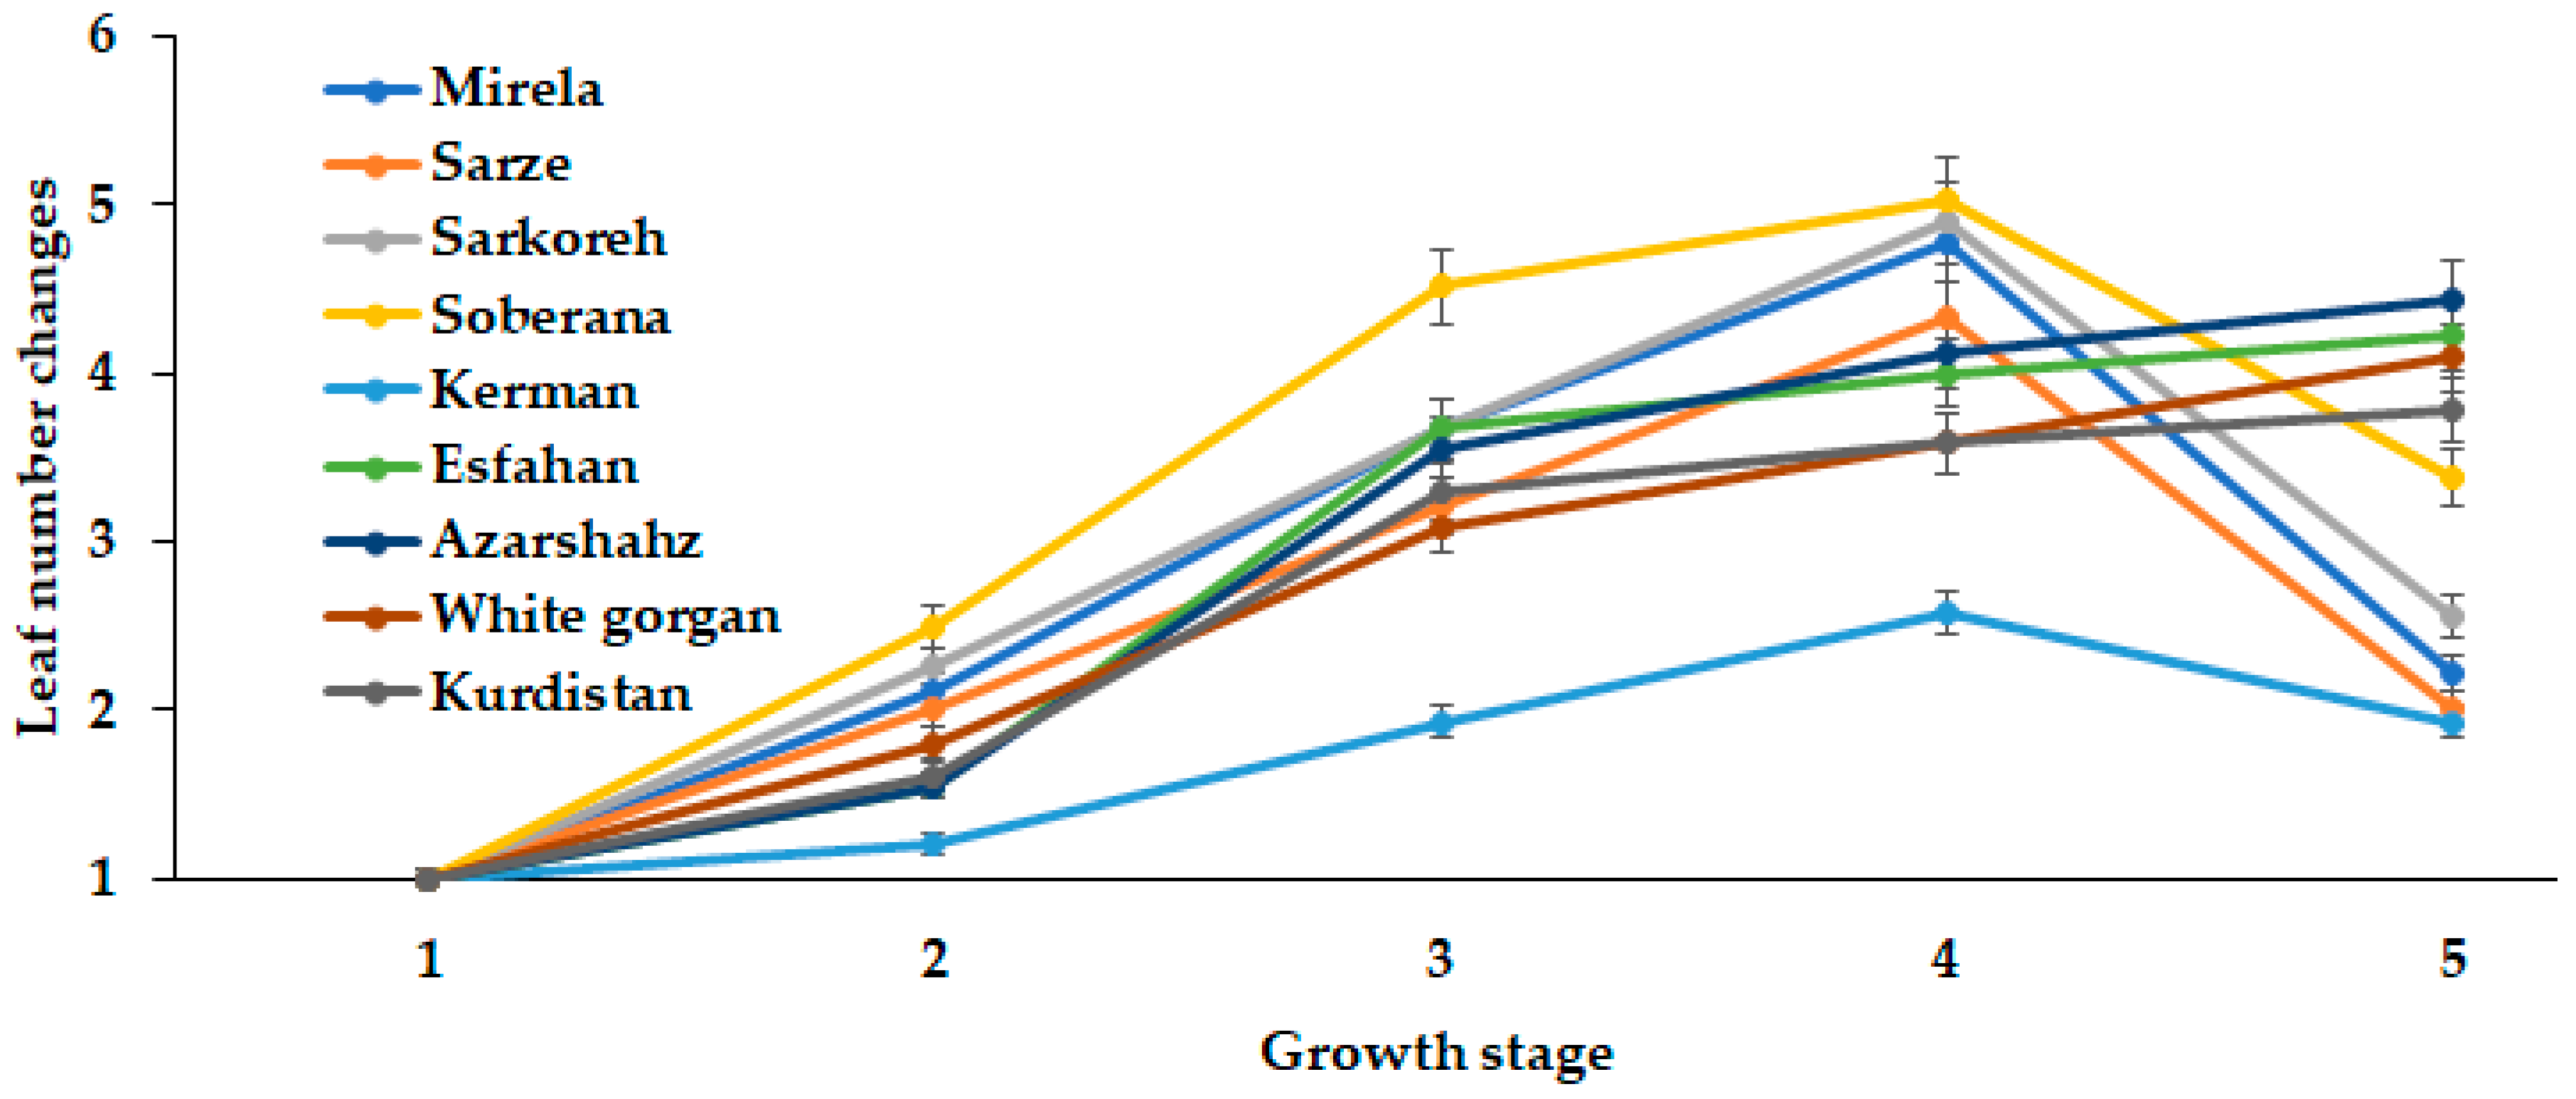
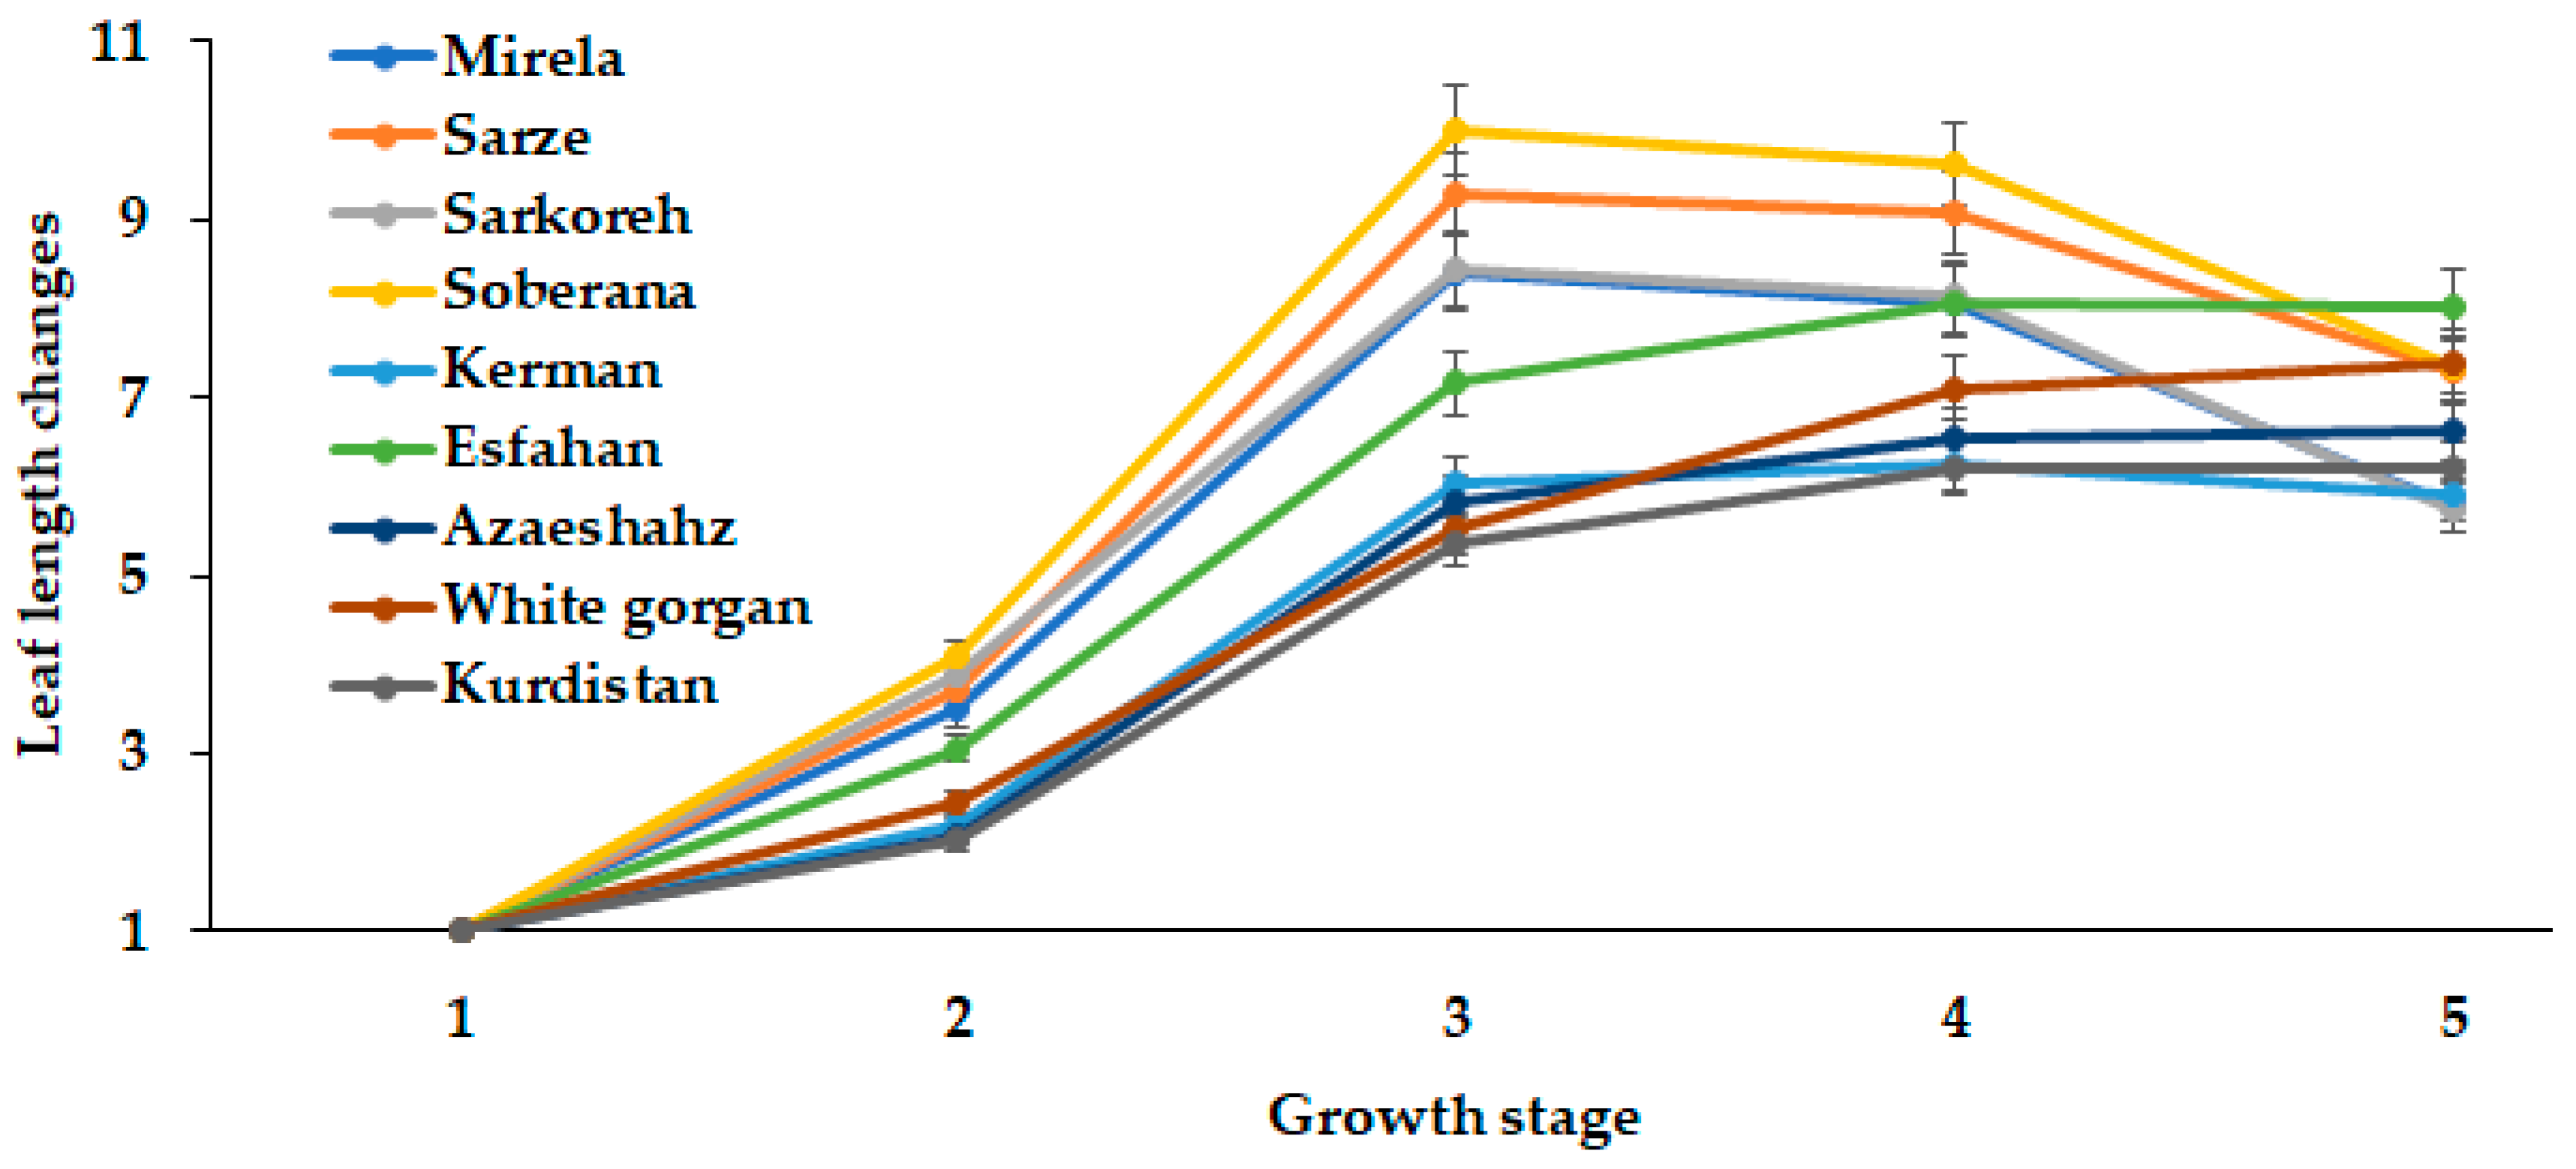
Onion bulb development greatly depends on leaf number and area. The present comparison of long- and short-day Iranian varieties indicated the close relationship between leaf number and length with the day length and GDD requirements for different ecological groups of plants (Figure 10 and Figure 11).
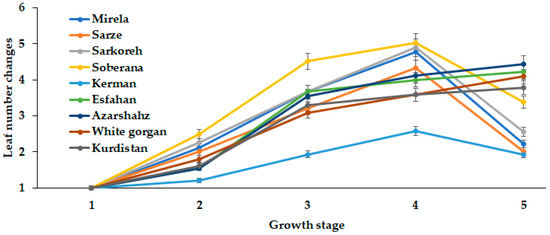
Figure 10.
Dynamics of Leaf number changes during onion growth. Day length and GDD values (1–5) are presented in Table 2.
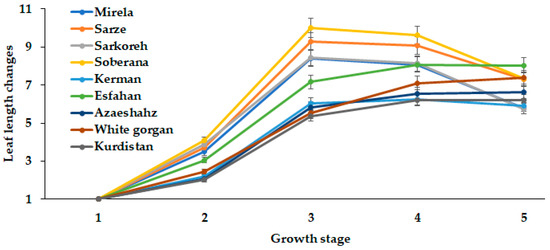
Figure 11.
Leaf length changes during onion growth. Day length and GDD values (1–5) are presented in Table 2.
In this respect, the short-day cultivars (commercial hybrids Soberana and Mirela, and landraces Sarkoreh, Sarze, and Kerman) showed the highest rate of leaf number changes at 15.3 h day length, while the long-day cultivars (White Gorgan, Azarshahr, Kurdistan, and Esfahan) constantly increased the leaf number with the day length increase (up to 15.7 h and 2331–2571 °C GDD) (Figure 10). High variability of the leaf number increase rate was recorded for short-day varieties: the highest leaf number changes were displayed by cultivar Soberana and a 2.5 times lower rate by cultivar Kerman.
Out of the five onion leaf stages, the second phenological stage occurred at day lengths between 12 and 14 h and GDD of 609–1097 in Soberana, Sarkoreh, Mirela, Sarze, and Esfahan, whereas White Gorgan, Kurdistan, Kerman, and Azarshahr at 14.3 h and GDD 1097 reached the five-leaf stage. Notably, the long-day varieties showed similar rates of leaf number increase.
The leaf length in the short-day onion varieties reached the maximum extent at 14.3 h day length and then decreased, while the long-day varieties White Gorgan, Azarshahr, Kurdistan, and Esfahan had an increased leaf length with increasing day length up to 15.7 h (Figure 11). The most pronounced leaf length growth was recorded in cultivars Soberana, Sarze, Sarkoreh, and Mirela, while the lowest rates were found in the long-day cultivars, among which cultivar Esfahan showed the most intensive leaf length growth.
3.1.5. Root Length
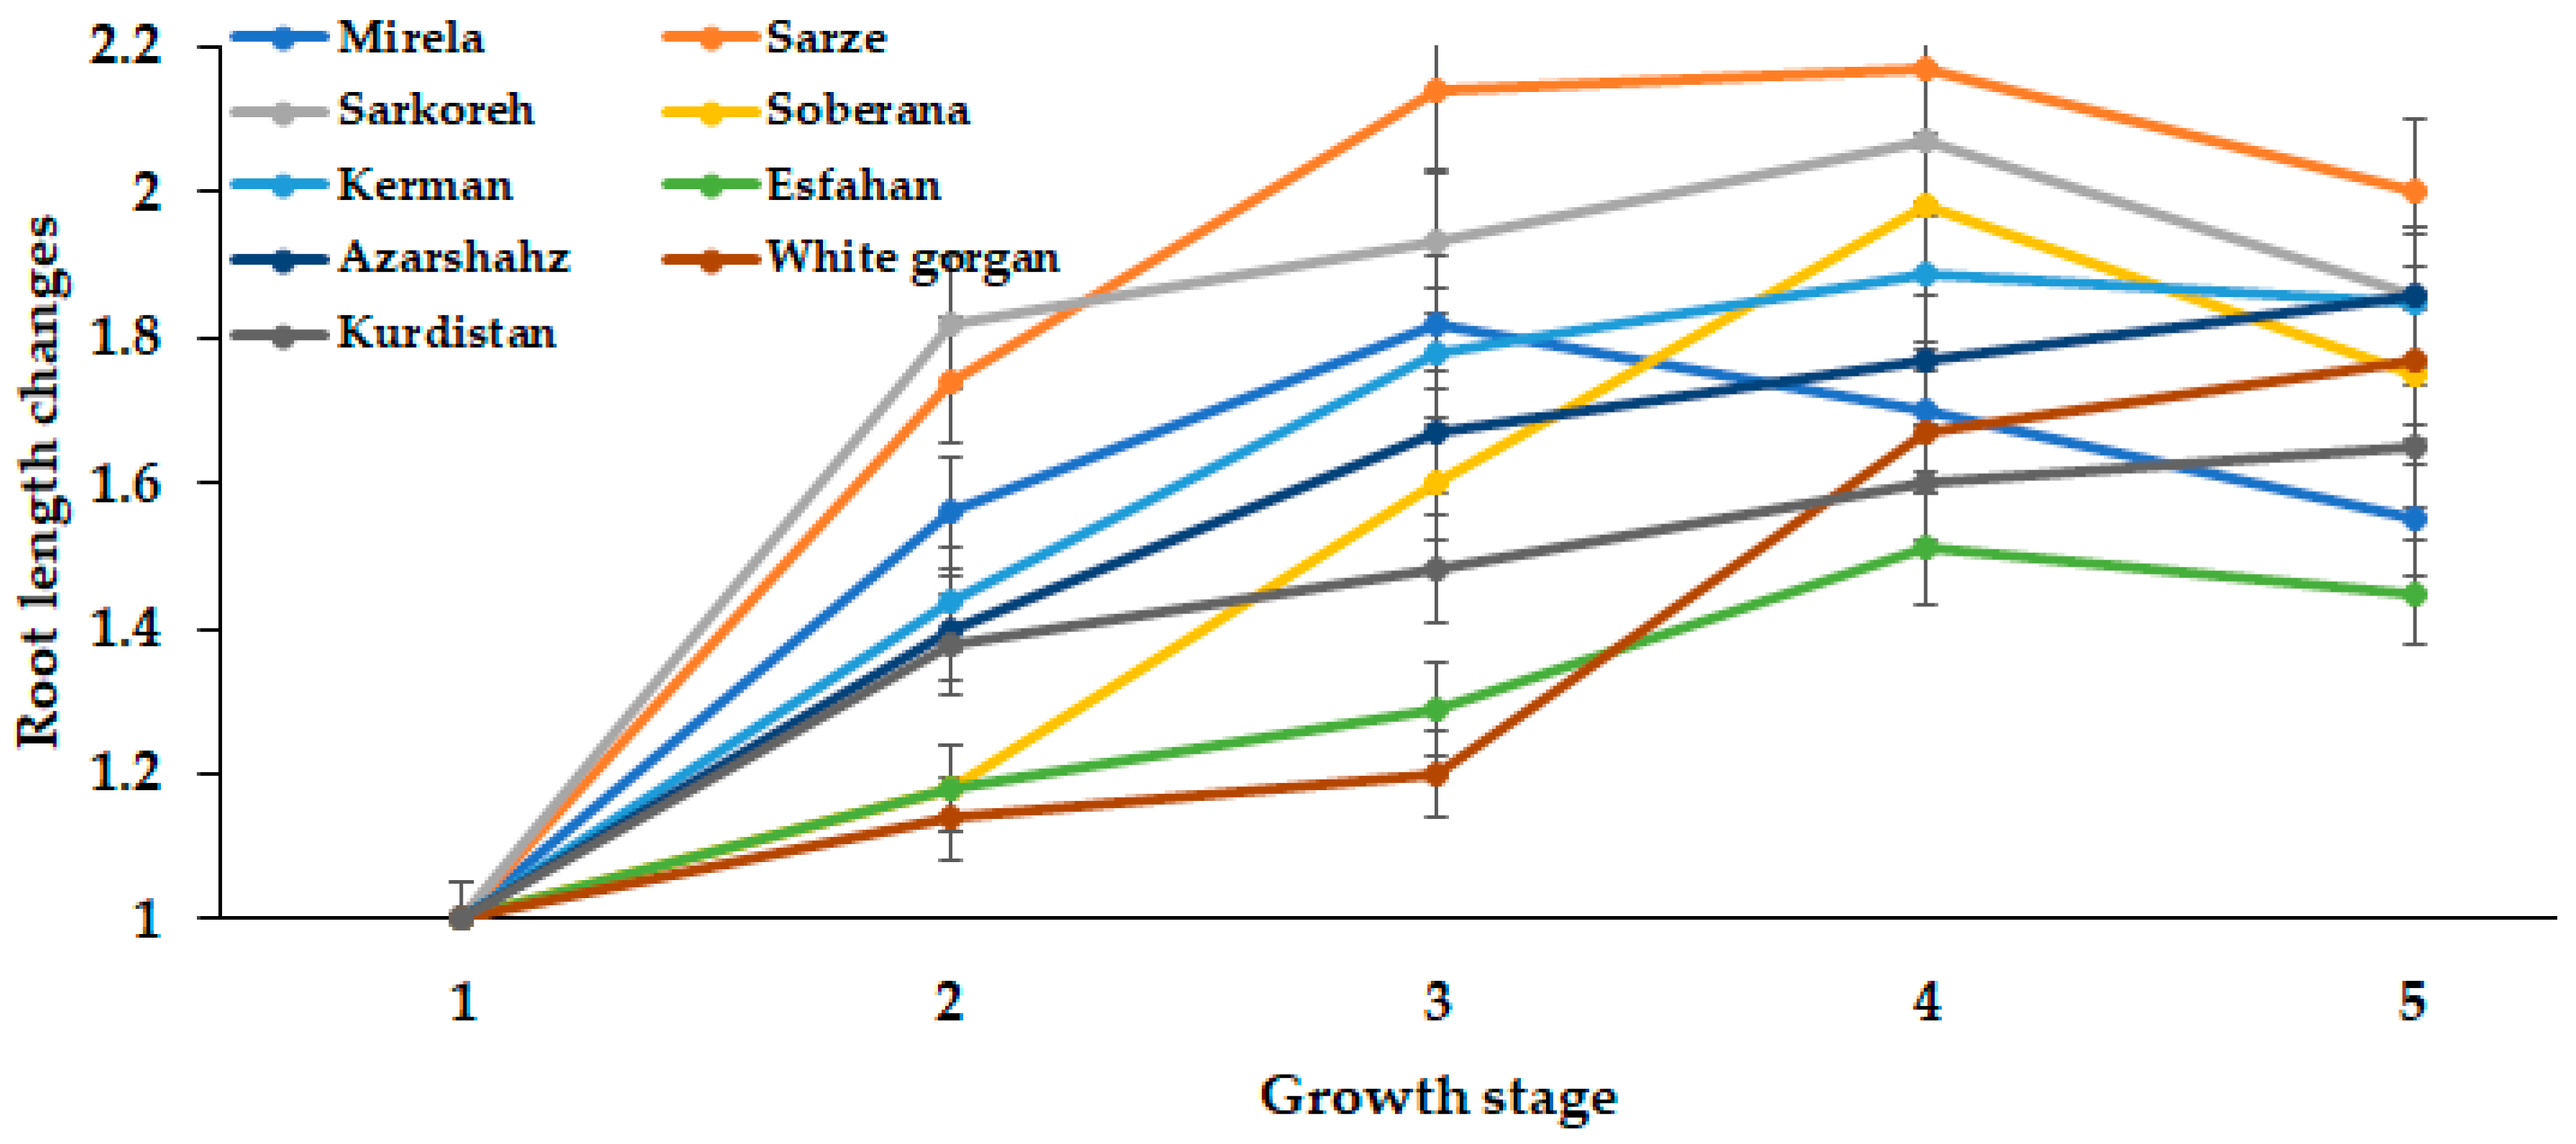
The root length in all short-day varieties tended to decrease with increasing day length from 15.3 to 15.7 h. Lee and Suth, 2009 [27] reported that leaf number decreased as temperature increased, thus possibly affecting root growth, whereas in Azarshahr, Kurdistan, and White Gorgan, the root length increased up to 15.7 h day length, because these varieties need a longer day length and GDD to reach the ripening phase, compared with short-day varieties (Figure 12 and Figure 13).
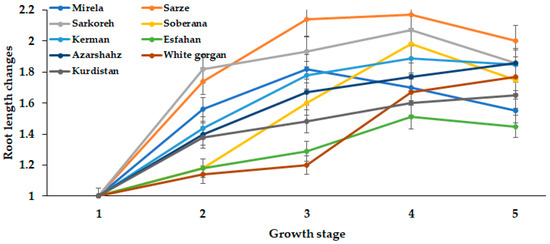
Figure 12.
Dynamics in root length during onion growth. Day length and GDD values (1–5) are presented in Table 2.
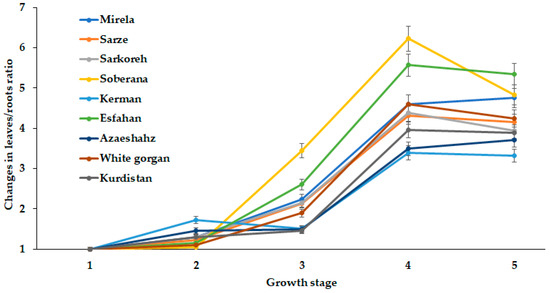
Figure 13.
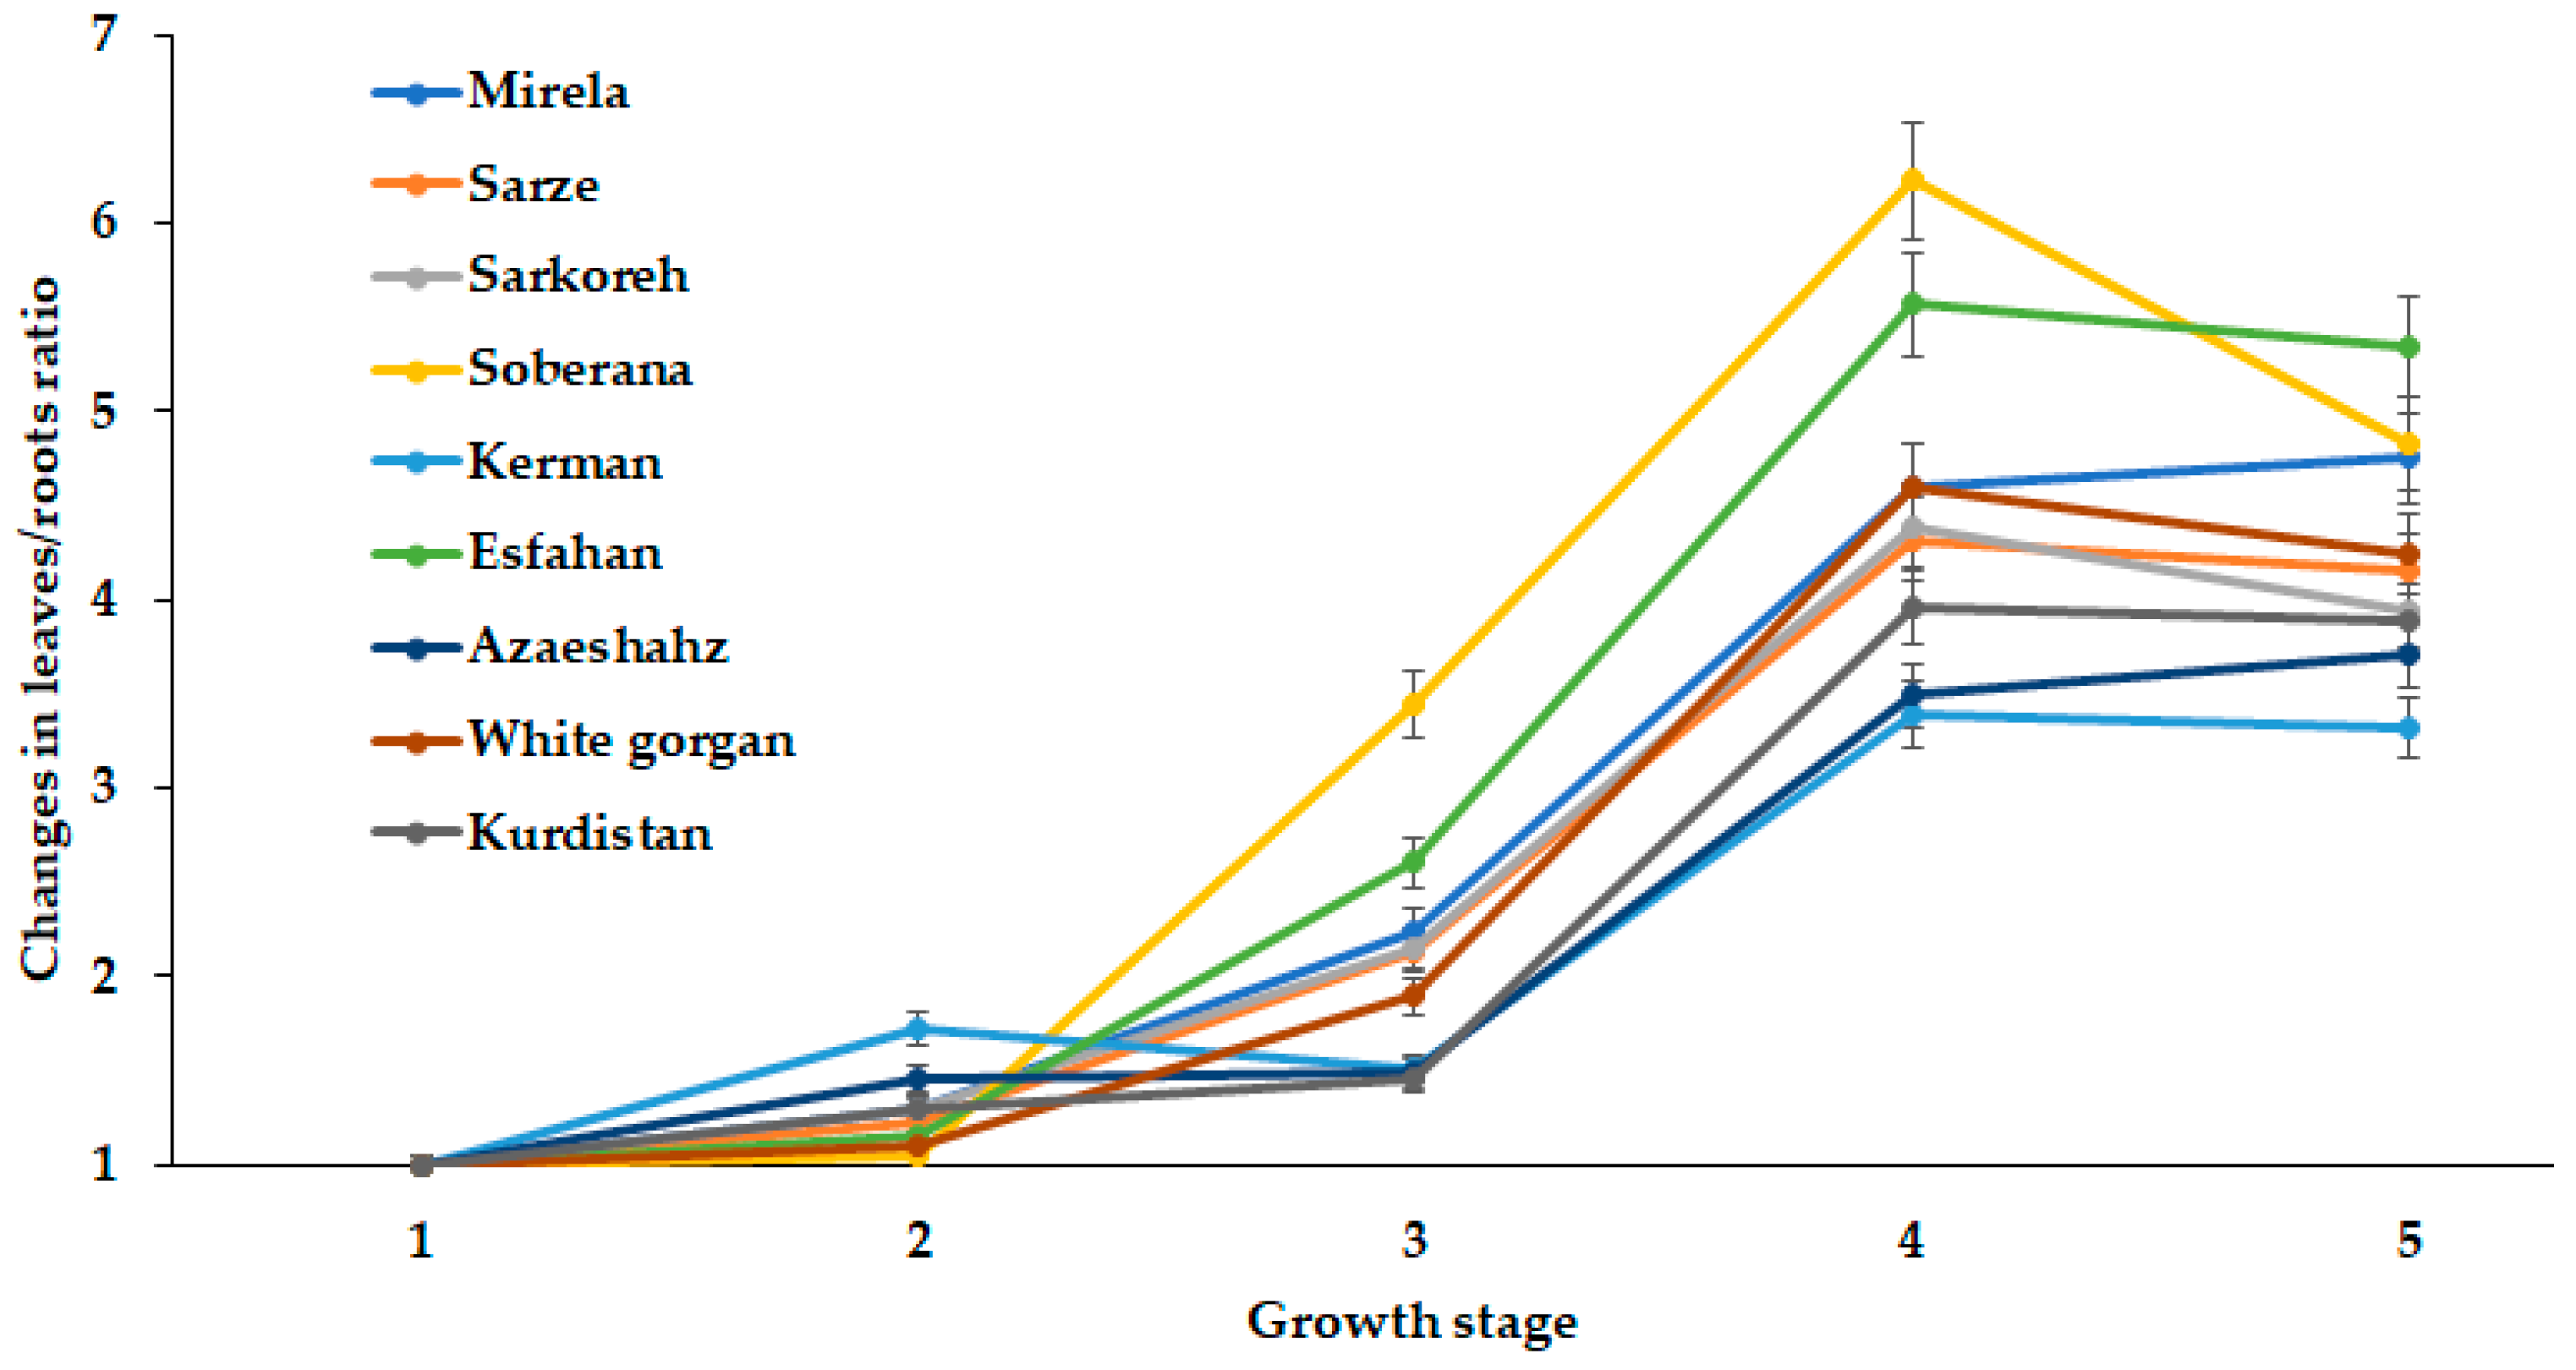
Dynamics of leaves/roots length changes during onion growth. Day length and GDD values (1–5) are presented in Table 2.
The direct relationship between root and leaf development has provided the opportunity of a comparison of leaves/roots length ratio for the cultivars examined (Figure 13).
The presented data suggest the critical role of third stage growth (5.3 h day length and 1634–1735 °C GDD) on leaves/roots ratio changes in all studied cultivars. Subsequently, these values either decrease for most short-day varieties at the fourth development stage or changed insignificantly in long-day cultivars. In this respect, two short-day cultivars have drawn particular attention. The hybrid Soberana is the first one, with the highest rate of leaves/roots ratio changes. The second is cultivar Kerman, characterized by an unusual increase in leaves/roots length ratio during the second growth stage (12.2 h day length and 590–609 °C GDD). The latter cultivar demonstrated the lowest bulb diameter and plant fresh weight at harvest (Table 3).
3.2. Chlorophyll Index
The ability of plants to synthesize chlorophyll is directly connected with the value of onion yield.
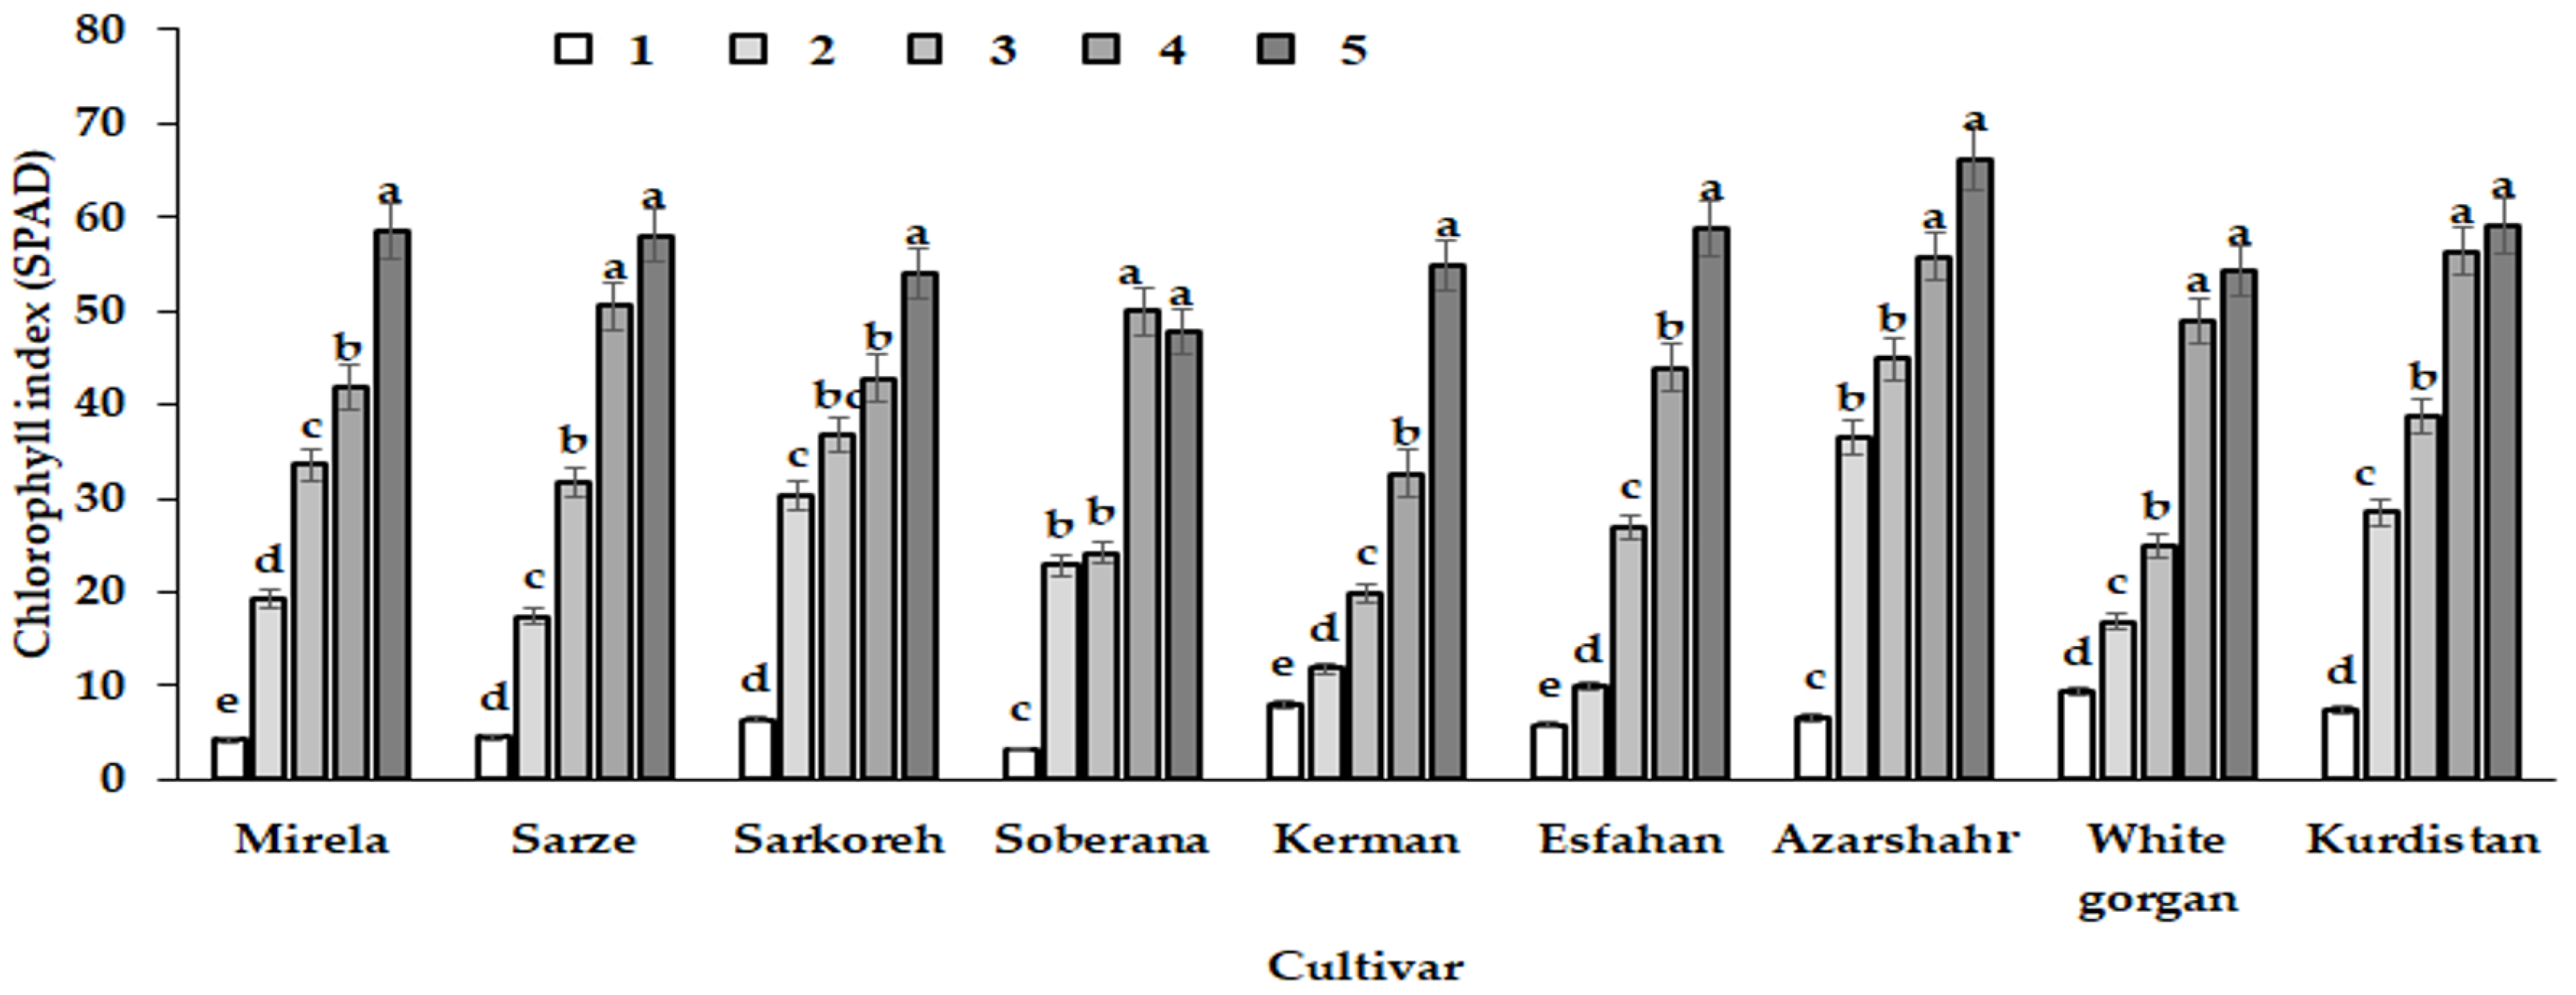
In the fifth sampling date (day lengths 15.7 h), all varieties had the highest leaf chlorophyll index (Figure 14). As the days became longer, plant leaves were exposed to more intense direct light than at the beginning of the growing period, characterized by autumn and winter short days. Longer photoperiods enhance plant growth by increasing leaf area and chlorophyll concentration as well as DLI, which increases yield in crops such as kale and lettuce [30,31]. A previous investigation of Duysens et al. [32] revealed that the day length rise from 6 to 12 h increased the daily rate of photosynthesis. The present results show the highest chlorophyll index for the leaves of cultivar Azarshahr, characterized by high values of leaf number and length and plant dry weight (Table 3). This cultivar demonstrated one of the most remarkable increases of chlorophyll index at the second growth stage, corresponding to 12.2 h day length and 590–609 GDD (Table 2).
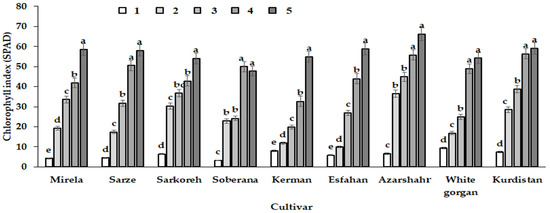
Figure 14.
Chlorophyll index change pattern of the nine onion cultivars in response to day length and GDD in different sampling dates (different growth phase). Day length and GDD values (1–5) are presented in Table 2. Within each cultivar values with the same letters do not differ statistically according to Duncan test at p < 0.05.
3.3. Antioxidant Status
Health benefits from onion consumption are directly connected with high levels of antioxidants, particularly polyphenols [33,34]. Among the latter, flavonoids and mainly quercetin and its derivatives provide the highest antioxidant defense [33,35]. Anthocyanins of red onion also show high antioxidant activity, and their accumulation in onion bulbs are greatly affected by genetic peculiarities, environmental factors, and applied agricultural technology [36].
The present results are in accordance with previous reports regarding the high variability of phenolic content in Iranian A. cepa landraces [37] (Table 5). Indeed, the coefficient of variation related to phenolics in the nine studied cultivars reached 45.11%, which is associated with variations in the content of both flavonoids and anthocyanins. The highest polyphenol content was recorded in cultivars Azarshahr, Kurdistan, Esfahan, Sarze, and Kerman, while the lowest one was found in cultivar Mirela. Being part of polyphenols association, flavonoids and anthocyanins demonstrate a direct correlation between each other in onions (Table 6), which explains the phenomenon of unusually high polyphenol content in red cultivar Azarshahr.

Table 5.
Bulb antioxidant status of A. cepa cultivars.

Table 6.
Relationship between antioxidant parameters of Allium cepa bulbs.
The results indicate the predominant effect of genetic factors on A. cepa bulb antioxidant status parameters (p ≤ 0.01; Table 7).

Table 7.
Results of analysis of variance for main effects of the onion accession on phytochemical content.
3.4. Results of Molecular Experiments
3.4.1. ISSR Analysis
The results obtained with the eight ISSR primers showed that six primers have suitable efficiency to form polymorphism bands in onion landraces (Table 8) and commercial hybrid species (Table 8). Polymorphism bands expanded from 100 bp to 3 kb and most polymorphism content was in the range of 400–900 bp.

Table 8.
ISSR primer sequences, Polymorphic information content (PIC) and amplicons using ISSR markers.
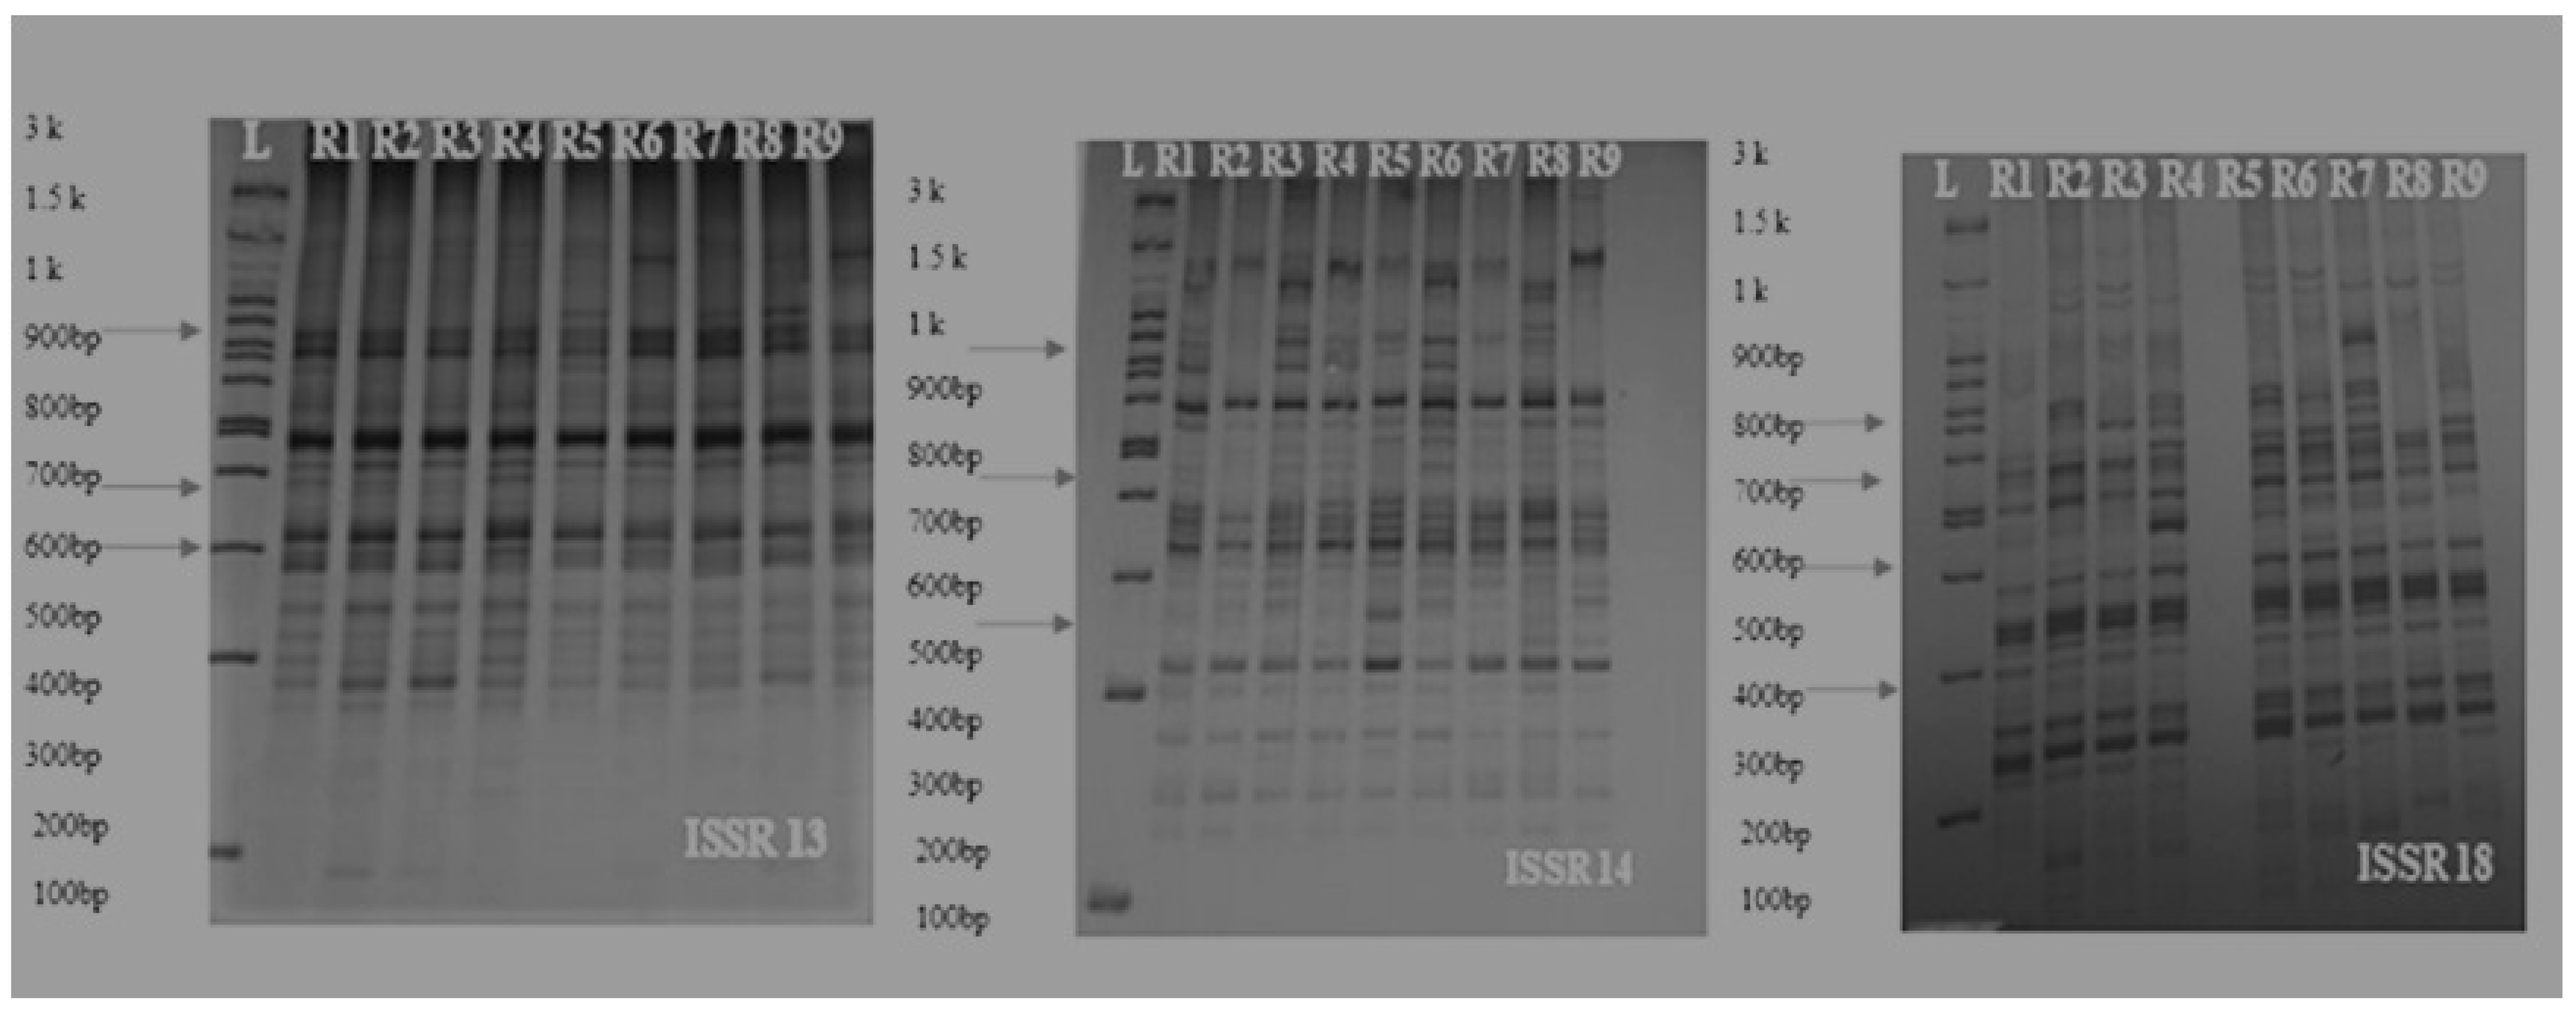
The number of scorable bands in each ISSR marker varied from 6 to 46 and the mean of produced bands was 14.23. Primer ISSR18, with a total of 46 bands and 32 polymorphism bands, showed maximum scorable bands over other primers and had the highest resolving power. Additionally, ISSR 13 with PIC, more than others (46%), showed the highest resolution power in separation of onion genotypes. Some primers showed an absence of amplification products and this is due to the fact that these ISSR primers need further optimization of PCR conditions in onion species [38,39]. The most PIC for dominant markers was reported to be less than 0.5; most markers in this study had a PIC of 0.4, indicating that these markers contain useful information and distribution in onion genotypes’ genome level. A view of the bands generated by the various markers is shown below (Figure 15).
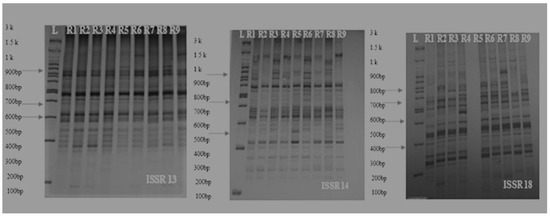
Figure 15.
Allelic pattern of some ISSR markers on the nine cultivars of onion (L: Lader (3 Kb), R1: Mirela, R2: Sarze, R3: Sarkoreh, R4: Azarshahr, R5: Soberana, R6: Esfahan, R7: Kurdistan, R8: Kerman, R9: White Gorgan).
3.4.2. Relationships between the Iranian Onion Landraces and the Commercial Short-Day Species
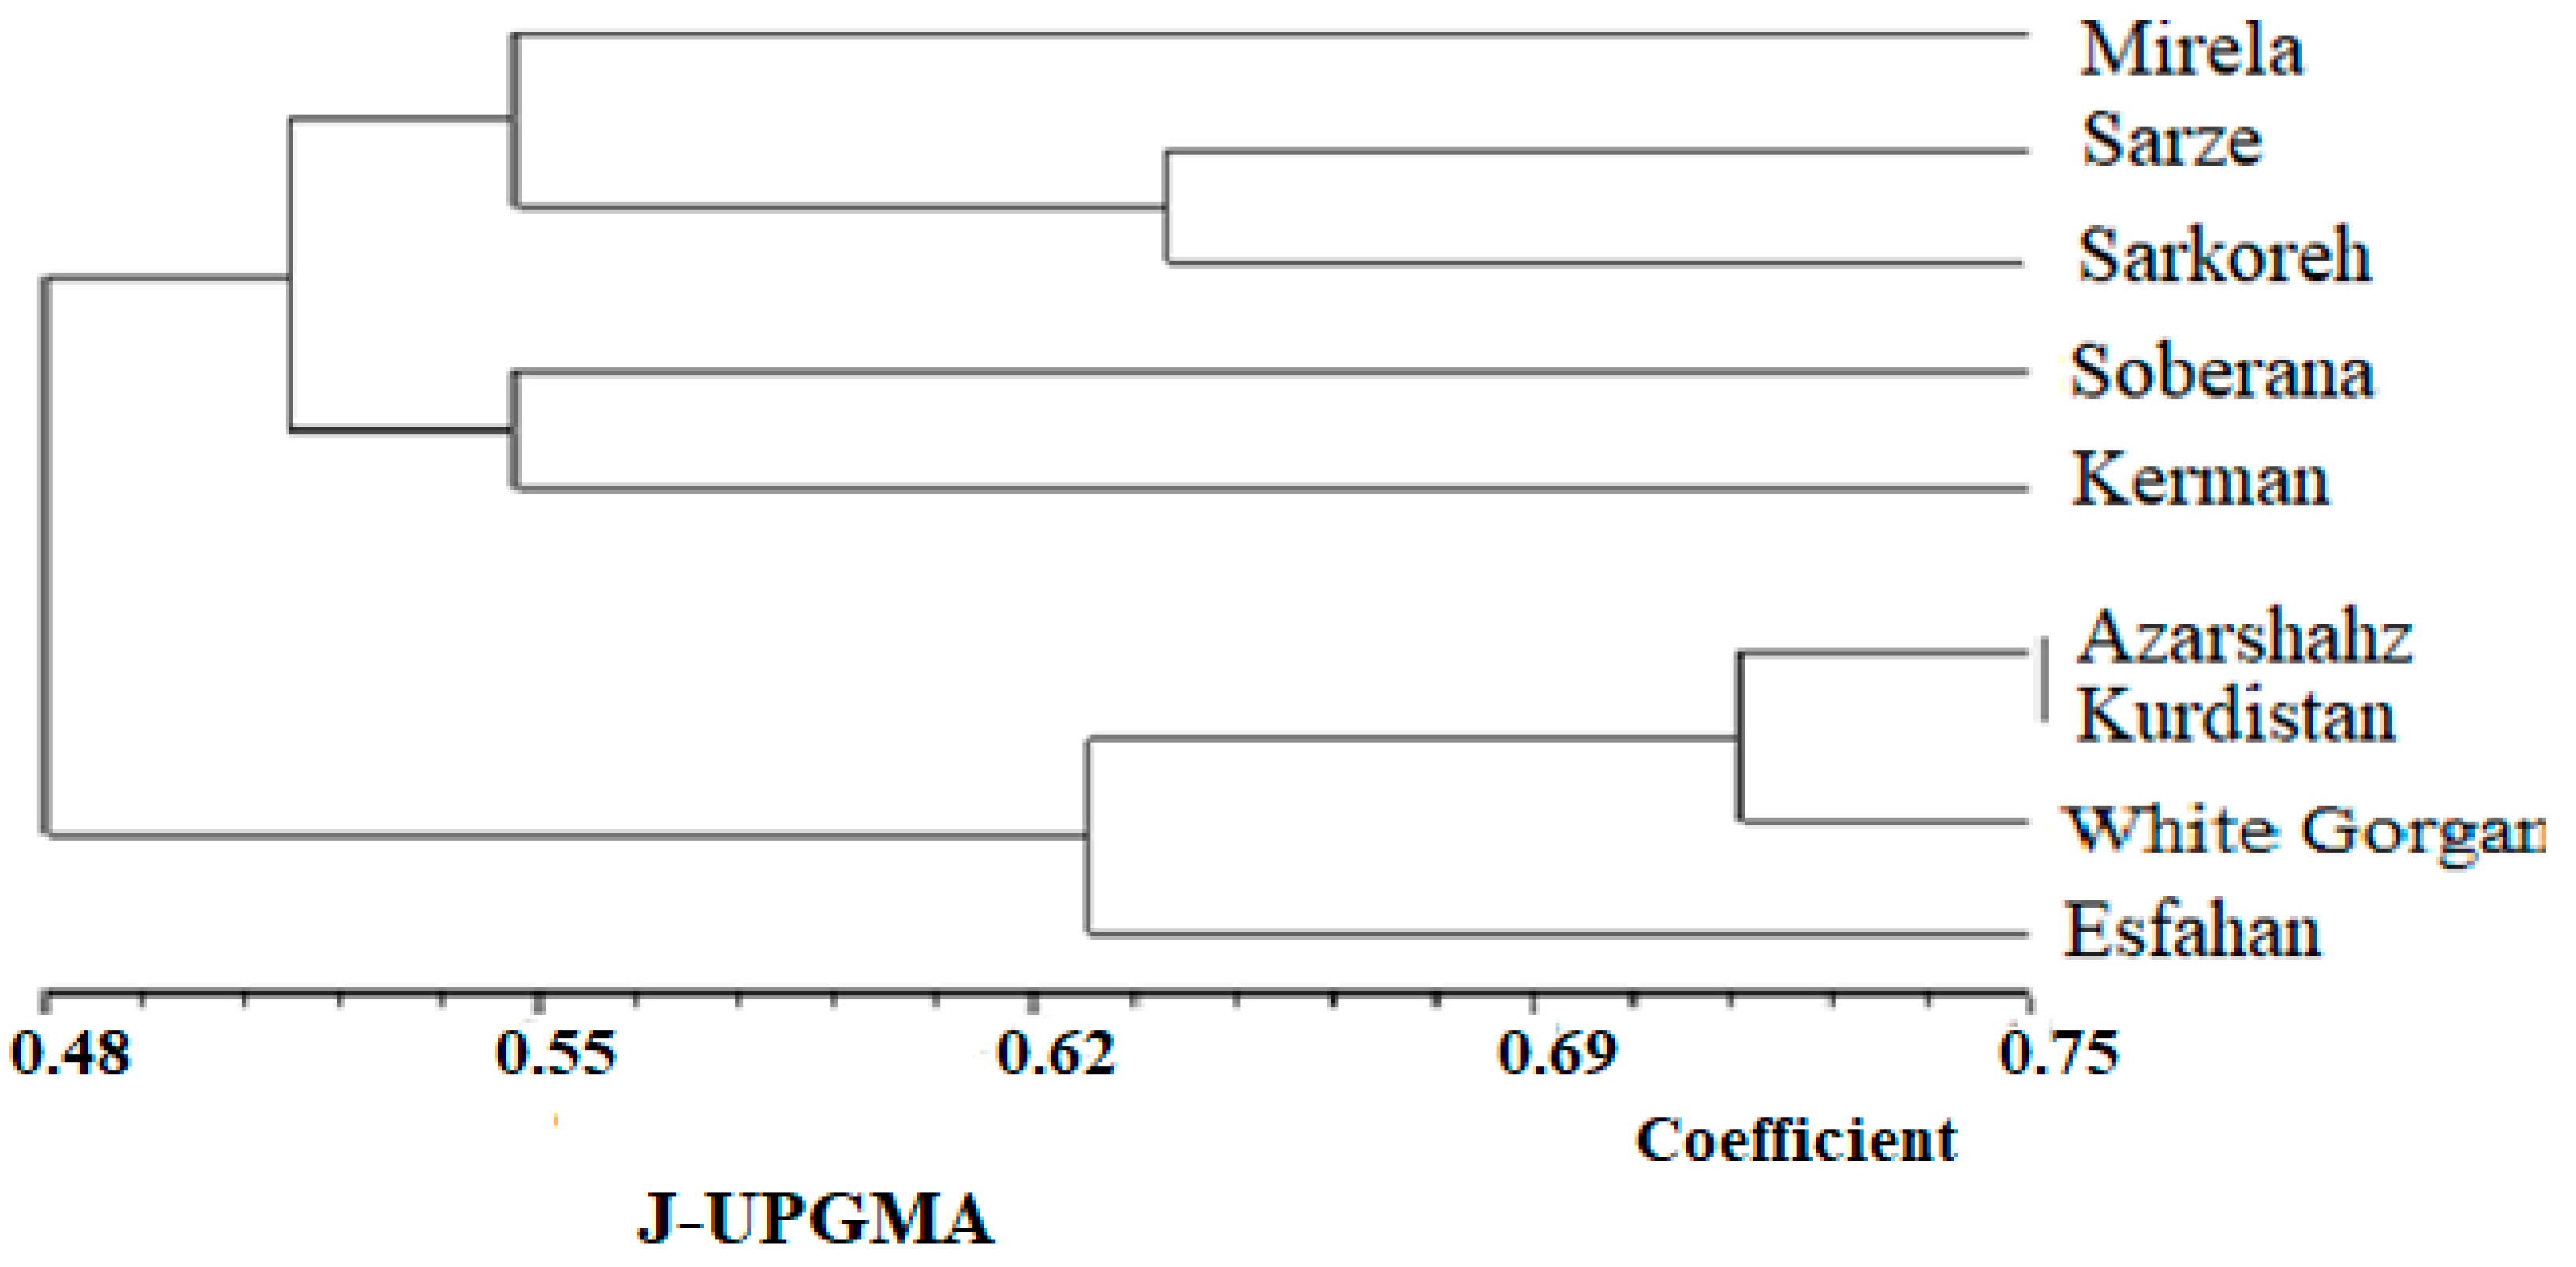
The UPGMA dendrogram grouped the nine Allium accessions into two main clusters, with each cluster representing some of the Allium species (Figure 16). Clusters CI contained all landraces that originated from south regions of Iran (tropical climate and low latitude) with commercial short-day varieties, and Clusters C II included landraces that originated from the North and West region, which have a temperate and cold climate (high latitude), respectively. Cluster CI contained two subclusters, including (R1, R2, R3, and R5) group and R4 group. Two subclusters belonging to the short-day onion species, including landraces that originated from south regions of Iran and two commercial short-day varieties, and were two neighbor groups with maximum similarity based on altitude characters, indicating that commercial short-day onions and landraces originated from the South region of Iran might have a common ancestor. Mallor et al. [6] grouped 91 onion genotypes into six clusters based on molecular diversity analysis. DNA-based markers are more suitable tools for discriminating variation within crop germplasms and studying genetic relationships rather than biometrical and agronomic data. On the other hand, the cultivars’ clustering pattern and biometrical-agronomic screen were not completely obtained according to their geographical origin. Kerman and Esfahan showed similar biometrical and agronomic behavior despite different geographical origin and being located in different clusters. This phenomenon could be indicative of an extensive germplasm resource exchange among farmers from different geographical regions. Additionally, biometrical and agronomic traits appear as a result of the expression of genes that cover a limited part of the genome, while the molecular study examines all parts of the genome [32]. Nevertheless, some accessions from similar geographical locations were closely grouped. Gupta et al. [40] reported that the distribution of cultivars between different clusters, despite their same origin, is connected with the wide genetic base of genotypes from the same origin. Additionally, the low level of association between genetic diversity and geographic distribution is due to less representation of accessions from a particular area and should be uniformly studied. Dehdari et al. [41] also reported a lack of association between biometrical and agronomic traits and origin. To overcome the problem associated with phenotypic-based parental selection, DNA-based markers were previously proven to be extremely useful for all marker kinds. Kutty et al. [42], applying 90 RAPD primers, grouped 24 onion cultivars into two separate groups. The first cluster consisted of cultivars from the northern region, and the second consisted of cultivars from the southern region of India. Thirty-two germplasm resources of onion were analyzed with SSR markers and germplasms were divided into five groups [43].
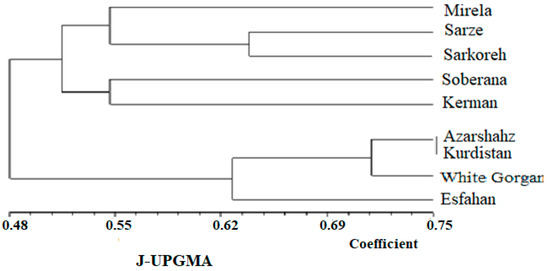
Figure 16.
Dendrogram obtained from the nine cultivars of onion with UPGMA based on Jaccard’s coefficient using ISSR primers.
The similarity values in terms of genetic distance ranged from 0.325 to 0.61 (Figure 16).
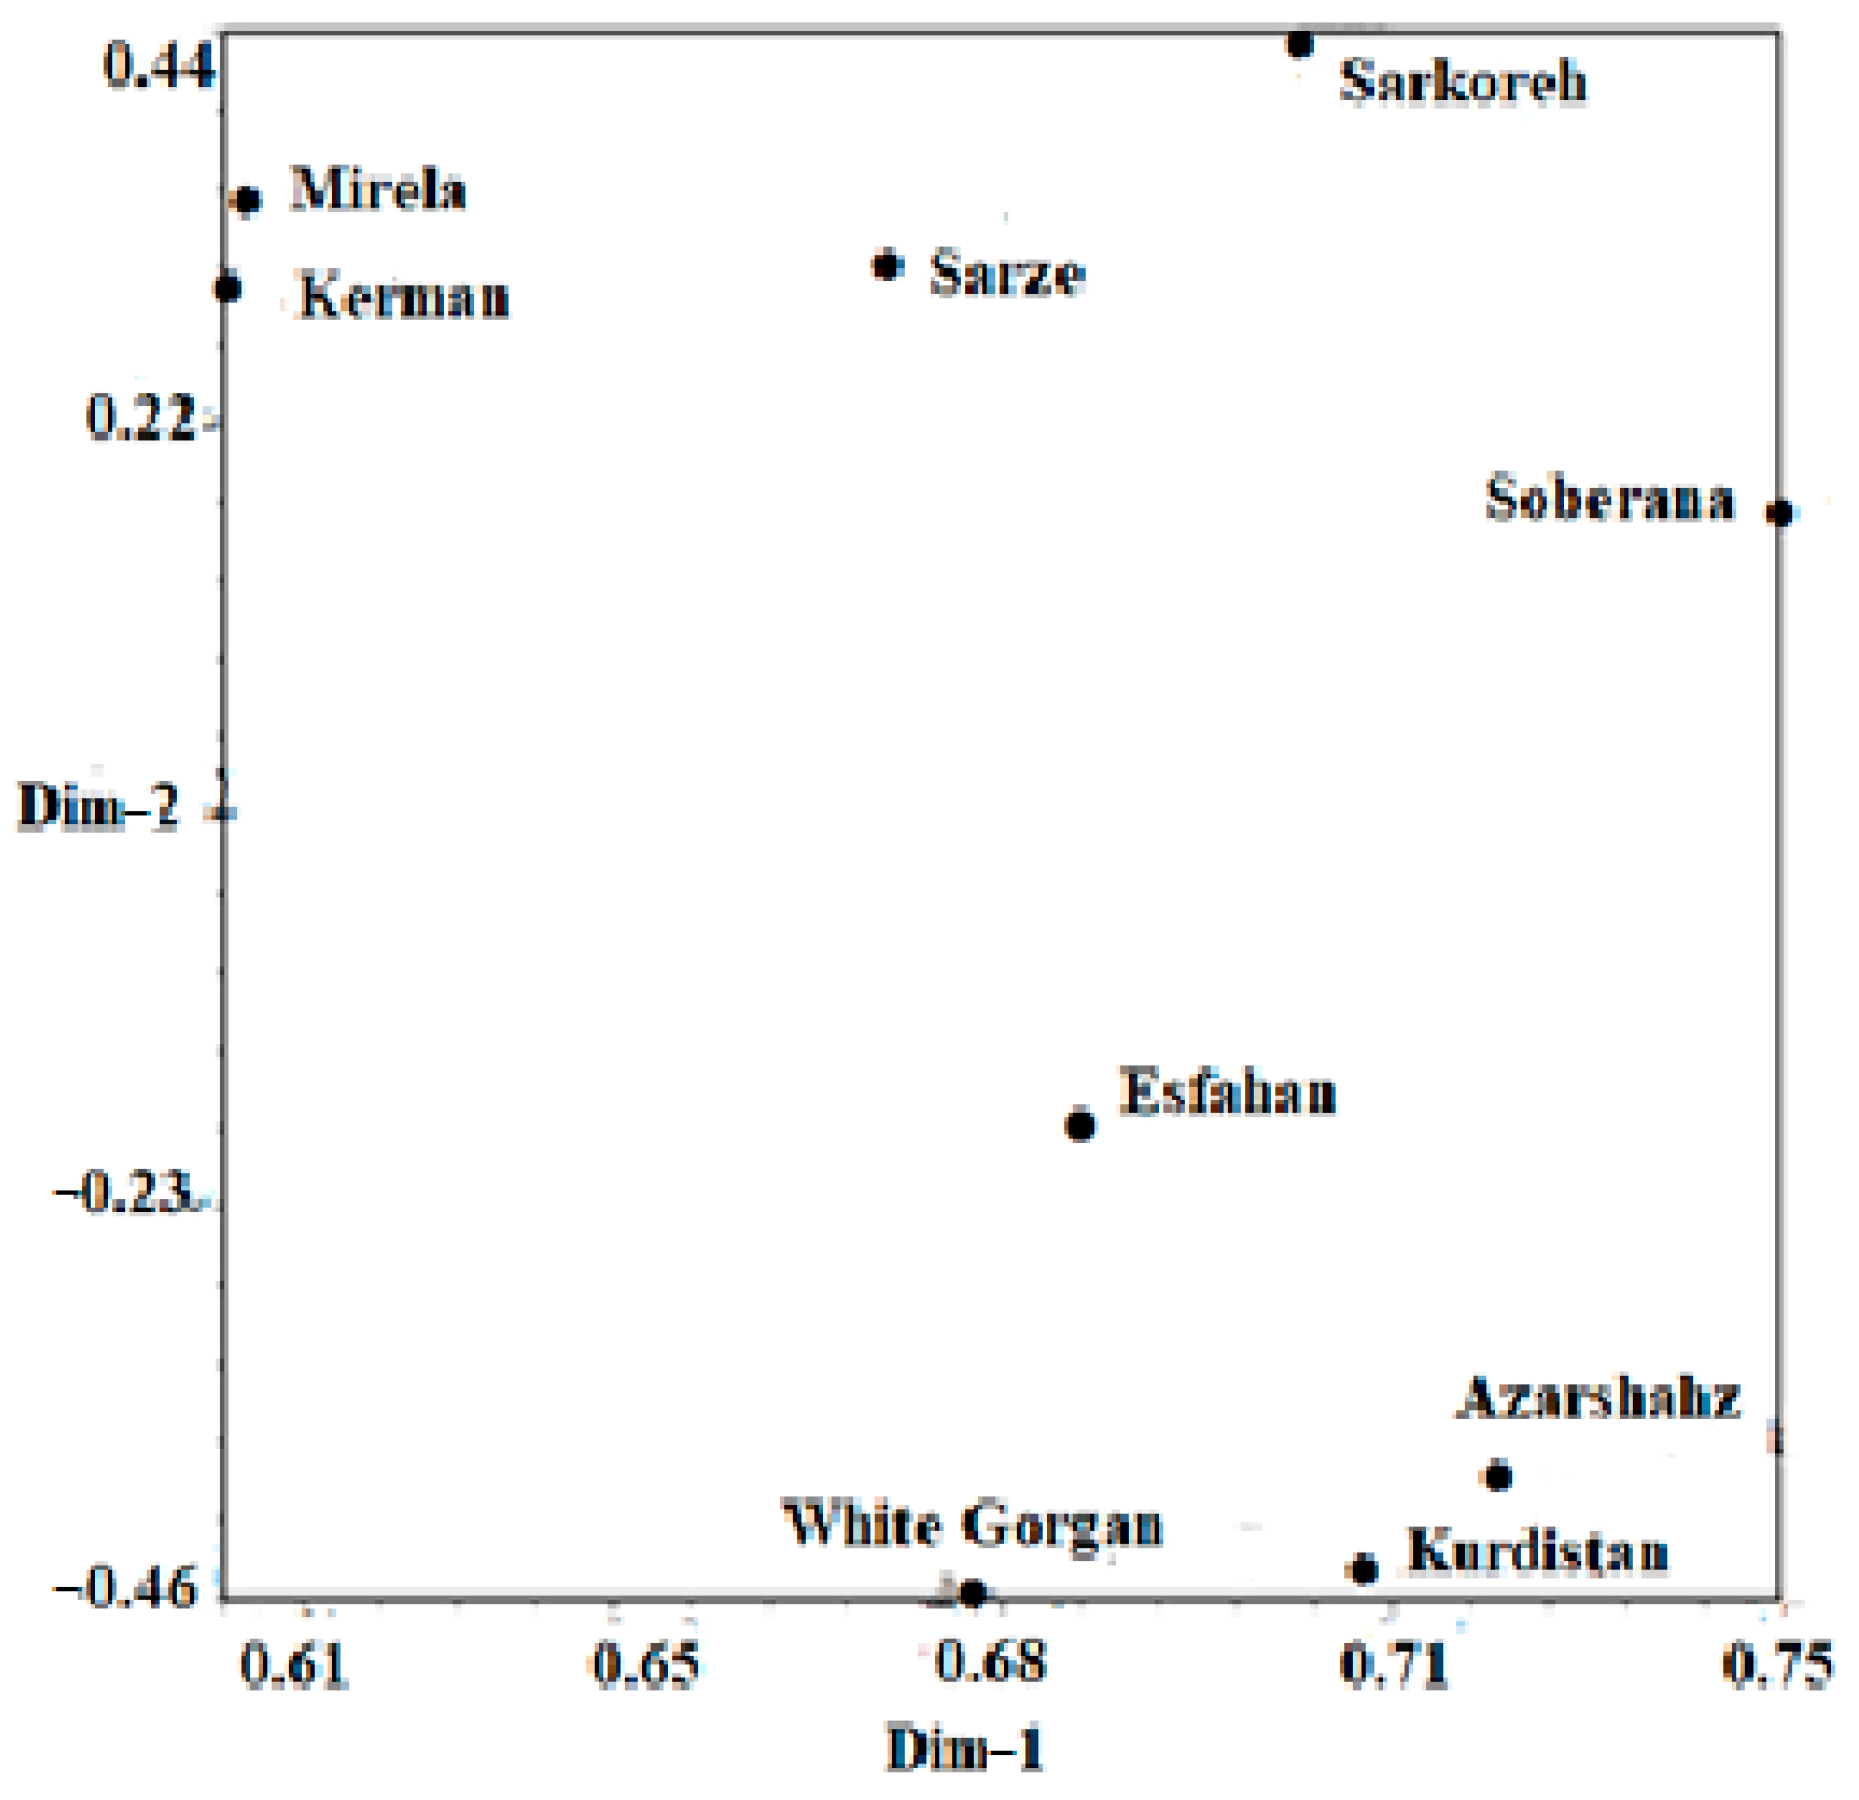
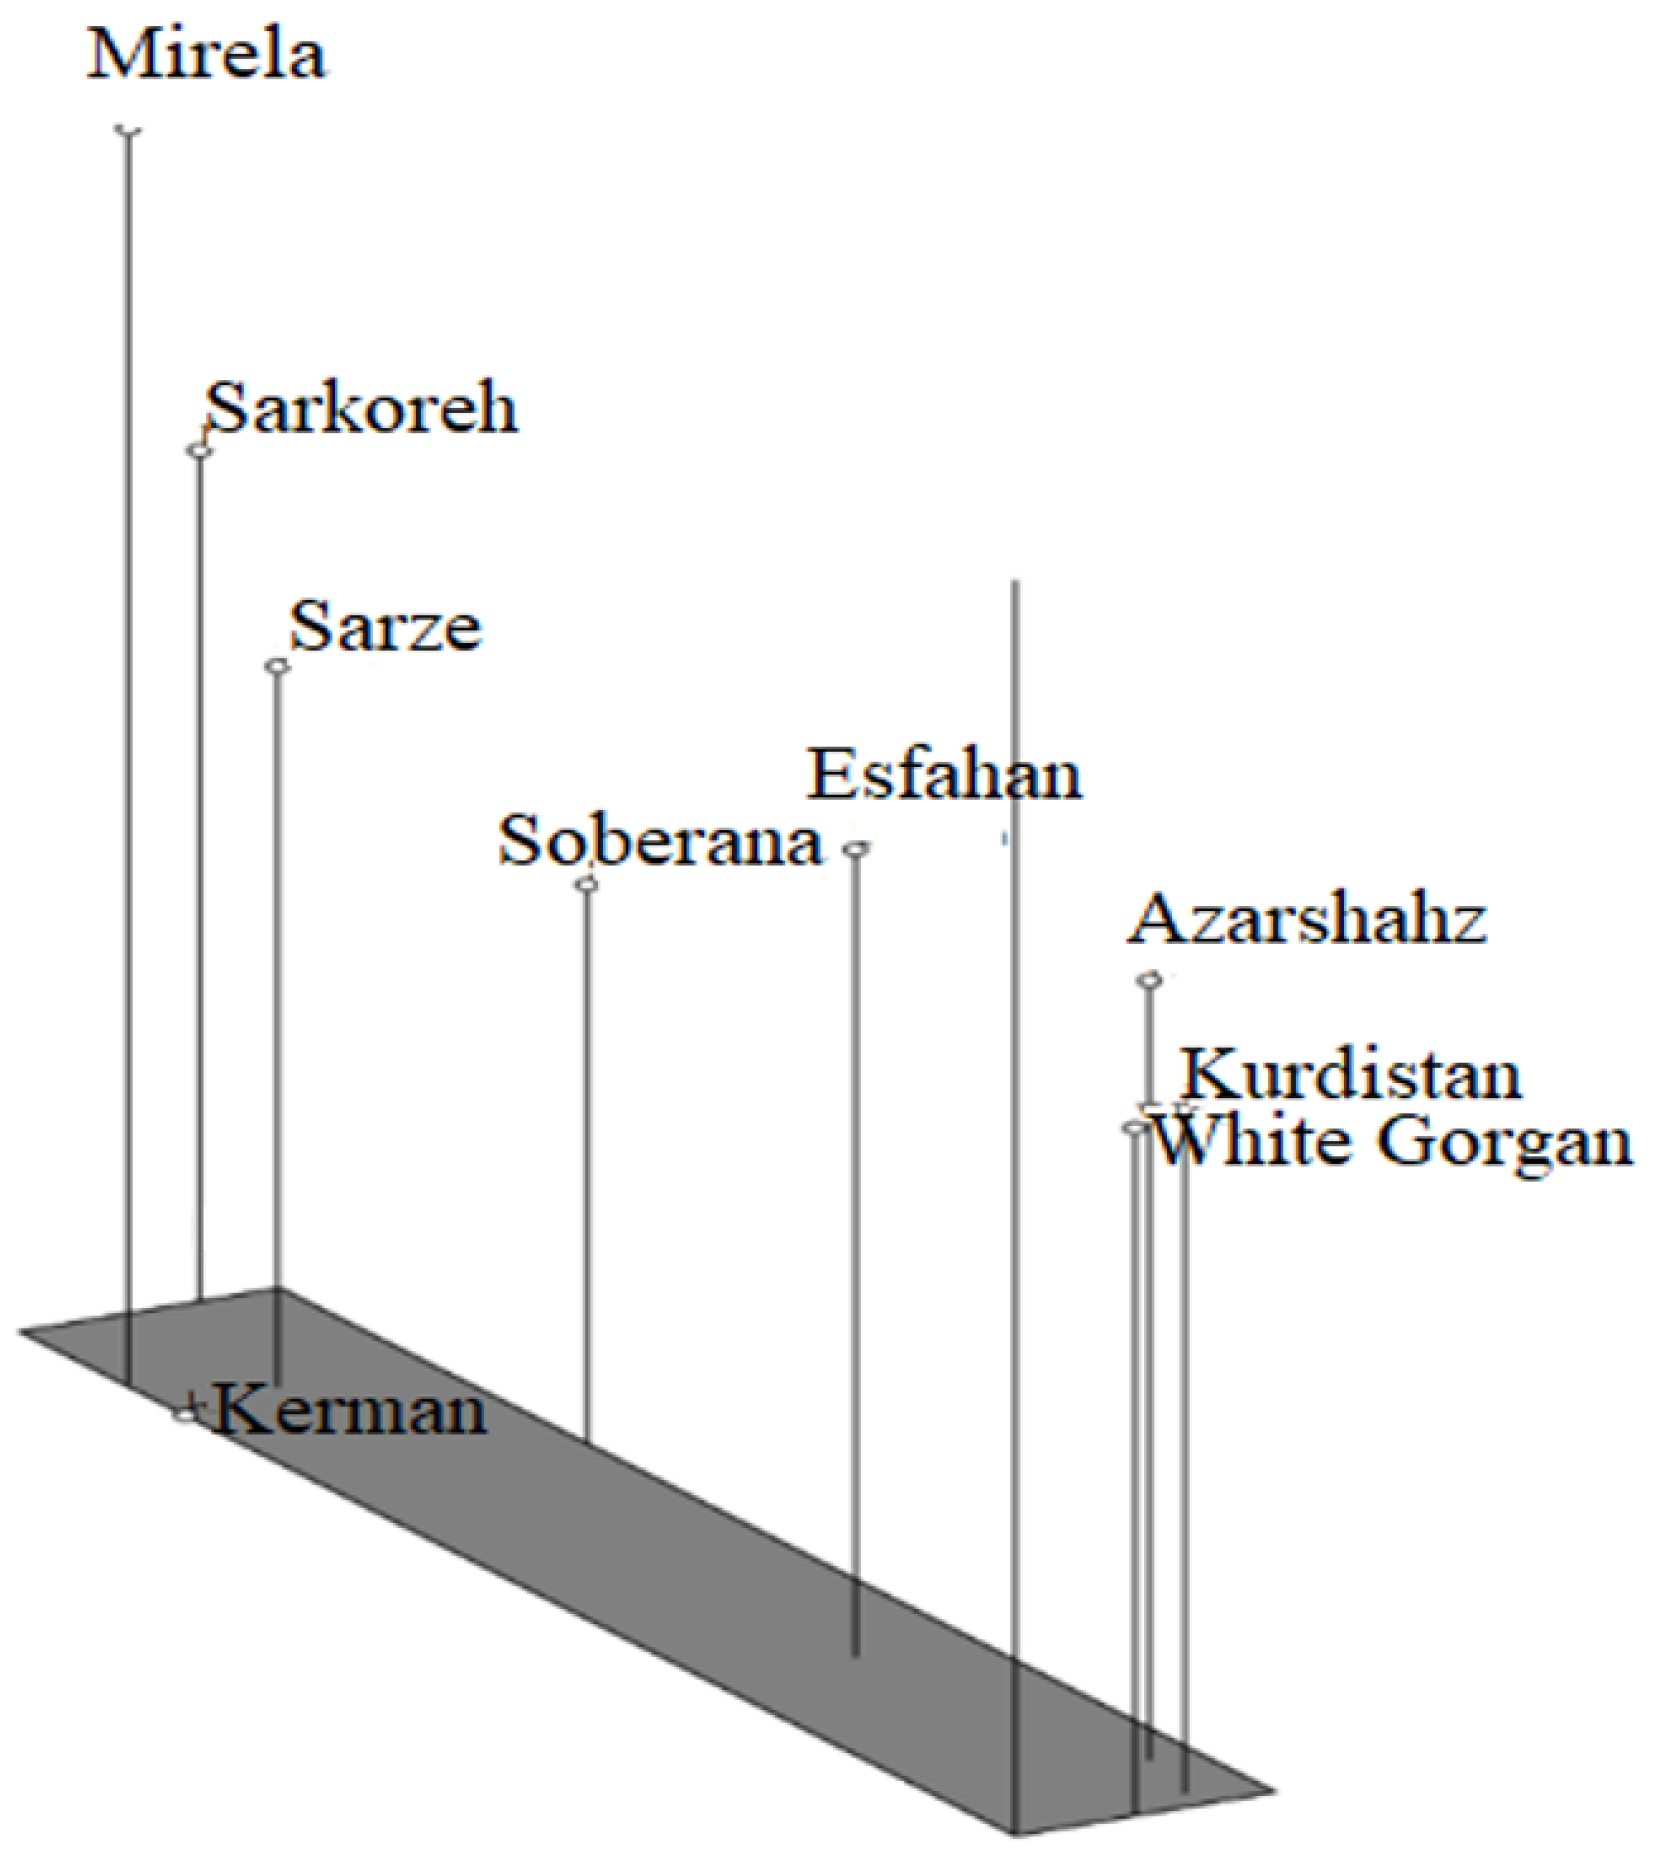
Based on the mentioned results, it can be inferred that cultivars investigated in this study are different from each other, so that they can contain novel genetic components. It can be concluded from our findings that the molecular analysis using ISSR markers was extremely powerful for studying the genetic relationship among the nine cultivars of onion. Observation using the UPGMA dendrogram (Figure 16) showed that cultivars originating from south regions of Iran including Sarze, Sarkoreh, and Kerman, with short-day varieties, Mirela and Soberana, are in a group with similar physiological responses to day lengths. The other cultivars originating from temperate and cold regions of Iran (north, west), White Gorgan, Azarshahr, Esfahan, and Kurdistan, are in another group that has similar physiological behavior. Both the biometrical and agronomic characterization and the molecular analysis performed in this study provide valuable information for curators and for increasing germplasm use by researchers and onion breeders requesting samples. Analysis of the main coordinated components of PCoA to investigate the distribution of the ISSR marker as a complementary method for cluster analysis showed that the components of the graph corresponded with the grouping obtained from cluster analysis by the UPGMA method (Figure 17). The results of the three-dimensional PCoA diagram of Azarshahr, Kurdistan, White Gorgan, and Isfahan varieties are clearly separated from the native varieties of the southern regions of the country and short-day hybrid varieties (Figure 18). The placement of these varieties together in two neighbor clusters is due to the genetic proximity and their compatibility with cold regions of high latitudes [43].
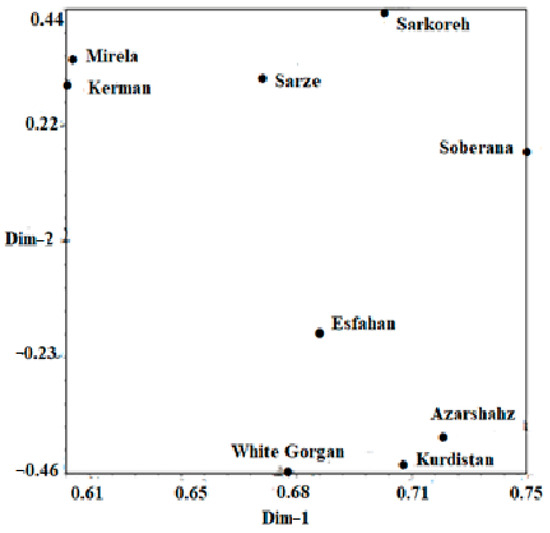
Figure 17.
Two-dimensional PCOA diagram of nine onion varieties based on Jaccard similarity coefficient obtained from ISSR data.
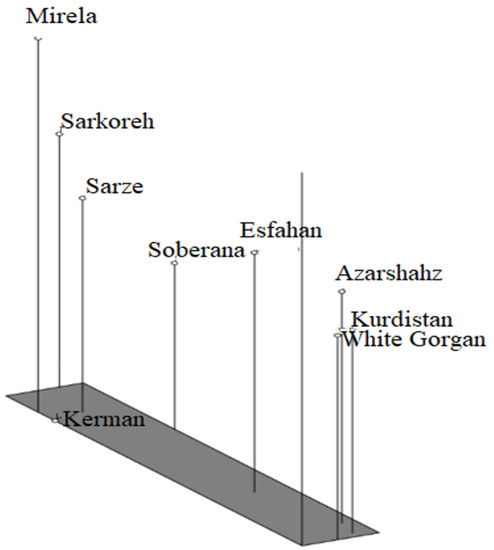
Figure 18.
Three-dimensional PCOA diagram of nine onion varieties based on Jaccard similarity coefficient obtained from ISSR data.
3.4.3. Cluster Analysis of Biometrical and Agronomic Traits
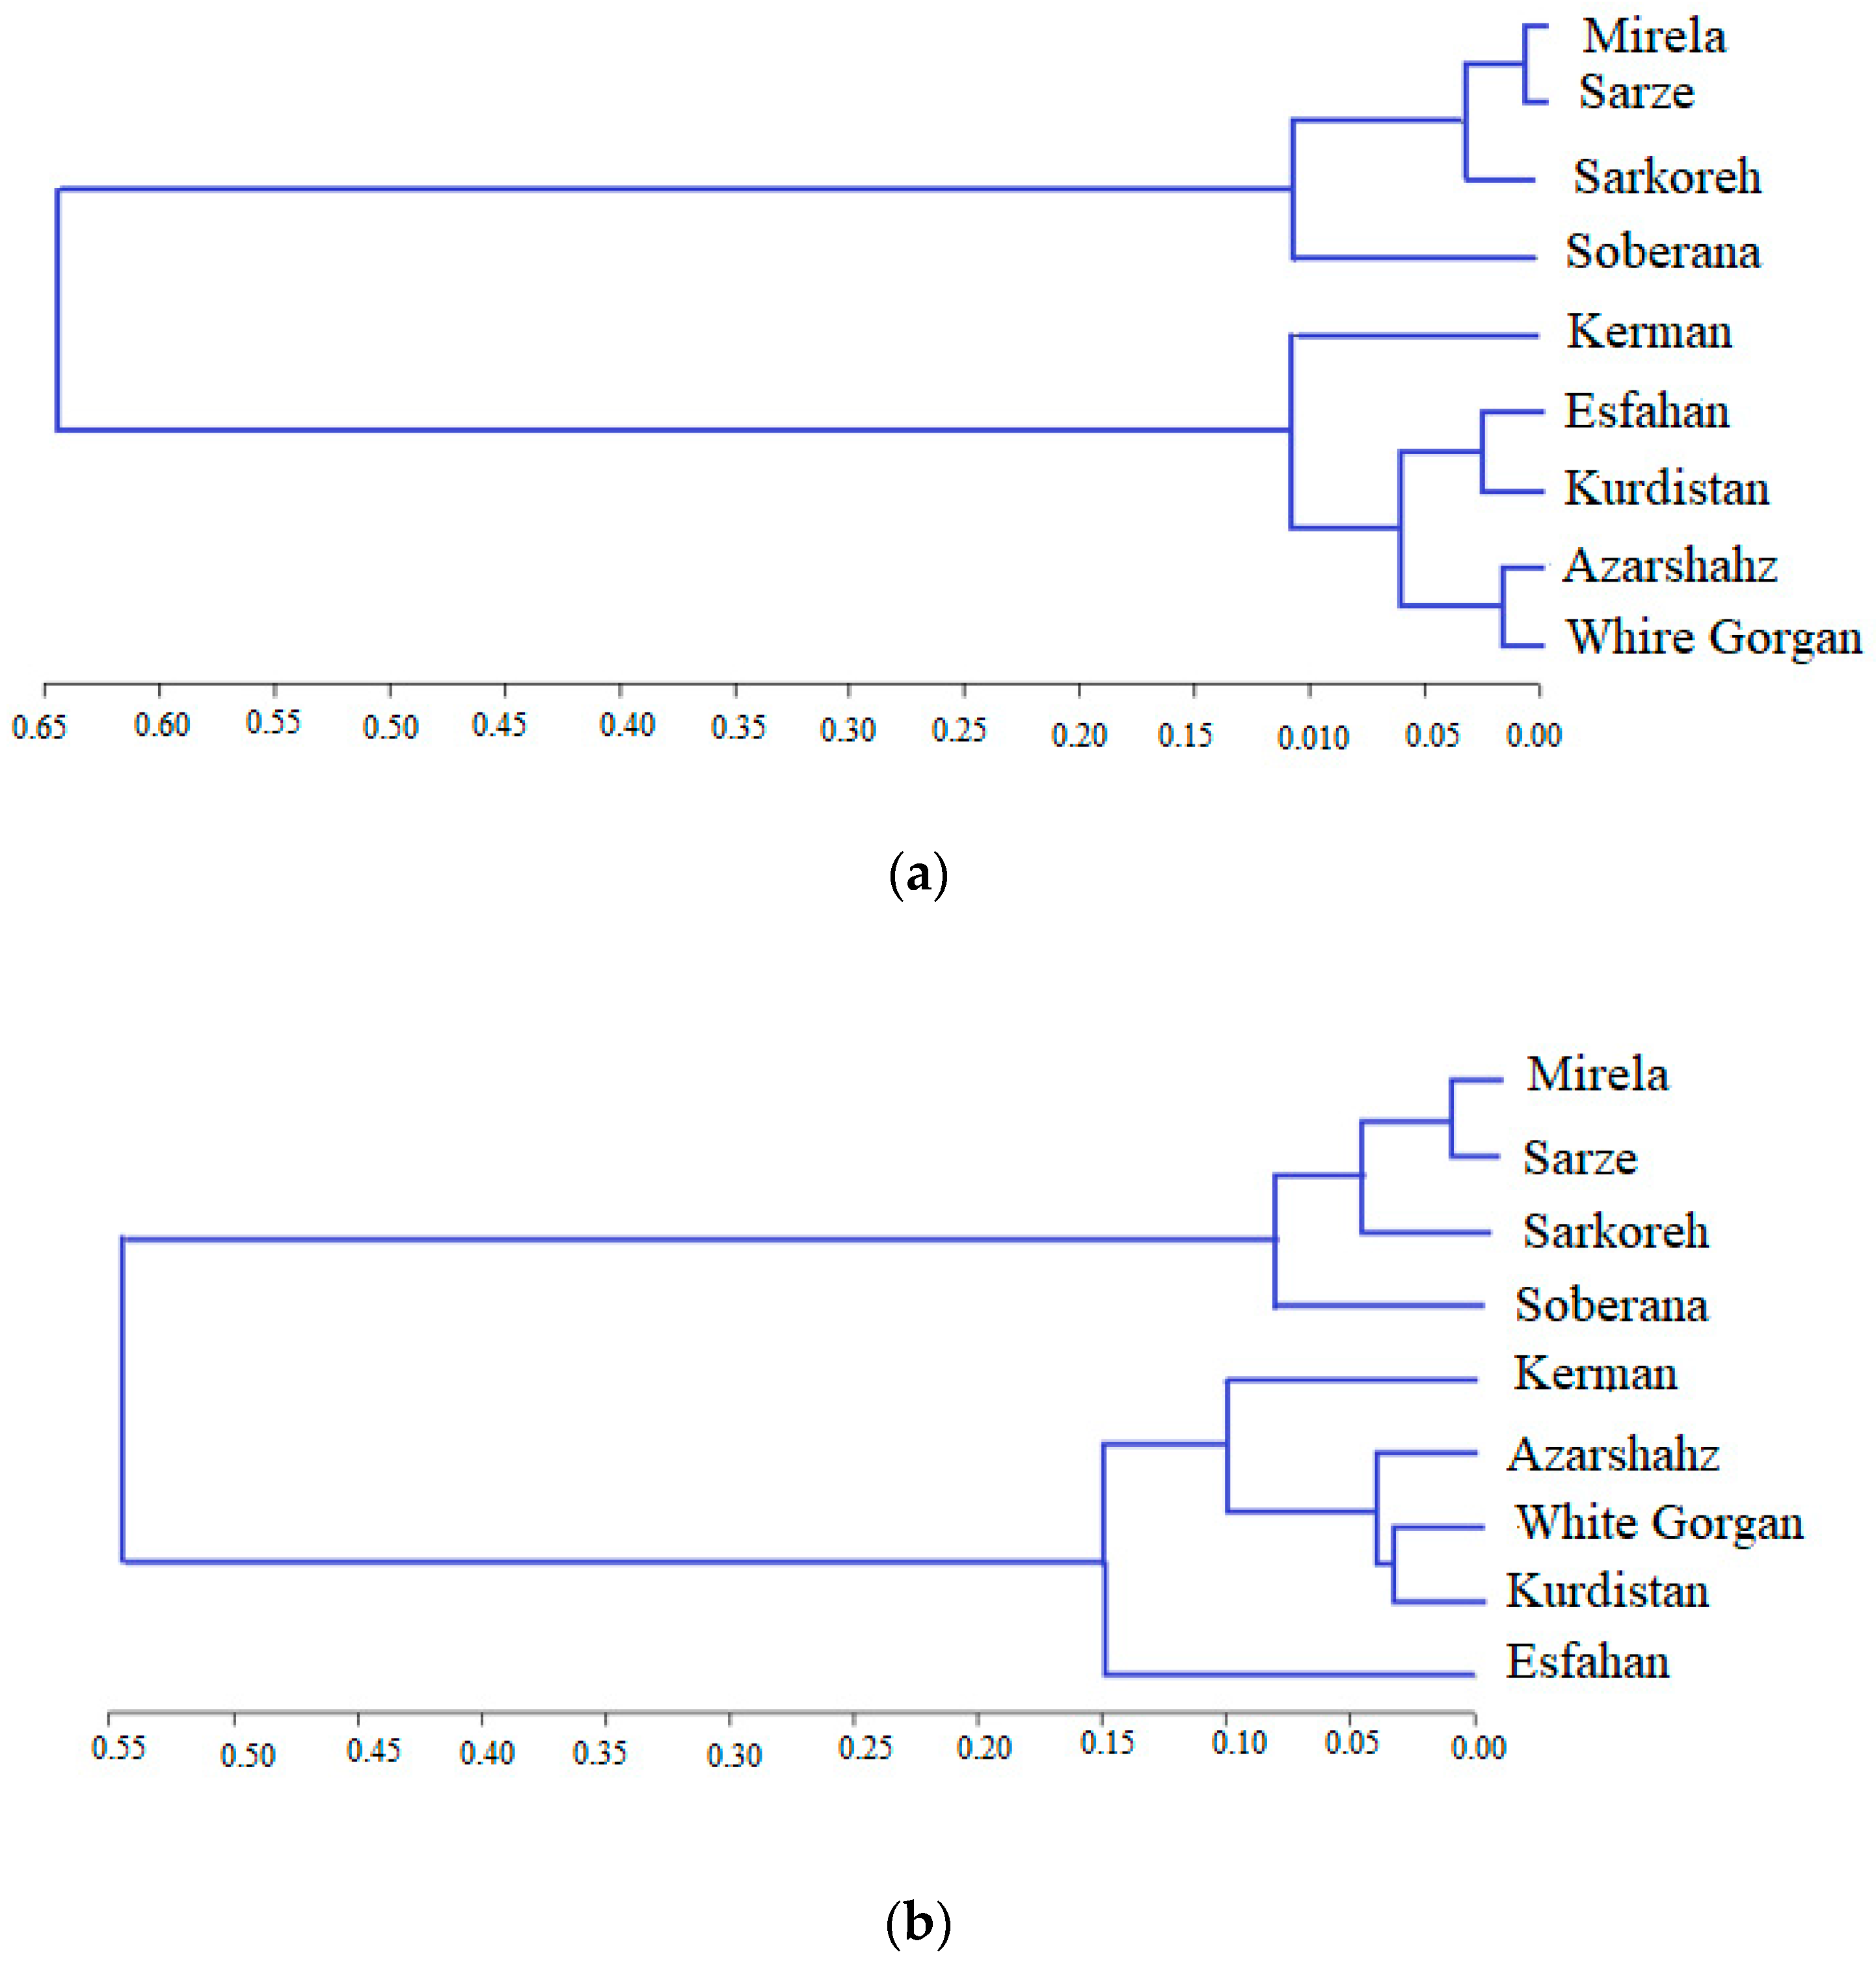
The cluster analysis based on biometrical and agronomic traits and similar photoperiodic behavior allowed for distributing the varieties in two groups and four subgroups, with a geographically close distance of produce (Figure 19).
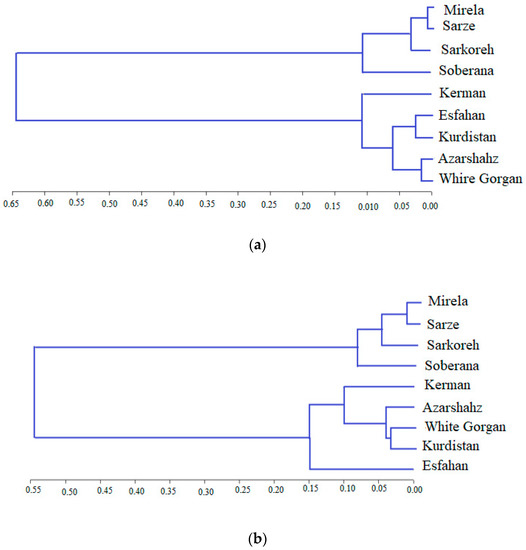
Figure 19.
Cluster analysis of onion varieties based on biometrical and agronomic traits by Ward method at the first (a) and the second (b) sowing date.
Cultivars Azarshahr, Kurdistan, White Gorgan, and Isfahan can be justified in a cluster due to their closer geographical distance. The location of Kerman variety next to Azarshahr, White Gorgan, and Kurdistan varieties showed an inconformity between bioimetrical-agronomic and geographical diversity. The biometrical and agronomic characteristics of the plant are affected by environmental conditions and are not fixed in contrast to molecular markers [44]. The inconformity of biometrical-agronomic diversity from geographical diversity was reported in a study comparing 20 onion genotypes, based on biometrical and agronomic traits, due to the transfer of native varieties from one region to another and cultivation in the destination region [41], as well as the nature of onion free-spraying [45]. In general, different genetic bases of onion varieties caused different biometrical and agronomic behaviors [46,47].
3.4.4. Cluster Analysis of Phytochemical Traits
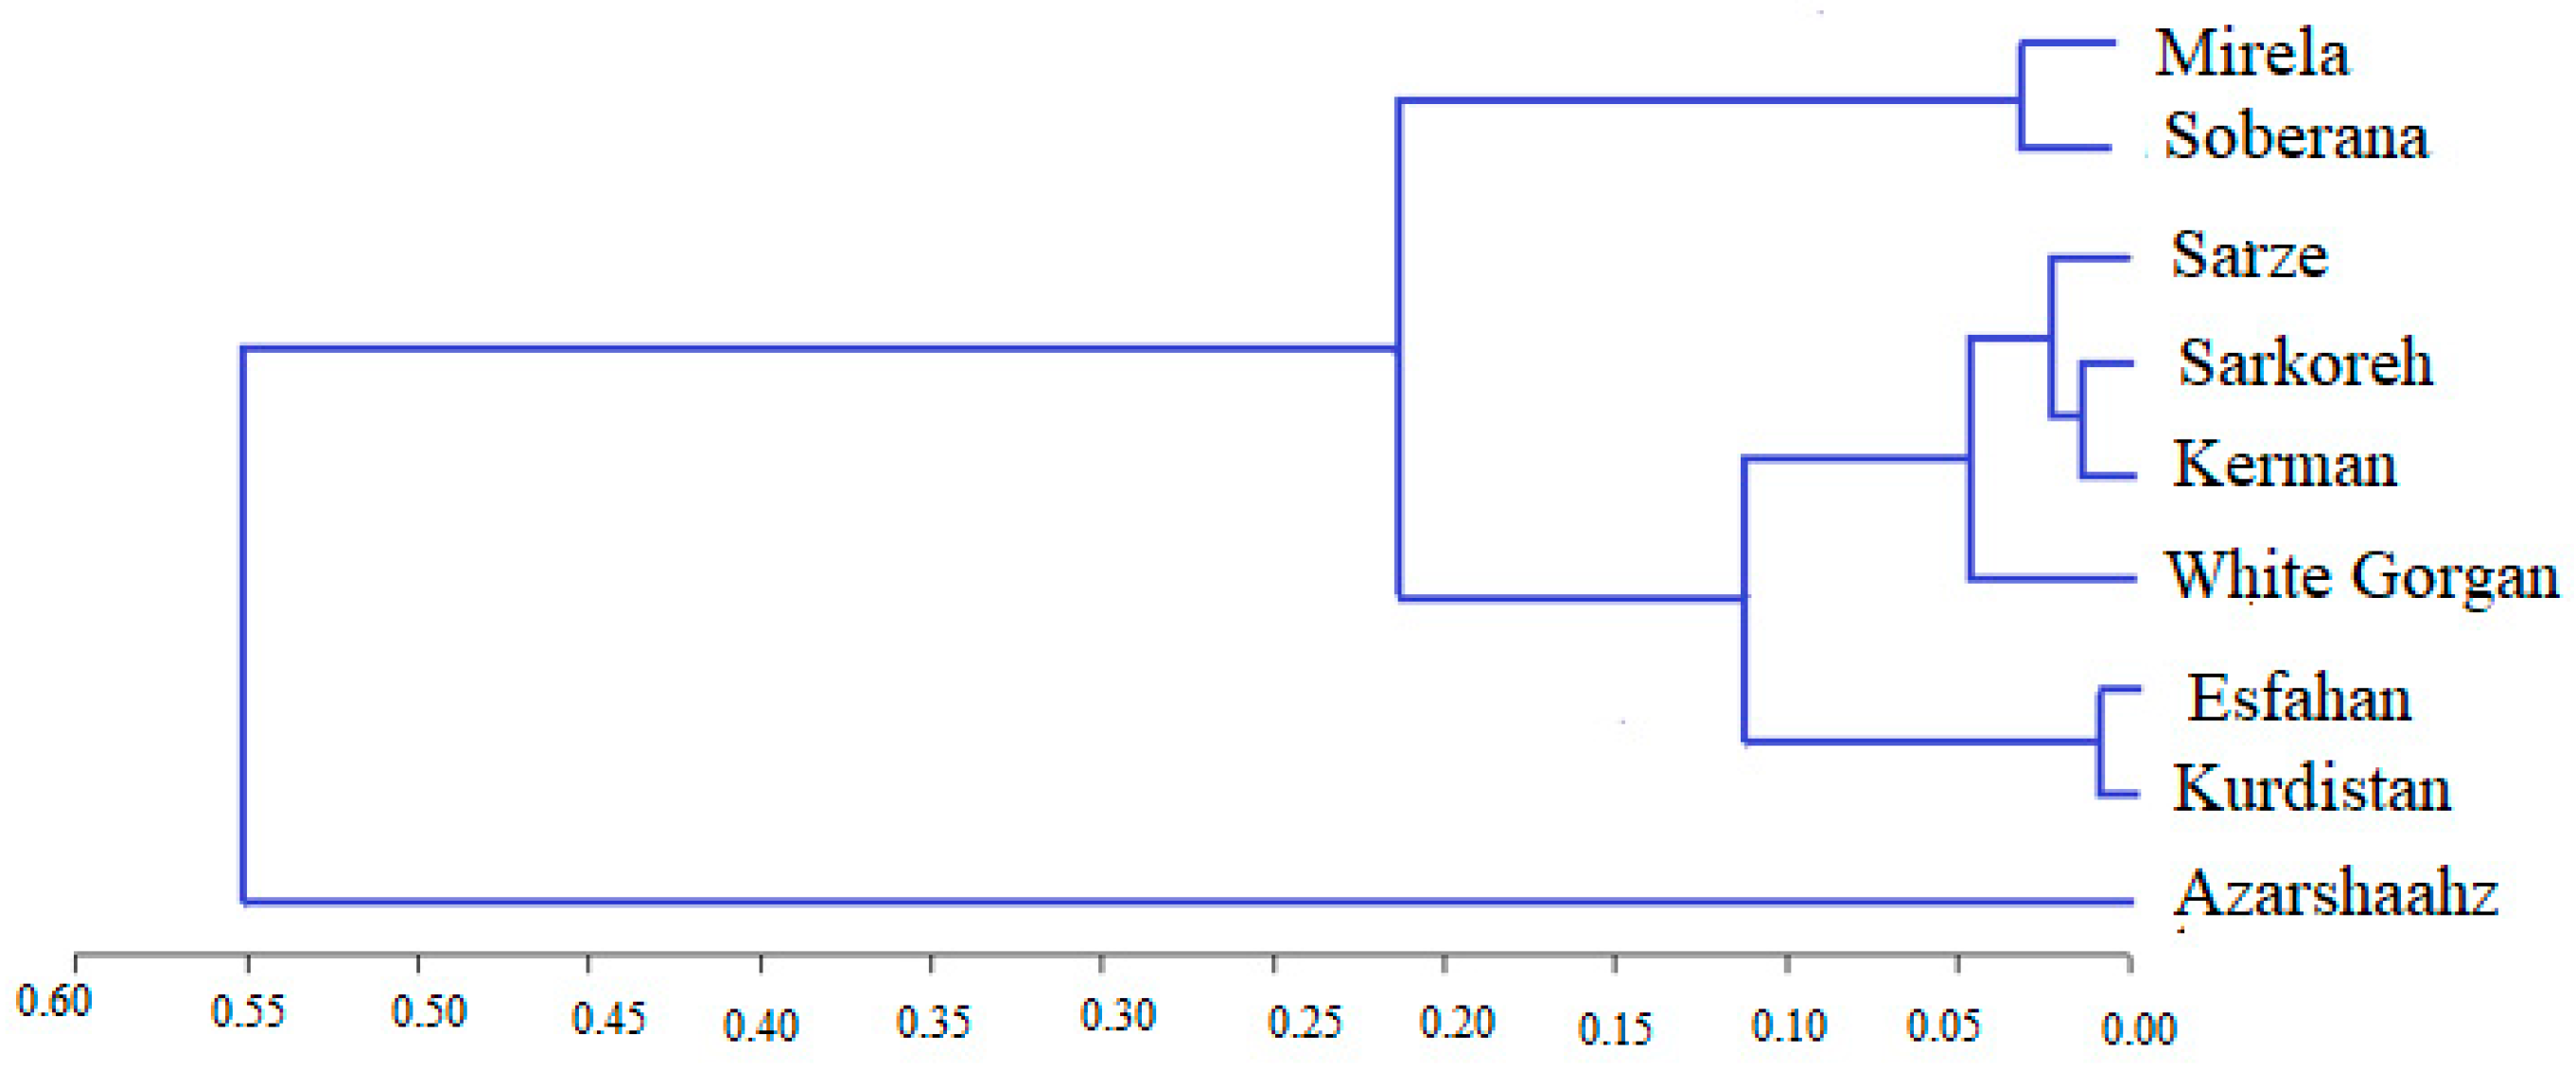
Cluster analysis based on phytochemical traits divided accessions into two main clusters. The first one combines two subgroups: (1) of Mirela and Soberana and (2) of Sarze, Sarkoreh, Kerman, White Gorgan, Esfahan, and Kurdistan cultivars. Azarshahr cultivar composed cluster 2 (Figure 20). The comparison of Figure 19 and Figure 20 data suggests that cluster analysis of varieties based on phytochemical traits does not match with the biometrical, agronomic and genetic clustering of varieties as short-day and long-day varieties are located in Cluster I while Azarshahr is located in Cluster II.
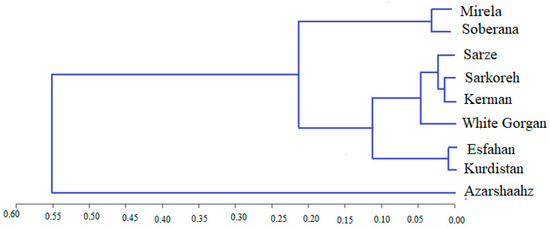
Figure 20.
Cluster analysis of onion varieties based on phytochemical traits by Ward method at the second sowing date.
At present, old varieties are being replaced by the modern varieties sold by international seed companies, particularly F1 hybrids showing a narrow genetic base. Local landraces are less spread out than the short-day hybrids and are often close to extinction. Molecular data along with physiological responses of varieties suggested that the replacement of local landraces originating from low latitudes of Iran are valuable genetic resources and, therefore, a possible alternative to commercial short-day onions, even to preserve the local germplasm resource.
4. Conclusions
The utilization of molecular markers for the nine Iranian onion landraces and varieties provided an accurate determination of the genetic variability and population structure, while the combination of molecular technique with biometrical and agronomic screening resulted in a more effective outcome. The results demonstrated the potential ability of ISSR markers to assess genetic diversity among varieties. The onion landraces originating from the low latitudes of south regions of Iran (Sarze, Sarkoreh, and Kerman, and the short-day hybrids Mirela and Soberana), included in the same group, showed high genetic similarity, expressed in close physiological responses to day lengths and temperatures during the crop cycle and bulbing stage initiation at day length between 11 and 12 h. The landraces from high latitudes (Azarshahr, White Gorgan, Kurdistan, and Esfahan) displayed low biometrical, agronomic and genetic similarity with commercial short-day onions, which is connected with different reactions to day lengths and temperature.
Cultivars Azarshahr, Kurdistan, and Esfahan showed higher antioxidant status than the short-day hybrids and local landraces, providing important sources of valuable phytochemicals, suitable for onion breeding with high quality parameters. Maintenance and enhancement of local landrace productivity and sustainability relates to high prospects of their utilization as an alternative to foreign F1 hybrid varieties.
Author Contributions
Z.K. and K.M. conceived the experimental protocol and were involved in the bibliographic search, data critical analysis, and statistical processing, as well as writing the draft and final version of the manuscript; S.J.M. and K.Z.N. contributed to the bibliographic search and critical revision of the final manuscript version; N.G. and G.C. participated in data critical analysis as well as writing and revising the final manuscript version. All authors have read and agreed to the published version of the manuscript.
Funding
This research received no external funding.
Institutional Review Board Statement
Not applicable.
Data Availability Statement
Not applicable.
Conflicts of Interest
The authors declare that they have no conflict of interest.
References
- King, J.J.; Bradeen, J.M.; Bark, O.; McCallum, J.A.; Havey, M.J. A low-density genetic map of onion reveals a role for tandem duplication in the evolution of an extremely large diploid genome. Theor. Appl. Genet. 1998, 96, 52–62. [Google Scholar] [CrossRef]
- Vavilov, N.I. Origin and Geography of Cultivated Plants; English Translation by D Love 1992; Cambridge University Press: Cambridge, UK, 1926. [Google Scholar]
- Brewster, J.L. Environmental physiology of the onion: Towards quantitative models for the effects of photoperiod, temperature and irradiance on bulbing, flowering and growth. Acta Hortic. 1997, 433, 347–374. [Google Scholar] [CrossRef]
- Malik, G.; Dhatt, A.; Malik, A.A. A Review of Genetic Understanding and Amelioration of Edible Allium Species. Food Rev. 2020, 37, 415–446. [Google Scholar] [CrossRef]
- Astley, D. Conservation of genetic resources. In Onions and Allied Crops; Rabinowitch, H.D., Brewster, J.L., Eds.; CRC Press: Boca Raton, FL, USA, 1990; Volume 1, pp. 177–198. [Google Scholar]
- Mallor, C.; Arnedo-Andres, M.S.; Garces-Claver, A. Assessing the genetic diversity of Spanish Allium cepa landraces for onion breeding using microsatellite markers. Sci. Hortic. 2014, 170, 24–31. [Google Scholar] [CrossRef]
- Mettananda, K.A.; Fordham, R. The effects of 12 and 16 h daylength treatments on the onset of bulbing in 21 onion cultivars (Allium cepa L.) and its application to screening germplasm for use in the tropics. J. Hortic. Sci. Biotechnol. 1997, 72, 981–988. [Google Scholar] [CrossRef]
- Khokhar, K.M. Environmental and genotypic effects on bulb development in onion. A review. J. Hortic. Sci. Biotechnol. 2017, 92, 448–454. [Google Scholar] [CrossRef]
- Hall, K.D.; Holloway, R.L.; Smith, D.T.; Anciso, J.; Troxclair, N.; Black, M. Texas Crop Profile-Onions; AgriLife Extension Service Publication E-18; Texas A&M University: Austin, TX, USA, 2011; Available online: http://upshur.agrilife.org/files/2011/03/Onions.pdf (accessed on 3 February 2023).
- Lee, E.J.; Yoo, K.S.; Leskovar, D.; Patil, B.S. Effects of leaf cutting on bulb weight and pungency of short-day onions after lifting the plants. Sci. Hortic. 2019, 257, 108720. [Google Scholar] [CrossRef]
- Mobli, M.; Aslani, L. Research on edible onion in Iran. Strateg. Res. J. Agric. Sci. Nat. Resour. 2019, 3, 153–168. [Google Scholar]
- Kik, C. Allium genetic resources with particular reference to onion. Acta Hortic. 2008, 770, 135–138. [Google Scholar] [CrossRef]
- Rashid, M.H.; Islam, M.A.K.; Mian, M.A.K.; Hossain, T.; Kabir, M.E. Multivariate analysis in onion (Allium cepa L.). Bangladesh J. Agric. Res. 2013, 37, 573–582. [Google Scholar] [CrossRef]
- Fabriki Ourang, S.; Shams Bakhsh, M.; Jalali Javara, M.; Ahmadi, J. Analysis of genetic diversity of Iranian melons (Cucumis melo L.) using ISSR markers. Iran. J. Biol. 2009, 22, 57–68. [Google Scholar]
- Lancaster, J.E.; Triggs, C.M.; Deruiter, J.M.; Gandar, P.W. Bulbing in onions: Photoperiod and temperature requirements and prediction of bulb size and maturity. Ann. Bot. 1996, 78, 423–430. [Google Scholar] [CrossRef]
- Ikeda, H.; Tsukazaki, H. Expression analysis of bulb development-related genes in onion cultivars. Acta Hortic. 2021, 1312, 31–36. [Google Scholar] [CrossRef]
- Dantata, I.J. Bulb Moisture, Ash and Dry Matter Contents of Onion Provenances in Northern Bauchi, Nigeria. Asian J. Appl. Sci. 2014, 2, 368–374. [Google Scholar]
- Doyle, J.J.; Doyle, J.L. A rapid DNA isolation procedure for small quantities of fresh leaf tissue. Phytochem. Bull. 1987, 19, 11–15. [Google Scholar]
- Meda, A.; Lamien, C.E.; Romito, M.; Millogo, J.; Nacoulma, O.G. Determination of the total phenolic, flavonoid and pralin contents in Burkinafasan honey, as well as their scavenging activity. Food Chem. J. 2005, 91, 571–577. [Google Scholar] [CrossRef]
- Masood, S.; Ihsan, M.A.; Shahzad, K.; Sabir, M.; Alam, S.; Ahmed, W.; Shah, Z.H.; Alghabari, F.; Mehmood, A.; Chung, G. Antioxidant potential and α-glucosidase inhibitory activity of onion (Allium cepa L.) peel and bulb extracts. Braz. J. Biol. 2023, 83, e247168. [Google Scholar] [CrossRef] [PubMed]
- Giusti, M.M.; Wrolstad, R.E. Current Protocols in Food Analytical Chemistry F1.2.1–1.2.13; John Wiley & Sons, Inc.: Hoboken, NJ, USA, 2001. [Google Scholar]
- Brand-Williams, W.; Cuvelier, M.E.; Berset, C. Use of a free radical method to evaluate antioxidant activity. J. Food Sci. Technol. 1995, 28, 25–30. [Google Scholar] [CrossRef]
- Nei, M.; Li, W.H. Mathematical model for studying the genetic variation in terms of restriction endonuclease. Proc. Natl. Acad. Sci. USA 1979, 76, 5269–5273. [Google Scholar] [CrossRef]
- Rohlf, F. NTSYS PC: Numerical Taxonomy and Multivariate Analysis for the IBM PC Microcomputers (and Compatibles); Version 2.1; Applied Biostatistics Inc.: Stony Brook, NY, USA, 2000. [Google Scholar]
- Feller, C.; Bleiholder, H.; Buhr, L.; Hack, H.; Hess, M.; Klose, R.; Meier, U.; Stauss, R.; Van den Boom, T.; Weber, E. Phenological growth stages of vegetable crops. I. Bulb root tuber and leaf vegetables. Coding and description according to the expanded BBCH scale with illustrations. Nachr. Dtsch. Pflanzenschutzd. 1995, 47, 193–206. [Google Scholar]
- Przygocka-Cyna, K.; Barłóg, P.; Grzebisz, W.; Spiżewski, T. Onion (Allium cepa L.) Yield and Growth Dynamics Response to In-Season Patterns of Nitrogen and Sulfur Uptake. Agronomy 2020, 10, 1146. [Google Scholar] [CrossRef]
- Lee, E.J.; Suh, J.K. Effect of temperature on the growth, pyruvic acid and sugar contents in onion bulbs. Korean J. Hortic. Sci. Biotechnol. 2009, 27, 554–558. [Google Scholar]
- Ikeda, H.; Yamamoto, T.; Kinoshita, T.; Tsukazaki, H.; Yamasaki, A. A Comparative Study on the Growth and Bulb Development of Several Onion (Allium cepa L.) Cultivars Sown in Spring in the Northeast Region of Japan. Jpn. Soc. Hortic. Sci. 2020, 89, 586–592. [Google Scholar] [CrossRef]
- Rabinowitch, H.D.; Currah, L. Allium Crop Science, Recent Advances; Centre for Agriculture and Biosciences International: Wallingford, UK, 2002. [Google Scholar]
- Kopsell, D.A.; Lefsrud, M.G.; Auge, R.M.; Both, A.J. Biomass production and pigment accumulation in kale grown under increasing photoperiods. HortScience 2006, 41, 603–606. [Google Scholar]
- Koontz, H.V.; Prince, R.P.; Koontz, R.F. Comparison of fluorescent and high-pressure sodium lamps on growth of leaf lettuce. HortScience 1987, 22, 424–425. [Google Scholar] [CrossRef]
- Duysens, L.M.N.; Sonneveld, A.; Rademaker, H. Chlorophyll a fluorescence as a monitor of nanosecond reduction of the photooxidized primary donor P-680+ of Photosystem II. Biochim. Biophys. Acta (BBA)-Bioenerg. 1979, 548, 536–551. [Google Scholar]
- Golubkina, N.; Caruso, G. Nutritional and antioxiant properties of Allium cepa L. In Nutritional Composition and Antioxidant Properties of Fruits and Vegetables; Jaiswal, A.M., Ed.; Academic Press: Cambridge, MA, USA, 2020; pp. 73–89. [Google Scholar]
- Marefatia, N.; Ghorania, V.; Shakeric, F.; Boskabadye, M.; Kianiang, F.; Rezaeeh, R.; Hosein, M. Boskabady A review of anti-inflammatory, antioxidant, and immunomodulatory effects of Allium cepa and its main constituents. Pharm. Biol. 2021, 59, 285–300. [Google Scholar] [CrossRef] [PubMed]
- Hossain, M.B.; Lebelle, J.; Birsan, R.; Rai, D.K. Enrichment and Assessment of the Contributions of the Major Polyphenols to the Total Antioxidant Activity of Onion Extracts: A Fractionation by Flash Chromatography Approach. Antioxidants 2018, 7, 175. [Google Scholar] [CrossRef] [PubMed]
- Metrani, R.; Singh, J.; Acharya, P.; Jayaprakasha, G.K.; Patil, B.S. Comparative Metabolomics Profiling of Polyphenols, Nutrients and Antioxidant Activities of Two Red Onion (Allium cepa L.) Cultivars. Plants 2020, 9, 1077. [Google Scholar] [CrossRef]
- Keighobadi, K.; Golabadi, M.; Khozaei, M.; Rezai, A. Phytochemical Screening of the Aqueous Extracts of Iranian Onion (Allium cepa L.) Landraces. J. Food Biosci. Technol. 2021, 11, 99–106. [Google Scholar]
- Baldwin, S.; Pither-Joyce, M.; Wright, K.; Chen, L.; McCallum, J. Development of robust genomic simple sequence repeat markers for estimation of genetic diversity within and among bulb onion (Allium cepa L.) populations. Mol. Breed. 2012, 30, 1401–1411. [Google Scholar] [CrossRef]
- Khar, A.; Lawande, K.E.; Negi, K.S. Microsatellite marker based analysis of genetic diversity in short-day tropical Indian onion and cross amplification in related Allium spp. Genet. Resour. Crop Evol. 2011, 58, 741–752. [Google Scholar] [CrossRef]
- Gupta, V.P.; Sekhon, M.S.; Satija, D.R. Studies on genetic diversity, heterosis and combining ability in Indian mustard (Brassica juncea (L.) Czern and Coss.). Indian J. Genet. 1991, 51, 448–453. [Google Scholar]
- Dehdari, A.; Rezaei, A.; Mobli, M. Evaluation of physical and agronomic characteristics of some Iranian onion genotypes. J. Agric. Sci. Technol. Nat. Res. 2001, 5, 109–123. [Google Scholar]
- Kutty, M.S.; Veere Gowda, R.; Anand, L. Analysis of genetic diversity among Indian short-day onion (Allium cepa L.) cultivars using RAPD markers. J. Hortic. Sci. Biotechnol. 2006, 81, 774–778. [Google Scholar] [CrossRef]
- Seyyed Tabatabaei, B.E.; Karimi Nafchi, Z.; Mobli, M. Genetic diversity of some onion genotypes using SSR markers. Iranian J. Hortic. Sci. 2012, 42, 11–20. [Google Scholar]
- Huang, X.; Han, B. Natural variations and genome-wide association studies in crop plants. Annu. Rev. Plant Biol. 2014, 65, 531–551. [Google Scholar] [CrossRef]
- Chinnappareddy, L.R.D.; Khandagale, K.; Chennareddy, A.; Ramappa, V.G. Molecular markers in the improvement of Allium crops. Czech. J. Genet. Plant Breed. 2013, 49, 131–139. [Google Scholar] [CrossRef]
- Shanmugam, A.S.; Rangasamy, S.R.S. Multivariate analysis of genetic divergences of blackgram (Vigna mungo (L.) Hepper). Madras Agric. J. 1982, 69, 701–706. [Google Scholar]
- Elsharkawy, G.A.; Hegazi, H.H.; Azab, E.; Gobouri, A.A.; Sayed, S.A. Assessment of genetic diversity among Egyptian garlic landraces based on morphological characteristics and ISSR markers. Eur. J. Hortic. Sci. 2021, 86, 579–589. [Google Scholar] [CrossRef]
Disclaimer/Publisher’s Note: The statements, opinions and data contained in all publications are solely those of the individual author(s) and contributor(s) and not of MDPI and/or the editor(s). MDPI and/or the editor(s) disclaim responsibility for any injury to people or property resulting from any ideas, methods, instructions or products referred to in the content. |
© 2023 by the authors. Licensee MDPI, Basel, Switzerland. This article is an open access article distributed under the terms and conditions of the Creative Commons Attribution (CC BY) license (https://creativecommons.org/licenses/by/4.0/).

