
Has Rural Public Services Weakened Population Migration in the Sichuan–Chongqing Region? Spatiotemporal Association Patterns and Their Influencing Factors

Abstract
:1. Introduction
2. Literature Review
3. Methods and Data
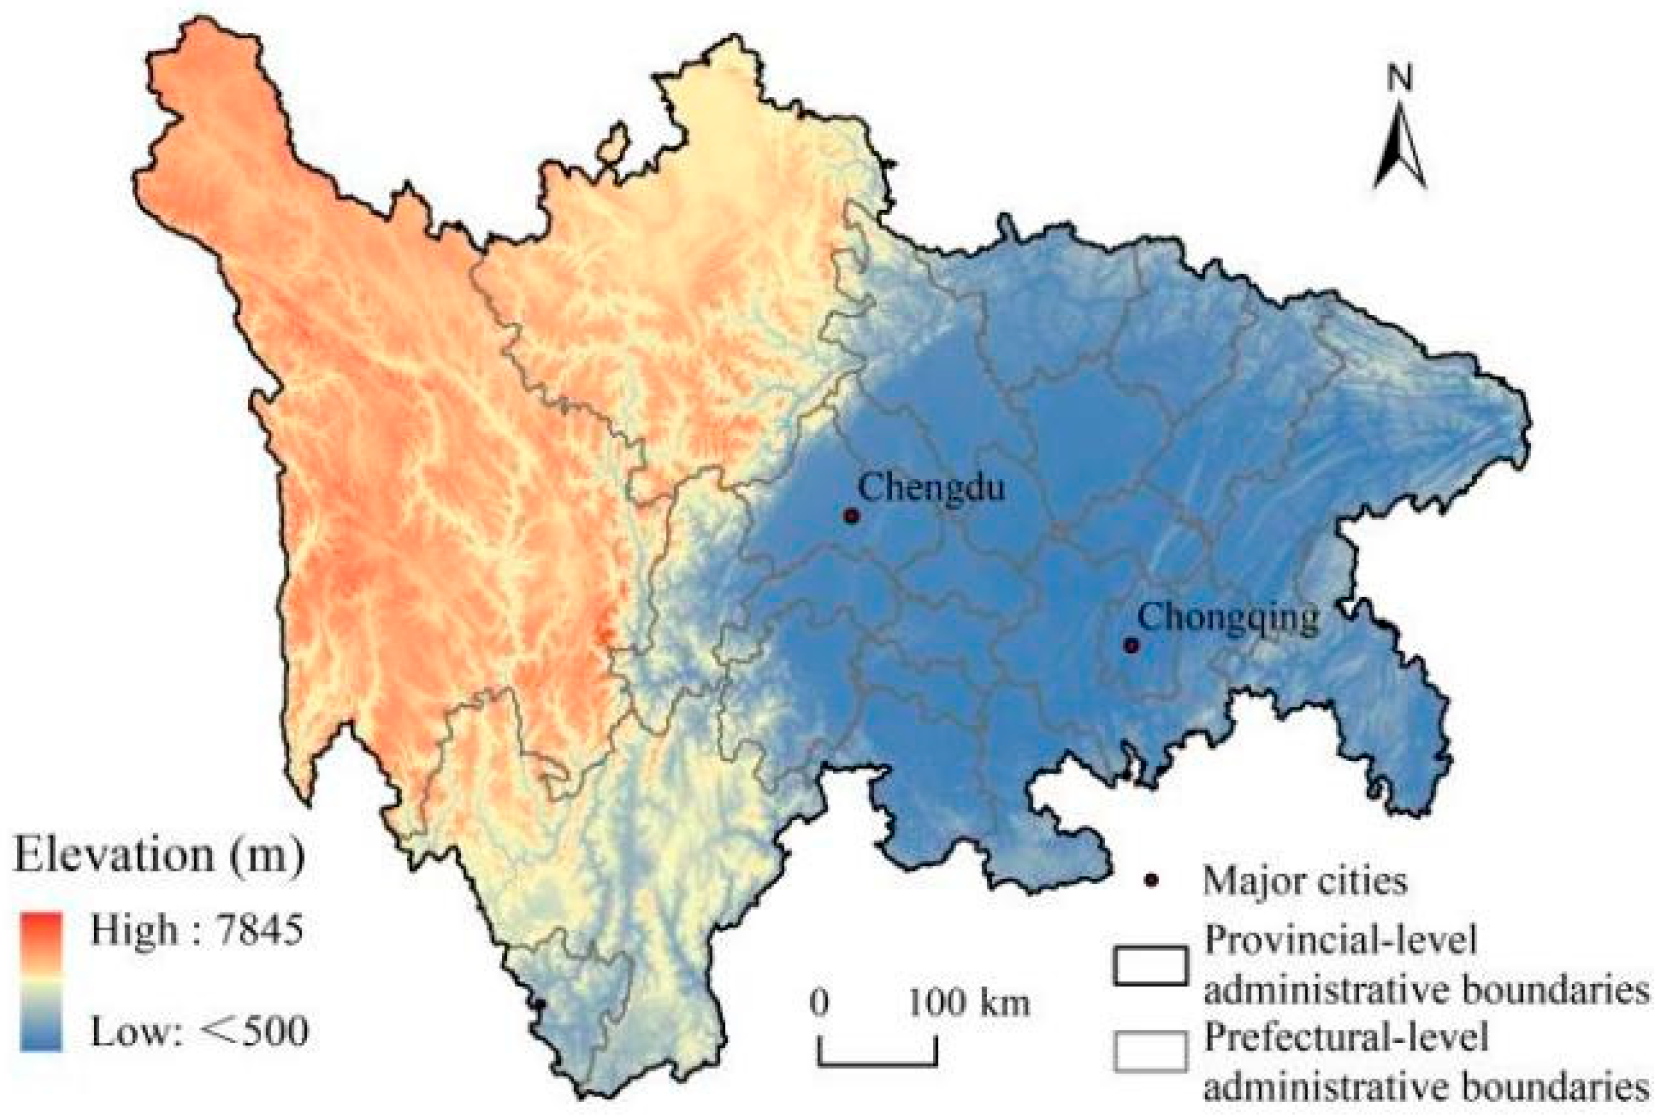
3.1. Study Area
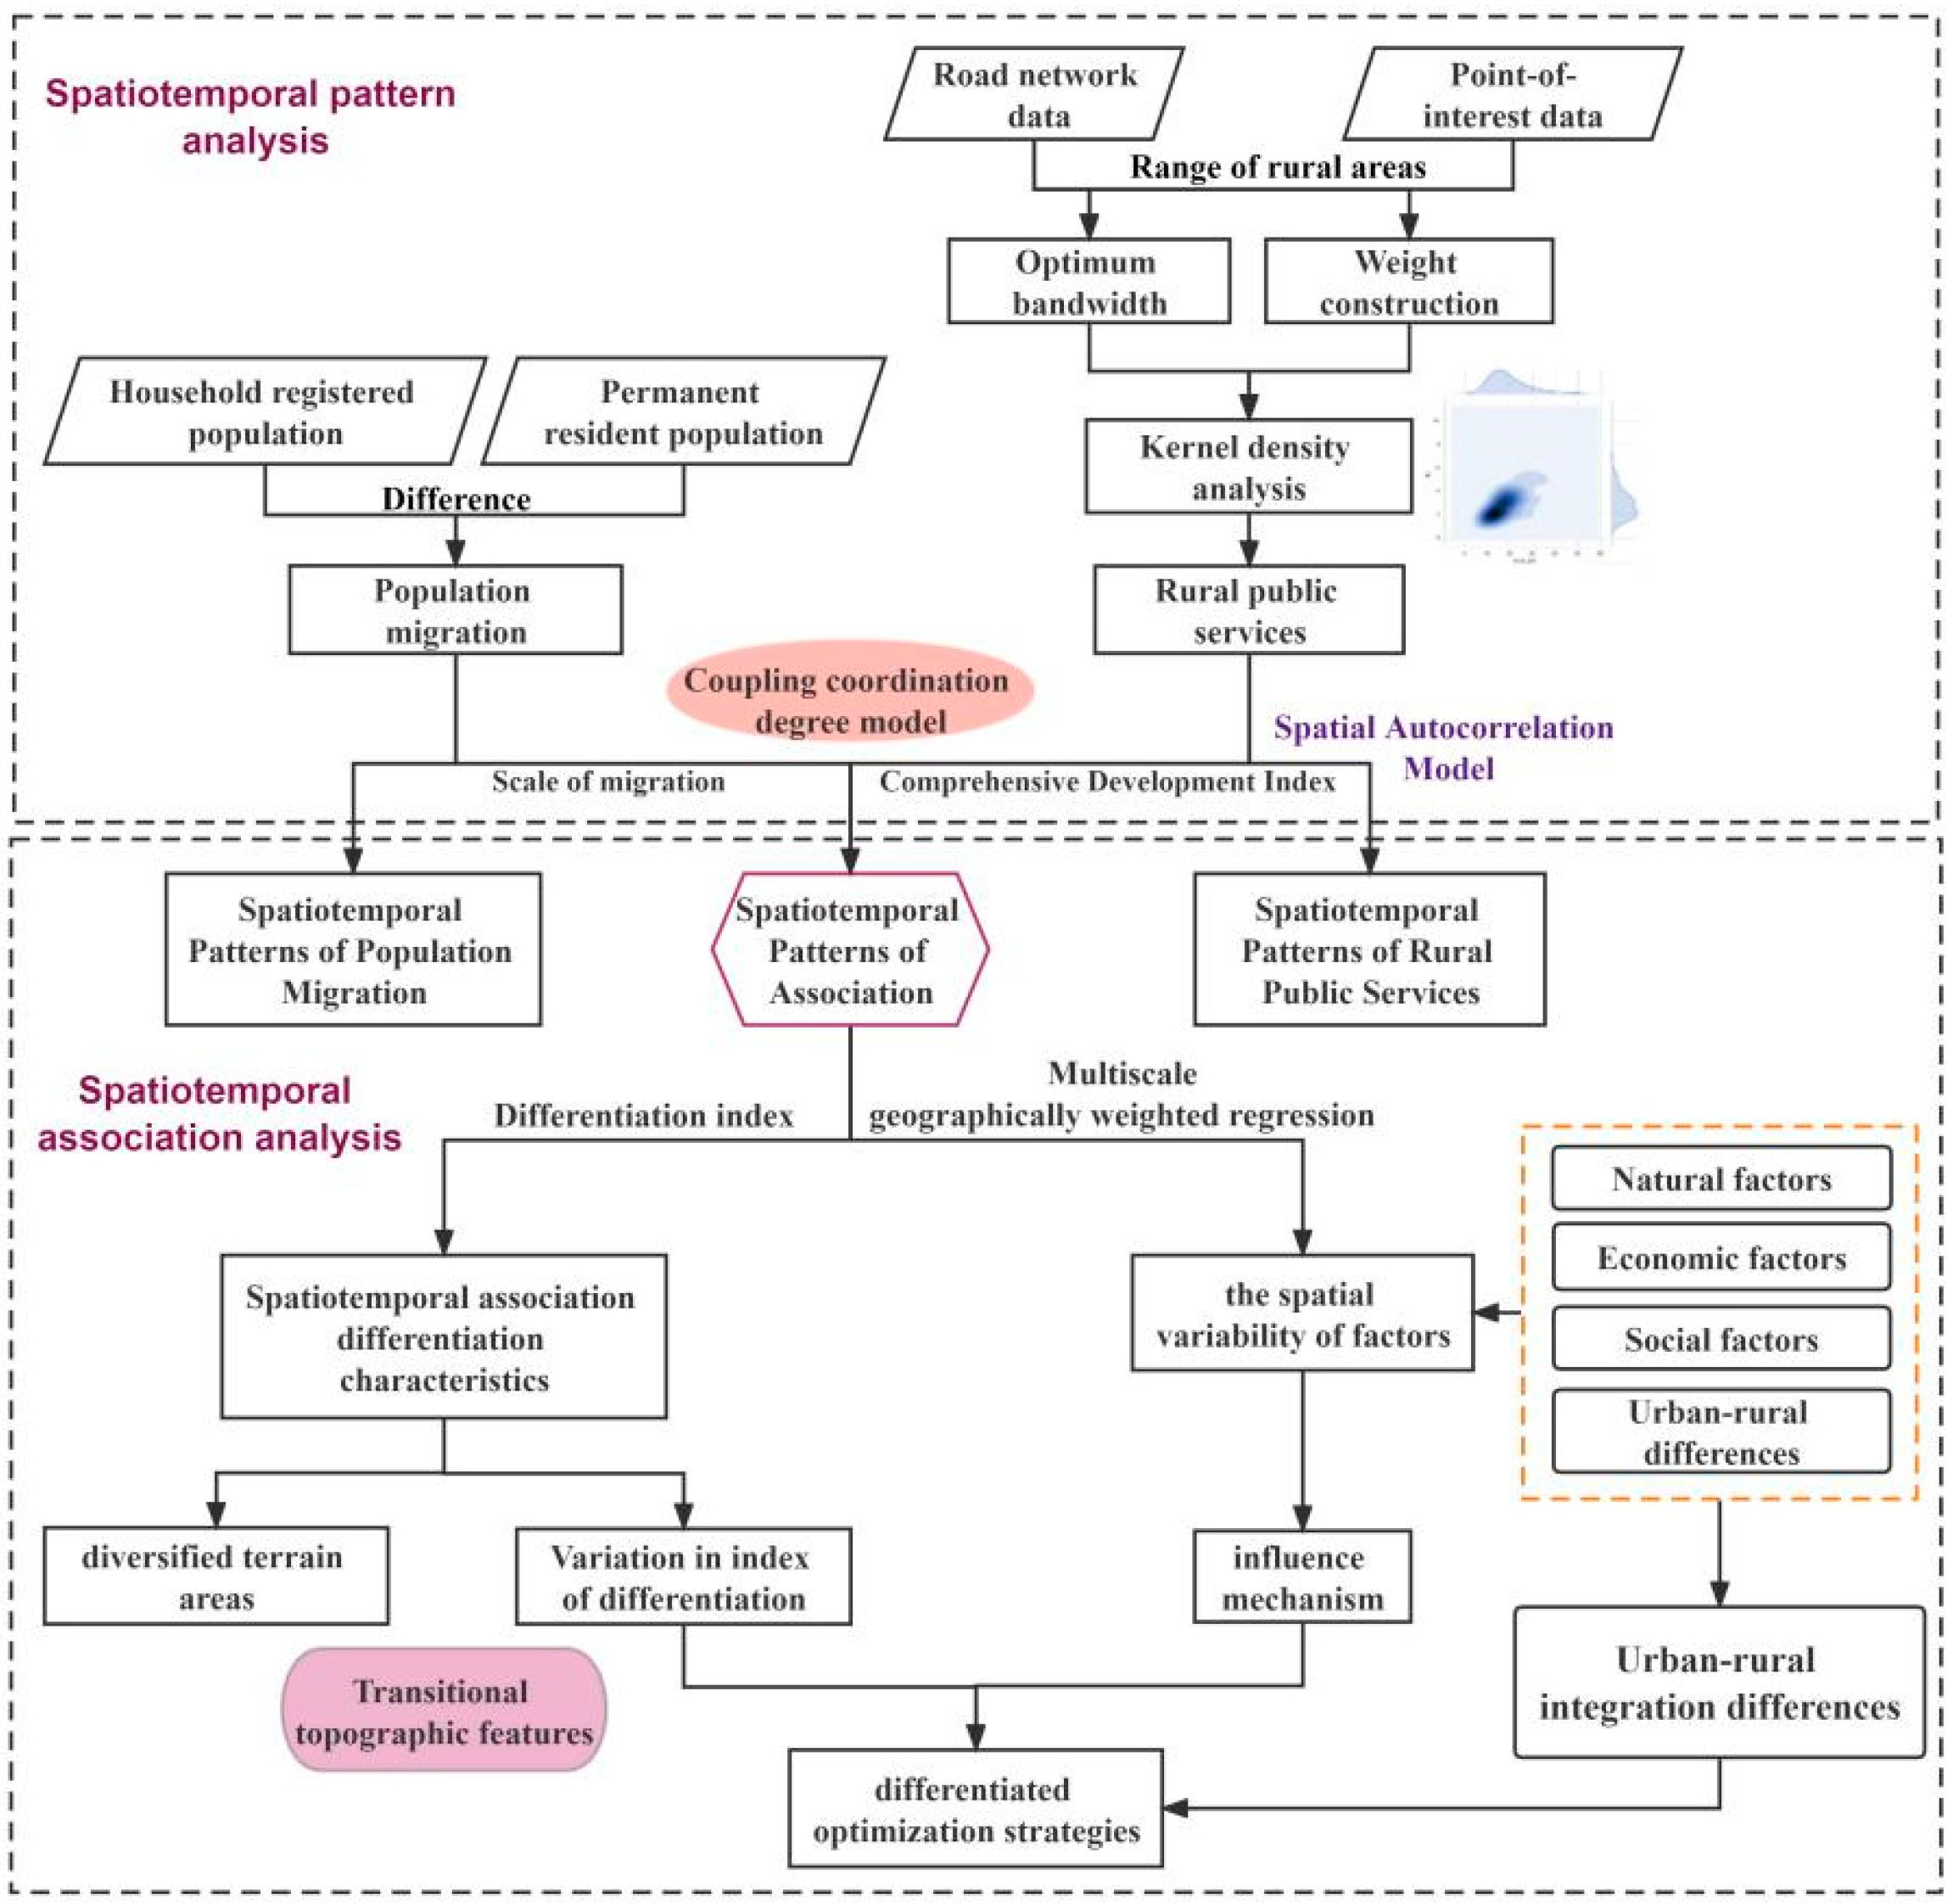
3.2. Study Design
3.3. Data Source and Processing
3.4. Research Methods
3.4.1. The Improved CRITIC Entropy Method
3.4.2. Coupling Co-Ordination Degree Model
3.4.3. Differentiation Index
3.4.4. Multiscale Geographically Weighted Regression
4. Results
4.1. The Evolution of the Spatiotemporal Patterns in SCR
4.1.1. Spatiotemporal Patterns of RPSs
4.1.2. Spatiotemporal Patterns of PM
4.2. Spatiotemporal Associations between RPSs and PM in SCR
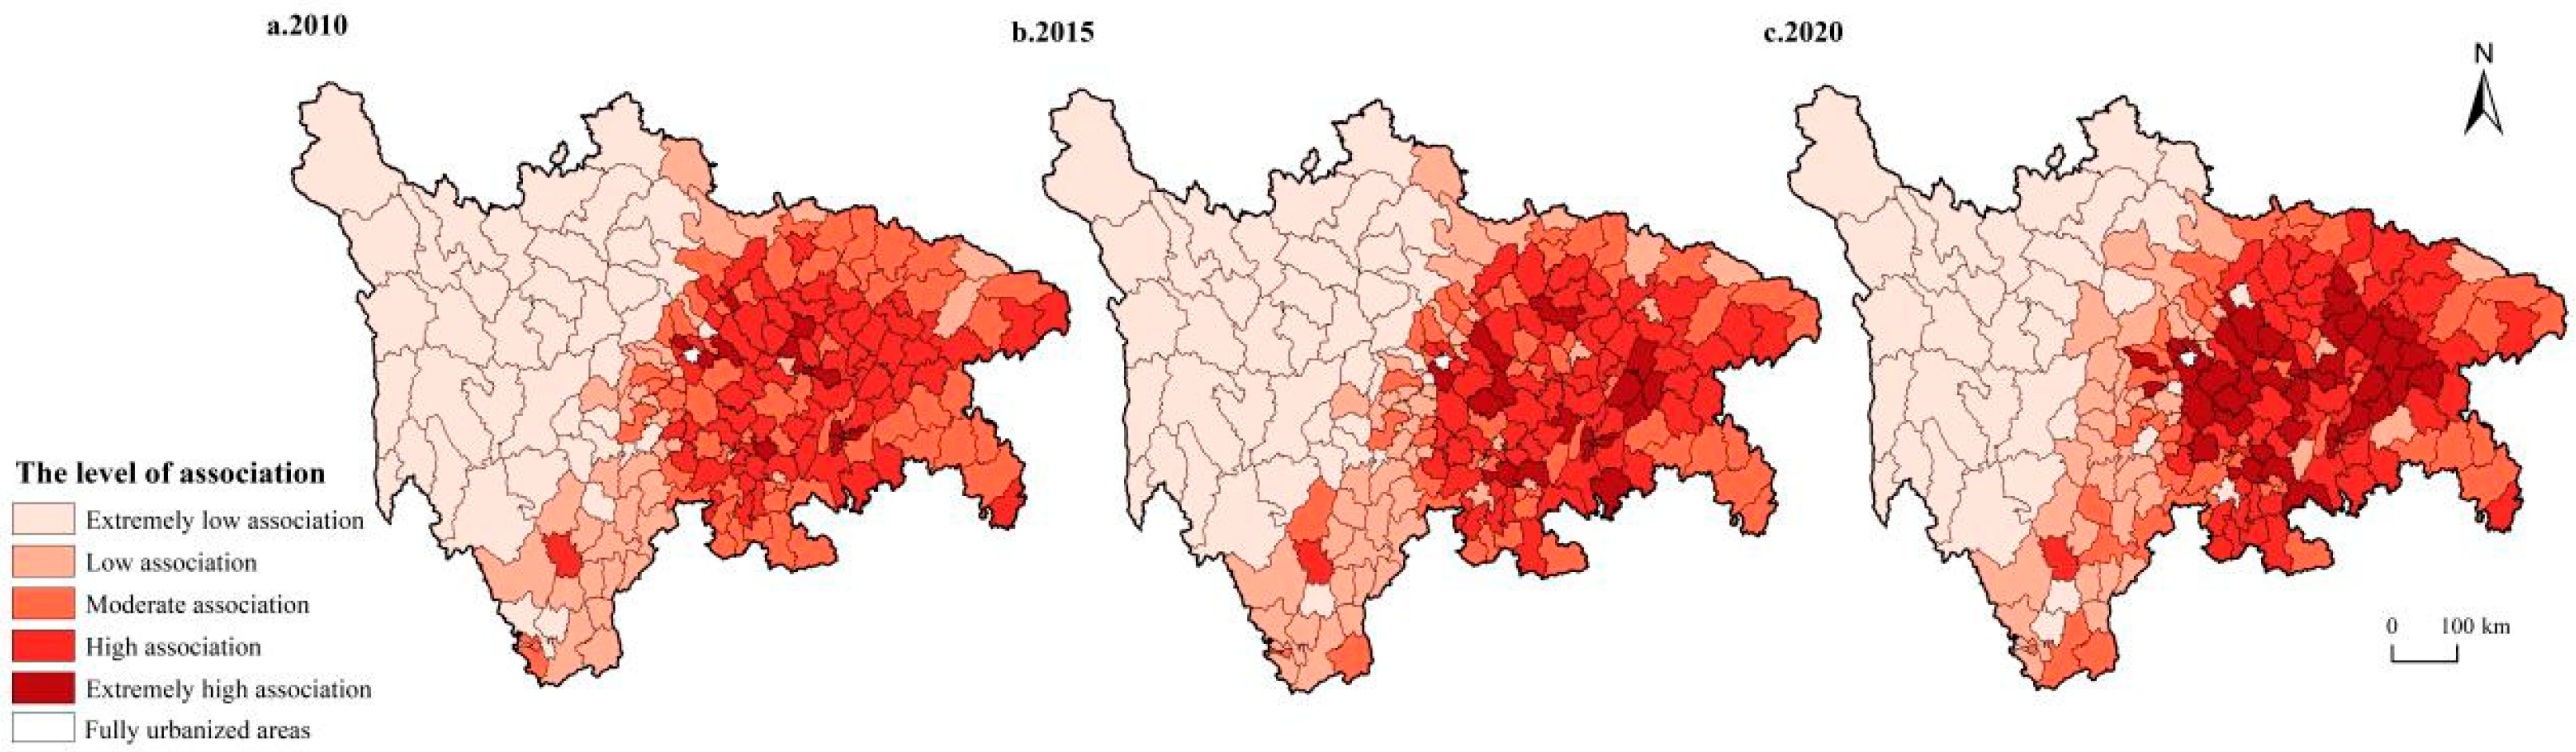
4.2.1. The Spatiotemporal Patterns of Association
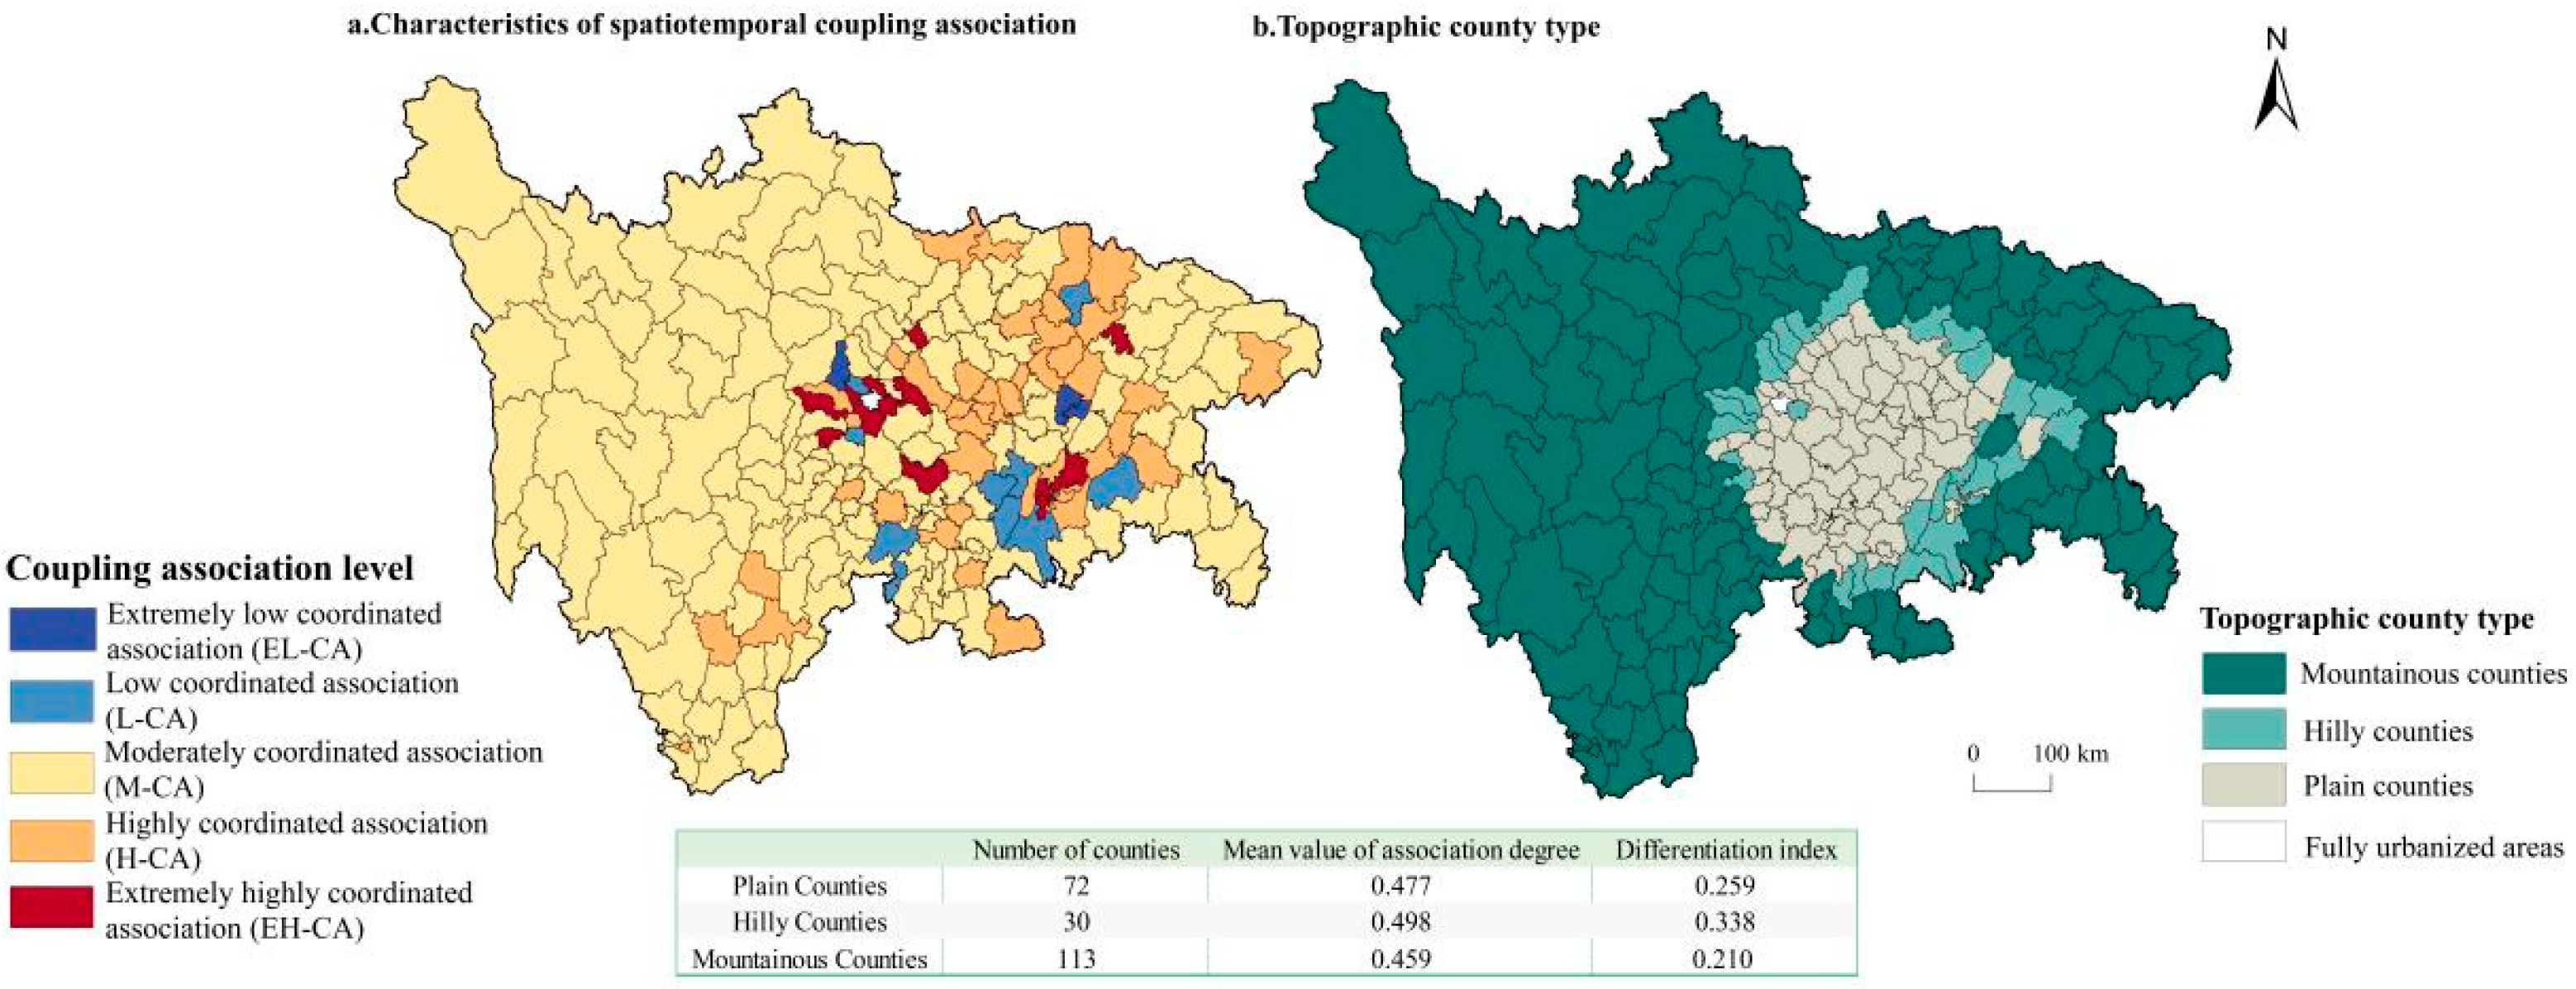
4.2.2. Types and Divisions of Spatiotemporal Association Patterns
4.2.3. The Differentiation of Spatiotemporal Association Characteristics
4.3. Factors Influencing the Spatiotemporal Associations
4.3.1. Influence Factor Selection and Model Establishment
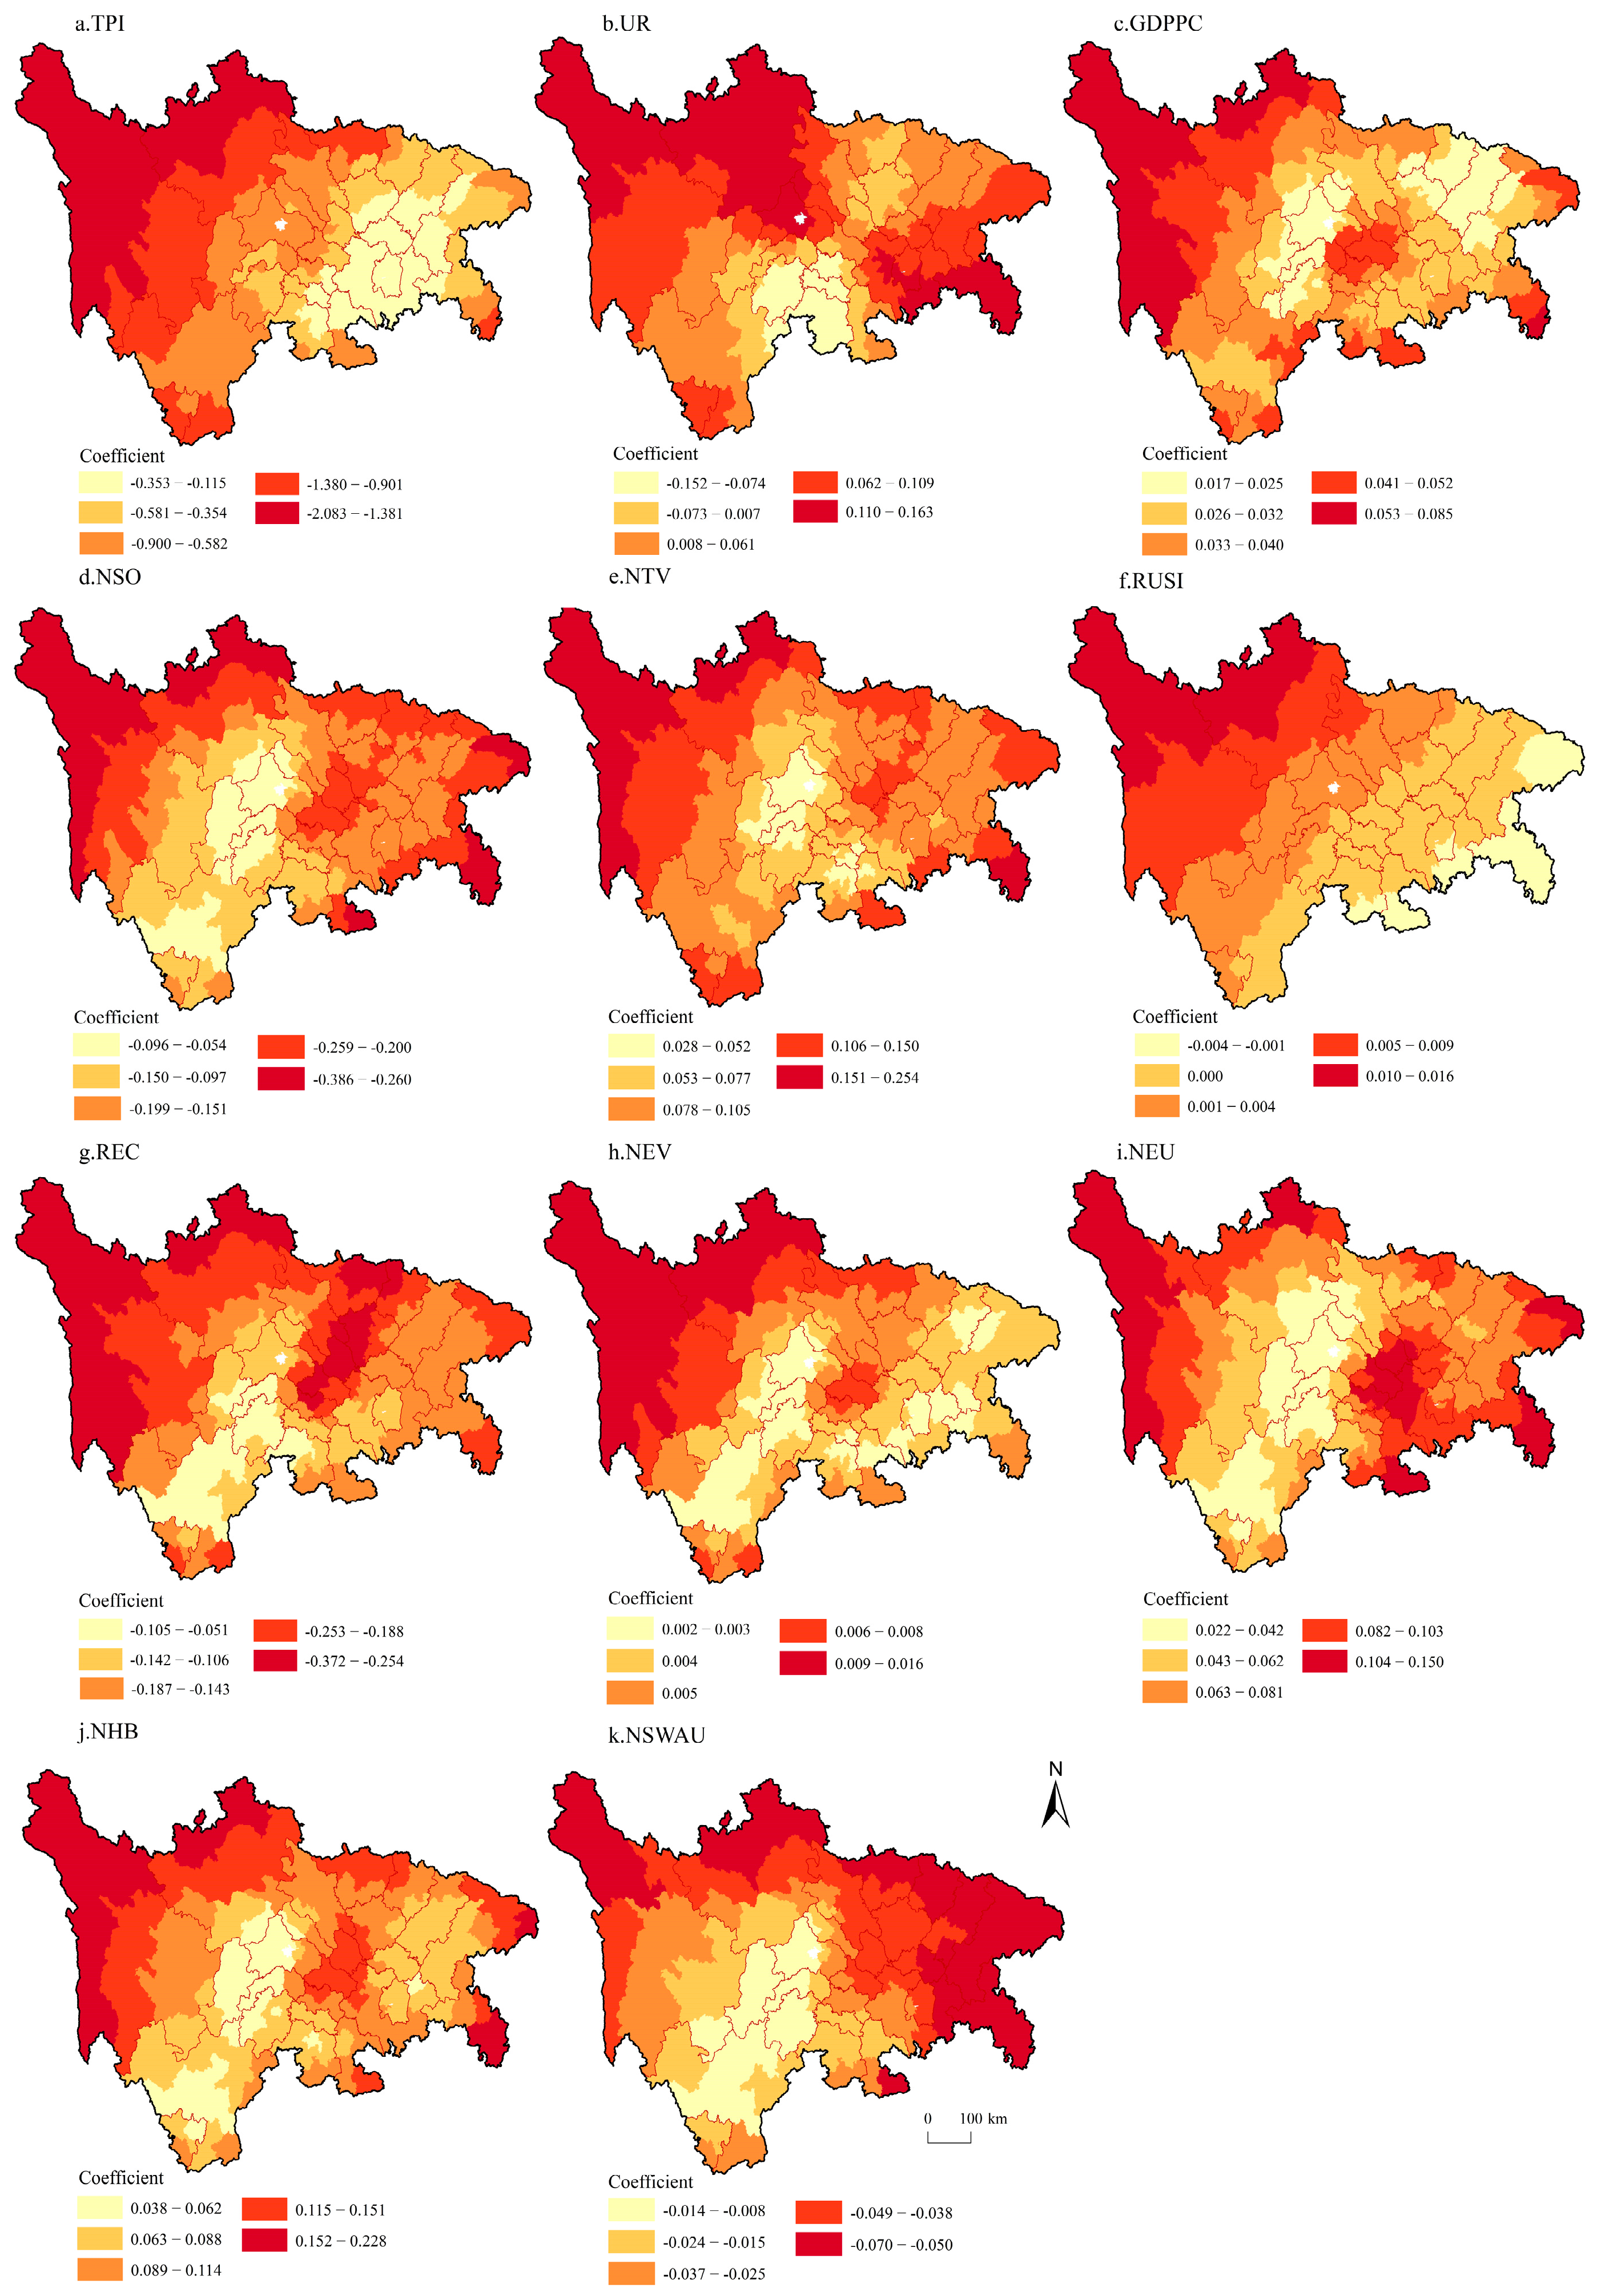
4.3.2. Factor Analysis Based on the MGWR Model
5. Discussion
5.1. New Perceptions of Spatiotemporal Association Regionality in an Improved Framework
5.2. Main Association Types and Differentiated Optimization Strategy
6. Conclusions
Author Contributions
Funding
Institutional Review Board Statement
Data Availability Statement
Conflicts of Interest
Abbreviations
| RPSs | rural public services | GDPPC | GDP per capita |
| PM | population migration | REC | rural electricity consumption |
| SCR | Sichuan–Chongqing region | UR | urbanization rate |
| MGWR | multiscale geographically weighted regression | NHB | number of hospital and health center beds |
| EH-CA | extremely highly co-ordinated association | NSWAU | number of social welfare adoptive units |
| H-CA | highly co-ordinated association | NSO | number of regional street offices |
| M-CA | moderately co-ordinated association | NTV | number of towns and villages |
| L-CA | low co-ordinated association | NEV | number of village employees |
| EL-CA | extremely low co-ordinated association | NEU | number of urban unit employees |
| TPI | topographic position index | RUSI | ratio of urban to total social fixed asset investment |
References
- Ning, J.Z. Main data of the seventh national population census. China Stat. 2021, 5, 4–5. [Google Scholar]
- Tong, W.; Guo, J.; Su, F.; Xu, W. Progress and prospect of the impact of population migration on rural transformation development under the background of rural revitalization. J. Geogr. Sci. 2022, 42, 662–669. [Google Scholar] [CrossRef]
- Zhang, Y.; Long, H.; Ma, L.; Tu, S.; Chen, K. Research progress of urban-rural relations and its implications for rural revitalization. Geogr. Stud. 2019, 3, 578–594. [Google Scholar] [CrossRef]
- Mubangizi, B.; Mwesigwa, D. Migration and public service delivery: The status quo and policy responses in sending and receiving countries. In Crisis, Identity and Migration in Post-Colonial Southern Africa; Springer: Cham, Switzerland, 2018; pp. 53–73. [Google Scholar]
- Zhang, K.Z.; Gao, Z.B.; Zhang, L.N.; Ceng, Q. Migratory-Bird Flow or Permanent Migration?—Public Services Accessibility and Population Migration Options Based on the Perspective of Social Integration. Econ. Manag. Stud. 2020, 7, 112–133. [Google Scholar] [CrossRef]
- Zhang, Z.; Lu, Y. China’s urban-rural relationship: Evolution and prospects. China Agric. Econ. Rev. 2018, 2, 260–276. [Google Scholar] [CrossRef]
- Ouyang, W.; Wang, B.; Tian, L.; Niu, X. Spatial deprivation of urban public services in migrant enclaves under the context of a rapidly urbanizing China: An evaluation based on suburban Shanghai. Cities 2017, 60, 436–445. [Google Scholar] [CrossRef]
- Liu, Z.; Liu, S.; Jin, H.; Qi, W. Rural population change in China: Spatial differences, driving forces and policy implications. J. Rural. Stud. 2017, 51, 189–197. [Google Scholar] [CrossRef]
- Yang, R.; Zhang, J.; Xu, Q.; Luo, X. Urban-rural spatial transformation process and influences from the perspective of land use: A case study of the Pearl River Delta Region. Habitat Int. 2020, 104, 102234. [Google Scholar] [CrossRef]
- Parry, L.; Day, B.; Amaral, S.; Peres, C. Drivers of rural exodus from Amazonian headwaters. Popul. Environ. 2010, 32, 137–176. [Google Scholar] [CrossRef]
- Zhang, S.; Deng, W.; Peng, L.; Zhou, P.; Liu, Y. Has rural migration weakened agricultural cultivation? Evidence from the mountains of Southwest China. Agriculture 2020, 10, 63. [Google Scholar] [CrossRef] [Green Version]
- Chen, Z.; Liu, X.; Lu, M. Beyond Lewis: Rural-to-urban migration with endogenous policy change. China Agric. Econ. Rev. 2013, 5, 213–230. [Google Scholar] [CrossRef]
- Yin, C.; He, Q.; Liu, Y.; Chen, W.; Gao, Y. Inequality of public health and its role in spatial accessibility to medical facilities in China. Appl. Geogr. 2018, 92, 50–62. [Google Scholar] [CrossRef]
- Jiang, H.B.; Zhang, W.Z.; Wei, S. Public service facility accessibility as influenced by public transportation in Beijing. Prog. Geogr. 2017, 10, 1239–1249. [Google Scholar] [CrossRef] [Green Version]
- Long, H.; Tu, S.; Ge, D.; Li, T.; Liu, Y. The allocation and management of critical resources in rural China under restructuring: Problems and prospects. J. Rural. Stud. 2016, 47, 392–412. [Google Scholar] [CrossRef] [Green Version]
- Yang, Y.; Liu, Y.; Li, Y.; Li, J. Measure of urban-rural transformation in Beijing-Tianjin-Hebei region in the new millennium: Population-land-industry perspective. Land Use Policy 2018, 79, 595–608. [Google Scholar] [CrossRef]
- Li, B.; Li, T.; Yu, M.; Chen, B. Can equalization of public services narrow the regional disparities in China? A spatial econometrics approach. China Econ. Rev. 2017, 44, 67–78. [Google Scholar] [CrossRef]
- Sanogo, T. Does fiscal decentralization enhance citizens’ access to public service-s and reduce poverty? Evidence from Côte d’Ivoire municipalities in a conflict setting. World Dev. 2019, 113, 204–221. [Google Scholar] [CrossRef] [Green Version]
- Li, Y.; Jia, L.; Wu, W.; Yan, J.; Liu, Y. Urbanization for rural sustainability–Rethinking China's urbanization strategy. J. Clean. Prod. 2018, 178, 580–586. [Google Scholar] [CrossRef]
- Yin, P.; Li, C.G.; Chen, C.; Duan, P. Relationship between population urbanization and basic public service in the context of the new urbanization: Take Jilin province for example. Econ. Geogr. 2015, 1, 61–67. [Google Scholar] [CrossRef]
- Christiaanse, S. Rural facility decline: A longitudinal accessibility analysis questioning the focus of Dutch depopulation-policy. Appl. Geogr. 2020, 121, 102251. [Google Scholar] [CrossRef]
- Cui, X.; Ma, L.; Tao, T.; Zhang, W. Do the supply of and demand for rural public service facilities match? Assessment based on the perspective of rural residents. Sustain. Cities Soc. 2022, 82, 103905. [Google Scholar] [CrossRef]
- Liu, T.; Qi, Y.; Cao, G.; Liu, H. Spatial patterns, driving forces, and urbanization effects of China’s internal migration: County-level analysis based on the 2000 and 2010 censuses. J. Geogr. Sci. 2015, 2, 236–256. [Google Scholar] [CrossRef]
- Tong, W.; Lo, K. Back to the countryside: Rural development and the spatial patterns of population migration in Zhejiang, China. Agriculture 2021, 11, 788. [Google Scholar] [CrossRef]
- Qi, W.; Deng, Y.; Fu, B. Rural attraction: The spatial pattern and driving factors of China's rural in-migration. J. Rural. Stud. 2022, 93, 461–470. [Google Scholar] [CrossRef]
- Cheng, M.; Duan, C. The changing trends of internal migration and urbanization in China: New evidence from the seventh National Population Census. China Popul. Dev. Stud. 2021, 5, 275–295. [Google Scholar] [CrossRef]
- Liu, R.; Greene, R.; Yu, Y.; Lv, H. Are migration and settlement environment-driven? Environment-related residential preferences of migrants in China. J. Clean. Prod. 2022, 377, 134263. [Google Scholar] [CrossRef]
- Wu, J.; Yu, Z.; Wei, Y.D.; Yang, L. Changing distribution of migrant population and its influencing factors in urban China: Economic transition, public policy, and amenities. Habitat Int. 2019, 94, 102063. [Google Scholar] [CrossRef]
- Wu, H.; Wang, L.; Zhang, Z.; Gao, J. Analysis and optimization of 15-minute comm-unity life circle based on supply and demand matching: A case study of Shanghai. PLoS ONE 2021, 16, e0256904. [Google Scholar] [CrossRef]
- Shi, Y.; Yang, J.; Shen, P. Revealing the correlation between population density and the spatial distribution of urban public service facilities with mobile phone data. Int. J. Geo-Inf. 2020, 9, 38. [Google Scholar] [CrossRef] [Green Version]
- Firmino Costa da Silva, D.; Elhorst, J.P.; Silveira Neto, R.D.M. Urban and rural population growth in a spatial panel of municipalities. Reg. Stud. 2017, 51, 894–908. [Google Scholar] [CrossRef] [Green Version]
- Guo, Y.Z.; Zhou, Y.; Liu, Y.S. Spatial-temporal Evolution of Rural Population Outflow and Its Mechanism in China. J. Geogr. Sci. 2020, 40, 50–59. (In Chinese) [Google Scholar] [CrossRef]
- Alamá-Sabater, L.; Budí, V.; Álvarez-Coque, J.M.G.; Roig-Tierno, N. Using mixed research approaches to understand rural depopulation. Econ. Agrar. Recur. Nat.-Agric. Resour. Econ. 2019, 19, 99–120. [Google Scholar] [CrossRef] [Green Version]
- Zhang, Q.F.; Wu, J. Providing rural public services through land commodification: Policy innovations and rural–urban integration in Chengdu. In Public Service Innovations in China; Palgrave Macmillan: London, UK, 2017; pp. 67–91. [Google Scholar] [CrossRef]
- Li, L.C. State and market in public service provision: Opportunities and traps for institutional change in rural China. Pac. Rev. 2008, 21, 257–278. [Google Scholar] [CrossRef]
- Gao, M.M.; Wang, Z.; Qiu, Z. Review and Prospect of Rural Public Service Facilities Configuration from the Perspective of Dynamic Development. J. Hum. Settl. West China 2023, 38, 129–135. (In Chinese) [Google Scholar] [CrossRef]
- Li, Y.; Ma, R.; Jin, B. Research on Rural Typology Based on the Symbiotic Model of Rural Revitalization and Basic Public Services. Land 2023, 12, 1259. [Google Scholar] [CrossRef]
- Wan, C.W.; Yang, G.Q. Declining villages in mountainous area: Demand willingness characteristics, problems, and trends of public service facilities and planning responses. City Plan. Rev. 2020, 44, 77–86+102. (In Chinese) [Google Scholar] [CrossRef]
- Chen, Y.; Tan, Y.; Gruschke, A. Rural vulnerability, migration, and relocation in mountain areas of Western China: An overview of key issues and policy interventions. Chin. J. Popul. Resour. Environ. 2021, 19, 110–116. [Google Scholar] [CrossRef]
- Wu, Y.M. The Dilemma of “People-Centered Urbanization” and the Structural Reform of the Supply to Public Services. J. Soc. Sci. 2017, 437, 72–81. (In Chinese) [Google Scholar] [CrossRef]
- Zhao, Z.; Pan, Y.; Zhu, J.; Wu, J.; Zhu, R. The impact of urbanization on the delivery of public service–related SDGs in China. Sustain. Cities Soc. 2022, 80, 103776. [Google Scholar] [CrossRef]
- Hou, X.; Wu, S.; Chen, D.; Cheng, M.; Yu, X.; Yan, D.; Dang, Y.; Peng, M. Can urban public services and ecosystem services achieve positive synergies? Ecol. Indic. 2021, 124, 107433. [Google Scholar] [CrossRef]
- Li, X.; Wei, L.; Shang, W.; Xing, X.; Yin, M.; Ling, J.; Mao, K.; Zhu, Y.; Yang, K. Trace and evaluation systems for health services quality in rural and remote areas: A systematic review. J. Public Health 2018, 26, 127–135. [Google Scholar] [CrossRef]
- Qian, F.; Yi, S. Research on Equalization of Public Services Based on Changes of Urban and Rural Population Structure. In Proceedings of the Eleventh International Conference on Management Science and Engineering Management 11, Kanazawa, Japan, 28–31 July 2018; Springer: Cham, Switzerland, 2018. [Google Scholar] [CrossRef]
- Yang, Y.; Jia, L.; Qin, Y.; Han, S.; Dong, H. Understanding structure of urban traffic network based on spatial-temporal correlation analysis. Mod. Phys. Lett. B 2017, 31, 1750230. [Google Scholar] [CrossRef]
- Xu, J.; Yan, Z.; Hu, S.; Pu, C. The Spatial Distribution and Optimization of Medical and Health Land from the Perspective of Public Service Equalization: A Case Study of Urumqi City. Sustainability 2022, 14, 7565. [Google Scholar] [CrossRef]
- Liu, D.; Zhang, H. Spatial Distribution of Public Service Facilities Based on POI Data: A Case Study of Taiyuan City. Geogr. Inf. World 2021, 1, 48–54. (In Chinese) [Google Scholar] [CrossRef]
- Wang, S.-J.; Kong, W.; Ren, L.; Zhi, D.-D.; Dai, B.-T. Research on misuses and modification of coupling coordination degree model in China. J. Nat. Resour. 2021, 3, 793–810. (In Chinese) [Google Scholar] [CrossRef]
- Nie, X.Y.; Shi, P.J.; Zhang, X.B.; Lv, R.; Zhu, Y.; Wei, W. Research on Rurality Evaluation and the Driving Mechanism in Arid Regions of Northwest China: A Case Study of Wuwei City in Gansu Province. J. Geogr. Sci. 2017, 37, 585–594. (In Chinese) [Google Scholar] [CrossRef]
- Yang, R.; Ren, F.; Ma, X.; Zhang, H.; Xu, W.; Jia, P. Explaining the longevity characteristics in China from a geographical perspective: A multi-scale geographically weighted regression analysis. Geospat. Health 2021, 16, 1024. [Google Scholar] [CrossRef]
- Luo, J.; Chen, S.; Sun, X.; Zhu, Y.; Zeng, J.; Chen, G. Analysis of city centrality based on entropy weight TOPSIS and population mobility: A case study of cities in the Yangtze River Economic Belt. Geogr. Sci. 2020, 30, 515–534. [Google Scholar] [CrossRef]
- Li, C.; Zong, H.M.; Xiao, L. Population mobility patterns in typical population outflow regions in China: The case of Sichuan and Chongqing regions. Trop. Geogr. 2021, 41, 516–527. (In Chinese) [Google Scholar] [CrossRef]
- Sun, X.; Zhang, C.; Tan, Q. Factors Influencing the Coordinated Development of Urbanization and Its Spatial Effects: A Case Study of Beijing-Tianjin-Hebei Region. Sustainability 2023, 15, 4137. [Google Scholar] [CrossRef]
- Zhang, S.; Deng, W.; Zhang, H.; Wang, Z. Identification and analysis of transitional zone patterns along urban-rural-natural landscape gradients: An application to China’s southwest mountains. Land Use Policy 2023, 129, 106625. [Google Scholar] [CrossRef]
- Liu, Y.S.; Lu, S.S.; Chen, Y. Spatio-temporal change of urban-rural equalized development patterns in China and its driving factors. J. Rural. Stud. 2013, 32, 320–330. [Google Scholar] [CrossRef]
- Xu, D.; Hou, G.L. The spatiotemporal coupling characteristics of regional urbanization and its influencing factors: Taking the Yangtze River Delta as an example. Sustainability 2019, 11, 822. [Google Scholar] [CrossRef] [Green Version]
- Nguyen, L.D.; Raabe, K.; Grote, U. Rural–Urban Migration, Household Vulnerability, and Welfare in Vietnam. World Dev. 2015, 71, 79–93. [Google Scholar] [CrossRef]
- Nolan, P.; White, G. Urban bias, rural bias or state bias? Urban-rural relations in post-revolutionary China. J. Dev. Stud. 1984, 20, 52–81. [Google Scholar] [CrossRef]
- Arnaiz-Schmitz, C.; Schmitz, M.; Herrero-Jáuregui, C.; Gutiérrez-Angonese, J.; Pineda, F.; Montes, C. Identifying socio-ecological networks in rural-urban gradients: Diagnosis of a changing cultural landscape. Sci. Total Environ. 2018, 612, 625–635. [Google Scholar] [CrossRef]
- Liu, H.M.; Fang, C.L.; Fang, K. Coupled Human and Natural Cube: A novel framework for analyzing the multiple interactions between humans and nature. J. Geogr. Sci. 2020, 30, 355–377. [Google Scholar] [CrossRef]
- Derudder, B.; Taylor, P.J. Central flow theory: Comparative connectivities in the world-city network. Reg. Stud. 2018, 52, 1029–1040. [Google Scholar] [CrossRef]
- Wei, L.; Chen, T.T.; Li, X. A new style of urbanization in China: Transformation of urban rural communities. Habitat Int. 2016, 55, 1–9. [Google Scholar] [CrossRef]
- Chen, M.; Zhou, Y.; Huang, X.; Ye, C. The integration of new-type urbanization and rural revitalization strategies in China: Origin, reality and future trends. Land 2021, 10, 207. [Google Scholar] [CrossRef]
- Su, C.-W.; Liu, T.-Y.; Chang, H.-L.; Jiang, X.-Z. Is urbanization narrowing the urban-rural income gap? A cross-regional study of China. Habitat Int. 2015, 48, 79–86. [Google Scholar] [CrossRef]
- Liu, S.-Q.; Zhang, H.-Q.; Xie, F.-T.; Guo, S.-L. Current situation and influencing factors of pluriactivity in mountainous and hilly rural areas of Sichuan province, China. J. Mt. Sci. 2013, 10, 445–454. [Google Scholar] [CrossRef]


| Research Content | Principal Author | Main Conclusions | |
|---|---|---|---|
| The impact of rural public services on population migration | Public services accessibility and population migration options | Zhang et al. (2020) and Firmino Costa da Silva et al. (2017) [5,31] | The importance of the public service level of inflow areas in attracting people is becoming increasingly evident, and spatial differences in public services between areas form a “potential energy” that further drives migration, especially between urban and rural areas. |
| Spatial–temporal evolution of rural migration and its mechanism | Guo et al. (2020) and Alamá-Sabater et al. (2019) [32,33] | Rural migration is the result of a combination of the natural environment, the humanities, and the economy, which is a social phenomenon triggered by the imbalance of regional factors and resources. Currently, personal and family factors have become the direct drivers of rural exodus, and rural public services have an important influence on migration trade-offs and decisions. | |
| Rural public service provision and urban–rural integration | Zhang and Wu (2017) and Li (2018) [34,35] | Rural public services are effective in weakening rural migration and promoting population clustering for rural–urban integration. Innovative rural public service provision can be a positive, transformative force in rural reconstruction. | |
| The impact of population migration on rural public services | Rural public service configuration from a dynamic development perspective | Gao et al. (2023) and Li (2023) [36,37] | The construction of rural public services in China has experienced a transformation from “increasing quantity” to “improving quality” under combined forces. In addition, the relevant research has also gradually shifted to a people-oriented focus, and population structure and migration are incorporated into the model to complete the pattern study. |
| Heterogeneity of rural public services in mountainous areas | Wan and Yang (2020) [38] | Compared with urban areas or rural areas in the urban periphery, most rural areas in mountains are featured with a decreasing population and scattered settlements. The heterogeneity of rural spaces in mountainous areas leads to a heterogeneous population and social structures, and poses many challenges to the equalization of public services. | |
| Rural vulnerability, migration, and relocation in mountain areas | Chen et al. (2021) [39] | Rural migration has a mixed impact on mountain societies. The information and skills brought back by migrants will make rural society progress; however, the mass exodus of people will lead to a shortage of labor resources in rural areas, the development of public services will be hindered, and the aging of rural subjects accumulated by various factors will have a great negative impact on rural development. | |
| The association between rural public services and population migration | Population urbanization dilemma and public service supply | Wu (2017) and Zhao et al. (2022) [40,41] | In China, the new urbanization corresponds to population urbanization, which is based on urban–rural integration, and there is a strong coupling association between population urbanization and the equalization of public services. The root cause of the relative lag in population urbanization was the inadequacy or lack of public services, and rural public services were one of the important aspects. |
| Hierarchy System | Major Categories | Minor Categories | Weight |
|---|---|---|---|
| Basic public services | Basic transportation services | Calculated using road network density | |
| Basic medical services | Health center, clinic, and pharmacy | 0.147 | |
| Basic education services | Secondary school, primary school, and kindergarten | 0.262 | |
| Life services | Post office, bank, laundry, funeral facility, etc. | 0.114 | |
| Catering services | Restaurant, teahouse, dessert shop, cold drink shop, etc. | 0.062 | |
| Shopping services | Shopping mall, supermarket, specialty shop, etc. | 0.082 | |
| Advanced public services | Cultural and sports services | Library, cinema, sports hall, training institute, etc. | 0.069 |
| Tourism and leisure services | Travel agency, hotel, scenic spot, holiday resort, etc. | 0.093 | |
| Transport and travel services | Service area, car repair, petrol station, coach station, etc. | 0.081 | |
| Health care services | General hospital, specialist hospital, emergency center, etc. | 0.090 |
| Model Parameters | 2010 | 2020 | ||||
|---|---|---|---|---|---|---|
| OLS | GWR | MGWR | OLS | GWR | MGWR | |
| R2 | 0.655 | 0.707 | 0.792 | 0.710 | 0.730 | 0.787 |
| Adjusted R2 | 0.637 | 0.676 | 0.751 | 0.692 | 0.702 | 0.753 |
| AICc | −390.900 | −385.053 | −428.480 | −340.502 | −339.904 | −360.001 |
| Residual Sum of Squares | 1.988 | 1.692 | 1.198 | 2.246 | 2.088 | 1.649 |
| Variable | 2010 | 2020 | ||||||||
|---|---|---|---|---|---|---|---|---|---|---|
| Min | Median | Max | Adaptive | VIF | Min | Median | Max | Adaptive | VIF | |
| Intercept | 0.232 | 0.296 | 0.341 | 17 | 0.344 | 0.346 | 0.346 | 210 | ||
| TPI | −0.300 | −0.299 | −0.298 | 213 | 2.62 | −0.535 | −0.357 | −0.241 | 27 | 2.75 |
| UR | −0.271 | −0.086 | −0.555 | 12 | 4.84 | 0.341 | 0.343 | 0.349 | 213 | 4.85 |
| GDPPC | 0.032 | 0.033 | 0.036 | 213 | 2.97 | −0.123 | −0.116 | −0.096 | 173 | 1.94 |
| NSO | −0.196 | −0.193 | −0.189 | 210 | 3.65 | −0.152 | −0.136 | −0.111 | 137 | 4.06 |
| NTV | 0.085 | 0.088 | 0.092 | 213 | 2.46 | 0.130 | 0.134 | 0.136 | 213 | 3.11 |
| RUSI | −0.003 | 0.000 | 0.008 | 213 | 1.16 | −0.775 | −0.514 | −0.263 | 16 | 1.15 |
| REC | −0.200 | −0.129 | −0.062 | 38 | 1.66 | −0.011 | −0.008 | −0.003 | 203 | 1.73 |
| NEV | 0.002 | 0.005 | 0.008 | 213 | 4.02 | 0.067 | 0.070 | 0.080 | 203 | 4.16 |
| NEU | 0.122 | 0.126 | 0.130 | 213 | 3.65 | 0.585 | 0.609 | 0.641 | 138 | 3.41 |
| NHB | 0.142 | 0.145 | 0.150 | 213 | 4.77 | −0.076 | −0.070 | −0.053 | 183 | 3.85 |
| NSWAU | −0.045 | −0.043 | −0.041 | 213 | 2.24 | −0.042 | 0.026 | 0.059 | 138 | 1.89 |
Disclaimer/Publisher’s Note: The statements, opinions and data contained in all publications are solely those of the individual author(s) and contributor(s) and not of MDPI and/or the editor(s). MDPI and/or the editor(s) disclaim responsibility for any injury to people or property resulting from any ideas, methods, instructions or products referred to in the content. |
© 2023 by the authors. Licensee MDPI, Basel, Switzerland. This article is an open access article distributed under the terms and conditions of the Creative Commons Attribution (CC BY) license (https://creativecommons.org/licenses/by/4.0/).
Share and Cite
Zhou, Q.; Zhang, S.; Deng, W.; Wang, J. Has Rural Public Services Weakened Population Migration in the Sichuan–Chongqing Region? Spatiotemporal Association Patterns and Their Influencing Factors. Agriculture 2023, 13, 1300. https://doi.org/10.3390/agriculture13071300
Zhou Q, Zhang S, Deng W, Wang J. Has Rural Public Services Weakened Population Migration in the Sichuan–Chongqing Region? Spatiotemporal Association Patterns and Their Influencing Factors. Agriculture. 2023; 13(7):1300. https://doi.org/10.3390/agriculture13071300
Chicago/Turabian StyleZhou, Qianli, Shaoyao Zhang, Wei Deng, and Junfeng Wang. 2023. "Has Rural Public Services Weakened Population Migration in the Sichuan–Chongqing Region? Spatiotemporal Association Patterns and Their Influencing Factors" Agriculture 13, no. 7: 1300. https://doi.org/10.3390/agriculture13071300