Article

Correlation between Kinetics of Pectin Degradation and Texture Loss of Okra (Abelmoschus esculentus L.) Puree during Thermal Treatments

1
UMR Qualisud (Univ Montpellier, Avignon Université, CIRAD, Institut Agro, IRD, Université de La Réunion), F-34398 Montpellier, France
2
CIRAD, UMR Qualisud, F-34398 Montpellier, France
*
Author to whom correspondence should be addressed.
Agriculture 2024, 14(10), 1687; https://doi.org/10.3390/agriculture14101687
Submission received: 22 July 2024 / Revised: 15 September 2024 / Accepted: 23 September 2024 / Published: 26 September 2024
(This article belongs to the Section Agricultural Product Quality and Safety)

Abstract

:
Okra is a common vegetable in the African cuisine, known for its distinctive slimy texture. Plant cell walls include hydrocolloids, especially pectin, which contribute to their sliminess. This textural property is known to become lost during thermal treatment. In this research, okra hydrocolloid is extracted and used to produce a model medium at a pH of 6.0, representing okra’s natural state. This medium is subjected to various controlled thermal treatments (70–130 °C) to evaluate their impact on pectin degradation. At the same time, the texture of okra puree is also assessed using an instrumental method under the same conditions. The two main products of pectin degradation—reducing end sugars from depolymerization and methanol from a demethylation—are measured and found to show an increase as a function of time and temperature. Kinetic modeling indicates that a first-order reaction fits well with the experimental concentrations of both products. The rate constants, as a function of temperature, aligns with the Arrhenius model, confirming the chemical basis of the degradation. Instrumental results correlate well with the production of methanol and reducing end sugars, indicating that pectin degradation is the primary cause of texture changes during the thermal treatment of okra and that this change can be controlled by adjusting the temperature.

1. Introduction

For both nutritional adequacy and environmental sustainability, diversifying and utilizing plant-based resources is essential. This strategy helps meet the needs of an expanding global population and maintain the nutritional balance of that population while reducing the strain on land and other natural resources [1]. In addition to their nutritional and energetic value, plant-based products have appealing organoleptic qualities that make them attractive on the market. These qualities must be preserved throughout the entire supply chain, from producer to consumer. Therefore, for plant-based foods to become a more integral part of people’s daily diets, they must meet consumer preferences for taste and texture while also being safe for consumption.
Okra is a species with unique textural characteristics that is becoming more and more popular on the market. The entire plant is edible [2] and is considered a multipurpose crop, as every part of the plant—leaves, buds, flowers, pods, stems, and seeds—can be used in various dishes [3]. However, the main edible part is the fruit, which is green, slightly curved, and has six-chambered fibrous pods [4]. These can be consumed fresh or in dehydrated forms [5] and can also be prepared through boiling or frying [3]. The mucilaginous texture of okra is highly prized in the African cuisine, as it enhances the palatability and ease of consumption of various dishes [6]. This property is characterized by the ease of swallowing rough-textured foods due to the water suspension provided by the okra [7]. The nutritional composition of okra varies based on the cultivar and growing conditions. The average dry matter content is estimated at 8–18 g per 100 g of fresh weight. The most abundant components of this dry matter are fibers (8.16 g per 100 g fresh weight), carbohydrates (4.86 g per 100 g fresh weight), and protein (3.55 g per 100 g fresh weight), while the fat content is relatively low (0.066 g per 100 g fresh weight) [8,9,10,11,12,13]. In addition to these macronutrients, okra is also a good source of micronutrients, including vitamins (K, A, C, B9, etc.) and minerals (K, Ca, Mg, P, etc.) [12,13,14,15]. Okra pods and seeds are also rich in phenolic compounds [16,17].
Regarding sensory properties, okra has a mild acidic taste. Its distinctive slimy texture comes from its mucilage, which consists of complex carbohydrates [18,19], primarily pectic polysaccharides [4], as confirmed by the relatively high content of uronic acids [20,21]. The pectin in okra pods mainly include galactose, rhamnose, and galacturonic acid [22,23], with α-(1-4) linked D-galacturonic acid units esterified with methanol in varying amounts [24,25]. The pectin in okra is concentrated in the walls of the pods [1]. When cooked, the pectin is released, giving the okra its slimy texture and thickening dishes such as soups, stews, and sauces [2,9]. In addition to its direct food use, okra pectin can be utilized indirectly for both food and non-food applications [26,27]. For example, in gluten-free bread, okra pectin has been used to improve texture [28]. Okra has also been employed in traditional medicine, and further research has confirmed that its high content of polysaccharides and phenolic compounds has a positive effect on human health [9,29]. However, the potential of okra ingredients as low-cost functional foods still warrants further study from both functional and economic perspectives [15]. Various extraction protocols can be used to obtain functional polysaccharides from vegetables [30,31,32,33,34,35,36]. Most of these processes are complex, involving multiple steps of extraction and purification, all of which require significant resources, including time and reagents. The composition and structure of the polysaccharide extracts—and thus their functionality—can vary depending on the extraction procedure, particularly factors such as time, temperature, and pH [1,4,15,26,30,37].
Thermal treatments such as blanching, drying, and cooking degrade the okra’s texture in an irreversible way [10,21]. This poses a barrier to the consumption of stabilized okra-based products. Savouré et al. (2020) monitored the changes in okra’s rheological and textural properties during various preservation processes and formulations [38]. They found that higher temperatures during thermal treatment resulted in significant texture loss. They also developed a protocol to quantify the unique texture, as well as the viscous and elongation properties of okra [38]. Recently, researchers have explored new processes to preserve okra while avoiding high-temperature treatments and texture loss. Some of this research has focused on microwave drying [11], high-pressure sterilization [39], and ultrasound preservation [40]. However, these treatments are only marginally adopted in the food industry; therefore, further investigation is needed to optimize okra’s thermal treatments and understand the mechanisms leading to texture loss.
Pectin degradation can have either enzymatic or nonenzymatic origins, but it consistently results in detrimental consequences for the texture [41]. In the case of okra pectin, the primary degradation pathway is thermal degradation, which involves the following reactions: demethylation, acid hydrolysis, and β-elimination [42]. Demethylation is the cleavage of methyl ester groups, leading to the release of methanol. While this reaction does not alter the length of the pectin chain, it affects the rate of depolymerization reactions. Depolymerization includes two main processes: acid hydrolysis and β-elimination. Both of these processes lead to the cleavage of pectin chains, resulting in a loss of texture.
Studies on pectin puree from various sources have shown that the β-elimination reaction is promoted by increased temperature, higher methoxyl content, and higher pH. In contrast, acid hydrolysis is more pronounced with a low methylation degree and pH, although its rate also increases with temperature [43,44]. The rate constants for demethylation have been found to be minimal at a pH of 3.0 and increased at both lower and higher pH levels [45]. The β-elimination reaction can be completely halted by combining high temperature with high pressure [39].
No studies have been conducted on the behavior of pure okra pectin during thermal treatments. Additionally, there is no research that addresses both textural degradation and the chemical reactions of okra pectin to understand the origin of texture loss. Therefore, this work aims to better understand the degradation pathways of okra hydrocolloids by studying both the textural degradation of okra puree and the chemical degradation of purified okra pectin in a model system during thermal treatments. Studying the reactivity of okra hydrocolloids directly in the complex real matrix is challenging. An effective approach is to use a simplified medium made of pectin extracted from okra. This model system tracks the two main degradation reactions—demethylation and depolymerization—and present their kinetics as a function of different thermal treatments. Additionally, texture loss in okra puree is monitored under the same conditions to analyze its potential correlation with pectin chemical indicators. The results enhance our understanding of the relationship between textural properties and hydrocolloid degradation in okra pectin.

2. Materials and Methods

2.1. Materials

Okra fruits were purchased from the local market in Montpellier (France). The initial moisture content was 89.5% on a wet basis.
Pods were stored at 4 °C until used. In the laboratory, okra pods were selected manually before each trial to avoid damaged fruits or fruits at different maturation stages. Before the experiment, pods were washed in clean water, cut in half, and the seeds and calyx were removed.
One kilogram of blanched, seedless fruits was prepared for grinding. A vacuum grinder (Robot Coupe, Montceau-les-Mines, France) was used because okra’s slimy texture produces foam during grinding under ambient pressure. The grinding was conducted at the highest speed for 3 min. The resulting optimized puree was then vacuum-packed in polyethylene bags and stored at −20 °C until the next trial.
Guaiacol, hydrogen peroxide, all buffer salts, ethanol (96% w/w), acetone, sodium tetraborate, 3-phenylphenol, D-galacturonic acid monohydrate, methanol solution, acetylacetone, acetic acid, ammonium acetate, and enzyme alcohol oxidase were obtained from Sigma-Aldrich (St. Louis, MO, USA).

2.2. Methods

2.2.1. Blanching Test and Production of Okra Puree

Okra fruits were selected manually to achieve equality in fruit size and, therefore, promote a homogenous blanching effect. One kilogram of fresh okra was washed in clean water, the pods were cut in half, and the seeds and calyx were removed. Blanching was performed in a food steamer (VC145100, Seb, Ecully, France) at 100 °C for 4 min. After blanching, the halves were crushed in a mortar and the puree was subjected to a peroxidase test (POD). The test was conducted in order to check if the blanching procedure had been successful [46]. The test was repeated three times. The puree was stored in vacuum bags at −18 °C in small quantities and samples were subjected to extraction steps (Section 2.2.3) or directly to thermal treatments (Section 2.2.7) as needed.

2.2.2. Moisture Content

Moisture content was calculated by gravimetry, according to the AOAC 1999 method [47]. The water content of the samples was expressed on a wet matter basis. All measurements were performed in triplicates.

2.2.3. Extraction of Okra Pectin

Different extraction protocols were tested (cf. result section) and results showed that the best one was inspired by Alba et al. [32] but with many optimizations: extraction of the pectin from the okra puree was performed in a Thermomix TM6 (Vorwerk, Wuppertal, Germany). The frozen puree sample from the vacuum bag was thawed and then mixed with a phosphate buffer at a pH of 6.0. The extraction lasted one hour with constant mixing at 80 °C. The temperature was chosen to facilitate the solubilization of insoluble pectic substances (protopectin) [48,49]. Separation of the supernatant was attained by using the centrifugation method for 10 min at 10,000× g. Then, the pectin from the supernatant was precipitated and purified with the use of solvents. The obtained pectin was dried in a vacuum dryer for 12 h at 40 °C and ground in a Thermomix TM6 (Vorwerk, Wuppertal, Germany). The final conditions are presented in the results section.

2.2.4. Pectin Yield

The yield was calculated on a wet matter basis using Equation (1), which is a ratio of grams of dry pectin to grams of fresh okra.
Yield   ( % ) = g   ( p e c t i n ) g ( f r e s h   O k r a ) × 100 %   ( w . b . )

2.2.5. Reactivity of Extracted Pectin to Temperature and pH

Formulation of Model Medium

To mimic the okra, the model medium was prepared with 1.5% pectin solution in 0.1 M phosphate buffer at a pH of 6.0. A solution of 1.5% had the nearest instrumental stringiness to the fresh okra and the pH of 6.0 corresponds to the pH of okra in its natural state [38,50]. Pectin was dissolved under magnetic stirring for one hour. Dissolution of pectin was facilitated with a water bath at 55 °C. The glass with the pectin powder and buffer was placed in the water bath with constant stirring. This light increase in the temperature facilitated pectin solubilization. After the pectin was completely dissolved, the model medium was then placed in glass screw-capped test tubes, 6 mL each, and stored at −20 °C until use.

Thermal Treatments

Test tubes with the model medium underwent various thermal treatments to monitor the degradation of the hydrocolloid structure during prolonged heating. Samples were subjected to the treatments presented in Table 1. Thermal treatments were conducted in an oil bath and the temperature in the sample and oil bath was monitored by a type J thermocouple associated with a data logger (Almemo, Ahlborn, Germany). After each treatment period, the test tube was placed in an ice bucket to halt the degradation reaction. Each sample was prepared in triplicates and stored at −20 °C until analysis.

2.2.6. Chemical Characterization

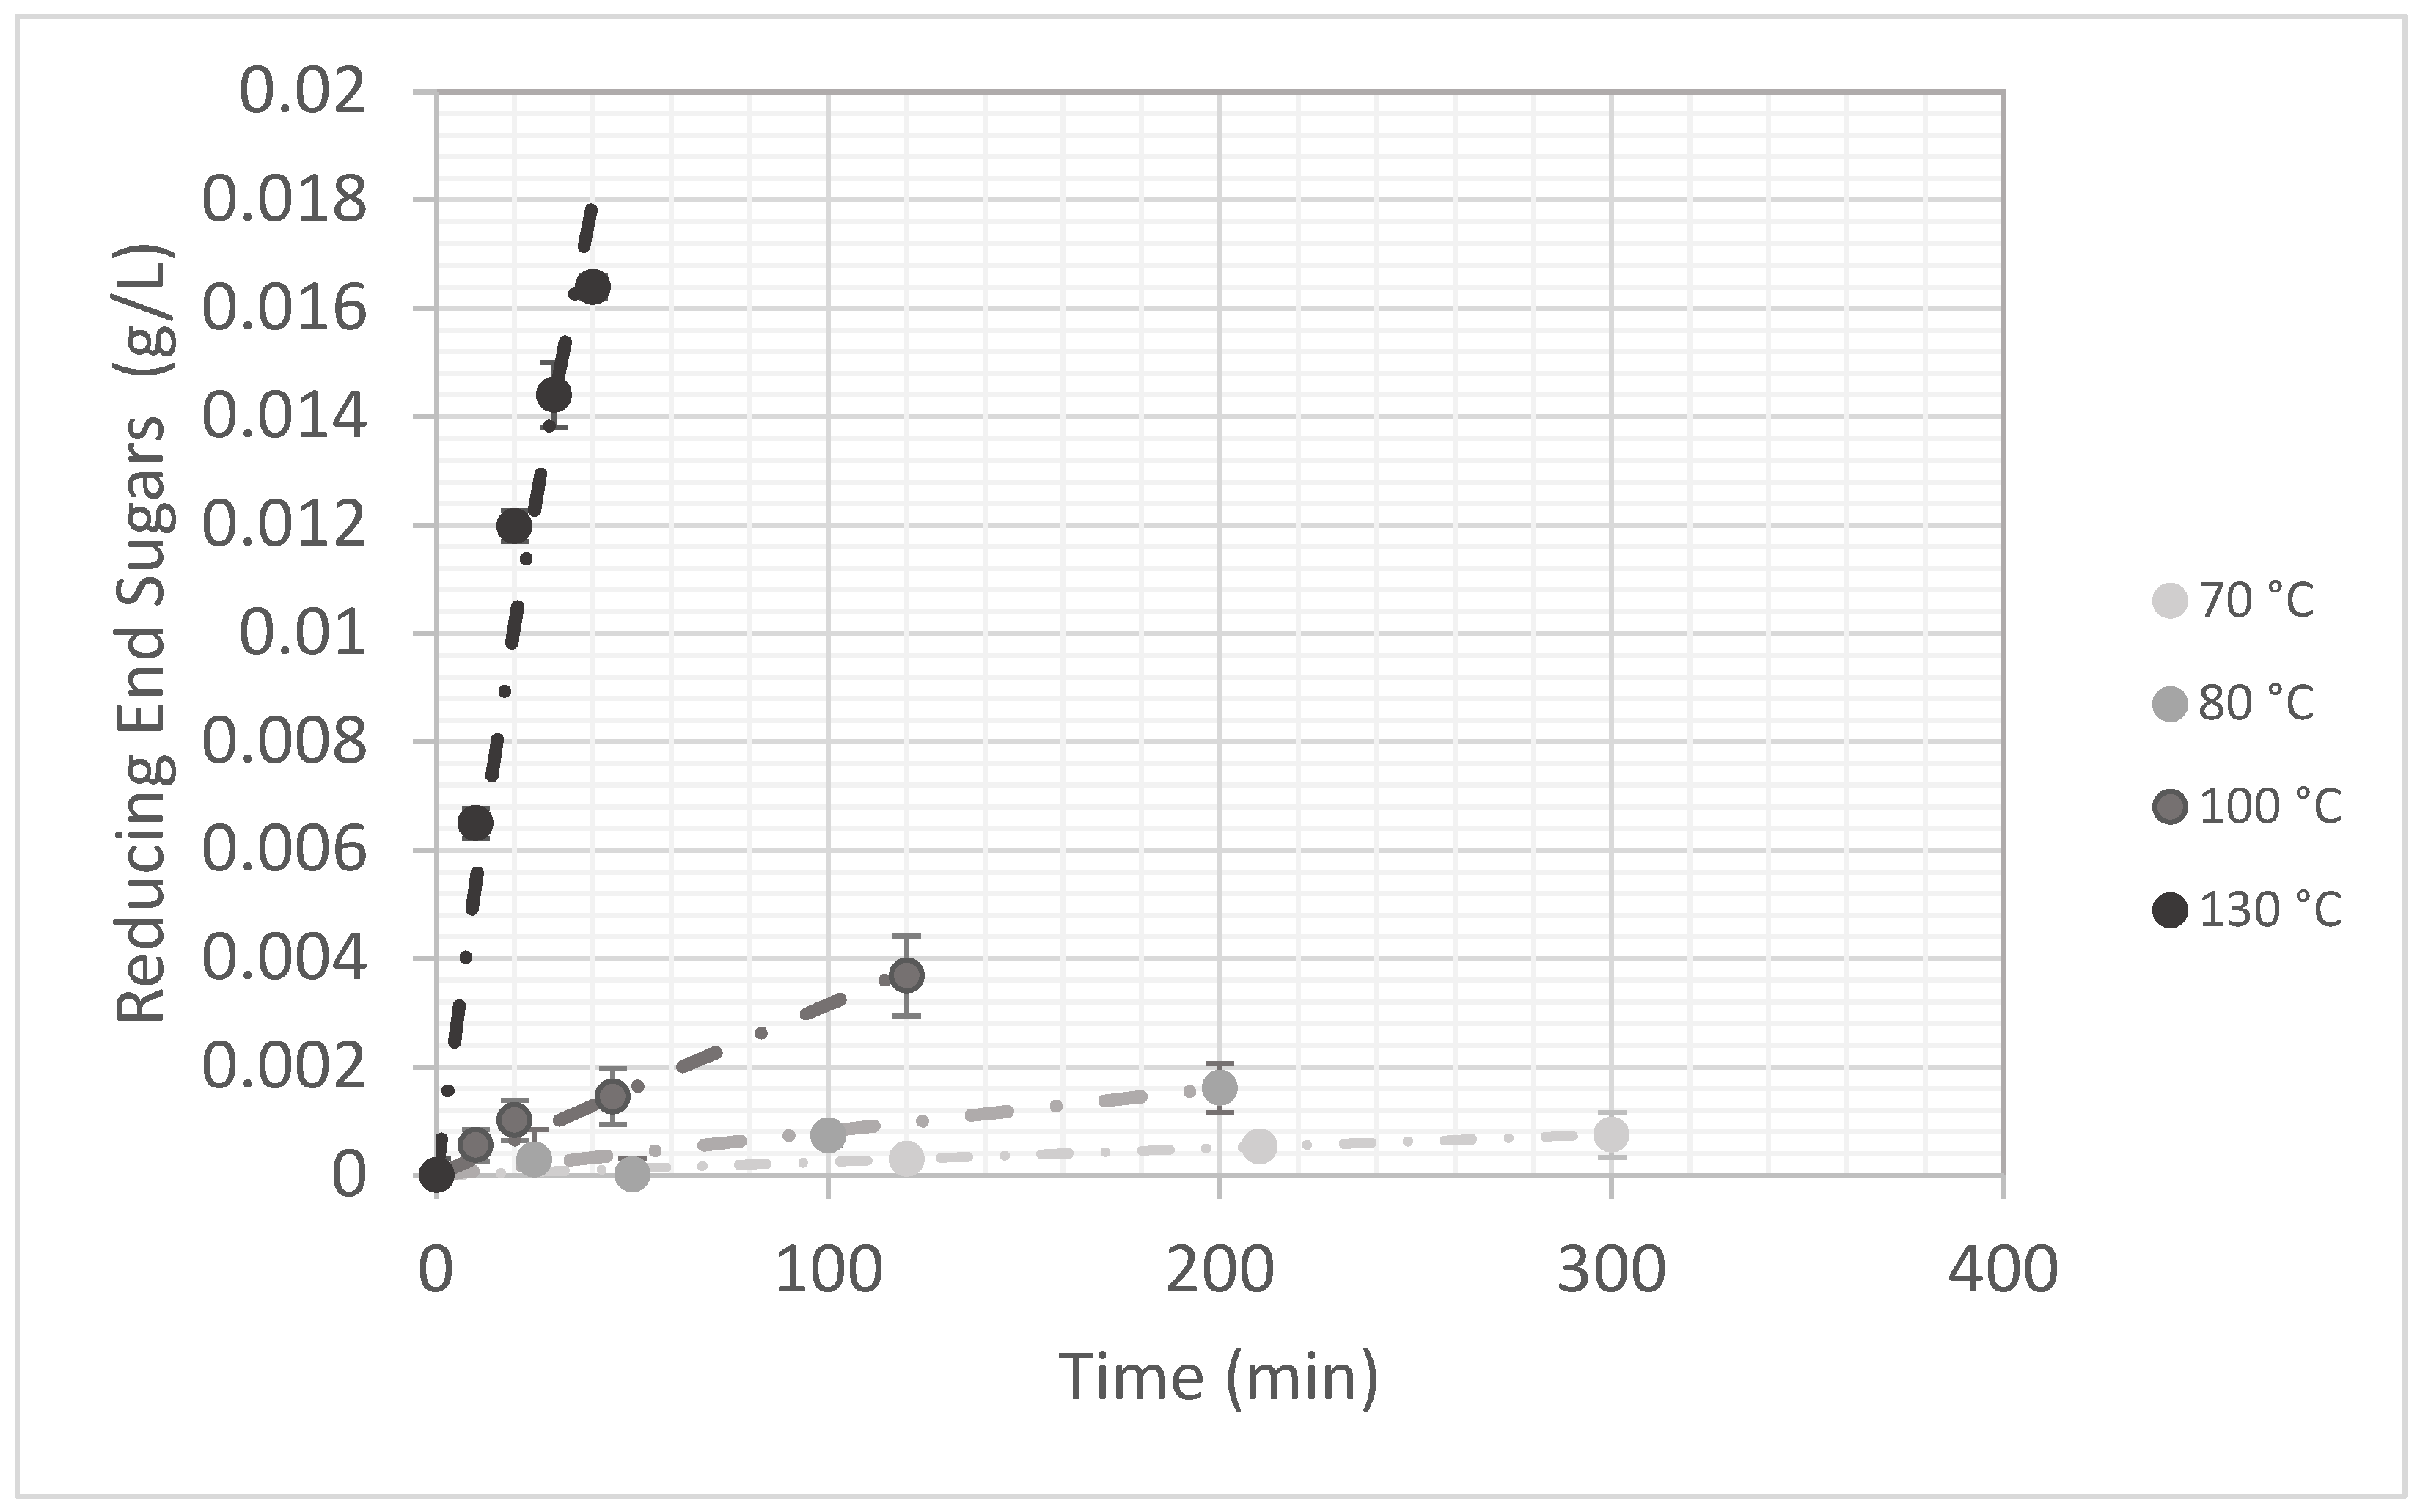
Reducing End Groups (Galactose Equivalent)
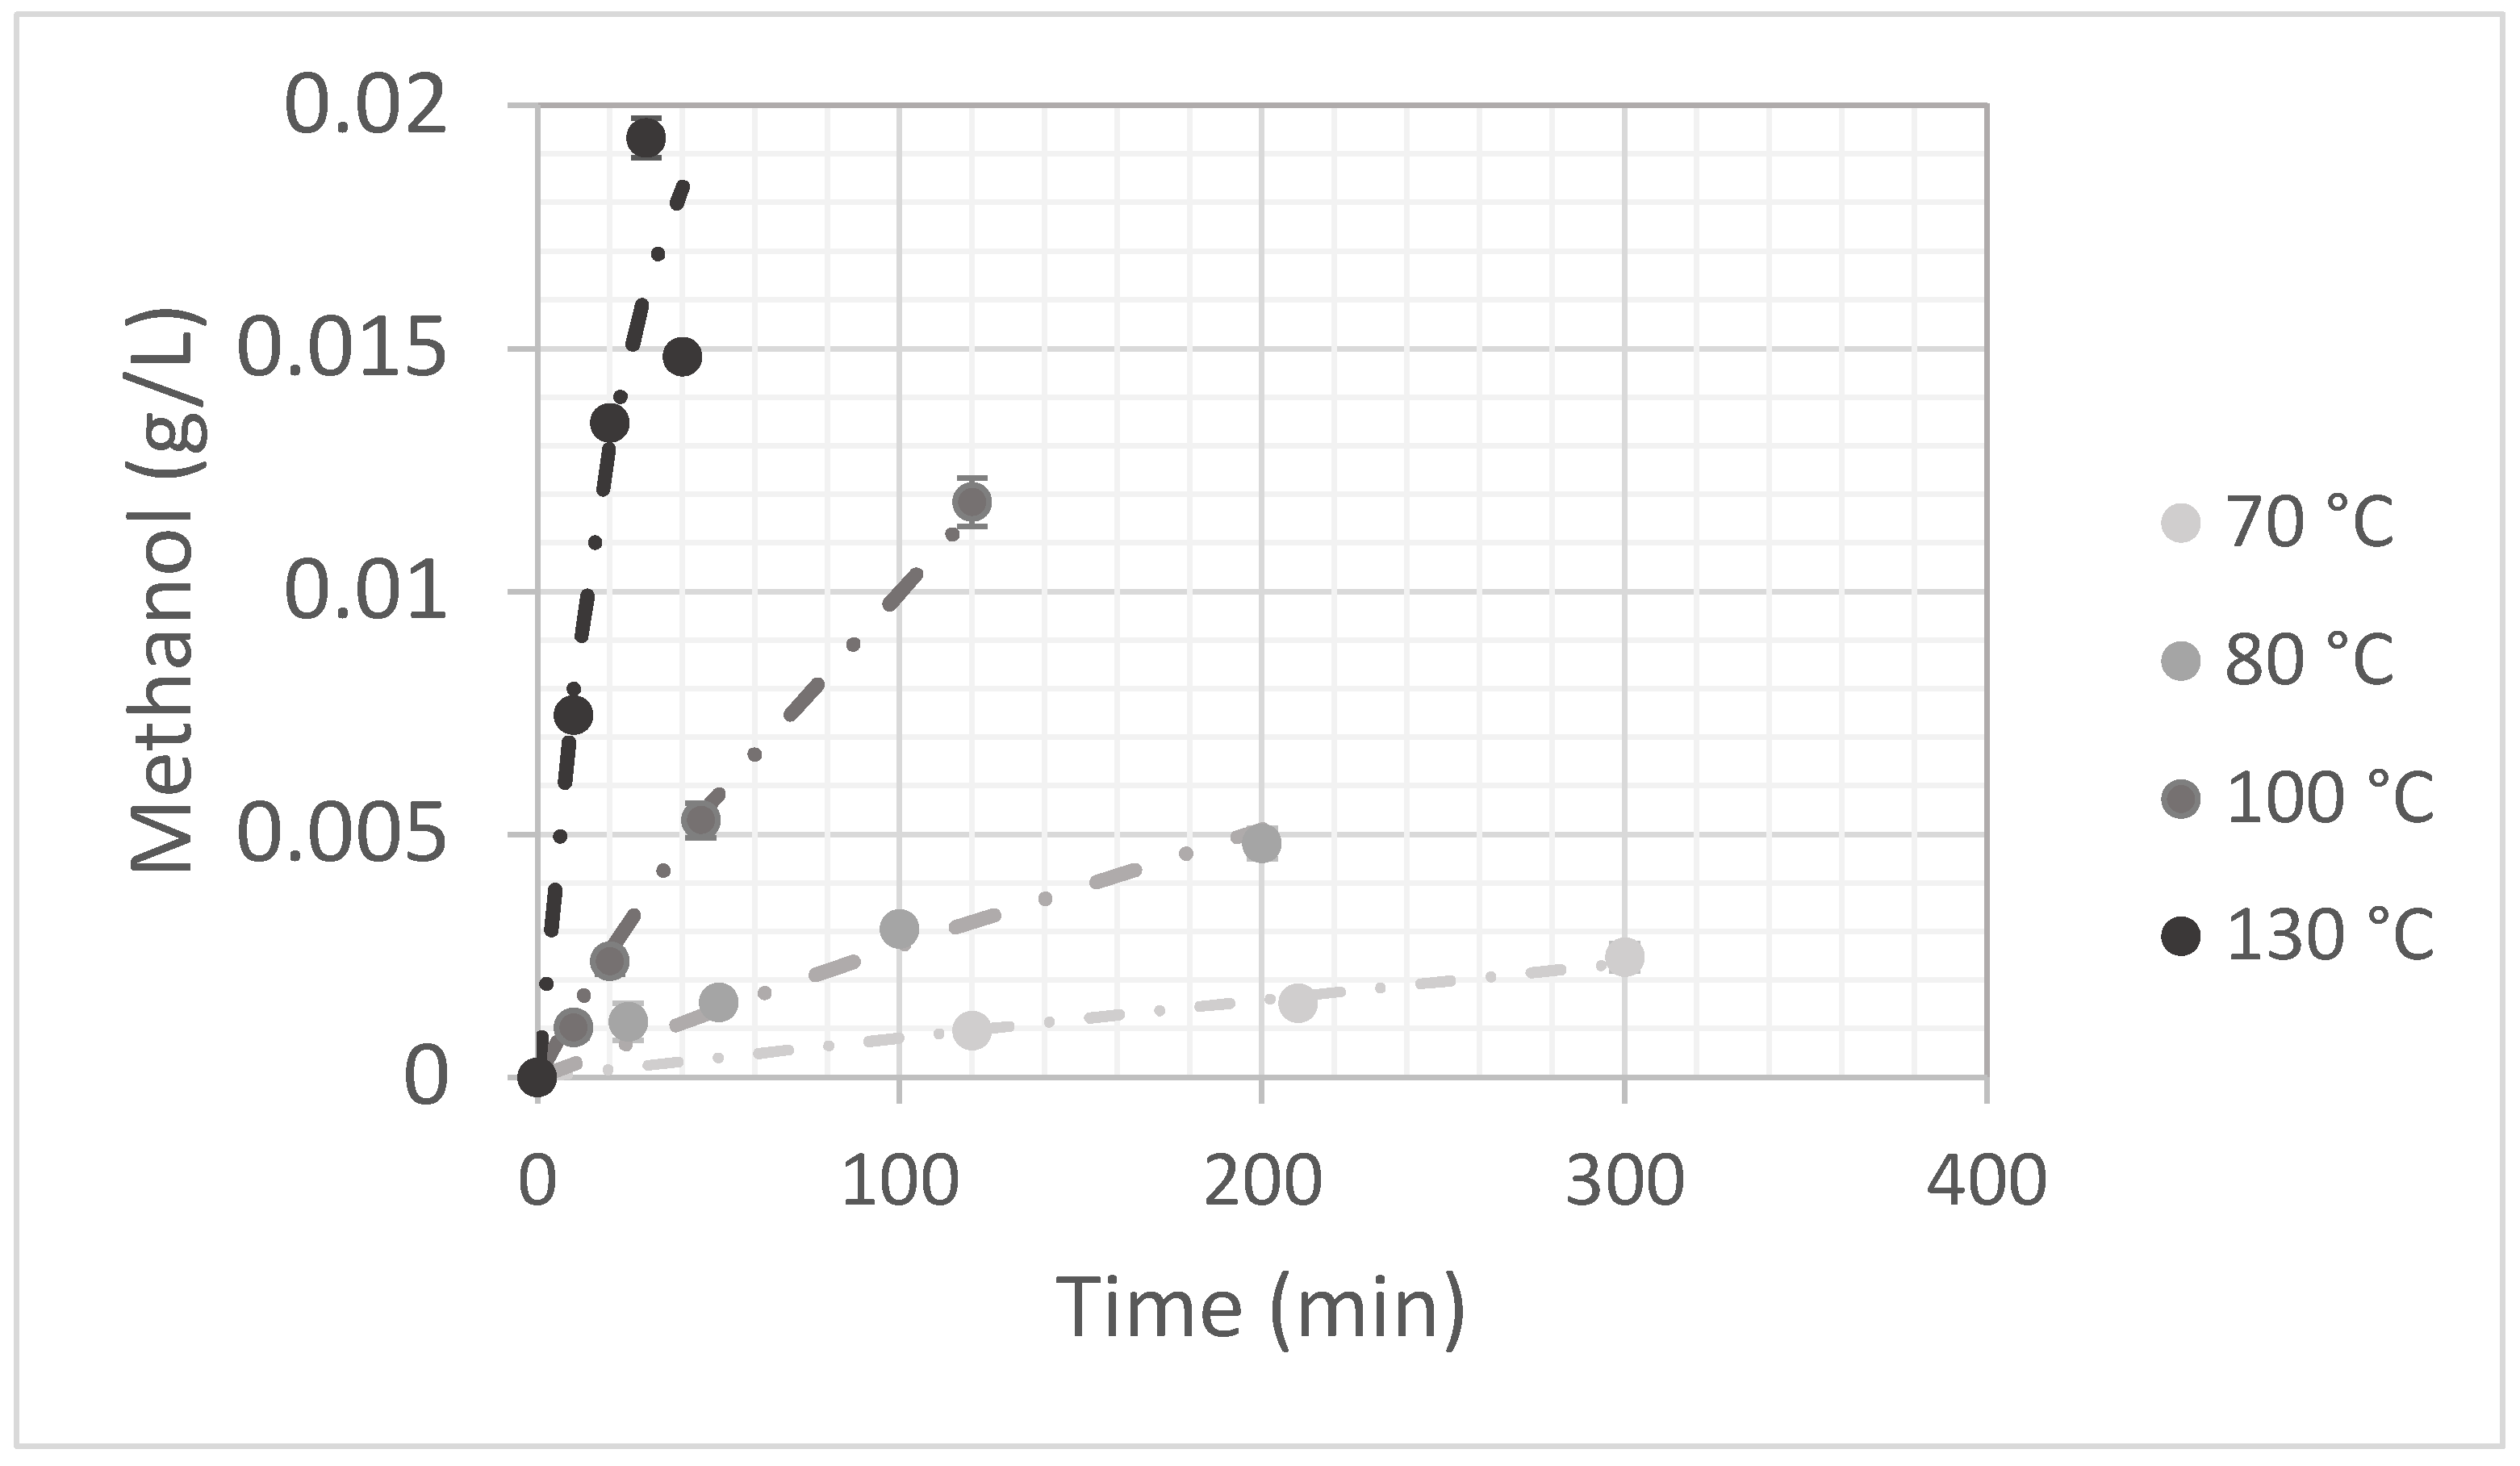
Reducing sugars are produced during depolymerization reactions and pectin cleavage. They were measured following the assay described by Waffenschmidt et al. [51]. The reaction involves the bicinchoninate reagent reacting specifically with reducing sugars. The intensity of the color formed is directly proportional to the concentration of reducing sugars present in the sample. The absorbance of the lavender-colored product was read at 560 nm with a Specord S600 (Analytik Jena, Jena, Germany). According to Alba et al. [32], the most represented reduced sugar in okra pods is galactose. Therefore, the total reducing sugar concentration was calculated using an equation obtained with a galactose calibration curve at concentrations between 0.0008–0.0036 g/L (R2 = 0.99). All measurements were performed in triplicates.

Methanol Production

Demethylation causes methanol liberation. In order to measure the amount of methanol released from pectin, a spectrophotometric method was used involving a reaction with alcohol oxidase [52]. Methanol is converted to methanal under the action of an oxidoreductase enzyme. A phosphate buffer at a pH of 7.5 was used in order to attain the highest enzyme activity. Then, 2,4-pentanedione, ammonium acetate, and methanal reacted together, forming a colored compound (3,5-diacetyl-1,4-dihydro-2,6-dimethylpyridine) which absorbed at 412 nm and was read with a Specord S600 (Analytik Jena, Jena, Germany). A methanol standard curve was used, with concentrations ranging from 0.00315 to 0.1575 g/L (R2 = 0.99). All measurements were performed in triplicates.

2.2.7. Thermal Treatments of Okra Puree

In order to reproduce homogeneous isothermal treatments for the puree, the heat treatments were carried out in hermetic test cells, made of stainless steel and of a design similar to those developed by Jiménez et al. [53]. A type J thermocouple (TC Direct, Dardilly, France) was located at the geometric center of one of the compartments and was connected to an Almemo 2690-8A data logger (Ahlborn, Holzkirchen, Germany). The evolution of the temperature of the product during the heat treatment was monitored. Each sample of okra puree was introduced into the device at room temperature (25 ± 2 °C) and then immersed in an oil bath equipped with a thermostat. When the hold time had elapsed, the device was immersed in an ice bath (0 °C) until the core temperature reached 25 °C. The sample was then removed from the cell and stored at 4 °C overnight until analysis.

2.2.8. Textural Measurements on Okra Puree

Before performing the rheological and textural measurements, each sample was immersed in a water bath to be returned to room temperature (25 °C ± 1 °C). Then, distilled water was added to adjust their water content at 17% dry basis (d.b.). Indeed, previous results have shown that the water content has a positive effect on the stringy properties of okra purees [38].
In order to measure the stringiness, a three-step procedure was defined using the experimental device described by Savouré et al. [38]:
  • Recording of a stretching test with a camera: after having been placed in a steel cylinder (diameter = 3 cm; depth = 5.2 cm), each sample was left to relax for 2 min. Next, a Stable Micro Systems (Surrey, UK) TA.XT plus texture analyzer equipped with a cylindrical PVC probe (diameter = 2 cm) was used to perform a stretch test (probe descent rate = 10 mm∙s−1, 2 mm penetration of the probe into the sample after detection of a trigger force of 19.6 mN; ascent rate of the probe = 40 mm∙s−1). A penetration of 2 mm of the probe into the sample, before stretching, is intended to ensure good adhesion between the probe and the suspension.
  • Extraction of the image corresponding to the maximum length of elongation of the filament, reached during the ascent of the probe. The VLC Media Player (VLC 3.0.16) software was used to capture and extract the image from the stretch test film.
  • Measurement of filament length in cm before breaking with the Image J (version 2.0.0) software [54,55].
Each measurement was repeated 15 times.

2.2.9. Mathematical Modeling

Texture loss was found to follow a first-order reaction kinetic. The degradation can be described according to the following equation:
T = T 0   e k l t
where T is the texture and, more precisely, the stringiness measured in Section 2.2.8 as a function of time t, T0 is the initial texture, and kl is the rate constant of texture loss.
Demethylation and hydrolysis of okra hydrocolloids were found to follow a first-order reaction kinetic. The products of both reactions were methanol and reducing end sugars, respectively, so that, under a constant temperature, the concentrations of the different degradation products Pi increased according to Equation (3):
P i = P   1 e k p i t
with Pi representing the concentration of the product i, methanol or reducing sugars, P representing the concentration of both products at the end of the reaction, and kpi representing the production rate constant. We assumed an initial concentration P0 = 0 at time t = 0.
The rate constants kl and kpi were assumed to vary with the temperature according to the Arrhenius law (Equation (4)):
k = k r e f · e E a R 1 T 1 T r e f
where kref is the rate constant at the reference temperature (70 °C) and Ea, T, and R are the activation energy (J∙mol−1), bulk temperature (K), and gas constant (8.314 J∙mol−1∙K−1), respectively.
The reaction rates were identified by nonlinear regression with a least square minimization procedure using the complement Excel “Solver”. This procedure allows for a more accurate identification of constants compared to the usual logarithm linearization [56]. Uncertainty of the rate constants was obtained using the VBE Macro “SolverAid” [57]. The R2 was calculated from the residual sum of the square.

3. Results and Discussion

3.1. Extraction of Okra Hydrocolloid

Standard protocols for pectin extraction, especially from fruit, recommend the extraction of pectin from alcohol-insoluble solids (AIS). Cell wall isolation from AIS may be achieved under different conditions of ethanol extraction and different temperature conditions [34,36]. This protocol was tested on okra. We also decided to use a most specific and gentle extraction procedure suggested by Alba et al. for okra cell wall material extraction [32]. As a result, by implementing the AIS extraction protocol followed by purification, we obtained a yield of 1.8% with a very low stringiness of the resulting polysaccharides, while, by using Alba’s, we obtained a yield of about 4%. These tests helped us decide to use Alba’s protocol for further research. This protocol was then optimized with the goal of reducing the use of reagents and decreasing the duration of the protocol. Different conditions were tested and resulted in a simplified extraction procedure presented in Figure 1.
Optimization of this protocol considered adjustments for each step. The main condition change during extraction was the use of a buffer in a ratio of 1:10 (w/v) solid-to-liquid compared to Alba’s protocol, where this ratio was 1:15 (w/v). Other changes concerning precipitation and purification steps were as follows: after extraction, the collected supernatant was subjected to pectin precipitation by using pure ethanol in the ratio of 1:2.5 (w/v) for our research compared to the 1:2 (w/v) ratio in Alba’s protocol. In Alba’s work, precipitated pectin was then washed with an organic solvent to remove compounds such as pigment (chlorophyll) in a ratio of 1:1 (w/v) with isopropanol and two concentration steps with rotary evaporation to 1/3 of the initial level. In the present work, washing was done with acetone in a ratio of 1:1 (w/v) and concentration steps were skipped. The extracted pectin in Alba’s protocol was dried at 70 °C for 10 min, but in our case, drying was done at 40 °C for 12 h under vacuum to avoid pectin degradation. Alba’s protocol also contained two steps of purification that were not performed in the present research. The first step was to extract lipid-free material and perform an extraction with petroleum ether (bp 40–65 °C). Since this step is long and okra pods have a low lipid content, lipid removal was avoided alongside the dialysis step against deionized water which lasted 3 days. The removal of the mentioned steps led to significant savings with respect to used solvents and time. Finally, the optimization of Alba’s protocol speeded up the extraction protocol for 4 days. To ensure that the removal of the purification steps was not detrimental to the functionalities of okra pectin, a 1.5% solution was prepared and the stringiness measured: it was close to that of fresh okra, showing that the extraction was efficient and did not denature the pectin (Figure S1). The pectin yield obtained by implementing Alba’s optimized protocol in this research was 4.24% and 4.13% w.b. for two batches of experiments. This value is in the range of the fiber content of 3–8% w.b. found in the literature for okra [9,58]. This large range may be due to the variability in the composition of the initial okra due to different places of origin and different varieties. In addition, the value of pectin content may be lower than the fiber content because of the presence of other cell wall polysaccharides such as hemicellulose and cellulose.

3.2. Kinetic of Okra Pectin Degradation: Demethylation and Hydrolysis

To monitor precisely the degradation reactions of okra pectin and avoid interactions with the other constituents in the matrix during analysis, the previous extracts were used in a model medium.

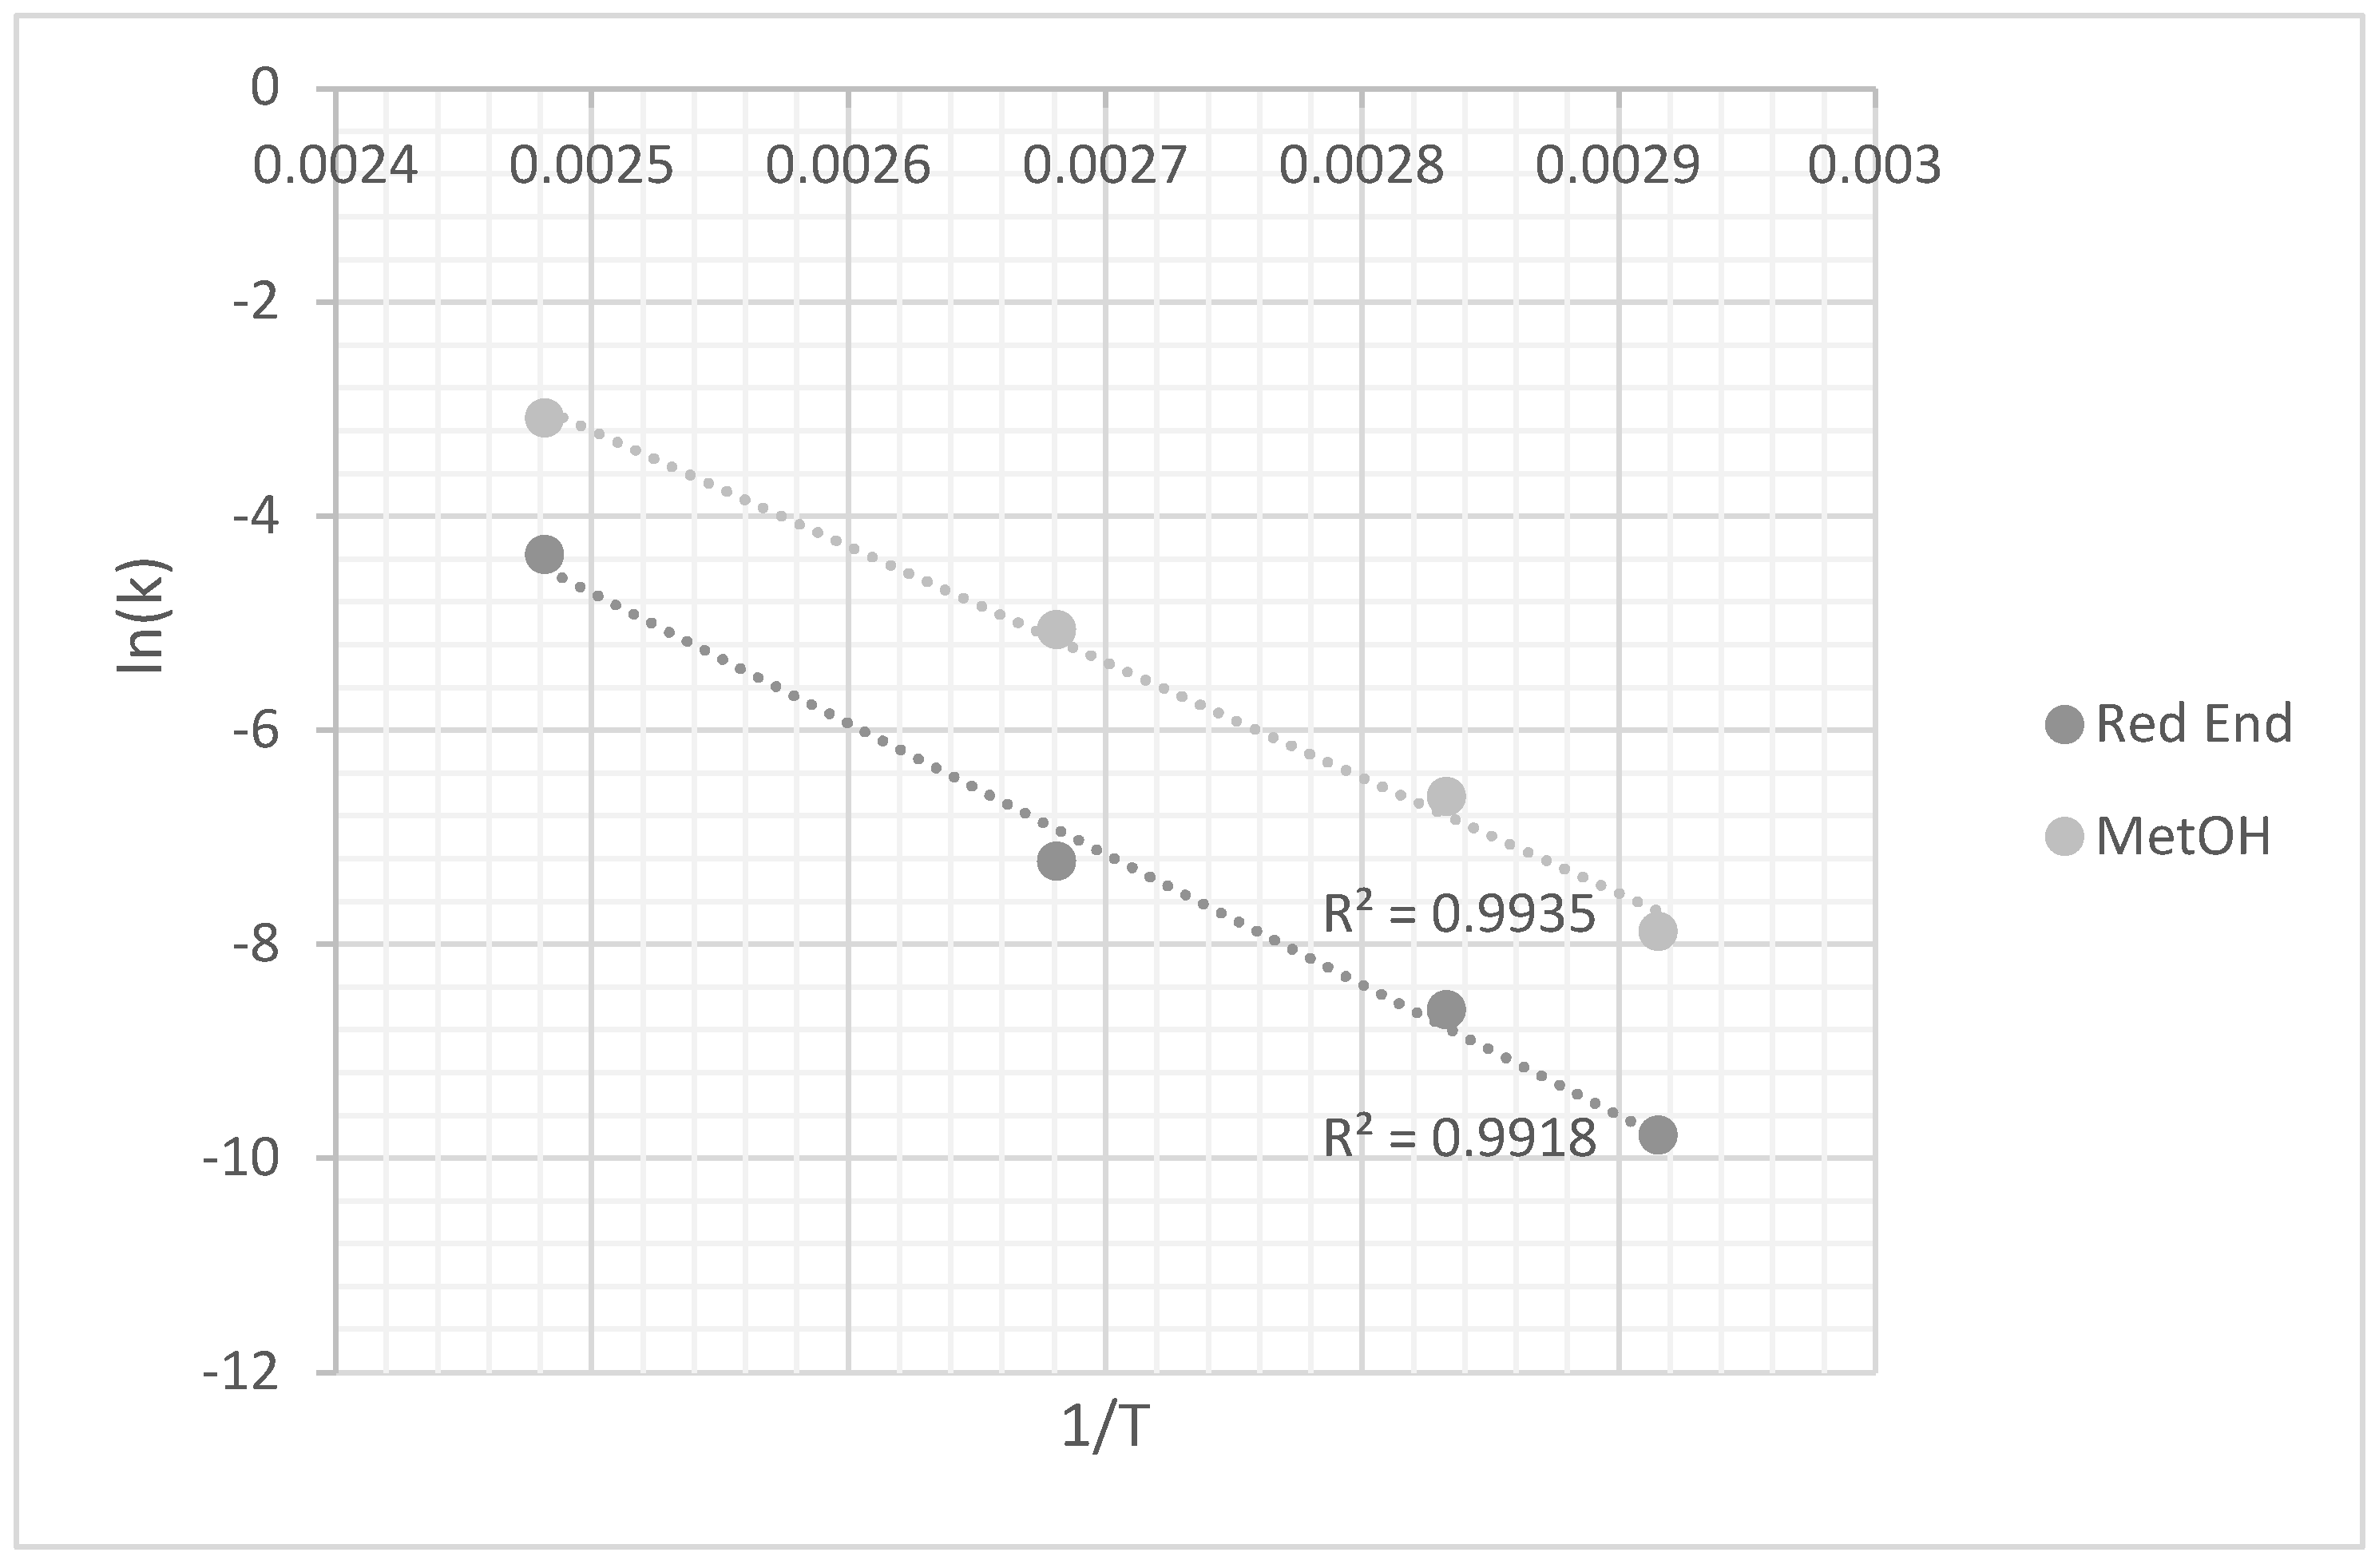
3.2.1. Temperature Effect

Two reactions, demethylation and depolymerization, were followed during the different temperature treatments, by monitoring the products of those reactions, methanol and reducing end groups, respectively.

Demethylation Reaction

Generally, the methanol increased as a function of time under all assessed temperatures (Figure 2). The concentration of methanol released from the pectin structure increased slightly during heating for up to 300 min when the model medium was heated at 70 °C. There was a steady increase in methanol in the model medium heated at 80 °C for up to 200 min, whereas heating at temperatures ≥ 100 °C led to a faster and higher release of methanol with a trend of continued increase. The temperature of 130 °C provided the highest concentration of methanol in the shortest time: 40 min. By monitoring the presented graph, the assumption was that longer treatments would release a higher concentration of methanol at this temperature.
The dashed lines in Figure 2 represent the one-order model increase of methanol as a function of time for the different temperatures. The rate constant obtained and R2 are presented in Table 2. For all temperatures, the model fitted well with the experimental data (R2 = 0.92–0.99). Therefore, demethylation may be a direct and total reaction from pectin during thermal treatment, leading to pectin with a decreased degree of demethylation. This trend was also observed by Fraeye et al. [45] and Constenla et al. [59].
Table 2 shows the different temperatures and the reaction rate constants of the pectin demethylation studied. The rate constants significantly increased with an increase in temperature, more precisely 3.5-fold from 70 °C to 80 °C, 15-fold from 70 °C to 100 °C, and 100-fold from 70 °C to 130 °C. Therefore, this trend may show an exponential effect of temperature on the demethylation reaction rate. Constenla et al. [59] found a three-fold increase in the demethylation rate from 65 °C to 80 °C for apple pectin. This result is close to what we found. De Roeck et al. [39] found a six-fold increase in the rate from 70 °C to 100 °C in apple pectin as well, which is lower than what we found but in the same range.
The temperature dependence of the reaction rate constants could be adequately modeled with the Arrhenius equation, resulting in activation energies of 82.7 kJ mol−1 (Table 3 and Figure 4) for demethylation. De Roeck et al. [39] found an activation energy of 70.8 kJ mol−1, which is close to what we found.

Depolymerization Reaction

When heated, reducing end sugars increased in okra pectin solutions as a product of pectin hydrolysis (Figure 3). The more the temperature increased, the more the rate constant of the reaction increased. As for methanol release, galactose equivalent production was well represented by a one-order model (R2 = 0.88–0.97). The rate constants are presented in Table 3.
Compared with the demethylation reaction, the pectin hydrolysis rates were lower. At temperatures of 70 °C and 80 °C, the concentration of galactose was very low, but increased with time and temperature and exhibited rate constants about 10 times lower than those associated with demethylation. A significant increase in the concentration of galactose, as in the case of demethylation, occurred only after the implementation of the thermal treatment with a temperature above 100 °C. In the range of temperatures applied in this research, the speediest reaction took place at the temperature of 130 °C. At this temperature, the rate constant was closest to the demethylation reaction rate. Okra’s pectin was hydrolyzed, thus depolymerized, to a considerable extent, and we can assume a significant effect was exerted on texture loss.
The rate constants of pectin hydrolysis also followed the Arrhenius law (Table 4 and Figure 4). The rate constant increased as a function of temperature and, more precisely, it increased 3.5-fold from 70 °C to 80 °C, 13-fold from 70 °C to 100 °C, and 200-fold from 70 °C to 130 °C. The activation energy was 117.3 kJ mol−1, i.e., 40% more elevated than that of demethylation. This means that depolymerization is more sensitive to an increase in temperature. This trend was also observed by De Roeck et al., who found an activation energy of 70.8 kJ mol−1 for demethylation and 96.6 kJ mol−1 for depolymerization [39]. In their study, they found that the depolymerization reaction was due to the β-elimination reaction.

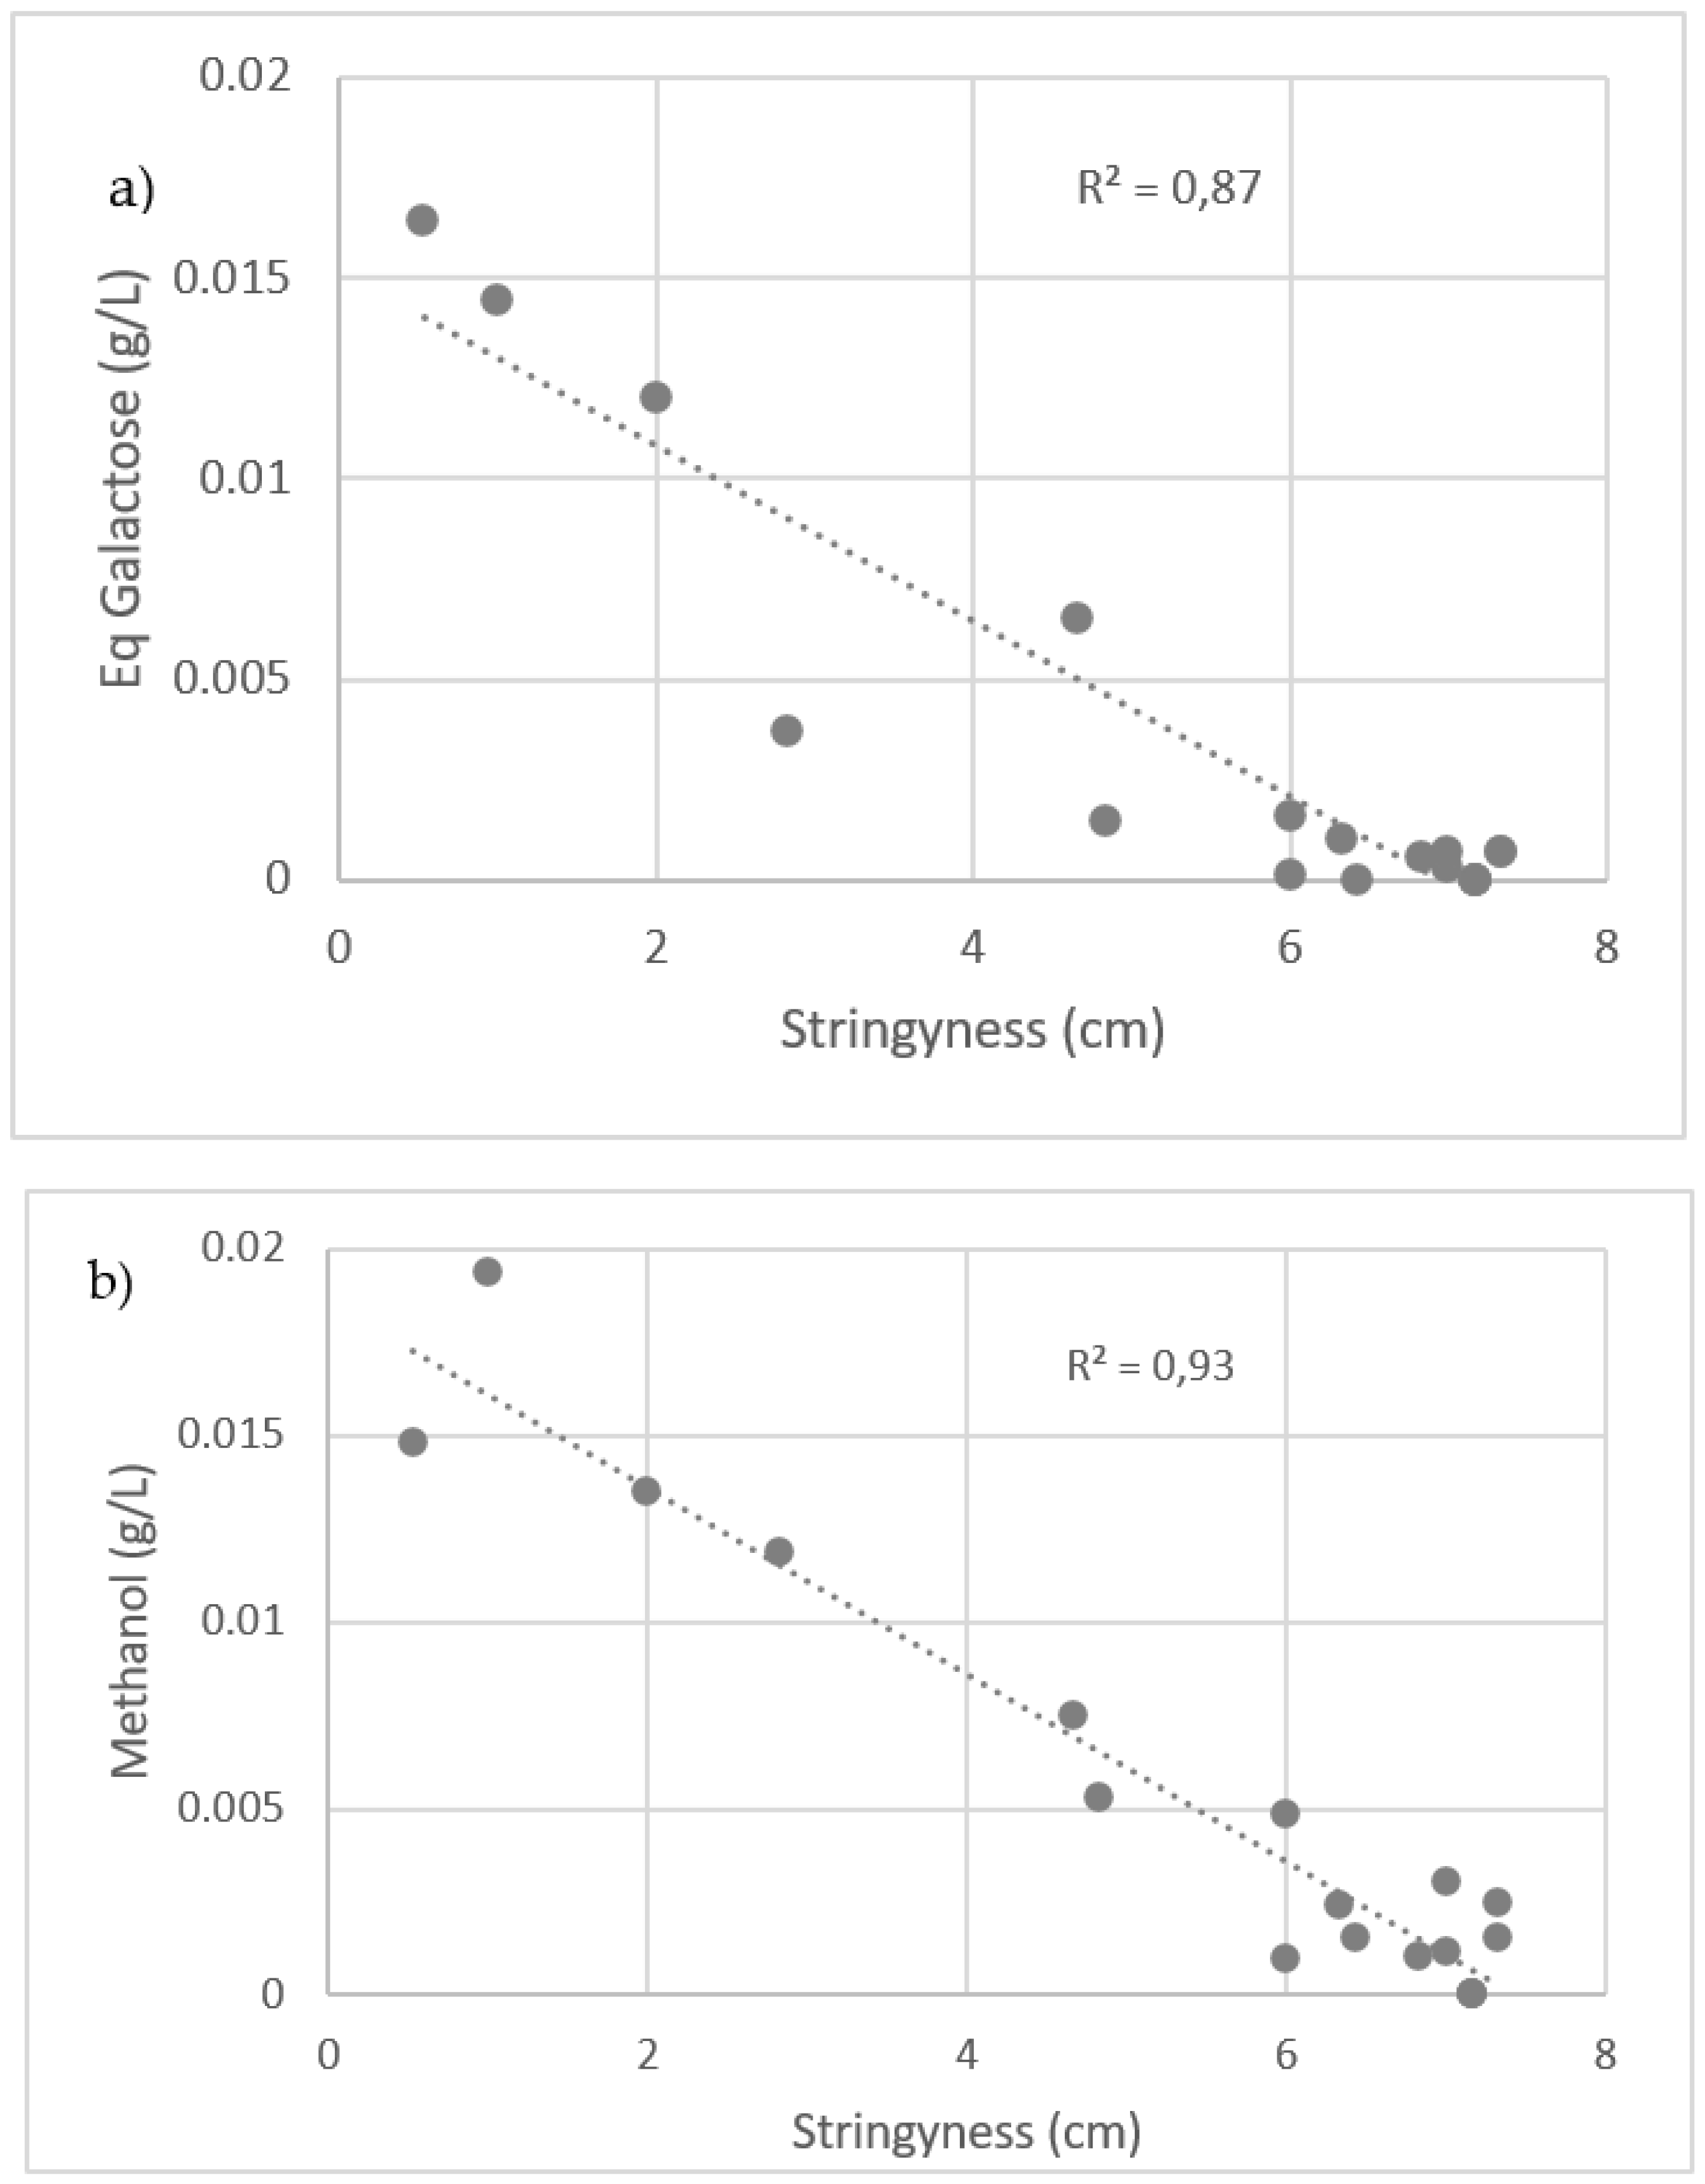
3.3. Stringiness Loss and Hydrocolloid Reactions

Figure 5 represents the evolution of the stringiness of okra puree during the thermal treatment. During this uniform isothermal treatment, it is interesting to observe that the stringiness decreased according to a one-order model kinetic. The rate constants were 9.5 × 10⁻⁵, 8.1 × 10⁻⁴, 7.7 × 10⁻³, and 5.7 × 10⁻² min−1 at 70 °C, 80 °C, 100 °C, and 130 °C, respectively. The activation energy found was 119 kJ/mol, which is close to that of depolymerization. This closeness confirms that texture loss is highly correlated to the hydrolysis of pectin.
To confirm this hypothesis, all the data from the thermal treatments were pooled, and the methanol and reducing end sugar content was plotted against stringiness (Figure 6a,b). The determination coefficients were 0.87 and 0.93 for reducing end sugars and methanol content, respectively. Therefore, the concomitant evaluation of chemical indicators of pectin degradation in a model media and of texture loss in the real matrix show that those data were strongly correlated.

4. Conclusions

In the present work, the correlation between okra pectin chemical structure denaturation and okra texture disorientation under prolonged heating was confirmed. Purified pectin was extracted under the okra native pH conditions, which saved reagent use and time. The pectin was used to study the degradation of okra pectin structure under various thermal treatments. Demethylation and depolymerization reactions accelerated with increased temperature and treatment time, findings which were confirmed by the increase in products of those reactions, methanol and reducing end sugars, respectively.
Texture degradation was also confirmed by a decrease in stringiness under the same thermal treatment conditions. In both experiments, the evolution followed a first-order reaction kinetic. This closeness was confirmed, since texture loss was highly correlated to the hydrolysis of pectin.
The results section not only explains texture loss through pectin degradation markers, but also provides kinetic parameters. Indeed, kinetic measurements enabled the identification of rate constants and Arrhenius parameters that may be useful to other food researchers/technologists for estimating the extent of okra texture loss or pectin degradation under different thermal treatments. With these quantified parameters, further experiments could be designed to develop better preservation methods that minimize negative impacts on okra texture.
Also, in order to deepen the examination of okra pectin and its alterations during thermal treatment, researchers in the future should investigate different pH conditions, and how both texture and pectin react in those model mediums. This study helps identify factors other than temperature to improve okra texture after thermal treatment. Additionally, the reactions and their dynamics according to temperature and pH should be more thoroughly investigated. In this respect, the distinction of the two depolymerization reactions, acid hydrolysis and β-elimination reactions, should be achieved and also correlated with the texture transformations. Finally, a future investigation into galacturonic acid content, and, therefore, a degree of methylation (DM), would promote a better understanding of the pectin state in the okra and of its transformation during thermal treatments.

Supplementary Materials

The following supporting information can be downloaded at: https://www.mdpi.com/article/10.3390/agriculture14101687/s1, Figure S1: Pectin extracted with a modified protocol.

Author Contributions

Conceptualization, N.A., A.C. and M.D.; methodology, A.S., M.P.M. and T.S.; software, N.A.; validation, A.S., M.D., A.C., T.S. and N.A.; formal analysis, M.P.M.; investigation, M.P.M. and T.S.; resources, A.C. and M.D.; data curation, M.P.M.; writing—original draft preparation, M.P.M.; writing—review and editing, N.A.; visualization, M.P.M. and N.A.; supervision, A.S. and N.A.; project administration, M.D., A.C. and N.A.; funding acquisition, M.D. and A.C. All authors have read and agreed to the published version of the manuscript.

Funding

This research received no external funding.

Institutional Review Board Statement

Not applicable.

Data Availability Statement

Dataset available on request from the authors.

Acknowledgments

We acknowledge AS Food International, Grenoble, France, for its support.

Conflicts of Interest

The author Milena Petrovic Markovic is an employee of MDPI; however, she was not working for the journal Agriculture at the time of submission and publication.

References

  1. Kumar, S.; Dagnoko, S.; Haougui, A.; Ratnadass, A.; Pasternak, D.; Kouame, C. Okra (Abelmoschus spp.) in West and Central Africa: Potential and progress on its improvement. Afr. J. Agric. Res. 2010, 5, 3590–3598. [Google Scholar]
  2. Olawuyi, I.F.; Park, J.J.; Hahn, D.; Lee, W.Y. Physicochemical and Functional Properties of Okra Leaf Polysaccharides Extracted at Different pHs. Chemistry 2022, 4, 405–418. [Google Scholar] [CrossRef]
  3. Gemede, H.F.; Ratta, N.; Haki, G.D.; Woldegiorgi, A.Z.; Beyene, F. Nutritional Quality and Health Benefits of Okra (Abelmoschus Esculentus): A Review. Int. J. Nutr. Food Sci. 2015, 4, 208–215. [Google Scholar] [CrossRef]
  4. Zhu, X.-M.; Xu, R.; Wang, H.; Chen, J.-Y.; Tu, Z.-C. Structural Properties, Bioactivities, and Applications of Polysaccharides from Okra [Abelmoschus esculentus (L.) Moench]: A Review. J. Agric. Food Chem. 2020, 68, 14091–14103. [Google Scholar] [CrossRef] [PubMed]
  5. Sugri, I.; Abdulai, M.S.; Larbi, A.; Hoeschle-Zeledon, I.; Kusi, F.; Agyare, R.Y. Participatory variety selection of okra (Abelmoschus esculentus L.) genotypes for adaptation to the semi-arid agro-ecology of Northern Ghana. Afr. J. Plant Sci. 2015, 9, 466–475. [Google Scholar] [CrossRef]
  6. Uzo, J.O.; Ojiako, G.U. A physical method for measuring Okra fruit quality. J. Food Sci. 1980, 45, 390–391. [Google Scholar] [CrossRef]
  7. Owoeye, A.I.; Caurie, M.C.; Allagheny, N.N.; Onyezili, F.N. Chemical and Physical Parameters Affecting the Viscosity of Mixed Okra and Tomato Homogenate. J. Sci. Food Agric. 1990, 53, 283–286. [Google Scholar] [CrossRef]
  8. Kumar, D.S.; Tony, D.E.; Kumar, A.P.; Kumar, K.A.; Rao, D.B.S.; Nadendla, R. A Review on: Abelmoschus esculentus (Okra). Int. Res. J. Pharm. Appl. Sci. 2013, 3, 129–132. [Google Scholar]
  9. Romdhane, M.H.; Chahdoura, H.; Barros, L.; Dias, M.I.; Corrêa, R.C.G.; Morales, P.; Ciudad-Mulero, M.; Flamini, G.; Majdoub, H.; Ferreira, I.C.F.R. Chemical Composition, Nutritional Value, and Biological Evaluation of Tunisian Okra Pods (Abelmoschus esculentus L. Moench). Molecules 2020, 25, 4739. [Google Scholar] [CrossRef]
  10. Inyang, U.E.; Ike, C.I. Effect of blanching, dehydration method and temperature on the ascorbic acid, colour, sliminess and other constituents of okra fruit. Int. J. Food Sci. Nutr. 1998, 49, 125–130. [Google Scholar] [CrossRef]
  11. Aamir, M.; Boonsupthip, W. Effect of microwave drying on quality kinetics of okra. J. Food Sci. Technol. 2017, 54, 1239–1247. [Google Scholar] [CrossRef] [PubMed]
  12. USDA, Agricultural Research Service. 2018. Available online: https://fdc.nal.usda.gov/fdc-app.html#/food-details/169260/nutrients (accessed on 1 July 2024).
  13. Ciqual, Anses. Available online: https://ciqual.anses.fr/ (accessed on 28 August 2024).
  14. Liu, Y.; Qi, J.; Luo, J.; Qin, W.; Luo, Q.; Zhang, Q.; Wu, D.; Lin, D.; Li, S.; Dong, H.; et al. Okra in Food Field: Nutritional Value, Health Benefits and Effects of Processing Methods on Quality. Food Rev. Int. 2019, 37, 67–90. [Google Scholar] [CrossRef]
  15. Dantas, T.L.; Alonso Buriti, F.C.; Florentino, E.R. Okra (Abelmoschus esculentus L.) as a Potential Functional Food Source of Mucilage and Bioactive Compounds with Technological Applications and Health Benefits. Plants 2021, 10, 1683. [Google Scholar] [CrossRef]
  16. Xu, K.; Martinez, M.M.; Yang, B.; Guo, M. Fine structure, physicochemical and antioxidant properties of LM-pectins from okra pods dried under different techniques. Carbohydr. Polym. 2020, 241, 116272. [Google Scholar] [CrossRef] [PubMed]
  17. Al-Dabbas, M.M.; Moumneh, M.; Hamad, H.J.; Abughoush, M.; Abuawad, B.; Al-Nawasrah, B.A.; Al-Jaloudi, R.; Iqbal, S. Impact of Processing and Preservation Methods and Storage on Total Phenolics, Flavonoids, and Antioxidant Activities of Okra (Abelmoschus esculentus L.). Foods 2023, 12, 3711. [Google Scholar] [CrossRef] [PubMed]
  18. Singh, P.; Chauhan, V.; Tiwari, B.K.; Chauhan, S.S.; Simon, S.; Bilal, S.; Abidi, A.B. An Overview on Okra (Abelmoschus esculentus) and it’s Importance as a Nutritive Vegetable in the World. Int. J. Pharm. Biol. Sci. 2014, 4, 227–233. [Google Scholar]
  19. Xiong, B.; Zhang, W.; Wu, Z.; Liu, R.; Yang, C.; Hui, A.; Huang, H.; Xian, Z. Preparation, characterization, antioxidant and anti-inflammatory activities of acid-soluble pectin from okra (Abelmoschus esculentus L.). Int. J. Biol. Macromol. 2021, 181, 824–834. [Google Scholar] [CrossRef]
  20. Nie, X.-R.; Fu, Y.; Wu, D.-T.; Huang, T.-T.; Jiang, Q.; Zhao, L.; Zhang, Q.; Lin, D.-R.; Chen, H.; Qin, W. Ultrasonic-Assisted Extraction, Structural Characterization, Chain Conformation, and Biological Activities of a Pectic-Polysaccharide from Okra (Abelmoschus esculentus). Molecules 2020, 25, 1155. [Google Scholar] [CrossRef]
  21. Woolfe, M.L.; Chaplin, M.F.; Otchere, G. Studies on the mucilages extracted from okra fruits (Hibiscus esculentus L.) and baobab leaves (Adansonia digitata L.). J. Sci. Food Agric. 1977, 28, 519–529. [Google Scholar] [CrossRef]
  22. Benchasri, S. Okra (Abelmoschus esculentus (L.) Moench) as a Valuable Vegetable of the World. Ratar. Povrt. 2012, 49, 105–112. [Google Scholar] [CrossRef]
  23. Olawuyi, I.F.; Lee, W.Y. Structural characterization, functional properties and antioxidant activities of polysaccharide extract obtained from okra leaves (Abelmoschus esculentus). Food Chem. 2021, 354, 129437. [Google Scholar] [CrossRef] [PubMed]
  24. Sengkhamparn, N.; Bakx, E.J.; Verhoef, R.; Schols, H.A.; Sajjaanantakul, T.; Voragen, A.G.J. Okra pectin contains an unusual substitution of its rhamnosyl residue with acetyl and alpha-linked galactosyl groups. Carbohydr. Res. 2009, 344, 1842–1851. [Google Scholar] [CrossRef] [PubMed]
  25. Sila, D.N.; Smout, C.; Elliot, F.; Loey, A.V.; Hendrickx, M. Non-enzymatic Depolymerization of Carrot Pectin: Toward a Better Understanding of Carrot Texture During Thermal Processing. J. Food Sci. 2006, 71, E1–E9. [Google Scholar] [CrossRef]
  26. Olawuyi, I.F.; Kim, S.R.; Hahn, D.; Lee, W.Y. Influences of combined enzyme-ultrasonic extraction on the physicochemical characteristics and properties of okra polysaccharides. Food Hydrocoll. 2019, 100, 105396. [Google Scholar] [CrossRef]
  27. Ashour, E.A.; Bin-Jumah, M.; Abou Sayed-Ahmed, E.T.; Osman, A.O.; Taha, A.E.; Momenah, M.A.; Allam, A.A.; Swelum, A.A.; Abd El-Hack, M.E. Effects of dried okra fruit (Abelmoschus esculentus L.) powder on growth, carcass characteristics, blood indices, and meat quality of stored broiler meat. Poult. Sci. 2020, 99, 3060–3069. [Google Scholar] [CrossRef]
  28. Tufaro, D.; Bassoli, A.; Cappa, C. Okra (Abelmoschus esculentus) Powder Production and Application in Gluten-Free Bread: Effect of Particle Size. Food Bioprocess Technol. 2022, 15, 904–914. [Google Scholar] [CrossRef]
  29. Guebebia, S.; Gharsallaoui, A.; Dumas, E.; Baghi, F.; Zourgui, L.; Romdhane, M.; Agusti, G.; Ghnimi, S. Microencapsulation of Phenolic Compounds Extracted from Okra (Abelmoschus esculentus L.) Leaves, Fruits and Seeds. Appl. Sci. 2023, 13, 12273. [Google Scholar] [CrossRef]
  30. Yuan, Q.; Lin, S.; Fu, Y.; Nie, X.R.; Liu, W.; Su, Y.; Han, Q.H.; Zhao, L.; Zhang, Q.; Lin, D.R.; et al. Effects of extraction methods on the physicochemical characteristics and biological activities of polysaccharides from okra (Abelmoschus esculentus). Int. J. Biol. Macromol. 2019, 127, 178–186. [Google Scholar] [CrossRef]
  31. Sengkhamparn, N.; Verhoef, R.; Schols, H.A.; Sajjaanantakul, T.; Voragen, A.G.J. Characterisation of cell wall polysaccharides from okra (Abelmoschus esculentus (L.) Moench). Carbohydr. Res. 2009, 344, 1824–1832. [Google Scholar] [CrossRef]
  32. Alba, K.; Laws, A.P.; Kontogiorgos, V. Isolation and characterization of acetylated LM-pectins extracted from okra pods. Food Hydrocoll. 2015, 43, 726–735. [Google Scholar] [CrossRef]
  33. Öncü Glaue, Ş.; Akcan, T.; Tavman, Ş. Thermal Properties of Ultrasound-Extracted Okra Mucilage. Appl. Sci. 2023, 13, 6762. [Google Scholar] [CrossRef]
  34. King, K. Method for rapid extraction of pectic substances from plant materials. Food Chem. 1987, 26, 109–118. [Google Scholar] [CrossRef]
  35. Dranca, F.; Oroian, M. Extraction, purification and characterization of pectin from alternative sources with potential technological applications. Food Res. Int. 2018, 113, 327–350. [Google Scholar] [CrossRef] [PubMed]
  36. Fangel, J.U.; Jones, C.Y.; Ulvskov, P.; Harholt, J.; Willats, W.G.T. Analytical implications of different methods for preparing plant cell wall material. Carbohydr. Polym. 2021, 261, 117866. [Google Scholar] [CrossRef]
  37. Kpodo, F.M.; Agbenorhevi, J.K.; Alba, K.; Bingham, R.J.; Oduro, I.N.; Morris, G.A.; Kontogiorgos, V. Pectin isolation and characterization from six okra genotypes. Food Hydrocoll. 2017, 72, 323–330. [Google Scholar] [CrossRef]
  38. Savouré, T.; Dornier, M.; Vachoud, L.; Collignan, A. Clustering of instrumental methods to characterize the texture and the rheology of slimy okra (Abelmoschus esculentus) suspensions. J. Texture Stud. 2020, 51, 426–443. [Google Scholar] [CrossRef]
  39. De Roeck, A.; Duvetter, T.; Fraeye, I.; Van der Plancken, J.; Sila, D.N.; Van Loey, A.; Hendrickx, M. Effect of high-pressure/high-temperature processing on chemical pectin conversions in relation to fruit and vegetable texture. Food Chem. 2009, 115, 207–213. [Google Scholar] [CrossRef]
  40. Zhang, L.; Ye, X.; Ding, T.; Sun, X.; Xu, Y.; Liu, D. Ultrasound effects on the degradation kinetics, structure and rheological properties of apple pectin. Ultrason. Sonochem. 2013, 20, 222–231. [Google Scholar] [CrossRef]
  41. Sila, D.N.; Van Buggenhout, S.; Duvetter, T.; Fraeye, I.; De Roeck, A.; Van Loey, A.; Hendrickx, M. Pectins in Processed Fruits and Vegetables: Part II—Structure–Function Relationships. Compr. Rev. Food Sci. Food Saf. 2009, 8, 86–104. [Google Scholar] [CrossRef]
  42. Kiss, J. β-Eliminative Degradation of Carbohydrates Containing Uronic Acid Residues. Adv. Carbohyd. Chem. 1974, 29, 229–303. [Google Scholar] [CrossRef]
  43. Diaz, J.V.; Anthon, G.E.; Barrett, D.M. Nonenzymatic Degradation of Citrus Pectin and Pectate during Prolonged Heating: Effects of pH, Temperature, and Degree of Methyl Esterification. J. Agric. Food Chem. 2007, 55, 5131–5136. [Google Scholar] [CrossRef] [PubMed]
  44. Krall, S.M.; McFeeters, R.F. Pectin Hydrolysis: Effect of Temperature, Degree of Methylation, pH, and Calcium on Hydrolysis Rates. J. Agric. Food Chem. 1998, 46, 1311–1315. [Google Scholar] [CrossRef]
  45. Fraeye, I.; De Roeck, A.; Duvetter, T.; Verlent, I.; Hendrickx, M.; Van Loey, A. Influence of pectin properties and processing conditions on thermal pectin degradation. Food Chem. 2007, 105, 555–563. [Google Scholar] [CrossRef]
  46. Zid, M.B.; Dhuique-Mayer, C.; Bellagha, S.; Sanier, C.; Collignan, A.; Servent, A.; Dornier, M. Effects of Blanching on Flavanones and Microstructure of Citrus aurantium Peels. Food Bioprocess Technol. 2015, 8, 2246–2255. [Google Scholar] [CrossRef]
  47. Official Methods of Analysis of AOAC International, 16th ed.; AOAC International: Gaithersburg, MD, USA, 1999.
  48. Faravash, R.S.; Ashtiani, F.Z. The influence of acid volume, ethanol-to-extract ratio and acid-washing time on the yield of pectic substances extraction from peach pomace. Food Hydrocoll. 2008, 22, 196–202. [Google Scholar] [CrossRef]
  49. Pagan, J.; Ibarz, A.; Llorca, M.; Coll, L. Quality of industrial pectin extracted from peach pomace at different pH and temperatures. J. Sci. Food Agric. 1999, 79, 1038–1042. [Google Scholar] [CrossRef]
  50. Approximate pH of Foods and Food Products; US FDA/CFSAN: Silver Spring, MD, USA, 2003.
  51. Waffenschmidt, S.; Jaenicke, L. Assay of Reducing Sugars in the Nanomole Range with 2,2′-Bicinchoninate. Anal. Biochem. 1987, 165, 337–340. [Google Scholar] [CrossRef] [PubMed]
  52. Klavons, J.A.; Bennett, R.D. Determination of Methanol Using Alcohol Oxidase and Its Application to Methyl Ester Content of Pectins. J. Agric. Food Chem. 1986, 34, 597–599. [Google Scholar] [CrossRef]
  53. Jiménez, N.; Bohuon, P.; Lima, J.; Dornier, M.; Vaillant, F.; Pérez, A.M. Kinetics of Anthocyanin Degradation and Browning in Reconstituted Blackberry Juice Treated at High Temperatures (100–180 °C). J. Agric. Food Chem. 2010, 58, 2314–2322. [Google Scholar] [CrossRef]
  54. Schindelin, J.; Arganda-Carreras, I.; Frise, E.; Kaynig, V.; Longair, M.; Pietzsch, T.; Preibisch, S.; Rueden, C.; Saalfeld, S.; Schmid, B.; et al. Fiji: An open-source platform for biological-image analysis. Nat. Methods 2012, 9, 676–682. [Google Scholar] [CrossRef]
  55. Rueden, C.T.; Schindelin, J.; Hiner, M.C.; DeZonia, B.E.; Walter, A.E.; Arena, E.T.; Eliceiri, K.W. ImageJ2: ImageJ for the next generation of scientific image data. BMC Bioinform. 2017, 18, 529. [Google Scholar] [CrossRef] [PubMed]
  56. van Boekel, M.A.J.S. Kinetic Modeling of Reactions in Foods, 1st ed.; CRC Press: Boca Raton, FL, USA, 2008. [Google Scholar] [CrossRef]
  57. de Levie, R. Advanced Excel for Scientific Data Analysis, 3rd ed.; Atlantic Academic LLC: Virginia Beach, VA, USA, 2012. [Google Scholar]
  58. U.S. Department of Agriculture, Agricultural Research Service, Beltsville Human Nutrition Research Center. FoodData Central. 2024. Available online: https://fdc.nal.usda.gov/ (accessed on 1 July 2024).
  59. Constenla, D.; Lozano, J.E. Kinetic model of pectin demethylation. Lat. Am. Appl. Res. 2003, 33, 91–95. [Google Scholar]
Figure 1. Scheme of adapted pectin extraction protocol inspired by Alba et al. [32].
Agriculture 14 01687 g001
Figure 2. Experimental concentrations of methanol (dots) during heat treatments of okra pectin at four temperatures. Each point represents the average of three treatment replications. Error bars represent the standard deviation (n = 3) and the lines represent the modeled data.
Agriculture 14 01687 g002
Figure 3. Experimental concentrations (dots) during heat treatments at four temperatures of reducing end sugars. Error bars represent the standard deviation (n = 3) and the lines represent the modeled data.
Agriculture 14 01687 g003
Figure 4. Rate constants (dots) of methanol and reducing end sugar production. Lines represent the Arrhenius modeled data.
Agriculture 14 01687 g004
Figure 5. Experimental stringiness measurements (dots) during heat treatments at four temperatures. Error bars represent the standard deviation (n = 3) and lines represent the modeled data.
Agriculture 14 01687 g005
Figure 6. Relationship between stringiness and (a) reducing end sugar and (b) methanol content.
Agriculture 14 01687 g006
Table 1. Time of sampling points in min for the four temperatures of thermal treatments applied to the hydrocolloid solution.
Temperature (°C)Time (min)
700120210300
8003060110200
1000102045120
130010203040
Table 2. Rate constants of methanol production (kmet) due to demethylation reactions in okra hydrocolloids. Values in brackets represent the standard errors. R2 represents the coefficient of determination.
T (°C)kmet (min−1)R2
703.8 × 10⁻⁴ (1.5 × 10⁻⁵)0.99
801.3 ×10⁻³ (7.8 × 10⁻⁵)0.98
1006.3 × 10−3 (1.5 × 10⁻⁴)0.99
1304.6 × 10−2 (7.5 × 10⁻³)0.92
Table 3. Rate constants of reducing end sugar production (khyd) due to hydrolysis reactions in okra hydrocolloids. Values in brackets represent the standard errors. R2 represents the coefficient of determination.
T (°C)khyd (min−1)R2
705.62 × 10⁻⁵ (3.32 × 10⁻⁵)0.88
801.83 × 10⁻⁴ (5.74 × 10⁻⁵)0.93
1007.30 × 10−4 (4.04 × 10⁻⁵)0.98
1301.28 × 10−2 (8.27 × 10⁻⁴)0.97
Table 4. Arrhenius parameters of demethylation and hydrolysis reactions of okra hydrocolloids during thermal treatment.
DemethylationDepolymerization
kref (min−1)4.37 × 10⁻³ (1.31 × 10⁻⁴)4.56 × 10⁻⁴ (5.19 × 10⁻⁵)
Ea (kJ mol−1)82.7 (1.1)117.3 (4.0)
R20.990.99
Disclaimer/Publisher’s Note: The statements, opinions and data contained in all publications are solely those of the individual author(s) and contributor(s) and not of MDPI and/or the editor(s). MDPI and/or the editor(s) disclaim responsibility for any injury to people or property resulting from any ideas, methods, instructions or products referred to in the content.

