Article

Functional Properties of Rapeseed Honey Enriched with Lyophilized Fruits

1
Institute of Food Technology in Novi Sad, University of Novi Sad, Bulevar cara Lazara 1, 21000 Novi Sad, Serbia
2
Oncology Institute of Vojvodina, Faculty of Medicine, University of Novi Sad, Put doktora Goldmana 4, 21204 Sremska Kamenica, Serbia
*
Author to whom correspondence should be addressed.
Agriculture 2024, 14(12), 2117; https://doi.org/10.3390/agriculture14122117
Submission received: 24 October 2024 / Revised: 12 November 2024 / Accepted: 20 November 2024 / Published: 22 November 2024
(This article belongs to the Section Agricultural Product Quality and Safety)

Abstract

:
This study evaluates the physicochemical characteristics, antioxidant, antibacterial, and antiproliferative properties of rapeseed honey collected from Vojvodina, Serbia, as well as rapeseed honey-based products enriched with 10% fruit lyophilizate, including sour cherry (Prunus cerasus), strawberry (Fragaria), blueberry (Vaccinium myrtillus), raspberry (Rubus idaeus), blackberry (Rubus fruticosus), orange (Citrus sinensis), and pineapple (Ananas comosus). Honey-based products with lyophilizates were developed to enhance the relatively limited therapeutic potential of rapeseed honey by incorporating fruit lyophilizates known to possess bioactive compounds. The moisture content, pH, electrical conductivity, free acidity, hydroxymethylfurfural (HMF), and mineral composition were analyzed. Sour cherry-enriched honey exhibited the highest total phenolic content (TPC = 102 ± 0.18 mg GAE/100 g), while blueberry-enriched honey had the highest total flavonoid content (TFC = 34.9 ± 0.89 mg CAE/100 g) and total anthocyanin content (TAC = 299 ± 3.14 mg EC/100 g), with the greatest relative scavenging capacity (81.0 ± 0.46% of DPPH inhibition). Polyphenol profiling identified phenolic acids and flavonoids, with raspberry-enriched honey showing the highest total polyphenol content (47.0 ± 0.98 mg/kg) due to its high ellagic acid content (38.4 ± 1.11 mg/kg). All honey-based products demonstrated moderate antibacterial activity against Staphylococcus aureus and Staphylococcus epidermidis. Significant antiproliferative effects against breast (MCF-7), cervix (HeLa), and colon (HT-29) cancer cell lines were observed, particularly in pineapple and blueberry-enriched honey, with IC50 values as 9.04 ± 0.16 mg/mL and 9.95 ± 0.24 mg/mL for MCF-7 cells, respectively. Based on all the obtained results, it can be concluded that the enrichment of rapeseed honey with fruit lyophilizates at a 10% level contributed to an increase in the antioxidant, antibacterial, and antiproliferative properties of rapeseed honey.

1. Introduction

Throughout history, honey and other bee products have played significant roles as religious symbols, nutritional sources, and medicinal substances. Often regarded as one of the earliest functional foods consumed in its natural state, honey is predominantly composed of carbohydrates (70–80%), water (up to 20%), and proteins (1%). Beyond these primary constituents, honey contains other components with beneficial properties such as amino acids, organic acids, enzymes, vitamins, minerals, carotenoids, and polyphenolic compounds [1].
Contemporary research has confirmed that honey exhibits numerous positive effects on human health. The therapeutic action of honey is primarily attributed to its antioxidant nature, predominantly derived from polyphenolic compounds, especially flavonoids (such as apigenin, quercetin, myricetin, pinocembrin, and hesperetin) and phenolic acids (including caffeic, ferulic, sinapic, gallic, and p-coumaric acids), as well as ascorbic acid, carotenoids, organic acids, Maillard reaction products, amino acids, peptides, proteins, and selenium [2,3].
Beyond its antioxidant properties, honey possesses a range of therapeutic benefits. It also demonstrates antibacterial, bacteriostatic, antimutagenic, anti-inflammatory, antiatherogenic antithrombotic, and other advantageous effects [4,5,6].
The intensity of the therapeutic effect of honey primarily depends on the type of honey [7]. There are reports of exceptionally therapeutically effective types of honey, such as manuka honey [8], as well as those that are less potent, such as rapeseed honey [9]. In addition, honey has been used in combination with medicinal herbs since ancient times (honey infused with herbs) [10]. Furthermore, honey-based products containing fruits, such as honey with added prunes as a traditional Serbian dessert [11] or enriched with algae, like Spirulina honey, ref. [12] were investigated. Moreover, the new innovative method for bee feeding with pomegranate, orange, and black carrot concentrates for functional honey production was established [13].
Berries, including strawberries (Fragaria), raspberries (Rubus idaeus), blueberries (Vaccinium spp.), and blackberries (Rubus fruticosus), possess significant potential for honey enrichment because they are abundant in bioactive components, mainly anthocyanins [14]. Their antioxidant activities, along with their potential cancer-protective and anti-aging properties, make berries excellent candidates for functional honey production [15] with significant diversification of the honey’s flavor profile.
Among other fruits, pineapple is distinguished by its high levels of bioactive compounds, minerals, dietary fiber, and nutrients. It has been shown to provide various health benefits, including anti-inflammatory and antioxidant effects, support for nervous system function, and the promotion of digestive health [16].
One of the methods of preserving fruits is lyophilization, which reduces the risk of spoilage and extends the shelf life of the products, preserves nutritional and bioactive components of the fruits, maintains their taste, aroma, and texture, enables easy handling and transportation, and eliminates the need for preservatives to stabilize the products [17]. Different lyophilized fruits are commercially available on the market, including in Serbia, and are used in a variety of products.
Rapeseed honey has been shown to have weaker antioxidant, antibacterial, and antiproliferative effects compared to other honey types that are characteristic of Serbia [9]. The limitations of rapeseed honey’s therapeutic potential provide a strong rationale for exploring enhancement strategies aimed at augmenting its functional properties. This study proposes enriching rapeseed honey with fruit lyophilizates, abundant sources of antioxidants, to enhance its antioxidant, antibacterial, and antiproliferative effects, resulting in a new range of rapeseed honey-based products.

2. Materials and Methods

2.1. Honey and Honey-Based Samples

The study was carried out on 8 commercially available samples—7 rapeseed honey-based samples enriched with various lyophilized fruits: sour cherry (Prunus cerasus), strawberry (Fragaria), blueberry (Vaccinium myrtillus), raspberry (Rubus idaeus), blackberry (Rubus fruticosus), orange (Citrus sinensis), and pineapple (Ananas comosus) at the level of 10% and the control (rapeseed honey sample). The selection of fruit lyophilizates was made based on previously conducted consumer preference surveys organized by the producers of honey-based products, and is also justified from the standpoint of scientific data on the health potential of the selected fruits. Honey and honey-based products were directly provided by the local beekeeping farm from the Autonomous Province of Vojvodina, Serbia.
The samples were enclosed in glass containers and maintained at a constant room temperature (22 ± 1 °C) in a dark environment until further analysis. All assays were performed in triplicate (n = 3) to ensure the reliability and accuracy of the results.

2.2. Physicochemical Parameters

Moisture content was assessed using a refractometer (Schmidt/Haensch ATR-ST, Labexchange—Die Laborgerätebörse GmbH, Burladingen, Germany). A few drops of honey or honey-based product were placed on the refractometer prism, and the moisture content was directly read from the display [18].
Free acidity was measured using a titrimetric method. A solution was prepared by dissolving 10 g of honey or honey-based product in 75 mL of distilled water (free of carbon dioxide) [18]. The solution was titrated with 0.1 mol/L NaOH (Lacher, Neratovice, Czech Republic) until reaching a pH of 8.5. The acidity was calculated based on the volume of 0.1 mol/L NaOH required to neutralize 10 g of honey or honey-based product, multiplied by 10. The final result was expressed in milliequivalents of acid per kilogram of honey or product (meq/kg).
Electrical conductivity was determined potentiometrically using a 20% v/v solution of honey or honey-based product, following the method described by Bogdanov [19]. The moisture content of the samples, assessed by refractometry, was considered when preparing the dilutions. Measurements were performed using a RIAC CM 100/E conductometer equipped with an ISI 3418 electrode (Yellow Springs Instruments Inc., Yellow Springs, OH, USA). The conductometer was calibrated with a standard 0.1 mol/L KCl solution (Sigma-Aldrich Co. LLC, St. Louis, MI, USA), which had a conductivity of 1413 mS/cm at 20 °C.
For pH determination, a 20% v/v honey/honey-based product solution prepared as described above was utilized. A SevenEasi™ pH meter (Mettler Toledo, Urdorf, Switzerland) equipped with an InLab 427 electrode (Mettler Toledo, Urdorf, Switzerland) was employed. Prior to each measurement, the electrode was calibrated using pH value standards of 4.01 ± 0.02 and 7.01 ± 0.02 [19].

2.3. Determination of 5-Hydroxymethylfurfural Content

Sample preparation: The extraction of hydroxymethylfurfural (HMF) was carried out using the method of Rufián-Henares and De La Cueva [20], with modifications as described by Petisca et al. [21]. Ten grams of the sample were suspended in 5 mL of a water:methanol mixture (70:30) and vortexed for 1 min. Subsequently, 2.0 mL of Carrez I and Carrez II solutions (Carl Roth GmbH, Karlsruhe, Germany) were added. The mixture was then centrifuged at 5000 rpm for 15 min at 4 °C. Two additional extractions were performed with 2 mL of water:methanol mixture (70:30), until a total of 10 mL of supernatant was obtained. This combined supernatant was further centrifuged at 8000 rpm for 15 min and set aside for analysis.
HPLC-DAD analysis: HMF quantification was conducted using an HPLC method based on the protocols of Ariffin et al. [22] and Tomasini et al. [23], with modifications. A liquid chromatograph (Agilent 1200 series, Agilent Technologies, Santa Clara, CA, USA) equipped with a DAD detector and an Eclipse XDB-C18, 1.8 μm, 4.6 × 50 mm column (Agilent) was used for quantification of HMF. Separation was achieved with a column temperature of 30 °C and a sample injection volume of 2 µL. The mobile phase consisted of two eluents, H2O (0.1% HCOOH) (Carl Roth GmbH, Karlsruhe, Germany) (A) and methanol (Carl Roth GmbH, Karlsruhe, Germany) (B). The flow rate was 0.75 mL/min. The isocratic elution was used with the ratio A:B (90:10, v/v). Detection was conducted at 284 nm. The total run time of the analysis was 5 min. HMF quantification was calibrated using standard solutions at a concentration range of 1–60 μg/mL.

2.4. Determination of Mineral Content

The mineral content of honey and honey-based products was quantified using atomic absorption spectrometry (AAS), as described by Sakač et al. [24]. Briefly, 5 g of each sample was dry-ashed at 550 °C. The concentrations of K, Na, Ca, Mg, Zn, Mn, Fe, and Cu were determined using a Varian SPECTRAA-10 atomic absorption spectrophotometer (Mulgrave, Australia). Calibration was conducted with standard solutions of these minerals provided by AccuStandard (New Haven, CT, USA). The concentration ranges for the construction of calibration curves were as follows: for K 15–400 μg/mL, for Na 15–400 μg/mL, for Ca and Mg 0.5–2.0 μg/mL, for Cu and Fe 0.2–4.0 μg/mL, for Mn 0.05–2.0 μg/mL, and for Zn 0.02–0.2 μg/mL. The calibration curves exhibited linearity across the analytical range, with all R2 values exceeding 0.999.

2.5. Determination of Total Phenolic Content

The total phenolic content (TPC) was assessed using the Folin–Ciocalteu assay as described by Ferreira et al. [25] with some modifications. Honey or a honey-based product (1 g) was dissolved in 20 mL of distilled water. A total of 8 mL of the aqueous honey or honey-based solution was mixed with 0.5 mL of Folin–Ciocalteu reagent (Sigma-Aldrich Co. LLC, St. Louis, MI, USA), previously diluted with distilled water (1:2). After a 3 min reaction period, 1.5 mL of 25% sodium carbonate solution (Merck, Darmstadt, Germany) was added to the mixture. The mixture was vortexed, and the tubes were covered and incubated in a dark place at 25 °C for 2 h. The absorbance of the reaction mixture was measured at 750 nm using a Shimazu, UV-1800 spectrophotometer (Kyoto, Japan) relative to the blank sample.
Gallic acid (Sigma-Aldrich Co. LLC, St. Louis, MI, USA) (1.25–31.25 mg/mL) was used as the standard for constructing the calibration curve, and the total phenolic content was expressed as gallic acid equivalents (GAE) (mg GAE/100 g of honey/honey-based product).

2.6. Determination of Total Flavonoid Content

A total of 0.5 g of honey or honey-based product was dissolved in 1 mL of distilled water. To this solution, 0.3 mL of 5% NaNO2 (Merck, Darmstadt, Germany) was added and mixed thoroughly. After a 5-min incubation, 0.3 mL of 10% AlCl₃ (Merck, Darmstadt, Germany) was introduced, and the mixture was vortexed. Following an additional 6 min of reaction time, the solution was neutralized by the addition of 2 mL of 1 mol/L NaOH. The absorbance of the solution was measured at 510 nm using a Shimadzu UV-1800 spectrophotometer (Kyoto, Japan), with a blank sample used as the reference [26].
Catechin (Sigma-Aldrich Co. LLC, St. Louis, MI, USA) (3.1875–102.0 µg/mL) was used as the standard for constructing the calibration curve, and the total flavonoid content (TFC) was expressed as catechin equivalents (CAE) (mg CAE/100 g of honey/honey-based product).

2.7. Determination of Total Anthocyanin Content

The anthocyanin content (TAC) was determined according to Barać et al. [27]. Briefly, anthocyanins were measured in solution obtained by diluting 2 g of sample in 20 mL of 0.1% HCl (Carl Roth GmbH, Karlsruhe, Germany) in methanol. The solution (1 mL) was transferred to 9 mL of buffer (pH 1.0) (Merck, Darmstadt, Germany). After stabilization at 4 °C for 2 h, absorbance was measured at 515 and 700 nm using a spectrophotometer (Shimazu, UV-1800, Kyoto, Japan). The blank was prepared by dissolving 1 mL of 0.1% HCl in methanol in 9 mL of buffer. The total anthocyanin content was calculated using measured absorbance, molar extinction coefficient and molar mass of cyanidin-3-glucoside and expressed as cyanidin-3-glucoside equivalents (EC) (mg EC/100 g of honey/honey-based product).

2.8. DPPH Radical Scavenging Capacity

The DPPH radical scavenging activity was assessed following the method of Noor et al. [28], with minor modifications. In brief, 0.75 mL of a methanolic solution of honey or honey-based product (0.2 g/mL) was mixed with 1.5 mL of a 0.09 mg/mL DPPH solution (Sigma-Aldrich Co., LLC, St. Louis, MI, USA) in methanol. The mixture was incubated at 25 °C for 5 min in a water bath. The absorbance was then measured at 517 nm against the blank consisting of methanol and honey/honey-based product solution.
The radical scavenging capacity (RSC) of honey or honey-based products was expressed as the percentage inhibition of DPPH radical and calculated using the formula:
RSC (DPPH inhibition, %) = [(A0 − A1)/A0] × 100
where:
  • A0 = Absorbance of radical blank
  • A1 = Absorbance of test sample

2.9. Polyphenol Profile Analysis

The quantification of polyphenols was done according to the method described in the paper of Nyarko et al. [29] with some modifications. A total of 7.5 g of honey/honey-based product was mixed with 15 mL of acidified water (pH 2) and vortexed until fully dissolved. The mixture was centrifuged at 10,000 rpm for 10 min using an Eppendorf 5804 R centrifuge (Hamburg, Germany) to remove solid impurities. For further purification solid-phase extraction (SPE) was performed with a SampliQ C18 ODS (500 mg/6 mL) column (Agilent Technologies, Santa Clara, CA, USA), which was conditioned with 5 mL of methanol (Carl Roth GmbH, Karlsruhe, Germany) and 5 mL of water. The honey/honey-based product solution (15 mL) was passed through the column, and excess sugars were removed with 7.5 mL of water. Phenolic compounds were subsequently eluted with 7.5 mL of 80% methanol. The eluate was evaporated under a nitrogen stream and stored at −20 °C until analysis.
Quantification of individual polyphenols was performed using a modified HPLC method as outlined by Sakač et al. [24]. The analysis was conducted with an Agilent 1290 liquid chromatograph (Agilent Technologies, Santa Clara, CA, USA) equipped with a diode-array detector (DAD) and a Zorbax Eclipse XDB-C18 column (1.8 μm, 4.6 × 250 mm; Agilent Technologies, Santa Clara, CA, USA). An aliquot of 5 μL of the sample was injected into the HPLC system. Separation of polyphenols was achieved with a gradient elution method utilizing methanol (solvent A) and 0.5% (v/v) formic acid in water (solvent B). The flow rate was maintained at 0.3 mL/min. The gradient program was as follows: 3% A from 0 to 13 min; 3% A from 13 to 25 min; 5% A from 25 to 34 min; 6% A from 34 to 35 min; 9% A from 35 to 52 min; 10% A from 52 to 75 min; 25% A from 75 to 95 min; 45% A from 95 to 110 min; 60% A from 110 to 130 min; 90% A from 130 to 133 min; and returning to 3% A from 133 to 135 min. Prior to injection, samples were diluted with a mobile phase mixture (A, 10:90%, v/v) and filtered through a 0.45 μm RC syringe filter (Macherey-Nagel GmbH & Co. KG., Düren, Germany). Detection was carried out at wavelengths of 280 nm and 320 nm to capture the absorbance of different polyphenolic compounds. Calibration was conducted with standard solutions of polyphenols provided by Sigma-Aldrich (St. Louis, MI, USA). The concentration ranges for the construction of calibration curves were as follows: for ellagic acid, 0.1–50 μg/mL; for rutin, 0.1–5.0 μg/mL; for naringin and naringenin, 0.05–1.0 μg/mL; for quercetin and protocatechuic acid, 0.05–5.0 μg/mL; for neochlorogenic acid, 0.01–1.0 μg/mL; for caffeic acid, chlorogenic acid, ferulic acid, and sinapic acid, 0.1–5.0 μg/mL; for p-cumaric acid, 0.1–20 μg/mL; and for quercetin-3-arabinoglucoside, quercetin-3-glucuronide, quercetin-3-glucoside, and quercetin-3-rutinoside, 0.05–2.5 μg/mL. Retention times (tR) and coefficients of determination (R2) for each polyphenol are presented in Table S1, while the chromatograms of the polyphenol standards mixture are presented in Figure S1. The results are expressed in mg of compound per kg of honey/honey-based product. All analyses were conducted in triplicate.

2.10. Antibacterial Activity Assay

Solutions of honey and honey-based products were prepared by diluting the samples with sterile distilled water immediately before analysis, resulting in final concentrations of 25.0%, 12.5%, 6.25%, 3.125%, 1.56%, and 0.75%, respectively. These diluted solutions were incubated in the dark at 30 °C for 30 min. The antibacterial activity was evaluated against a panel of bacterial strains: Gram-negative bacteria (Echerichia coli ATCC 10536, Escherichia coli ATCC 8739, and Proteus hauseri ATCC 13315) and Gram-positive bacteria (Staphylococcus epidermidis ATCC 12228, Staphylococcus aureus ATCC 25923, and Enterococcus faecalis ATCC 29212). The minimal inhibitory concentration (MIC) was determined using a modified microdilution method as described by Szweda [30]. Bacterial strains were subcultured on nutrient agar slants at 37 °C for 24 h, and the bacterial suspensions were adjusted to a McFarland of 0.5 optical density, corresponding to approximately 1.5 × 10⁸ CFU/mL.
For MIC determination, 10 µL of a 0.01% resazurin (HiMedia, Mumbai, India) solution was added to each well, and the plates were incubated at 37 °C for 24 h, until the development of the red color. The MIC was defined as the lowest concentration of honey or honey-based product that completely inhibited bacterial growth, indicated by the absence of red formazan formation.

2.11. In Vitro Antiproliferative Assay—MTT Test

Human solid tumor cell lines were used to investigate the antiproliferative activity of the tested honey and honey-based products. The cell lines used in this study included estrogen receptor-positive (ER+) human breast adenocarcinoma MCF-7 (American Type Culture Collection—ATCC HTB22), cervix carcinoma colon cancer HT-29 (ATCC HTB38), human cervix adenocarcinoma HeLa (ATCC CCL2), and normal fetal lung fibroblast cell line MRC-5 (ATCC CCL 171).
The cells were grown in Dulbecco’s modified Eagle’s medium (DMEM, PAA Laboratories GmbH, Pashing, Austria) with 4.5% glucose (Sigma-Aldrich Co. LLC, St. Louis, MI, USA), supplemented with 10% fetal calf serum (FCS, Sigma) and antibiotics/antimycotics solution (Sigma-Aldrich Co. LLC, St. Louis, MI, USA). The cell lines were cultured in 25 mL flasks (Costar®, Corning, NY, USA) at 37 °C in an atmosphere of 100% humidity and 5% CO2 (Heraeus, Waltham, MA, USA). Exponentially growing viable cells were used for the assays.
In vitro antiproliferative activity was evaluated using the MTT (3-(4, 5-dimethylthiazole-2)-2,5-diphenyltetrazolium bromide) (Thermo Fisher Scientific, Waltham, MA, USA) assay in microwell plates [31]. Exponentially growing cells were harvested, counted using trypan blue, and seeded into 96-well plates (Costar®, Corning, NY, USA) at an optimal density of 5 × 10³ cells per well to ensure logarithmic growth during the assay period. Viable cells were seeded in a volume of 90 µL per well and pre-incubated in complete medium at 37 °C for 24 h to allow cell stabilization before adding the samples.
All tested honey and honey-based products, dissolved in 0.9% NaCl solution (Lacher, Neratovice, Czech Republic), were prepared at five different concentrations ranging from 0.5 to 100 mg/mL and added (10 µL/well) to all wells except the control wells. The microplates were then incubated for 48 h. Wells containing cells without tested samples were used as the controls. Three hours before the end of the incubation period, 10 µL of MTT solution (dissolved at 5 mg/mL in medium and filtered to sterilize and remove any insoluble residue) was added to all wells. Acid-isopropanol (100 µL of 0.04 mol/L HCl in isopropanol (Merck, Darmstadt, Germany)) was then added to all wells and mixed thoroughly to dissolve the dark blue crystals. After a few minutes at room temperature to ensure complete dissolution of the crystals, the plates were read using a spectrophotometer plate reader (Multiscan Ascent, Thermo Labsystems, Helsinki, Finland) at 540/690 nm. Wells containing only medium and MTT, without cells, were used as the blank.
Inhibition of growth was expressed as a percentage of the control, and cytotoxicity was calculated using the formula:
(1 − Atest/Acontrol) × 100
The IC50 value was defined as the concentration of the sample that inhibited cell growth by 50% relative to the control (untreated) cells.

2.12. Statistical Analyses

The data were analyzed using the XLSTAT 2024 software package (Lumivero, Denver, CO, USA). Results are presented as mean ± standard deviation. Statistical comparisons among sample means were conducted using analysis of variance (ANOVA) followed by Tukey’s Honestly Significant Difference (HSD) test with a significance level of α = 0.05.
Principal component analysis (PCA) was conducted to identify and clarify the relationships and underlying patterns among the measured variables.

3. Results and Discussion

3.1. Physicochemical Characterisation

The physicochemical parameters of honey are critical indicators of its quality and must comply with EU regulations [32]. Considering that investigated honey-based products primarily consist of rapeseed honey (90%) and lyophilized fruits (10%), they were tested in accordance with the Codex Alimentarius [32]. The physicochemical parameters assessed included moisture content, electrical conductivity, pH, free acidity, and HMF, as detailed in Table 1.
The moisture content of honey is influenced by its botanical origin, ambient regional humidity, and the conditions under which it is processed and stored [7]. Low moisture content can lead to caramelization and Maillard reactions during storage, while excessive moisture can promote fermentation and the production of acetic acid, which is considered undesirable [33]. In this study, the moisture content of honey/honey-based samples ranged from 16.2 ± 0.40% to 20.0 ± 0.60% (Table 1). All examined samples complied with the moisture content regulations established by the Codex Alimentarius Commission [32].
The acidity of honey is influenced by the presence of various organic acids, along with other compounds such as lactones, esters, and inorganic ions [7]. In accordance with Codex Alimentarius [32], the permissible maximum acidity level for honey is 50.00 meq/kg. All honey and honey-based products met this standard (Table 1).
The pH of honey generally ranges between 3.2 and 4.5, which plays a crucial role in its antimicrobial properties by inhibiting microbial growth. This is particularly effective given that most pathogens thrive optimally within a neutral pH range of 6.5 to 7.5 [34,35]. The pH values of the honey and honey-based samples were consistently acidic, varying from 3.60 ± 0.05 for rapeseed honey with blueberry to 3.99 ± 0.14 for rapeseed honey with sour cherry (Table 1).
The concentration of HMF in honey serves as an indicator of honey degradation, signaling either improper storage conditions or the use of thermal treatment to dissolve honey crystals or suppress microbial contamination [36]. The Codex Alimentarius [32] specifies a maximum allowable HMF concentration of 40.00 mg/kg for honey from non-tropical. According to Tornuk et al. [37], HMF concentrations below 4.12 mg/kg are indicative of fresh honey, while levels up to 10 mg/kg are considered typical for naturally occurring honey [38]. In this study, the HMF concentrations of the honey and honey-based products ranged from 5.02 ± 0.05 mg/kg for rapeseed honey to 7.10 ± 0.44 mg/kg for rapeseed honey with blueberry, thereby confirming the freshness of the samples (Table 1).
Electrical conductivity, which indicates the mineral content in honey, ranged from 0.21 to 0.60 mS/cm (Table 1). The rapeseed honey sample showed the lowest conductivity at 0.21 ± 0.05 mS/cm. In contrast, honey samples containing lyophilized orange, raspberry, and strawberry had higher conductivity values of 0.55 ± 0.06, 0.58 ± 0.07, and 0.60 ± 0.01 mS/cm, respectively. All samples complied with the conductivity limits established by the Codex Alimentarius [32].

3.2. Mineral Content

Previous studies have indicated a low mineral content in rapeseed honey samples compared to other honey types. Kędzierska-Matysek et al. [39] showed that rapeseed honey samples exhibited a total mineral content of 370 mg/kg. Furthermore, Sakač et al. [9] also found low amounts of minerals in rapeseed honey compared to other honey types that were characteristic of the Western Balkans (except acacia honey).
Numerous studies have demonstrated that fruits are rich sources of minerals. Pereira et al. [40] highlighted the high mineral content in berries, particularly in terms of K, Ca, and Na levels. Consequently, the addition of lyophilized fruits to rapeseed honey significantly enhanced the mineral profile of the resulting products (Table 2).
The most abundant element in honey-based products was K (307 ± 50.4–1029 ± 169.0 mg/kg), followed by Ca (101 ± 15.7–324 ± 50.2 mg/kg), Mg (32.8 ± 5.08–114 ± 17.6 mg/kg), and Na (62.5 ± 10.3–94.2 ± 15.5 mg/kg) (Table 2). The mineral enrichment of rapeseed honey with lyophilized berry fruits was in line with the findings of Pereira et al. [40].
The highest total of all investigated mineral contents was found in honey-based samples with strawberry, raspberry, and orange, with values of 1387 ± 217, 1373 ± 215, and 1390 ± 218 mg/kg, respectively. These results indicate that the addition of lyophilized fruits significantly influenced the overall mineral composition of the honey (Table 2).

3.3. Antioxidant Potential

The antioxidant activity of honey is primarily attributed to polyphenols [41]. Polyphenolic compounds are known for their ability to reduce oxidative damage by acting as antioxidants. They can directly neutralize free radicals or remove them through a series of reactions together with the action of antioxidant enzymes [42]. Flavonoids contribute significantly to the overall antioxidant efficacy of honey, providing beneficial effects in various diseases [4]. Additionally, the antioxidant activity of phenolic acids present in honey is also notable [43].
Table 3 presents the content of total phenols, total flavonoids, total anthocyanins, and the antiradical activity on DPPH radicals of the investigated samples.
In rapeseed honey, the total phenolic content was determined to be 12.4 ± 0.51 mg GAE/100 g, which is a typical value for this honey type from Serbia [9,44]. Several studies have indicated that rapeseed honey generally has lower polyphenol content and antioxidant activity compared to other monofloral and polyfloral honeys [45,46]. Consequently, berries, known for their high polyphenol levels [47], were suitable candidates for enhancing the total phenolic content of rapeseed honey. The highest phenolic content was achieved with the sour cherry lyophilizate, which had a value of 102 ± 0.18 mg GAE/100 g (Table 3).
A significant content of flavonoids was detected in honey samples enriched with lyophilized berries, particularly in the honey sample with blueberry, which contained 34.9 ± 0.89 mg ECA/100 g. This represents up to 30 times more flavonoids than the control sample of rapeseed honey, which had 1.83 ± 0.27 mg ECA/100 g (Table 3). Grabek-Lejko et al. [48] investigated the effect of adding blackberry and raspberry fruits to rapeseed honey and observed a significant increase in total flavonoid content compared to the control sample, consistent with our findings. However, it is important to note that their research was conducted with non-commercial products, while our study specifically focused on enhancing commercially available rapeseed honey through the addition of lyophilized fruit. Numerous studies also highlight the richness of berries, especially blueberries, in anthocyanins [49,50,51].
Anthocyanins are polyphenols that act as natural pigments and antioxidants, contributing to the visual appeal and nutritional value of various foods, and potentially offering protective effects against chronic diseases. According to our research, all honey-based samples enriched with lyophilized fruits exhibited higher anthocyanin content compared to the control sample, in which anthocyanins were not detected (Table 3). The highest anthocyanin content was found in the sample with lyophilized blueberries (TAC = 299 ± 3.14 mg EC/100 g). Other samples with lyophilized blackberry, raspberry, and sour cherry also exhibited notably high anthocyanin levels, with contents of 125 ± 0.75, 85.5 ± 2.27, and 84.6 ± 0.67 mg EC/100 g, respectively.
The antioxidant capacity of honey and honey-based products was assessed by measuring the percentage inhibition of DPPH radicals (Table 3). This capacity exhibited a consistent trend with total phenolic content (TPC), total flavonoid content (TFC), and total anthocyanin content (TAC), showing high correlation coefficients (r = 0.770, r = 0.896, and r = 0.810, respectively) (Table S2, Figure S2). Among the tested honey and honey-based products, the highest relative antioxidant capacity was observed in blueberry-enriched honey (RSC = 81.0 ± 0.46%), followed by honey enriched with sour cherry (77.0 ± 0.34%) and blackberry (69.3 ± 1.18%). In contrast, rapeseed honey had the lowest relative antioxidant capacity (35.9 ± 0.77%), consistent with our previous findings [9]. The incorporation of fruit lyophilizates significantly enhanced the antioxidant potency of the honey-based products by increasing their phenolic compounds and overall antioxidant capacity (Table 3).

3.4. Polyphenol Profile

Rapeseed honey produced in Vojvodina has been previously characterized as having low polyphenol content [9,52]. In contrast, fruits, particularly berries, are known for their rich polyphenol profiles [14]. Consequently, it was anticipated that the addition of fruit lyophilizates would significantly enhance the polyphenol profile of rapeseed honey (Table 4).
The honey-based product enriched with raspberry lyophilizate exhibited the highest total polyphenol content of 47.0 ± 0.98 mg/kg, primarily due to its high ellagic acid content (38.4 ± 1.11 mg/kg) (Table 4). Additionally, the honey-based product containing strawberry lyophilizate was also noted for its ellagic acid content (9.86 ± 0.59 mg/kg), consistent with literature indicating that ellagic acid comprises more than 50% of the total polyphenolic compounds in both strawberries and raspberries [53].
The rapeseed honey mixed with blueberry lyophilizate was characterized by a high total polyphenol content of 24.3 ± 0.82 mg/kg and a diverse range of phenolic compounds, including rutin (3.83 ± 0.38 mg/kg), naringin (0.52 ± 0.05 mg/kg), naringenin (0.22 ± 0.01 mg/kg), quercetin (2.23 ± 0.21 mg/kg), protocatechuic acid (1.26 ± 0.09 mg/kg), caffeic acid (4.28 ± 0.18 mg/kg), and ferulic acid (3.02 ± 0.17 mg/kg), all of which are known for their antioxidant properties [54]. This product also contained quercetin derivatives such as quercetin-3-arabinoglucoside, quercetin-3-glucoside, and quercetin-3-rutinoside, which are associated with notable health benefits, including anti-inflammatory, antioxidant, and cardioprotective effects [55]. The results for the honey-based product enriched with blueberry lyophilizate (Table 4) are consistent with those presented in Table 3 regarding total polyphenol content (TPC) and total anthocyanin content (TAC).
The enrichment of rapeseed honey with pineapple and orange lyophilizates contributed the least to the total polyphenol content compared to other fruit lyophilizates (Table 4). Notably, the honey-based product enriched with pineapple lyophilizate contained the highest level of sinapic acid (1.15 ± 0.15 mg/kg) among the investigated products (Table 4).

3.5. Antibacterial Activity

The antibacterial properties of honey can be attributed to a combination of factors, including its acidity and osmolarity [56], as well as the presence of hydrogen peroxide [57]. Additionally, honey’s polyphenols contribute significantly to its antibacterial activity [58]. Methyl syringate has also been shown to exhibit antioxidant activity against superoxide anion radicals, thereby functioning as an antibacterial agent in honey [59].
Rapeseed honey is known to exhibit the weakest antibacterial potential compared to other honey types typical of the Western Balkans region [9]. Therefore, it was anticipated that enriching rapeseed honey with fruit lyophilizates would enhance its antibacterial activity due to the increased polyphenol content.
Antibacterial activity against Gram-negative and Gram-positive bacteria was assessed, with results presented as minimal inhibitory concentration (MIC) values in Table 5.
All honey-based products demonstrated antibacterial activity, showing greater effectiveness against Gram-positive bacteria, particularly Staphylococcus epidermidis and Staphylococcus aureus.
The varying susceptibility of Gram-positive and Gram-negative bacteria to antibacterial agents is attributed to structural differences in their cell walls, as described by Sakač et al. [9]. Gram-negative bacteria exhibit reduced permeability to hydrophobic compounds, which, combined with their surface hydrophobicity and the presence of porin proteins, further influences their susceptibility to antibacterial agents [50].
Honey-based products enriched with lyophilized berry fruits demonstrated a significant effect on Gram-positive bacteria, particularly Staphylococcus aureus and Staphylococcus epidermidis (Table 5). High negative correlations were observed between the TPC and antibacterial activity against Staphylococcus epidermidis (r = −0.941), Staphylococcus aureus (r = −0.751), and Enterococcus faecalis (r = −0.965), highlighting the important role of lyophilizate polyphenols in inhibiting Gram-positive bacteria. Additionally, total flavonoid content was negatively correlated with the antibacterial activity against Staphylococcus epidermidis (r = −0.712) (Table S2). Phenolic acids and flavonoids, particularly quercetin, kaempferol, and monoglycoside anthocyanins found in berries, were identified as potent antibacterial agents [60], which is supported by our findings. Grabek-Lejko et al. [48] also observed that honey enriched with Rubus showed the highest sensitivity in Staphylococcus aureus. Several studies have confirmed the antimicrobial activity of berry fruits against Gram-positive bacteria, especially Staphylococcus strains [50,60].

3.6. Antiproliferative Activity

The most potent honey-based products were those with pineapple lyophilizate (IC50MCF-7 = 9.04 ± 0.16 mg/mL and IC50HT-29 = 28.3 ± 0.91 mg/mL) and blueberry lyophilizate (IC50MCF-7 = 9.95 ± 0.24 mg/mL and IC50HeLa = 23.1 ± 0.66 mg/mL), showing notable efficacy against breast (MCF-7), cervix (HeLa), and colon (HT-29) cancer cell lines (Table 6).
None of the investigated honey and honey-based products affected the growth of MRC-5 cells derived from healthy lung tissue (IC50MRC-5 > 100 mg/mL). The IC50 values for glucose as the standard ranged from 32.0 ± 2.58 to 43.7 ± 3.50 mg/mL, indicating that only certain honey-based products contain bioactive compounds, beyond sugars, which expressed antiproliferative activities on examined cancer cell growth.
Rapeseed honey exhibited low activity against the investigated cancer cell lines (Table 6). This finding aligns with Sakač et al. [9], who reported that among nineteen honey samples from the Western Balkans, rapeseed honey showed the weakest antiproliferative effects on tested cancer cell lines.
Honey enriched with blueberry lyophilizate demonstrated significant antiproliferative activity against cancer cell lines (Table 6). Zhao et al. [51] confirmed that blueberries, rich in anthocyanins, exert strong antiproliferative effects on HeLa and MCF-7 cancer cell lines. This aligns with our findings (Table 6) and corresponds to the elevated total anthocyanin content (Table 3) in the blueberry lyophilizate-containing honey.
Despite Carmo et al. [61] emphasizing the critical role of polyphenols in inhibiting cancer cell growth, our results suggest that additional mechanisms or compounds may also play a significant role. Notably, the honey-based product enriched with lyophilized pineapple exhibited the highest activity against cancer cell lines, despite its lower total polyphenol content compared to berry-enriched products (Table 3). This can be attributed to pineapple’s high content of bromelains, a complex mixture of plant cysteine proteolytic enzymes [62]. Numerous studies have confirmed the antitumor effects of these enzymes, particularly on MCF-7 and HT-29 cancer cell lines [63,64,65], which supports our findings.

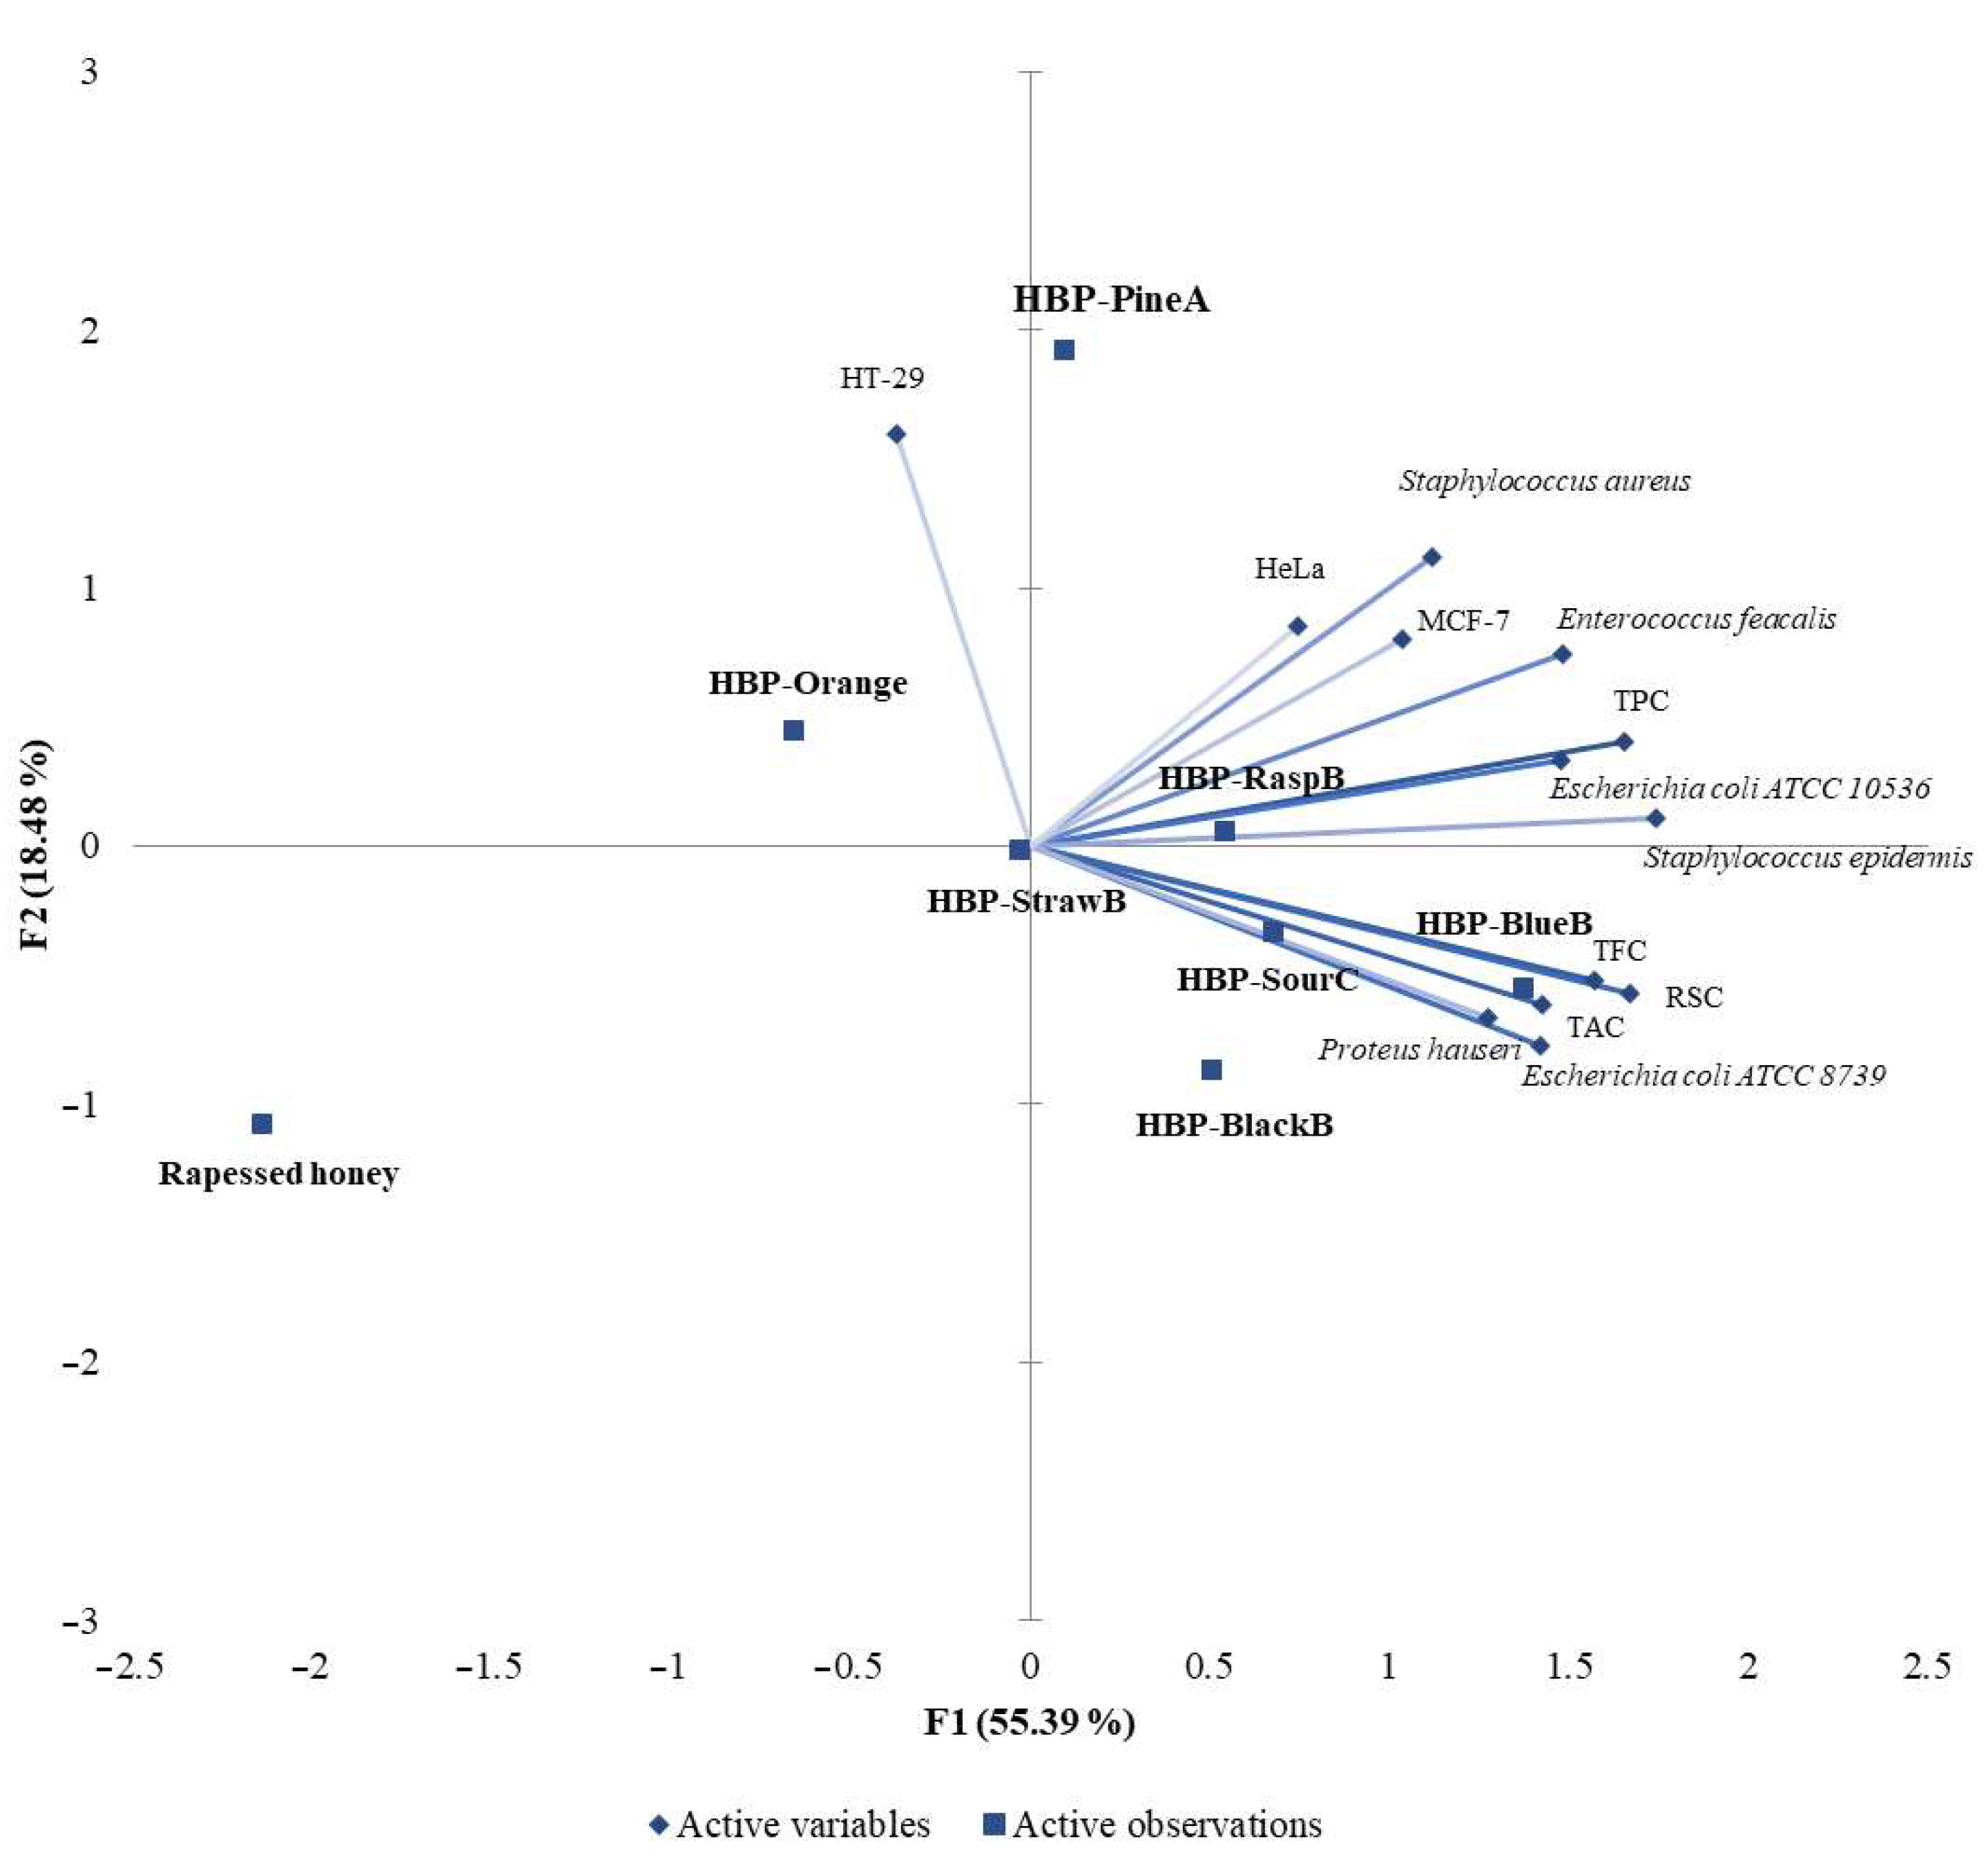
3.7. Principal Component Analysis (PCA)

The PCA analysis revealed distinct clustering and positioning among honey-based products enriched with various lyophilized fruits, indicating variability in their phenolic content, flavonoid levels, anthocyanin concentrations, antioxidant capacity, and antibacterial and antiproliferative activities (Figure 1). Notably, samples enriched with sour cherry, blueberry, raspberry, and blackberry lyophilizates clustered closely together in the PCA biplot, suggesting similar profiles with high phenolic and flavonoid content, significant antioxidant capacity, and notable anthocyanin levels. Although the PCA plot also shows several microbial strains near this cluster, the previously presented MIC values indicate that the most significant antibacterial activity was observed against Staphylococcus epidermidis and Staphylococcus aureus, with only raspberry-enriched honey demonstrating a strong inhibitory effect against both strains. This alignment in the PCA plot may suggest general compositional similarities, although distinct antibacterial efficacy is selectively observed in certain strains.
On the other hand, the strawberry-enriched honey was positioned near the center of the plot, reflecting a more neutral profile. This central position suggests that strawberry-enriched honey does not exhibit pronounced distinguishing characteristics across the measured variables, in contrast to the other honey-based products. Conversely, the pineapple-enriched honey separated itself from the other samples in the PCA plot, highlighting its unique characteristics, particularly with respect to antiproliferative activity. Although other analytical methods indicated moderate values for this sample, its specific inhibitory effects against the HT-29 and HeLa cell lines suggest a distinct profile of bioactive compounds or mechanisms that may selectively inhibit cancer cell growth in vitro.
Distinct from all other samples, rapeseed honey was positioned separately in the PCA plot. This sample exhibited lower levels of phenols, flavonoids, anthocyanins, and antioxidant capacity compared to the other samples. The clear separation of rapeseed honey from the honey-based products suggests that its bioactive composition is significantly different, whereas the addition of lyophilized fruit notably enhances its antioxidant and antibacterial activities.
Overall, the PCA analysis effectively visualizes the differences between rapeseed honey and rapeseed honey-based samples, highlighting the unique bioactive and compositional profiles imparted by various lyophilized fruit enrichments, particularly in terms of antioxidant, antibacterial, and antitumor properties.

4. Conclusions

Rapeseed honey-based products containing 10% lyophilized fruits including sour cherry (Prunus cerasus), strawberry (Fragaria), blueberry (Vaccinium myrtillus), raspberry (Rubus idaeus), blackberry (Rubus fruticosus), orange (Citrus sinensis), and pineapple (Ananas comosus) were developed to enhance the antioxidant, antibacterial, and antiproliferative properties of rapeseed honey. The enrichment of rapeseed honey with fruit lyophilizate resulted in increased levels of phenolic compounds, total flavonoids, total anthocyanins, and improved DPPH radical scavenging capacity. The polyphenol profile revealed the presence of both phenolic acids and flavonoids in the enriched honey-based samples. Among them, the product containing raspberry lyophilizate exhibited the highest total polyphenol content, as measured by HPLC, attributed to its significant ellagic acid content. All enriched honey-based products displayed moderate antibacterial activity against Staphylococcus aureus and Staphylococcus epidermidis. The strongest antiproliferative activity against breast (MCF-7), cervical (HeLa), and colon (HT-29) cancer cell lines was observed in honey-based products containing pineapple and blueberry lyophilizates.

Supplementary Materials

The following supporting information can be downloaded at: https://www.mdpi.com/article/10.3390/agriculture14122117/s1. Figure S1: The chromatograms of the polyphenol standards mixture Chromatogram of the standards mixture at 280.4 and 320.4 nm. The elution order of the compounds: 1—Protocatechuic acid; 2—Neochlorogenic acid; 3—Caffeic acid; 4—Chlorogenic acid; 5—p-Cumaric acid; 6—Ferulic acid; 7—Sinapic acid; 8—Quercetin-3-arabinoglucoside; 9—Quercetin-3-glucuronide; 10—Ellagic acid; 11—Quercetin-3-glucoside; 12—Quercetin-3-rutinoside; 13—Rutin; 14—Naringin; 15—Naringenin; 16—Quercetin; Figure S2: Image of the correlation matrix between total phenolic content (TPC), total flavonoid content (TFC), total anthocyanin content (TAC), and DPPH radical scavenging activity of rapeseed honey and honey-based products; Table S1: Retention times (tR) and coefficients of determination (R2) for HPLCdetermination of polyphenols; Table S2: Correlation matrix.

Author Contributions

For Conceptualization, A.M., D.P. and D.J.; methodology, A.M., P.J., N.T., D.P. and D.J.; software, B.Đ.; validation, P.J. and N.T.; formal analysis, A.M. and D.J.; investigation, B.Đ., N.T. and D.J.; writing—original draft preparation, M.S. and A.M.; writing—review and editing, P.J. and D.P.; visualization, B.Đ.; supervision, M.S.; project administration, M.S. All authors have read and agreed to the published version of the manuscript.

Funding

This research was funded by the Ministry of Science, Technological Development and Innovation, Republic of Serbia (Contract No. 451-03-66/2024-03/200222) and by the Provincial Secretariat for Higher Education and Scientific Research (Contract No. 142-451-3503/2023-02).

Institutional Review Board Statement

Not applicable.

Informed Consent Statement

Not applicable.

Data Availability Statement

Data are contained within the article.

Acknowledgments

We would like to thank the beekeeping farm “Mimi and Ivana” from Lazarevo (near Zrenjanin) from the Autonomous Province of Vojvodina, Serbia for providing us with the samples used in the research included in this study.

Conflicts of Interest

The authors declare no conflicts of interest.

References

  1. Kieliszek, M.; Piwowarek, K.; Kot, A.M.; Wojtczuk, M.; Roszko, M.; Bryła, M.; Trajkovska Petkoska, A. Recent Advances and Opportunities Related to the Use of Bee Products in Food Processing. Food Sci. Nutr. 2023, 11, 4372–4397. [Google Scholar] [CrossRef] [PubMed]
  2. Cornara, L.; Biagi, M.; Xiao, J.; Burlando, B. Therapeutic Properties of Bioactive Compounds from Different Honeybee Products. Front. Pharmacol. 2017, 8, 412. [Google Scholar] [CrossRef] [PubMed]
  3. Estevinho, L.; Pereira, A.P.; Moreira, L.; Dias, L.G.; Pereira, E. Antioxidant and Antimicrobial Effects of Phenolic Compounds Extracts of Northeast Portugal Honey. Food Chem. Toxicol. 2008, 46, 3774–3779. [Google Scholar] [CrossRef] [PubMed]
  4. Alvarez-Suarez, J.; Giampieri, F.; Battino, M. Honey as a Source of Dietary Antioxidants: Structures, Bioavailability and Evidence of Protective Effects Against Human Chronic Diseases. Curr. Med. Chem. 2013, 20, 621–638. [Google Scholar] [CrossRef] [PubMed]
  5. Rao, P.V.; Krishnan, K.T.; Salleh, N.; Gan, S.H. Biological and Therapeutic Effects of Honey Produced by Honey Bees and Stingless Bees: A Comparative Review. Rev. Bras. Farmacogn. 2016, 26, 657–664. [Google Scholar] [CrossRef]
  6. Talebi, M.; Talebi, M.; Farkhondeh, T.; Samarghandian, S. Molecular Mechanism-Based Therapeutic Properties of Honey. Biomed. Pharmacother. 2020, 130, 110590. [Google Scholar] [CrossRef]
  7. da Silva, P.M.; Gauche, C.; Gonzaga, L.V.; Costa, A.C.O.; Fett, R. Honey: Chemical Composition, Stability and Authenticity. Food Chem. 2016, 196, 309–323. [Google Scholar] [CrossRef]
  8. El-Senduny, F.F.; Hegazi, N.M.; Abd Elghani, G.E.; Farag, M.A. Manuka Honey, a Unique Mono-Floral Honey. A Comprehensive Review of Its Bioactives, Metabolism, Action Mechanisms, and Therapeutic Merits. Food Biosci. 2021, 42, 101038. [Google Scholar] [CrossRef]
  9. Sakač, M.; Jovanov, P.; Marić, A.; Četojević-Simin, D.; Novaković, A.; Plavšić, D.; Škrobot, D.; Kovač, R. Antioxidative, Antibacterial and Antiproliferative Properties of Honey Types from the Western Balkans. Antioxidants 2022, 11, 1120. [Google Scholar] [CrossRef]
  10. Kumar, S.; Verma, M.; Hajam, Y.A.; Kumar, R. Honey Infused with Herbs: A Boon to Cure Pathological Diseases. Heliyon 2024, 10, e23302. [Google Scholar] [CrossRef]
  11. Čanadanović-Brunet, J.; Ćetković, G.; Šaponjac, V.T.; Stajčić, S.; Vulić, J.; Djilas, S.; Štajner, D.; Popović, B. Evaluation of Phenolic Content, Antioxidant Activity and Sensory Characteristics of Serbian Honey-Based Product. Ind. Crops Prod. 2014, 62, 1–7. [Google Scholar] [CrossRef]
  12. Guldas, M.; Gurbuz, O.; Cakmak, I.; Yildiz, E.; Sen, H. Effects of Honey Enrichment with Spirulina Platensis on Phenolics, Bioaccessibility, Antioxidant Capacity and Fatty Acids. LWT 2022, 153, 112461. [Google Scholar] [CrossRef]
  13. Guldas, M.; Demircan, H.; Cakmak, I.; Oral, R.A.; Yildiz, E.; Gurbuz, O.; Tosunoglu, H.; Cavus, F.; Sen, H. Antioxidant and Bioaccessibility Characteristics of Functional Fruit and Vegetable Honeys Produced by Innovative Method. Food Biosci. 2022, 48, 101732. [Google Scholar] [CrossRef]
  14. Manzoor, A.; Yousuf, B.; Pandith, J.A.; Ahmad, S. Plant-Derived Active Substances Incorporated as Antioxidant, Antibacterial or Antifungal Components in Coatings/Films for Food Packaging Applications. Food Biosci. 2023, 53, 102717. [Google Scholar] [CrossRef]
  15. Baby, B.; Antony, P.; Vijayan, R. Antioxidant and Anticancer Properties of Berries. Crit. Rev. Food Sci. Nutr. 2018, 58, 2491–2507. [Google Scholar] [CrossRef]
  16. Mohd Ali, M.; Hashim, N.; Abd Aziz, S.; Lasekan, O. Pineapple (Ananas Comosus): A Comprehensive Review of Nutritional Values, Volatile Compounds, Health Benefits, and Potential Food Products. Int. Food Res. 2020, 137, 109675. [Google Scholar] [CrossRef]
  17. Kawasaki, H.; Shimanouchi, T.; Kimura, Y. Recent Development of Optimization of Lyophilization Process. J. Chem. 2019, 2019, 9502856. [Google Scholar] [CrossRef]
  18. Association of Official Analytical Chemists. Official Methods of Analysis of the AOAC, 17th ed.; Association of Official Analytical Chemists: Gaithersburg, MD, USA, 2000. [Google Scholar]
  19. Bogdanov, S. Harmonised Methods of the International Honey Commission; Swiss Bee Research Centre: Bern, Switzerland, 2009. [Google Scholar]
  20. Rufián-Henares, J.A.; de la Cueva, S.P. Assessment of Hydroxymethylfurfural Intake in the Spanish Diet. Food Addit. Contam. Part A 2008, 25, 1306–1312. [Google Scholar] [CrossRef]
  21. Petisca, C.; Henriques, A.R.; Pérez-Palacios, T.; Pinho, O.; Ferreira, I.M.P.L.V.O. Assessment of Hydroxymethylfurfural and Furfural in Commercial Bakery Products. J. Food Compos. Anal. 2014, 33, 20–25. [Google Scholar] [CrossRef]
  22. Ariffin, A.A.; Ghazali, H.M.; Kavousi, P. Validation of a HPLC Method for Determination of Hydroxymethylfurfural in Crude Palm Oil. Food Chem. 2014, 154, 102–107. [Google Scholar] [CrossRef]
  23. Tomasini, D.; Sampaio, M.R.F.; Caldas, S.S.; Buffon, J.G.; Duarte, F.A.; Primel, E.G. Simultaneous Determination of Pesticides and 5-Hydroxymethylfurfural in Honey by the Modified QuEChERS Method and Liquid Chromatography Coupled to Tandem Mass Spectrometry. Talanta 2012, 99, 380–386. [Google Scholar] [CrossRef] [PubMed]
  24. Sakač, M.; Novaković, A.; Ikonić, P.; Peulić, T.; Škrobot, D.; Radišić, P.; Šikoparija, B.; Jovanov, P.; Maravić, N.; Marić, A. Geographical Origin Authentication of Honey Produced in the Region of Rtanj Mountain (Serbia). J. Food Compos. Anal. 2024, 129, 106088. [Google Scholar] [CrossRef]
  25. Ferreira, I.C.F.R.; Aires, E.; Barreira, J.C.M.; Estevinho, L.M. Antioxidant Activity of Portuguese Honey Samples: Different Contributions of the Entire Honey and Phenolic Extract. Food Chem. 2009, 114, 1438–1443. [Google Scholar] [CrossRef]
  26. Zhishen, J.; Mengcheng, T.; Jianming, W. The Determination of Flavonoid Contents in Mulberry and Their Scavenging Effects on Superoxide Radicals. Food Chem. 1999, 64, 555–559. [Google Scholar] [CrossRef]
  27. Barać, G.; Mastilović, J.; Kevrešan, Ž.; Milić, B.; Kovač, R.; Milović, M.; Kalajdžić, J.; Bajić, A.; Magazin, N.; Keserović, Z. Effects of Plant Growth Regulators on Plum (Prunus. domestica. L.) Grown on Two Rootstocks at Harvest and at the Postharvest Period. Horticulturae 2022, 8, 621. [Google Scholar] [CrossRef]
  28. Noor, N.; Sarfraz, R.A.; Ali, S.; Shahid, M. Antitumour and Antioxidant Potential of Some Selected Pakistani Honeys. Food Chem. 2014, 143, 362–366. [Google Scholar] [CrossRef]
  29. Nyarko, K.; Boozer, K.; Greenlief, C.M. Profiling of the Polyphenol Content of Honey from Different Geographical Origins in the United States. Molecules 2023, 28, 5011. [Google Scholar] [CrossRef]
  30. Szweda, P. Antimicrobial Activity of Honey. In Honey Analysis; InTech: Rijeka, Croatia, 2017. [Google Scholar]
  31. Mosmann, T. Rapid Colorimetric Assay for Cellular Growth and Survival: Application to Proliferation and Cytotoxicity Assays. J. Immunol. Methods 1983, 65, 55–63. [Google Scholar] [CrossRef]
  32. Codex Standard 12-1981; Revised Codex Standards for Honey. Codex Alimentarius Commission: Rome, Italy, 2019.
  33. Missio da Silva, P.; Gonzaga, L.V.; Biluca, F.C.; Schulz, M.; Vitali, L.; Micke, G.A.; Oliveira Costa, A.C.; Fett, R. Stability of Brazilian Apis. mellifera L. Honey during Prolonged Storage: Physicochemical Parameters and Bioactive Compounds. LWT 2020, 129, 109521. [Google Scholar] [CrossRef]
  34. Almasaudi, S.B.; Al-Nahari, A.A.M.; Abd El-Ghany, E.S.M.; Barbour, E.; Al Muhayawi, S.M.; Al-Jaouni, S.; Azhar, E.; Qari, M.; Qari, Y.A.; Harakeh, S. Antimicrobial Effect of Different Types of Honey on Staphylococcus Aureus. Saudi J. Biol. Sci. 2017, 24, 1255–1261. [Google Scholar] [CrossRef]
  35. da Silva, I.C.; Conceição, E.O.A.; Pereira, D.S.; Rogez, H.; Muto, N.A. Evaluation of the Antimicrobial Capacity of Bacteria Isolated from Stingless Bee (Scaptotrigona Aff. Postica) Honey Cultivated in Açai (Euterpe Oleracea) Monoculture. Antibiotics 2023, 12, 223. [Google Scholar] [CrossRef] [PubMed]
  36. Shapla, U.M.; Solayman, M.; Alam, N.; Khalil, M.I.; Gan, S.H. 5-Hydroxymethylfurfural (HMF) Levels in Honey and Other Food Products: Effects on Bees and Human Health. Chem. Cent. J. 2018, 12, 35. [Google Scholar] [CrossRef] [PubMed]
  37. Tornuk, F.; Karaman, S.; Ozturk, I.; Toker, O.S.; Tastemur, B.; Sagdic, O.; Dogan, M.; Kayacier, A. Quality Characterization of Artisanal and Retail Turkish Blossom Honeys: Determination of Physicochemical, Microbiological, Bioactive Properties and Aroma Profile. Ind. Crops Prod. 2013, 46, 124–131. [Google Scholar] [CrossRef]
  38. Godoy, C.A.; Valderrama, P.; Boroski, M. HMF Monitoring: Storage Condition and Honey Quality. Food Anal. Methods 2022, 15, 3162–3176. [Google Scholar] [CrossRef]
  39. Kędzierska-Matysek, M.; Florek, M.; Wolanciuk, A.; Barłowska, J.; Litwińczuk, Z. Concentration of Minerals in Nectar Honeys from Direct Sale and Retail in Poland. Biol. Trace Elem. Res. 2018, 186, 579–588. [Google Scholar] [CrossRef]
  40. Pereira, C.C.; do Nascimento da Silva, E.; de Souza, A.O.; Vieira, M.A.; Ribeiro, A.S.; Cadore, S. Evaluation of the Bioaccessibility of Minerals from Blackberries, Raspberries, Blueberries and Strawberries. J. Food Compos. Anal. 2018, 68, 73–78. [Google Scholar] [CrossRef]
  41. Biluca, F.C.; da Silva, B.; Caon, T.; Mohr, E.T.B.; Vieira, G.N.; Gonzaga, L.V.; Vitali, L.; Micke, G.; Fett, R.; Dalmarco, E.M.; et al. Investigation of Phenolic Compounds, Antioxidant and Anti-Inflammatory Activities in Stingless Bee Honey (Meliponinae). Int. Food Res. 2020, 129, 108756. [Google Scholar] [CrossRef]
  42. Swallah, M.S.; Sun, H.; Affoh, R.; Fu, H.; Yu, H. Antioxidant Potential Overviews of Secondary Metabolites (Polyphenols) in Fruits. Int. J. Food Sci. 2020, 2020, 9081686. [Google Scholar] [CrossRef]
  43. Trautvetter, S.; Koelling-Speer, I.; Speer, K. Confirmation of Phenolic Acids and Flavonoids in Honeys by UPLC-MS. Apidologie 2009, 40, 140–150. [Google Scholar] [CrossRef]
  44. Gašić, U.; Stanković, D.; Dabić, D.; Milojković-Opsenica, D.; Natić, M.; Tešić, Z.; Mutić, J. Analytical Possibilities for the Relative Estimation of the Antioxidative Capacity of Honey Varieties Harvested in Different Regions of Serbia. J. Serb. Chem. Soc. 2016, 81, 567–574. [Google Scholar] [CrossRef]
  45. Bodó, A.; Radványi, L.; Kőszegi, T.; Csepregi, R.; Nagy, D.U.; Farkas, Á.; Kocsis, M. Melissopalynology, Antioxidant Activity and Multielement Analysis of Two Types of Early Spring Honeys from Hungary. Food Biosci. 2020, 35, 100587. [Google Scholar] [CrossRef]
  46. Đogo Mračević, S.; Krstić, M.; Lolić, A.; Ražić, S. Comparative Study of the Chemical Composition and Biological Potential of Honey from Different Regions of Serbia. Microchem. J. 2020, 152, 104420. [Google Scholar] [CrossRef]
  47. Higbee, J.; Brownmiller, C.; Solverson, P.; Howard, L.; Carbonero, F. Polyphenolic Profiles of a Variety of Wild Berries from the Pacific Northwest Region of North America. Curr. Res. Food Sci. 2023, 7, 100564. [Google Scholar] [CrossRef] [PubMed]
  48. Grabek-Lejko, D.; Miłek, M.; Sidor, E.; Puchalski, C.; Dżugan, M. Antiviral and Antibacterial Effect of Honey Enriched with Rubus Spp. as a Functional Food with Enhanced Antioxidant Properties. Molecules 2022, 27, 4859. [Google Scholar] [CrossRef] [PubMed]
  49. Aaby, K.; Grimmer, S.; Holtung, L. Extraction of Phenolic Compounds from Bilberry (Vaccinium. myrtillus. L.) Press Residue: Effects on Phenolic Composition and Cell Proliferation. LWT 2013, 54, 257–264. [Google Scholar] [CrossRef]
  50. Aly, A.A.; Ali, H.G.M.; Eliwa, N.E.R. Phytochemical Screening, Anthocyanins and Antimicrobial Activities in Some Berries Fruits. J. Food Meas. Charact. 2019, 13, 911–920. [Google Scholar] [CrossRef]
  51. Zhao, F.; Wang, J.; Wang, W.; Lyu, L.; Wu, W.; Li, W. The Extraction and High Antiproliferative Effect of Anthocyanin from Gardenblue Blueberry. Molecules 2023, 28, 2850. [Google Scholar] [CrossRef]
  52. Marić, A.; Jovanov, P.; Sakač, M.; Novaković, A.; Hadnađev, M.; Pezo, L.; Mandić, A.; Milićević, N.; Đurović, A.; Gadžurić, S. A Comprehensive Study of Parameters Correlated with Honey Health Benefits. RSC Adv. 2021, 11, 12434–12441. [Google Scholar] [CrossRef]
  53. Bobinaitė, R.; Viškelis, P.; Venskutonis, P.R. Variation of Total Phenolics, Anthocyanins, Ellagic Acid and Radical Scavenging Capacity in Various Raspberry (Rubus spp.) Cultivars. Food Chem. 2012, 132, 1495–1501. [Google Scholar] [CrossRef]
  54. Cook, N.C.; Samman, S. Flavonoids–Chemistry, Metabolism, Cardioprotective Effects and Dietary Sources. J. Nutr. Biochem. 1996, 7, 66–76. [Google Scholar] [CrossRef]
  55. de Mello Andrade, J.M.; Fasolo, D. Polyphenol Antioxidants from Natural Sources and Contribution to Health Promotion. In Polyphenols in Human Health and Disease; Elsevier: Amsterdam, The Netherlands, 2014; pp. 253–265. [Google Scholar]
  56. Masoura, M.; Passaretti, P.; Overton, T.W.; Lund, P.A.; Gkatzionis, K. Use of a Model to Understand the Synergies Underlying the Antibacterial Mechanism of H2O2-Producing Honeys. Sci. Rep. 2020, 10, 17692. [Google Scholar] [CrossRef] [PubMed]
  57. Deng, J.; Liu, R.; Lu, Q.; Hao, P.; Xu, A.; Zhang, J.; Tan, J. Biochemical Properties, Antibacterial and Cellular Antioxidant Activities of Buckwheat Honey in Comparison to Manuka Honey. Food Chem. 2018, 252, 243–249. [Google Scholar] [CrossRef] [PubMed]
  58. Leyva-Jimenez, F.J.; Lozano-Sanchez, J.; Borras-Linares, I.; de la Luz Cadiz-Gurrea, M.; Mahmoodi-Khaledi, E. Potential Antimicrobial Activity of Honey Phenolic Compounds against Gram Positive and Gram Negative Bacteria. LWT 2019, 101, 236–245. [Google Scholar] [CrossRef]
  59. Almasaudi, S. The Antibacterial Activities of Honey. Saudi J. Biol. Sci. 2021, 28, 2188–2196. [Google Scholar] [CrossRef]
  60. Das, Q.; Islam, M.R.; Marcone, M.F.; Warriner, K.; Diarra, M.S. Potential of Berry Extracts to Control Foodborne Pathogens. Food Control 2017, 73, 650–662. [Google Scholar] [CrossRef]
  61. do Carmo, M.A.V.; Pressete, C.G.; Marques, M.J.; Granato, D.; Azevedo, L. Polyphenols as Potential Antiproliferative Agents: Scientific Trends. Curr. Opin. Food Sci. 2018, 24, 26–35. [Google Scholar] [CrossRef]
  62. Haiyan, S.; Funing, M.; Keming, L.; Wei, S.; Guiying, X.; Rulin, Z.; Shenghe, C. Growth of Breast Cancer Cells Inhibited by Bromelains Extracted from the Different Tissues of Pineapple. Folia Biol. 2020, 68, 81–88. [Google Scholar] [CrossRef]
  63. Gani, M.B.A.; Nasiri, R.; Hamzehalipour Almaki, J.; Majid, F.A.A.; Marvibaigi, M.; Amini, N.; Chermahini, S.H.; Mashudin, M. In Vitro Antiproliferative Activity of Fresh Pineapple Juices on Ovarian and Colon Cancer Cell Lines. Int. J. Pept. Res. Ther. 2015, 21, 353–364. [Google Scholar] [CrossRef]
  64. Li, F.; Li, S.; Li, H.-B.; Deng, G.-F.; Ling, W.-H.; Wu, S.; Xu, X.-R.; Chen, F. Antiproliferative Activity of Peels, Pulps and Seeds of 61 Fruits. J. Funct. Foods 2013, 5, 1298–1309. [Google Scholar] [CrossRef]
  65. Reguengo, L.M.; do Nascimento, R.D.; da Fonseca Machado, A.P.; Junior, M.R. Signaling Pathways and the Potential Anticarcinogenic Effect of Native Brazilian Fruits on Breast Cancer. Int. Food Res. 2022, 155, 111117. [Google Scholar] [CrossRef]
Figure 1. Principal component analysis (PCA) of antioxidative, antibacterial and antiproliferative properties of honey/honey-based products enriched with lyophilized fruits.
Agriculture 14 02117 g001
Table 1. Physicochemical parameters of rapeseed honey and honey-based products.
Honey or HBP *Moisture
(%)
Electrical Conductivity
(mS/cm)
pHFree Acidity
(meq/kg)
HMF
(mg/kg)
Rapeseed honey19.4 ± 0.20 bc0.21 ± 0.01 a3.78 ± 0.09 cba6.00 ± 0.20 a5.02 ± 0.05 a
HBP-BlackB19.8 ± 0.06 c0.37 ± 0.02 b3.61 ± 0.20 ba18.0 ± 0.79 cd5.81 ± 0.12 bc
HBP-Orange19.6 ± 0.35 bc0.60 ± 0.01 c3.90 ± 0.07 cb16.7 ± 0.38 c5.93 ± 0.35 bc
HBP-PineA16.3 ± 0.40 a0.35 ± 0.03 b3.97 ± 0.04 c12.1 ± 0.27 b5.05 ± 0.03 a
HBP-RaspB18.7 ± 0.20 b0.55 ± 0.05 c3.74 ± 0.10 cba30.7 ± 1.41 g6.33 ± 0.14 c
HBP-BlueB19.2 ± 0.60 bc0.36 ± 0.04 b3.60 ± 0.06 a19.3 ± 0.80 de7.10 ± 0.44 d
HBP-StrawB20.0 ± 0.15 c0.58 ± 0.04 c3.96 ± 0.08 c20.4 ± 0.42 e5.61 ± 0.05 ab
HBP-SourC19.3 ± 0.17 bc0.42 ± 0.02 b3.99 ± 0.14 c24.4 ± 0.59 f6.32 ± 0.07 c
Means within each column with different letters differ significantly (p ≤ 0.05). * HBP—honey-based product; BlackB—blackberry; PineA—pineapple; RaspB—raspberry; BlueB—blueberry; StrawB—strawberry; SourC—sour cherry.
Table 2. Mineral content of rapeseed honey and honey-based products.
Honey or HBP *NaCaKMgZnMnFeCuTotal
(mg/kg)
Rapeseed honey44.0 ± 13.8 a101 ± 15.7 a307 ± 50.4 a32.8 ± 5.1 a0.25 ± 0.04 a0.37 ± 0.06 a2.65 ± 0.63 a0.08± 0.01 a488 ± 83.8
HBP-BlackB63.5 ± 10.4 bc178 ± 27.5 c627 ± 103 bc114 ± 17.6 e1.89 ± 0.29 b17.8 ± 2.74 e4.77 ± 0.74 b0.66 ± 0.10 d1008 ± 158
HBP-Orange88.6 ± 14.5 e324 ± 50.2 d875 ± 144 de93.6 ± 14.5 d2.27 ± 0.35 bc0.62 ± 0.10 a5.33 ± 0.82 b0.52 ± 0.08 cd1390 ± 218
HBP-PineA87.2 ± 14.3 de126 ± 19.5 ab706 ± 116 cd72.7 ± 11.3 b2.77 ± 0.43 c12.4 ± 1.90 c4.44 ± 0.68 ab1.09 ± 0.17 e1013 ± 159
HBP-RaspB85.0 ± 14.0 de160 ± 24.8 bc1017 ± 167 e87.0 ± 13.5 c2.75 ± 0.42 c15.3 ± 2.36 d5.48 ± 0.84 b0.52 ± 0.08 cd1373 ± 215
HBP-BlueB94.2 ± 15.5 e185 ± 28.7 c466 ± 76.5 ab66.9 ± 10.4 b4.12 ± 0.63 d15.8 ± 2.44 d5.52 ± 0.85 b0.31 ± 0.05 bc838 ± 131
HBP-StrawB75.4 ± 12.4 cd172 ± 26.7 c1029 ± 166 e95.8 ± 14.8 d1.70 ± 0.26 b2.04 ± 0.31 b10.4 ± 1.60 c0.30 ± 0.05 bc1387 ± 217
HBP-SourC62.5 ± 10.3 b155 ± 23.9 bc628 ± 103 bc72.8 ± 11.3 b0.80 ± 0.12 a0.71 ± 0.11 a5.61 ± 0.86 b0.20 ± 0.03 ab925 ± 145
Means within each column with different letters differ significantly (p ≤ 0.05). * HBP—honey-based product; BlackB—blackberry; PineA—pineapple; RaspB—raspberry; BlueB—blueberry; StrawB—strawberry; SourC—sour cherry.
Table 3. Total phenolic content (TPC), total flavonoid content (TFC), total anthocyanin content (TAC), and DPPH radical scavenging capacity (RSC) of rapeseed honey and honey-based products.
Honey or HBP *TPC
(mg GAE/100 g)
TFC
(mg CAE/100 g)
TAC
(mg EC/100 g)
RSC
(% of DPPH Inhibition)
Rapeseed honey12.4 ± 0.51 a1.83 ± 0.27 an.d.35.9 ± 0.77 a
HBP-BlackB93.6 ± 0.90 e17.7 ± 1.12 d125 ± 0.75 d69.3 ± 1.18 e
HBP-Orange83.5 ± 0.32 c8.17 ± 0.38 b22.1 ± 1.61 a45.0 ± 0.28 b
HBP-PineA80.7 ± 0.38 b7.12 ± 0.59 b20.1 ± 1.07 a46.6 ± 0.25 b
HBP-RaspB85.8 ± 0.72 d12.9 ± 0.41 c85.5 ± 2.27 c58.6 ± 0.54 c
HBP-BlueB98.8 ± 0.66 f34.9 ± 0.89 e299 ± 3.14 e81.0 ± 0.46 g
HBP-StrawB87.3 ± 0.64 d11.0 ± 0.96 b50.7 ± 2.54 b60.9 ± 0.16 d
HBP-SourC102 ± 0.18 g17.8 ± 1.01 c84.6 ± 0.67 c77.0 ± 0.34 f
Means within each column with different letters differ significantly (p ≤ 0.05). * HBP—honey-based product; BlackB—blackberry; PineA—pineapple; RaspB—raspberry; BlueB—blueberry; StrawB—strawberry; SourC—sour cherry. GAE—gallic acid equivalent; CAE—catechin equivalent; EC—cyanidin-3-glucoside equivalent; RSC—relative scavenging capacity; n.d.—not detectable.
Table 4. Polyphenol profile of rapeseed honey and honey-based products.
Honey or HBP *Rapeseed HoneyHBP-
BlackB
HBP-
Orange
HBP-
PineA
HBP-
RaspB
HBP-
BlueB
HBP-
StrawB
HBP-
SourC
Ellagic acid
(mg/kg)
0.15 ± 0.06 a1.38 ± 0.01 abn.d.1.12 ± 0.11 ab38.4 ± 1.11 d2.36 ± 0.31 b9.86 ± 0.59 c0.47 ± 0.08 a
Rutin
(mg/kg)
0.30 ± 0.05 a3.46 ± 0.29 cn.d.0.59 ± 0.06 a1.73 ± 0.07 b3.83 ± 0.38 c0.33 ± 0.04 a0.56 ± 0.07 a
Naringin
(mg/kg)
n.d.0.13 ± 0.03 an.d.n.d.n.d.0.52 ± 0.05 bn.d.0.21 ± 0.02 a
Naringenin
(mg/kg)
0.01 ± 0.00 a0.04 ± 0.003 a0.04 ±0.003 a0.03 ± 0.009 a0.01 ± 0.006 a0.22 ± 0.01 b0.08 ± 0.003 a0.06 ± 0.008 a
Quercetin
(mg/kg)
0.10 ± 0.01 a0.30 ± 0.01 ab0.29 ± 0.04 ab0.11 ± 0.02 a0.32 ± 0.04 ab2.23 ± 0.21 c0.49 ± 0.03 b0.069 ± 0.005 a
Protocatechuic acid
(mg/kg)
n.d.0.27 ± 0.02 b0.35 ± 0.05 bc0.09 ± 0.01 a0.11 ± 0.01 a1.26 ± 0.09 d0.38 ± 0.01 c0.34 ± 0.02 bc
Neochlorogenic acid
(mg/kg)
n.d.0.68 ± 0.07 b0.03 ± 0.00 an.d.n.d.n.d.n.d.0.03 ± 0.00 a
Caffeic acid
(mg/kg)
0.47 ± 0.04 a0.59 ± 0.05 ab1.30 ± 0.09 c0.82 ± 0.07 b0.90 ± 0.04 b4.28 ± 0.18 d0.58 ± 0.02 ba0.80 ± 0.06 ab
Chlorogenic acid
(mg/kg)
0.11 ± 0.01 a4.31 ± 0.16 d0.36 ± 0.07 abc0.25 ± 0.02 ab0.19 ± 0.02 ab0.38 ± 0.04 bc0.22 ± 0.03 ab0.53 ± 0.06 c
p-Cumaric acid
(mg/kg)
0.21 ± 0.03 a0.83 ± 0.09 ab1.36 ± 0.11 b1.43 ± 0.15 b2.21 ± 0.23 c1.35 ± 0.11 b1.28 ± 0.12 b12.8 ± 0.31 d
Ferulic acid
(mg/kg)
0.20 ± 0.02 a1.04 ± 0.13 c0.23 ± 0.03 ab0.63 ± 0.07 bc2.98 ± 0.19 d3.02 ± 0.17 d0.32 ± 0.02 ab0.30 ± 0.02 ab
Sinapic acid
(mg/kg)
0.15 ± 0.01 a0.16 ± 0.02 a0.28 ± 0.02 ab1.15 ± 0.15 d0.16 ± 0.02 a0.53 ± 0.03 c0.41 ± 0.03 bc0.15 ± 0.02 a
Quercetin-3-arabinoglucoside
(mg/kg)
n.d.n.d.n.d.n.d.n.d.1.63 ± 0.18n.d.n.d.
Quercetin-3-glucuronide
(mg/kg)
n.d.n.d.0.25 ± 0.02n.d.n.d.n.d.n.d.n.d.
Quercetin-3-glucoside
(mg/kg)
n.d.0.15 ± 0.02 a1.61 ± 0.15 b0.23 ± 0.02 an.d.1.83 ± 0.14 b0.02 ± 0.00 an.d.
Quercetin-3-rutinoside
(mg/kg)
n.d.3.83 ± 0.20 cn.d.n.d.n.d.0.92 ± 0.08 b0.36 ± 0.03 a0.49 ± 0.03 a
Total
(mg/kg)
1.70 ± 0.1117.2 ± 0.246.09 ± 0.056.46 ± 0.1847.0 ± 0.9824.3 ± 0.8214.3 ± 0.4616.7 ± 0.28
Means within each column with different letters differ significantly (p ≤ 0.05). * HBP—honey-based product; BlackB—blackberry; PineA—pineapple; RaspB—raspberry; BlueB—blueberry; StrawB—strawberry; SourC—sour cherry. n.d.—not detectable.
Table 5. Antibacterial analysis of rapeseed honey and honey-based products.
Honey or HBP *MIC (%) Against Different Strains of Bacteria
Escherichia coli
ATCC 8739
Escherichia coli
ATCC 10536
Enterococcus feacalis
ATCC 29212
Staphylococcus aureus
ATCC 25923
Staphylococcus epidermidis
ATCC 12228
Proteus hauseri
ATCC 13315
Rapeseed honey>25>25>25>25>25>25
HBP-BlackB2525252512.525
HBP-Orange>25>2525252525
HBP-PineA>25252512.525>25
HBP-RaspB25252512.512.525
HBP-BlueB2525252512.525
HBP-StrawB>25252512.52525
HBP-SourC2525252512.525
The determination of MIC (minimum inhibitory concentrations) was performed in triplicate. * HBP—honey-based product; BlackB—blackberry; PineA—pineapple; RaspB—raspberry; BlueB—blueberry; StrawB—strawberry; SourC—sour cherry.
Table 6. Effects of rapeseed honey and honey-based products on the growth of selected human cell lines (expressed as IC50 values (mg/mL)).
Honey or HBP *Cell Lines
MCF-7HT-29HeLaMRC-5
Rapeseed honey>100 e>100 e>100 d>100 b
HBP-BlackB>100 e>100 e>100 d>100 b
HBP-Orange>100 e48.4 ± 2.09 c>100 d>100 b
HBP-PineA9.04 ± 0.16 a28.3 ± 0.91 a34.2 ± 1.25 a>100 b
HBP-RaspB24.6 ± 0.52 b>100 e79.9 ± 3.33 c>100 b
HBP-BlueB9.95 ± 0.24 a>100 e23.1 ± 0.66 b>100 b
HBP-StrawB>100 e>100 e>100 d>100 b
HBP-SourC30.8 ± 1.13 c85.2 ± 3.05 d>100 d>100 b
Standard glucose35.6 ± 2.58 d32.0 ± 0.40 b33.9 ± 1.31 a43.7 ± 3.50 a
Values represent means ± SD of four (test samples and standard) or eight (control). Means within each column with different letters differ significantly (p ≤ 0.05). * HBP—honey-based product; BlackB—blackberry; PineA—pineapple; RaspB—raspberry; BlueB—blueberry; StrawB—strawberry; SourC—sour cherry. HeLa—HeLa human cervical carcinoma cell line; MCF-7—MCF-7 human breast adenocarcinoma cell line; HT-29—HT-29 human colorectal adenocarcinoma cell line; MRC-5—MRC-5 human lung cell line.
Disclaimer/Publisher’s Note: The statements, opinions and data contained in all publications are solely those of the individual author(s) and contributor(s) and not of MDPI and/or the editor(s). MDPI and/or the editor(s) disclaim responsibility for any injury to people or property resulting from any ideas, methods, instructions or products referred to in the content.

