Abstract
To address the issue of reduced yield in the second season caused by damaged stubbles resulting from being compressed during the harvesting process of the first season’s ratoon rice, a device for rectifying the compressed stubbles was designed. Utilizing the DEM-MBD coupling simulation method, a simulation analysis was conducted to determine the range of key parameters and verify the feasibility of the solution. Using rotational speed, forward speed, and stubble entry angle as experimental factors and stubble rectification rate and second-season yield as evaluation metrics, a three-factor, three-level Box–Behnken response surface field trial was conducted. The theoretically optimal working parameter combination was found to be a forward speed of 1.4 m/s, device rotational speed of 75 rpm, and stubble entry angle of 39°. Under these conditions, three parallel experiments were performed, resulting in a rectification rate of 90.35% in the mechanically harvested and compressed area and a second-season yield of 2202.64 ± 35 kg/hm2. The deviation from the numerical simulation results of parameter optimization was less than 5%. These findings suggest that the designed stubble rectification device for ratoon rice can meet the requirements of stubble rectification during the first-season harvest of ratoon rice. Furthermore, it provides valuable insights for reducing harvest losses in the first season and further improving the level of mechanized harvesting for ratoon rice.
1. Introduction
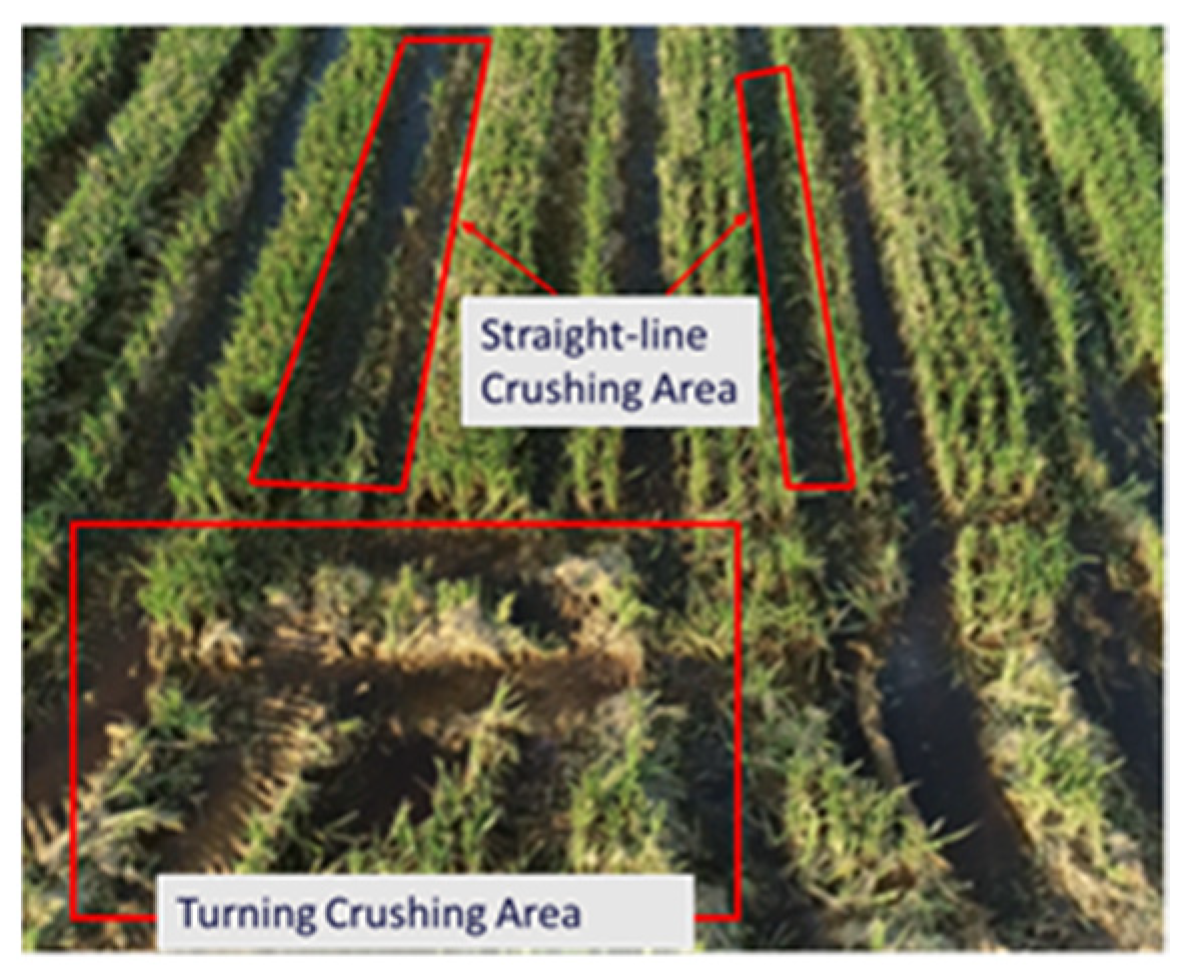
Ratoon rice refers to a rice planting mode where, after harvesting the first-season rice, specific cultivation and management measures are taken to stimulate dormant axillary buds on the stubs to germinate into tillers [1], which ultimately produce ears, flowers, and set seed, enabling a second harvest from the same planting. This method offers advantages such as double harvest from one planting, labor and cost savings, increased yield and efficiency, and superior rice quality in the second season [2,3], enhancing the net economic benefit of the ecosystem [4]. Currently, the cultivated area of ratoon rice in southern China has exceeded 1.3 million hm2 [5], with a potential for further expansion of 3–6 million hm2. However, during machine harvesting, the straight-line crushing rate (the ratio of the crawler crushing area to the harvesting area) is as high as 40–50% [6,7], and the turning area is 70–80%, as shown in Figure 1, which results in delayed development of regenerative axillary buds and severe yield reduction in the second season (with the ratoon yield in the crushed area accounting for about 30% of the uncrushed area) [8,9,10]. Therefore, increasing the yield of the second season of ratoon rice is of great significance to the development of ratoon rice [11,12].

Figure 1.
Stubs of ratoon rice being crushed.
In order to address the technical challenge of significant yield reduction in the second-season rice caused by the high rolling compaction rate during mechanical harvesting of the first-season ratoon rice, Yang et al. attempted to enhance the yield and quality of the ratoon season through optimized variety selection and cultivation techniques [13]. However, this approach failed to effectively reduce the compaction rate and had limited success in increasing yield. On the other hand, scholars such as Fu and Zeng tackled the issue from a different perspective by improving the design of the harvester. They developed a specialized harvester for ratoon rice through adjustments to the cutting table width and optimization of the chassis form [14,15,16,17,18]. This approach achieved notable success in reducing the straight-line compaction rate and significantly contributed to increasing the yield of the second-season rice. However, it is worth noting that they did not consider the potential impact of compacted stubbles on the yield of the second-season rice.
To enhance the yield of second-season rice from compacted stubbles, Chen et al. conducted an experiment comparing various indicators such as total dry weight, number of panicles, and axillary buds between manually straightened and unstraightened compacted stubbles during the second-season harvest [19]. The results demonstrated that straightening the compacted stubbles can contribute to increasing the yield of the second-season rice. Additionally, the team designed an innovative double-layer chain-driven claw-type straightening device for ratoon rice aimed at lifting the compacted stubbles, achieving a straightening rate of approximately 55% [20,21]. However, due to the need for the machine to re-enter the field during operation, which can potentially cause secondary damage to the stubbles, and the lack of direct yield tests in the second season to verify the device’s effectiveness in increasing production, further research and validation are required to assess its practical application.
With the development of computer technology, the Discrete Element Method (DEM) has become a significant tool for studying the interaction mechanisms between crops and mechanical devices, and its application in agricultural machinery research is increasingly widespread [22,23,24]. Sun-integrated geometric and mechanical models to construct a DEM-based wheat plant model with flexible characteristics. By comparing experimental data with simulation results, the feasibility and effectiveness of the DEM in building flexible plant models were fully verified [25]. During the design process of the lawn mower, Shen utilized ADAMS 2022 and EDEM 2020 software to establish a coupled simulation platform for dynamic analysis and optimization of the device. Field measurements confirmed that the operational performance of the device meets national standards and the practical demands of agricultural production [26]. Wang employed the MBD-DEM coupling method to conduct simulation experiments on a trenching device. The accuracy of the simulation tests was validated through comparisons with on-site measurements, providing strong support for exploring the complex interactions between mechanical movements and soil [27]. In summary, the coupled application of DEM and dynamics software has emerged as an effective simulation testing tool for exploring the impact of mechanical device movements on crops, offering technical support for the design and optimization of agricultural machinery.
Addressing the challenge of yield reduction in the second season of regenerated rice caused by stub crushing during mechanized harvesting in the first season, this study proposes a stub straightening device for regenerated rice, considering the requirements of agricultural machinery and agronomy. The device has been designed and its feasibility has been verified through DEM-MBD coupled simulation methods. Key factors influencing the straightening performance have been identified. A prototype has been made and field tests have been conducted, using the straightening rate and yield of the second-season rice in the crushed area as operational indicators. The aim is to provide a basis and reference for the research and development, as well as the improvement of the stub straightening device for mechanized harvesting of regenerated rice, ultimately aiming to enhance the mechanization level of regenerated rice harvesting operations.
2. Materials and Methods
2.1. Overall Structure and Working Principle
2.1.1. Characteristics of Stubble Plants
The crushed stubs left during the harvesting of the first season of regenerated rice are the targets of the stub straightening device. Unlike normal rice plants, which have rice ears, the stubs mainly consist of rice stems, leaf sheaths, and leaves. In the southern region of Jiangsu, China, the common varieties of regenerated rice have a stub height of 250–350 mm in the first season. The number of rice plants per clump is affected by the variety and transplantation, ranging from 10 to 20 plants. After being crushed, the stubs spread radially from the root, as shown in Figure 2a, and form an angle of about 30° with the ground, as shown in Figure 2b.
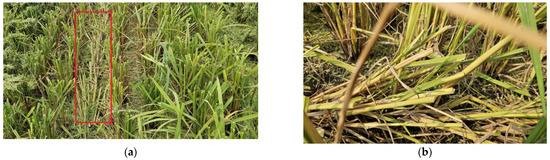
Figure 2.
The shape of the pile after being rolled, (a) the state of the pile after being crushed; and (b) the angle between the pile and the ground.
2.1.2. Overall Structure
The stub straightening device designed in this article is mounted behind the harvester through connecting frames and double-acting hydraulic cylinders, as shown in Figure 3. Its height from the ground can be adjusted through the lifting mechanism of the hydraulic cylinder. Meanwhile, it is rotated by a DC gear motor. During the harvesting process, the stubs that have been crushed are lifted up under the action of the straightening gears. The straightening device mainly consists of a rotating shaft, a motor, stub straightening gears, inner and outer discs, an eccentric adjusting plate, and other components, as illustrated in Figure 4. The width of the straightening operation can be adjusted based on the track width. The device has a simple structure and can flexibly adapt to different types of harvesters.
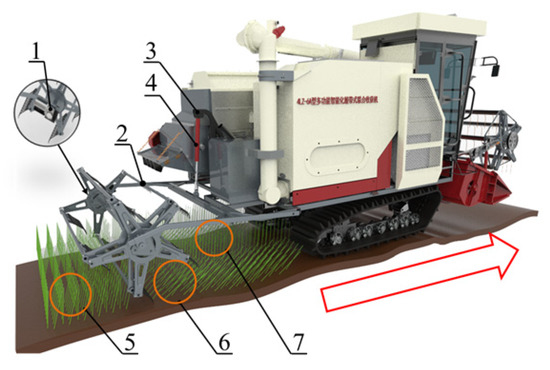
Figure 3.
Schematic diagram of the overall configuration of the stub straightening device with the combined harvester: 1. Motor; 2. Stub Straightening Device; 3. Mounting Frame; 4. Hydraulic Cylinder; 5. Straightened Stub; 6. Crushed Stub; 7. Upright Stub.
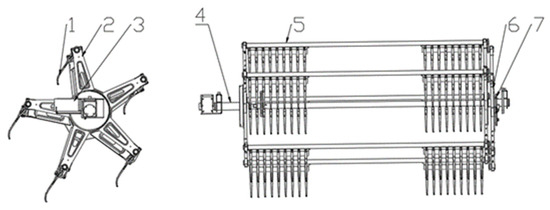
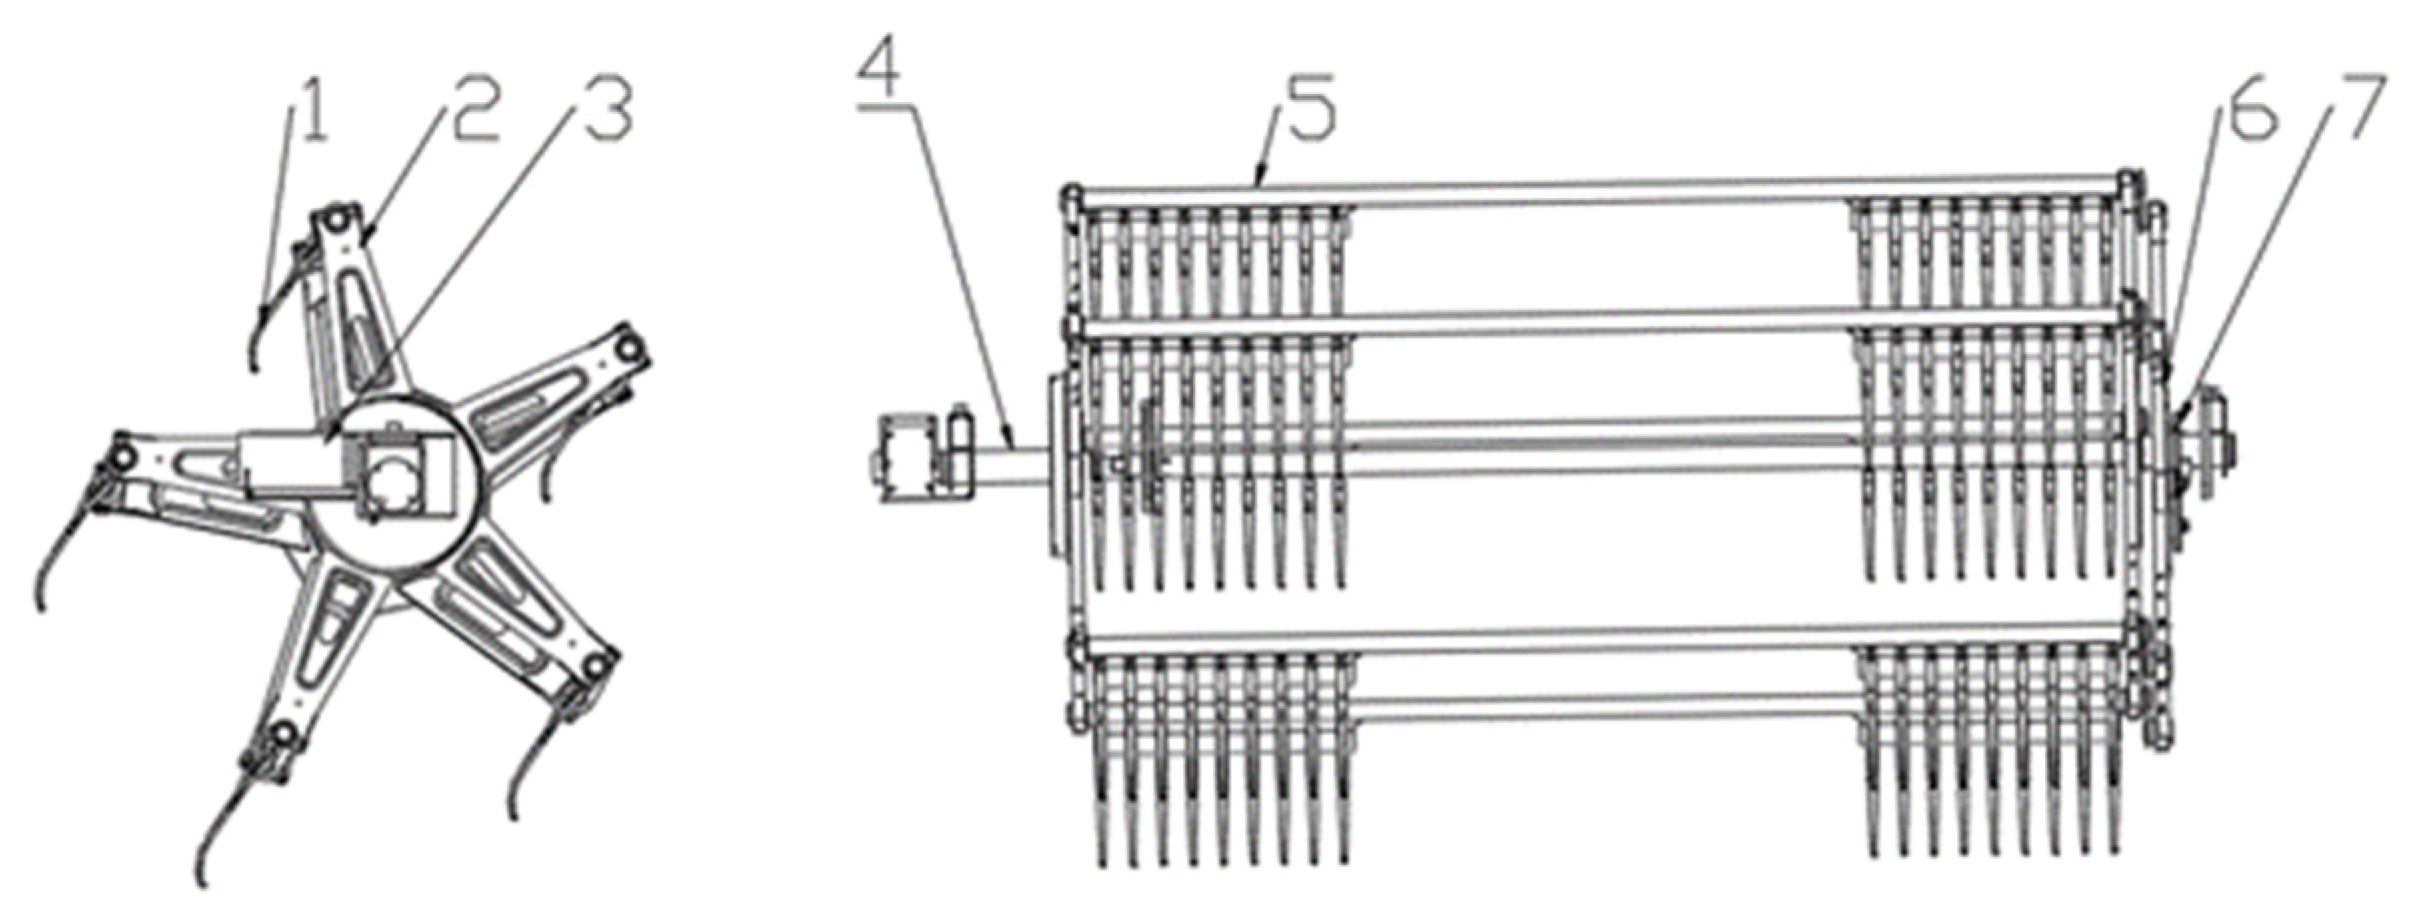
Figure 4.
Structural diagram of the stub straightening device: 1. Stub retaining and aligning gear; 2. Inner plate; 3. DC gear motor; 4. Rotating shaft; 5. Rack bar; 6. Outer plate; 7. Eccentric adjusting plate.
2.1.3. Working Principle of the Uprighting Process
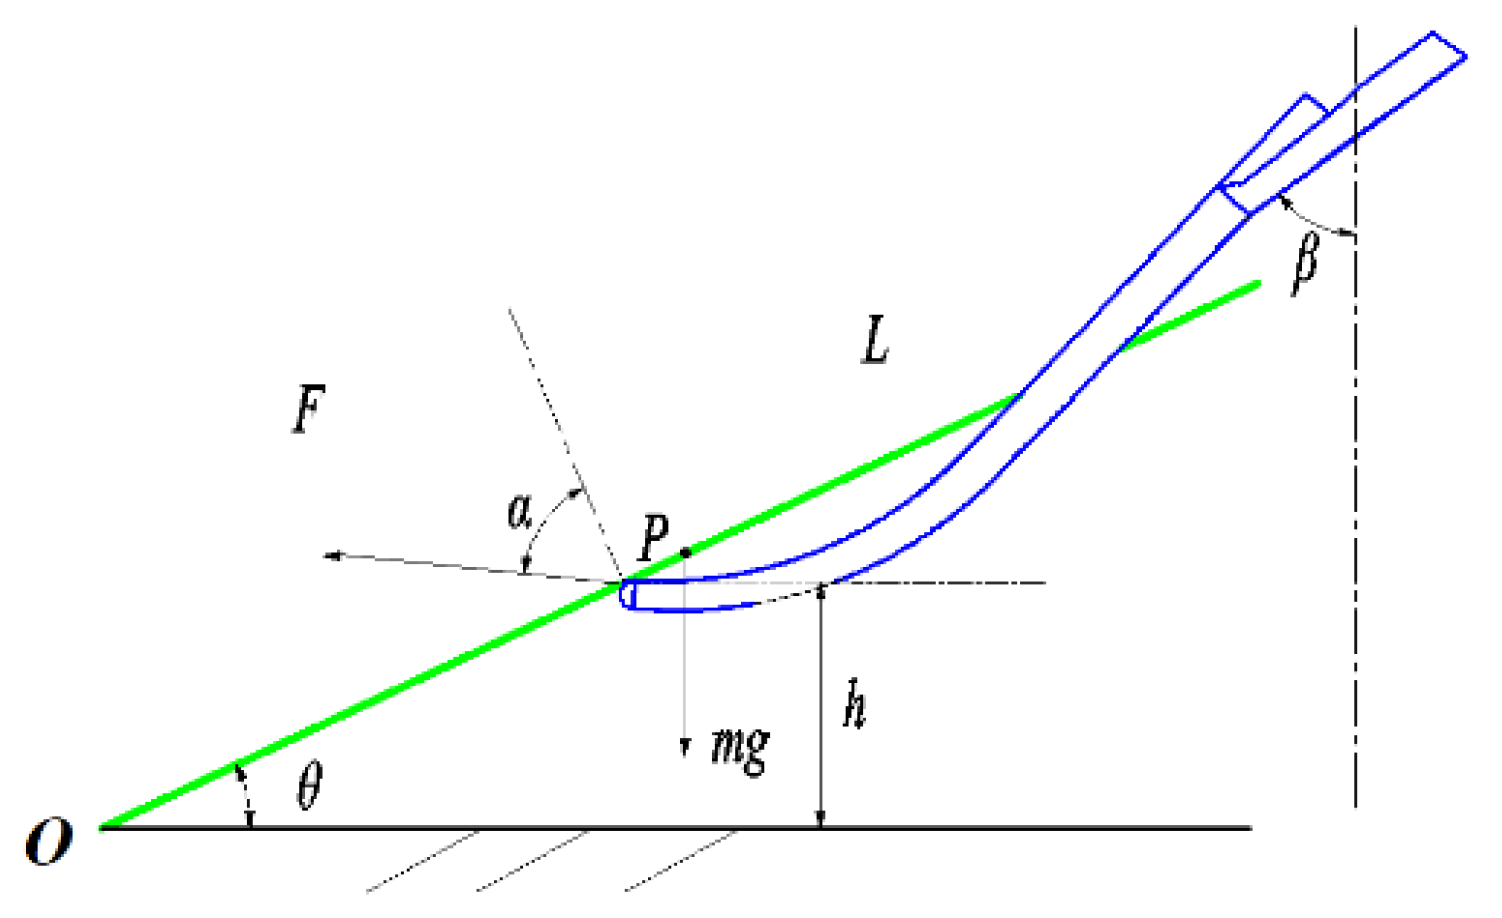
During the mechanized harvesting of the first season of ratoon rice, the direction of the leaning stubs is consistent with the forward direction of the harvester, and the stubs, after being crushed, form an angle of 20 to 30 degrees with the ground. The linear velocity direction of the uprighting teeth is opposite to the harvester’s forward direction. In the rotation process of the uprighting device, it is assumed that the crushed stubs in the crushing zone are in a static state after being crushed and that the uprighting teeth only come into contact with the stem of the crushed stub once, ignoring the influence of wind force. When the uprighting teeth come into contact with the crushed stub instantaneously, the force acts perpendicularly upward to the centerline of the stub. The stress state is shown in Figure 5, which satisfies the following conditions:
where m represents the mass of the crushed stub in the crushing zone, kg; L is the length of the stub, m; P denotes the force applied by the uprighting tooth on the crushed stub, N; θ is the angle between the stub and the ground, °; h stands for the height of the contact point from the ground, m; α is the angle between P and the normal line of the stem, which varies with the change in the stub entry angle β.
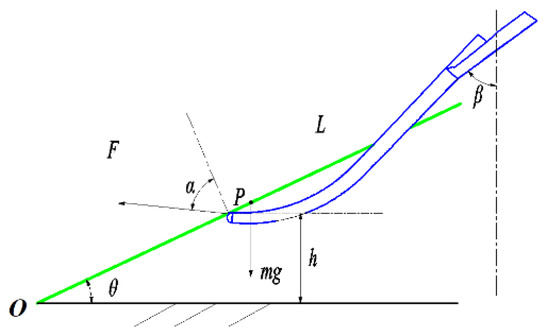
Figure 5.
Contact interaction between uprighting teeth and stubs: the green part represents a single rice straw, while the blue part represents the uprighting tooth.
2.2. Design of Key Components of the Uprighting Device
2.2.1. Determination of Uprighting Teeth Spacing
The spacing between uprighting teeth refers to the lateral distance between two adjacent teeth. Field experiments have revealed that the uprighting of crushed stubs is primarily achieved by inserting the uprighting teeth beneath them and pushing them upright. To ensure effective uprighting, the spacing between the teeth must be appropriate. If the spacing is too narrow, it increases the likelihood of the teeth striking the stubs, potentially uprooting them and causing significant resistance that could damage the uprighting device. Conversely, if the spacing is too wide, individual rice plants may fall completely between two teeth, rendering the device ineffective. Therefore, based on field observations and statistics on the distribution of crushed stubs, it was found that the width of a single row of rice stubs after being crushed ranged between 180 and 250 mm, with a relatively concentrated distribution. Through manual field trials, it was determined that a spacing of 20–30 mm (adjustable) between the uprighting teeth was optimal for effectively uprighting the crushed stubs.
2.2.2. Design of the Rotation Speed of the Uprighting Device
In order to lift up the pressed rice stubbles and avoid causing secondary damage to them due to excessive striking by the uprighting teeth, it is necessary to analyze their movement trajectory. The movement trajectory of the uprighting tooth tip is the resultant motion formed by the forward movement of the harvester and the rotation of the device, as shown in Figure 6. The equation of motion is as follows:
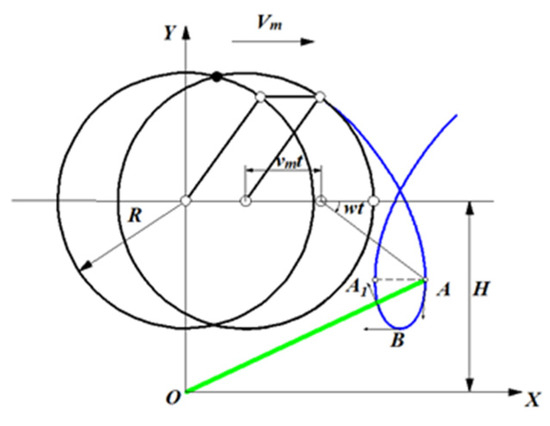
Figure 6.
Schematic diagram of the movement trajectory of the tooth uprighting. Note: The green part represents a single rice straw, while the blue part represents the trajectory of the uprighting tooth.
In the formula, represents the forward speed of the harvester, m/s; t represents the working time of the device, s; R denotes the radius of the uprighting device, m; ω is the rotational speed of the stub uprighting device, rad/s; n signifies the rotational speed of the uprighting device, r/min; λ is the ratio of the circumferential linear velocity of the stubble straightening device to the forward speed of the harvester, known as the stub uprighting speed ratio; and represent the coordinate values of any point on the tooth under the coordinate system XOY, while and are the velocity components at that point.
From Formulas (2) and (3), it can be inferred that the movement trajectory of any point on the uprighting tooth of the uprighting device follows a trochoidal curve. To achieve stubble uprighting, which requires the stubble uprighting device to have a backward component of velocity when it rotates to near the lowest point, the velocity ratio must be satisfied λ > 1, and a loop must be formed between ABA1. On the maximum chord AA1 of the loop, the absolute velocity of point A is vertical downward, while that of point A1 is vertical upward. The absolute velocity of the lowest point B is horizontal backward. Therefore, only within the range of the ABA1 segment is there a horizontal backward component of velocity for stubble uprighting [28]. Assuming that the action point of stubble uprighting is below point B, the effective range of direct stubble uprighting by the uprighting tooth can be expressed by Formula (6) as follows:
From Formula (6), it can be seen that the effective range of the uprighting tooth for supporting rice stubs is related to the rotational speed of the device, the radius of the device, and the forward speed of the harvester. Taking into account the overall length of the harvester, the need to lift the uprighting device during operation, and the relationship between the uprighting device and the harvester’s crusher, as well as referencing devices such as the rice-pushing wheel of the harvester, the radius of the stub-uprighting device is designed to be 450 mm. When the radius of the device remains constant, the effective range of the uprighting tooth for supporting rice stubs is only related to λ (The ratio of the circumferential speed of the device to the forward speed of the harvester.). When λ is small, it is difficult to lift the pressed rice stubs; when λ is large, the rotational speed of the device is too high, resulting in excessive force on the stubs, which may lead to over-uprighting and causing secondary damage to the stubs. When λ > 1, referencing the normal operating speed of the harvester = 1.2 m/s, the rotational speed of the uprighting device should be >26 r/min.
2.2.3. Determination of the Number of Uprighting Teeth Rows
To achieve the uprighting of all pressed rice stubs, theoretically, the trajectory of the uprighting tooth tips of the stub-uprighting device should be able to cover all pressed stubs. Referencing a stub height of 300 mm and an angle of approximately 30° between the pressed stub and the ground, the trajectory of the uprighting teeth should completely cover a horizontal line approximately 100 mm above the ground. The area not covered by the trajectory of the uprighting device is defined as the “missed uprighting area.” To improve the uprighting effect of the device, the missed uprighting area needs to be controlled within a reasonable range.
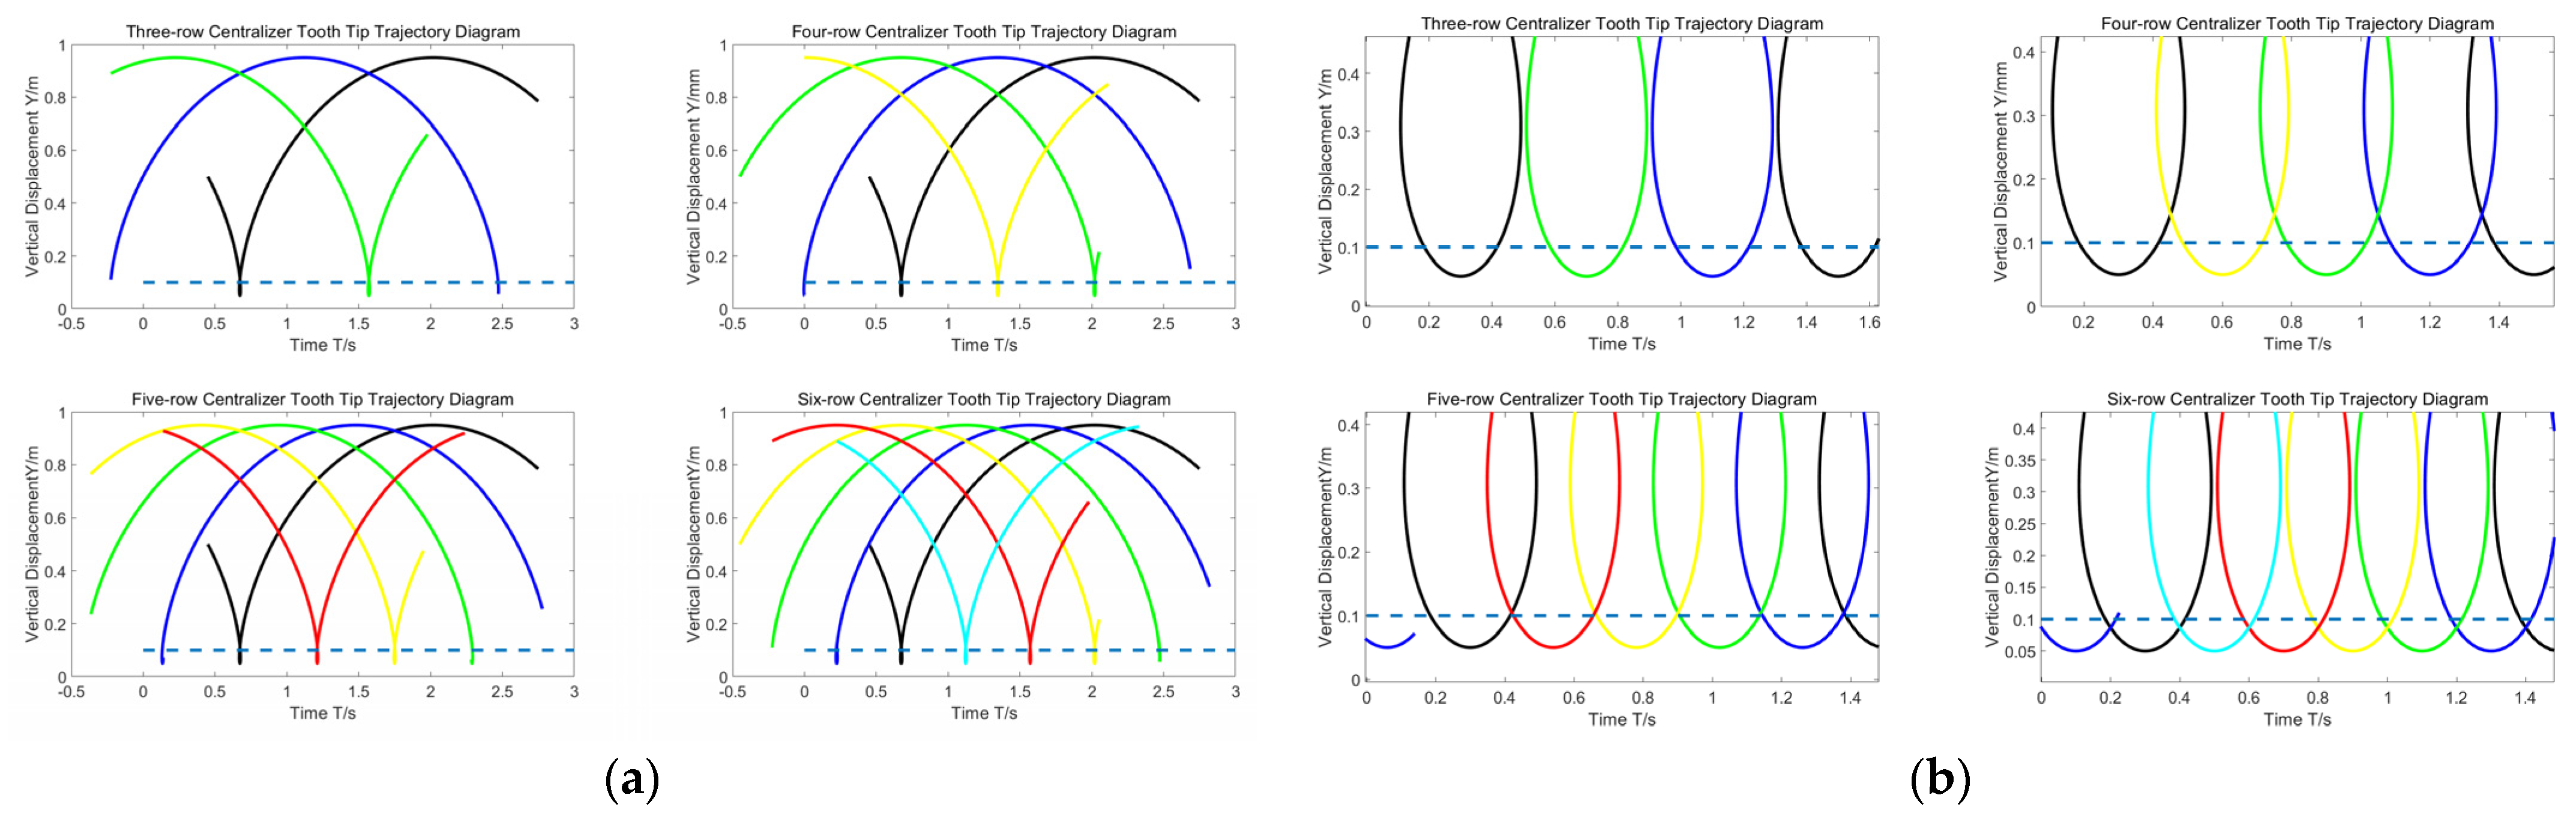
Combined with Formula (2), the size of the missed uprighting area depends on the forward speed of the harvester, the rotational speed of the uprighting device, the number of rows of uprighting teeth, and the height above the ground. During the uprighting process, because one end of the regenerated rice stub grows in the soil, the height of the uprighting tooth above the ground should be less than 100 mm, but if it is too small, it will lead to damage to the uprighting device and poor reliability. Referencing the values of 1.2 m/s for the forward speed, 450 mm for the radius R, greater than 26 r/min for the rotational speed, and 500 mm for H, the MATLAB 2022b (R2022b, MathWorks. Inc., Natick, MA, USA) software was used to analyze the trajectories of the uprighting tooth tips with different numbers of rows. The results, as shown in Figure 7a, indicate that six rows of uprighting teeth still cannot meet the uprighting requirements at this rotational speed. Therefore, the rotational speed was increased to 60 r/min, and the results are shown in Figure 7b. The analysis reveals that with a rotational speed of 60 r/min, three and four rows of uprighting teeth have missed uprighting areas, and there is no guarantee that all pressed stubs will come into contact with the uprighting teeth. However, five and six rows of uprighting teeth can meet the requirements. Considering the weight of the device and structural simplicity, a five-row uprighting tooth configuration is selected.
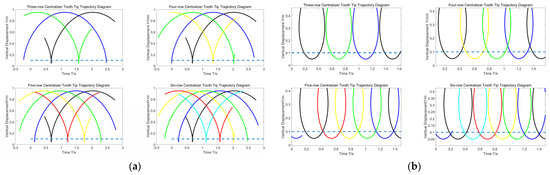
Figure 7.
Simulation trajectory diagrams under different conditions in MATLAB; (a) MATLAB simulation trajectory diagram of different rows of uprighting teeth at 30 r/min; (b) MATLAB simulation trajectory diagram of different rows of uprighting teeth at 60 r/min. Note: Different colors represent the trajectories of different uprighting teeth.
2.3. Simulation Analysis
2.3.1. Establishment of Simulation Model
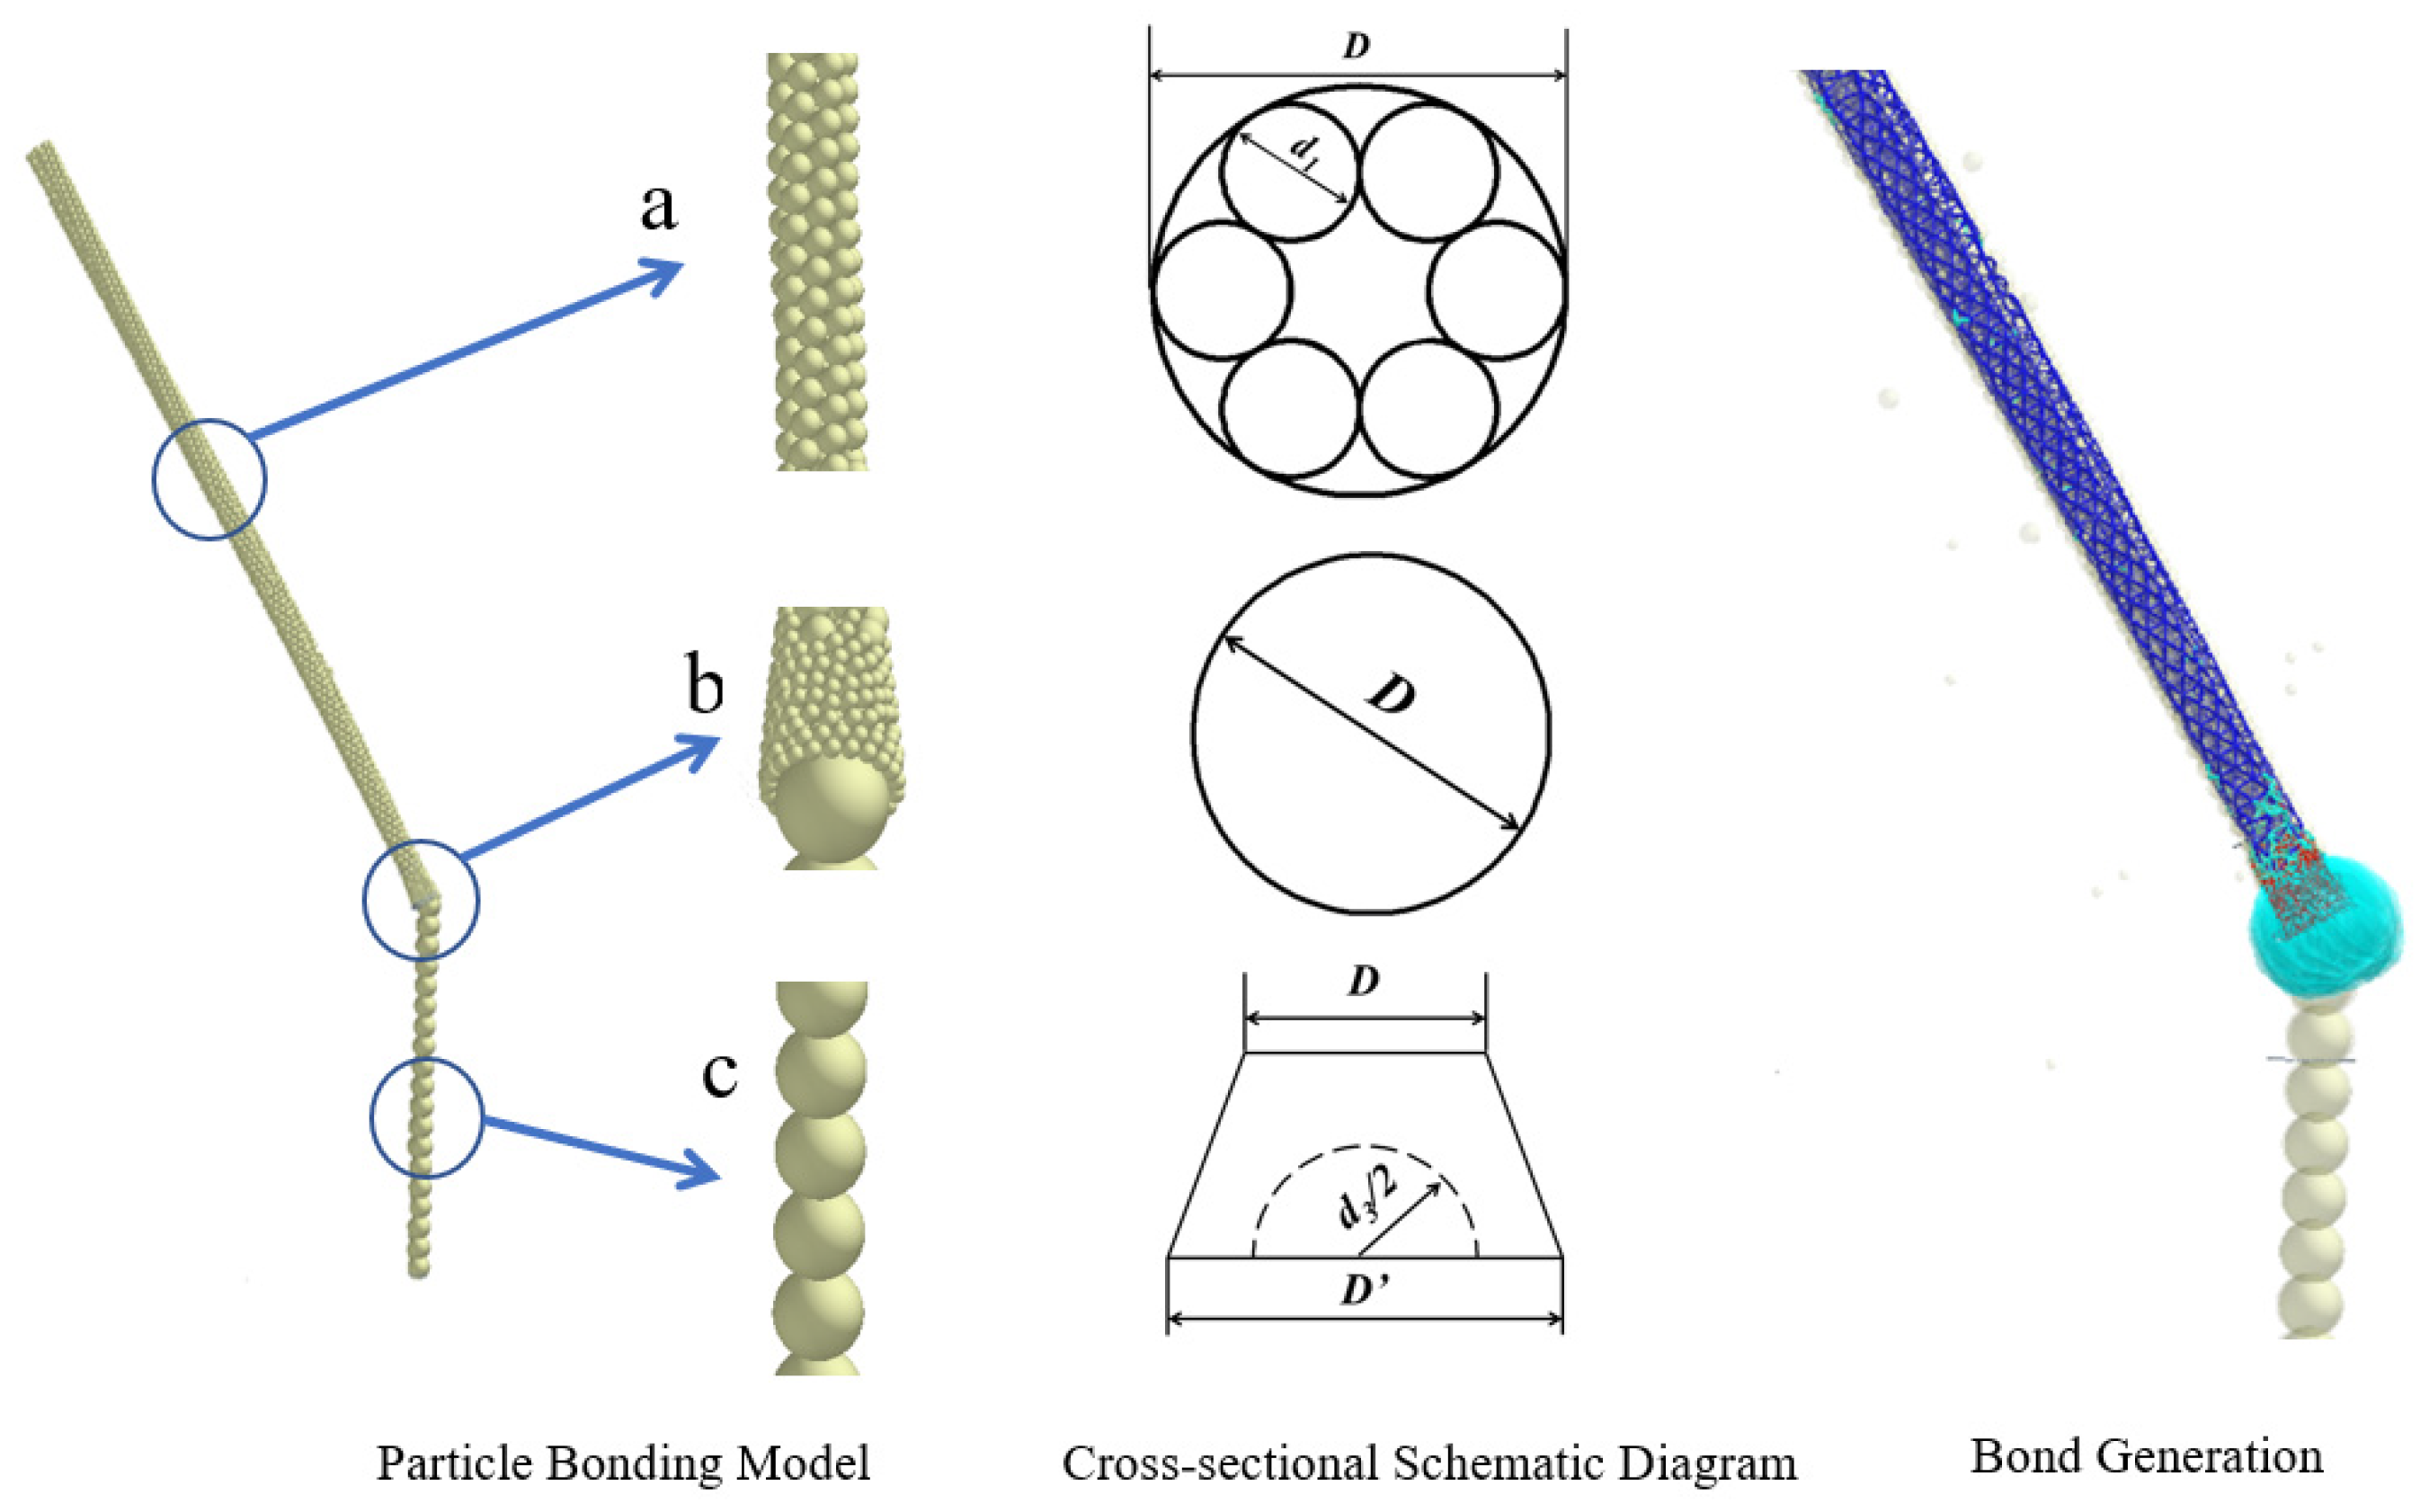
Utilizing DEM-MBD technology, it is possible to model and simulate complex issues within the soil-crop-machinery system in the agricultural field, enabling the optimization of agricultural machinery design [29,30]. This article utilizes the discrete element software EDEM 2020 (2020, Altair Engineering Inc., Troy, MI, USA) to construct a multi-scale aggregated spherical particle discrete element model for the stubbles of regenerated rice. Combined with the Recurdyn V9R4 (V9R4, FunctionBay, Seongnam-si, Republic of Korea) multibody dynamics approach, the process of uprighting operation is analyzed [31]. To simplify the complexity of modeling and computation, the influence of leaves and axillary buds at the base of the stubble on the uprighting process is disregarded. The stubble is divided into three sections: the stubble itself, the connection between the stubble and the root system, and the root system. Based on the characteristics of the plant, particles of different sizes are used to fill these sections accordingly. The modeling process for a single plant is illustrated in Figure 8. To achieve large deformation and crushing effects in the regenerated rice stubble model, Bonding bonds are added between the particles of the model, and the parameter settings are shown in Table 1 [32,33,34]. Finally, a simulation model of the uprighting device and the regenerated rice stubble is established as shown in Figure 9.

Figure 8.
Modeling process of the single stub.

Table 1.
Parameters for material configuration.

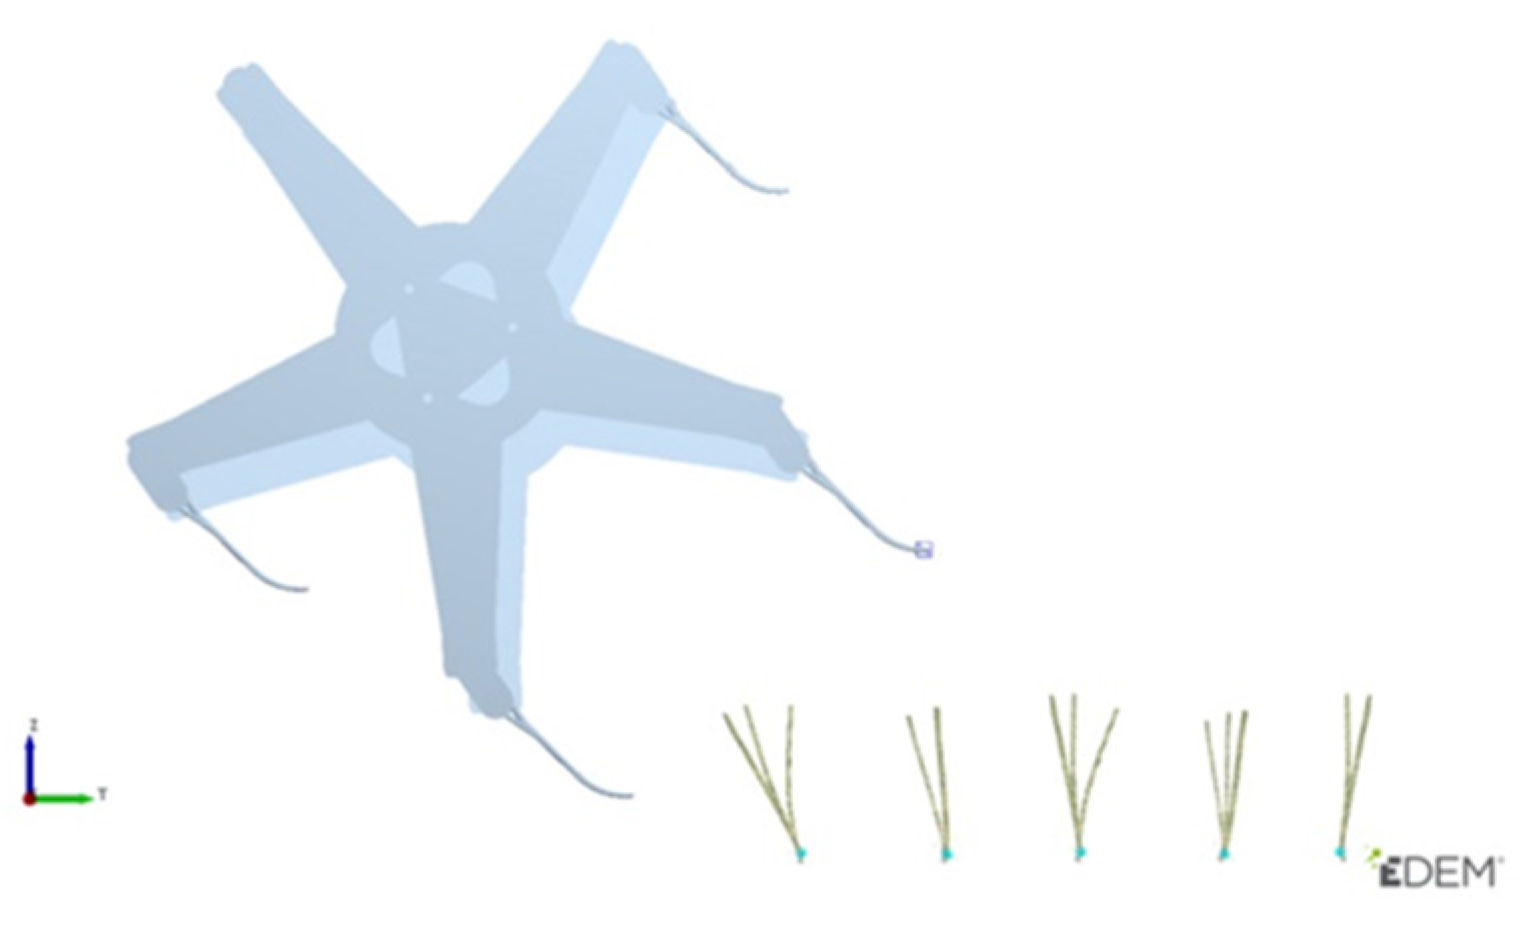
Figure 9.
Simulation model of uprighting device and stubble.
2.3.2. Simulation Analysis Metrics
To investigate the impact of the angle range of the crushed and straightened stubbles on yield, a manual straightening experiment was conducted on the machine-harvested crushed stubs. The experimental group (manually straightened) and the control group (not crushed, or crushed but not straightened) were set up, with 10 m taken from each group and repeated three times. Yield measurements were taken during the second season’s harvest, and the experimental results are shown in Table 2.
Table 2.
Yield of second-season ratoon rice under different treatment methods.
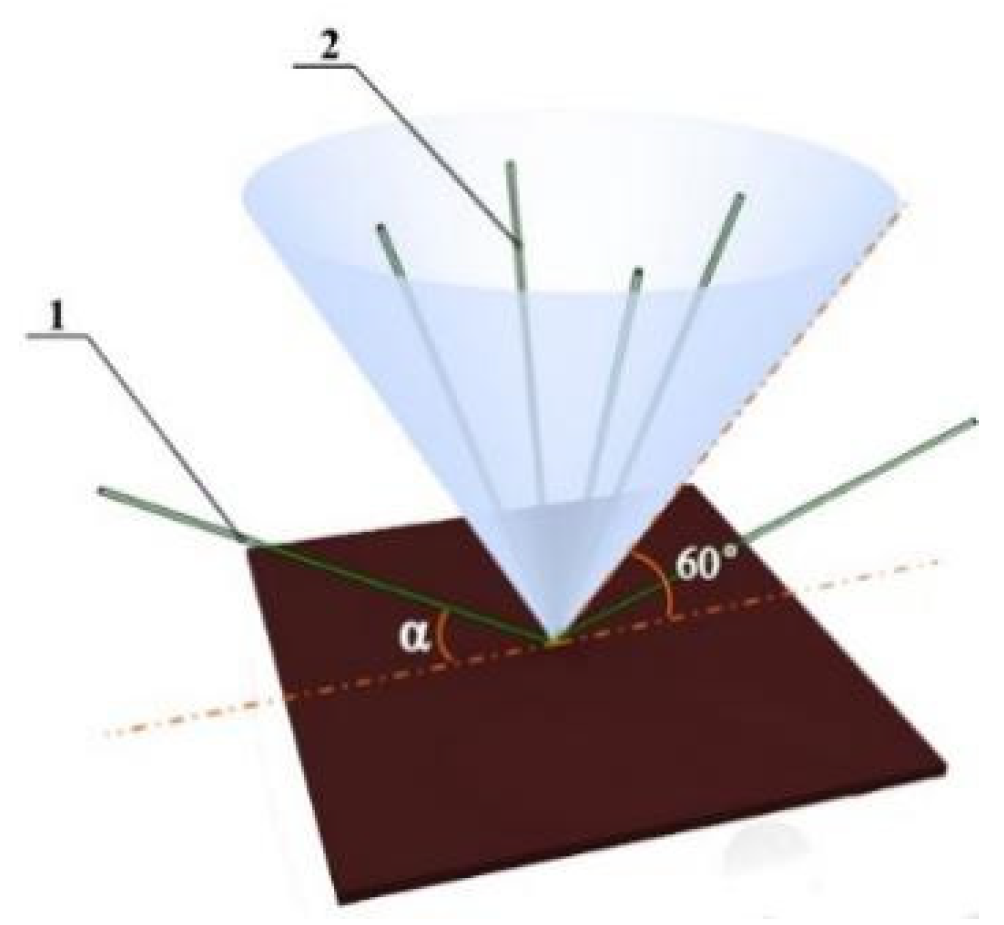
The results indicate that when the stubs in the crushed area are uprighted to an angle of 60° or more, the yield reaches approximately 80% of the yield in the non-crushed area. Therefore, a stub is considered successfully uprighted if the angle between its stem centerline and the ground exceeds 60°, as shown in Figure 10. The formula for calculating the uprighting rate (without considering the situation where the stubs crushed by the harvester are not capable of germinating in the second season) is as follows (7):
where η represents the straightening rate (%), Nw represents the number of unstraightened plants, and Z represents the total number of plants.
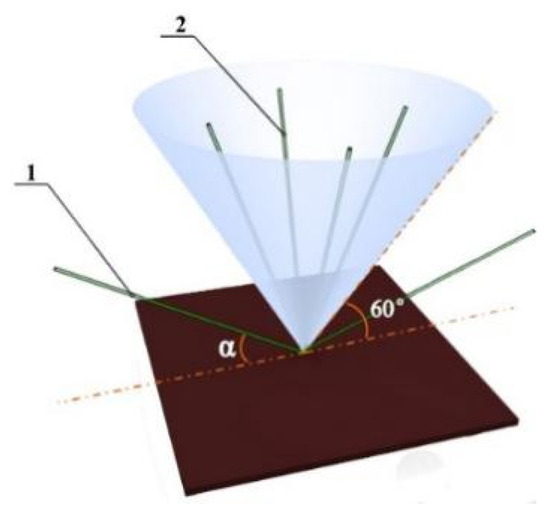
Figure 10.
Schematic diagram for judging the effect of uprighting stubbles in the rolled area: 1. Non-uprighted stubbles in the rolled area; 2. Successfully uprighted stubbles in the rolled area.
Meanwhile, the ratio of the number of damaged stubbles (K) to the total number of plants (Z) is recorded as the stubble damage rate (B), expressed in percentage, as follows:
2.3.3. Simulation Process and Analysis
To verify the uprighting effect of the uprighting device and determine the range of operating parameters, a single-factor simulation test was conducted using the stubble uprighting rate and breakage rate as indicators. The test plan is shown in Table 3.
Table 3.
Simulation analysis test parameters.
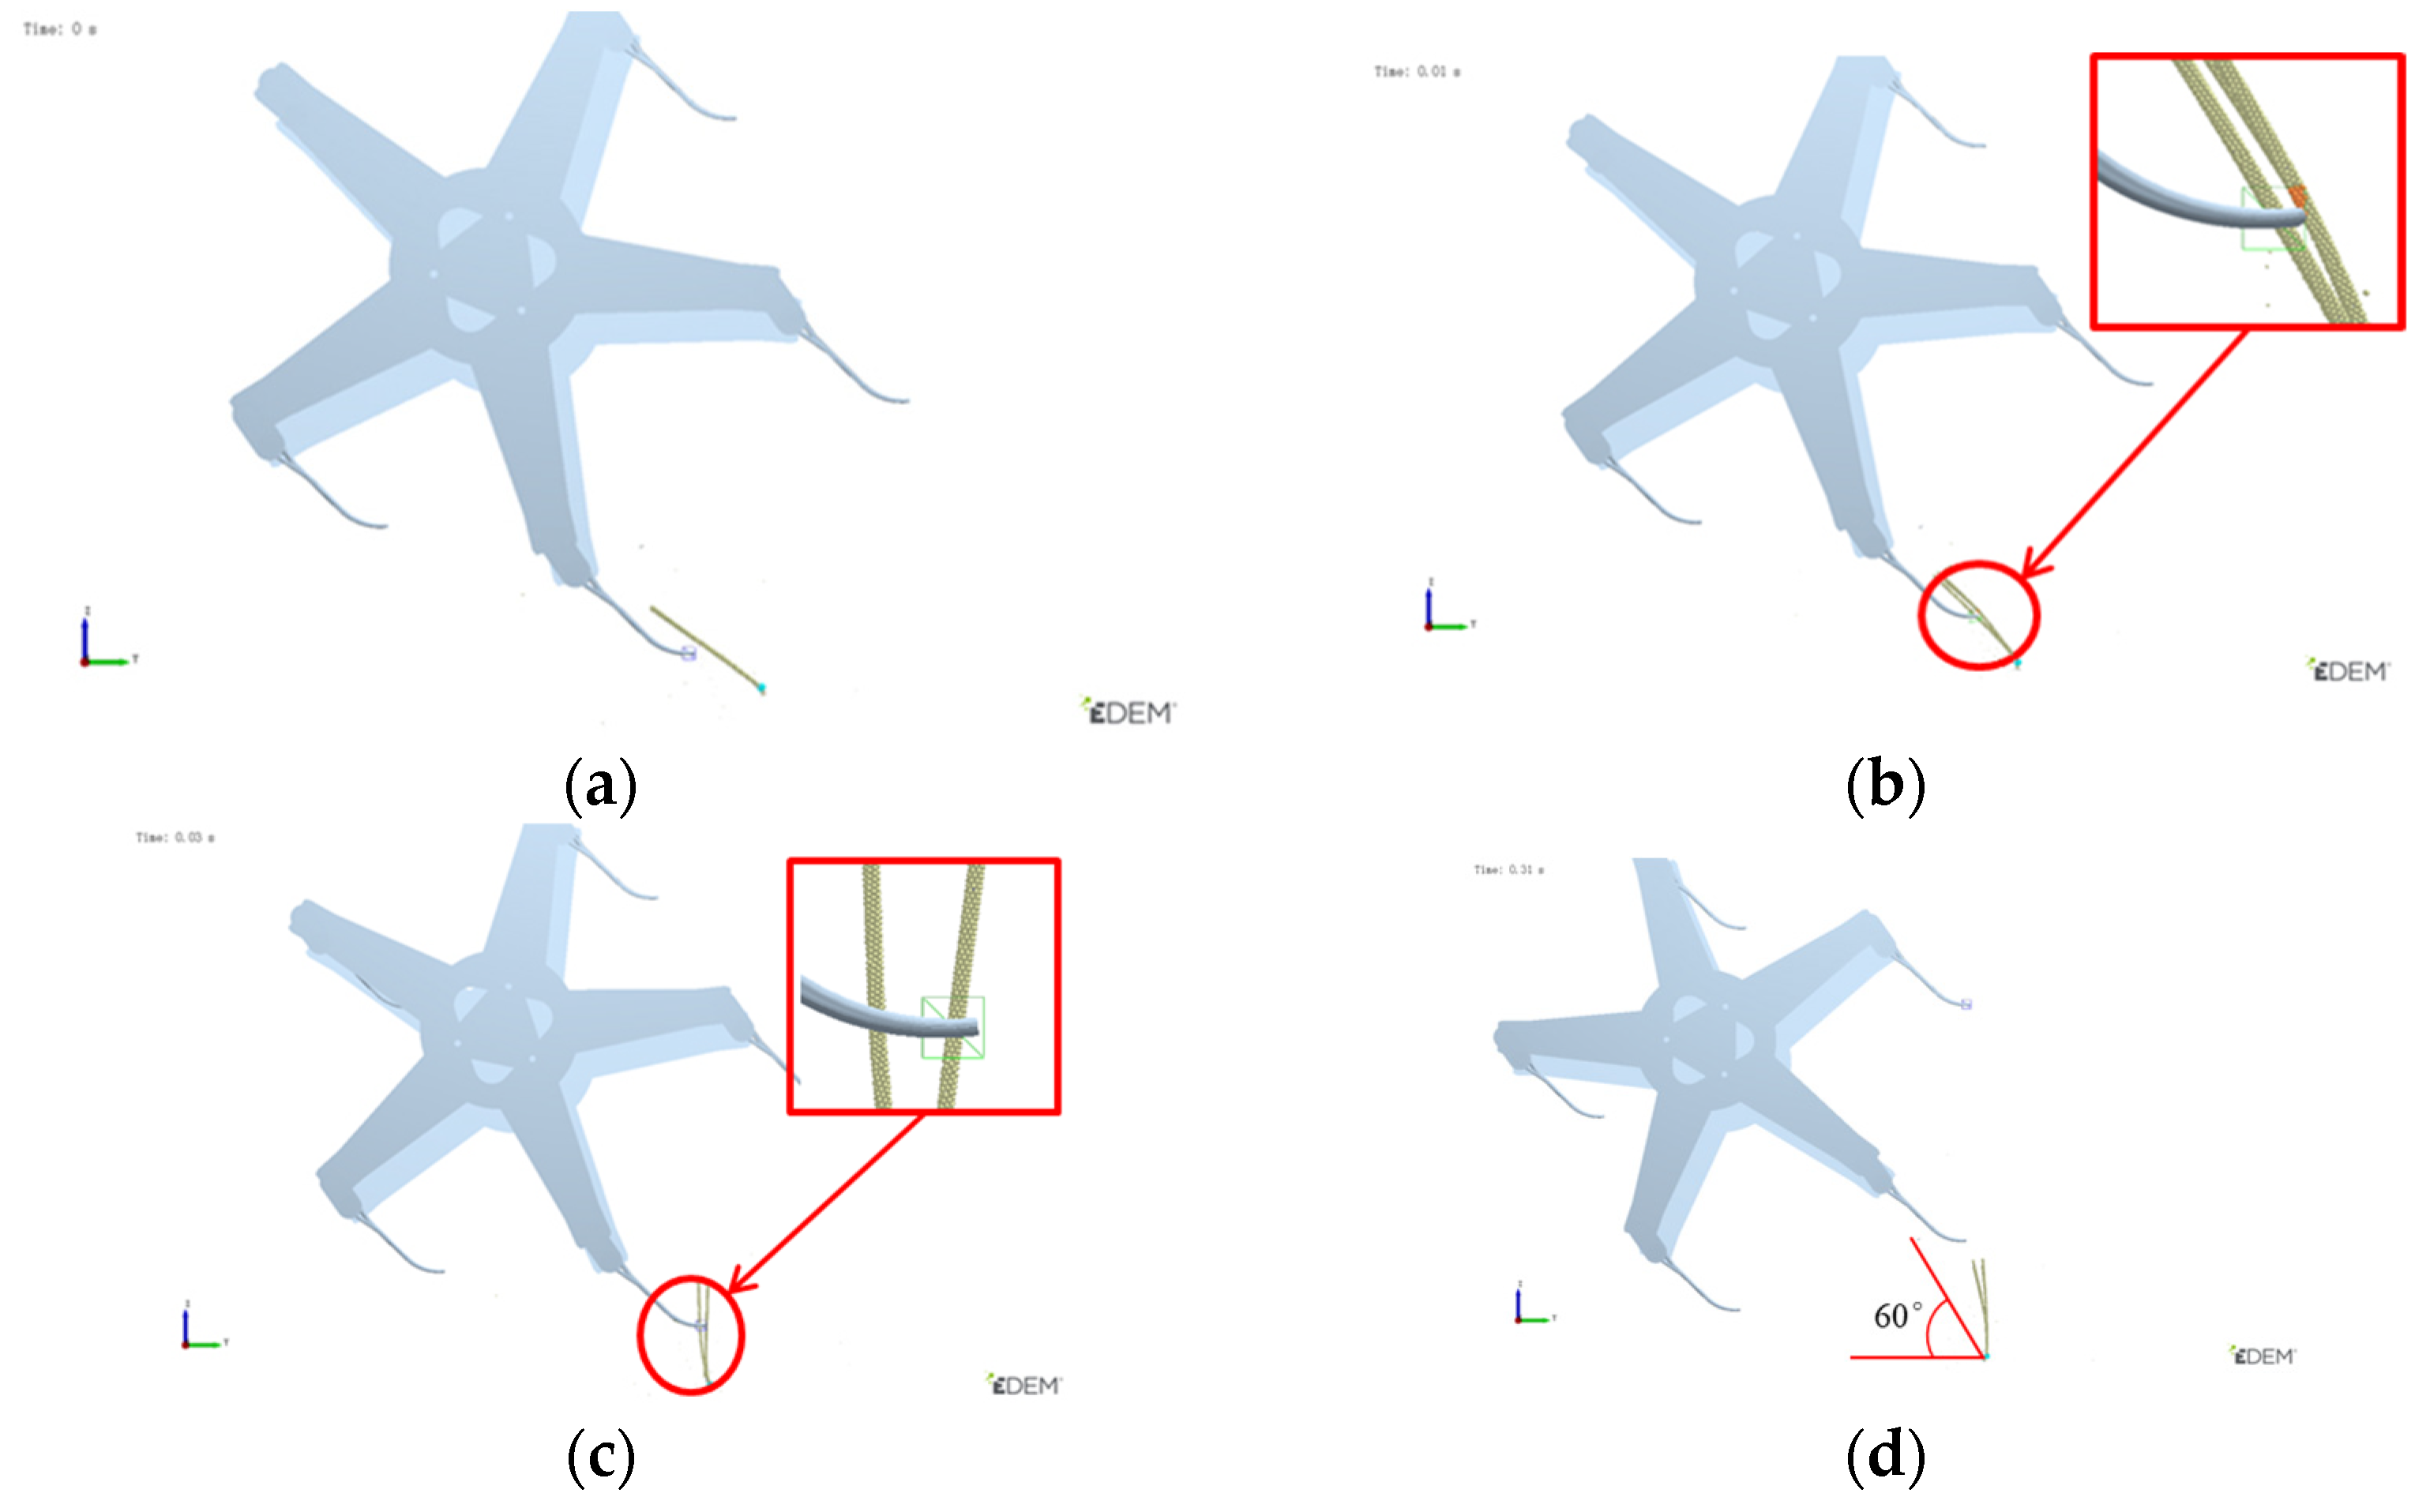
The simulation process of the single-stubble uprighting operation is illustrated in Figure 11. Additionally, the EDEM post-processing function was employed to establish monitors at the front ends of each uprighting tooth, monitoring the magnitude of the force applied by the teeth to the rice stubbles during the uprighting operation under different operating parameters.
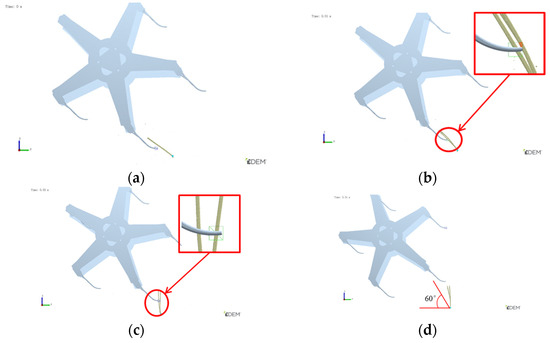
Figure 11.
Schematic diagram of the simulation process; (a) When t = 0, the contact has not yet begun; (b) When t = 0.01, contact is initiated; (c) When t = 0.03 s, contact is lost; (d) Observation during standstill after the uprighting operation (at t = 0.31 s).
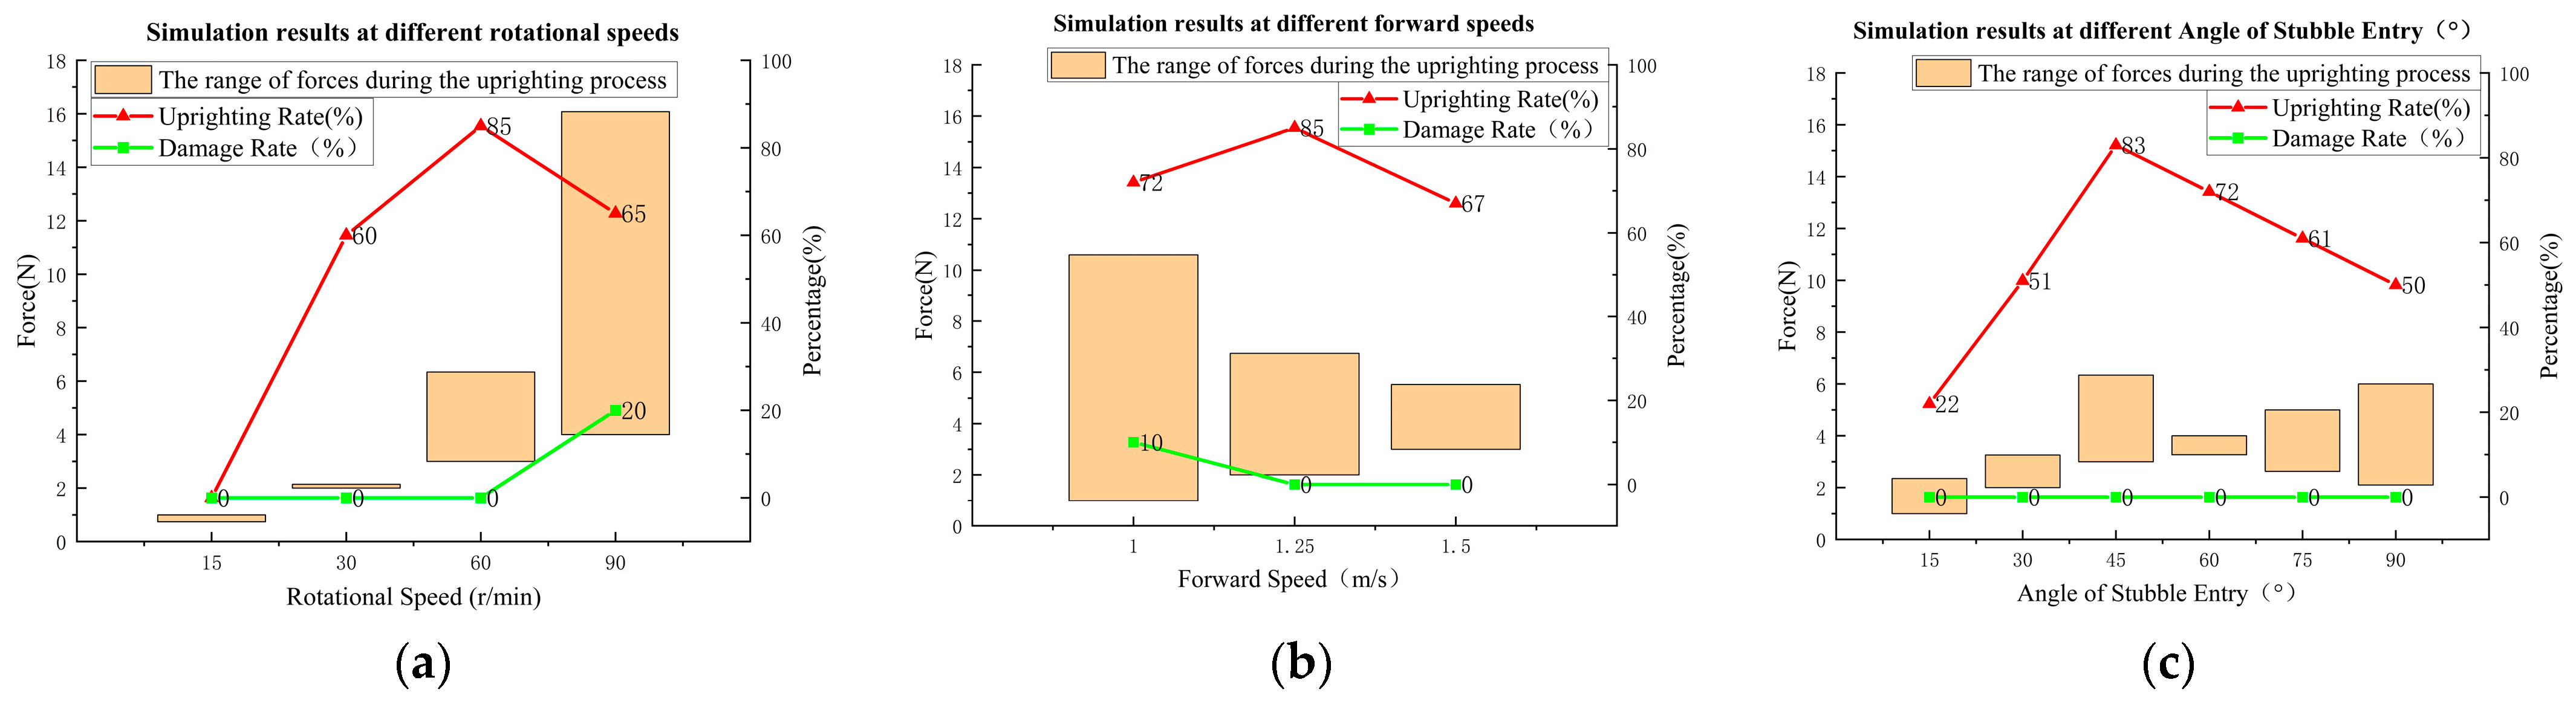
Based on Table 3, a single-factor simulation analysis was performed on the device rotation speed, forward speed, and stub entry angle, respectively. The simulation results obtained after repeating three times and calculating the mean values are shown in Figure 12. As can be seen from Figure 12a, as the device rotation speed increases, the force during the straightening process shows an increasing trend, while the straightening rate first increases and then decreases. After the device rotation speed exceeds 60 r/min, the damage rate to the stubs increases. Figure 12b shows that as the forward speed increases, the force during the straightening process decreases, and the straightening rate also first increases and then decreases. When the force is relatively high, stub damage occurs. Figure 12c indicates that as the stub entry angle increases, both the force and the straightening rate during the straightening process first increase and then decrease. The damage rate remains at 0%. When the stub entry angle is below 30°, it cannot meet the operational requirements. However, when the stub entry angle is 45°, the straightening rate is relatively high.
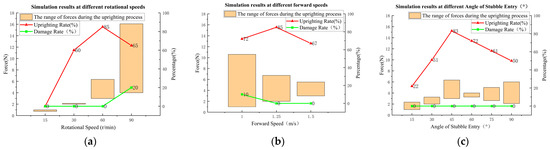
Figure 12.
Simulation analysis results under different conditions; (a) Simulation results at different device rotation speeds; (b) Simulation results at different forward speeds; (c) Simulation results at different stub entry angles.
A comprehensive analysis of Figure 12 reveals that the ratio λ between the rotational speed of the device and the forward speed of the harvester significantly impacts the uprighting rate of the stubbles. When λ is relatively high, there are more frequent contacts between the uprighting device and the stubbles. Simultaneously, influenced by the rotational speed, the horizontal backward component force of the tooth exceeds the force required to upright the rice stubbles, leading to over-uprighting and damage to the stubbles. Conversely, when the rotational speed is too low, the opposite situation occurs, and the rice stubbles cannot be effectively uprighted, which aligns with the design expectations.
Through comparative experiments, it was found that when the rotational speed of the device is around 60 r/min, the forward speed is approximately 1.25 m/s, and the angle of the uprighting tooth is about 45°, the force applied during the uprighting process ranges between 6 and 10 N. Under these conditions, there is a good uprighting effect with minimal stubble damage. The feasibility of this approach has been verified through simulation analysis, providing a basis for selecting the parameter range in subsequent field experiments.
2.4. Field Experiment
2.4.1. Test Prototype and Materials
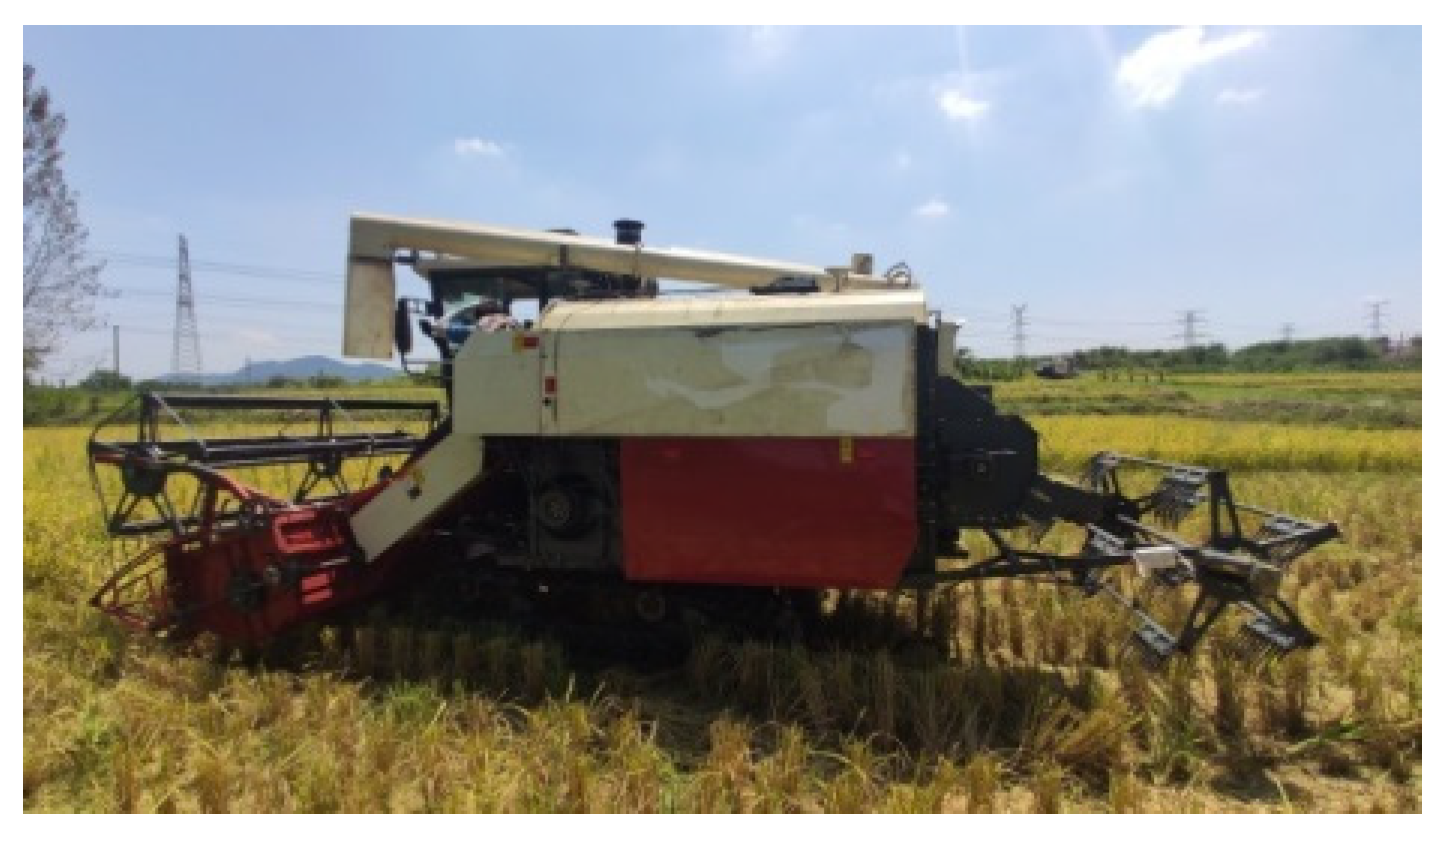
The ratoon rice variety used in this experiment is “Yueguang Rice”. The trial site is located in Jurong City, Jiangsu Province, where the plots are level and there are no significant differences in rice growth. The row spacing and plant spacing of rice in each trial plot are both approximately 20 cm. The experimental equipment includes a 4LZ-6.0 harvester (Figure 13), stubble uprighting device, tape measure, javelin, vernier caliper, electronic scale, angle ruler, tachometer, and installation tools, among others.
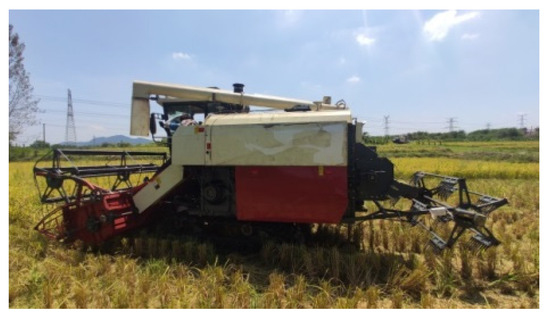
Figure 13.
Experimental prototype.
2.4.2. Test Methods
The objective of this study is to determine the effects of different parameter combinations of the stubble uprighting device on the stubble uprighting rate and the yield of second-season rice in the compacted area. Based on simulation analysis, a three-factor, three-level response surface analysis experiment was designed according to the Box–Behnken experimental principle. Three factors that significantly impact the stubble uprighting rate (Y1) and the yield of second-season rice in the compacted area (Y2) were selected: rotation speed (A), forward speed (B), and stubble entry angle (C). Each factor was assigned three levels labeled as −1, 0, and 1. The response surface software Design Expert 10.0.3 was used for factor-level design, aiming to obtain the optimal conditions for stubble uprighting rate and the yield of second-season rice in the compacted area. The factor level table is shown in Table 4.
Table 4.
Experimental design table for response surface analysis with three factors and three levels.
In the formula, yc represents the yield per square meter in the measured area, kg/m2; Y represents the yield per hectare in the measured area, kg/hm2.
3. Results
3.1. Field Test Result
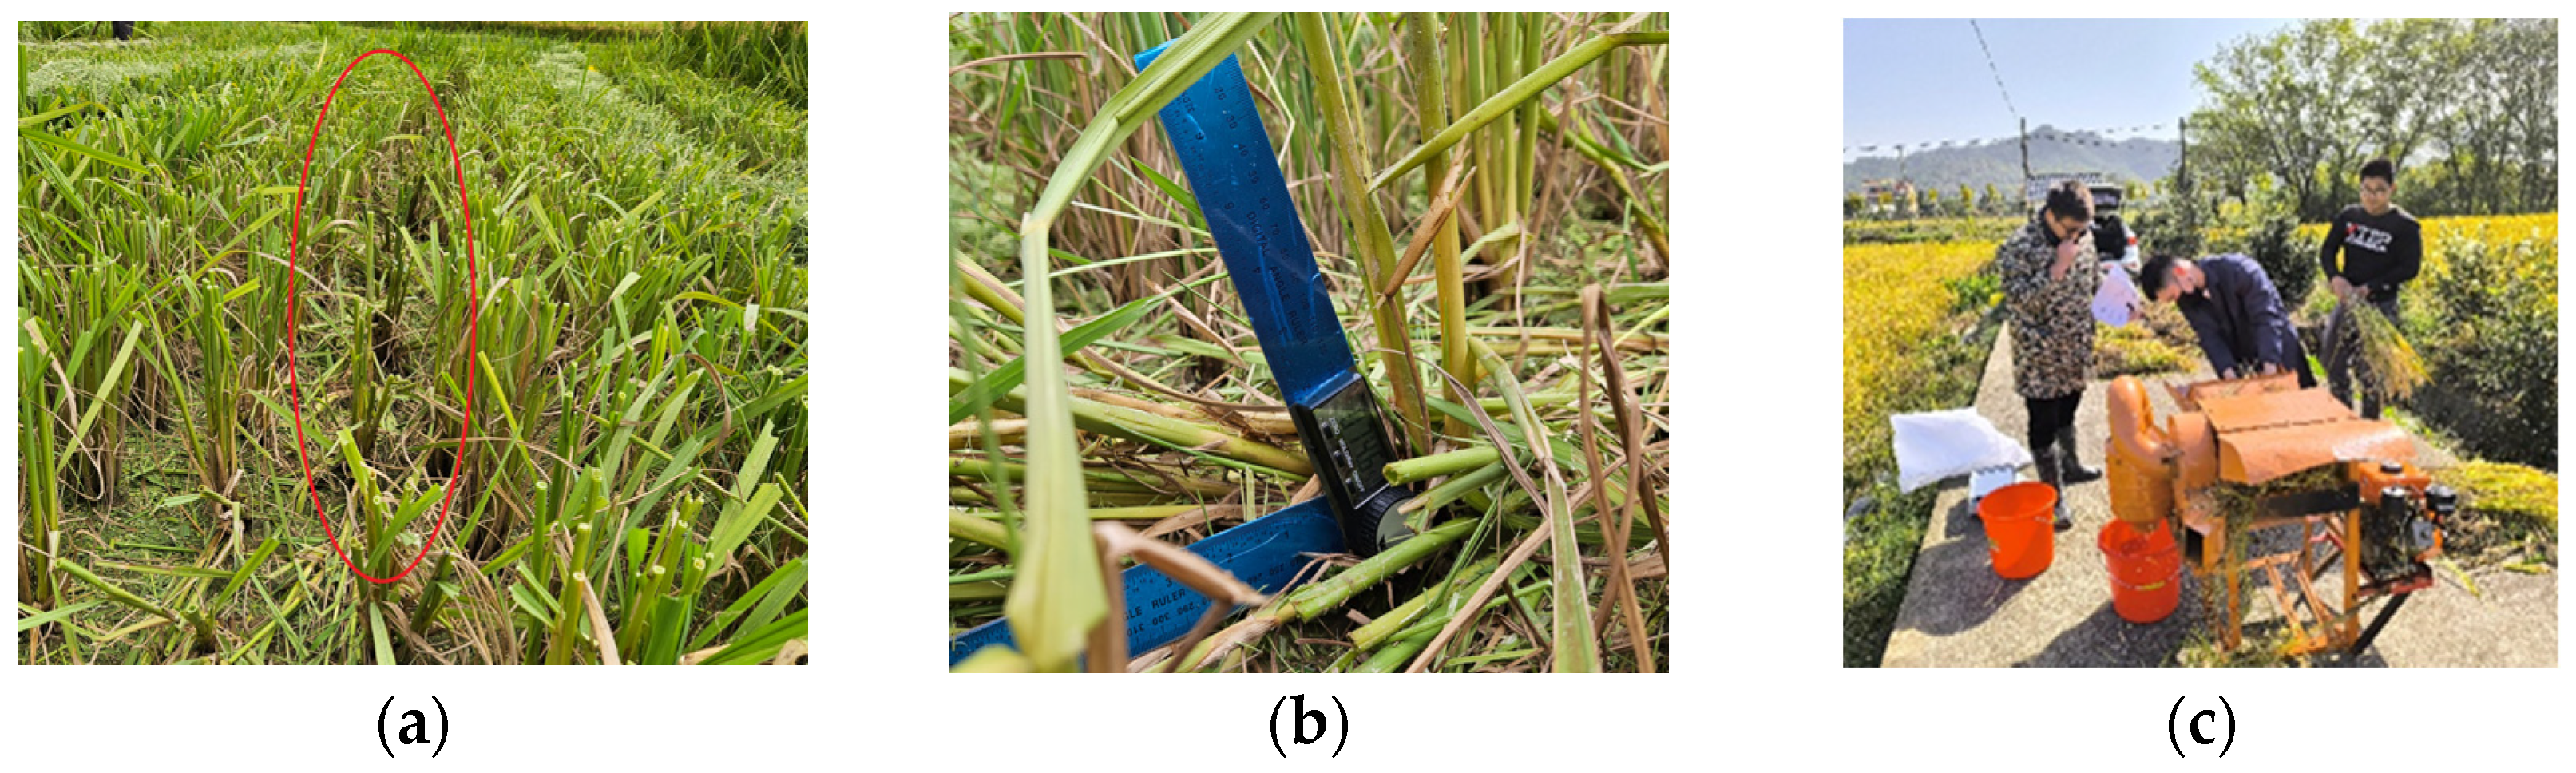
After the experiment, the uprighting effect of the rolled and remaining stubs is shown in Figure 14a, the angle of the remaining stubs measured manually is shown in Figure 14b, and the yield of the second season is also tested as shown in Figure 14c.

Figure 14.
Acquisition of field data; (a) The condition of the rolled and remaining stubs after being uprighted, note: The stubs within the red circle are the ones that have been uprighted. (b) Manual measurement of the angle of the remaining stubs; (c) Measurement of the second season’s yield.
Using Design Expert 10.0.3 (Stat-Ease, Minneapolis, MN, USA) data processing software, the data for various factors were entered into the Box–Behnken data analysis tool. This resulted in a response surface experimental design table. Experiments were conducted according to the factor levels specified in the design table, and the experimental data obtained are presented in Table 5.
Table 5.
Experimental design and results for optimizing the stubble straightening rate and yield of second-season rice in the compacted area using response surface methodology.
3.2. Model Establishment and Analysis
Based on the experimental results in Table 6, the Design Expert 10.0.3 data analysis software was used to perform multiple regression fitting on the test data. With rotational speed (A), forward speed (B), and entry angle (C) as independent variables, and stubble straightening rate (Y1) and yield of second-season rice in the crushed area (Y2) as response values, multiple regression fitting was performed. The regression model coefficients and significance test results are shown in Table 6, yielding the quadratic polynomial regression models:
Y1 = 88.27 + 1.75 ∗ A + 0.48 ∗ B − 0.52 ∗ C + 0.45 ∗ AB + 0.35 ∗ AC + 0.14 ∗ BC − 0.33 ∗ A2 − 0.37 ∗ B2 − 0.25 ∗ C2
Y2 = 2175.2 + 86.75 ∗ A + 34.5 ∗ B − 30.75 ∗ C − 34.25 ∗ AB − 24.25 ∗ AC − 9.25 ∗ BC − 53.48 ∗ A2 − 59.98 ∗ B2 − 55.97 ∗ C2
Table 6.
Regression analysis results of the model and regression coefficients.
Based on the analysis of Table 6, it can be seen that the p-values of the response surface models for the stubble straightening rate and yield of second-season rice in the compacted area are less than 0.0001, while their lack-of-fit terms are greater than 0.05. This indicates that the models have a good fit and can be used to predict the corresponding regression values of the regression equations. Meanwhile, the regression coefficients of the model are all close to 1, indicating a high reliability of the equation.
3.3. Analysis of the Impact of Interactive Factors on the Stubble Straightening Rate
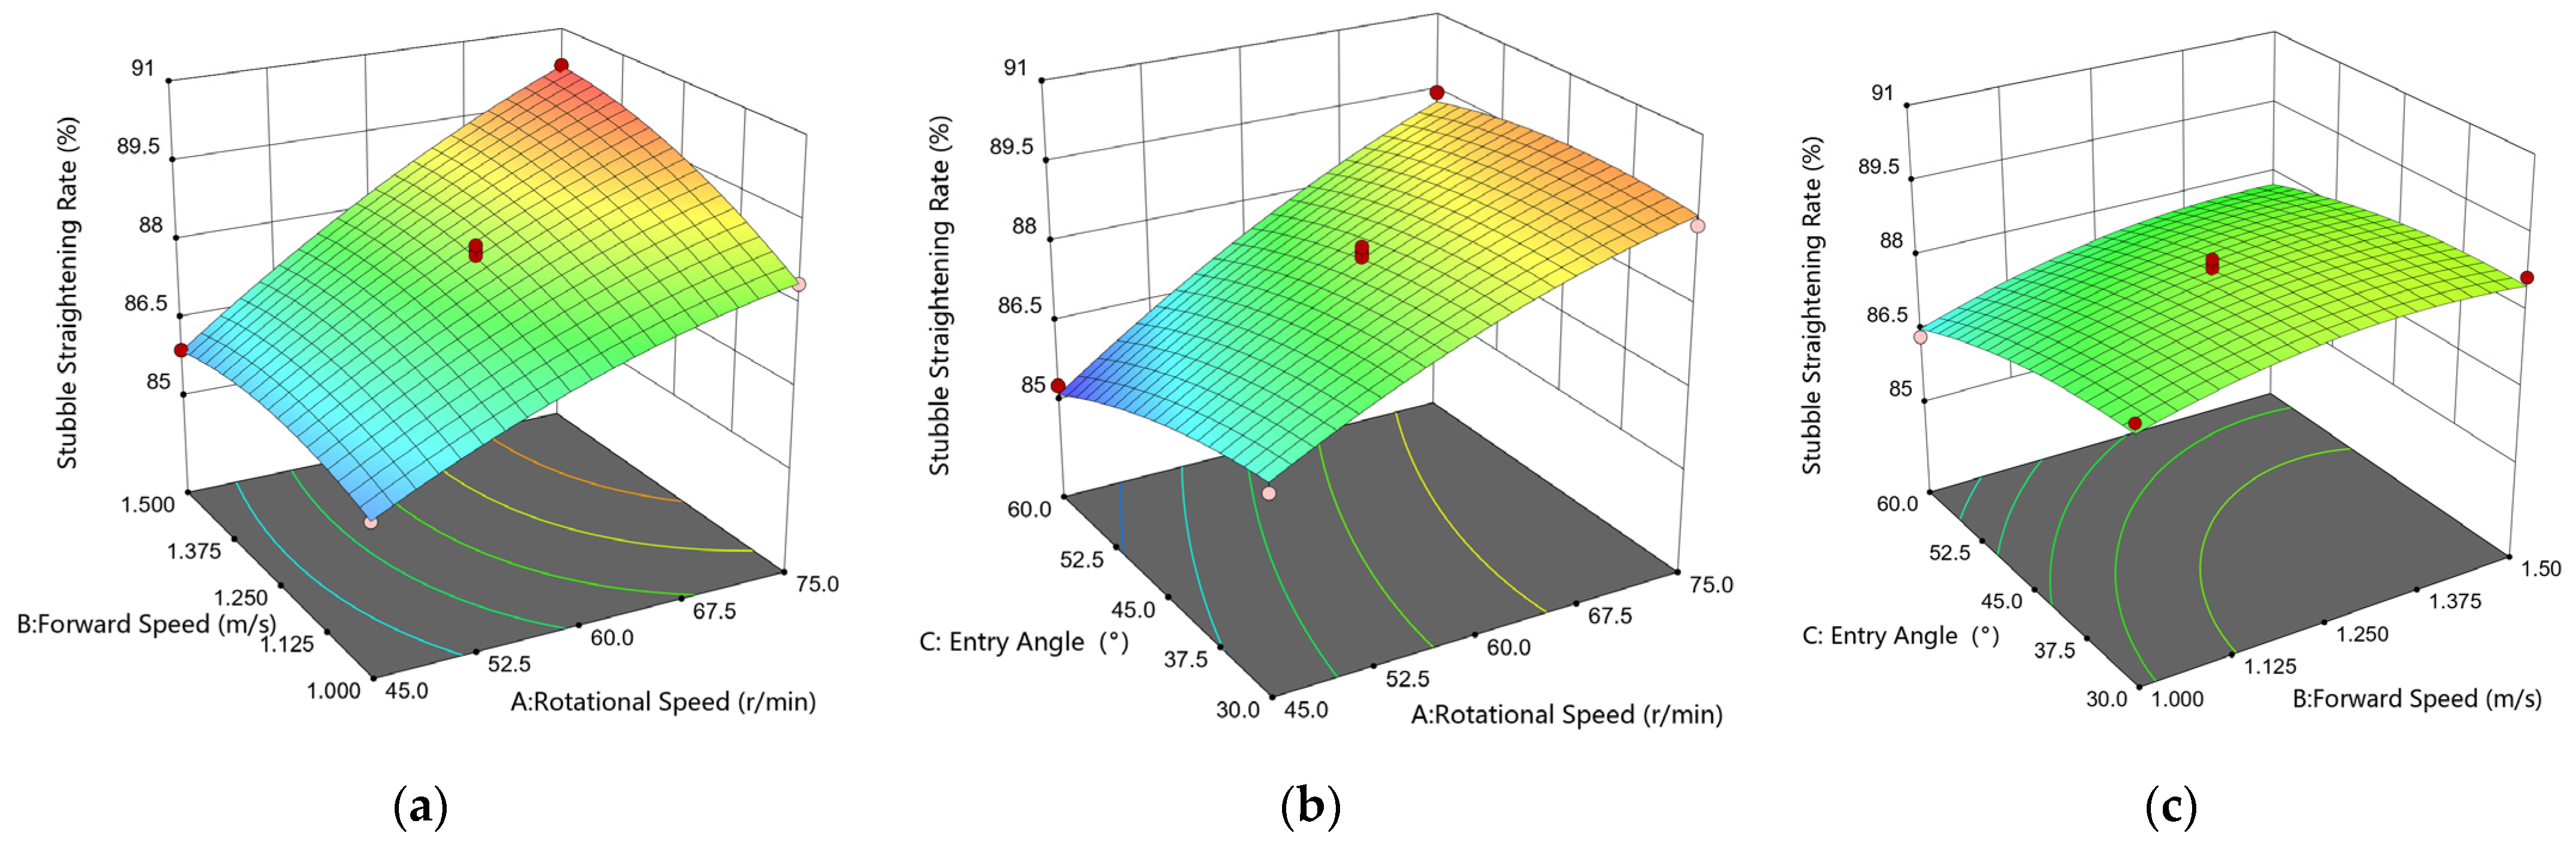
To further analyze the influence of interactive factors on the stubble straightening rate, response surface plots were generated using Design-Expert 10.0.3, as shown in Figure 15a. the stubble straightening rate increases with rotational speed. However, the rate of change with forward speed varies depending on the rotational speed, indicating a significant interaction between these two factors. This suggests that increasing both factors within a certain range can enhance the stubble straightening rate. Figure 15b shows that the stubble straightening rate is positively correlated with rotational speed but negatively correlated with the stub entry angle. The rate of change in the stubble straightening rate with increasing stub entry angle differs depending on the rotational speed, indicating a significant interaction between these factors. Lastly, Figure 15c demonstrates that as the stub entry angle increases, the stubble straightening rate decreases linearly. The slope of this change increases slightly with increasing forward speed, although this interaction is less significant compared to the other two interactions mentioned above.
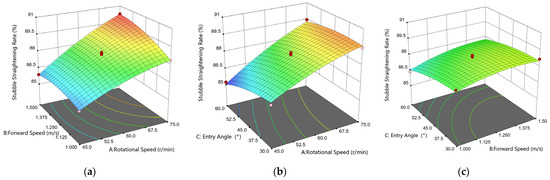
Figure 15.
Analysis of the impact of interactive factors on stub uprighting rate; (a) Response surface plot of rotation speed and forward speed on the stubble uprighting rate; (b) Response surface plot of rotation speed and stubble entry angle on the stubble uprighting rate; (c) Response surface plot of forward speed and stubble entry angle on the stubble uprighting rate.
This experiment also validates the simulation analysis, which shows that the ratio between the circumferential speed of the device and the forward speed of the harvester is closely related to the stub straightening rate. Changes in the straightening speed ratio determine the number of contacts between the device and the stubs, and there is a positive correlation between them. However, when the straightening speed ratio is too high, the stub straightening rate may decrease due to over-straightening caused by an increased number of contacts between the device and the stubs.
3.4. Analysis of the Influence Law of Interaction Factors on the Yield of Second-Season Rice in the Crushed Area
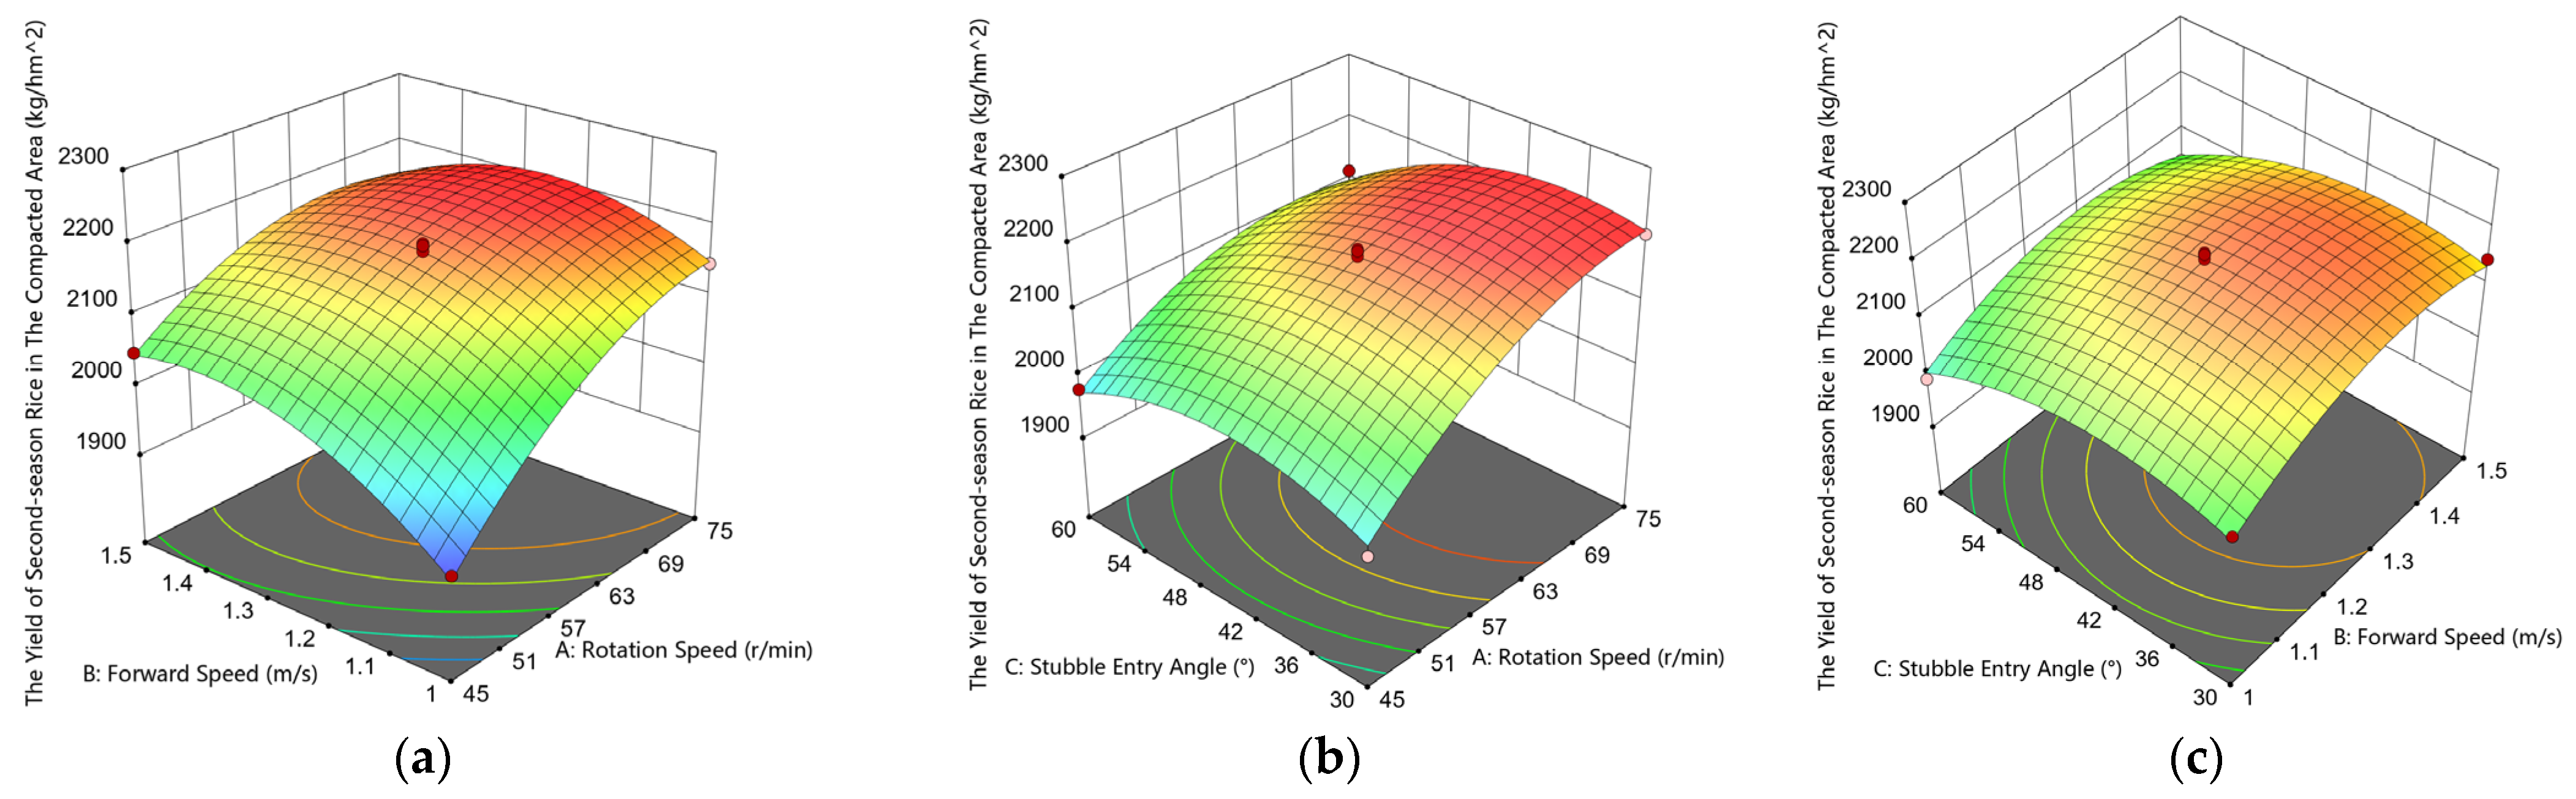
As shown in Figure 16a, when the rotational speed is low, the yield of second-season rice in the crushed area is positively correlated with the forward speed. However, when the rotational speed is high, the yield initially increases and then decreases with increasing forward speed. Similarly, when the forward speed is low, the yield is positively correlated with the rotational speed, but when the forward speed is high, the yield initially increases and then slowly decreases with increasing rotational speed. This indicates a significant interaction between rotational speed and forward speed. That is, within a certain range, simultaneously increasing both factors can reduce the yield of second-season rice in the crushed area. Considering only the interaction between these two factors, when the rotational speed is between 60 and 75 r/min and the forward speed is around 1.125–1.375 m/s, the yield of second-season rice in the crushed area is relatively high.
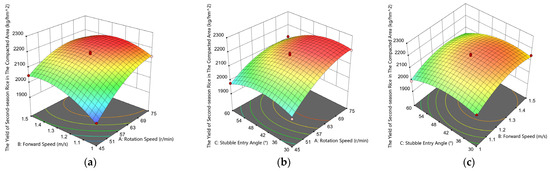
Figure 16.
Analysis of the influence law of interaction factors on the yield of second-season rice in the crushed area; (a) Response surface plot of rotation speed and forward speed on the yield of second-season rice in the compacted area; (b) Response surface plot of rotation speed and stubble entry angle on the yield of second-season rice in the compacted area; (c) Response surface plot of forward speed and stubble entry angle on the yield of second-season rice in the compacted area.
As shown in Figure 16b, when the rotational speed is low, the yield of second-season rice in the crushed area initially increases and then decreases with increasing entry angle. However, when the rotational speed is high, the yield initially remains flat and then decreases with increasing entry angle. Additionally, when the entry angle is small, the rate of change in yield increases with increasing rotational speed, while when the entry angle is large, the rate of change in yield initially increases and then flattens with increasing rotational speed. This suggests a significant interaction between rotational speed and entry angle. Considering the interaction between these two factors, when the rotational speed is between 67.5 and 75.0 r/min and the entry angle is around 30–45°, the yield of second-season rice in the crushed area is relatively high.
As shown in Figure 16c, with increasing entry angle, the yield of second-season rice in the crushed area initially increases and then slowly decreases. Similarly, the yield initially increases and then decreases with increasing forward speed. Considering only the interaction between these two factors, when the forward speed is between 1.25 and 1.50 m/s and the entry angle is around 30–45°, the yield of second-season rice in the crushed area is relatively high.
Comparing two response surface experiments, it was found that there is not a positive correlation between the stub straightening rate and the yield of second-season rice in the rolled area. As shown in Figure 15a and Figure 16a, at lower rotational speeds, as the speed of the harvester increases, the straightening speed ratio decreases, and the straightening rate decreases. However, there is a trend of increasing yield in the second season. Through later field observations, it was found that this is due to the fact that when the straightening speed ratio is relatively low, a portion of the stubs in a clump of rice are straightened, while some of the stubs that are close to the ground also germinate, promoting an increase in yield. However, the seed setting rate and maturity are relatively low.
3.5. Verification of Experimental Results
In order to obtain the optimal parameter combination, the theory and method of multi-objective nonlinear optimization are utilized. Taking the uprighting rate of remaining stubs and the yield of second-season rice in the rolled area as indicators, combined with the constraint conditions of experimental factors, the obtained regression equation is optimized and analyzed. The resulting objective function is as follows:
According to Formula (12), the optimal combination parameters of the stub uprighting device are a rotational speed of 75 r/min, forward speed of 1.398 m/s, and an entry angle of 39.21°. The predicted theoretical optimal uprighting rate of remaining stubs is 90.1%, and the maximum yield of second-season rice in the rolled area is 2202.64 kg/hm2.
According to the actual experimental conditions, the conditions were adjusted to a rotational speed of 75 r/min, a forward speed of 1.4 m/s, and an entry angle of 39°. Under these conditions, three parallel experiments were conducted, and the results of the experimental and predicted values are shown in Table 7. The error between the predicted and experimental values is within 5%. The results indicate that there is a good correlation between the predicted and experimental values, and the optimal operating parameters obtained using the response surface method are reasonable.
Table 7.
Comparison between predicted optimal value and experimentally verified value.
4. Discussion
The planting mode of ratoon rice is an effective means to ensure stable grain production and promote grain yield increase. However, the high rolling rate of the first-season rice harvested by machines has always been a difficult problem in ratoon rice planting, leading to a decrease in the yield of the second-season rice. Through experiments, Zhang and others have shown that manually lifting the rolled rice stubs can promote the germination of axillary buds and increase the yield of the second season. They designed a chain-row tooth-claw type correcting device for ratoon rice and conducted bench tests. However, the device has a complex structure and no relevant field experiments have been conducted.
To promote the germination of the second season of the rolled and reserved stubs and ensure the yield of the second season of ratoon rice, this paper designs an eccentric parallel four-bar linkage type correcting device for the rolled and reserved stubs of ratoon rice. Simulation analysis and field experiments are conducted to obtain the optimal operating parameters of the device. Parallel experiments are also conducted, which show that the designed correcting device can effectively increase the yield of the second season in the rolled areas of ratoon rice.
However, field experiments have also revealed that the device needs to be manually lifted during turns in the field, lacking adaptive adjustment capabilities. In the future, issues such as height monitoring, speed measurement, and displacement sensors will be added to the device to enable it to operate automatically. At the same time, to further improve the correction rate and promote the increase in the yield of the second season in the rolled areas, the relationship between the ground clearance of the device, the length of the correcting teeth, and the height of the reserved stubs will be further explored.
5. Conclusions
This study addresses the challenge of reduced yield in the second season of ratoon rice due to stubble damage during the mechanized harvesting of the first season. Based on the observation that straightening the crushed stubs can promote germination and increase the yield of the second-season rice, relevant research has been conducted.
By observing and analyzing the biological morphology of the crushed stubs, an eccentric parallelogram-type ratoon rice stub straightening device was designed. The key components of the straightening device were designed, and a preliminary analysis was conducted. Through the construction of a discrete element model of ratoon rice stubs using multi-scale spherical particle aggregation, combined with the Recurdyn multibody dynamics method, a single-factor simulation analysis was performed. This preliminary work determined the parameter range for field experiments and verified the feasibility of the proposed solution.
Using the straightening rate of crushed stubs and the yield of the second-season rice as evaluation metrics, field response surface experiments were conducted to determine the optimal experimental conditions. After refinement, the forward speed was set at 1.4 m/s, the device rotation speed at 75 r/min, and the stub entry angle at 39°. Three parallel experiments were conducted under these conditions, resulting in a straightening rate of 90.35% in the mechanized harvesting crush zone and a second-season yield of 2202.64 ± 10.25 kg/hm2. The difference between these results and the predicted outcomes was within 5%, indicating high reliability of the parameter optimization results. Additionally, yield measurements of crushed but unstraightened stubs and uncrushed stubs revealed that the yield of straightened crushed stubs was approximately 70% of the uncrushed stub yield, representing an increase of about 80% compared to the yield of crushed and unstraightened stubs.
These results indicate that the designed ratoon rice stub straightening device can meet the requirements of field operations and effectively improve the yield of the second season of ratoon rice, which has a positive significance for promoting the cultivation of ratoon rice.
Author Contributions
Conceptualization, S.X., L.X. and Y.Y.; data curation, S.X. and L.X.; formal analysis, S.X., L.X. and G.C.; funding acquisition, L.X.; investigation, J.L., J.H., Q.W. and Q.L.; methodology, S.X.; project administration, L.X.; resources, L.Z.; software, Y.Y.; supervision, J.H.; writing—original draft, S.X.; writing—review and editing, L.X., G.C. and Y.Y. All authors have read and agreed to the published version of the manuscript.
Funding
This research was supported by the following institutions and projects: Jiangsu Province and Education Ministry Co-Sponsored Synergistic Innovation Center of Modern Agricultural Equipment (XTCX1009), the 2023 Hunan Province Smart Agricultural Machinery and Equipment Innovation and Research and Development Project ([2023]60); Jiangsu Province Agricultural Science and Technology Independent Innovation Funds Class II Project (CX (21) 2042); Jiangsu Province Graduate Research and Practice Innovation Program Project (KYCX22-3678).
Institutional Review Board Statement
Not applicable.
Data Availability Statement
Data are contained within the article.
Acknowledgments
Here: I would like to express my gratitude to those who have assisted me in the experiment, including the farmer from Jurong Farm for providing support with the farmland and the experimental process, as well as my peers and junior colleagues for their assistance during the sweltering experiments!
Conflicts of Interest
Author Linjun Zhu was employed by the company Jiangsu World Agricultural Machinery. The remaining authors declare that the research was conducted in the absence of any commercial or financial relationships that could be construed as a potential conflict of interest.
References
- Lin, W.; Chen, H.; Zhang, Z.; Xu, Q.; Tu, N.; Fang, C.; Ren, W. Research and prospect on physio-ecological properties of ratoon rice yield formation and its key cultivation technology. Chin. J. Eco-Agric. 2015, 23, 392–401. [Google Scholar]
- Peng, S.; Zheng, C.; Yu, X. Progress and challenges of rice ratooning technology in China. Crop Environ. 2023, 2, 5–11. [Google Scholar] [CrossRef]
- Huang, J.; Pan, Y.; Chen, H.; Zhang, Z.; Fang, C.; Shao, C.; Amjad, H.; Lin, W.; Lin, W. Physiochemical mechanisms involved in the improvement of grain-filling, rice quality me-diated by related enzyme activities in the ratoon cultivation system. Field Crops Res. 2020, 258, 107962. [Google Scholar] [CrossRef]
- Xu, Y.; Liang, L.; Wang, B.; Xiang, J.; Gao, M.; Fu, Z.; Long, P.; Luo, H.; Huang, C. Conversion from double-season rice to ratoon rice paddy fields reduces carbon footprint and enhances net ecosystem economic benefit. Sci. Total Environ. 2021, 813, 152550. [Google Scholar] [CrossRef]
- Tang, Q.Y.; Qing, X.G. Technological advancement and production development counter-measures of ratooning rice in Hunan Province. Hybrid Rice 2023, 38, 1–9. [Google Scholar]
- Fei, W.; Huang, J.; Shaobing, P. Research and development of mechanized rice ratooning technology in China. China Rice 2021, 27, 1–6. [Google Scholar]
- Wang, W.K.; Luo, C.M.; Zhang, G.Z.; Fu, J.W.; Dong, Z.; Ji, C.; Zhao, Z.Z. Design and experiment of automatic navigation system for rice harvester with dual-motor crawler chassis. J. Huazhong Agric. Univ. 2022, 41, 199–207. [Google Scholar]
- Zou, J.N.; Pang, Z.Q.; Zhou, L.I.; Guo, C.L.; Lin, H.M.; Zheng, L.I.; Chen, H.F.; Huang, J.W.; Ting, C.H.E.N.; Xu, H.L.; et al. Effects of Machine-cut Stubble Height on Morphological Development and Grain Yield of Subsequent Ratoon Rice Crop. Fujian J. Agric. Sci. 2016, 31, 791–796. [Google Scholar]
- Qian, T.; Mei, S.; Zhang, J.; Yu, J.; Zhai, Z.; Fang, X.; Chen, J.; Zhang, C.; Wei, T. Yield and yield components of ratoon rice with different stubble height and harvest methods. Hubei Agric. Sci. 2015, 54, 14–17. [Google Scholar]
- Xu, F.; Zhang, L.; Zhou, X.; Guo, X.; Zhu, Y.; Liu, M.; Jiang, P. The ratoon rice system with high yield and high efficiency in China: Progress, trend of theory and tech-nology. Field Crops Res. 2021, 272, 108282. [Google Scholar] [CrossRef]
- Yang, D.; Peng, S.; Zheng, C.; Xiong, Z.; Yang, G.; Deng, S.; Wang, F. Stubble height affects the grain yield of ratoon rice under rainfed conditions. Agric. Water Manag. 2022, 272, 107815. [Google Scholar] [CrossRef]
- Fu, J.; Ji, C.; Liu, H.; Wang, W.; Zhang, G.; Gao, Y.; Zhou, Y.; Abdeen, M.A. Research Progress and Prospect of Mechanized Harvesting Technology in the First Season of Ratoon Rice. Agriculture 2022, 12, 620. [Google Scholar] [CrossRef]
- Desheng, Y.; Jianliang, H.; Shaobing, P. Research Progresses of Mechanized Rice Ratooning Technology for Improving Grain Yield and Quality. China Rice 2023, 29, 1–8. [Google Scholar]
- Fu, J.; Zhang, G.; Xie, G.; Wang, Y.; Gao, Y.; Zhou, Y. Development of double-channel feeding harvester for ratoon rice. Trans. Chin. Soc. Agric. Eng. 2020, 36, 11–20. [Google Scholar]
- Liu, W.; Luo, X.; Zeng, S.; Zeng, L.; Wen, Z. The Design and Test of the Chassis of a Triangular Crawler-Type Ratooning Rice Harvester. Agriculture 2022, 12, 890. [Google Scholar] [CrossRef]
- Yang, Y.K.; Liu, J.; Huang, D.P.; Zeng, S.; Lai, Q.X. Design of full-feeding ratoon rice combine harvester. Hubei Agric. Sci. 2019, 58, 129. [Google Scholar]
- Mingsen, H. Research on Wide-Swath Layered Cutting and Adaptive Control Technology of Ratoon Rice. Ph.D. Thesis, Jiangsu University, Zhenjiang, China, 2022. [Google Scholar]
- Lu, K.; Zhang, G.; Peng, S.; Lei, Z.; Fu, J.; Zha, X.; Zhou, Y. Design and performance of tracked harvester for ratoon rice with double-headers and double threshing cylinders. J. Huazhong Agric. Univ. 2017, 36, 108–114. [Google Scholar]
- Li, H.L.; Liu, Z.P.; Liu, M.H.; Chen, X.F.; Yu, J.J.; Zhang, X.Y.; Peng, Y.F. Design and test of the righting device of crushed rice stubble after the mechanical harvesting of ratoon rice. J. Shenyang Agric. Univ. 2021, 52, 314–320. [Google Scholar]
- Zhang, X. Design and Experiment of Regenerative Rice Chain Row Claw Type Righting Device. Master’s Thesis, Jiangxi Agricultural University, Nanchang, China, 2019. [Google Scholar] [CrossRef]
- Chen, X.F.; Liang, X.H.; Liu, M.H.; Yu, J.J.; Li, H.L.; Liu, Z.P. Design and experiment of finger-chain grain lifter for ratoon rice stubble rolled by mechanical har-vesting. INMATEH-Agric. Eng. 2022, 66, 361–372. [Google Scholar] [CrossRef]
- Walunj, A.; Chen, Y.; Tian, Y.; Zeng, Z. Modeling Soil–Plant–Machine Dynamics Using Discrete Element Method: A Review. Agronomy 2023, 13, 1260. [Google Scholar] [CrossRef]
- Chen, G.; Wang, Q.; Li, H.; He, J.; Wang, X.; Zhang, X.; He, D. Experimental research on vertical straw cleaning and soil tillage device based on Soil-Straw composite model. Comput. Electron. Agric. 2024, 216, 108510. [Google Scholar] [CrossRef]
- Zhao, J.; Zhao, H.; Tang, H.; Wang, X.; Yu, Y. Bionic threshing component optimized based on MBD-DEM coupling simulation significantly improves corn kernel harvesting rate. Comput. Electron. Agric. 2023, 212, 108075. [Google Scholar] [CrossRef]
- Sun, K.; Yu, J.; Zhao, J.; Liang, L.; Wang, Y.; Yu, Y. A DEM-based general modeling method and experimental verification for wheat plants in the mature period. Comput. Electron. Agric. 2023, 214, 108283. [Google Scholar] [CrossRef]
- Shen, S.; He, Y.; Tang, Z.; Dai, Y.; Wang, Y.; Ma, J. Development of an Orchard Mowing and Sweeping Device Based on an ADAMS–EDEM Simulation. Agriculture 2023, 13, 2276. [Google Scholar] [CrossRef]
- Wang, J.; Xu, Y.; Wang, C.; Xiang, Y.; Tang, H. Design and simulation of a trenching device for rice straw burial and trenching based on MBD-DEM. Comput. Electron. Agric. 2023, 207, 107722. [Google Scholar] [CrossRef]
- Yi, Y. Research on the Expression Method of Rape Pod Shatter Resistance and Optimization Design of Rape Header’s Reel. Master’s Thesis, Jiangsu University, Zhenjiang, China, 2019. [Google Scholar]
- Yan, D.; Xu, T.; Yu, J.; Wang, Y.; Guan, W.; Tian, Y.; Zhang, N. Test and Simulation Analysis of the Working Process of Soybean Seeding Monomer. Agriculture 2022, 12, 1464. [Google Scholar] [CrossRef]
- Wang, Q.; Wang, Z.; Zhang, Z.; Zhang, K.; Yao, S.; Zhou, W.; Sun, X.; Wang, J. Design and Test of Bionic Elastic Row Cleaner with Improved Straw Cleaning Performance. Agriculture 2024, 14, 186. [Google Scholar] [CrossRef]
- Na, Y. Simulation Research on the Construction of Potato Ridge with Large Ridge and Double Rows Based on DEM-MBD Coupling Technology. Master’s Thesis, Lanzhou University of Technology, Lanzhou, China, 2018. [Google Scholar]
- Zeng, S.; Zeng, L.; Liu, W.J.; Wei, S.L.; Tu, Q.L.; Chen, H.B. Design and experiment of rigid-flexible coupling rod tooth threshing device of harvester for ratooning rice. J. South China Agric. Univ. 2022, 43, 61–69. [Google Scholar]
- Li, Y.; Su, Z.; Liang, Z.; Li, Y. Variable-diameter drum with concentric threshing gap and performance comparison experiment. Appl. Sci. 2020, 10, 5386. [Google Scholar] [CrossRef]
- Xu, L.; Li, Y.; Chai, X.; Wang, G.; Liang, Z.; Li, Y.; Li, B. Numerical simulation of gas–solid two-phase flow to predict the cleaning performance of rice combine harvesters. Biosyst. Eng. 2020, 190, 11–24. [Google Scholar] [CrossRef]


Disclaimer/Publisher’s Note: The statements, opinions and data contained in all publications are solely those of the individual author(s) and contributor(s) and not of MDPI and/or the editor(s). MDPI and/or the editor(s) disclaim responsibility for any injury to people or property resulting from any ideas, methods, instructions or products referred to in the content. |
© 2024 by the authors. Licensee MDPI, Basel, Switzerland. This article is an open access article distributed under the terms and conditions of the Creative Commons Attribution (CC BY) license (https://creativecommons.org/licenses/by/4.0/).