Article

Optimized Design for Vibration Reduction in a Residual Film Recovery Machine Frame Based on Modal Analysis

School of Agricultural Engineering, Jiangsu University, Zhenjiang 212013, China
*
Author to whom correspondence should be addressed.
Agriculture 2024, 14(4), 543; https://doi.org/10.3390/agriculture14040543
Submission received: 7 March 2024 / Revised: 23 March 2024 / Accepted: 27 March 2024 / Published: 29 March 2024
(This article belongs to the Special Issue Design, Optimization and Analysis of Agricultural Machinery)

Abstract

:
The technology of plastic film mulching is widely applied in Xinjiang, but it also brings about serious issues of residual film pollution. Currently, the 1MSF-2.0 residual film recovery machine can effectively address the problem. However, it faces challenges such as high overall machine weight and noticeable frame vibrations, which affect the stability of the entire machine operation. The frame, as the installation foundation, needs to bear loads and impact. Therefore, the reliability of the frame is crucial for the stability of the entire machine. Improving the frame’s vibration is of great importance. In response to the significant vibration issues during the operation of the 1MSF-2.0 residual film recovery machine, this paper utilized Workbench 2020 R2 to establish a finite element model of the machine frame and conducted static analysis to obtain strength information, thereby initially understanding the optimization space of the frame. Building upon this, Mechanical was employed to solve the first 14 natural frequencies and mode shapes of the frame, and the accuracy of the theoretical analysis was verified through modal testing. After analyzing the frequency characteristics of external excitation forces, it was found that the fourth-order natural frequency of the frame fell within the frequency range of the excitation force of the shaft of the straw grinder, causing resonance in the frame and necessitating structural optimization. The optimal results indicated that the optimized frame increased in mass by 4.41%, reduced the maximum stress value by 2.56 MPa, and increased the fourth-order natural frequency to 22.7 Hz, avoiding the frequency range of the excitation force of the shaft of the straw grinder, thus improving the resonance issue. This paper provides a reference for optimizing the design of the frame of the residual film recovery machine.

1. Introduction

The technology of plastic film mulching can effectively increase the yield of cotton in Xinjiang and is widely applied there [1,2,3]. However, the problem of plastic film pollution in Xinjiang has become increasingly severe due to the long-term use of plastic film. This pollution issue seriously hinders the sustainable development of agriculture. Research has shown that residual plastic film can cause a yield reduction of approximately 10% in cotton and corn crops [4]. According to statistics, China’s annual plastic film usage has exceeded 1.4 million tons, with a recycling rate of approximately 80%. This indicates that approximately 300,000 tons of plastic film remain in the soil every year. The control and management of plastic film pollution has become an urgent task. Currently, the primary method for managing residual film pollution is to use residual film recovery machines. The focus of this paper is on the 1MSF-2.0 residual film recovery machine. Previous research and experiments have shown that this residual film recovery machine can effectively recover residual film from Xinjiang’s cotton fields, significantly mitigating the problem of residual film pollution. However, there are still some key issues that need to be optimized. Due to the complexity of the residual film recycling process, the 1MSF-2.0 residual film recovery machine has numerous moving components, which results in a significant amount of vibrational force. As a result, the machine experiences noticeable vibrations, significantly impacting its reliability and stability during operation [5]. The frame, serving as the installation foundation for the residual film recovery machine, plays a crucial role in bearing and resisting impacts. Improving the vibration issues of the frame and preventing resonance under vibrational forces are of vital importance in enhancing the reliability of the entire machine [6].
Modal analysis is used to calculate the natural frequencies and mode shapes of structures. It is the most fundamental dynamic analysis and an important area of study in vibration reduction design [7]. When the natural frequency of a structure is close to the frequency of external excitation forces, the structure can experience resonance. In such cases, it is necessary to optimize the structure to shift its natural frequencies away from the frequency range of the external excitation forces, thereby improving the structure’s vibration characteristics. In the work by Yaoming Li et al. [8], they solved for the modal frequencies and mode shapes of the chassis frame of a rice-wheat combined harvester. By optimizing the structure of the frame through changes in beam cross-sectional dimensions, they were able to shift the modal frequencies away from the excitation frequencies, thus enhancing the overall reliability of the machine. In the research conducted by Jianjun Gao et al. [9], they performed theoretical modal analysis on the chassis frame of a combined harvester. Then modal testing was used to validate the accuracy of their theoretical analysis. This allowed them to optimize the structure of the frame effectively, thereby preventing frame resonance and improving the stability and reliability of the machine. In the research conducted by Jinming Zhang et al. [10], simulation was used to determine the vibration characteristics of a wheeled tractor under different operating conditions. They obtained the natural frequencies of vertical vibrations for the front axle, cabin, driver’s seat, and implement as 2.09 Hz, 2.84 Hz, 2.84 Hz, and 2.09 Hz, respectively. Subsequently, they performed multi-objective optimization on the stiffness and damping parameters of the front axle, obtaining the optimal stiffness and damping settings to improve the tractor’s vibration performance and ride comfort. A modal analysis on the chassis frame of the 4JZ-1700 crawler-type pepper harvester using ANSYS was conducted by Xinzhong Wang et al. [11]. The natural frequencies of the frame were found to be between 23 and 76 Hz, providing a theoretical basis for the anti-vibration design of the frame. Yingcan Liu et al. [12] addressed the issue of strong vibrations in the residual film recovery machine. They performed static and modal analysis on the machine’s frame using ANSYS WorkBench 19.0 software. Through an orthogonal experimental design method, they optimized the structure, resulting in a reduction of the maximum stress and the maximum amplitude, effectively avoiding resonance phenomena. Junxian Guo et al. [13] focused on the intense vibrations of the cotton stalk return and residual film recycling integrated machine. The Lanczos Method algorithm in ANSYS Workbench was used to solve for the modal frequencies and modes of the frame. After optimization, the first two natural frequencies of the frame deviated from the external excitation frequency, resulting in a significant reduction in vibration amplitudes and enhanced vibration damping. Changjiang Liang et al. [14] conducted modal analysis on the frame of the residual film recovery machine using finite element analysis software. The results showed a significant difference between the natural frequencies of the frame and the external excitation frequencies, effectively avoiding resonance occurrences. Shuangshuang Zhong et al. [15] conducted modal analysis on the roller of the mulch shredder using ANSYS finite element software, obtaining the first eight natural frequencies and modes to verify the design requirements of the frame. Panfeng Zhang et al. [16] used ANSYS software and finite element simulation analysis to prevent the occurrence of resonance in the film-lifting component of the rotary tillage nail tooth plastic film recycling machine. Modal analysis and transient dynamic analysis were performed on the nail tooth component. The data confirmed that no resonance occurred during the operation of the nail tooth, thus ensuring the reliability of the entire machine. Zhenhua Yu et al. [17] conducted finite element stress analysis and modal analysis on the disc-type film-gathering device of the residual film recovery machine. The stress distribution and dynamic characteristics of the film-gathering device under working loads were obtained, providing a reference for the design improvement of the equipment.
This paper addressed the issue of noticeable vibrations during the operation of the 1MSF-2.0 residual film recovery machine. Through methods such as static analysis and modal analysis, the strength information and vibration characteristics of the frame were solved for. Combining the characteristics of external excitation forces, the frame of the residual film recovery machine was optimized in size to enhance its reliability and stability during operation, thereby the effectiveness of residual film recovery was further improved.

2. Materials and Methods

2.1. Establishment of Finite Element Model for the Frame and Static Analysis

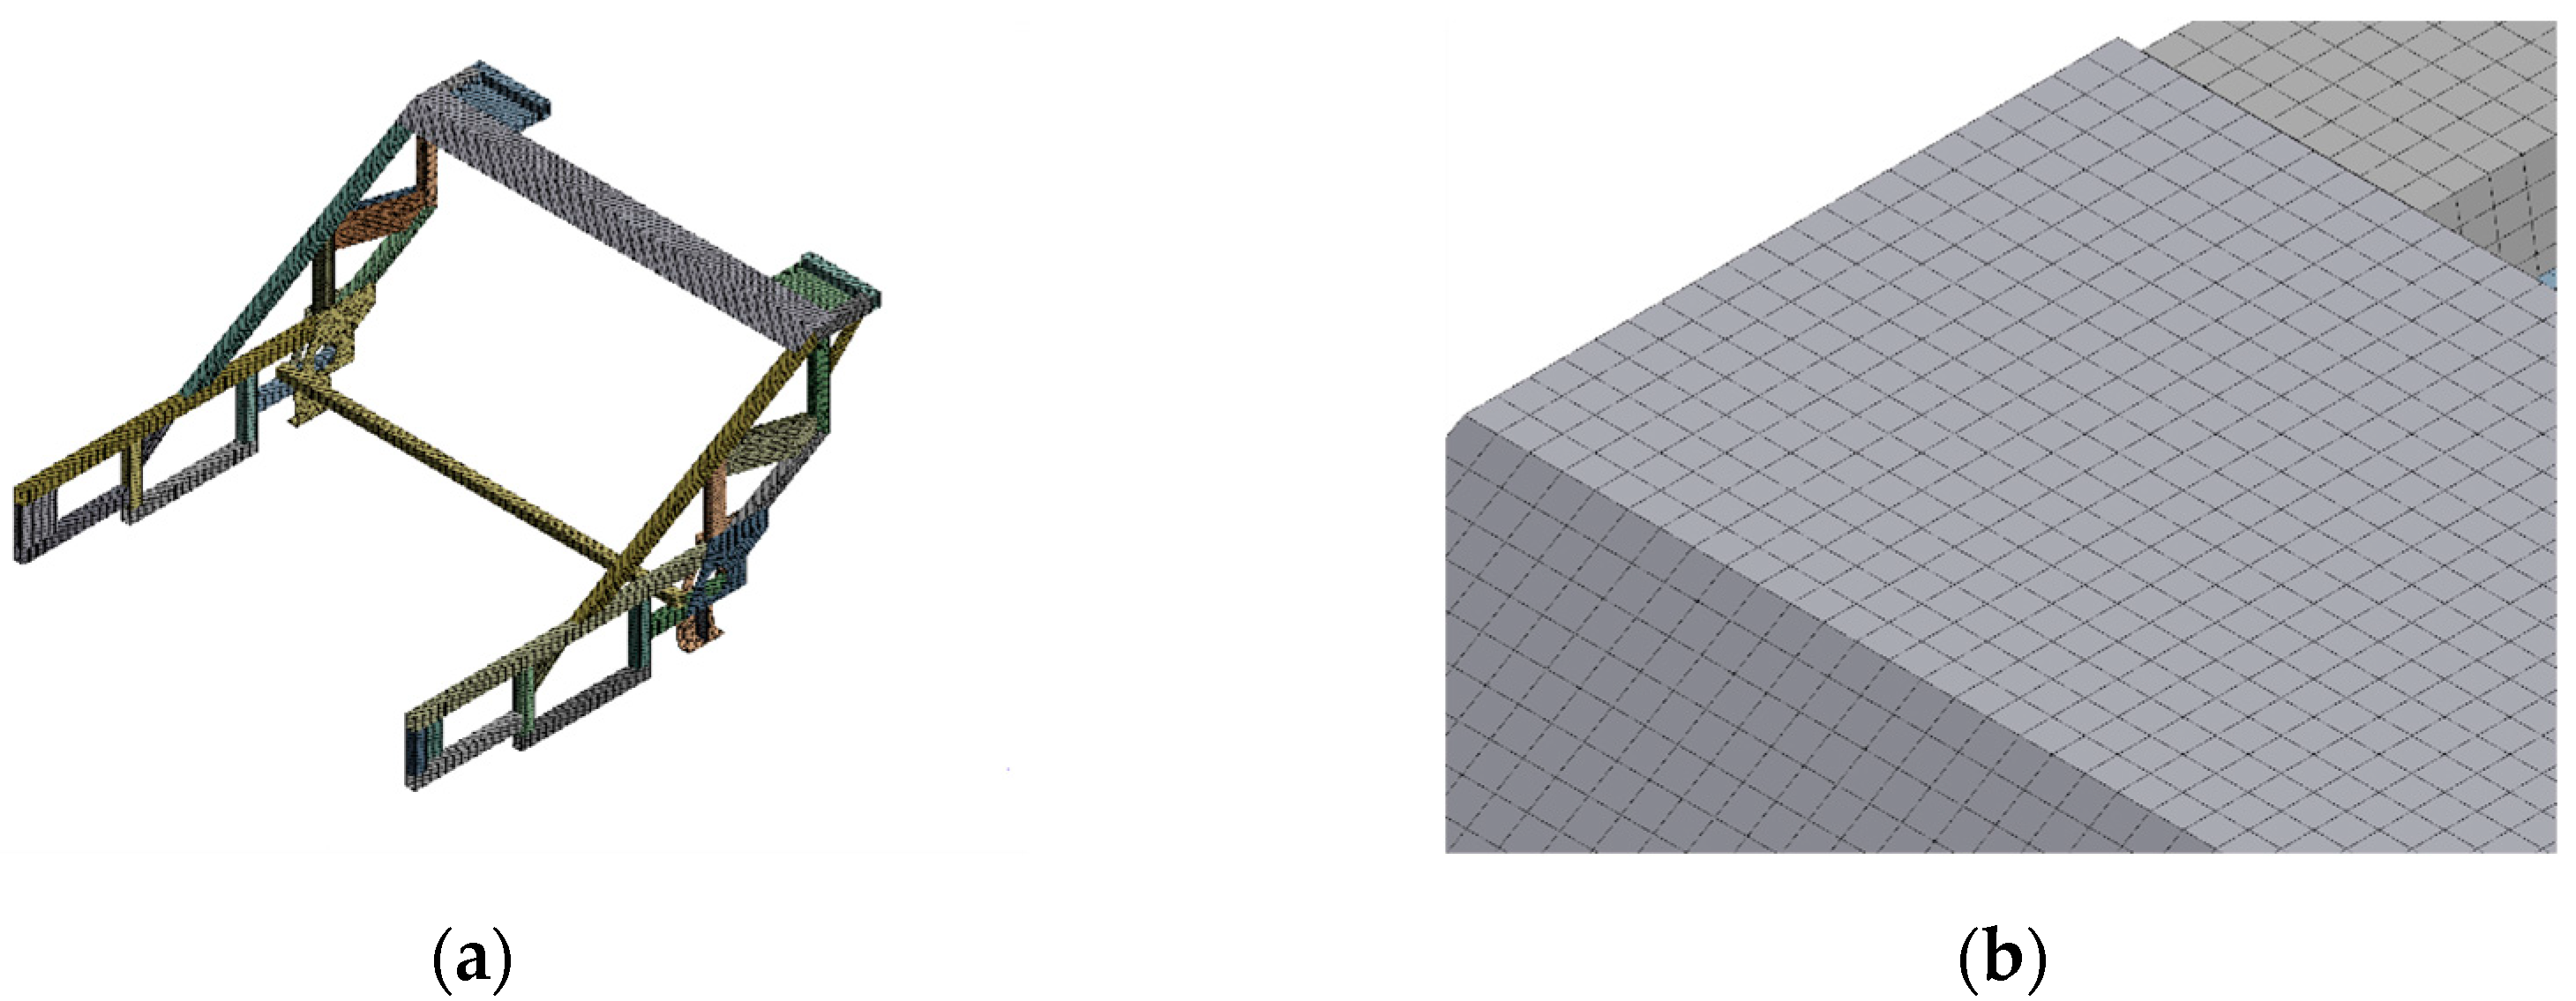
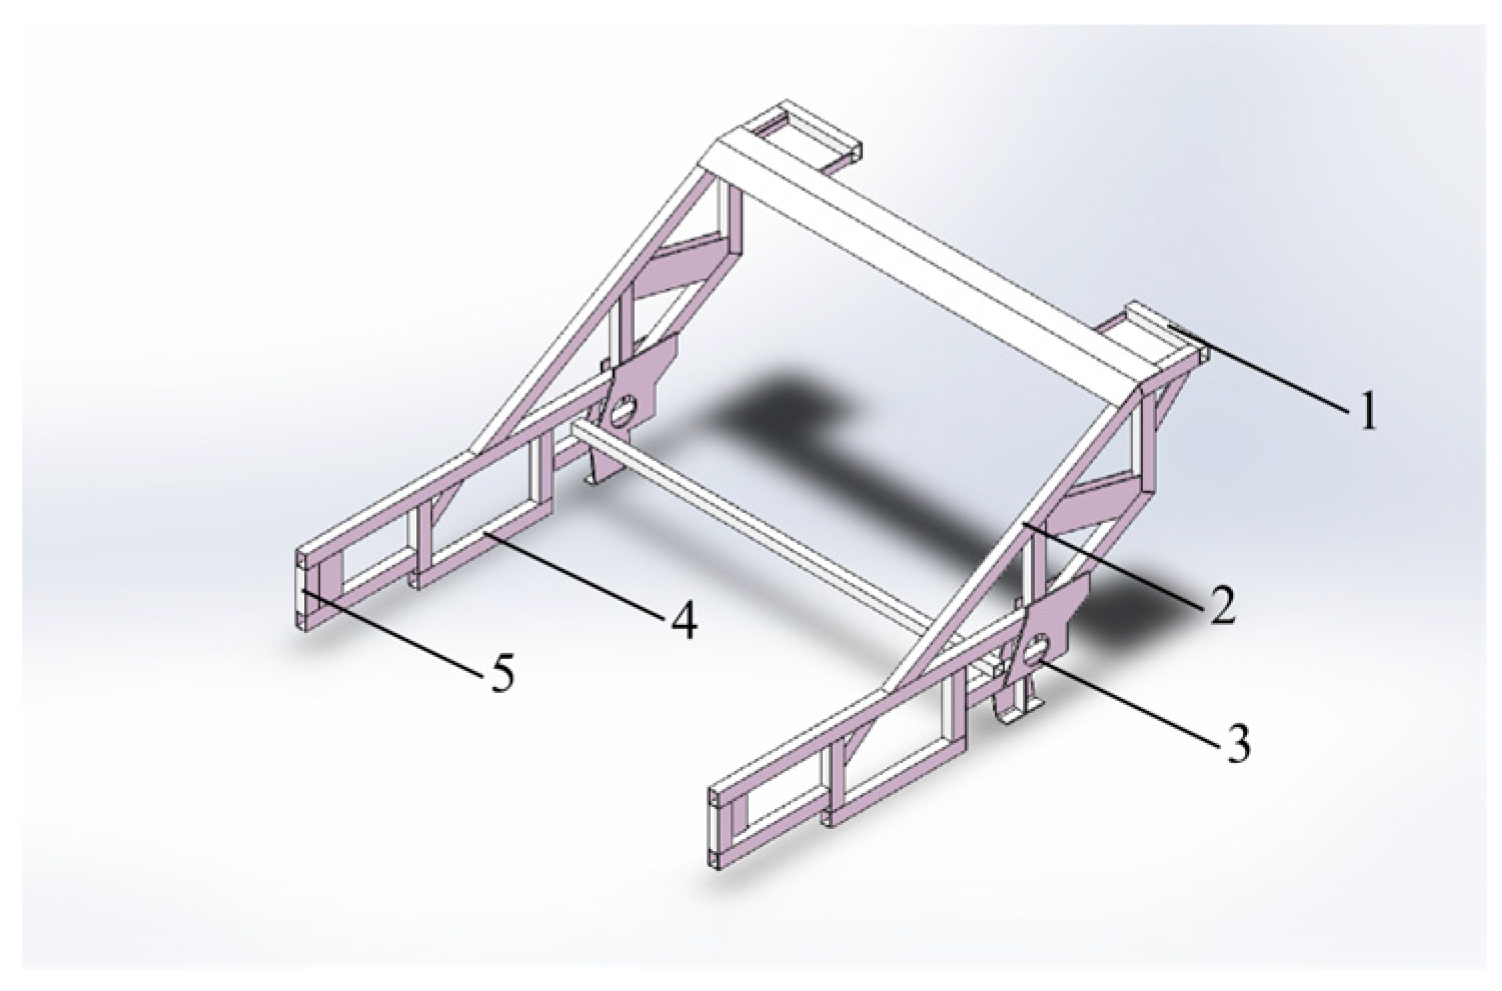
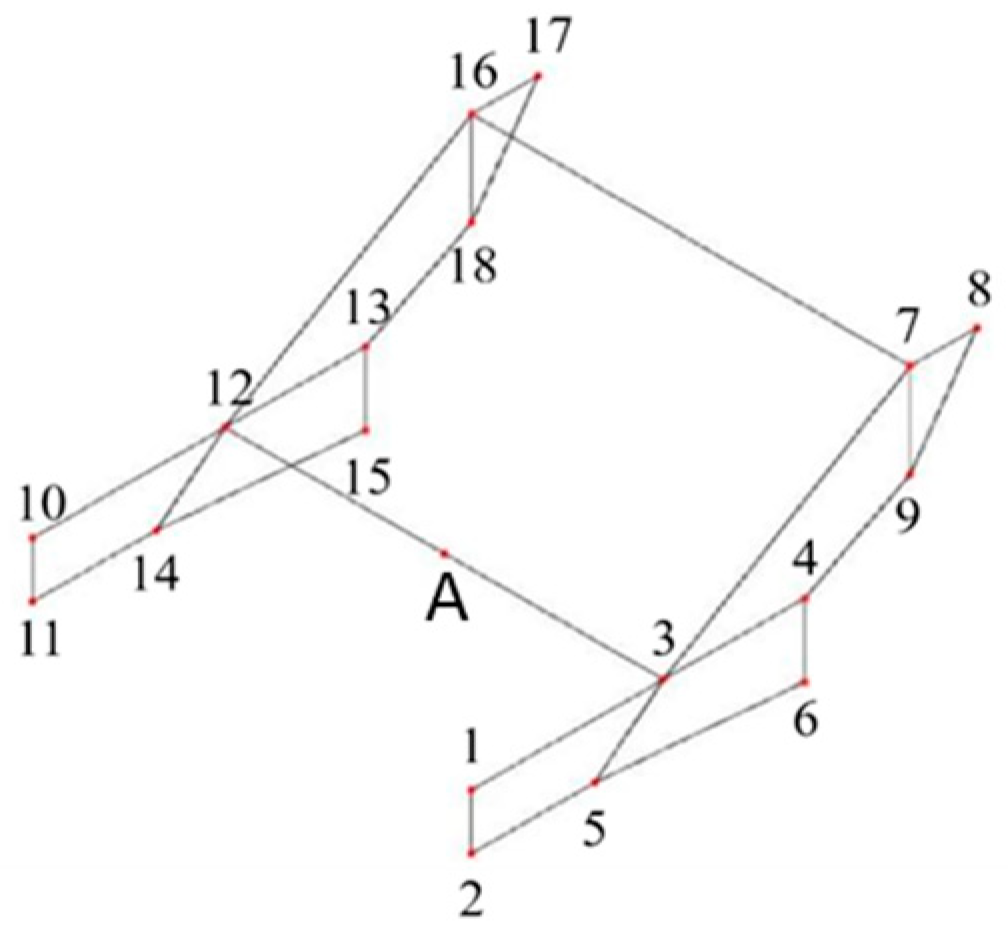
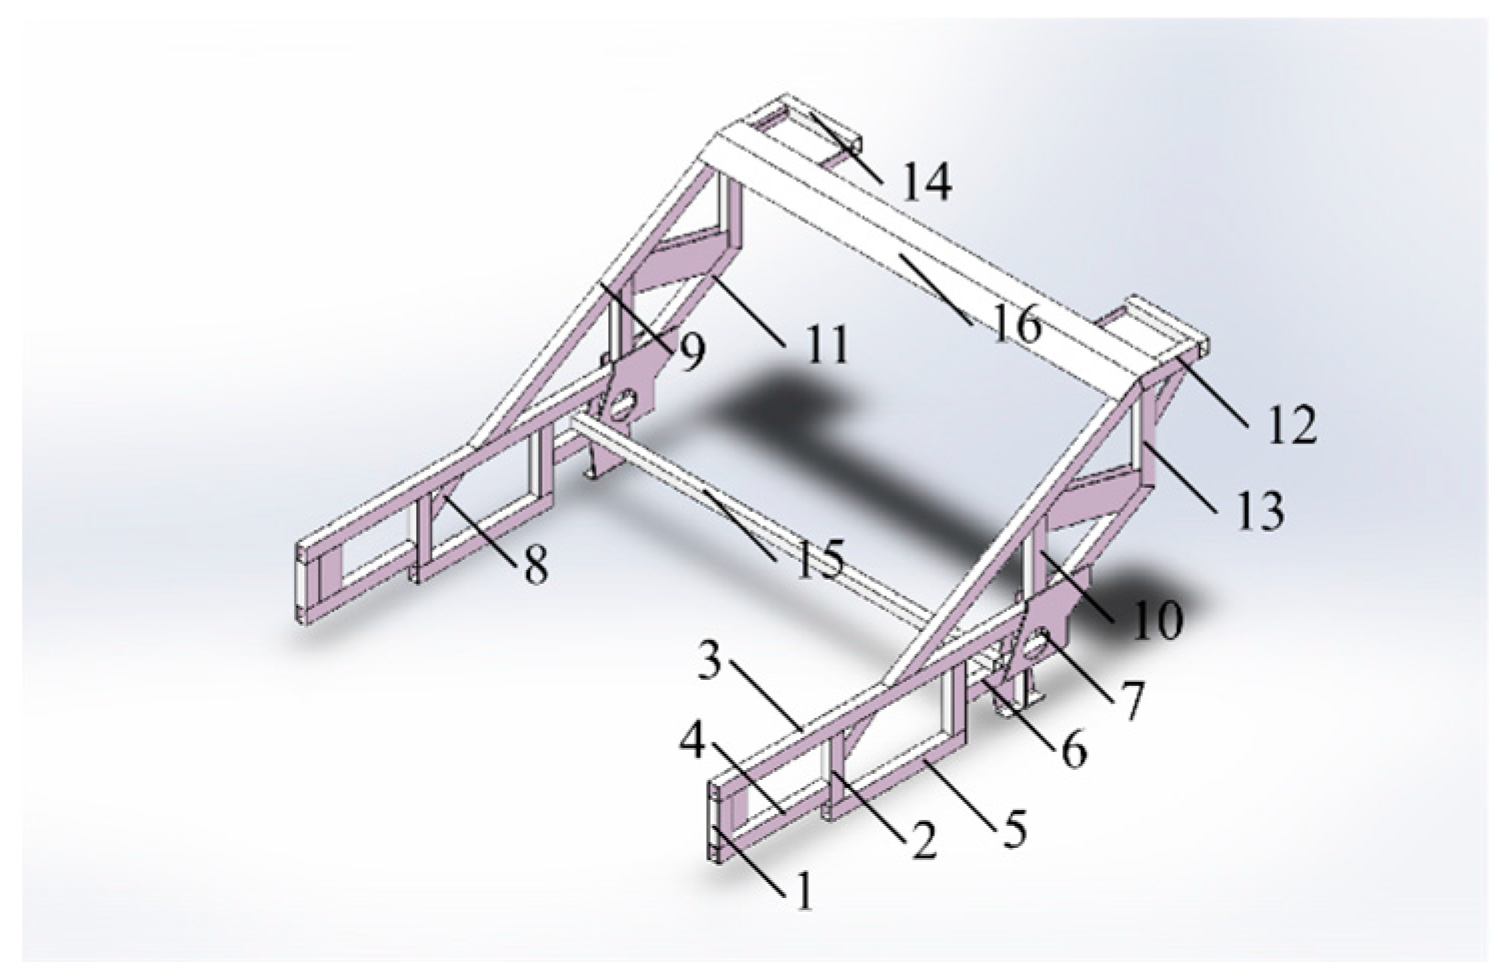
2.1.1. Establishment of Finite Element Model for the Frame

The frame of the residual film recovery machine is primarily composed of rectangular steel tubes and steel plates welded together. The overall dimensions of the frame are 2950 mm in length, 2560 mm in width, and 1559 mm in height, with a weight of 354.25 kg. At the front end of the frame, it is welded to the straw grinder. The frame is equipped with picking rollers, film stripping and pressure relief devices, baling machines, and some transmission components, serving a load-bearing function. Additionally, during operation, the frame must withstand external impacts and vibrations. Therefore, the frame needs to meet certain strength and stiffness requirements. The three-dimensional model of the frame, established using Autodesk Inventor Professional 2020, is shown in Figure 1.
Meshing is an important step in creating a finite element model, and the quality of the meshing directly affects the mathematical representation of the physical model and the computational workload. Therefore, it is necessary to set an appropriate mesh size when establishing a finite element model. Typically, the element quality after meshing should not be lower than 0.7. In this paper, multiple mesh sizes were considered, and it was determined that a mesh size of 7 mm resulted in an element quality of 0.780. When the mesh size exceeded 8 mm, the element quality dropped below 0.700. Therefore, selecting a mesh size of 7 mm not only ensures the quality of the meshing but also reduces the computational workload.
The three-dimensional model of the frame was imported into Workbench 2020 R2 to establish the finite element model. The material of the frame is Q235 structural steel, with a density of 7850 kg/m3, an elastic modulus of 210 GPa, and a Poisson’s ratio of 0.3. The material parameters in Workbench 2020 R2 were set, with a mesh size of 7 mm, and the mesh was divided to obtain the finite element model of the frame, as shown in Figure 2. It consists of 813,440 nodes and 413,333 elements. Figure 2 also displays the meshing details of the upper crossbeam of the frame.

2.1.2. Static Analysis of the Frame

During the process of optimizing the frame design, it is essential to ensure that the strength of the frame meets the required standards. Static analysis can provide information about the strength of the frame, serving as a reference for optimizing its design. Therefore, conducting static analysis on the frame is necessary.
The forces acting on the frame mainly originate from the tractor’s tractive force and ground resistance, as well as the gravitational forces of the picking rollers, film stripping and pressure relief devices, baling machines, and some transmission components mounted on the frame.
The magnitude of tractive force and resistance is measured through experiments. During the experiment, the torque at the picking roller was measured using the TQ201 wireless torque sensor node (manufactured by Beijing Beetech Inc., Beijing, China). The experimental setup was as shown in Figure 3. The resistance during the operation of the residual film recovery machine mainly comes from the resistance of the picking roller against the soil; it is assumed that the tractive force is solely used to overcome this resistance. Therefore, based on the measured torque magnitude and the relationship between force and torque, the magnitudes of tractive force and resistance can be calculated. In this paper, the calculated magnitudes of tractive force and resistance are 2500 N.
The forces exerted by the picking rollers, film stripping and pressure relief devices, baling machines, and some transmission components on the frame are primarily due to gravity. The weights of these components were determined by measuring their volumes using Autodesk Inventor Professional 2020, combined with their densities.
The constraints on the frame mainly come from the depth limitation roller and the rear suspension of the tractor. The depth limitation roller restricts three translational degrees of freedom and two rotational degrees of freedom of the frame, allowing only the freedom of rotation around the axis of the depth limitation roller. Additionally, the rear suspension of the tractor is connected to the frame, limiting the freedom of rotation around the axis of the depth limitation roller. Therefore, when applying constraints during static analysis, the frame is constrained according to the above conditions.
During static analysis, the positions, magnitudes, directions, and loading modes of the loads are as indicated in Table 1. The schematic diagram of load application positions is as shown in Figure 4. These positions on the frame all have symmetry.
After applying constraints and loads, the solution was computed using Workbench 2020 R2. Through post-processing of the results, stress analysis contour plots, strain analysis contour plots, and total deformation analysis contour plots of the frame, a finite element model was obtained.

2.2. Modal Analysis of the Frame

2.2.1. Calculated Modal Analysis of the Frame

Modal analysis is used to determine the vibrational characteristics of a structure. Calculated modal analysis can be divided into free modal analysis and constrained modal analysis. Constrained modal analysis requires simulating the actual working conditions of the structure [18]. When calculating this, appropriate boundary conditions, such as loads and constraints, need to be applied to the model. Due to the complexity of the actual working conditions of the residual film recovery machine frame in this paper, using constrained modal analysis will result in significant differences between simulated and actual working conditions, making it difficult to ensure the accuracy and reliability of the analysis results. Free modal analysis assumes that the structure is in a free state and does not consider the actual working conditions. The analysis is relatively simple and can reflect the vibrational characteristics of the structure. Therefore, free modal analysis was adopted for the modal analysis of the residual film recovery machine frame in this paper. Since the frame was in a free state, the first six modes obtained from modal analysis were rigid modes with natural frequencies of 0 [19].
Based on the static analysis of the frame, modal analysis was performed using the finite element model of the frame in Mechanical, without applying loads and constraints, to obtain the first 14 non-zero mode shapes and natural frequencies.

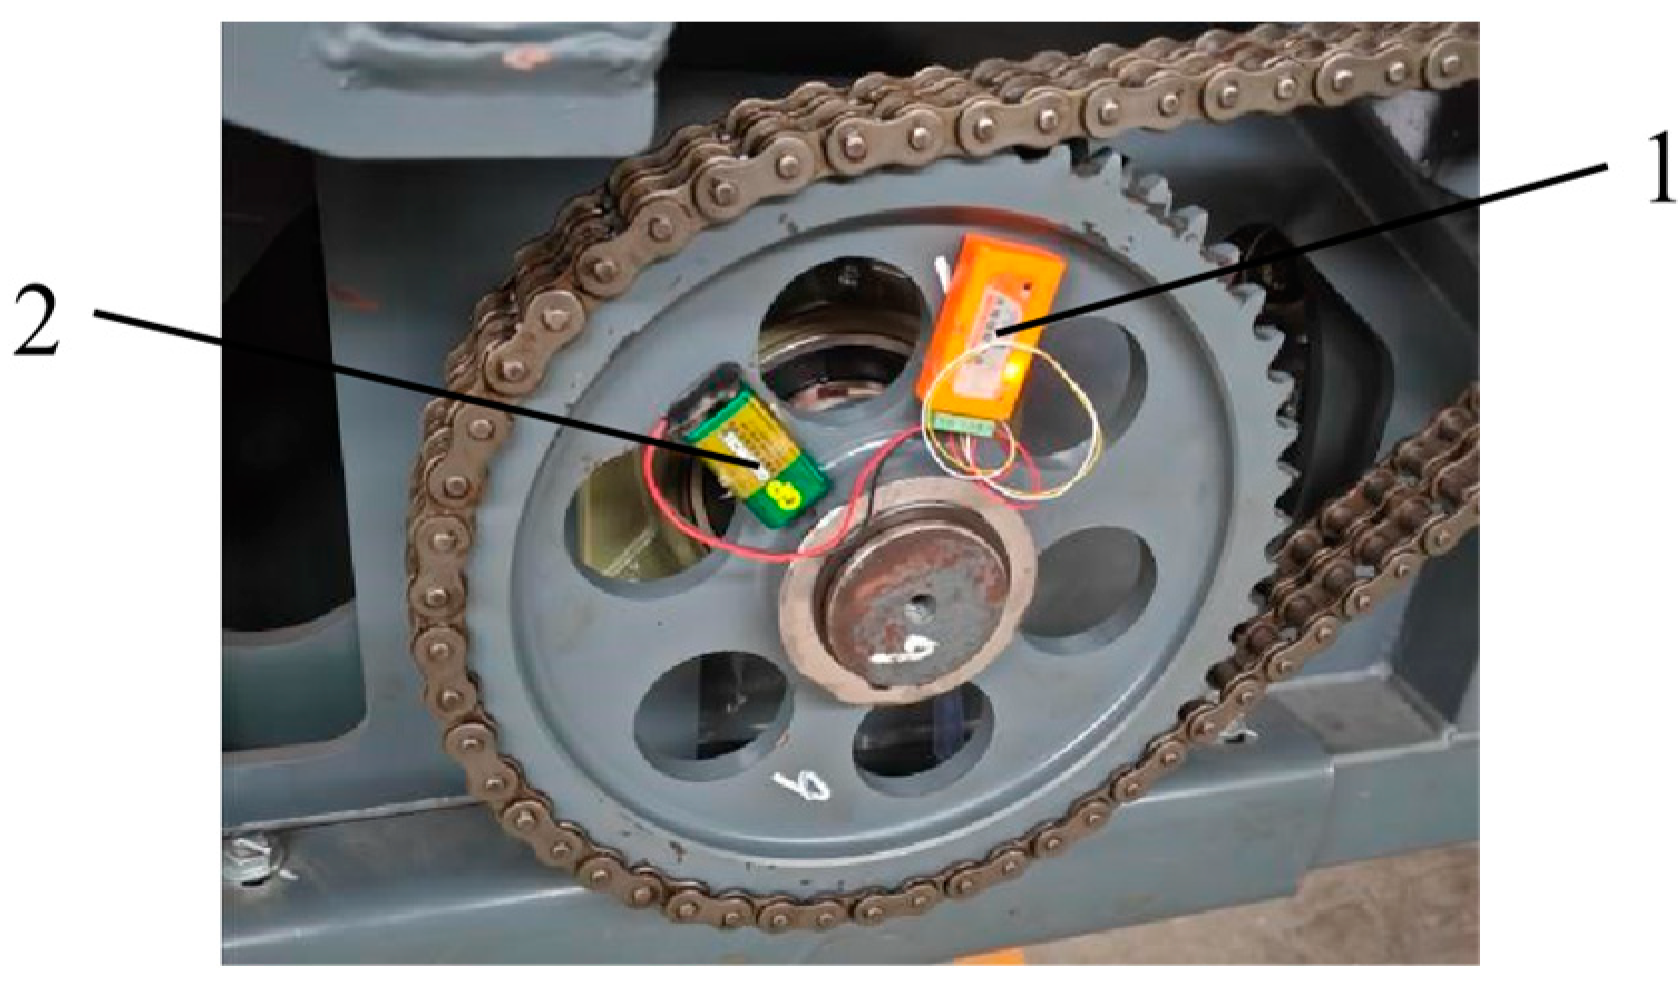
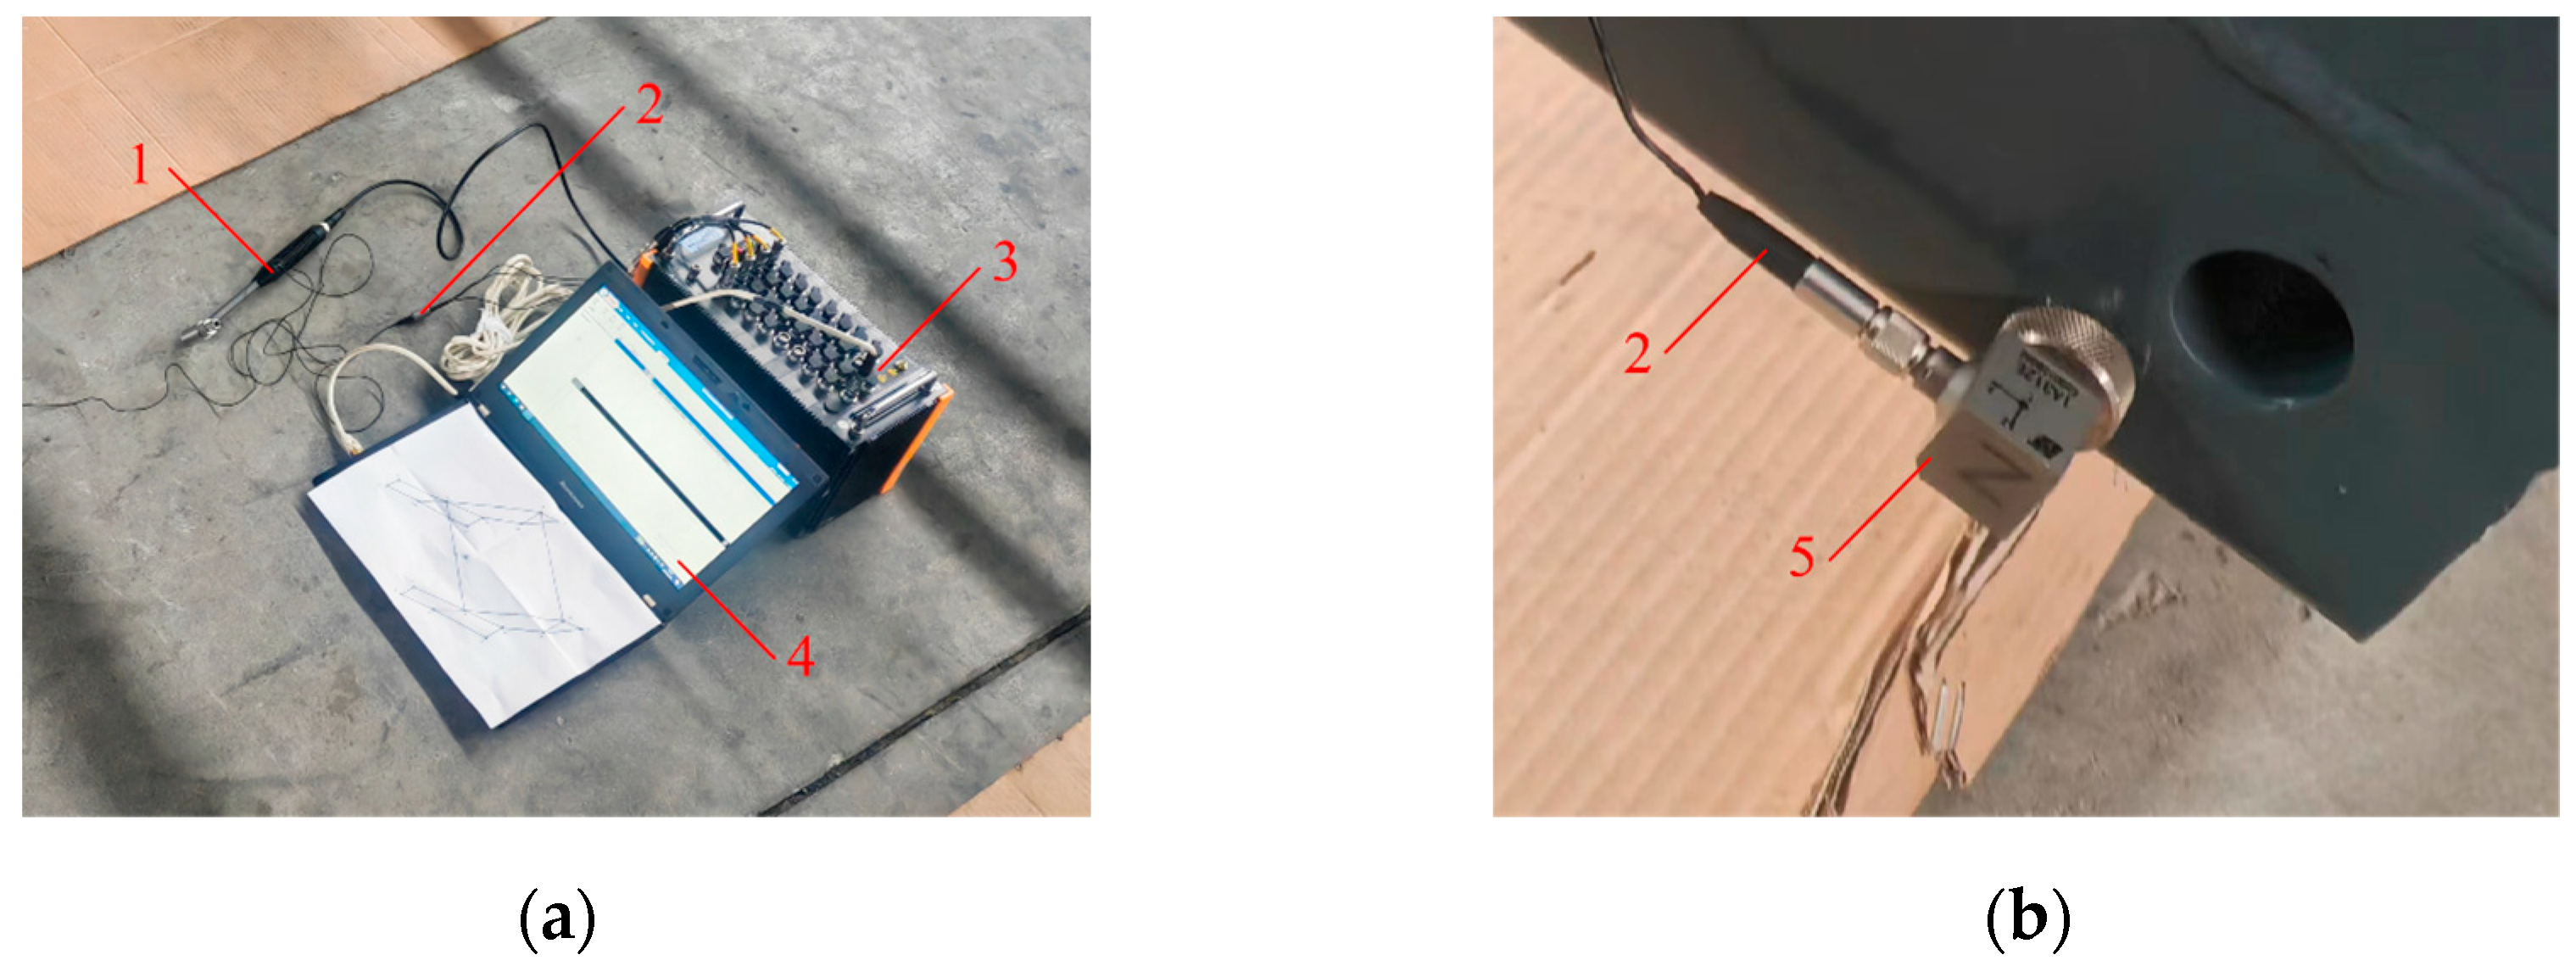
2.2.2. Test Modal Analysis of the Frame

To validate the accuracy of the finite element model of the frame and the calculated modal analysis, it is necessary to conduct modal testing on the frame [20,21,22]. The principle of modal testing is as follows: excite the structure with a vibrational force input, measure the signals at various points on the structure, and use modal parameter identification methods to obtain the modal parameters of the structure. By comparing the test modal parameters with the calculated modal parameters, the accuracy of the results can be verified.
In this paper, the force measurement method was used for the modal testing of the frame, employing a single-point excitation approach. The force measurement method requires simultaneous measurement of the excitation force and response during the test. By using this method, modal parameters can be estimated. Therefore, during modal testing, a force hammer equipped with a force sensor must be used to apply measurable excitation forces. The force measurement method can estimate all modal parameters, including natural frequencies, mode shapes, damping or damping ratios, modal mass, and modal stiffness, with high accuracy.
When selecting measurement points, it is important to choose points that adequately represent the shape of the frame. Too few measurement points will result in an incomplete representation of the frame’s shape, while too many points will lead to excessive computational burden, prolonged calculation time, or even computational infeasibility. As shown in Figure 5, this paper selected 18 important response points of the frame structure as the measurement points, and chose the midpoint position of the lower beam as the excitation point (Point A). The reliability of the results was ensured through two measurements and analyses [8].
During modal testing, it is essential to maintain consistency between the testing conditions and the calculated modal analysis. Since the calculated modal analysis conducted in this paper was based on free modal analysis, during the testing, the frame was suspended using a crane with a flexible connection between the crane and the frame to approximate a free-state condition. The experimental instruments are illustrated in Figure 6.
The experimental instruments mainly included a force hammer, triaxial accelerometer, DH5902N rugged data acquisition system, and DHDAS V2.0 software (all manufactured by Donghua Testing Technology Co., Ltd., Taizhou, China). The experimental process was as follows:
1. Instrument setup: The instruments were connected. The force sensor on the force hammer was connected to the first channel of the data acquisition system, while the accelerometer was connected to the second, third, and fourth channels. The instruments and DHDAS software were started, and then the Analysis/Frequency Response Analysis function was selected.
2. Parameter setting: The sensor sensitivity was input into the sensitivity setting column of the corresponding channel. Each measurement point was struck with the force hammer and the waveform was observed. The instrument connections, wire connections, sensor, and instrument functionality were checked until the waveform was correct. The range was appropriately adjusted by striking the points with suitable force until the force and response waveforms were neither overloaded nor too small.
3. Excitation and data collection: The frame was struck with the force hammer to induce forced vibration. The accelerometer installed on the frame collected the vibration acceleration–time domain signals. The DH5902N rugged data acquisition system and DHDAS software were used to collect, save, and analyze the signals. According to the Nyquist sampling theorem, the sampling frequency must be at least twice the highest frequency present in the original signal in order to accurately reconstruct the digital signal from the original signal [23]. In order to ensure the accuracy of the sampled signal, sampling frequency was set to 2 kHz, with 800 spectral lines, and the acceleration–time domain signals collected at each measurement point were measured sequentially. For example, when measuring point 1, the acceleration–time domain signals collected by the triaxial accelerometer installed on the frame were as shown in Figure 7.
The DHDAS software was utilized for the spectrum analysis and frequency response analysis of the acceleration–time domain signals. In the spectrum analysis settings, we chose amplitude output, selected the average spectrum for calculation parameters, set the number of spectral lines to 800, set the frequency spacing to 0.1 Hz, set the number of averages to 10, and selected linear averaging. In the frequency response analysis, we added input and output measurement point information. The results of the spectrum analysis and frequency response analysis are shown in Figure 8.
We established the corresponding model in the DHDAS software based on the 18 selected measurement points and 1 excitation point in this article. The model should adequately depict the shape of the framework, as shown in Figure 5. The measurement point numbers on the model were edited; these numbers should correspond to the modal testing. We imported the transfer functions of each measurement point into the data interface, performed modal parameter identification, and solved for the first 14 modal frequencies, damping ratios, and mode shapes.

2.3. Optimization of the Framework Dimensions

Material selection, dimension optimization, shape optimization, and topology optimization are important methods for frame optimization design [24]. Currently, commonly used materials for frames are Q235 steel and Q345 steel. Compared to Q235 steel, Q345 steel has poor welding performance and is prone to weld detachment issues. Furthermore, improving the performance of the frame usually requires more than just changing the material, structural optimization is also necessary. Dimension optimization establishes an accurate mathematical model and ensures that design variables meet specific design requirements by adding constraints. It is widely used in frame optimization design due to its precision and versatility. Shape optimization involves describing variables using partial differential equations [25]. It is more complex and less commonly applied than dimension optimization, and it is usually combined with dimension optimization in practical applications. Topology optimization offers a larger design space and greater degrees of freedom, making it suitable for lightweight design. In this study, depending on the specific circumstances, the dimension optimization method was to optimize the frame design. The residual film recovery machine consists of numerous key components and transmission parts. To ensure the reliability of the machine operation, the installation positions and alignments of each component on the frame have been thoroughly considered and calculated. Furthermore, the installation positions and alignments of each component are interrelated. During the optimization design of the frame, it is essential to avoid significant changes in the overall size and shape of the frame structure. Therefore, in this paper’s optimization design of the rectangular steel tubes in the frame, the wall thickness of the rectangular steel tubes was chosen as the design variable. This approach ensured that the overall shape of the frame would not undergo significant changes. There are a total of 16 rectangular steel tubes that can be optimized in terms of dimensions. The positions of the rectangular steel tubes are shown in Figure 9. Due to the symmetry of the frame, the identical rectangular steel tubes on both sides of the frame were considered as one design variable.
This paper aimed to adjust the natural frequency of the residual film recovery machine frame to avoid the excitation frequency range of the straw grinder’s stirring cage shaft. To achieve this goal, a dimensional optimization of the rectangular steel tubes constituting the frame was conducted.
Changing the dimensions of the frame to adjust the natural frequency may lead to a significant increase or decrease in the mass of the frame. The results of static analysis indicate that the frame has a certain margin of static strength but it is not sufficient because during actual operation, the frame may experience impacts where instantaneous stress could significantly increase. If the optimized frame significantly reduces in mass, although it can adjust the natural frequency, it cannot guarantee the strength of the frame. Therefore, when applying constraint conditions, it is necessary to impose constraints on the mass of the frame. Therefore, this paper imposed a constraint on the frame’s mass reduction, limiting it to no more than 5%. A total of 16 locations of the rectangular steel tubes’ wall thickness were chosen as design variables, forming the basis for the optimization design model. The selection of the rectangular steel tube wall thickness adhered to national standards.
The wall thickness of the 16 rectangular steel tubes is denoted in Formula (1).
X = [ x 1 , x 2 , , x 16 ]
The constraints are as follows: the fourth-order natural frequency ω of the frame is greater than the maximum excitation frequency f m a x of the straw grinder’s stirring cage shaft; the mass W ( x ) of the residual film recovery machine frame is not less than the specified minimum value W m i n ; and the maximum stress σ in the frame does not exceed the specified maximum value σ m a x . The mathematical model for optimizing the frame design was obtained as in Formula (2).
s . t . ω f m a x W ( x ) W m i n σ σ m a x X = [ x 1 , x 2 , , x 16 ]
Based on the static and modal analyses, Workbench 2020 R2 offers two optimization methods: direct optimization and response surface optimization [26,27]. Direct optimization involves selecting the optimal solution from sample points obtained from experimental designs. The more sample points there are, the more accurate the optimization results, but this also leads to longer computation times. Response surface optimization, on the other hand, utilizes fitted response surfaces for optimization. The accuracy of the optimization results depends on how well the response surface is fitted to the data. In this paper, there were a total of 16 discrete design variables. Since the number of sample points was relatively small, and to obtain accurate computational results, this paper intended to employ the direct optimization method to optimize the dimensions of the rectangular steel tubes in the frame. The Direct Optimization module was added to Workbench 2020 R2, aiming to calculate the optimal solution for the 16 design variables.
In Workbench 2020 R2, according to national standards, the range of values for the wall thickness of 16 rectangular steel tubes was determined and inputted into the parameter setting table. Since each parameter can only control the wall thickness of two opposite sides of the rectangular steel tube, the parameter relationship table needed to be updated to include the relationship between the wall thickness of adjacent sides. Objectives and constraints were set according to Formula (2). The optimization method chosen was Screening. After completing the setup, the calculation was performed, resulting in three sets of optimal sample points. By comparing these three sets, one set of optimal sample points was selected as the optimized design scheme for the frame.
The optimized frame underwent both static analysis and modal analysis to evaluate the feasibility of the optimization solution. By comparing the results of these analyses to those of the original frame, the effectiveness of the optimization approach could be examined.

3. Results

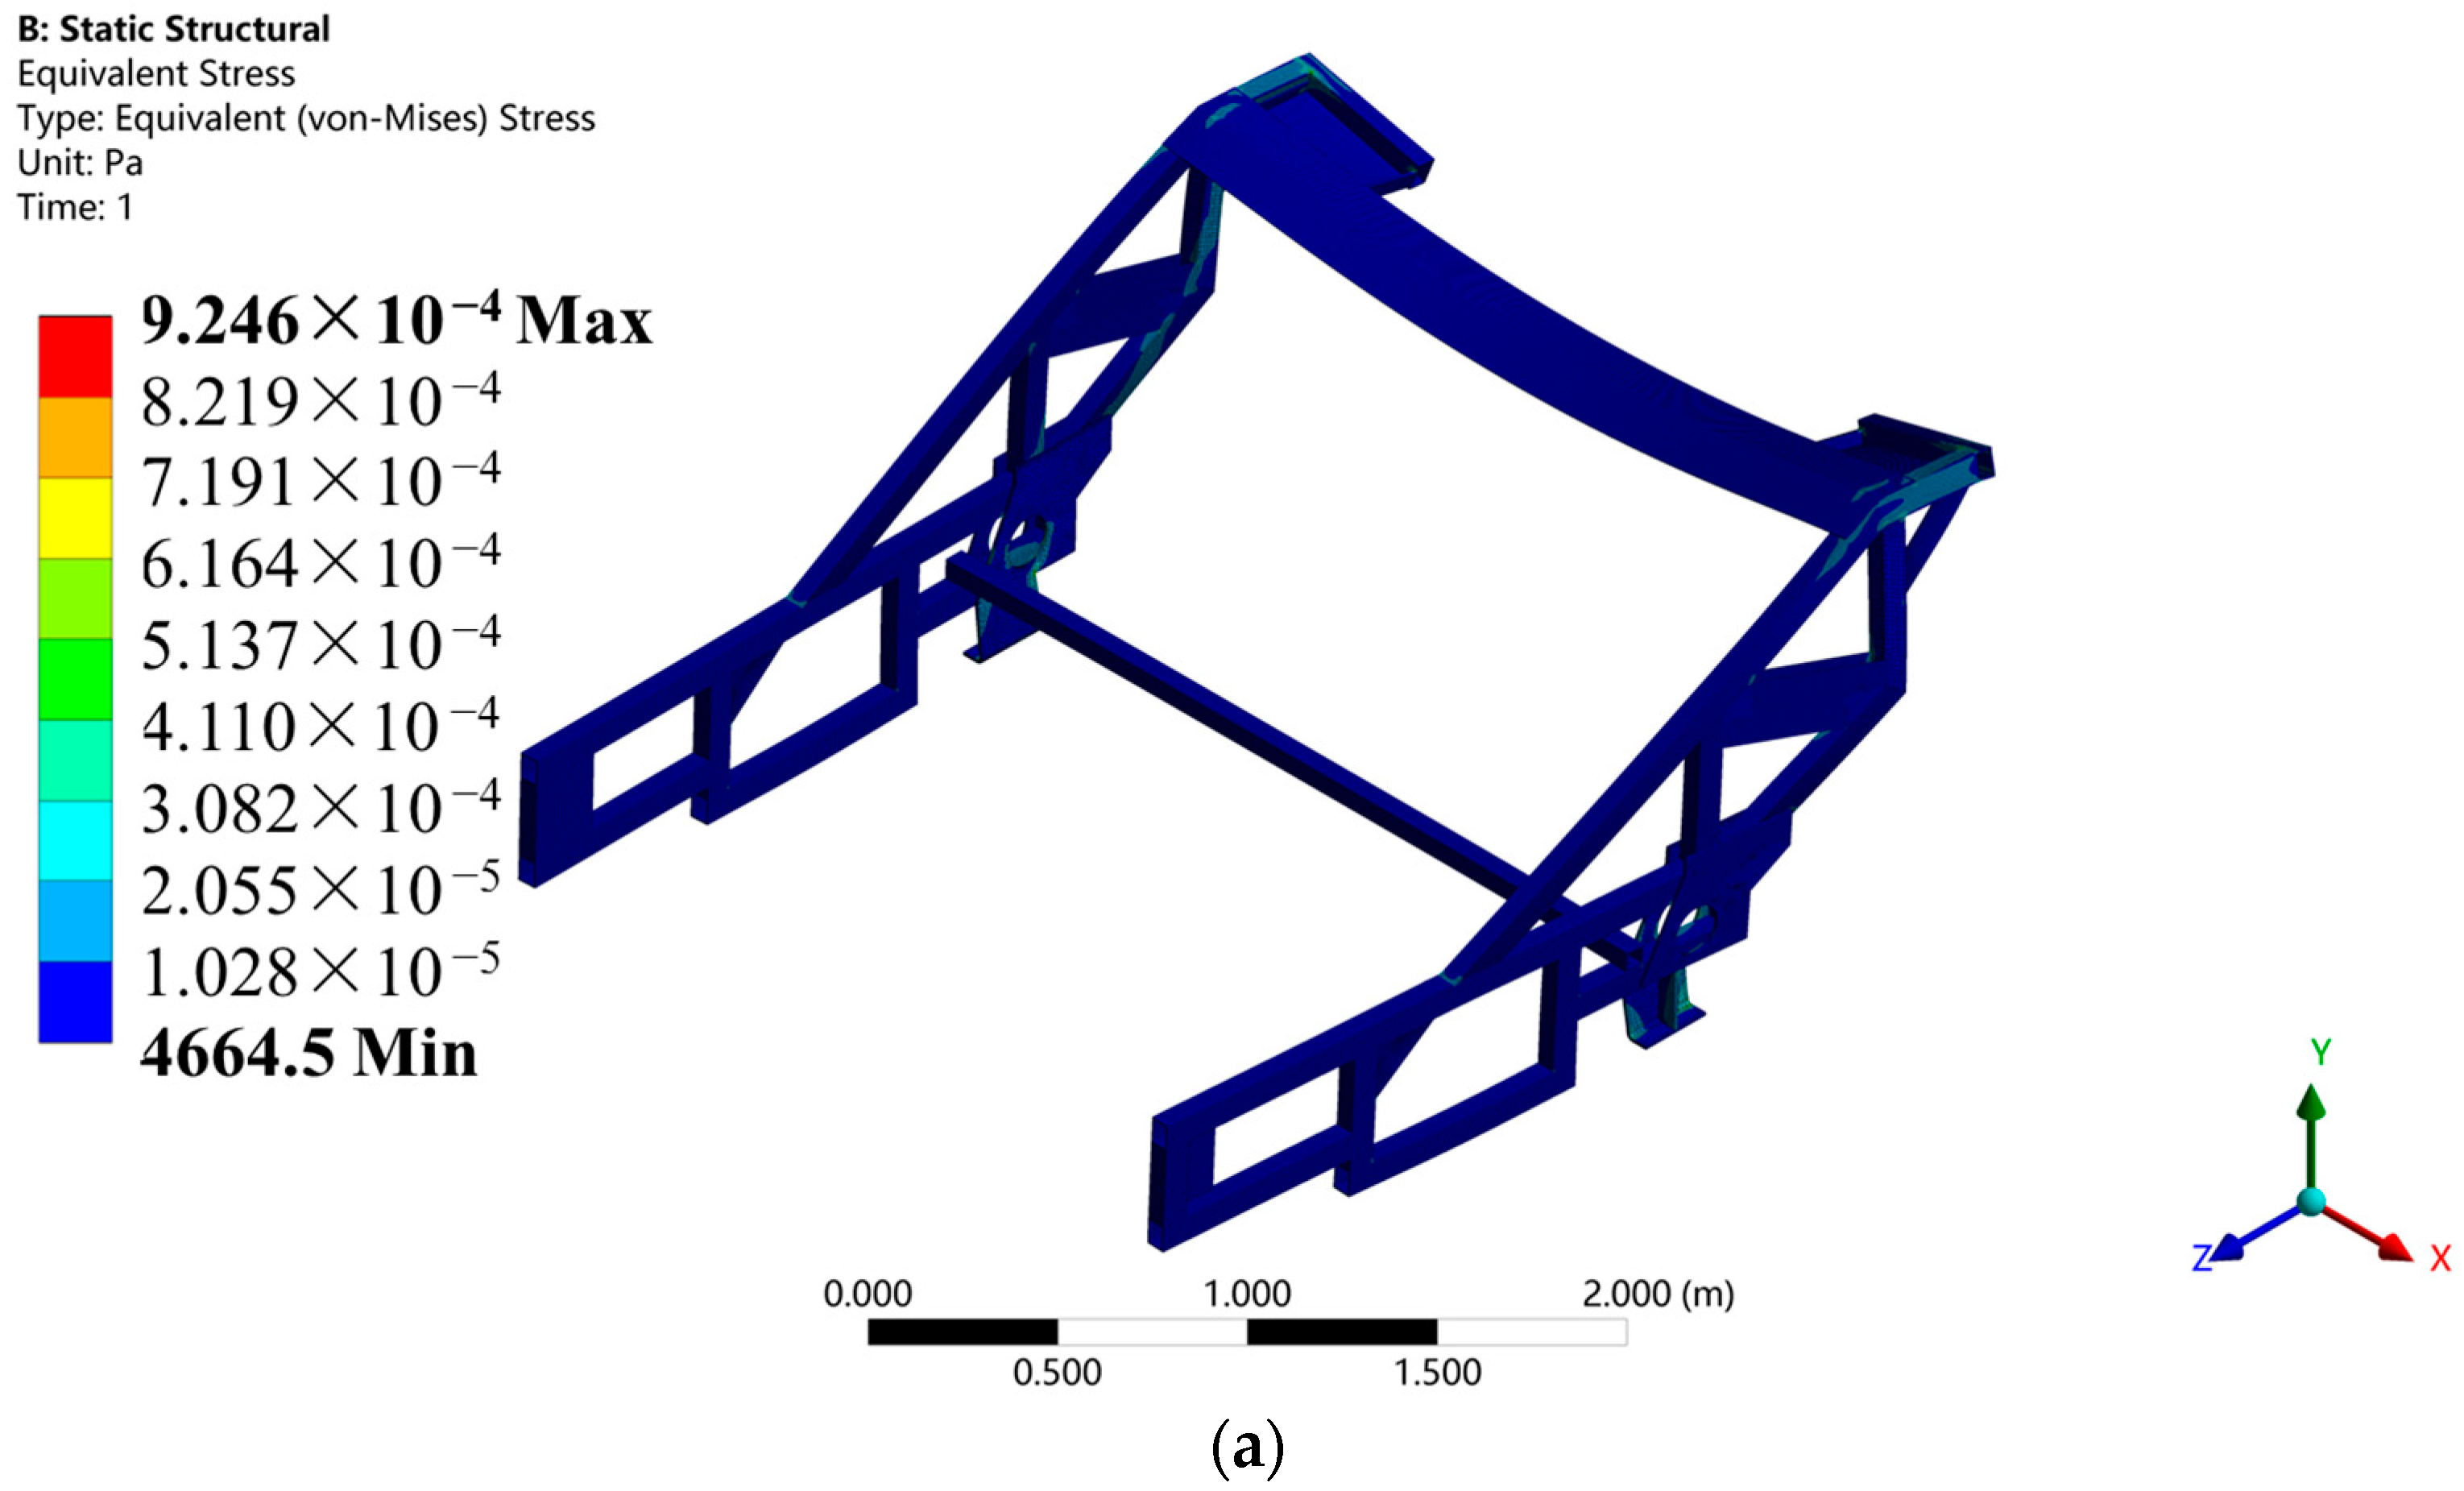
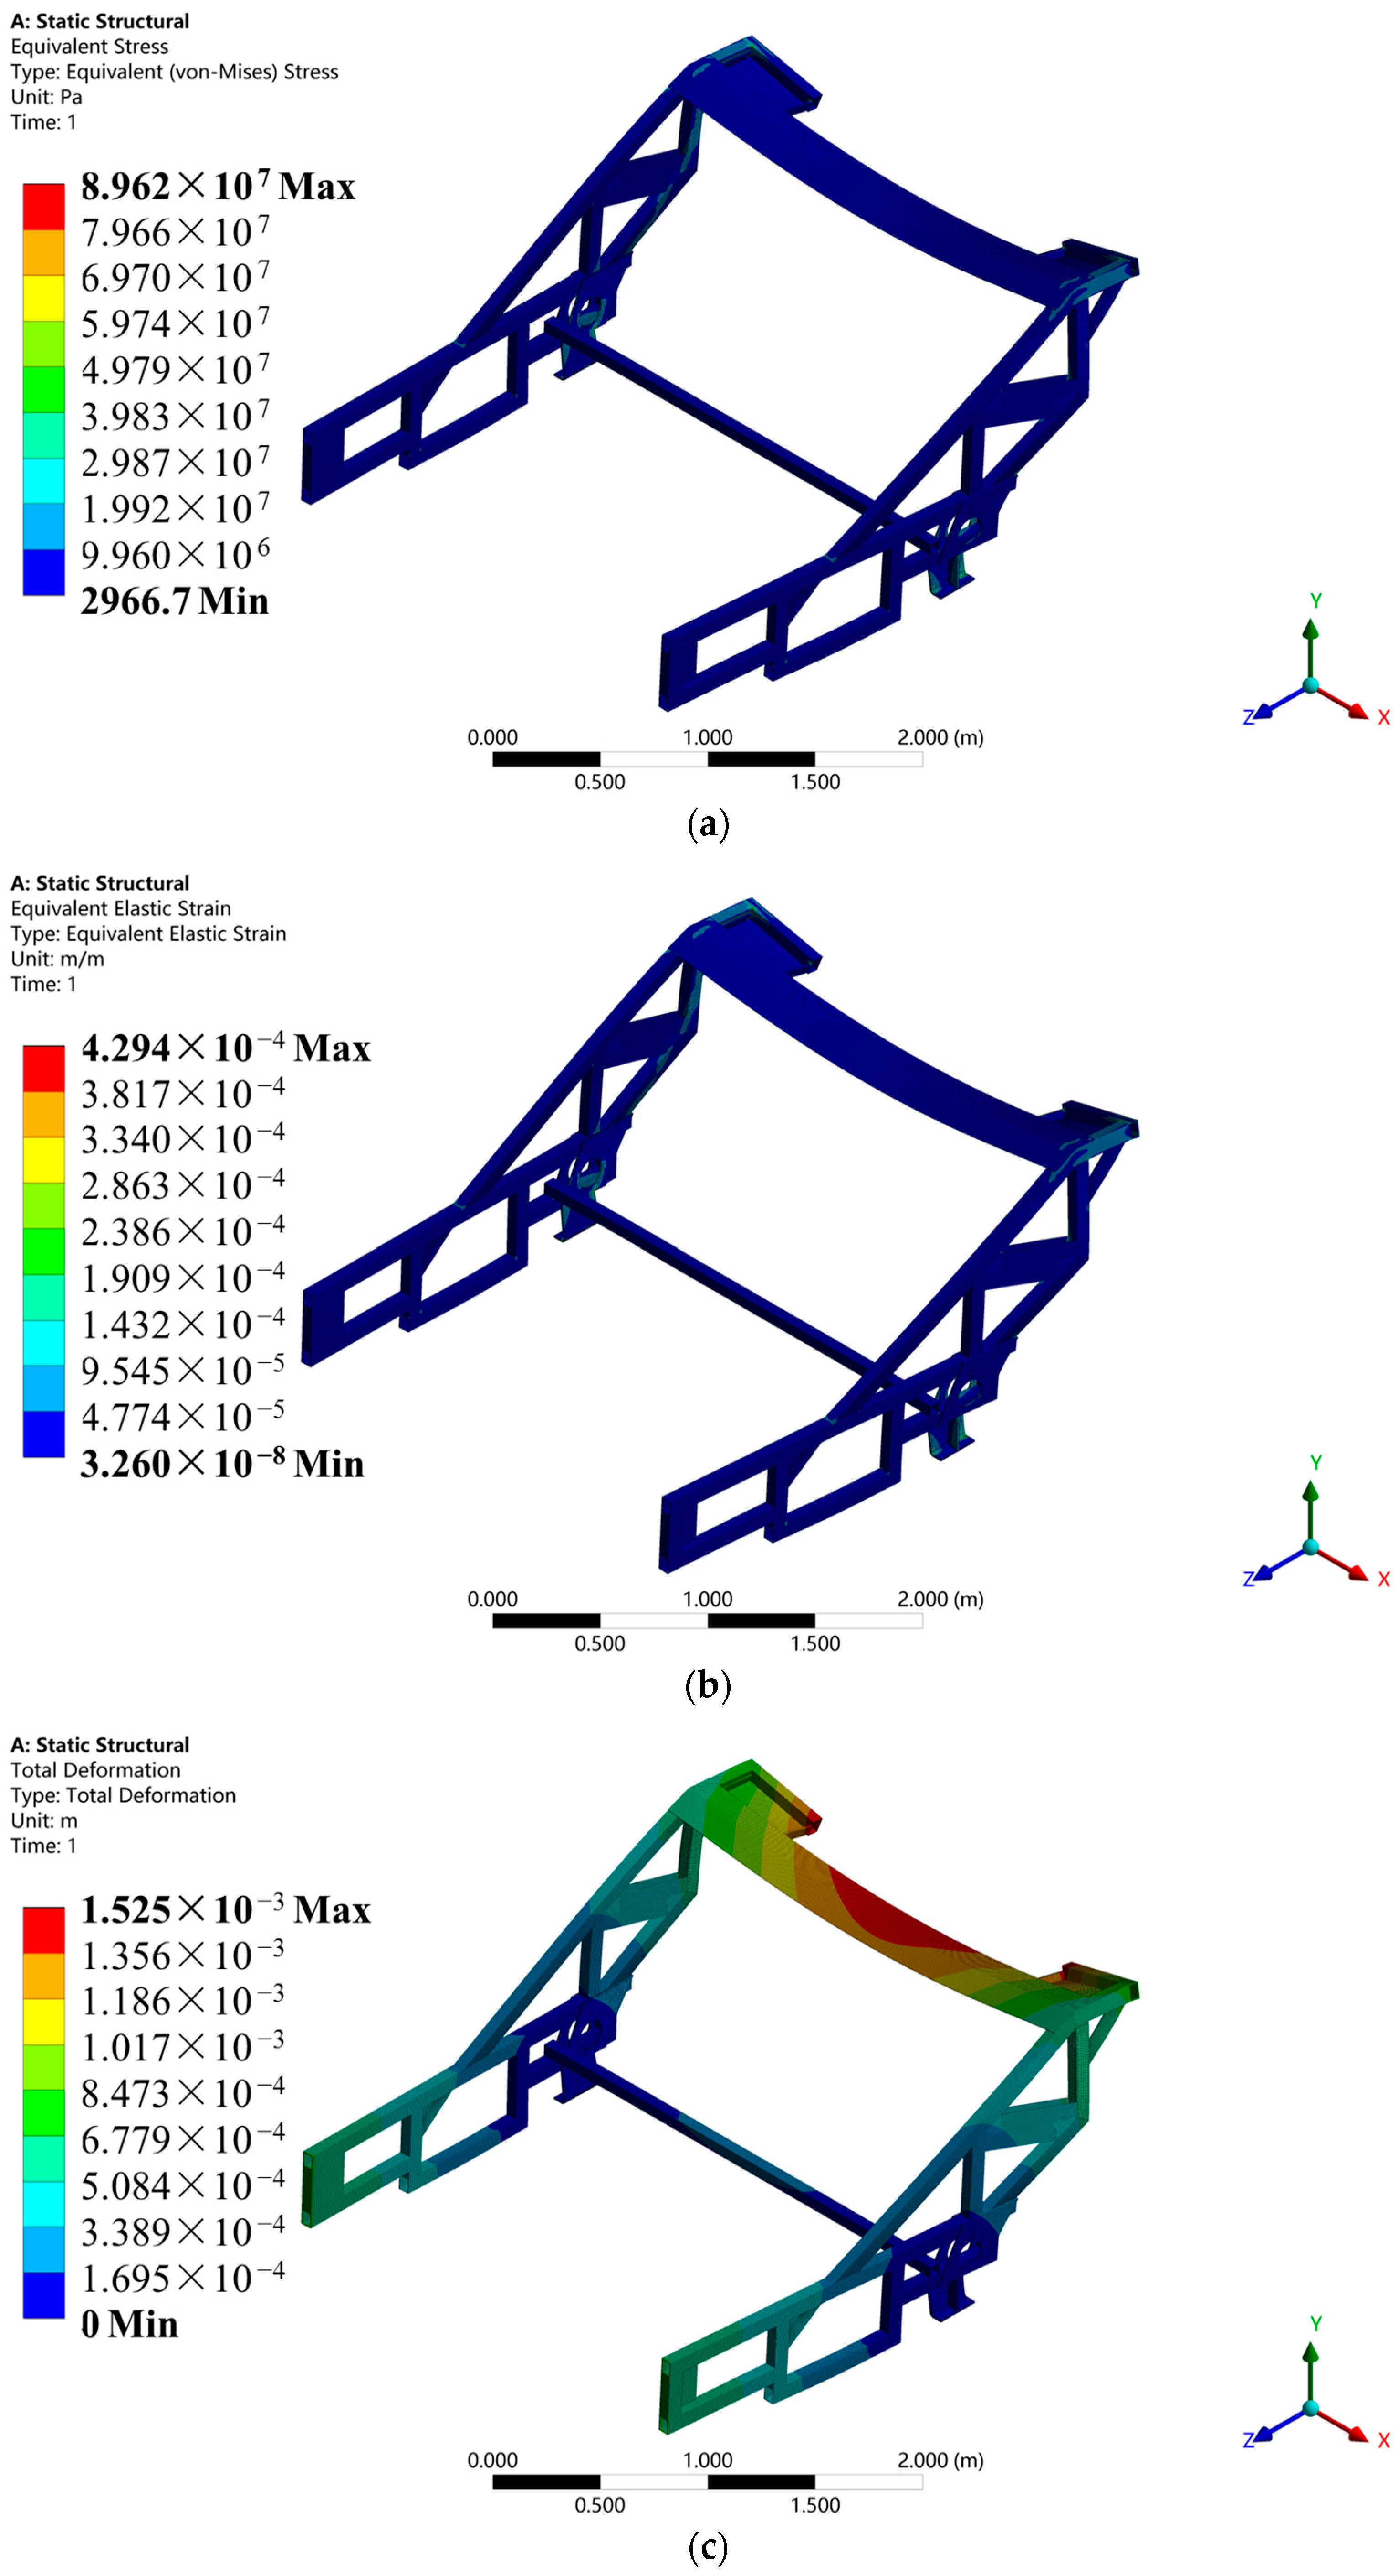
3.1. Results of Static Analysis

After post-processing the results of the static analysis, the stress analysis contour plot, strain analysis contour plot, and total deformation analysis contour plot of the frame finite element model were obtained as shown in Figure 10.
The main material used for the frame is Q235 structural steel, with a maximum yield strength of 235 MPa. The calculation formula for allowable stress is shown in Formula (3).
σ = σ s n
In Formula (3), σ represents the allowable stress, σ s represents the maximum yield strength, and n represents the safety factor. Taking n = 1.5 [10], the allowable stress σ for Q235 structural steel can be calculated as 156.67 MPa.
The results of static analysis indicate that the maximum stress in the frame is approximately 92.46 MPa, with an average value of 4.03 MPa. These values are below the allowable stress for Q235 structural steel, demonstrating that the frame meets the strength requirements under static loading conditions.
Analyzing the stress contour plot, strain contour plot, and total deformation contour plot of the frame reveals that, under static loading, the overall stress, strain, and total deformation of the frame are relatively small. There is noticeable variation only in the upper beam, this is mainly because the upper beam is connected to the baling machine, which has a relatively large weight. The baling machine exerts its load on the upper beam through bearings, causing a significant force on the upper beam.

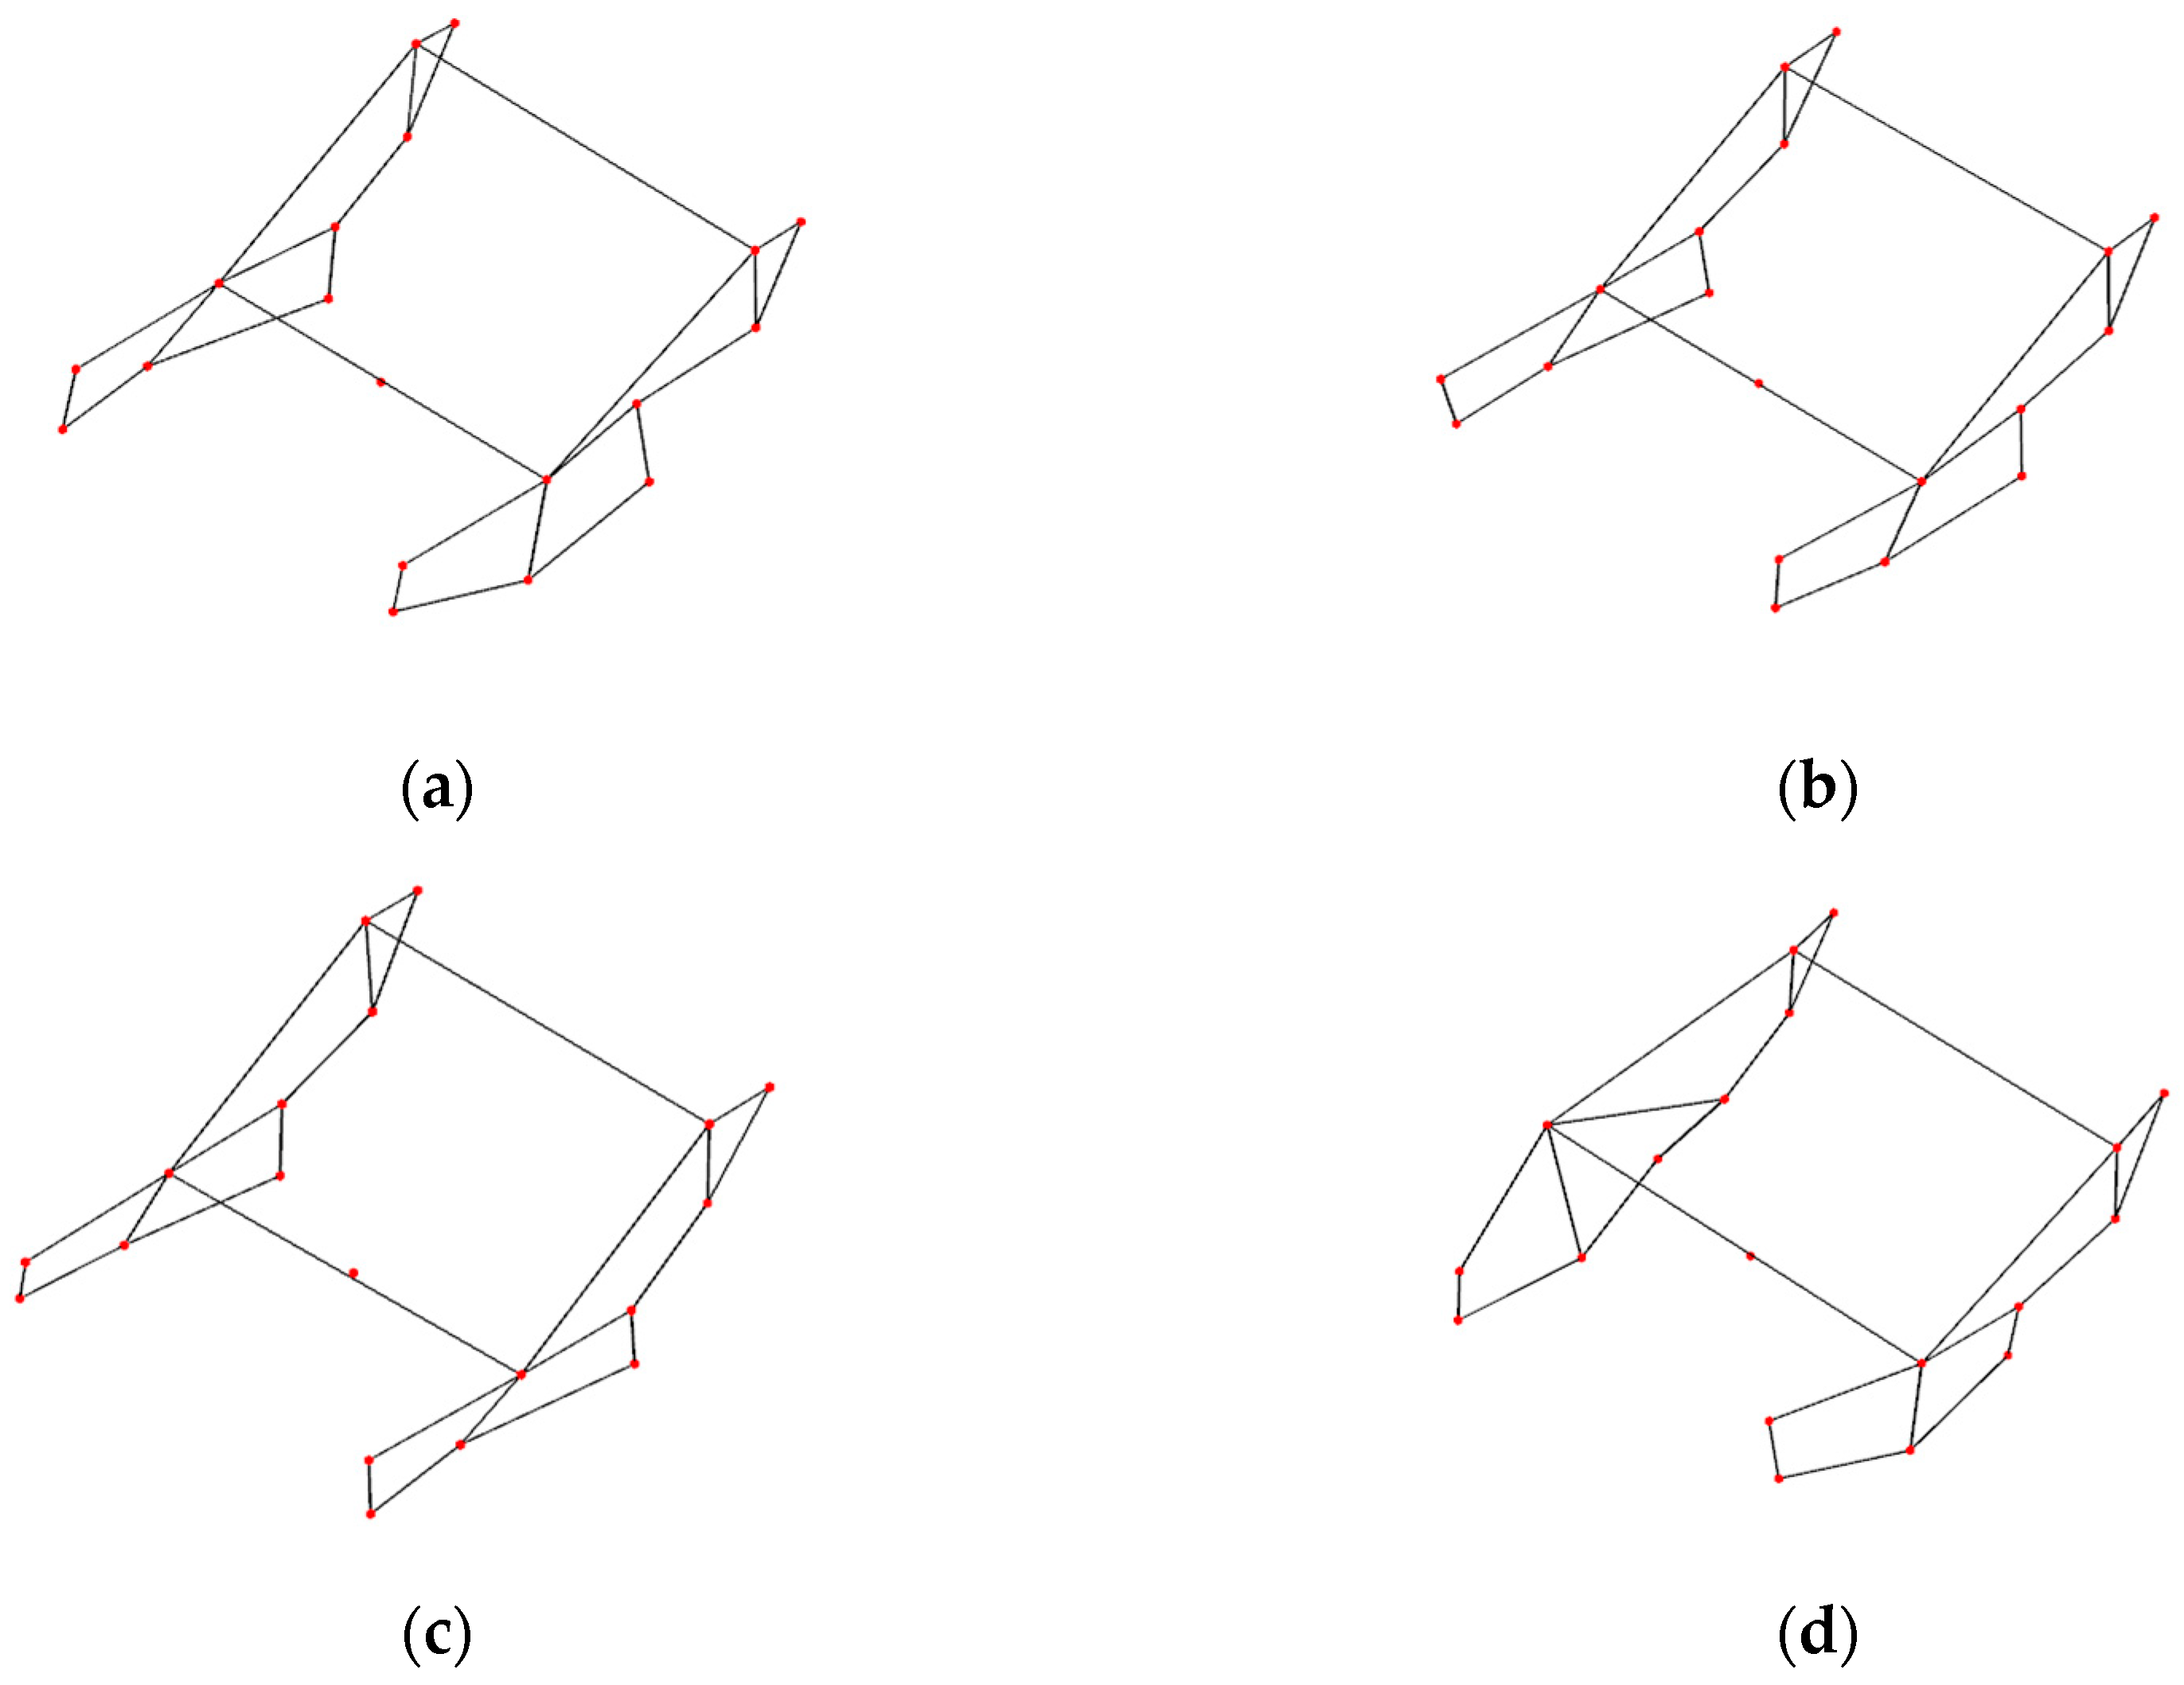
3.2. Results of Modal Analysis

Building upon the static analysis of the frame, modal analysis of the finite element model of the frame was conducted using Mechanical. The first 14 natural frequencies of the frame obtained from this analysis are presented in Table 2, while the mode shapes for the first four modes are depicted in Figure 11.
The three directions of the frame in the three-dimensional coordinate system are shown in Figure 11. Analyzing the first four non-zero mode shapes of the frame, the following observations can be made.
Mode 1: The primary deformation involves left–right torsion, with the maximum total deformation located at the front end of the frame. The torsion of the welded structures on both sides of the frame mainly occurs in the Y direction, with relatively minor deformations in the X and Z directions.
Mode 2: The primary deformation is characterized by forward–backward bending, with the maximum total deformation located at the front end of the frame. The bending of the welded structures on both sides of the frame primarily occurs in the X direction, with minor deformations in the Y and Z directions.
Mode 3: Similar to Mode 2, the primary deformation involves forward–backward bending, with the maximum total deformation located at the front end of the frame. The bending of the welded structures on both sides of the frame primarily occurs in the X direction, with minor deformations in the Y and Z directions.
Mode 4: The primary deformation is characterized by left–right bending, with the maximum total deformation located at the front end of the frame. Although there are no significant shape changes in the welded structures on both sides of the frame, noticeable displacement occurs due to a significant deformation of the two beams.
The natural frequencies of the frame obtained from modal testing are presented in Table 2, while the first four mode shapes are depicted in Figure 12. The red dots in Figure 12 represent the corresponding 18 measurement points and 1 excitation point in Figure 5.
The three directions of the frame in the three-dimensional coordinate system are shown in Figure 11. The analysis and parameter identification yield the following results for the first four mode shapes.
Mode 1: The first mode shape is primarily characterized by twisting motion in the horizontal direction. The welded structures on both sides of the frame twist around the X-axis in opposite directions. The front and middle sections of the welded structures exhibit significant deformation.
Mode 2: The second mode shape is primarily characterized by bending motion in the forward and backward directions. The welded structures on both sides of the frame exhibit displacement along the X-axis. The front and middle sections of the welded structures display significant deformation.
Mode 3: The third mode shape is primarily characterized by bending motion in the left and right directions. The welded structures on both sides of the frame exhibit displacement along the X-axis. The lateral bending of the welded structures is evident, while deformation is relatively small in other regions.
Mode 4: The fourth mode shape is primarily characterized by bending motion in the left and right directions. The welded structures on both sides of the frame bend in opposite directions around the Z-axis. The front and middle sections of the welded structures display significant deformation, and the two horizontal beams also experience a certain degree of deformation.
During modal analysis, the calculated results may have errors compared to the actual conditions due to the simplified idealized model used and the differences between the simulated and actual operating conditions. In modal testing, apart from the external signal interference caused by environmental factors, it was challenging to ensure that the excitation force applied by humans remained consistently positioned accurately at the excitation point and maintained a consistent magnitude. These factors could introduce certain errors into the test results. Therefore, it is necessary to perform modal shape correlation analysis to assess the reliability of the calculated modal analysis results in comparison with the calculated modal analysis results.
To address these challenges, it is essential to conduct modal shape correlation analysis. This analysis aims to assess the reliability of the calculated modal analysis results by comparing them with test modal analysis results [28].
As shown in Table 2, the relative errors between the calculated frequencies and test frequencies of the analyzed frame indicate that the absolute values of relative errors for each natural frequency are within 8%. This suggests that the finite element model of the frame and the results of modal analysis are accurate [29]. The relatively large errors in the first and second natural frequencies are primarily due to their small absolute values, as small absolute errors can result in relatively larger relative errors. Other contributing factors may include simplifications made in the finite element model of the frame compared to the actual model and external signal interference.
A comparison of the modal shapes from the calculated modal analysis and test modal analysis reveals a basic consistency and correlation between the two. Discrepancies in the descriptions of modal shapes for the 3rd, 10th, 11th, 12th, and 14th modes are attributed to the inability of the chosen measurement points in the test modal analysis to fully replicate the frame structure, leading to inevitable deviations in modal shapes.
Given that the lower-order modal shapes determine the dynamic characteristics of the structure [8], a focused analysis is conducted on the first four natural frequencies and corresponding modal shapes of the frame. During the operation of the residue recovery machine, the excitation forces primarily originate from the ground, the cutter shaft of the straw grinder, and the stirring shaft of the straw grinder. Ground excitation is determined by ground conditions, with typical ground excitation frequencies being below 3 Hz [30]. Actual measurements indicate that the normal operating speeds of the cutter shaft and stirring shaft are in the range of 2400 to 2500 r/min and 1200 to 1300 r/min, with excitation frequencies ranging from 40 to 41.7 Hz and 20 to 21.7 Hz, respectively.
All of the first four natural frequencies of the frame are above 3 Hz and below 40 Hz, suggesting that the influences of ground conditions and the cutter shaft are minimal. However, the fourth natural frequency of the frame is 21.314 Hz, coinciding with the excitation frequency range of the stirring shaft. This results in significant resonance during operation. To address this resonance issue, an enhanced reliability and stability of the entire machine during operation and optimization of the structural dimensions of the frame are required.

3.3. Results of Dimensional Optimization

Optimal solutions for 16 design variables were obtained through optimization calculations, as shown in Table 3. The samples from the optimization results are illustrated in Figure 13, with each curve representing a sample. Based on the optimization objectives, the optimal solution was selected from the samples.

3.4. Comparison of the Frame before and after Optimization

Using Autodesk Inventor Professional 2020, the optimal thickness values obtained from Table 3 for the 16 rectangular steel tubes were used to modify the thickness of the corresponding steel tubes on the original frame, resulting in the three-dimensional model of the optimized frame. Subsequently, in Workbench 2020 R2, a finite element model of the optimized frame was created following the same principles mentioned earlier. Static analysis and modal analysis were performed on the optimized frame to compare the calculated results with the original frame and validate the effectiveness of the optimization solution.

3.4.1. Comparison of Static Analysis Results

In Mechanical, appropriate constraints and loads were applied to the optimized frame. The positions, magnitudes, directions, and loading modes of the loads were consistent with the previous description.
After applying the constraints and loads, the finite element model was solved. Post-processing the results, stress contour plots, strain contour plots, and overall deformation contour plots of the optimized frame were obtained, as shown in Figure 14.
The static analysis results indicated that the maximum stress of the optimized frame was approximately 89.62 MPa, with an average stress of 3.83 MPa. Both the maximum and average stresses were smaller than those of the frame before optimization. The maximum overall deformation of the optimized frame was approximately 1.5 mm, which was also smaller than the deformation observed in the original frame. The mass of the optimized frame was 368.83 kg, which was an increase of 14.58 kg (4.12%) compared to the original frame. The mass increase was not significant, indicating that the optimization did not significantly affect the overall mass of the frame. The optimized frame exhibited reduced overall stress, strain, and deformation compared to the original frame. These quantities were distributed more evenly throughout the structure, satisfying both strength and stiffness requirements. This confirms the effectiveness of the structural optimization approach.

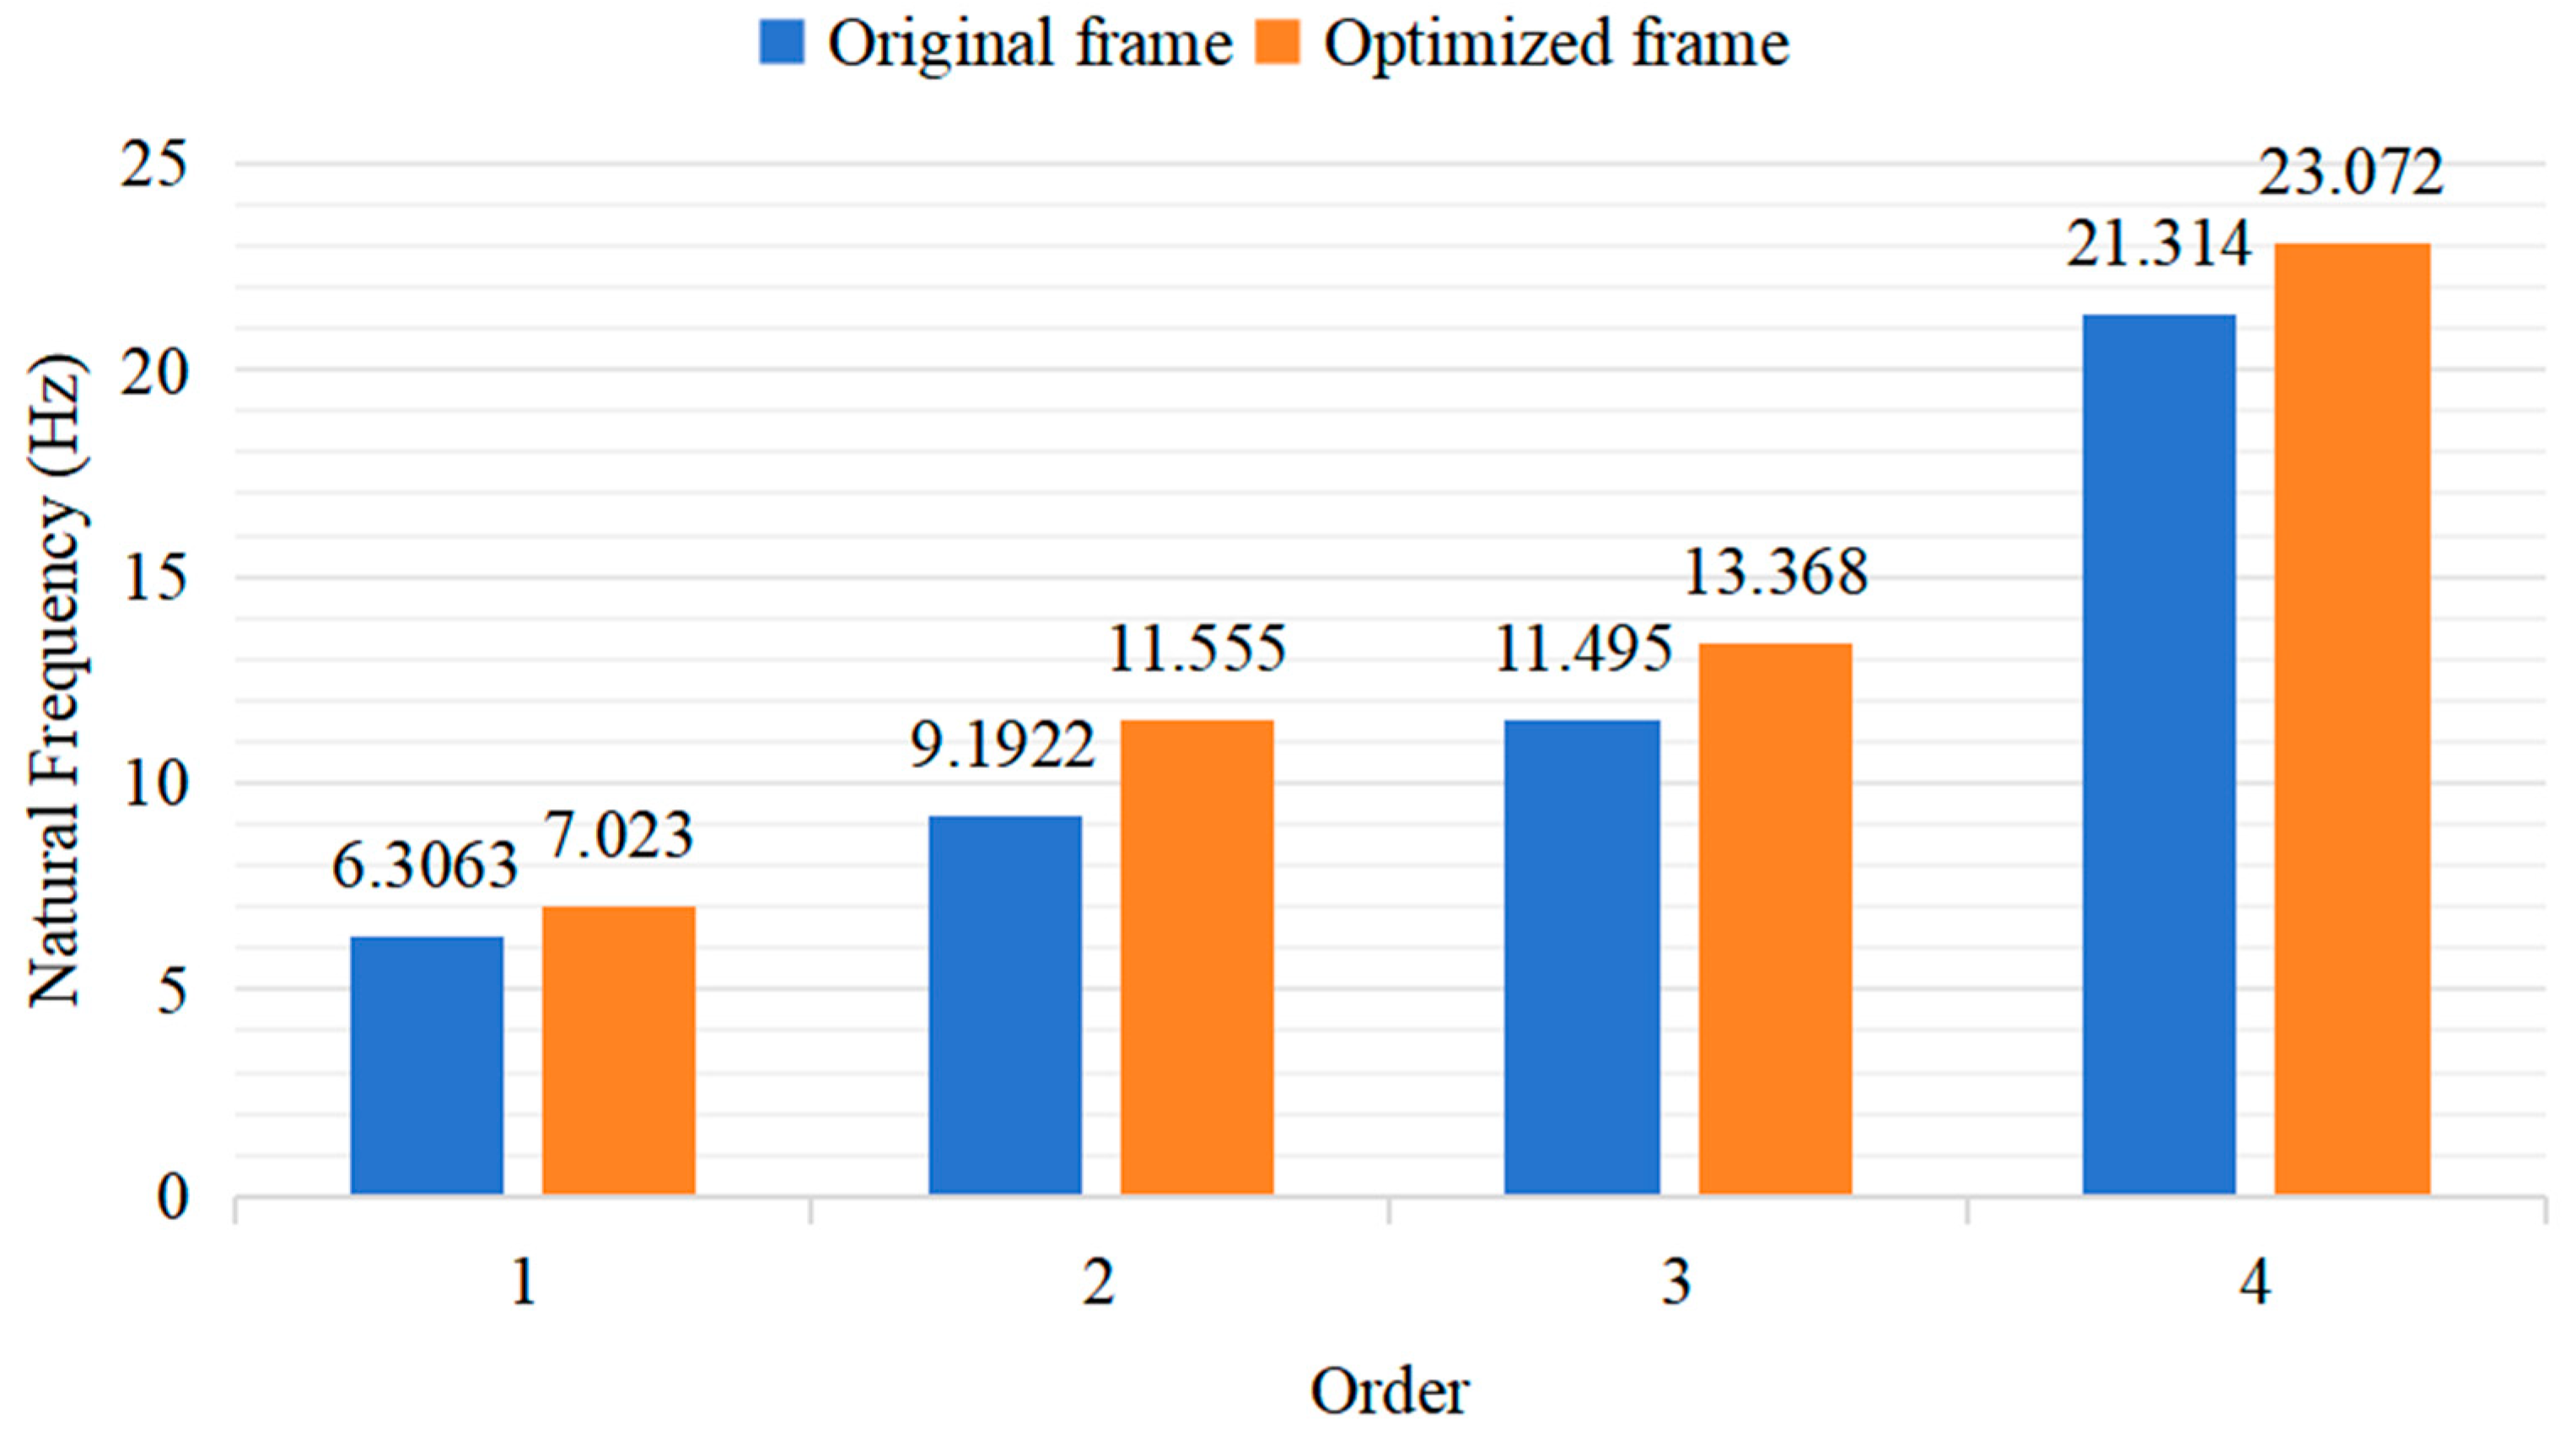
3.4.2. Comparison of Modal Analysis Results

Building upon the static analysis, the finite element model of the optimized frame was further subjected to modal analysis using Mechanical. This analysis was conducted without applying any loads or constraints. The objective was to determine the natural frequencies and corresponding mode shapes for the first four non-zero modes. The specific results are presented in Figure 15. Among them, the fourth natural frequency and mode of vibration of the optimized frame is shown in Figure 16.
Despite the increase in frame mass by 4.12%, the natural frequencies of the first four modes of the optimized frame increased by 11.36%, 25.70%, 16.29%, and 8.25%, respectively. These frequencies still remained above 3 Hz and below 40 Hz, indicating that the frame is not significantly affected by ground and harrowing machine vibration. In particular, the fourth mode frequency of the frame increased from 21.314 Hz to 23.072 Hz, effectively avoiding the vibration range of the harrowing machine’s shaft. This improvement indicates a significant reduction in resonance phenomena caused by the interaction between the frame and the stirring shaft. Therefore, the improvement brought about by the optimization plan was significant.

4. Discussion

In recent years, China has conducted extensive research on vibration reduction in agricultural machinery. The main method for vibration reduction is to analyze the vibration characteristics of the frame and optimize its structure [31]. This can effectively improve the vibration problems of agricultural machinery. However, due to the limitations of optimization methods and the complexity of mechanical equipment under actual working conditions, there is a certain deviation from theoretical analysis under ideal conditions [32]. Therefore, it is difficult to completely avoid the generation of resonance problems by optimizing the frame structure.
The research findings of this paper have, to some extent, addressed the issue of significant vibrations in the 1MSF-2.0 residual film recovery machine (manufacturered by World Heavy Industries (China) Co., Ltd, Zhenjiang, China). This improvement has enhanced the reliability and stability during residual film recovery operations, ensuring the effectiveness of the recovery process. However, there are still some issues that need to be addressed.
1. The size of the residual film recovery machine is relatively large. While improving the vibration problem, the problem of large mass still exists, which will lead to increased energy consumption and have an impact on the agricultural ecological environment. Therefore, a lightweight design of the frame of the residual film recovery machine is also necessary.
2. This paper only used the method of dimensional optimization to optimize the frame design. In addition to this, material selection, shape optimization, and topology optimization are also important methods for frame optimization, each with its advantages and disadvantages [24]. It is a future research issue to comprehensively apply dimensional optimization, shape optimization, and topology optimization methods to fully exploit the space of frame optimization design and obtain better optimization solutions.

5. Conclusions

This paper conducted static and modal analyses on the frame of the residual film recovery machine and optimized the thickness of the rectangular tube of the frame, obtaining the optimal solution for 16 design variables, which improved the vibration problem of the residual film recovery machine. The optimization design of the frame in this paper ensured that there was no significant change in the frame’s mass while ensuring its strength. Based on this, the fourth mode’s natural frequency of the frame was adjusted to avoid the frequency range of excitation forces, effectively improving the resonance issues during the operation of the frame. This enhancement has led to an improved reliability and stability of the frame, providing support for the efficient operation of the residual film recovery machine. The research in this paper mainly includes the following aspects.
1. The three-dimensional model of the frame was established using Autodesk Inventor Professional 2020, and the finite element model of the frame was established using Workbench 2020 R2. Static analysis was performed on the finite element model of the frame. The results of static analysis showed that the maximum stress of the frame was 92.46 MPa, indicating that the strength of the frame under static load met the requirements and had a certain optimization design space.
2. The finite element model of the frame was subjected to free modal analysis using Workbench 2020 R2, and the first 14 natural frequencies and mode shapes of the frame were obtained. Among them, the first four natural frequencies with significant influence on the vibration characteristics of the frame were 6.3063 Hz, 9.1922 Hz, 11.495 Hz, and 21.314 Hz. The accuracy of the modal analysis results was verified through modal experiments, with an absolute value of relative error within 8%. The frequency range of external excitation forces was analyzed, and it was found that the excitation force of the stirring shaft could cause frame resonance, thus proposing optimization strategies.
3. Dimensional optimization of the frame was performed using Workbench 2020 R2 to control the frame mass, ensure that the frame met the requirements of strength and stiffness, and avoid the frequency range of external excitation forces around the fourth natural frequency. The final optimization scheme was obtained. After optimization, the frame met the requirements of strength and stiffness, with a mass increase of 4.12%, which was not significant. The fourth natural frequency increased by 8.25%, avoiding the frequency range of external excitation forces, and the vibration problem was improved.
4. The forces acting on the residual film recovery machine during operation are highly complex. Conducting a more comprehensive analysis of the frame’s load distribution and establishing a more precise mechanical model will be crucial for future research on the 1MSF-2.0 residual film recovery machine. Additionally, given the numerous components present on the residual film recovery machine, optimizing the components outside the frame also holds significant importance.

Author Contributions

Conceptualization, X.W.; methodology, X.W.; software, T.H.; validation, T.H. and X.C.; formal analysis, T.H. and X.C.; investigation, T.H. and X.C.; resources, T.H. and X.C.; data curation, T.H. and X.C.; writing—original draft preparation, T.H.; writing—review and editing, X.W. and W.F.; visualization, X.W. and W.F.; supervision, X.W.; project administration, X.W. All authors have read and agreed to the published version of the manuscript.

Funding

This research was funded by the Key Technologies Research and Development Program (Grant NO. 2022YFD2002400), Key Scientific and Technological Projects in Key Areas of Corps (Grant NO. 2023AB014), the Agricultural Engineering Faculty of Jiangsu University (Grant NO. NZXB20200104), and Priority Academic Program Development of Jiangsu Higher Education Institutions (Grant NO. PAPD-2023).

Institutional Review Board Statement

Not applicable.

Data Availability Statement

The datasets used and/or analyzed during the current study are available from the corresponding author on reasonable request.

Conflicts of Interest

The authors declare no conflicts of interest.

References

  1. Chauhan, S.; Basnet, B.; Shrestha, A.K. Innovative farming techniques for superior okra yield in Chitwan, Nepal: The benefits of plastic film mulch and pest exclusion net on soil properties, growth, quality and profitability. Acta Ecol. Sin. 2023, 44, 23–32. [Google Scholar] [CrossRef]
  2. Liu, J.L.; Huang, X.Y.; Chen, H. Sustaining yield and mitigating methane emissions from rice production with plastic film mulching technique. Agric. Water Manag. 2021, 245, 106667. [Google Scholar] [CrossRef]
  3. Yang, J.L.; Ren, L.Q.; Zhang, P. Can soil organic carbon sequestration and carbon management index be improved by changing the film-mulching methods in semiarid region? J. Integr. Agric. 2023. [Google Scholar] [CrossRef]
  4. Yang, Y.; Bai, S.H.; Ma, S.T. Residual Film Recycling Machine Research and Analysis of the Collecting Device. Food Sci. Technol. Econ. 2018, 43, 79–81. [Google Scholar] [CrossRef]
  5. Ma, Z.; Zhang, Z.; Zhang, Z.; Song, Z.; Liu, Y.; Li, Y.; Xu, L. Durable Testing and Analysis of a Cleaning Sieve Based on Vibration and Strain Signals. Agriculture 2023, 13, 2232. [Google Scholar] [CrossRef]
  6. Zhang, Y.P.; Hu, Z.C.; You, Z.Y.; Gu, F.W.; Wu, F.; Chen, Y.Q. Comparative study on working performance of two kinds of residue plastic film collectors. Jiangsu Agric. Sci. 2018, 46, 179–182. [Google Scholar] [CrossRef]
  7. Li, Z.J.; Zheng, K.; Zheng, X.; Hao, Z.Y. Analysis of the Influence of Tooling on Constraint Modal Test of Front End Module. Noise Vib. Control 2019, 39, 150–154. [Google Scholar]
  8. Li, Y.M.; Sun, P.P.; Pang, J.; Xu, L.Z. Finite element mode analysis and experiment of combine harvester chassis. Trans. Chin. Soc. Agric. Eng. 2013, 29, 38–46+301. [Google Scholar]
  9. Gao, J.J.; Liu, Z.Y.; Gu, W.; Zhang, F.F.; Zhu, L.P.; Xu, J.X. Modal Analysis and Optimization of Grain Combine Harvester Undercarriage Frame. Mach. Des. Res. 2023, 39, 199–205. [Google Scholar] [CrossRef]
  10. Zhang, J.M.; Yao, H.P.; Xue, J.L. Vibration characteristics analysis and suspension parameter optimization of tractor/implement system with front axle sus-pension under ploughing operation condition. J. Terramech. 2022, 102, 49–64. [Google Scholar] [CrossRef]
  11. Wang, X.Z.; Cao, Y.H.; Fang, W.Q.; Sheng, H.R. Vibration Test and Analysis of Crawler Pepper Harvester under Multiple Working Conditions. Sustainability 2023, 15, 8112. [Google Scholar] [CrossRef]
  12. Liu, Y.C.; Guo, J.X.; Shi, Y.; Xie, J.H.; Qian, X.G.; Han, J. Finite element analysis and optimization of the frame of residual plastic film recycling machine. J. Chin. Agric. Mech. 2023, 44, 189–194. [Google Scholar] [CrossRef]
  13. Guo, J.X.; Liu, Y.C.; Wei, Y.J.; Zhou, J.; Shi, Y. Ration Characteristics Analysis and Structure Optimization of Integrated Straw Returning and Residual Film Recycling Machine. Trans. Chin. Soc. Agric. Eng. 2024, 40, 155–163. [Google Scholar] [CrossRef]
  14. Liang, C.J.; Wu, X.M.; Wang, P.Z.; Li, G.C.; Tao, P.J.; Zhang, F.G. Simulation design and experimental on frame and comb teeth of the residual plastic film picker. J. Anhui Agric. Univ. 2019, 46, 203–208. [Google Scholar] [CrossRef]
  15. Zhong, S.S.; Wang, Q.; Fang, H.F.; Wang, M.D. Modal Analysis of Roller in Used Mulch Shredder. Mech. Eng. 2018, 4, 43–45. [Google Scholar]
  16. Zhang, P.F.; Hu, C.; Wang, X.F.; Lu, B.; Liu, C.J. Kinetic Analysis of Rotary Tillage Nail Tooth Plastic Film Recycling Machine Hook Film Unit. J. Agric. Mech. Res. 2018, 40, 14–18+25. [Google Scholar] [CrossRef]
  17. Yu, Z.H.; Xu, G.M.; Wang, H.Y.; Niu, Y.P.; Cao, W.L. Force and modal analysis of film gathering device of residue film recycling machine. China South. Agric. Mach. 2021, 52, 70–71. [Google Scholar]
  18. Zhang, J.; Wang, T.Y.; Yao, X.X.; Luo, W.G.; Luo, J.G. Modal analysis and physical test verification of a certain type of automobile exhaust system. J. Guangxi Univ. Sci. Technol. 2023, 34, 1–6. [Google Scholar] [CrossRef]
  19. Wang, Y.L.; Dai, X.D.; Xie, Y.B. Modal Analysis of Multi-Cylinder Engine Block. J. Xi’an Jiaotong Univ. 2001, 35, 536–539. [Google Scholar]
  20. Han, Z.P.; Brownjohn, J.M.W.; Chen, J. Structural modal testing using a human actuator. Eng. Struct. 2020, 221, 111113. [Google Scholar] [CrossRef]
  21. Liang, J.; Zhao, D.F. Summary of the model analysis method. Mod. Manuf. Eng. 2006, 8, 139–141. [Google Scholar] [CrossRef]
  22. Zhou, M.; Wei, Z.; Wang, Z.; Sun, H.; Wang, G.; Yin, J. Design and Experimental Investigation of a Transplanting Mechanism for Super Rice Pot Seedlings. Agriculture 2023, 13, 1920. [Google Scholar] [CrossRef]
  23. Zhang, F.; Li, J.X.; Shi, J.S. Research on Subsynchronousr/Supersynchronous Oscillation Parameter Identification Based on Fundamental Synchrophasor: Spectrum Characteristics and Essential Issues. Trans. China Electrotech. Soc. 2024. [Google Scholar] [CrossRef]
  24. Cai, S.; Luo, Y.H.; Li, Q.L. State of the Art of Lightweight Technology in Agricultural Machinery and Its Development Trend. J. Mech. Eng. 2021, 57, 35–52. [Google Scholar]
  25. Liao, Y.Y.; Liao, B.Y. Lightweight Design of Hydro-Generator Upper Bracket Based on Sizing Optimization. Water Power 2019, 45, 91–94+117. [Google Scholar]
  26. Cao, Y.; Yu, Y.; Tang, Z.; Zhao, Y.; Gu, X.; Liu, S.; Chen, S. Multi-Tooth Cutting Method and Bionic Cutter Design for Broccoli Xylem (Brassica oleracea L. var. Italica Plenck). Agriculture 2023, 13, 1267. [Google Scholar] [CrossRef]
  27. Wang, F.; Liu, Y.; Li, Y.; Ji, K. Research and Experiment on Variable-Diameter Threshing Drum with Movable Radial Plates for Combine Harvester. Agriculture 2023, 13, 1487. [Google Scholar] [CrossRef]
  28. Zhu, M.T.; He, Z.G.; Xu, L.; Li, Z.B. Mode Analysis of Car-body and Its Correlative Research Shape. Trans. Chin. Soc. Agric. Mach. 2004, 3, 13–15+19. [Google Scholar]
  29. Palumbo, A.; Polito, T.; Marulo, F. Experimental modal analysis and vibro-acoustic testing at leonardo laboratories. Mater. Today Proc. 2021, 34, 24–30. [Google Scholar] [CrossRef]
  30. Zhang, K.P.; Shao, L.; Lv, J.C.; Deng, C. Modal Analysis on the Frame of Tractor. Automob. Appl. Technol. 2012, 1, 35–39. [Google Scholar]
  31. Hao, S.; Tang, Z.; Guo, S.; Ding, Z.; Su, Z. Model and Method of Fault Signal Diagnosis for Blockage and Slippage of Rice Threshing Drum. Agriculture 2022, 12, 1968. [Google Scholar] [CrossRef]
  32. Fang, C.; Zhao, S.Y.; Yan, G.; Qing, G.F. Multi-Objective Topology Optimization, Size Optimization and Detailed Design of Frame for an Electric Car. Mach. Des. Manuf. 2023, 8, 16–22. [Google Scholar] [CrossRef]
Figure 1. The three-dimensional model of the frame.
Agriculture 14 00543 g001
Figure 2. Finite element model of the frame: (a) The overall meshing of the frame. (b) The meshing of the upper crossbeam of the frame.
Agriculture 14 00543 g002
Figure 3. Experimental setup for torque measurement: 1. TQ201 wireless torque sensor node and 2. battery.
Agriculture 14 00543 g003
Figure 4. The schematic diagram of load application positions: 1. Baling machine bearing seat, 2. peel-off roller bearing seat, 3. transport roller bearing seat, 4. picking support side plate, and 5. straw grinder connection hole.
Agriculture 14 00543 g004
Figure 5. The positions of 18 measurement points and 1 excitation point in modal testing.
Agriculture 14 00543 g005
Figure 6. The experimental instruments: (a) Data acquisition system section: 1. force hammer, 2. accelerometer bus, 3. DH5902N rugged data acquisition system, and 4. laptop. (b) Sensor section: 2. accelerometer bus and 5. accelerometer.
Agriculture 14 00543 g006
Figure 7. The acceleration–time domain signals collected by the triaxial accelerometer sensor.
Agriculture 14 00543 g007
Figure 8. The results of the spectrum analysis and frequency response analysis.
Agriculture 14 00543 g008
Figure 9. The positions of the 16 design variables.
Agriculture 14 00543 g009
Figure 10. The results of static analysis of the frame: (a) stress analysis contour plots; (b) strain analysis contour plots; and (c) total deformation analysis contour plots.
Agriculture 14 00543 g010aAgriculture 14 00543 g010b
Figure 11. The first four modes of the frame in calculated modal analysis: (a) mode 1, (b) mode 2, (c) mode 3, and (d) mode 4.
Agriculture 14 00543 g011aAgriculture 14 00543 g011b
Figure 12. The first four modes of the frame in test modal analysis: (a) mode 1, (b) mode 2, (c) mode 3, and (d) mode 4.
Agriculture 14 00543 g012
Figure 13. The samples from the optimization results.
Agriculture 14 00543 g013
Figure 14. The results of static analysis of the optimized frame: (a) stress analysis contour plots; (b) strain analysis contour plots; and (c) total deformation analysis contour plots.
Agriculture 14 00543 g014
Figure 15. Comparison of first four natural frequencies before and after optimization.
Agriculture 14 00543 g015
Figure 16. The fourth natural frequency and mode of vibration of the optimized frame.
Agriculture 14 00543 g016
Table 1. The positions, magnitudes, directions, and loading modes of the loads.
PositionsMagnitudes/NDirectionsLoading Modes
Picking support side plate7298Vertical downwardUniformly distributed load
Picking support side plate2500Horizontal backwardUniformly distributed load
Peel-off roller bearing seat3310Vertical downwardUniformly distributed load
Baling machine bearing seat8388Vertical downwardUniformly distributed load
Transport roller bearing seat2992Vertical downwardUniformly distributed load
Straw grinder connection hole2500Horizontal forwardUniformly distributed load
Table 2. Comparison between calculated modal analysis and test modal analysis.
OrderCalculated Modal AnalysisTest Modal AnalysisRelative Error/%
Calculated FrequencyMode ShapesTest FrequencyMode Shapes
16.306Torsion5.859Torsion7.093
29.192Bending7.813Bending5.004
311.495Bending11.603Bending−0.940
421.314Bending21.908Bending−2.787
535.302Bending35.157Bending0.411
642.909Bending41.415Bending3.482
750.949Bending51.055Bending−0.208
853.713Bending54.751Bending−1.932
961.642Bending61.908Bending−0.432
1069.063Torsion, Bending67.563Bending2.172
1176.664Bending76.730Bending−0.086
1283.454Torsion82.028Torsion1.709
1392.378Bending92.631Bending−0.274
1495.845Torsion, Bending95.334Bending0.533
Table 3. Comparison of design variable values before and after optimization.
Design VariablesBefore Optimization/mmAfter Optimization/mmIncrement/mm
Steel Tubes 1550
Steel Tubes 2572
Steel Tubes 3550
Steel Tubes 454−1
Steel Tubes 554−1
Steel Tubes 6550
Steel Tubes 754−1
Steel Tubes 8572
Steel Tubes 9572
Steel Tubes 10561
Steel Tubes 11561
Steel Tubes 12550
Steel Tubes 13550
Steel Tubes 14550
Steel Tubes 15550
Steel Tubes 16550
Disclaimer/Publisher’s Note: The statements, opinions and data contained in all publications are solely those of the individual author(s) and contributor(s) and not of MDPI and/or the editor(s). MDPI and/or the editor(s) disclaim responsibility for any injury to people or property resulting from any ideas, methods, instructions or products referred to in the content.

