Article

Transcriptome Sequencing Provides Insights into High-Temperature-Induced Leaf Senescence in Herbaceous Peony

College of Horticulture and Landscape Architecture, Yangzhou University, Yangzhou 225009, China
*
Author to whom correspondence should be addressed.
These authors contributed equally to this work.
Agriculture 2024, 14(4), 574; https://doi.org/10.3390/agriculture14040574
Submission received: 10 January 2024 / Revised: 22 March 2024 / Accepted: 2 April 2024 / Published: 3 April 2024
(This article belongs to the Section Genotype Evaluation and Breeding)

Abstract

:
Global warming causes frequent high temperatures in summer; which negatively impacts herbaceous peonies (Paeonia lactiflora Pall.) by accelerating leaf senescence and reducing biomass accumulation, leading to reduced flower quality in the subsequent year. Our findings revealed that as heat stress progressed, the high-temperature-sensitive cultivar ‘Meigui Zi’ (MGZ) exhibited a higher rate of chlorophyll content reduction and more pronounced premature aging symptoms than the high-temperature-tolerant cultivar ‘Chi Fen’ (CF). To investigate gene expression differences between CF and MGZ under high-temperature stress, we combined PacBio Iso-Seq sequencing (Iso-Seq) with next-generation sequencing (RNA-seq). Iso-seq yielded 352,891 full-length transcripts ranging from 61 bp to 49,022 bp in length. RNA-seq generated 257,562 transcripts across all samples. Further analysis revealed that differentially expressed genes (DEGs) between CF and MGZ were primarily enriched in “Photosynthesis”, with most photosynthesis-related DEGs highly expressed in CF. This indicates that CF has higher stability in its photosystem compared with MGZ, which is crucial for mitigating leaf senescence caused by high temperatures. Additionally, the highly expressed chlorophyll degradation genes stay-green (SGR) and stay-green-like (SGRL) in MGZ may be involved in chlorophyll content reduction induced by high temperature. This study preliminarily revealed the molecular mechanism of high-temperature-induced leaf senescence of in herbaceous peony and provided candidate genes for further studies of the regulation mechanism of high -temperature-induced leaf senescence.

1. Introduction

Global warming increases the frequency of extremely hot weather, which not only limits the survival ability of plants but also has profound impacts on their yield and quality [1,2]. Understanding the negative impact of high-temperature stress on plants not only helps us better address the challenges brought by climate change but also provides a theoretical basis for breeding high-temperature-tolerant plant cultivars. The leaf serves as the primary site of photosynthesis in plants, and the physiological status of leaves directly influences both their overall growth and development [3]. Consequently, investigating high-temperature stress in plant leaves has become a top research priority [4,5].
The effects of high temperatures on plant leaves have been extensively studied over the past few decades; researchers have found that prolonged or intense high-temperature conditions can trigger a series of physiological and biochemical reactions in plant leaves, including the accumulation of reactive oxygen species, cell membrane damage, and reduced enzyme activity [6,7]. Additionally, high temperatures accelerate the activities of chlorophyll degradation enzymes, leading to chlorophyll instability and resulting in accelerated degradation and reduced photosynthetic efficiency [8,9]. These reactions severely affect leaf growth and function, often resulting in premature aging characteristics known as high-temperature-induced leaf senescence. High-temperature-induced leaf senescence greatly affects the growth and biomass accumulation of plants [10,11]. However, there is currently a lack of systematic understanding regarding the molecular mechanisms underlying this phenomenon. Leaf senescence is a natural and intricately regulated process in plants, involving complex molecular mechanisms such as gene expression, hormone signaling, cellular metabolism, and cell death [12,13]. Chlorophyll degradation is a marker of leaf senescence initiation, during which chlorophyll catabolic enzyme genes (CCGs) are activated [14,15,16]. Whether high-temperature-induced leaf senescence shares the same regulatory mechanisms as natural leaf senescence remains to be investigated.
With the continuous advancement of transcriptomic sequencing technology, researchers can now analyze dynamic changes in plant gene expression under high-temperature conditions more effectively [17,18]. This is of great significance for unraveling the complex response network of leaf senescence in plants under high-temperature stress. Next-generation sequencing has been widely used because of its high accuracy and high throughput [19,20]. However, the limitation of short read lengths severely restricts its application in species with complex genome structures and a lack of reference genome sequences. Third-generation sequencing successfully compensates for the shortcomings of next-generation sequencing by offering longer read lengths [21]. Therefore, in plant transcriptomic studies, there has been a gradual shift from solely relying on next-generation sequencing technology to incorporating a comprehensive analysis that combines next-generation sequencing with third-generation sequencing technologies. For instance, Qian et al. have employed a blend of Single-Molecule Sequencing in Real Time (SMRT)and Illumina RNA sequencing methodologies to acquire fresh perspectives on the reactions to elevated temperature stress and their correlation with leaf senescence in tall fescue [22]. Similarly, Chang et al. employed SMRT and Illumina RNA sequencing methods to provide fresh perspectives on the regulatory mechanisms underlying tree peony flower formation and bud development [23].
Herbaceous peony (Paeonia lactiflora Pall.) is highly valued in both traditional Chinese medicine and the global market for its aesthetic qualities as a cut flower. Against the backdrop of global warming, leaf senescence induced by high temperature in summer reduces the biomass accumulation of herbaceous peony, resulting in a decline in both yield and quality in the following year. In previous studies, we obtained initial insights into the biochemical and molecular reactions of P. lactiflora to high-temperature stress [24]. We also identified successful approaches to mitigating the growth suppression induced by high temperatures, such as the application of shading and trehalose treatments [25,26]. Furthermore, we verified the important functions of heat shock protein 70 kDa (PlHSP70), mitogen-activated protein kinase (PlMAPK1), and tryptophan decarboxylase (PlTDC) in enhancing herbaceous peony’s resistance to high-temperature stress [27,28,29]. Although there have been some studies conducted on the effects of high-temperature stress on herbaceous peonies, a significant knowledge gap still exists regarding the specific molecular mechanisms underlying leaf senescence in herbaceous peony under summer high-temperature conditions. Given the complex genomic structure and lack of reference genome sequences, this research employed a combination of PacBio Iso-Seq sequencing and next-generation sequencing techniques. Our objective was to investigate the diverse molecular processes occurring in high-temperature-tolerant and high-temperature-sensitive cultivars under summer high-temperature stress, elucidating the underlying molecular mechanisms responsible for leaf senescence in herbaceous peony. This will yield insights for devising innovative genetic enhancement strategies, ultimately fostering sustainable development within the herbaceous peony industry.

2. Materials and Methods

2.1. Plant Materials

The herbaceous peony high-temperature-resistant cultivar ‘Chi Fen’ (CF) and high-temperature-sensitive cultivar ‘Meigui Zi’ (MGZ) were selected for this study. The leaves were collected from the germplasm repository of the College of Horticulture and Landscape Architecture, Jiangsu Province, China (32°30′ N, 119°25′ E) during two different time points when natural high-temperature stress occurred. These time points were June (S1), with an average temperature of 32 °C/23 °C, and July (S2), with an average temperature of 34 °C/26 °C in the year 2022. At every sampling time point, three distinct plant specimens from each cultivar were gathered on-site. Consequently, a total of 12 samples were acquired. Subsequently, each sample was divided into two sets: one set was utilized used for to quantifying pigment levels, while the other set was promptly frozen using liquid nitrogen to facilitate transcriptome sequencing.

2.2. Quantification of Chlorophyll Content

The quantification of chlorophyll contents was conducted by the experimental procedure described by Liu (2023) [30] with some modifications. For each sample, 0.2 g (referred to as FW) chopped leaves were immersed in 8 mL (referred to as V) of 95% ethanol (Sinopharm Chemical Reagent Co. Ltd., Shanghai, China) in a light-free environment until the tissue became colorless. The resulting extract solution was vigorously shaken, filtered through a filter paper, and collected for subsequent analysis. The levels of chlorophyll were evaluated by measuring the absorbance of the extract solution at specific wavelengths, including 665 nm, 649 nm, and 470 nm (referred to as A665, A649, and A470, respectively). The concentrations of chlorophyll a (Ca) and chlorophyll b (Cb) in the extract solution were determined using the following equations: Ca = 13.95A665 − 6.88A649, Cb = 24.96A649 − 7.32A665. The content of chlorophyll a in the tissue was calculated as Ca × V/FW, while for chlorophyll b it was Cb × V/FW.

2.3. PacBio Iso-Seq Library Preparation and Sequencing

The TRIzol reagent (Invitrogen, Carlsbad, CA, USA) was used to extract total RNA, followed by treatment with DNase I (RNA-free). To guarantee the precision of sequencing data, an initial evaluation of mRNA integrity was performed using electrophoresis in a 1.5% agarose gel. Subsequently, quantification was performed using both the NanoDrop2000 spectrophotometer (Thermo Fisher, Waltham, MA, USA) and the Bioanalyzer 2100 system (Agilent, Santa Clara, CA, USA), thereby ensuring reliable results. The library preparation was performed in accordance with the isoform sequencing protocol (Iso-Seq) provided by Pacific Biosciences (Pacific Biosciences, Menlo Park, CA, USA). Specifically, equal mole amounts of RNA samples were pooled together to create an RNA pool. The UMI base PCR cDNA Synthesis Kit is designed to efficiently produce high-quality full-length cDNAs and was employed to perform the reverse transcription of the total mRNAs into cDNAs. Next, the cDNA products were subjected to purification to prepare a library. This involved annealing a sequencing primer and introducing polymerase to the template along with attached primers. The template bound to the polymerase was immobilized onto MagBeads before performing SMRT sequencing with the Pacific Bioscience Sequel System. To process and analyze sequence movie files, we used the PacBio SMRT Analysis Server, which provided the maximum possible yield of the consensus sequences for subsequent steps by focusing on reads of insert (ROIs). The ICE algorithm, which operates at the isoform level, was employed to rectify errors in the isoform sequences of the full-length non-chimeric ROIs using the Quiver software (ver. 3.2.7). Finally, the cd-hit-est software (ver. 4.8.1) was employed to combine consensus transcripts of excellent quality from both samples and eliminate duplication to acquire the ultimate isoforms for subsequent analysis.

2.4. Next-Generation Library Preparation and Sequencing

Our mRNA extraction method was consistent with the one described in Section 2.3. Approximately 10 ug of mRNAs per sample was used to construct sequencing libraries, with index codes incorporated to assign sequences to their respective samples. Magnetic beads attached to poly-T oligos were used to purify mRNAs. Random hexamer primers were used to synthesize first-strand cDNAs from the complete set of mRNAs. Subsequently, PCR amplification was performed after end repair, adaptor ligation, and incorporating index codes for individual samples. Denaturation resulted in the generation of single-stranded PCR products. Subsequently, a reaction system and program were established for circularization. As a result, cyclized products consisting of single-stranded DNA were generated, while any linear DNA molecules that were not cyclized underwent digestion. Rolling cycle amplification facilitated single-stranded circular DNA molecule replication, generating a DNA nanoball (DNB) comprising numerous DNA copies. A high-intensity DNA nanochip technique was employed to load DNBs with sufficient quality onto patterned nanoarrays, which were then subjected to sequencing using combinatorial Probe–Anchor Synthesis (cPAS). Twelve cDNA libraries underwent preparation and sequencing using the DNBSEQ platform. The fastq format raw data (raw reads) were initially processed using SOAPnuke (ver. 1.5.2). At this stage, we produced high-quality reads by removing those with adapters, unknown bases exceeding 10%, and low quality. Afterward, these refined reads were matched to PacBio isoform sequences using Bowtie 2 (ver. 2.2.5).

2.5. Quantitative Real-Time PCR (qRT-PCR) Analysis

The transcriptome sequencing of each sample involved the treatment of 1μg total RNA with DNase and its conversion into cDNA following the instructions provided by the manufacturer (Vazyme, Nanjing, China). The ChamQ SYBR qRCR Master MIX kit (Vazyme, Nanjing, China) was utilized for real-time quantitative PCR (qPCR) assays in technical duplicates on a Biorad CFX Connect thermocycler (Bio Rad, Munich, Germany). The specific primers utilized are listed in Table S1, while β-actin was used as an internal reference gene. To assess changes in gene expression levels comparatively, we employed the 2−ΔΔCT method [31].

2.6. Data Analysis

The data are expressed representing three replicates. The differences between the means were evaluated using Duncan’s multiple range test performed with the SPSS 25.0 software (IBM, Armonk, NY, USA), and a significance level of p < 0.05 was deemed significant. Functional annotations were performed on all transcripts using BLAST similarity searches against multiple databases, such as NCBI NR (non-redundant protein sequences), Swiss-Prot (a manually curated and reviewed protein sequence database), and KOG (clusters of euKaryotic Orthologous Groups). The E-value threshold used was 10−5 to obtain the NR, Swiss-Prot, and KOG annotations. To assign Gene Ontology (GO) terms, we employed Blast2GO (https://www.blast2go.com/ accessed on 9 January 2024) to map the sequences. Furthermore, the KEGG Automatic Annotation Server (KAAS) was used to conduct KEGG pathway analysis. The DESeq2 R package [32] was employed to identify differentially expressed genes (DEGs), which were defined as genes with |log2 (Fold Change)| ≥ 1 and an adjusted p-value ≤ 0.05. The COR program in R was used to analyze the Pearson correlation coefficient of gene expression levels among all pairs of samples.

3. Results

3.1. Phenotypic Analysis of CF and MGZ under High-Temperature Stress

Leaves experience chlorosis because of elevated temperatures during the summer season. Our analysis of pigment profiles indicated a slight decline in chlorophyll a and chlorophyll b levels as high-temperature stress progressed in CF. Specifically, at S1, the content measured at 0.87 mg/g FW for chlorophyll a and 0.32 mg/g FW for chlorophyll b, which decreased to 0.84 mg/g FW and 0.31 mg/g FW, respectively, at S2. In MGZ, there was a significant reduction in both chlorophyll a and chlorophyll b content from 0.42 mg/g FW and 0.14 mg/g at S1 to 0.26 mg/g and 0.08 mg/g FW, respectively, at S2. Similarly, while the levels of chlorophyll a and b remained stable in CF leaves, they noticeably decreased from 0.57 mg/g FW at S1 to 0.36 mg/g FW at S2 in MGZ leaves. Therefore, high- temperature stress could reduce the chlorophyll content of herbaceous peony, especially for high-temperature-sensitive cultivars (Figure 1).

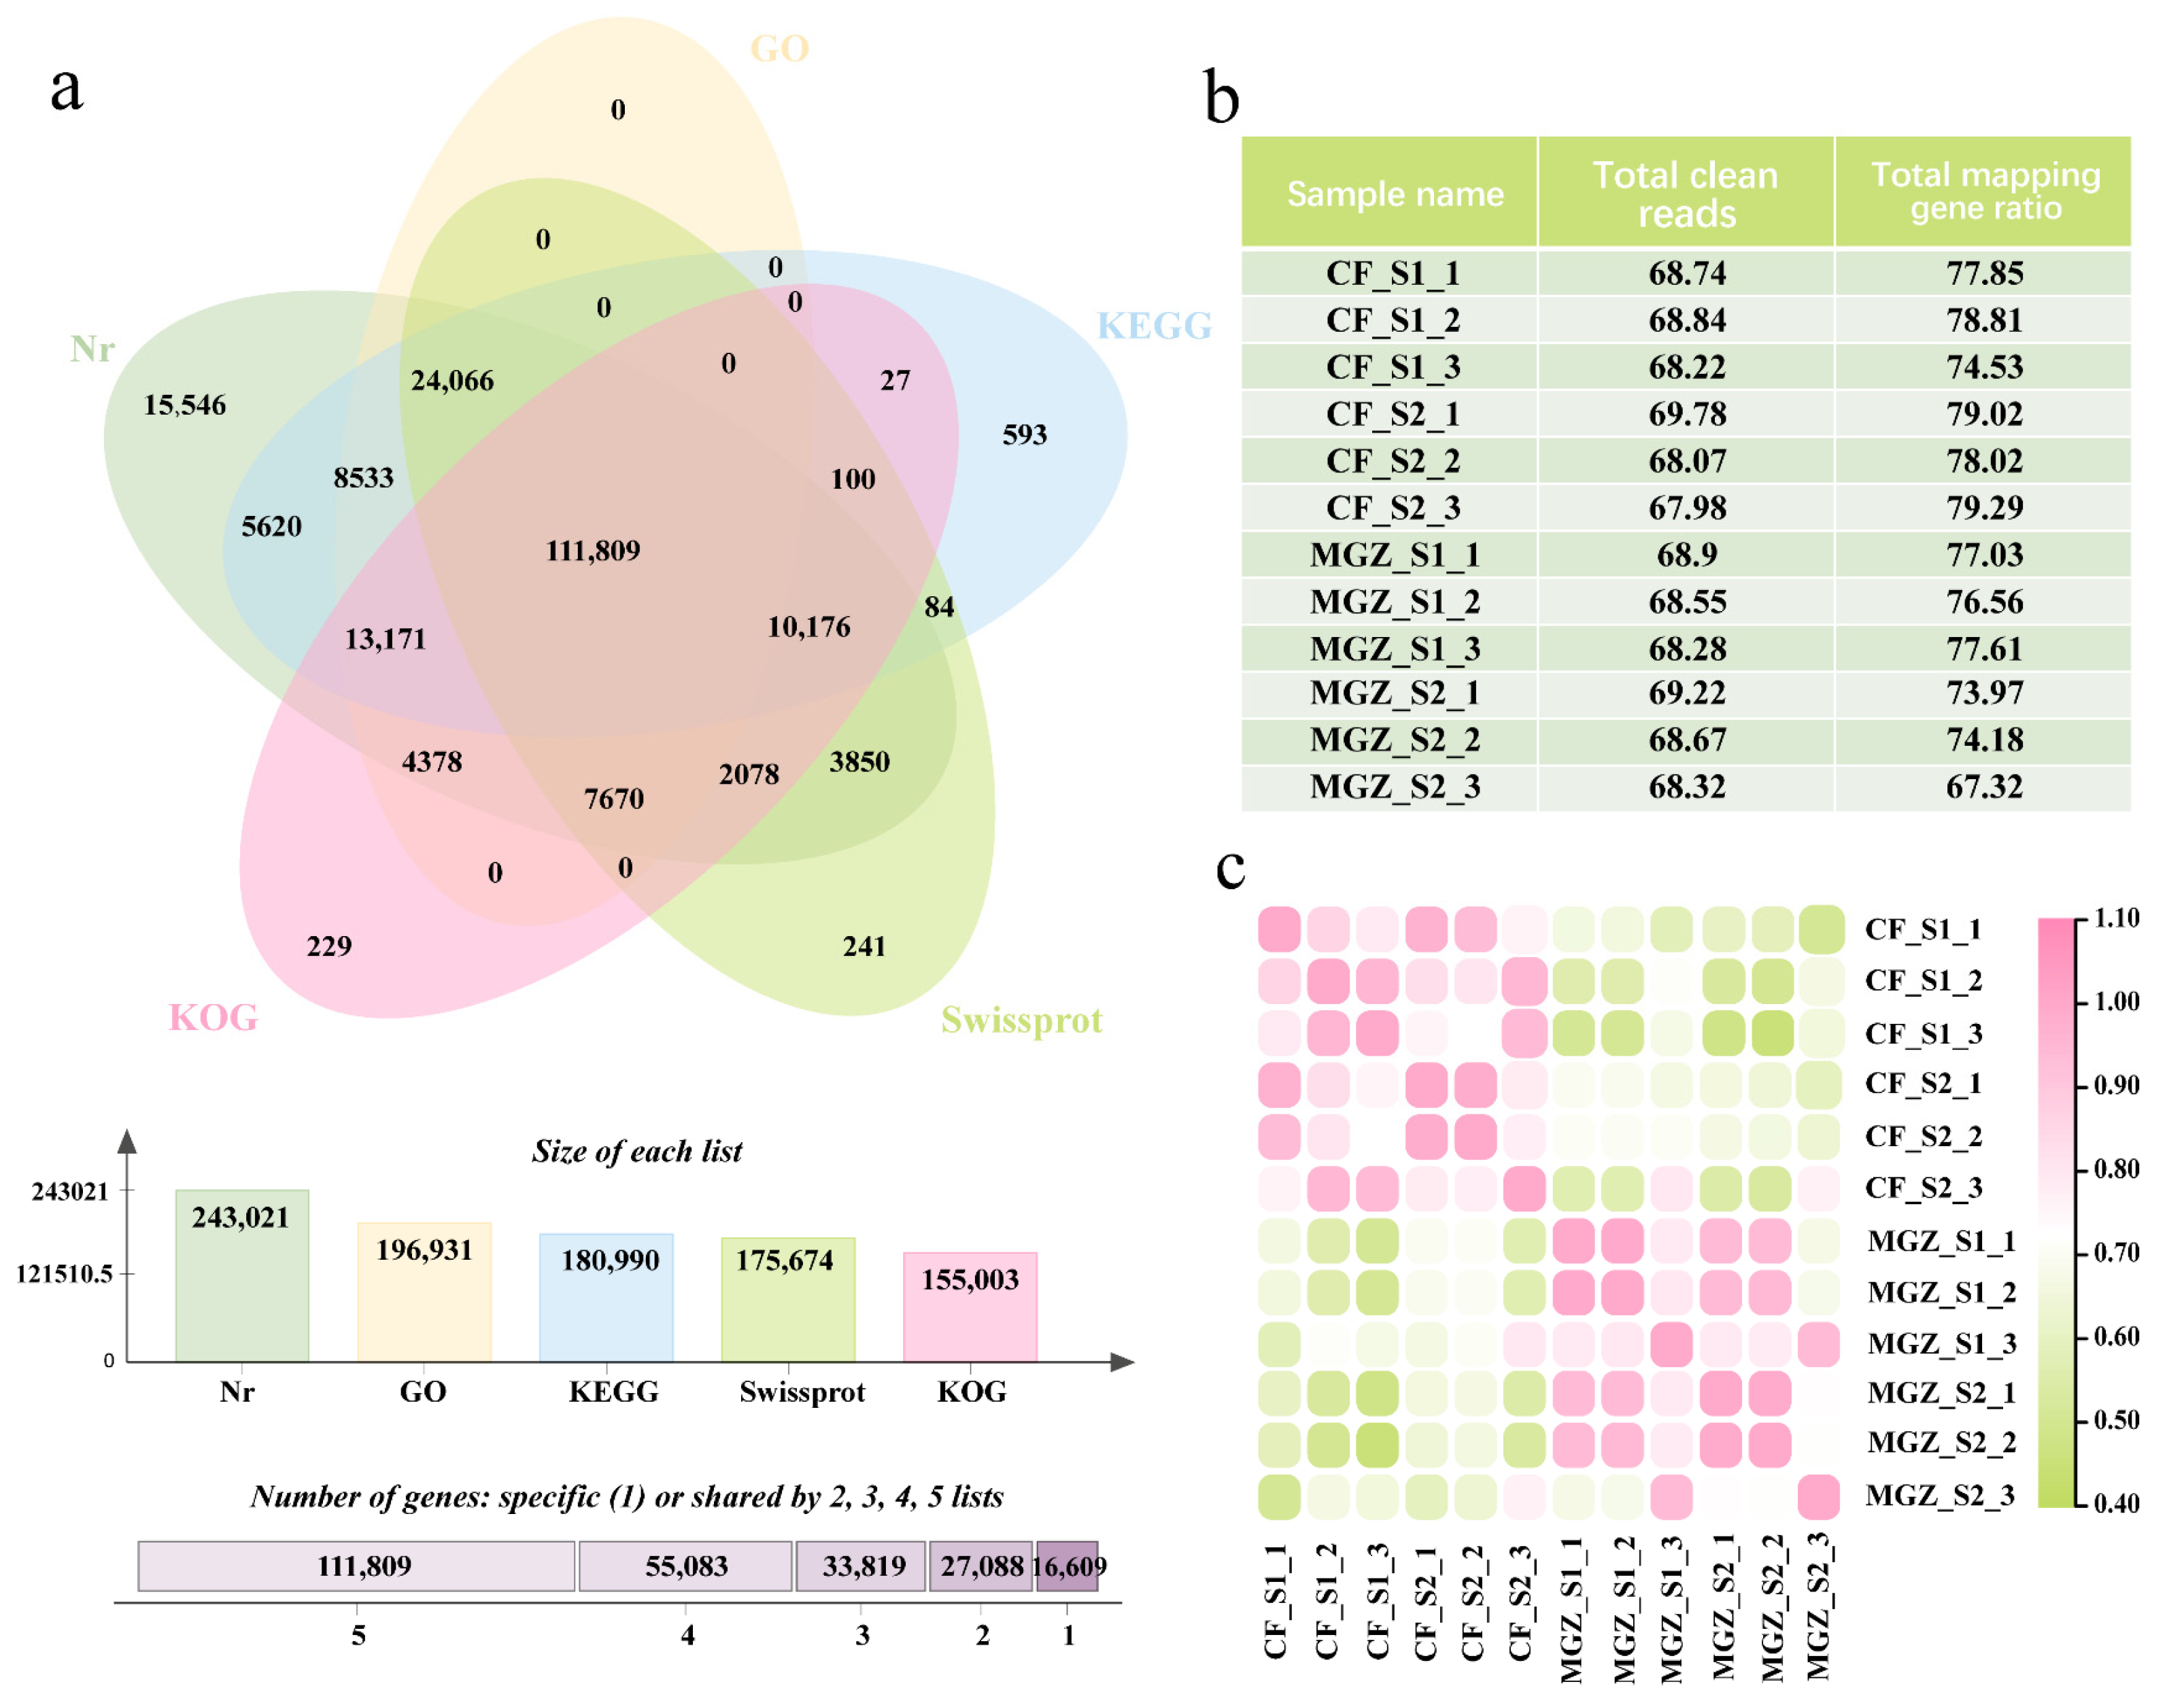
3.2. Combined PacBio Iso-Seq Sequencing with Next-Generation Sequencing

To comprehensively cover the herbaceous peony transcriptome, mRNAs from the leaves of two herbaceous peony cultivars were mixed. A PacBio Iso-Seq library was constructed, generating 61.59 GB bases for 688,147 multi-pass read insertions (ROIs). After applying the filtration process, a comprehensive collection of 352,891 isoforms was acquired, exhibiting diverse lengths spanning from 61 bp to 49,022 bp. Then, a comprehensive search was conducted on all 352,891 isoforms across five publicly available protein databases: NR, Swiss-Prot, KOG, GO, and KEGG. Significant hits in the Nr database were found for 243,021 (68.87%) transcripts; the GO database had hits for 196,931 (55.81%); the KEGG database had hits for 180,990 (51.29%); the Swissprot database had hits for 175,674 (49.78%); and the KOG database had hits for 155,003 (43.92%). In total, 111,809 (31.68%) transcripts were successfully annotated in all five databases (Figure 2a).
To ensure comprehensive sequence information, we employed the DNBSEQ platform to simultaneously sequence high-quality mRNAs intended for PacBio sequencing. Each sample yielded an average of 68.63 MB base pairs. Subsequently, the filtered sequences from each sample were aligned against the PacBio isoforms, resulting in a remarkable mapping rate ranging from 67.32% to 79.29% for DNBSEQ reads (Figure 2b). Consequently, 257,562 genes were identified across all 12 samples.
The Pearson correlation coefficient was employed to evaluate the relationship between gene expression in every pair of samples. The findings demonstrated a strong positive correlation between three samples from the same cultivar and sampling point, indicating excellent experimental reproducibility. Furthermore, a low correlation observed between the different cultivar samples suggested significant differences in gene expression between CF and MGZ (Figure 2c).

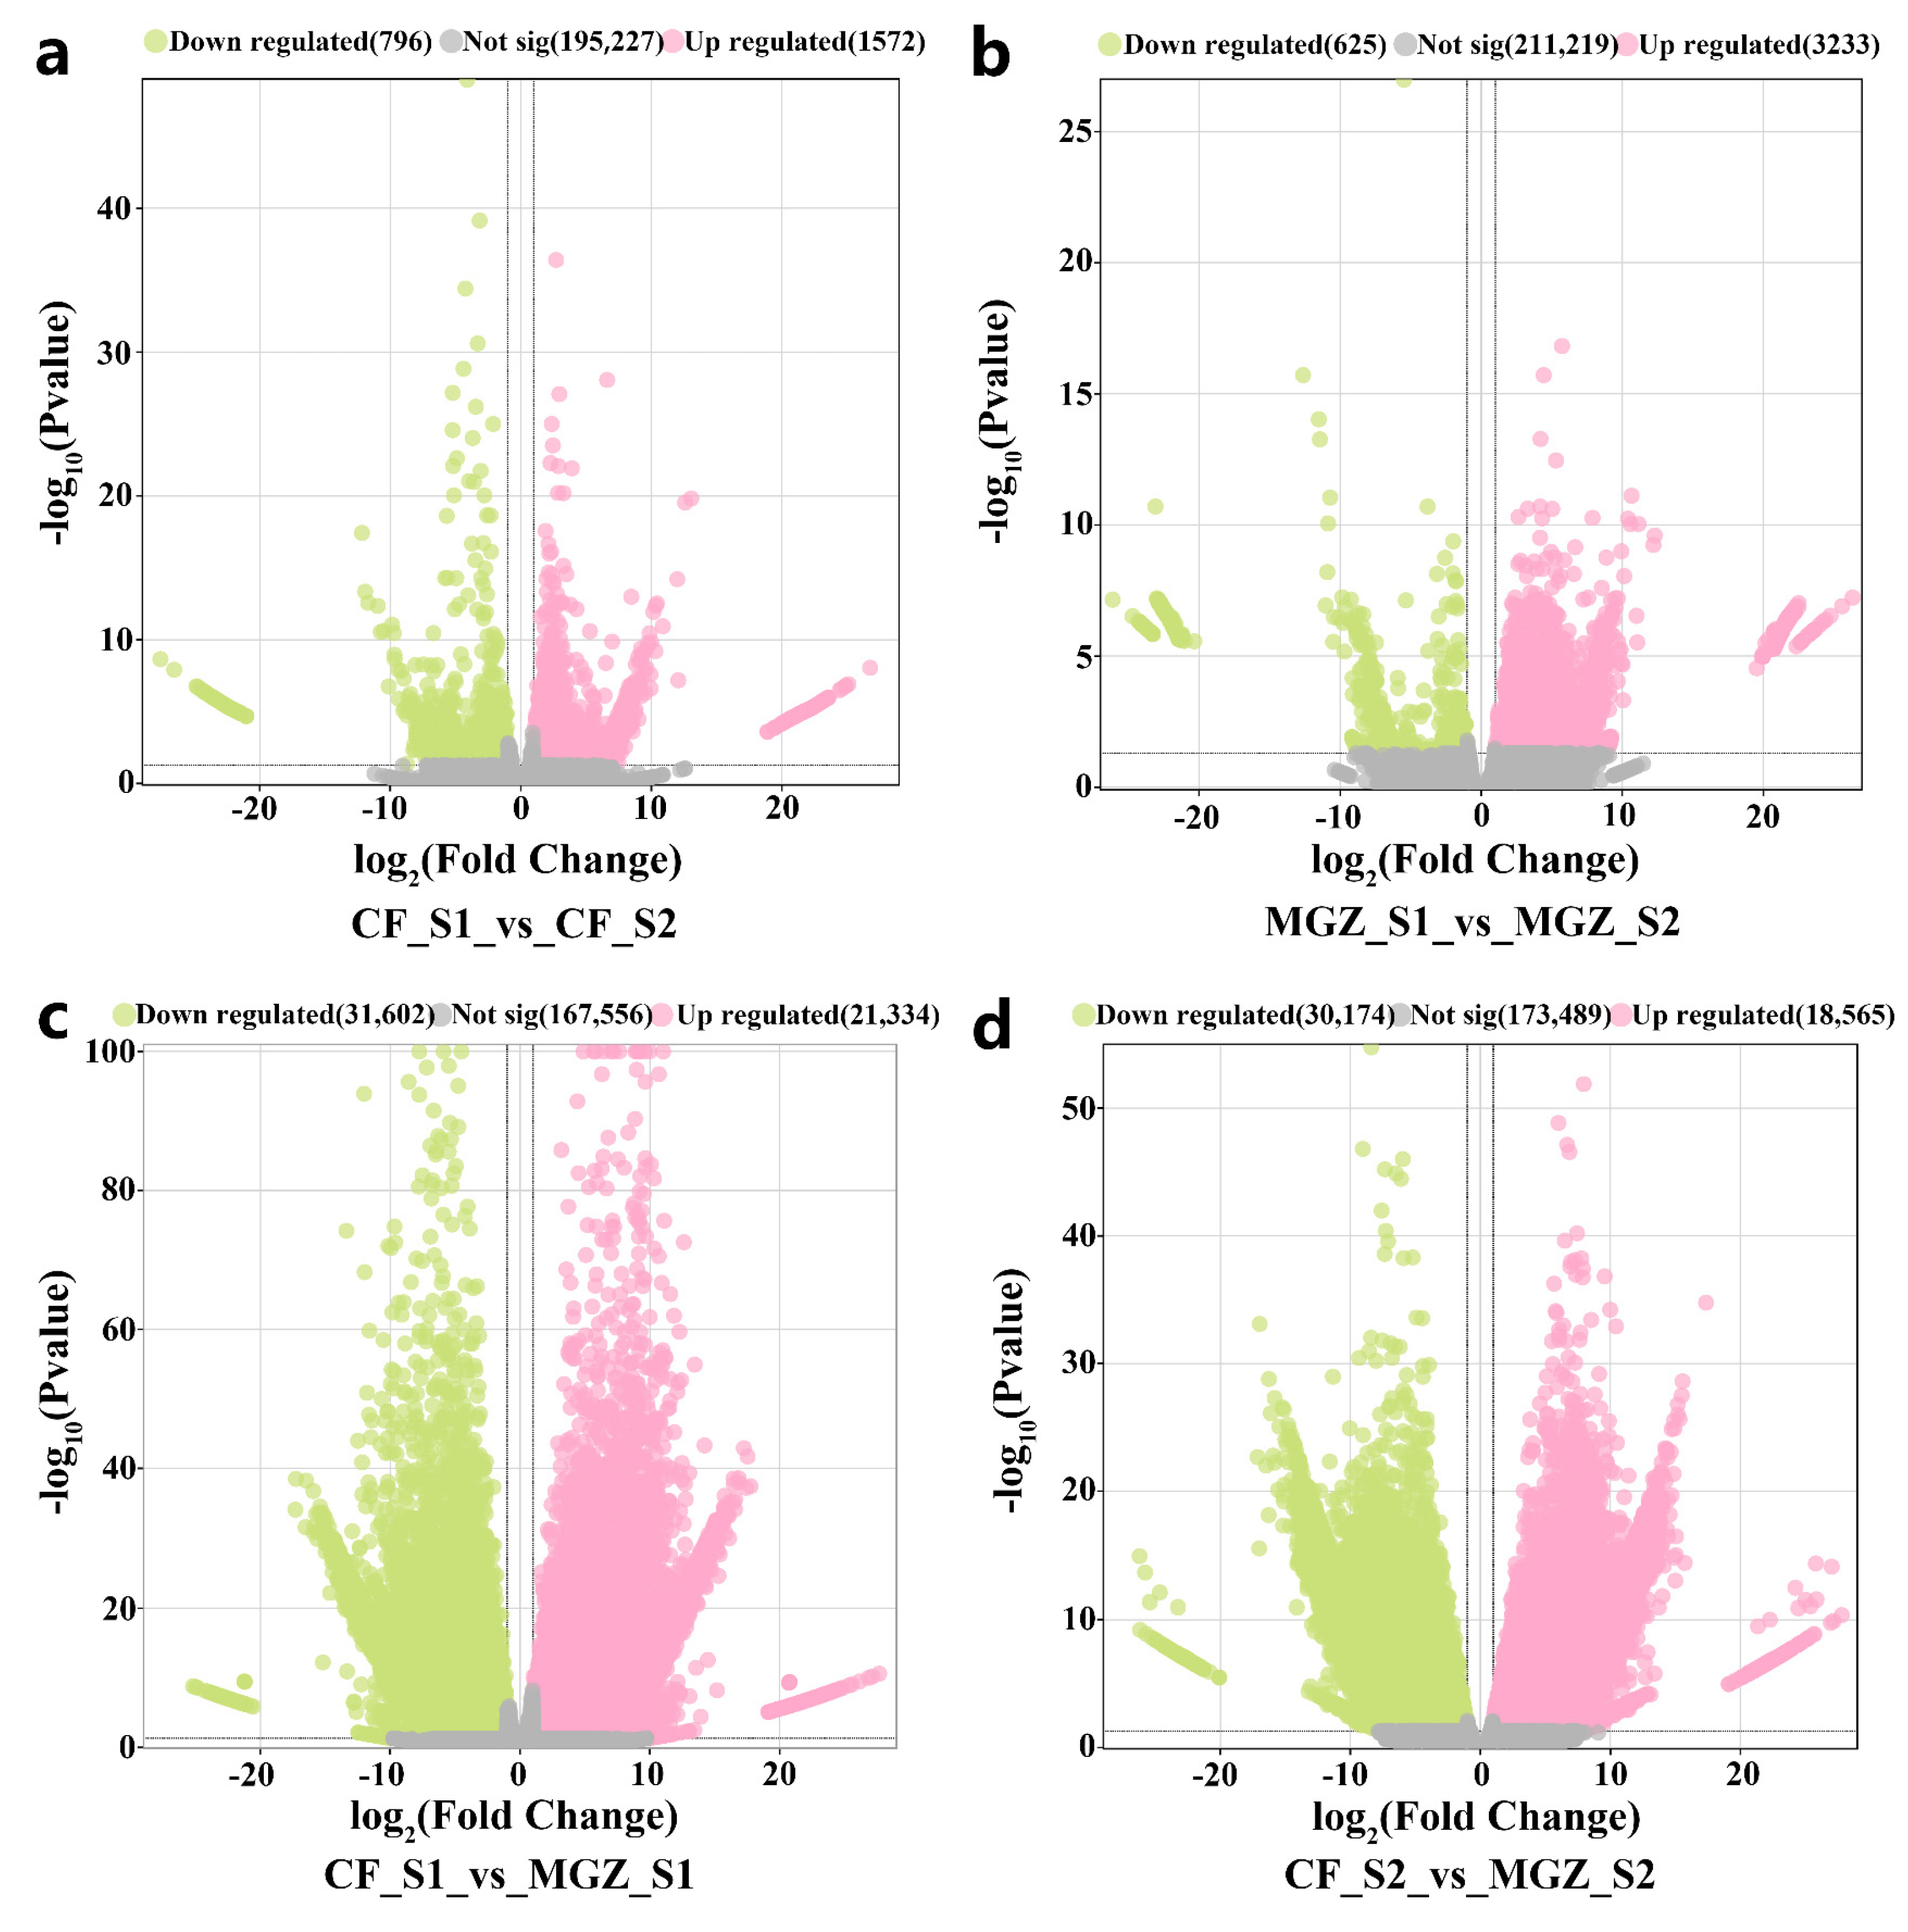
3.3. DEGs between CF and MGZ under High-Temperature Stress

In different periods of high-temperature stress, the expression of specific genes in CF exhibited significant alterations. Compared with CF_S1, there were 2368 DEGs in CF_S2. Among these DEGs, 1572 genes were upregulated, while 796 genes were downregulated in CF_S2 (Figure 3a). Similarly, the expression levels of certain genes in MGZ exhibited significant changes during different periods of high temperature stress. In comparison with MGZ_S1, there were 3858 DEGs in MGZ_S2. Among these, 3233 genes were upregulated, while 625 genes were downregulated in MGZ_S2 (Figure 3b). It is noteworthy that a substantial number of DEGs exist in CF and MGZ at two distinct sampling points. Specifically, compared to CF_S1, MGZ_S1 exhibited 52,936 DEGs with 21,334 upregulated genes and 31,602 downregulated genes (Figure 3c). Similarly, compared with CF_S2, MGZ_S2 displayed 48,739 DEGs with 18,565 upregulated genes and 30,174 downregulated genes (Figure 3d).

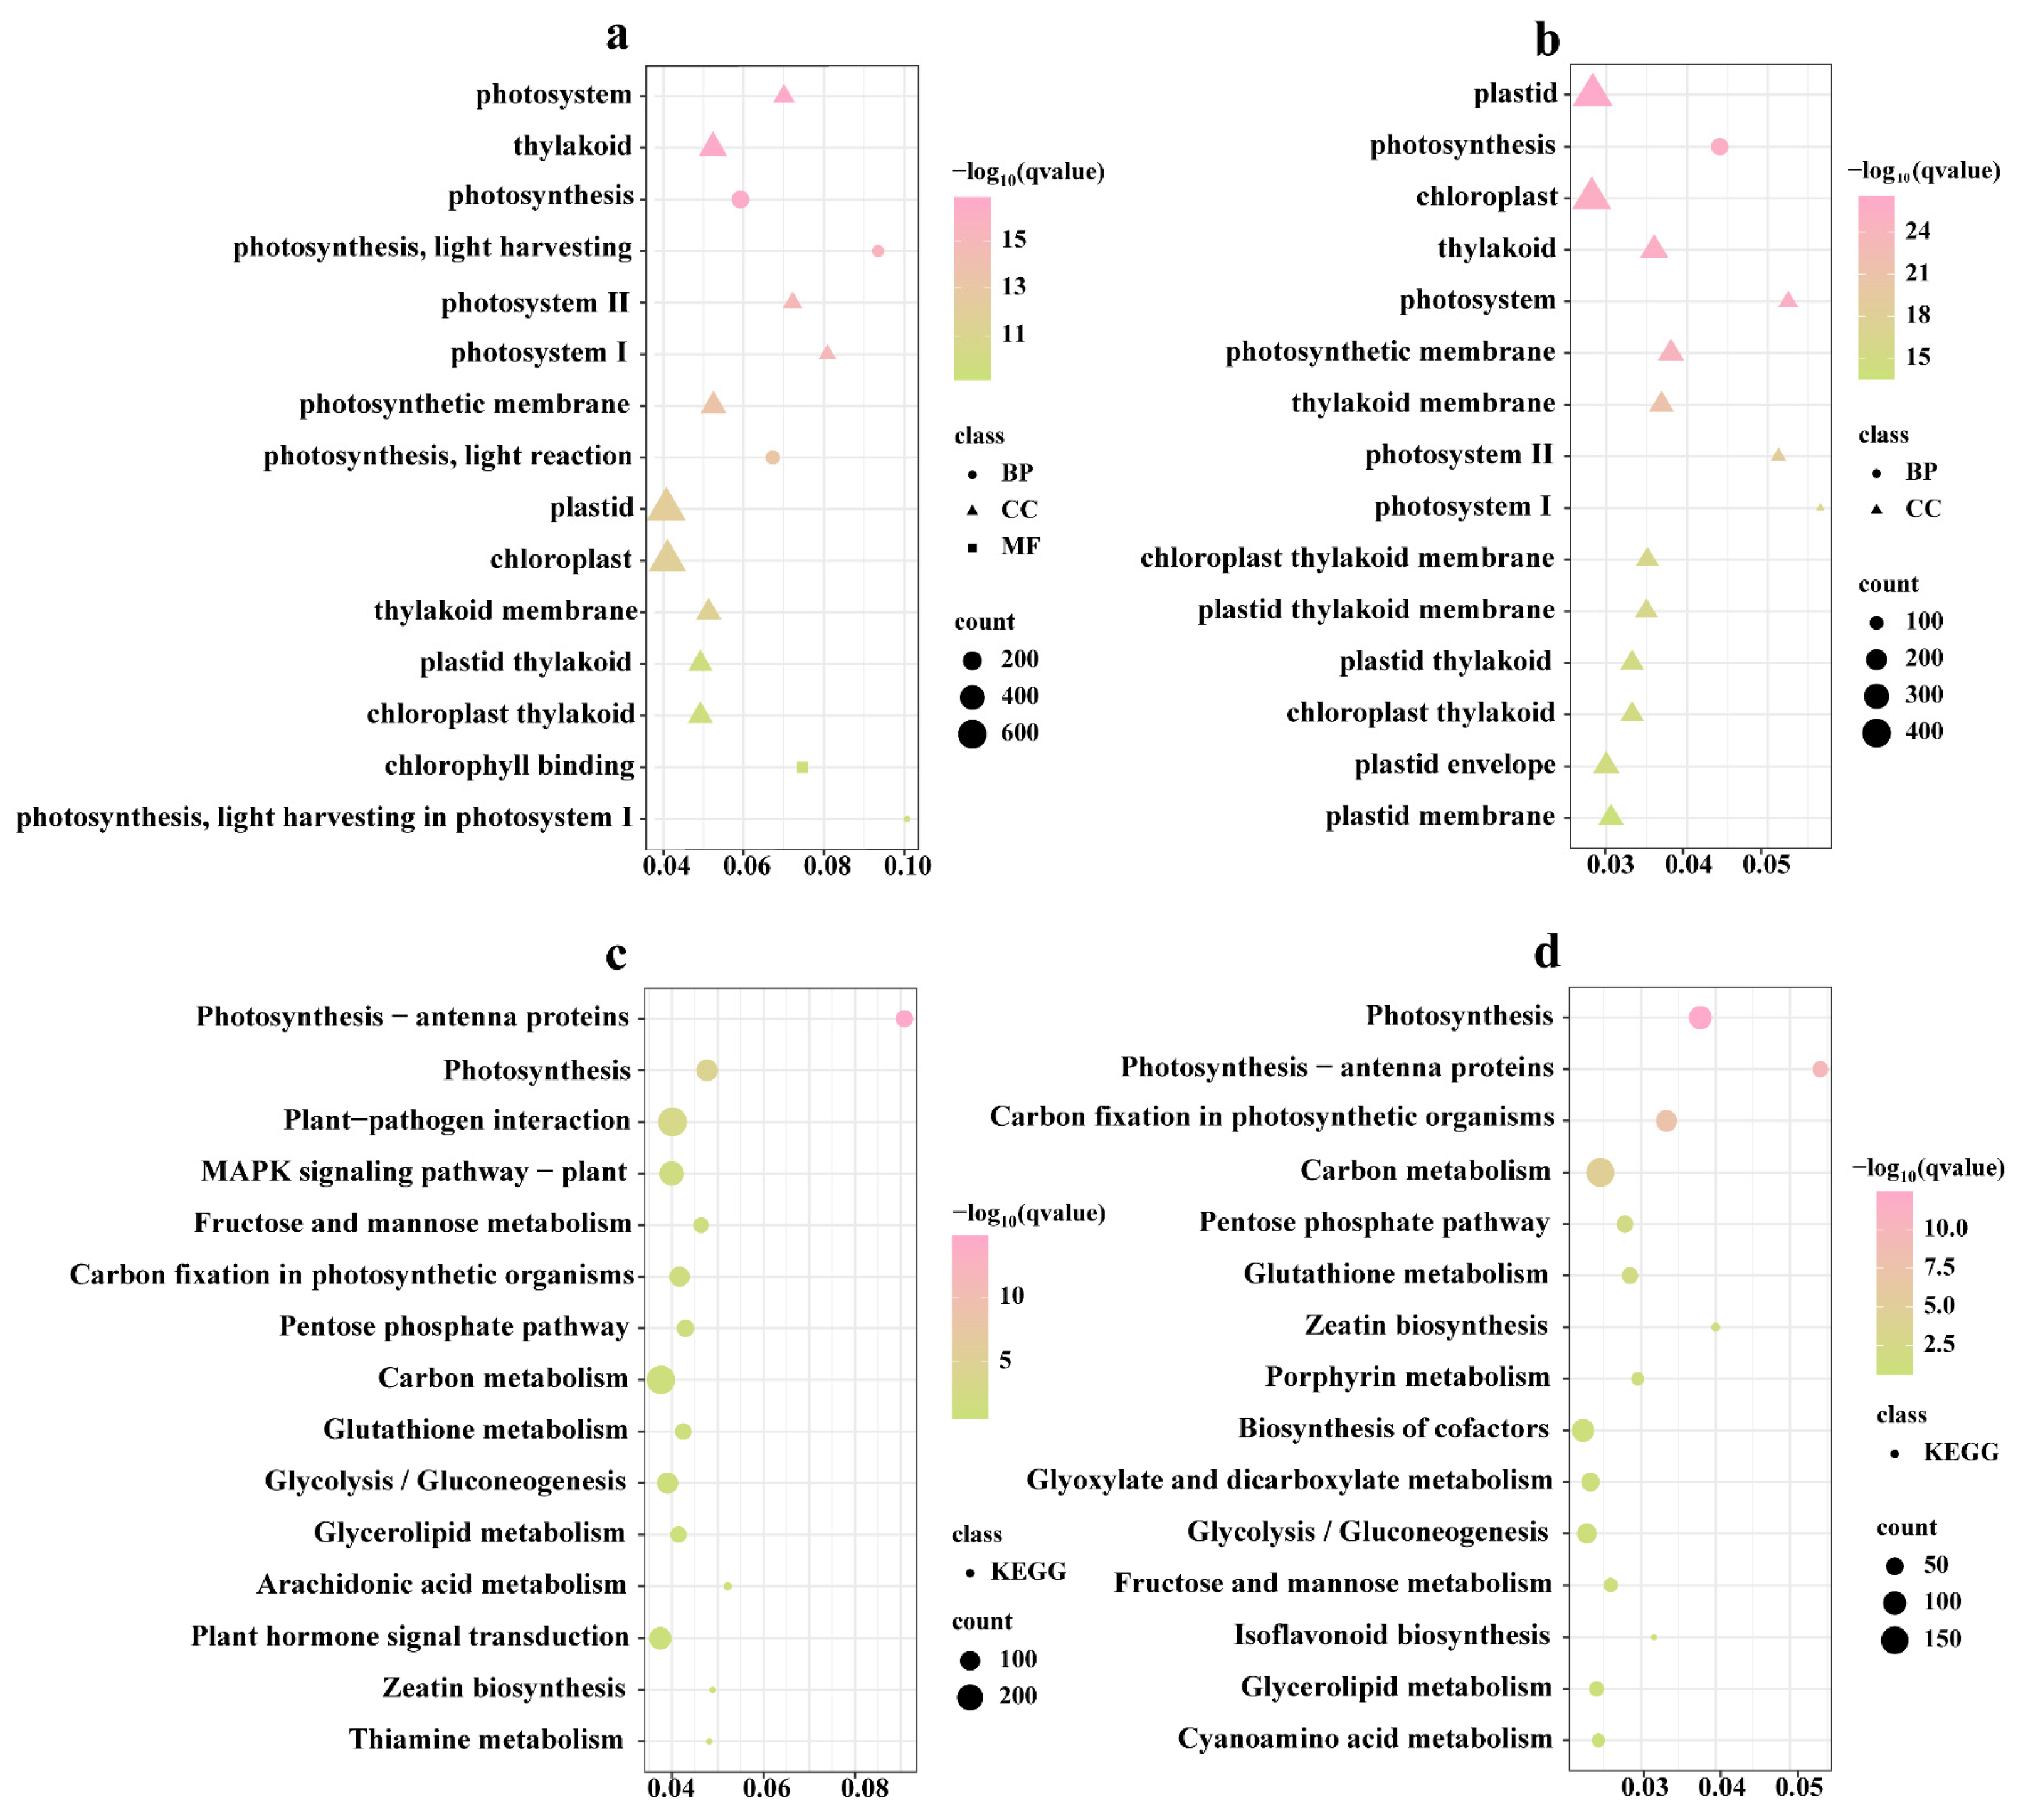
3.4. Functional Analysis of DEGs between CF and MGZ under High-Temperature Stress

To investigate the biological role of DEGs between CF and MGZ, the DEGs in CF_S1 vs. MGZ_S1 and CF_S2 vs. MGZ_S2 with minimum FPKM among 12 samples ≥ 1 were searched against the GO database and the KEGG pathway.
The GO database is a globally recognized system for categorizing gene functions with the main objective of uncovering the functional characteristics of gene products. The DEGs in CF_S1 vs. MGZ_S1 were significantly enriched in the “photosystem”, “thylakoid”, “photosynthesis”, “photosynthesis, light harvesting”, “photosystem II” and “photosystem I” categories (Figure 4a). The DEGs identified in CF_S2 vs. MGZ_S2 exhibited significant enrichment in the “plastid”, “photosynthesis”, “chloroplast”, “thylakoid” and “photosystem” categories (Figure 4b).
Furthermore, KEGG pathway analysis can provide a comprehensive understanding of gene interaction networks within cells. DEGs in CF_S1 vs. MGZ_S1 were significantly enriched in the “Photosynthesis–antenna proteins” and “Photosynthesis” categories (Figure 4c). DEGs in CF_S2 vs. MGZ_S2 exhibited significant enrichment in the “Photosynthesis” and “Photosynthesis–antenna proteins” categories. Additionally, DEGs were also found to be enriched in the “Porphyrin metabolism” categories, a crucial pathway involved in chlorophyll metabolism (Figure 4d).

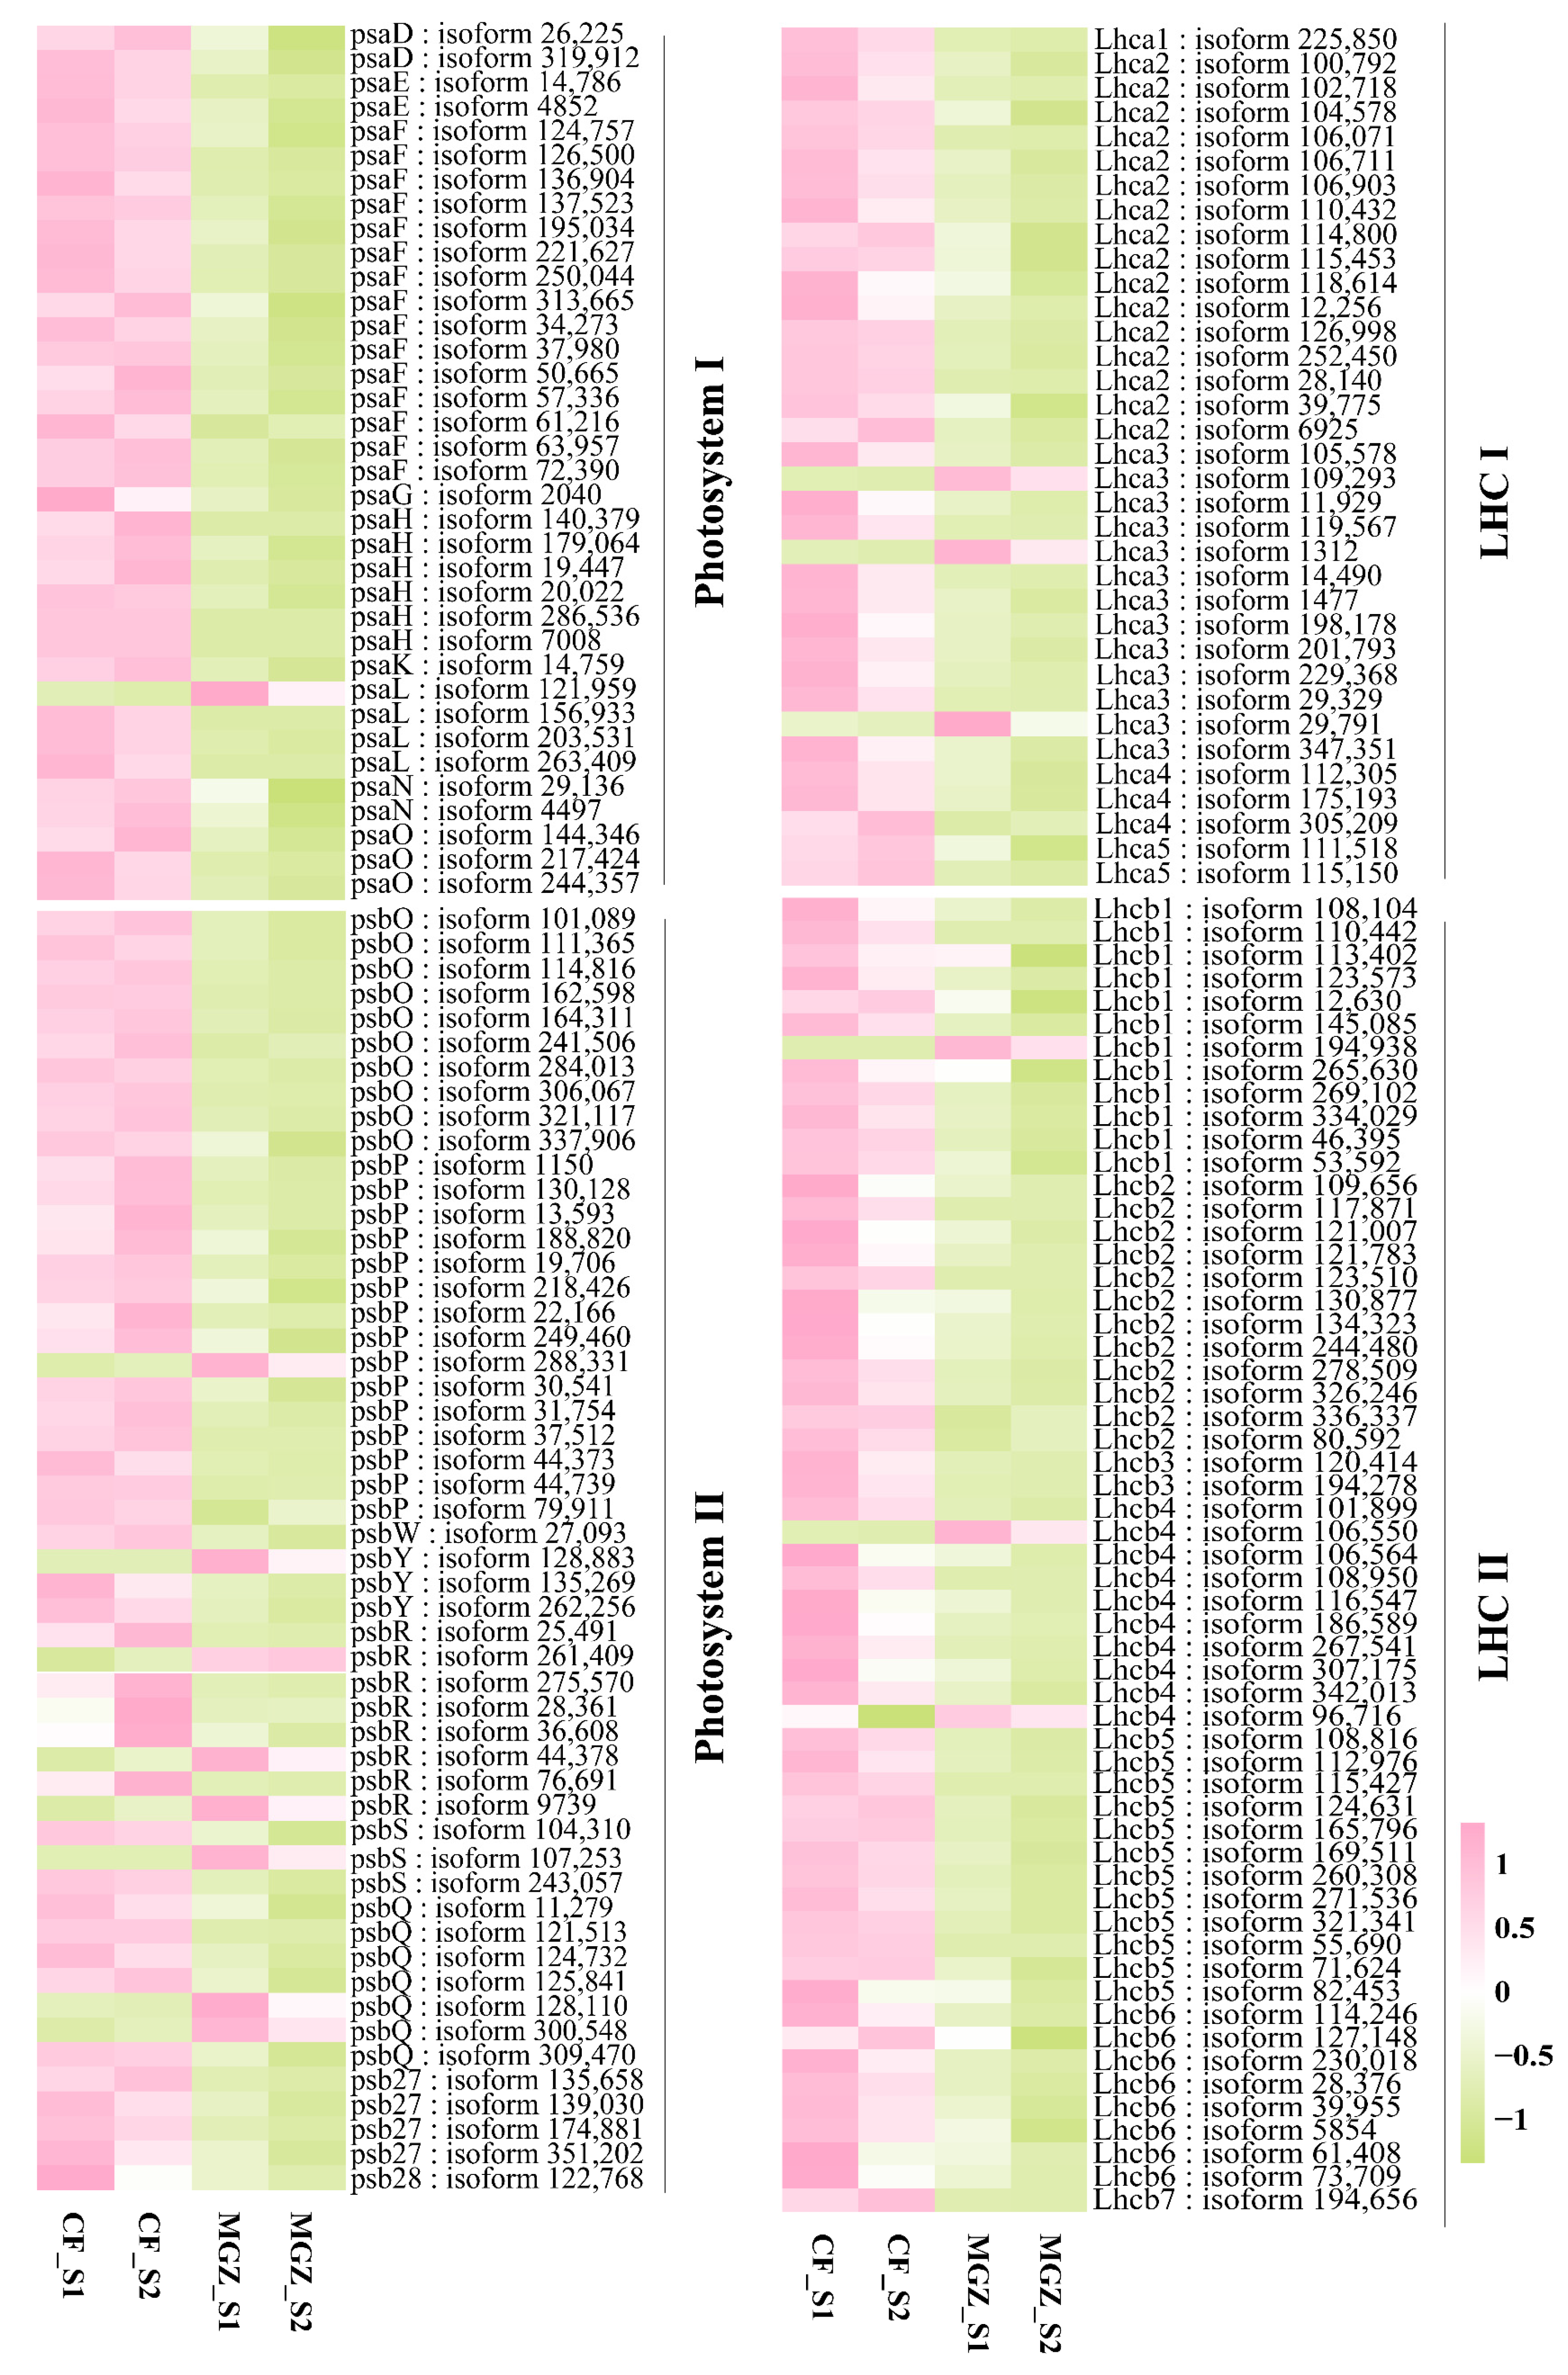
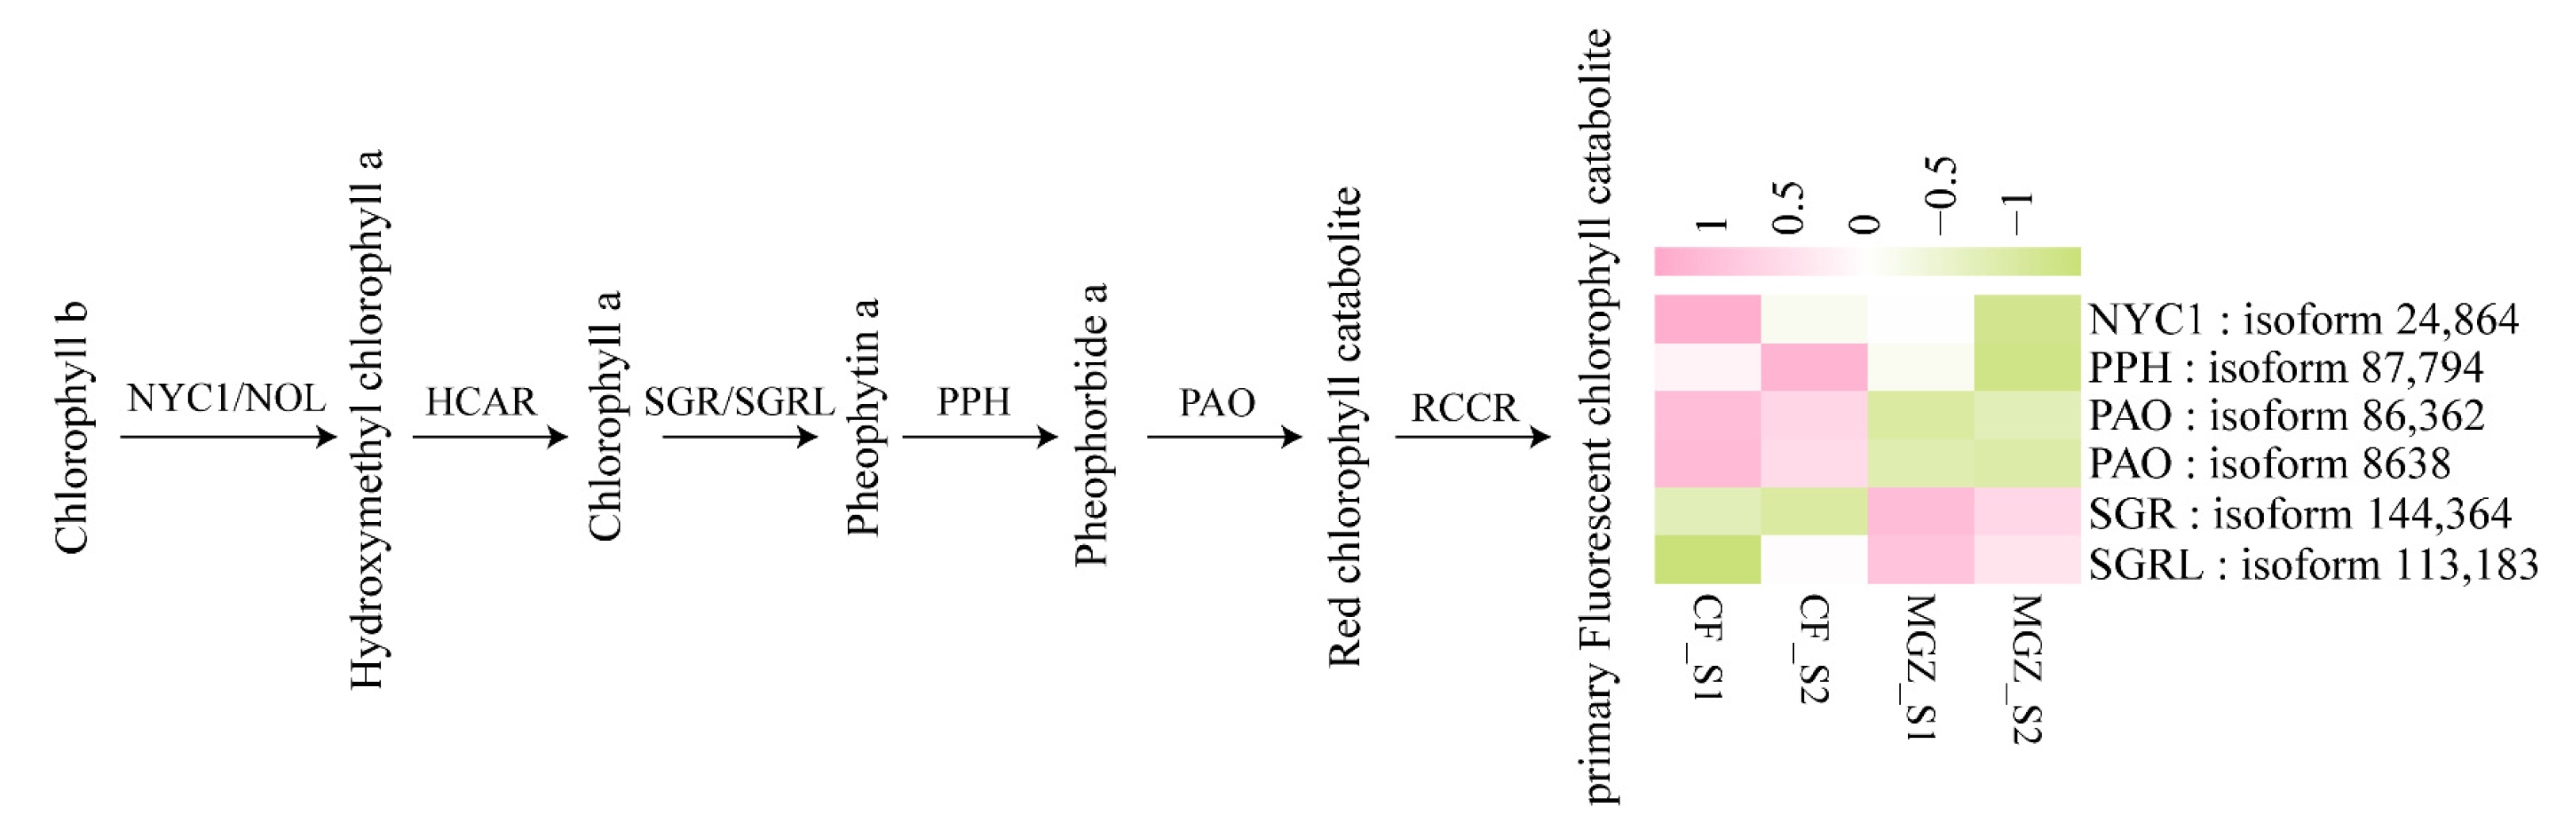
3.5. DEGs Associated with Photosynthesis and Chlorophyll Degradation

Because of DEGs between CF and MGZ significantly related to “Photosynthesis”, a total of 241 differentially expressed genes (DEGs) related to photosynthesis were identified and categorized based on their annotation information. Genes that encode photosystem I (PS I), photosynthetic electron transport (PET), photosystem II (PS II), ATPase, light-harvesting complex I (LHC I), and light-harvesting complex II (LHC II) were transcriptionally affected by high-temperature stress. In general, these genes in MGZ exhibited a comparatively reduced expression level compared with CF when subjected to high-temperature stress, indicating a higher photosynthetic capacity in CF. Furthermore, the expression of these genes in MGZ_S2 was lower than in MGZ_S1 (Figure 5 and Figure S1).
Since the chlorophyll content in CF and MGZ leaves is significantly reduced during high-temperature stress, and DEGs are enriched in the “Porphyrin metabolism” pathway, we also focused on CCGs. A total of six differentially expressed CCGs were identified in Figure 6. Non-yellow coloring 1 (NYC1), pheophytinase (PPH), and pheophorbide a oxygenase (PAO) were highly expressed in the high-temperature-resistant CF cultivar, while hydroxymethyl chl a reductase (SGR) and stay-green-like (SGRL) were highly expressed in the high-temperature-sensitive MGZ cultivar, which likely plays an important role in promoting herbaceous peony leaf chlorosis under high-temperature stress.

3.6. qRT-PCR Analysis of DEGs

The transcriptome sequencing’s accuracy was confirmed by assessing the relative gene expression levels involved in photosynthesis and chlorophyll degradation using qRT-PCR analyses. The findings exhibited consistency in gene expression patterns between the RNA-seq and qRT-PCR data, presenting strong evidence for the dependability of the transcriptome dataset (Figure 7).

4. Discussion

Previous studies have shown that high temperature stress can induce a cascade of physiological and biochemical alterations, ultimately resulting in premature leaf senescence. In this study, we combined second- and third-generation transcriptome analysis to investigate the molecular processes underlying the responses of high-temperature-tolerant and high-temperature-sensitive herbaceous peony cultivars to high-temperature stress during summer. We aimed to elucidate the mechanisms leading to premature senescence in herbaceous peony leaves under high-temperature stress, providing a theoretical basis for breeding high-temperature-resistant cultivars.
Leaf senescence is a normal developmental stage in the plant life cycle, involving intricate molecular mechanisms encompassing gene expression, hormone signaling, cellular metabolism, and programmed cell death [33,34]. High-temperature-induced leaf senescence has received extensive attention. In our study, a high temperature significantly accelerated leaf aging in the high-temperature-sensitive MGZ cultivar, which was characterized by leaf chlorosis and a continuous decline in chlorophyll content during the process of high-temperature stress. At the same time, transcriptome sequencing revealed that the expression of photosynthesis-related DEG in MGZ_S2 was lower than in MGZ_S1. We speculate that this is because high-temperature stress can suppress the photosynthesis-related gene expression level, resulting in the destruction of the photosystem [35,36]. In the study by Qian and his colleagues, they believed that long-term high temperature stress lead to leaf senescence could via suppressing photosynthesis-related genes, which is consistent with our findings [22].
As a sign of leaf senescence, chlorophyll degradation has attracted the attention of scholars in the last few decades [37,38]. Existing studies have shown that high temperature can cause chlorophyll degradation [39,40]. The genetic regulation of chlorophyll degradation is a highly controlled process, researchers have successfully identified the key genes responsible for chlorophyll degradation in many species [41,42,43]. SGR functions as a key regulator of chlorophyll degradation. Many recent studies have examined the physiological and molecular roles of SGR and its homologs (SGRL) in chlorophyll metabolism, finding that these genes play different roles in different species [44,45]. Various studies have demonstrated that SGR gene expression is enhanced under high-temperature stress conditions. This upregulation of SGR-mediated chlorophyll a degradation plays a pivotal role in maintaining photosystem stability during high-temperature-induced leaf senescence in perennial ryegrass [11,46]. In this study, SGR and SGRL were found to be highly expressed in MGZ under high-temperature stress, which was consistent with the accelerated chlorophyll content reduction phenotype observed in MGZ. These results indicate that SGR and SGRL may play an important role in regulating chlorophyll degradation and leaf senescence in herbaceous peony induced by high temperatures.
This study combined PacBio Iso-Seq sequencing with next-generation sequencing to investigate the diverse molecular processes in high-temperature-tolerant and high-temperature-sensitive cultivars of herbaceous peony under summer high-temperature stress. Under high-temperature stress, the DEGs between the high-temperature-tolerant and high-temperature-sensitive cultivars were significantly enriched in pathways that are significantly related to photosynthesis, such as “photosystem”, “thylakoid”, “photosynthesis”, “photosynthesis, light harvesting”, “photosystem II” and “photosystem I”. Photosynthesis is one of the most sensitive physiological processes to high-temperature stress. In particular, high temperatures destroy the stability of the photosystem and interfere with the normal operation of the electron transport chain [47]. Therefore, it is important to pay attention to photosynthesis-related DEGs to alleviate high-temperature-induced senescence in herbaceous peony. The expression levels of photosynthesis-related genes in the high-temperature-tolerant CF cultivar were significantly higher than those in the high-temperature-sensitive MGZ cultivar. A previous study showed that the transcriptional levels of genes involved in LHCI and LHCII were much higher in the soybean sgr mutant; the photosynthetic apparatus of the mutant was less damaged during senescence, which contributed to the stability of PSI and PSII [48]. This suggests that a more stable CF photosystem can reduce the peony leaf senescence caused by high temperatures.

5. Conclusions

In summary, we conducted a comparative analysis of phenotypic and gene expression differences between the high-temperature-tolerant cultivar CF and the high-temperature-sensitive cultivar MGZ under summer high-temperature conditions. Our research findings indicate that MGZ exhibits an accelerated rate of chlorophyll content reduction and displays more pronounced premature senescence. Transcriptome sequencing results showed that a more stable photosystem caused by the high expression of photosystem-related genes of CF could reduce the senescence of peony leaves caused by high temperature. SGR and SGRL play an important role in chlorophyll degradation induced by high temperature in herbaceous peonies, but their specific functions and upstream regulatory networks need to be further studied. We allow for future investigations to examine and decipher the specific regulating systems that account for the observed variations.

Supplementary Materials

The following supporting information can be downloaded at: https://www.mdpi.com/article/10.3390/agriculture14040574/s1, Table S1: Gene-specific primer sequence for qRT-PCR detection; Figure S1: Heat-map of differentially expressed genes (DEGs) related to photosynthesis in CF and MGZ.

Author Contributions

D.Z. conceived the experiments; S.Q. and Y.Q. conducted the experiments; S.Q. and M.Z. collected and analyzed the results; J.T., D.Z. and M.Z. wrote the original draft; J.T. and D.Z. reviewed and revised the manuscript. All authors have read and agreed to the published version of the manuscript.

Funding

This research was funded by Jiangsu Province Seed Industry Revitalization Unveiled Project [JBGS(2021)020], the Key R&D Program of Yangzhou (YZ202253), National Forest and Grass Science and Technology Innovation and Development Research Project (2023132012), Qing Lan Project of Jiangsu Province and High-Level Talent Support Program of Yangzhou University.

Institutional Review Board Statement

Not applicable.

Data Availability Statement

The original data presented in the study are openly available in National Center for Biotechnology Information (NCBI) under accession numbers PRJNA1059300 (https://www.ncbi.nlm.nih.gov/bioproject/PRJNA1059300 accessed on 9 January 2024) and PRJNA1059272 (https://www.ncbi.nlm.nih.gov/bioproject/PRJNA1059272 accessed on 9 January 2024).

Conflicts of Interest

The authors declare no conflicts of interest.

References

  1. Chapman, S.C.; Chakraborty, S.; Dreccer, M.F.; Howden, S.M. Plant adaptation to climate change—Opportunities and priorities in breeding. Crop Pasture Sci. 2012, 63, 251–268. [Google Scholar] [CrossRef]
  2. Raftery, A.E.; Zimmer, A.; Frierson, D.M.W.; Startz, R.; Liu, P. Less than 2 °C warming by 2100 unlikely. Nat. Clim. Change 2017, 7, 637–641. [Google Scholar] [CrossRef]
  3. Terashima, I.; Hanba, Y.T.; Tholen, D.; Niinemets, Ü. Leaf functional anatomy in relation to photosynthesis. Plant Physiol. 2011, 155, 108–116. [Google Scholar] [CrossRef] [PubMed]
  4. Das, A.; Eldakak, M.; Paudel, B.; Kim, D.W.; Hemmati, H.; Basu, C.; Rohila, J.S. Leaf proteome analysis reveals prospective drought and heat stress response mechanisms in soybean. BioMed Res. Int. 2016, 2016, 6021047. [Google Scholar] [CrossRef]
  5. Zhang, J. Effect of moderately-high temperature stress on photosynthesis and carbohydrate metabolism in tomato (Lycopersico esculentum L.) leaves. Afr. J. Agric. Res. 2012, 7, 487–492. [Google Scholar] [CrossRef]
  6. Liu, X.; Huang, B. Heat stress injury in relation to membrane lipid peroxidation in creeping bentgrass. Crop Sci. 2000, 40, 503–510. [Google Scholar] [CrossRef]
  7. Sharma, P.; Jha, A.B.; Dubey, R.S.; Pessarakli, M. Reactive oxygen species, oxidative damage, and antioxidative defense mechanism in plants under stressful conditions. J. Bot. 2012, 2012, 217037. [Google Scholar] [CrossRef]
  8. Ristic, Z.; Bukovnik, U.; Prasad, P.V.V. Correlation between heat stability of thylakoid membranes and loss of chlorophyll in winter wheat under heat stress. Crop Sci. 2007, 47, 2067–2073. [Google Scholar] [CrossRef]
  9. Zhang, J.; Xing, J.; Lu, Q.; Yu, G.; Xu, B.; Huang, B. Transcriptional regulation of chlorophyll-catabolic genes associated with exogenous chemical effects and genotypic variations in heat-induced leaf senescence for perennial ryegrass. Environ. Exp. Bot. 2019, 167, 103858. [Google Scholar] [CrossRef]
  10. Jespersen, D.; Zhang, J.; Huang, B. Chlorophyll loss associated with heat-induced senescence in bentgrass. Plant Sci. 2016, 249, 1–12. [Google Scholar] [CrossRef]
  11. Zhang, J.; Li, H.; Huang, X.; Xing, J.; Yao, J.; Yin, T.; Jiang, J.; Wang, P.; Xu, B. STAYGREEN-mediated chlorophyll a catabolism is critical for photosystem stability during heat-induced leaf senescence in perennial ryegrass. Plant Cell Environ. 2022, 45, 1412–1427. [Google Scholar] [CrossRef] [PubMed]
  12. Jibran, R.; Hunter, D.A.; Dijkwel, P.P. Hormonal regulation of leaf senescence through integration of developmental and stress signals. Plant Mol. Biol. 2013, 82, 547–561. [Google Scholar] [CrossRef]
  13. Kim, J. Sugar metabolism as input signals and fuel for leaf senescence. Genes Genom. 2019, 41, 737–746. [Google Scholar] [CrossRef] [PubMed]
  14. Hörtensteiner, S. Chlorophyll degradation during senescence. Annu. Rev. Plant Biol. 2006, 57, 55–77. [Google Scholar] [CrossRef] [PubMed]
  15. Pruzinská, A.; Tanner, G.; Aubry, S.; Anders, I.; Moser, S.; Muller, T.; Ongania, K.H.; Kräutler, B.; Youn, J.Y.; Liljegren, S.J.; et al. Chlorophyll breakdown in senescent Arabidopsis Leaves. Characterization of chlorophyll catabolites and of chlorophyll catabolic enzymes involved in the degreening reaction. Plant Physiol. 2005, 139, 52–63. [Google Scholar] [CrossRef] [PubMed]
  16. Sakuraba, Y.; Schelbert, S.; Park, S.Y.; Han, S.-H.; Lee, B.D.; Andrès, C.B.; Kessler, F.; Hörtensteiner, S.; Paek, N.C. STAY-GREEN and chlorophyll catabolic enzymes interact at light-harvesting complex II for chlorophyll detoxification during leaf senescence in Arabidopsis. Plant Cell 2012, 24, 507–518. [Google Scholar] [CrossRef] [PubMed]
  17. Zha, Q.; Xi, X.; He, Y.; Jiang, A. Transcriptomic analysis of the leaves of two grapevine cultivars under high-temperature stress. Sci. Hortic. 2020, 265, 109265. [Google Scholar] [CrossRef]
  18. Zhang, S.; Zhang, A.; Wu, X.; Zhu, Z.; Yang, Z.; Zhu, Y.; Zha, D. Transcriptome analysis revealed expression of genes related to anthocyanin biosynthesis in eggplant (Solanum melongena L.) under high-temperature stress. BMC Plant Biol. 2019, 19, 387. [Google Scholar] [CrossRef]
  19. Hert, D.G.; Fredlake, C.P.; Barron, A.E. Advantages and limitations of next-generation sequencing technologies: A comparison of electrophoresis and non-electrophoresis methods. Electrophoresis 2008, 29, 4618–4626. [Google Scholar] [CrossRef]
  20. Liu, L.; Li, Y.; Li, S.; Hu, N.; He, Y.; Pong, R.; Lin, D.; Lu, L.; Law, M. Comparison of Next-Generation Sequencing Systems. J. Biomed. Biotechnol. 2012, 2012, 251364. [Google Scholar] [CrossRef]
  21. Schadt, E.E.; Turner, S.; Kasarskis, A. A window into third-generation sequencing. Hum. Mol. Genet. 2010, 19, R227–R240. [Google Scholar] [CrossRef] [PubMed]
  22. Qian, Y.; Cao, L.; Zhang, Q.; Amee, M.; Chen, K.; Chen, L. SMRT and Illumina RNA sequencing reveal novel insights into the heat stress response and crosstalk with leaf senescence in tall fescue. BMC Plant Biol. 2020, 20, 366. [Google Scholar] [CrossRef] [PubMed]
  23. Chang, Y.; Hu, T.; Zhang, W.; Zhou, L.; Wang, Y.; Jiang, Z. Transcriptome profiling for floral development in reblooming cultivar ‘High Noon’ of Paeonia suffruticosa. Sci. Data 2019, 6, 217. [Google Scholar] [CrossRef]
  24. Wu, Y.Q.; Zhao, D.Q.; Han, C.X.; Tao, J.; Willenborg, C. Biochemical and molecular responses of herbaceous peony to high temperature stress. Can. J. Plant Sci. 2016, 96, 474–484. [Google Scholar] [CrossRef]
  25. Zhao, D.; Han, C.; Zhou, C.; Tao, J. Shade ameliorates high temperature-induced inhibition of growth in herbaceous peony (Paeonia lactiflora). Int. J. Agric. Biol. 2015, 17, 911–919. [Google Scholar] [CrossRef]
  26. Zhao, D.Q.; Li, T.T.; Hao, Z.J.; Cheng, M.L.; Tao, J. Exogenous trehalose confers high temperature stress tolerance to herbaceous peony by enhancing antioxidant systems, activating photosynthesis, and protecting cell structure. Cell Stress Chaperones 2019, 24, 247–257. [Google Scholar] [CrossRef]
  27. Qian, Y.; Cheng, Z.; Meng, J.; Tao, J.; Zhao, D. PlMAPK1 facilitates growth and photosynthesis of herbaceous peony (Paeonia lactiflora Pall.) under high-temperature stress. Sci. Hortic. 2023, 310, 111701. [Google Scholar] [CrossRef]
  28. Zhang, T.; Tang, Y.; Luan, Y.; Cheng, Z.; Wang, X.; Tao, J.; Zhao, D. Herbaceous peony AP2/ERF transcription factor binds the promoter of the tryptophan decarboxylase gene to enhance high-temperature stress tolerance. Plant Cell Environ. 2022, 45, 2729–2743. [Google Scholar] [CrossRef]
  29. Zhao, D.; Xia, X.; Su, J.; Wei, M.; Wu, Y.; Tao, J. Overexpression of herbaceous peony HSP70 confers high temperature tolerance. BMC Genom. 2019, 20, 70. [Google Scholar] [CrossRef]
  30. Liu, W.; Chen, G.; He, M.; Wu, J.; Wen, W.; Gu, Q.; Guo, S.; Wang, Y.; Sun, J. ABI5 promotes heat stress-induced chlorophyll degradation by modulating the stability of MYB44 in cucumber. Hortic. Res. 2023, 10, uhad089. [Google Scholar] [CrossRef]
  31. Livak, K.J.; Schmittgen, T.D. Analysis of relative gene expression data using real-time quantitative PCR and the 2−ΔΔCT Method. Methods 2001, 25, 402–408. [Google Scholar] [CrossRef] [PubMed]
  32. Love, M.I.; Huber, W.; Anders, S. Moderated estimation of fold change and dispersion for RNA-seq data with DESeq2. Genome Biol. 2014, 15, 550. [Google Scholar] [CrossRef] [PubMed]
  33. Guo, Y.; Ren, G.; Zhang, K.; Li, Z.; Miao, Y.; Guo, H. Leaf senescence: Progression, regulation, and application. Mol. Hortic. 2021, 1, 5. [Google Scholar] [CrossRef] [PubMed]
  34. Lim, P.O.; Kim, H.J.; Gil Nam, H. Leaf Senescence. Annu. Rev. Plant Biol. 2007, 58, 115–136. [Google Scholar] [CrossRef] [PubMed]
  35. Chauhan, J.; Singh, P.; Choyal, P.; Mishra, U.N.; Saha, D.; Kumar, R.; Anuragi, H.; Pandey, S.; Bose, B.; Mehta, B. Plant photosynthesis under abiotic stresses: Damages, adaptive, and signaling mechanisms. Plant Stress 2023, 10, 100296. [Google Scholar] [CrossRef]
  36. Rath, J.R.; Pandey, J.; Yadav, R.M.; Zamal, M.Y.; Ramachandran, P.; Mekala, N.R.; Allakhverdiev, S.I.; Subramanyam, R. Temperature-induced reversible changes in photosynthesis efficiency and organization of thylakoid membranes from pea (Pisum sativum). Plant Physiol. Biochem. 2022, 185, 144–154. [Google Scholar] [CrossRef] [PubMed]
  37. Avila-Ospina, L.; Moison, M.; Yoshimoto, K.; Masclaux-Daubresse, C. Autophagy, plant senescence, and nutrient recycling. J. Exp. Bot. 2014, 65, 3799–3811. [Google Scholar] [CrossRef] [PubMed]
  38. Christ, B.; Hörtensteiner, S. Mechanism and significance of chlorophyll breakdown. J. Plant Growth Regul. 2014, 33, 4–20. [Google Scholar] [CrossRef]
  39. Jahan, M.S.; Hasan, M.M.; Alotaibi, F.S.; Alabdallah, N.M.; Alotaibi, B.M.; Ramadan, K.M.A.; Bendary, E.S.A.; Alshehri, D.; Jabborova, D.; Al-Balawi, D.A.; et al. Exogenous putrescine increases heat tolerance in tomato seedlings by regulating chlorophyll metabolism and enhancing antioxidant defense efficiency. Plants 2022, 11, 1038. [Google Scholar] [CrossRef]
  40. Rossi, S.; Burgess, P.; Jespersen, D.; Huang, B. Heat-Induced leaf senescence associated with chlorophyll metabolism in bentgrass lines differing in heat tolerance. Crop Sci. 2017, 57, S-169–S-178. [Google Scholar] [CrossRef]
  41. Kuai, B.; Chen, J.; Hörtensteiner, S. The biochemistry and molecular biology of chlorophyll breakdown. J. Exp. Bot. 2018, 69, 751–767. [Google Scholar] [CrossRef] [PubMed]
  42. Wang, P.; Grimm, B. Connecting Chlorophyll metabolism with accumulation of the photosynthetic apparatus. Trends Plant Sci. 2021, 26, 484–495. [Google Scholar] [CrossRef] [PubMed]
  43. Park, S.Y.; Yu, J.W.; Park, J.S.; Li, J.; Yoo, S.C.; Lee, N.Y.; Lee, S.K.; Jeong, S.W.; Seo, H.S.; Koh, H.J. The senescence-induced staygreen protein regulates chlorophyll degradation. Plant Cell 2007, 19, 1649–1664. [Google Scholar] [CrossRef] [PubMed]
  44. Jiang, H.; Chen, Y.; Li, M.; Xu, X.; Wu, G. Overexpression of SGR results in oxidative stress and lesion-mimic cell death in rice seedlings. J. Integr. Plant Biol. 2011, 53, 375–387. [Google Scholar] [CrossRef] [PubMed]
  45. Yang, M.; Zhu, S.; Jiao, B.; Duan, M.; Meng, Q.; Ma, N.; Lv, W. SlSGRL, a tomato SGR-like protein, promotes chlorophyll degradation downstream of the ABA signaling pathway. Plant Physiol. Biochem. 2020, 157, 316–327. [Google Scholar] [CrossRef] [PubMed]
  46. Zhou, H.; Guo, S.; An, Y.; Shan, X.; Wang, Y.; Shu, S.; Sun, J. Exogenous spermidine delays chlorophyll metabolism in cucumber leaves (Cucumis sativus L.) under high temperature stress. Acta Physiol. Plant. 2016, 38, 224. [Google Scholar] [CrossRef]
  47. Sharkey, T.D.; Zhang, R. High temperature effects on electron and proton circuits of photosynthesis. J. Integr. Plant Biol. 2010, 52, 712–722. [Google Scholar] [CrossRef]
  48. Wang, P.; Hou, S.; Wen, H.; Wang, Q.; Li, G. Chlorophyll retention caused by STAY-GREEN (SGR) gene mutation enhances photosynthetic efficiency and yield in soybean hybrid Z1. Photosynthetica 2021, 59, 37–48. [Google Scholar] [CrossRef]
Figure 1. The phenotype and chlorophyll contents of ‘Chi Fen’ (CF) and ‘Meigui Zi’ (MGZ) under high-temperature stress. (a) The phenotype of CF and MGZ at S1 and S2. (b) The chlorophyll a content of CF and MGZ at S1 and S2. (c) The chlorophyll b content of CF and MGZ at S1 and S2. (d) The chlorophyll a and b content of CF and MGZ at S1 and S2. Each sample was analyzed in triplicate, and the results are reported as mean ± standard deviation (SD). The error bars represent the SD. Asterisks above each column indicate significant differences between samples (*** p < 0.001) and ns means no significance.
Agriculture 14 00574 g001
Figure 2. The result of PacBio Iso-Seq and next-generation sequencing. (a) Venn diagram of genes annotated to NR, Swiss-Prot, KOG, GO, and KEGG databases. (b) The mapping rate of samples aligned against the PacBio isoforms. (c) Correlation analysis between samples based on Pearson correlation coefficient. Color scales indicate the values of the Pearson correlation coefficient.
Agriculture 14 00574 g002
Figure 3. Volcanic map of genes in CF and MGZ at different sampling points. The genes that are downregulated are represented by the green dots, while the upregulated genes are indicated by the pink dots. Additionally, there are gray dots representing genes that do not show significant changes. (a) Volcanic map of genes in CF-S1 and CF_S2. (b) Volcanic map of genes in MGZ_S1 and MGZ_S2. (c) Volcanic map of genes in CF_S1 and MGZ_S1. (d) Volcanic map of genes in CF_S2 and MGZ_S2.
Agriculture 14 00574 g003
Figure 4. GO and KEGG enrichments of DEGs between CF and MGZ. (a,b) GO enrichment of DEGs between CF-S1 vs. MGZ-S1 and CF-S2 vs. MGZ-S2. (c,d) KEGG enrichment of DEGs between CF-S1 vs. MGZ-S1 and CF-S2 vs. MGZ-S2. Different colors represent different q-values, while the size represents the number of genes.
Agriculture 14 00574 g004
Figure 5. Heat-map of differentially expressed genes (DEGs) related to photosynthesis in CF and MGZ. Including genes encoding photosystem I (PS I), photosynthetic electron transport (PET), photosystem II (PS II), ATPase, light-harvesting complex I (LHC I), and light-harvesting complex II (LHC II). In the heat map, samples are represented by columns while genes are represented by rows. The values of gene expression (FPKM) are indicated using a color scale called ‘row scale’. High expression is shown in pink, intermediate expression in white and low expression in green.
Agriculture 14 00574 g005
Figure 6. Heat-map of DEGs related to chlorophyll degradation. NYC1, non-yellow coloring 1; NOL, NYC1-like; HCAR, hydroxymethyl chl a reductase; SGR, stay-green; SGRL, stay-green like; PPH, pheophytinase; PAO, pheophorbide a oxygenase; RCCR, red Chl catabolite reductase. In the heat map, samples are represented by columns while genes are represented by rows. The values of gene expression (FPKM) are indicated using a color scale called ‘row scale’. High expression is shown in pink, intermediate expression in white and low expression in green.
Agriculture 14 00574 g006
Figure 7. qRT-PCR validation of the mRNAs. The histogram depicts the Fpkm value of the gene acquired through RNA-seq, while the dashed lines represent the relative expression of genes obtained via qRT-PCR. The data are presented as mean ± standard deviation.
Agriculture 14 00574 g007
Disclaimer/Publisher’s Note: The statements, opinions and data contained in all publications are solely those of the individual author(s) and contributor(s) and not of MDPI and/or the editor(s). MDPI and/or the editor(s) disclaim responsibility for any injury to people or property resulting from any ideas, methods, instructions or products referred to in the content.

