Article

Winter Wheat Yield Estimation with Color Index Fusion Texture Feature

1
College of Civil Engineering, Henan University of Engineering, Zhengzhou 451191, China
2
Key Laboratory of Quantitative Remote Sensing in Agriculture of Ministry of Agriculture and Rural Affairs, Information Technology Research Center, Beijing Academy of Agriculture and Forestry Sciences, Beijing 100097, China
3
National Engineering and Technology Center for Information Agriculture, Nanjing Agricultural University, Nanjing 210095, China
*
Author to whom correspondence should be addressed.
Agriculture 2024, 14(4), 581; https://doi.org/10.3390/agriculture14040581
Submission received: 8 February 2024 / Revised: 31 March 2024 / Accepted: 5 April 2024 / Published: 6 April 2024

Abstract

:
The rapid and accurate estimation of crop yield is of great importance for large-scale agricultural production and national food security. Using winter wheat as the research object, the effects of color indexes, texture feature and fusion index on yield estimation were investigated based on unmanned aerial vehicle (UAV) high-definition digital images, which can provide a reliable technical means for the high-precision yield estimation of winter wheat. In total, 22 visible color indexes were extracted using UAV high-resolution digital images, and a total of 24 texture features in red, green, and blue bands extracted by ENVI 5.3 were correlated with yield, while color indexes and texture features with high correlation and fusion indexes were selected to establish yield estimation models for flagging, flowering and filling stages using partial least squares regression (PLSR) and random forest (RF). The yield estimation model constructed with color indexes at the flagging and flowering stages, along with texture characteristics and fusion indexes at the filling stage, had the best accuracy, with R2 values of 0.70, 0.71 and 0.76 and RMSE values of 808.95 kg/hm2, 794.77 kg/hm2 and 728.85 kg/hm2, respectively. The accuracy of winter wheat yield estimation using PLSR at the flagging, flowering, and filling stages was better than that of RF winter wheat estimation, and the accuracy of winter wheat yield estimation using the fusion feature index was better than that of color and texture feature indexes; the distribution maps of yield results are in good agreement with those of the actual test fields. Thus, this study can provide a scientific reference for estimating winter wheat yield based on UAV digital images and provide a reference for agricultural farm management.

1. Introduction

Wheat is one of the most important food rations in China, and its production is directly related to national food security and social stability. The timely, rapid, and accurate forecasting of yields is of great significance to the development of the national economy, early warning of food security, precise fertilization in agriculture, and agricultural insurance [1,2]. Satellite remote sensing provides a new method for estimating crop yields on a large scale because of its large coverage area and short detection period, and in particular, the mobility and flexibility of unmanned aerial remote sensing and its ability to quickly obtain the key growth parameters of a specific growth period of crops are also important [3,4].
In recent years, remote sensing technology has been rapidly applied in crop yield estimation. Currently, there are three main types of methods used for winter wheat yield prediction using remote sensing data: (1) the remote sensing spectral index yield empirical regression method, (2) the potential stress yield model, and (3) the crop dry matter yield model [5].
The empirical statistical regression model directly establishes the relationship between remote sensing and yield [6,7,8], generally using partial least squares regression, support vector machine regression, neural network regression, random forest regression, and other deep learning methods to establish the relationship between remote sensing and yield, regardless of the complex process of crop yield formation, and it establishes a concise and transparent model that is easy to compute. Still, this yield model has no apparent physical mechanism; it struggles to reflect crops’ growth and development process truly. Tao et al. [9] constructed a winter wheat yield estimation model by selecting the vegetation index and red-edge parameters, and the results show that the vegetation index fused with red-edge parameters could significantly improve the estimation effect of the yield model. Zhang et al. [10] used a UAV with a digital camera and a multi-spectral camera to extract different color feature models, vegetation coverage, and vegetation index from images. They constructed a regression model for cotton yield using multiple linear regression methods. The results show that the model established by multiple variables had the best effect. Fei et al. [11] adopted the ensemble Bayesian model averaging (EBMA) method to improve model performance; compared to the best-performing individual model, the EBMA models obtained a weak accuracy improvement by integrating only the linear models or the nonlinear models. Tao et al. [12] constructed a winter wheat yield estimation model based on the uncrewed aerial vehicle (UAV) hyperspectral data using a vegetation index fused with plant height employing partial least squares regression, neural network regression, and random forest regression. The R2 and RMSE values of the optimal yield model for winter wheat constructed using the partial least squares method were 0.77 and 648.90 kg/ha. The R2 and RMSE of the optimal yield model for winter wheat constructed using the Random Forest method were 0.44 and 1009.82 kg/ha.
Potential stress yield considers the physiological factors of the crop itself and the growing environmental conditions affecting its growth. It obtains these parameters to estimate the model yield based on remote sensing data [13,14]. This model is reasonable, but how to effectively determine and estimate crop potential stress yield is still a problem that needs further research. The crop dry matter yield model is mainly based on remote sensing information data, used to assess the quality of dry matter on the crop ground, and then based on the relationship between dry matter and fruit, it obtains a more reasonable remote sensing yield estimate model. This method has a certain degree of mechanical rationality, and the model is relatively stable. Although the model is rather complex, it involves agronomic parameters and has recently become a research hotspot [15]. Wang et al. [16] constructed a yield estimation model for winter wheat using a vegetation index fused with meteorological data, soil moisture content, and other multi-source data using a random forest algorithm in a yield prediction model for wheat at different growth stages, constructed by the random forest algorithm. The accuracy of the yield prediction model with the characteristic variables of May in the October sub-annual and April in the October sub-annual was high; the R2 values were 0.85 and 0.84, and the RMSE values were 821.55 and 832.01 kg/hm2.
The crop dry matter yield model is mainly based on remote sensing information data, which are used to estimate the quality of the dry matter on the crop ground, and then based on the relationship between dry matter and fruit, it obtains a more reasonable remote sensing yield estimate. This method has a certain degree of mechanical rationality, and the model is relatively stable. Although the model is relatively complex, it involves agronomic parameters, and has become a research hotspot in recent years. Zhang et al. [17] used the dynamic fraction of post-anthesis phase biomass accumulation to estimate the winter wheat harvest index, and then used this to obtain an estimated yield. Huang et al. [18] developed a data assimilation framework coupling remote sensing information with the WOFOST-PROSAIL model to estimate wheat yields in the North China Plain, and the results show that the method improved crop yields at the regional scale. Chen et al. [19] obtained the critical stages of winter wheat information from remote sensing data, and simulated and adjusted the climatic information in the crop model (MCWLA-Wheat). They assimilated the spatial difference of LAI into the crop model MCWLA-Wheat using the constant gain Kalman filter algorithm.
RGB cameras have become one of the more commonly used sensors on UAVs due to their cheapness, and the ease of their operation and data processing; RGB images represent the color of each pixel by combining the three basic colors of red, green, and blue. Texture features represent another important type of remote sensing information, which can reflect the properties of the object itself and help to distinguish between two different objects [20,21]. Texture features are those that refer to changes in the grey level of the image, which are related to spatial statistics and reflect the properties of the image itself. Datasets such as those regarding the spectra and textures acquired by UAV have successfully been used to predict various plant traits, such as grain yield [20], biomass [21] and so on. Ma et al. [22] extracted the visible vegetation indices and texture features from RGB images for cotton yield monitoring, and the results show that the yield model constructed with the RF_ELM model is optimal the R2 and RMSE were, respectively, 0.9109 and 0.91277 t/ha. Qu et al. [23] assessed the feasibility of using RF and XGBoost models to predict wild blueberry yields according to the color and texture feature data acquired from drone RGB images.
In terms of model selection, machine learning can establish generalizable models from a large amount of training data, which are increasingly being applied by many scholars in precision agriculture [24,25,26,27]. Cui et al. [28] used PLS, support vector machine (SVM), ridge regression (RR) and k-nearest neighbors (KNN) for faba yield estimation based on RGB and multispectral data from drones. The results show that the R2 value of RF is higher than those of other machine learning algorithms, followed by PLS. Alabi et al. [29] used five machine learning models (Cubist, XGBoost, GBM, SVM and RF) for soybean yield estimation, and the results show that the Cubist and RF estimation models were optimal; their R2 was 0.89. Cheng et al. [30] used PLSR, SVM and RF for winter wheat yield estimation, and the RF model had the highest estimation accuracy, with R2 and RMSE values of 0.560 and 1634 kg/hm2, respectively. Fan et al. [31] used RR, SVM and RF for maize yield modeling. The results show that RF modeling worked best, and its R2 was 0.88. These results indicate that the RF and PLSR methods are reliable when used in evaluating the relationship between input parameters and yield.
Although remote sensing information combined with agronomic parameters can simulate the physiological growth process of crops, it requires a large amount of agronomic information, hindering the wide application range of the model. However, empirical statistics can establish a quantitative relationship between crop parameters and remote sensing information with fewer data, so it is widely used for the estimation of crop physiological and biochemical parameters. UAV remote sensing is widely used to estimate the physiological and biochemical parameters of crops due to its advantages of high efficiency, high resolution, low operational cost, and flexibility. The above studies used UAV imagery to analyze individual vegetation indexes or multiple vegetation indexes for crop yield estimation. However, there are few methods for winter wheat yield estimation using UAV digital color indexes and texture feature fusion. In this study, the construction of a winter wheat yield model was carried out using color indexes, texture features, and the fusion of color indexes and texture features to explore the different remote sensing information types as the independent variable factors. Empirical statistical regression and machine learning methods were used to improve the accuracy of yield estimation, providing a scientific method for fast and efficient wheat yield prediction.

2. Materials and Methods

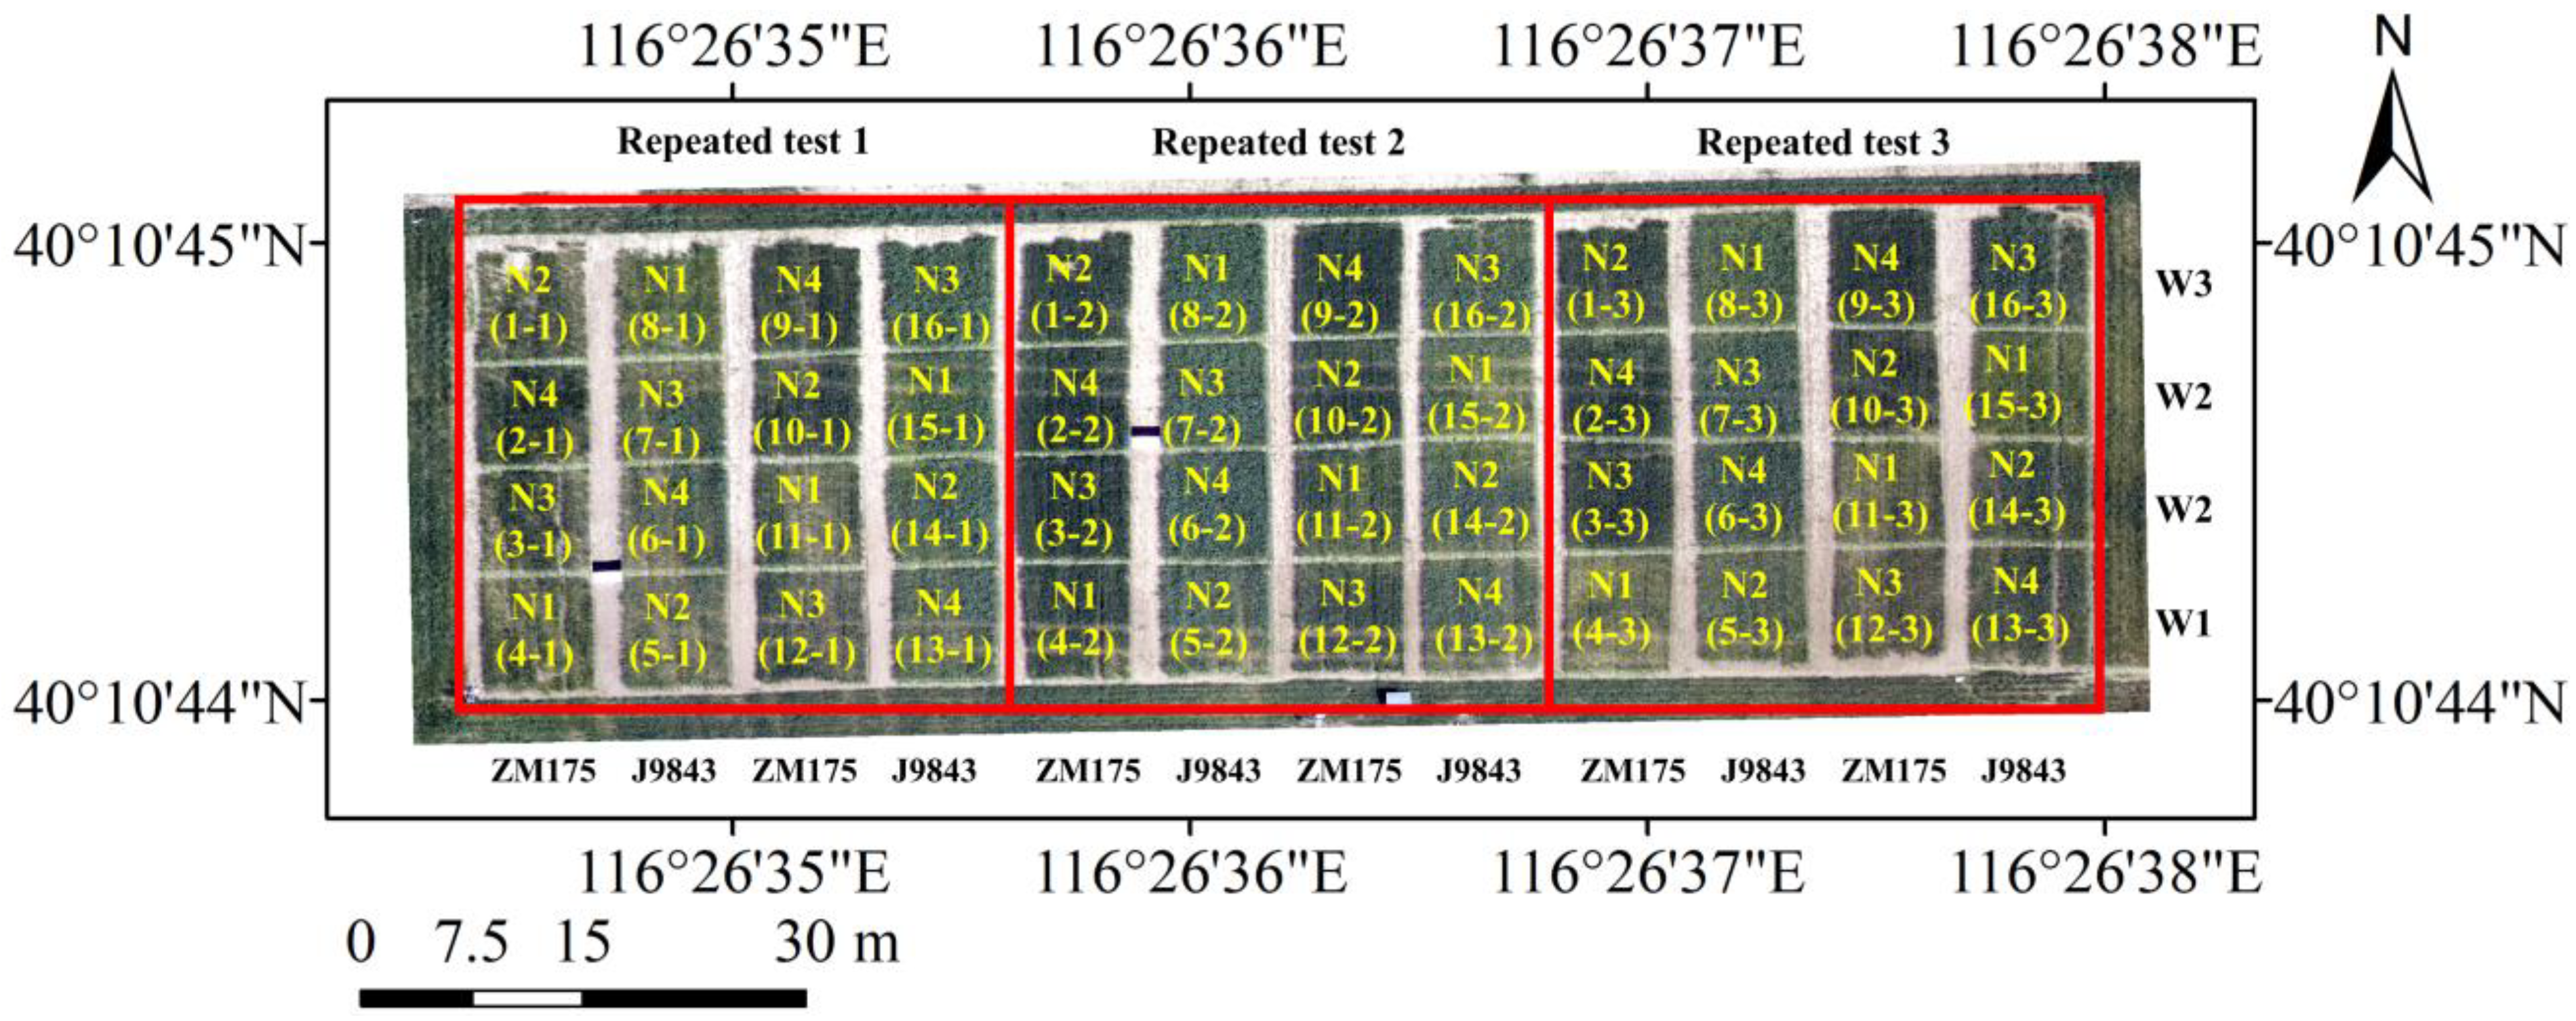
2.1. Experimental Design

The experiment was conducted at the National Precision Agriculture Research Demonstration Base in Xiaotangshan Town, Changping District, Beijing, China, which ranges from 116°34′ E to 117°00′ E and 40°00′ N to 40°21′ N, with an average elevation of 36 m. The terrain is flat, and the land is characterized by a warm, temperate continental monsoon climate suitable for wheat growth. Wheat was sown in October 2014 and harvested in June 2015. The two main types of wheat varieties were Jing 9843 (J9843) and ZhongMai 175 (ZM175). These are the main wheat varieties grown in North China. The leaves of the J9843 variety are spread out and have a high protein content; the leaves of Zhongmai 175 variety are upright and have a low protein content. Fertilizers were applied with four nitrogen levels: N1 (0 kg/hm2), N2 (1/2 normal nitrogen, 195 kg/hm2), N3 (normal nitrogen, 390 kg/hm2) and N4 (3/2 normal nitrogen, 585 kg/hm2). Setting the nitrogen in this way ensures that there are no settings of the same level in any subdivision, whether viewed horizontally or vertically, as well as enabling the use to eliminate differences in land. Water was mainly applied with W1 (rainfall), W2 (normal water), and W3 (2 times normal water). Setting the moisture in this way could enable us to reduce the impacts of neighboring plots and ensure the easy movement of equipment. The plants were planted traditionally. The length of the experimental field was 84 m in the east–west direction and 32 m in the north–south direction, with 16 plots for each treatment, and each treatment was repeated three times. Replicates 2 and 3 were used for modeling, and replicate 1 was used for verification. The detailed statistics are shown in Table 1. There were 48 plots in total, as shown in Figure 1.

2.2. Data Acquisition

2.2.1. Yield Acquisition

Wheat yield data were measured during the winter wheat harvest. Representative samples were selected from 1 m2 of each plot, which grew similarly to the whole plot, and the samples obtained were placed in bags and brought back to the laboratory. The wheat was sun-dried to a constant weight, and the yield of each plot was weighed.

2.2.2. Acquisition of Digital Images by UAV

An eight-rotor UAV equipped with a DSC-QX100 digital camera was used to acquire digital images of winter wheat during the flagging (26 April 2015), flowering (13 May 2015) and filling (22 May 2015) stages. The flying height of the UAV was at an altitude of 50 m; it flew at a speed of 4 meters per second, and aerial photographs of the experimental field were taken at noon under a clear and cloudless sky, with a spatial resolution of 0.013 m. The flight time was 15 min, and the heading and lateral overlap were 80%. The digitization footprint of the approach was 10476 Mb/ha. The digital images were stitched with PhotoScan software version 1.1.6 (Agisoft LLC, St. Petersburg, Russia) to obtain a digital elevation model (DEM) and digital orthophoto (DOM) of the experimental field, as described in reference [8,32].

2.3. Color Indexes Selection

Based on the DOM of the winter wheat test field, the average DN (Digital Number) values of the red (red, R), green (green, G), and blue bands (blue, B) of winter wheat in each plot in the DOM image were extracted using ArcGIS software (version 10.7; Esri, Redlands, CA, USA). The DN values of R, G and B were normalized; the values obtained after the normalization of R, G and B are defined as r, g and b. The formula is as follows:
r = R / ( R + G + B )
g = B / ( R + G + B )
b = B / ( R + G + B )
Based on the visible light color index available in the literature, 16 color indexes were selected, as well as the defined R, G, B, r, g, and b, for a total of 22 color indexes, as shown in Table 2.

2.4. Texture Feature Acquisition

Image texture features reflect the frequency of hue changes in an image [39,40], which depends not only on surface features, but also on the angle of illumination. In 1973 Haralick et al. proposed the Gray Level Co-occurrence Matrix (GLCM) to describe texture features. The texture calculation was performed in the “Co-occurrence Measures” in ENVI software (version 5.3; Boulder, CO, USA). Eight texture features were extracted in four directions (0°, 45°, 90° and 135°) from the red, green, and blue bands using the GLCM, and the texture features in four directions were averaged to obtain eight texture features for each band. Then, in ArcGIS, the region of interest was delineated for the image of each plot, and the average texture value of each region was extracted and was used as the final texture feature value for this plot. The eight texture feature values were mean (mean), variance (var), homogeneity (hom), contrast (con), dissimilarity (dis), entropy (ent), second moment (sec), and correlation (cor). The corresponding texture features in the red band are, respectively, mean_R, var_R, hom_R, con_R, dis_R, ent_R, sec_R and cor_R. The connected texture features in the green band are, respectively, mean_G, var_G, hom_G, con_G, dis_G, ent_G, sec_G and cor_G. The corresponding texture features in the blue band are, respectively, mean_B, var_B, hom_B, con_B, dis_B, ent_B, sec_B, and cor_B.

2.5. Data Analysis and Accuracy Evaluation

Partial least squares regression (PLSR) [41,42] and random forest (RF) [43,44] were used to construct the estimation model of winter wheat yield. Partial least squares are a mathematical optimization technique that finds the best function match for a data set by minimizing the sum of squared errors. It combines multiple linear regression, typical correlation, and principal component analyses. It simultaneously realizes regression modeling, simplifies the data structure, and analyzes the correlation between independent variables, which brings excellent variables to the statistical analysis of multivariate data and has good robustness in the established model. PLSR model building and charting were done using MATLAB2020a (commercial mathematical software produced by MathWorks, Natick, MA, USA) software and Excel2007 (Microsoft Office Software, Redmond, WA, USA). The random forest algorithm is an integrated learning method proposed by Breiman in 2001. It is a classifier containing many decision trees that can handle classification and regression problems, and is also suitable for problems with dimensionality reduction. RF regression combines multiple decision tree models to solve regression problems. Its basic principle is that each tree randomly extracts a portion of features from a sample, then constructs a decision tree from the training data, and finally combines the results of all the decision trees to produce a final prediction.

2.6. Precision Evaluation

The coefficient of determination (R2) and root mean square error (RMSE) [45] were used to evaluate the accuracy of the winter wheat yield model. R2 reflects the stability of the model’s establishment and validation; the closer R2 is to 1, the better the stability of the model is, and the measured value fits the predicted value to a high degree. RMSE is used to test the model’s forecasting ability; the smaller the RMSE is, the better the model’s estimation ability is.

3. Results and Discussion

3.1. Correlation between Color Indexes and Yield

Table 3 shows the results of the correlation analysis between the color indexes of digital images and yield. From Table 3, we see that there is no correlation between the color indexes g/b and WI and the yield at the flowering stage. In contrast, other color indexes are significantly correlated. During the flagging and flowering stages, gb was significantly correlated with yield at 0.05, and the rest of the color indexes were considerably associated with yield at 0.01. At the flagging stage, the color index with the highest absolute correlation value with yield was EXR, with a value of 0.6813. The performance metrics EXR, VARI, GRVI, NDI, and MGRVI were selected as independent variables for the winter wheat yield model construction. During the flowering stage, the color index with the highest absolute correlation value with yield was r, with a value of 0.7635. The performance metrics r, VARI, EXR, GRVI, and NDI were selected as the independent variables for yield model construction. During the filling stage, the remaining color index had a highly significant (0.01) correlation with yield. In contrast, the color index with the highest absolute correlation value with yield was r, with a value of 0.7521. r, (rgb)/(r + g), EXR, NDI, and GRVI were selected as the independent variables for constructing the yield model.

3.2. Correlation between Texture Feature Indexes and Yield

Table 4 shows the results of a correlation analysis of digital image texture feature indices with yield. Table 4 shows that some texture feature indices do not correlate well with yield. During the flag-picking period, the best absolute value of texture feature index correlation with yield was MEAN_R, with a value of 0.5296. The performance metrics MEAN_R, MEAN_G, SEC_G, SEC_R, and ENT_G were selected as the independent variables for yield modeling. During the flowering stage, the best absolute value of correlation between texture character index and yield was MEAN_G, with a value of 0.5136, and the performance metrics MEAN_G, MEAN_R, MEAN_B, COR_B, and COR_G were selected as the independent variables for yield modeling. During the filling period, the best absolute value of texture feature index correlation with yield was MEAN_R, with a value of 0.6263, and the performance metrics MEAN_R, MEAN_B, MEAN_G, SEC_G, and ENT_G were selected as the independent variables for yield modeling.

3.3. Inversion of Winter Wheat Yield Model

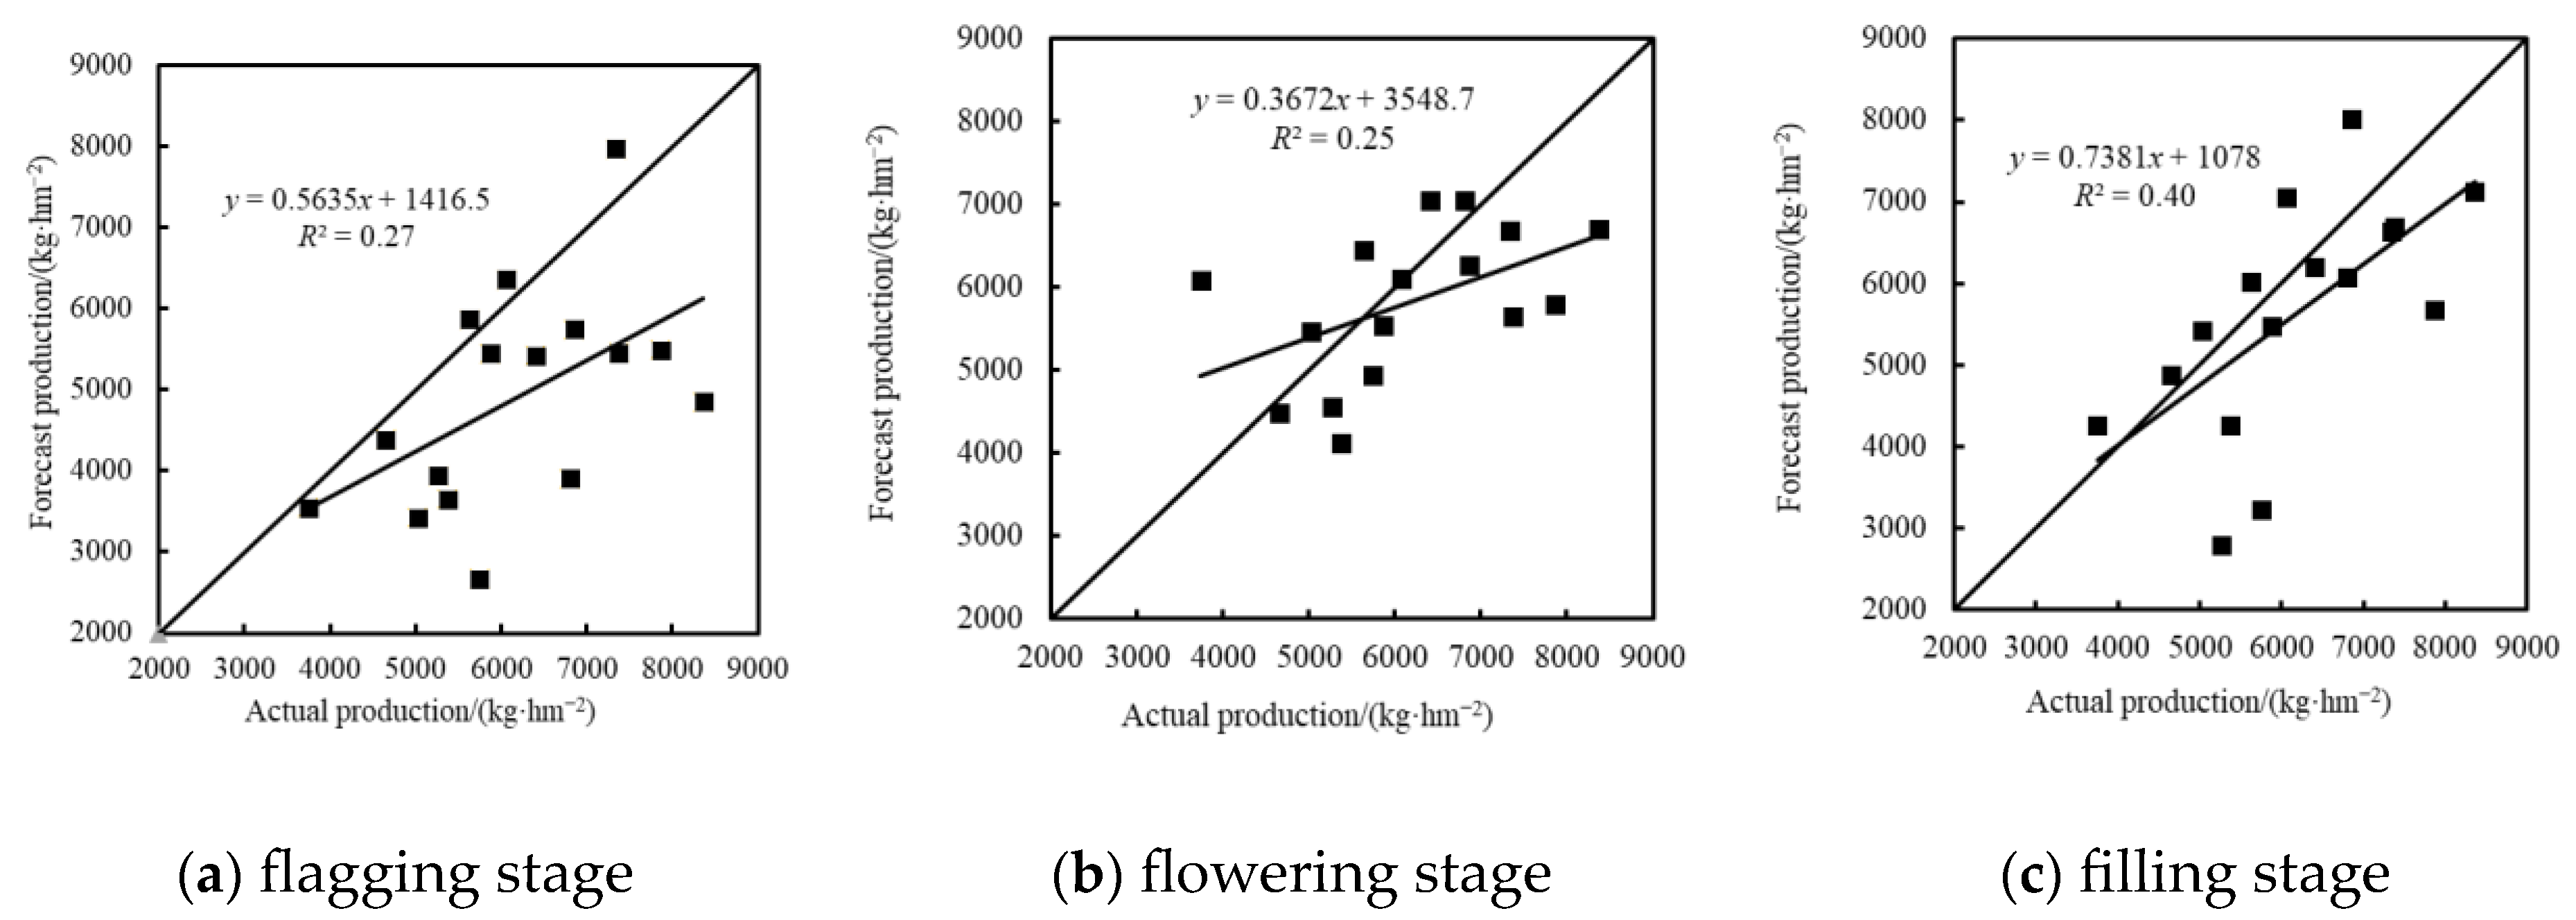
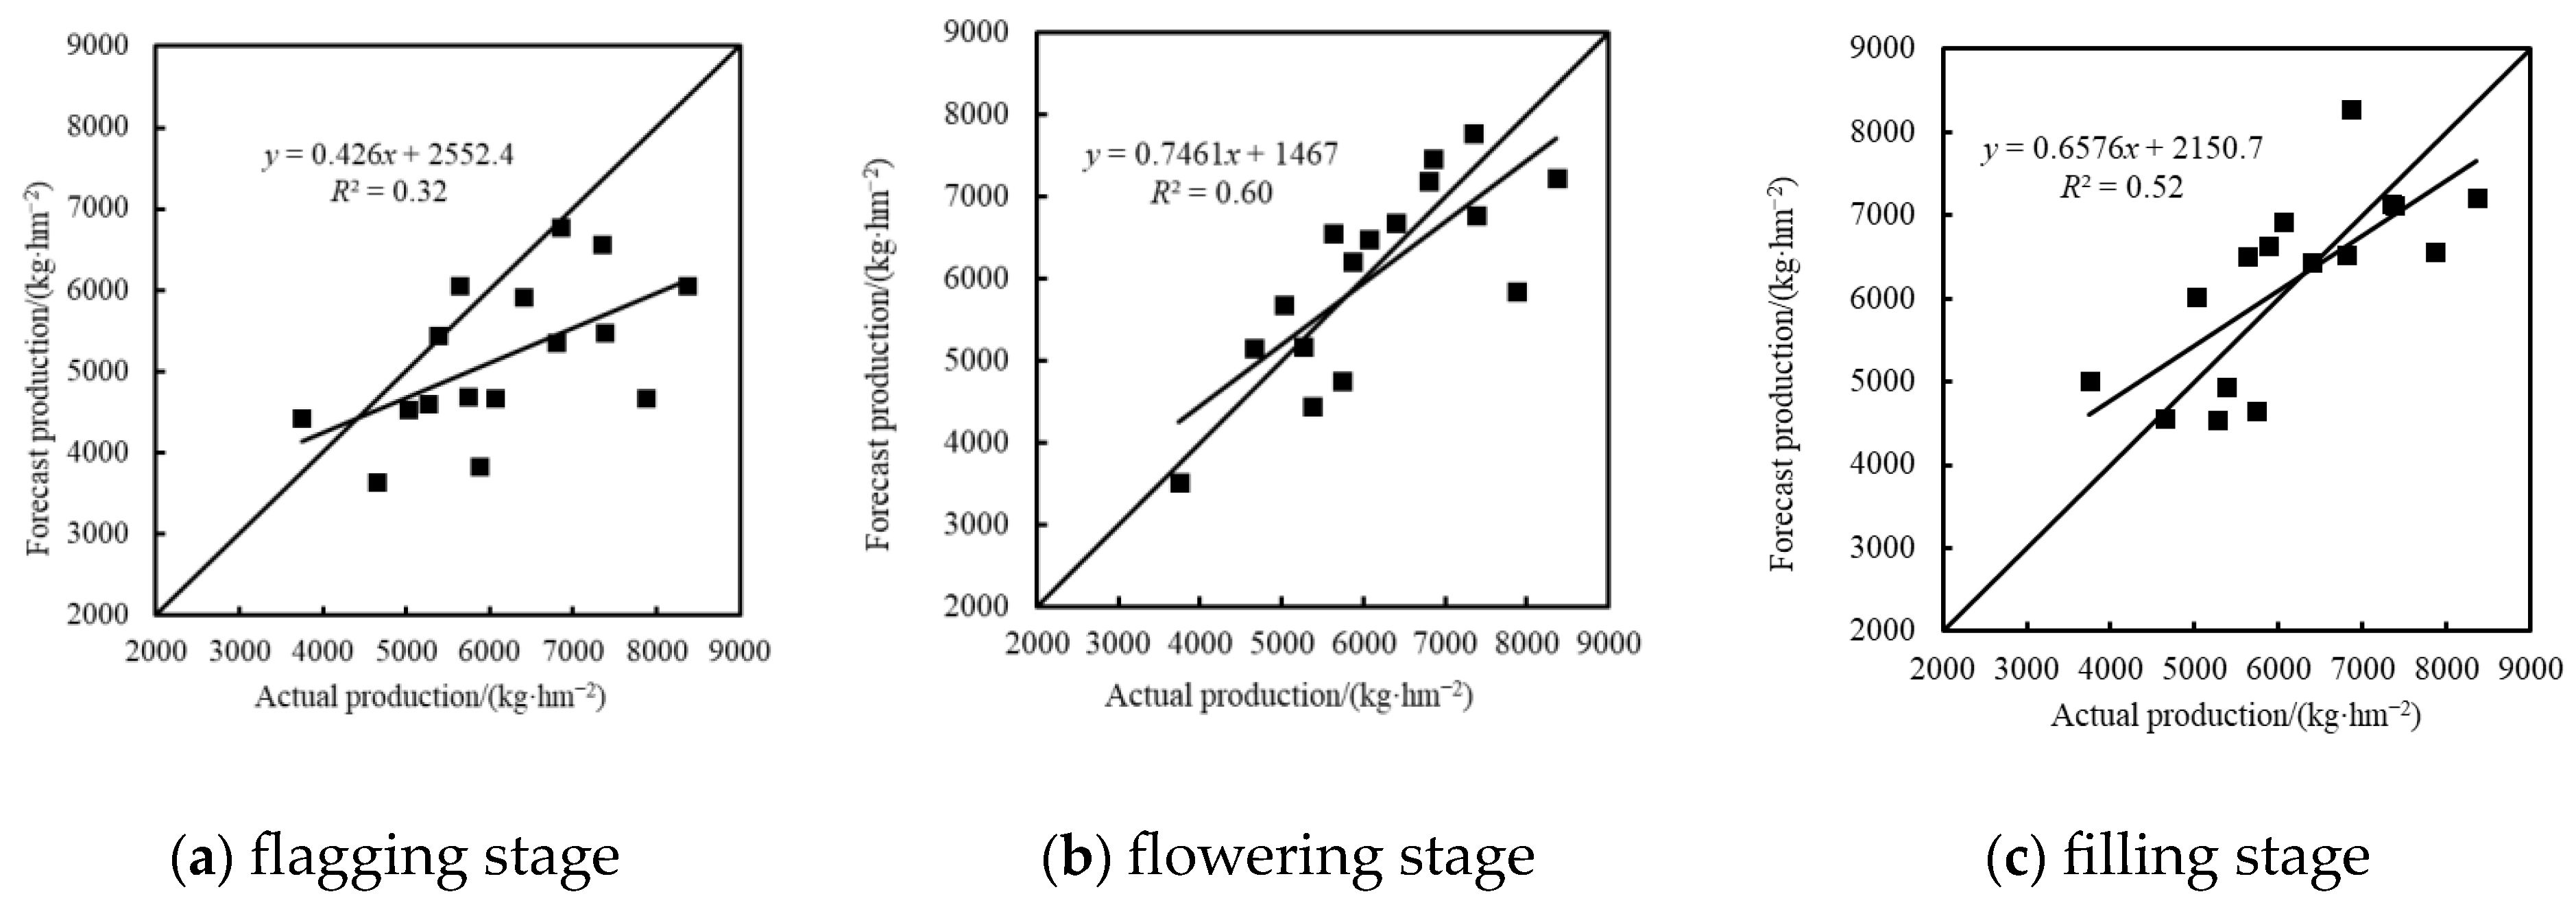
3.3.1. Yield Inversion Based on Color Indexes

A regression model for winter wheat yield was developed based on five color indexes using partial least squares regression and random forest (Table 5 and Figure 2 and Figure 3). The results show that: (1) The PLSR yield estimation model was more accurate than the RF yield estimation model based on visible vegetation index at three stages. (2) The yield estimation model at the filling stage was better than that at the flowering and flag-picking stages when using the PLSR model for yield estimation. Due to the instability of the random forest model, the model used for estimating yield at the filling stage had a lower R2 (0.01) than the model used for estimating yield at the flowering stage, but it was better than that of the model used for estimating yield at the flag-picking stage.
The validation results indicate (Figure 2) that most of the predicted yield values during the flag-picking stage were far away from the 1:1 line, and most of the regions were underestimated in terms of yield; most of the yield values during the flowering stage were near the 1:1 line, and only a few regions were undervalued in terms of yield, whereas the model accuracy during the grouting stage was poor. The predicted yield was underestimated in some regions compared to the actual yield, and some were overestimated and far away from the 1:1 line.
From the verification results in Figure 3, we can see that most of the predicted yield values in the flag-picking period were near the 1:1 line, and most of the expected yield values were underestimated; most of the predicted yield values in the flowering period were near the 1:1 line, but the expected yield values in some regions were underestimated. Many predicted values were underestimated in the filling period, and the predicted yield values In some areas were near the 1:1 line.
In Figure 4, we can see significant differences among replicates 1, 2, and 3 regarding area, with most of replicate 2’s area awarding higher yields than replicates 1 and 3, and most of replicate 1’s estimated area awarding higher yields than replicates 3. The yields under rainfed level treatments were lower, and were mainly distributed below 5280 kg/hm2, and the yields under two times water irrigation were better than those under regular water irrigation. The wheat yield under standard N application was around 7500 kg/hm2, which remained relatively high with excessive N application.

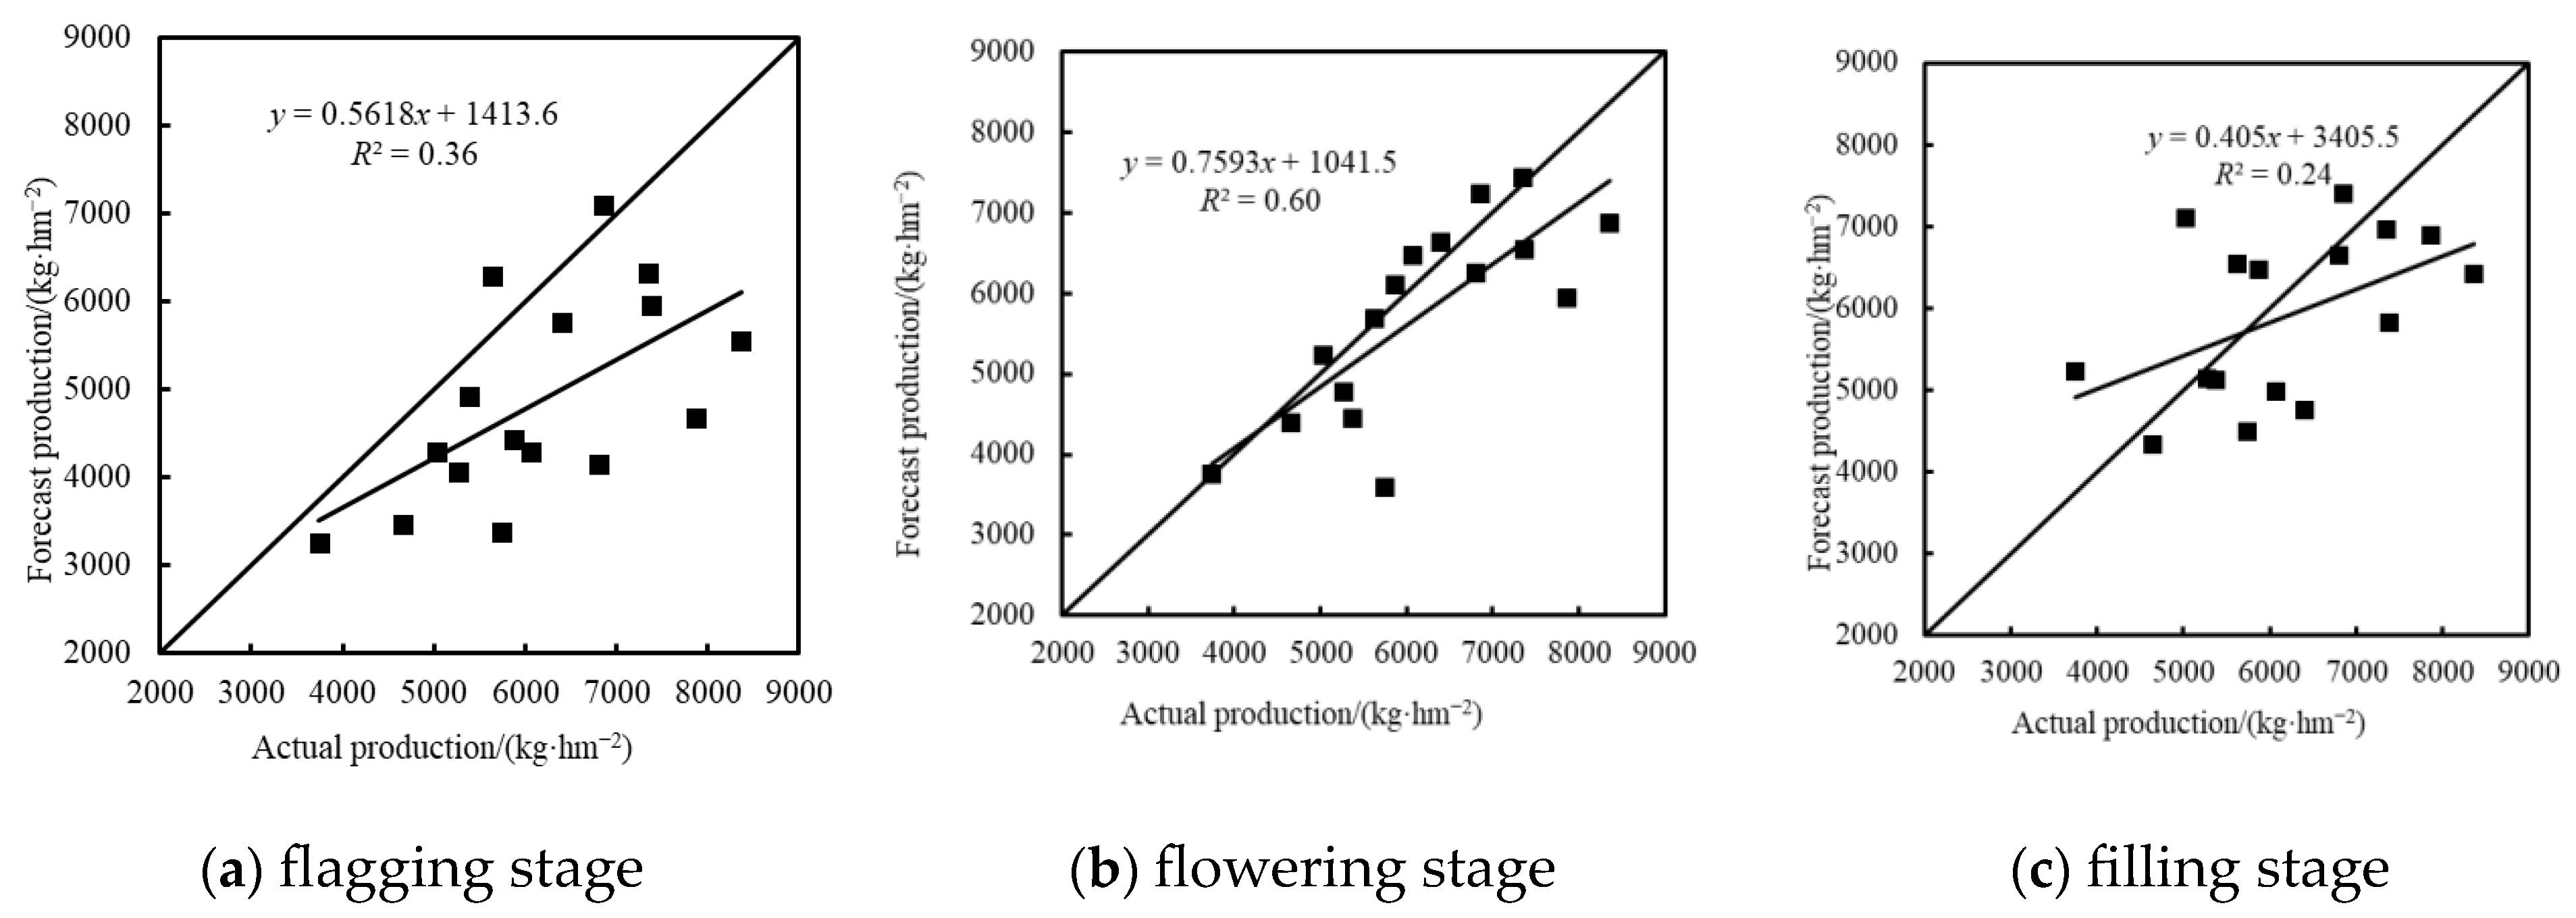
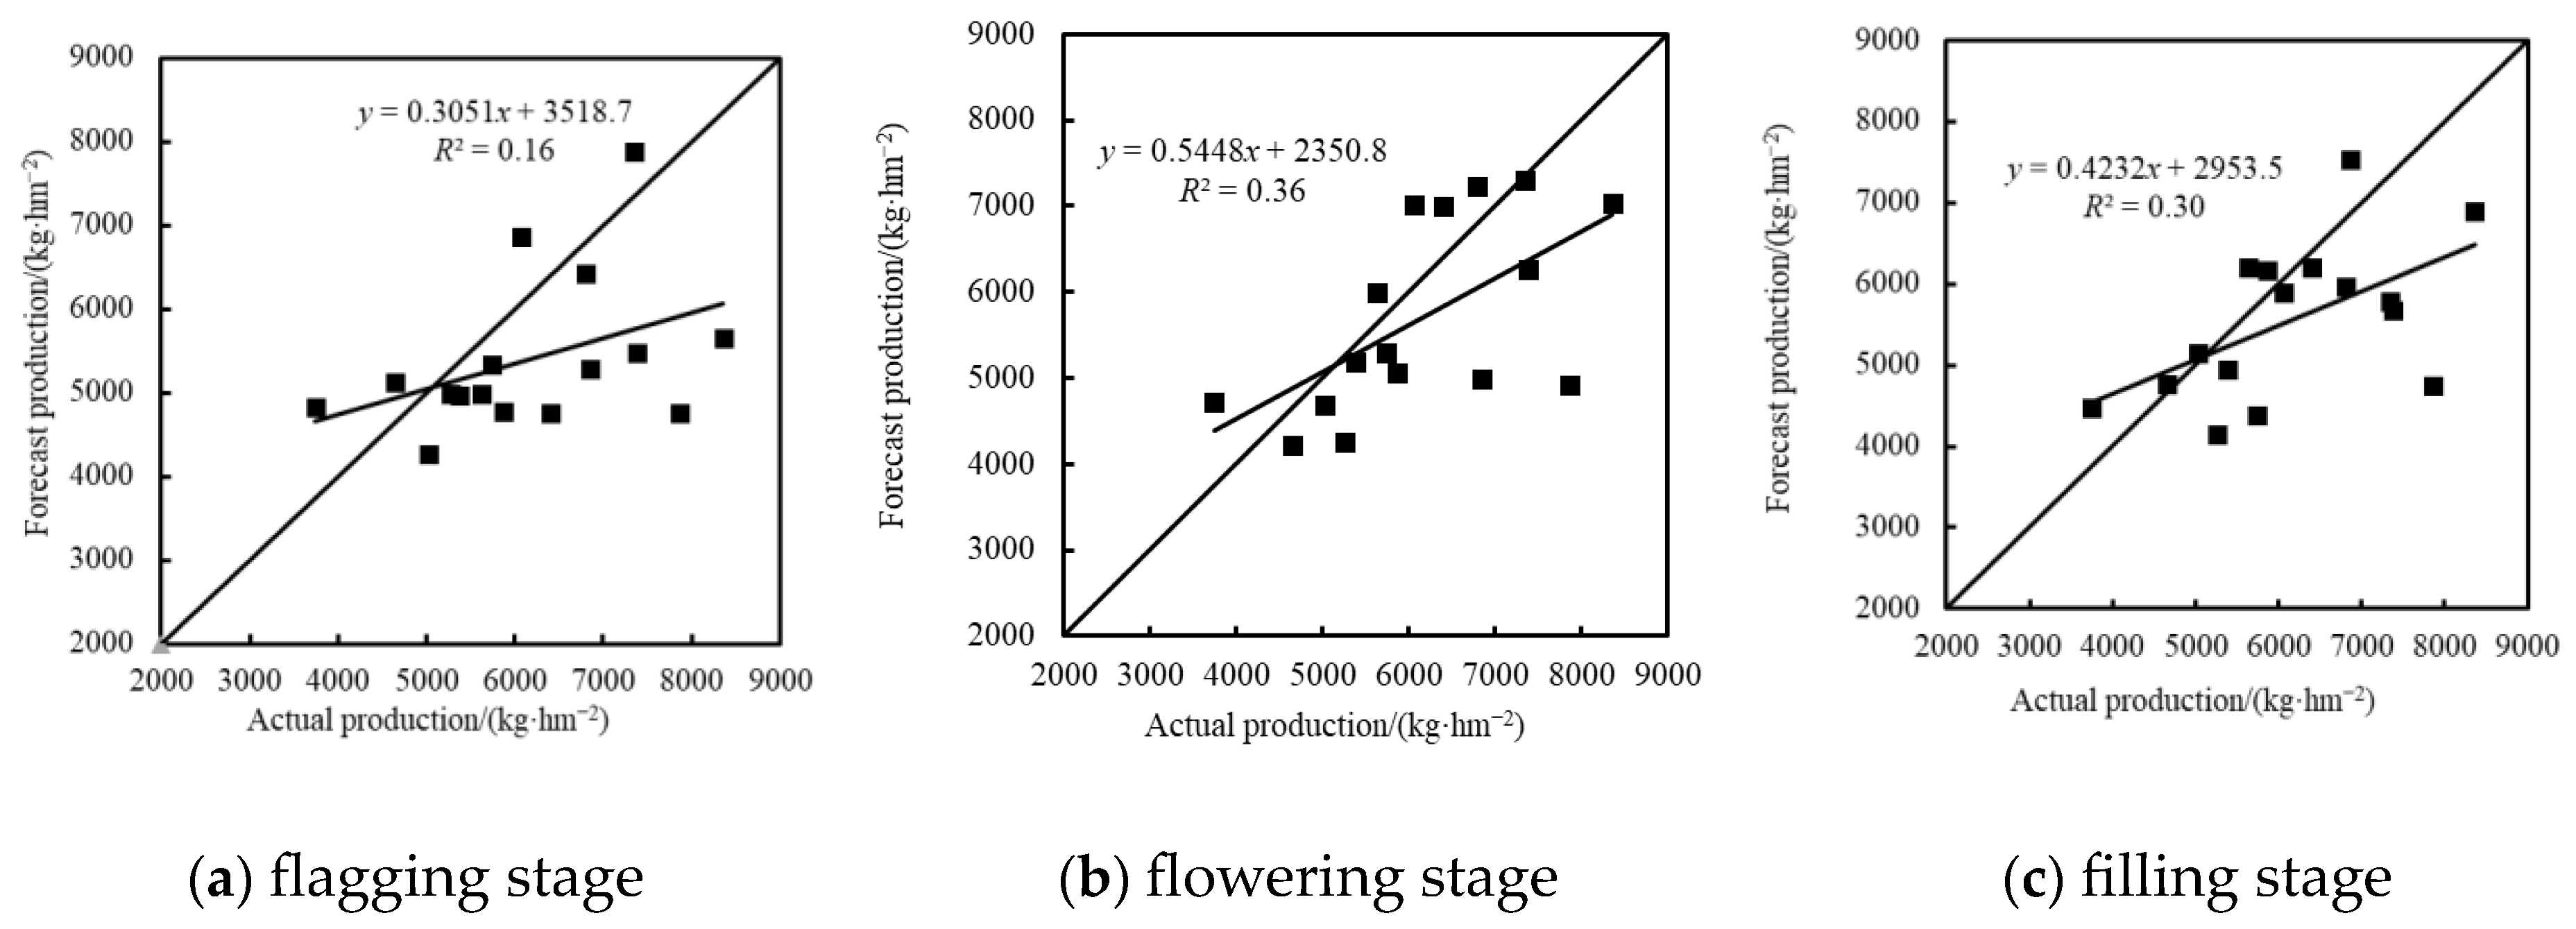
3.3.2. Yield Inversion Based on Texture Feature Indexes

Partial least squares regression and the random forest algorithm were used to establish a regression model for winter wheat yield based on five texture feature indices (Table 6 and Figure 5 and Figure 6). The results show that: (1) the PLSR yield estimation model was more accurate than the RF yield estimation model based on texture feature indexes at three stages. (2) The yield estimation model at the filling stage was superior to the yield estimation model at the flag-picking and flowering stages.
Figure 5 shows that most of the yield predictions in the picking stage needed to be underestimated. Aside from the 1:1 line, some yield predictions in the flowering were, and only some areas were overestimated, while others were underestimated. Some yields were around the 1:1 line at the filling stage, and some other areas were minimized.
The results indicate (Figure 6) that most of the predicted yield values in the flag-picking stage were underestimated and far away from the 1:1 line. In contrast, some predicted yield points in the flowering and grouting stages were near the 1:1 line, some points were underestimated, and the underestimated value was more than the overestimated value.
Figure 7 shows that there were significant regional differences among these regions. In the rainfed treatment (W1), winter wheat yield was distributed below 5027 kg/hm2. In the normal water (W2) and two times normal water (W3) treatments, winter wheat yield was larger, and the yield was concentrated in the range of 5027–8085 kg/hm2, compared with that in the W3 treatment, which was higher than that in the W2 treatment.

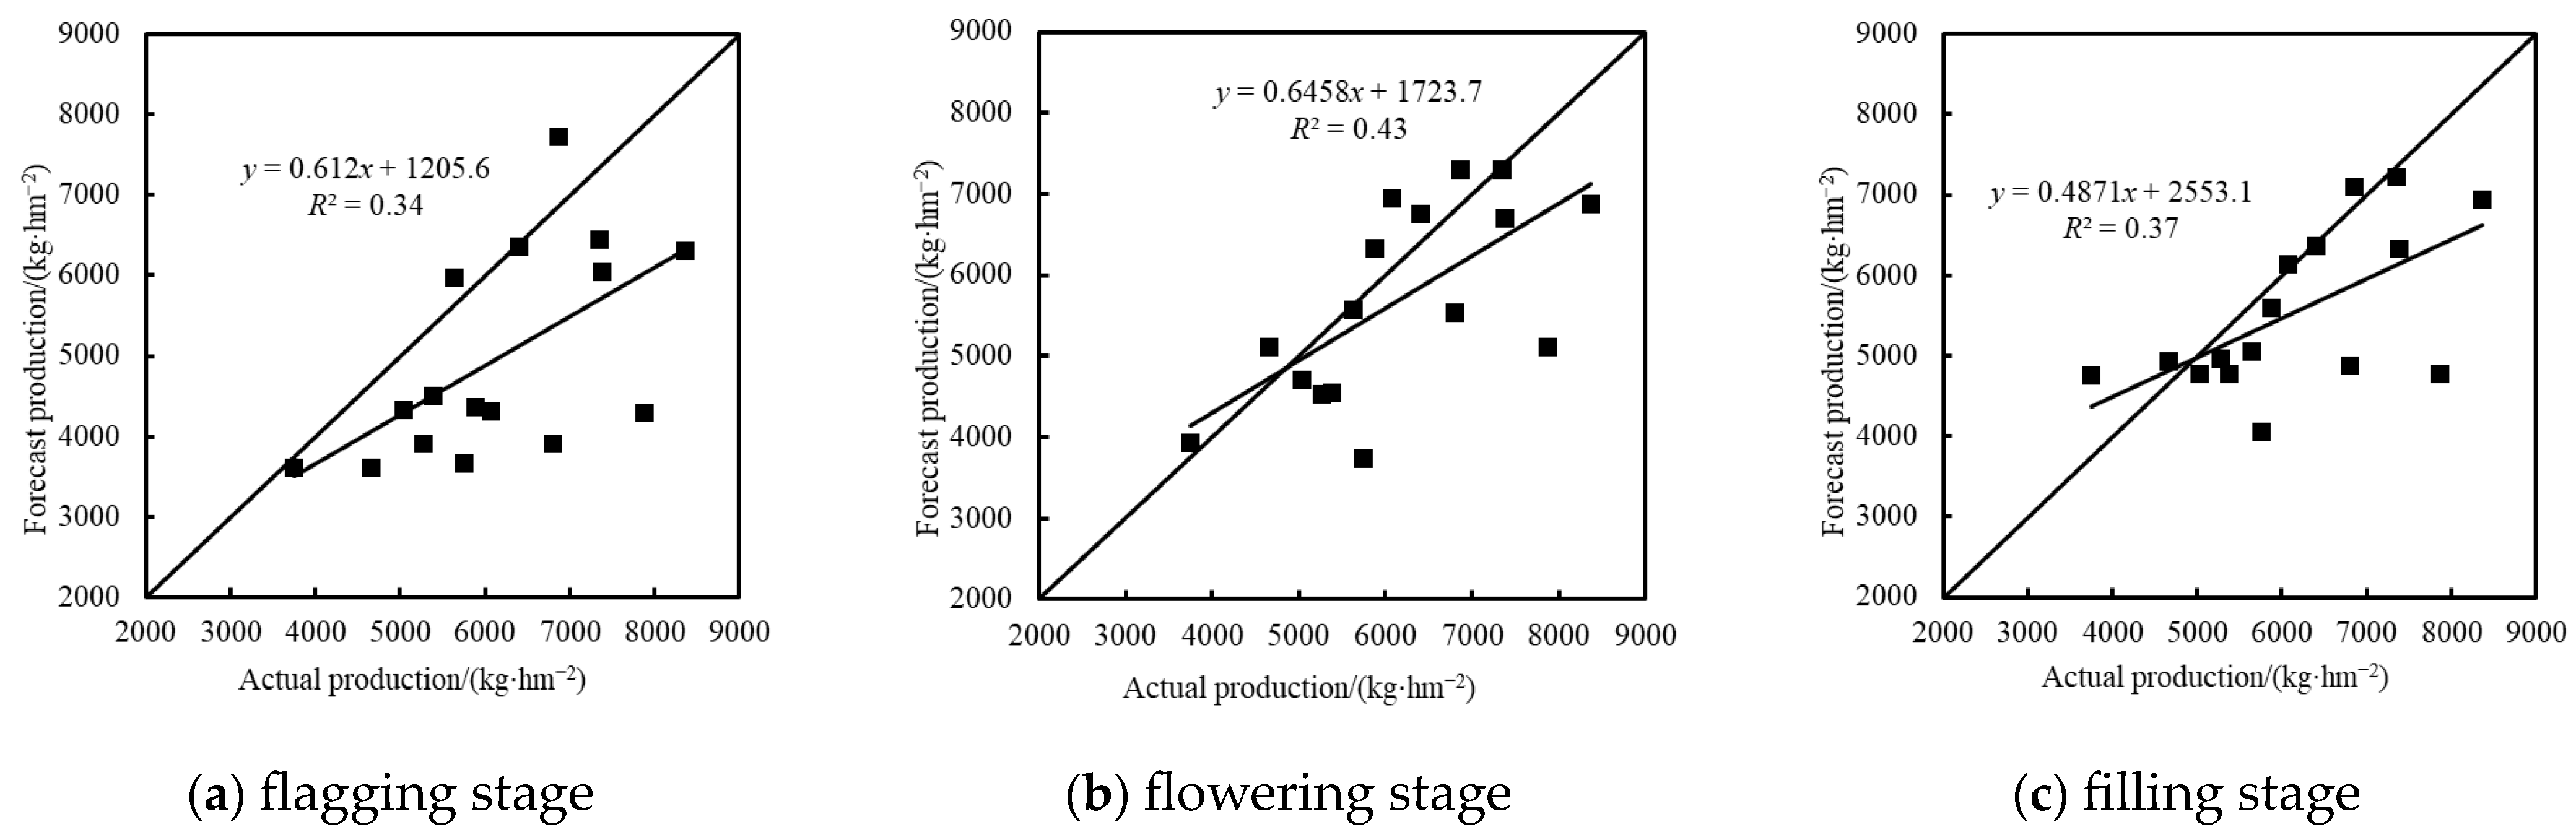
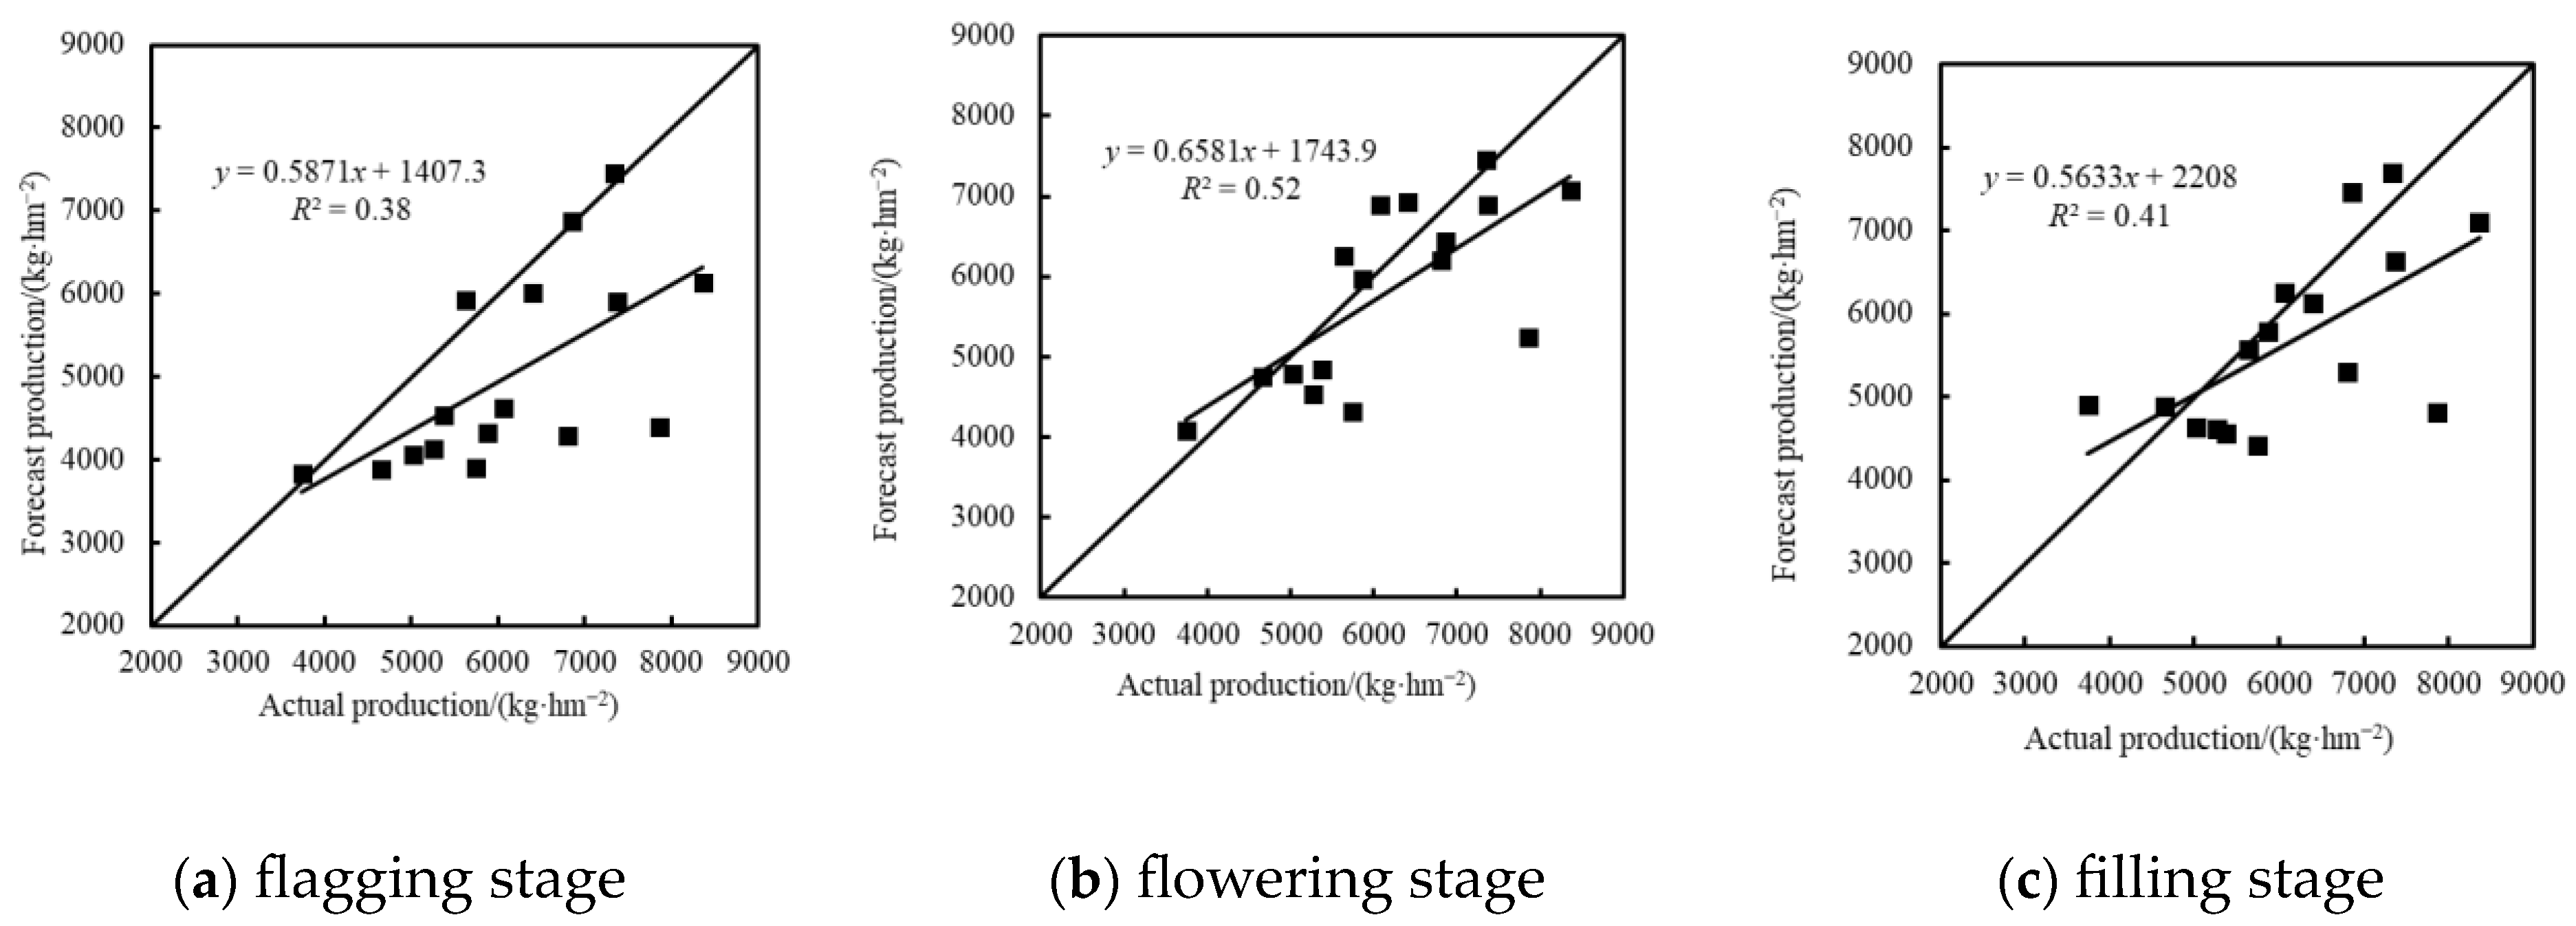
3.3.3. Yield Inversion Based on Fusion of Color Indexes and Texture Feature

In this study we selected the color indexes and texture feature fusion for yield inversion to predict the yield more effectively. The performance metrics EXR, VARI, GRVI, MEAN_R and MEAN_G were selected as independent variables to be used in the model for the estimation of the yield of winter wheat during the flag-picking stage. The performance metrics r, VARI, EXR, MEAN_G and MEAN_R were selected as independent variables to participate in the inversion of the yield model during the flowering stage. The performance metrics r, (rgb)/(r + g), EXR, MEAN_R and MEAN_B were selected as independent variables to participate in the inversion of yield model during the filling stage. The results are shown in Table 7 and Figure 8 and Figure 9. The result show that (1) the PLSR yield estimation model was more accurate than the RF yield estimation model based on visible vegetation indexes fused with texture feature indexes at three stages. (2) The yield estimation model at the filling stage was equal or superior to the yield estimation model at the flag-picking and flowering stages.
The results indicate (Figure 8) that the yield regions were still underestimated in most regions during the flag-picking period, and the predicted and measured yield values of flowering and grouting stages were distributed near the 1:1 line. The overestimated yield areas of the flowering stage numbered higher than those of the underestimated yield, and the overestimated yield areas of the grouting stage were equal to those of the underestimated yield.
Figure 9 shows that most of the regional yield values were underestimated during the flag-picking stage, and the predicted and measured yield values were near the 1:1 line in the flowering and irrigation stages, with most of the yield values being underestimated and very few points being seriously underestimated.
As shown in Figure 10, the yields of the regions for replicates 1, 2, and 3 were significantly different. Under rainfed treatment, there were significant differences between replicates 1, 2, and 3, but no significant difference in yield between replicates 1 and 2. Under rainfed treatment with no nitrogen application, the yield ranged from 3206 kg/hm2 to 5427 kg/hm2, and double water irrigation was shown to increase winter wheat yield.

4. Discussion

Accurate early yield estimates are important for food security and the formulation of agricultural policies. In recent years, UAV-based remote sensing data have increasingly been used for the assessment of grain crops such as corn [25] and wheat [31]. Our study extracted color indexes and texture features from UAV digital images, and employed machine learning for winter wheat yield estimation. This method can be used to obtain high accuracy at a relatively low cost.

4.1. The Impact of Growth Period on Yield

Due to the different canopy structures at the flagging, flowering, and irrigating stages of winter wheat, the color features and texture features obtained by a UAV equipped with a digital camera are different, resulting in the greater accuracy of the yield models constructed via other methods in the flagging, flowering, and irrigating stages [46]. The flag-picking and flowering stages are the stages of both vegetative and reproductive growth for wheat. Wheat in the filling stage enters the reproductive growth stage, and its water consumption in the flag-picking stage is large, which is the critical period to determine the number of ears per mu and the number of grains per ear. Wheat in the flowering stage is the most sensitive to fertilizer, light, and temperature. A lack of water or a low temperature will make wheat pollination poor, affecting the seed setting rate and thousand-grain weight. In the filling stage, the leaves and stems of wheat produce starch through photosynthesis, and the transformed proteins are stored in the wheat seeds through assimilation. The filling stage also accelerates the growth of wheat, and many wheat grains are produced at this stage. The remote sensing images collected during these three periods can accurately reflect the yield, consistent with the growth periods selected in the literature [9,30].

4.2. The Impact of Different Algorithms on Yield Estimation

To date, many machine learning models (such as RF and PLSR) have been successfully used for early crop yield estimation. Because the sensitivities of different bands to yield are different, the precision of yield modeling is greater in different growth periods. This study selected five color indexes, five texture feature indexes, and color indexes fused with texture feature indexes to construct yield models in the flagging stage, flowering stage, and filling stage according to the sensitive yield bands in the three growth stages [23]. It was found that the PLSR model achieved better yield estimation accuracy than the RF model in the three growth stages, which may have been caused by inconsistencies between the importance of projection variables used in PLSR and the importance of the out-of-pocket data set used as variables in RF. Whether using RF or PLSR methods, the accuracy of production estimation using color indexes fused with texture feature indexes is greater than the accuracy of production estimation using color indexes or texture feature indexes. The yield model constructed by Ma et al. [22] with color feature indices fused with texture feature indices is optimal; the R2 was 0.91. The R2 of the yield modeled by Qu et al. [23] by use of color feature indices fused with texture feature indices was 0.77. The wheat yield prediction model constructed by Liu et al. [47] with color feature indices fused with texture feature indices was verified, and its R2 was 0.629, which is 16.27% higher than that of the color index model. This study’s findings are consistent with those of [22,23,47].

5. Conclusions

Most color indexes in different growth stages significantly correlate with yield (p < 0.01). In contrast, only a few texture feature indexes were here significantly associated with yield (p < 0.01). The optimal color indexes, texture feature indexes and color indexes combined with texture indexes were used as input factors in the yield model. PLSR and RF were used to establish winter wheat yield estimation models at different growth stages. The results show that:
(1)
A model for estimating winter wheat yield using color indexes fused with texture feature indexes outperforms wheat yield models constructed using color indexes or texture feature indexes;
(2)
The wheat yield model constructed by PLSR was superior to the yield model constructed by RF for the flagging stage, flowering stage, and filling stage. The R2 and RMSE values of the optimal yield model modeled with PLSR were 0.75, 0.71 and 0.76 and 738.48 kg/hm2, 794.77 kg/hm2 and 728.85 kg/hm2 when using color indexes, texture indexes and color indexes fused with texture indexes, respectively, as the independent variable in the filling stage;
(3)
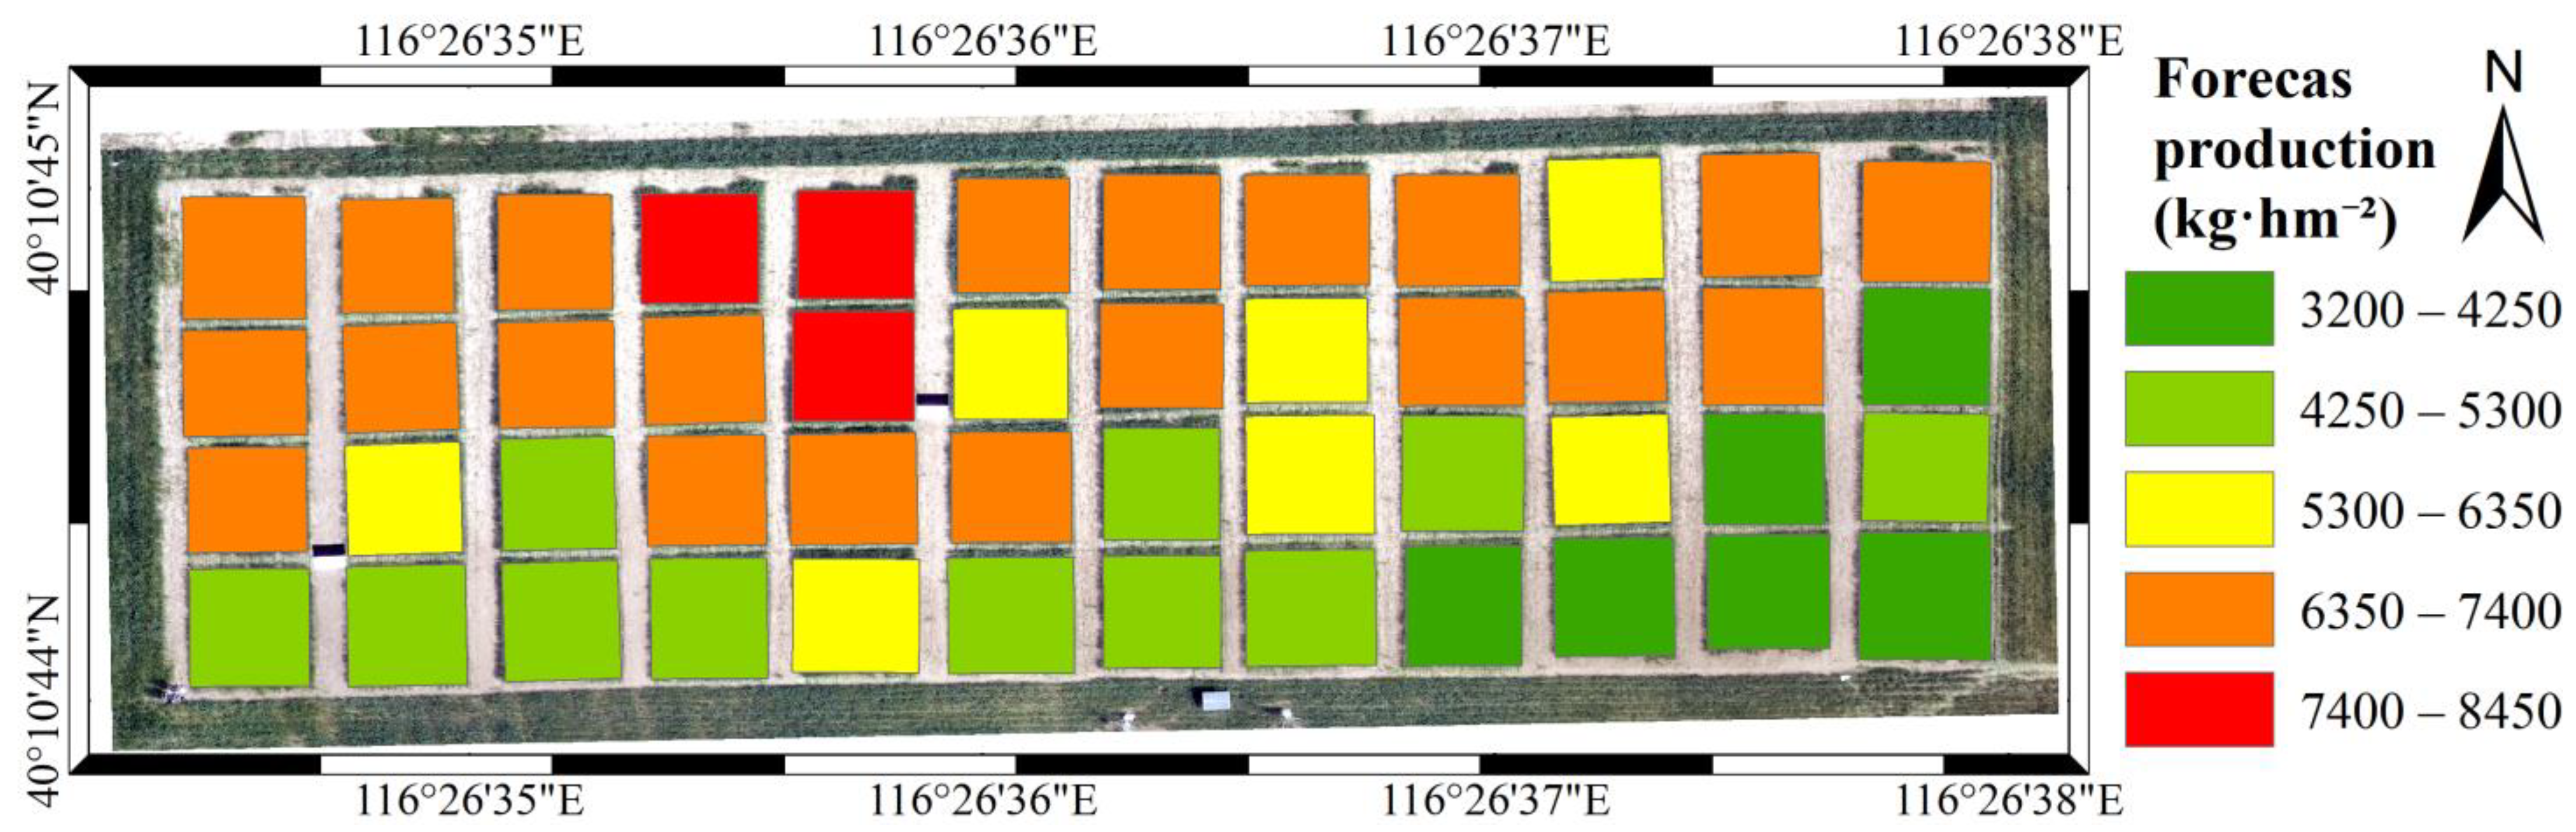
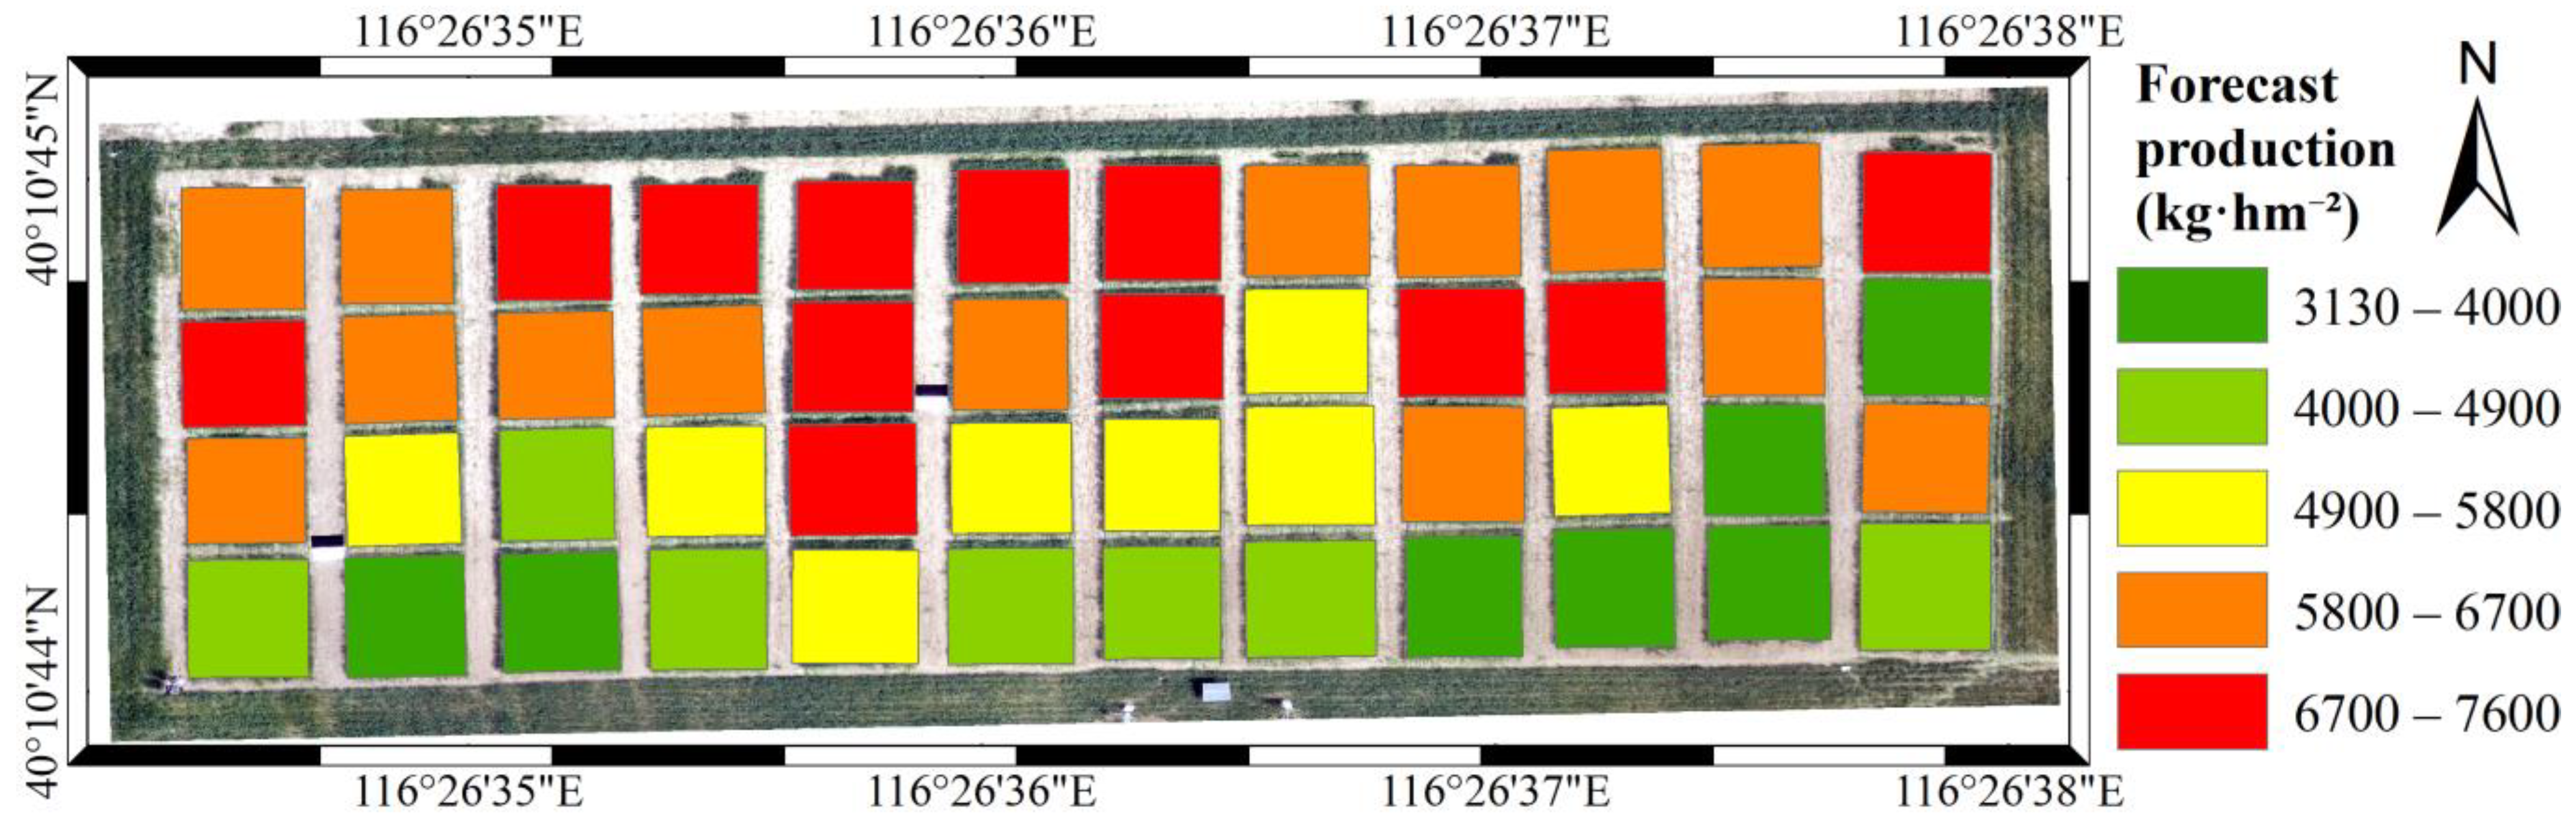
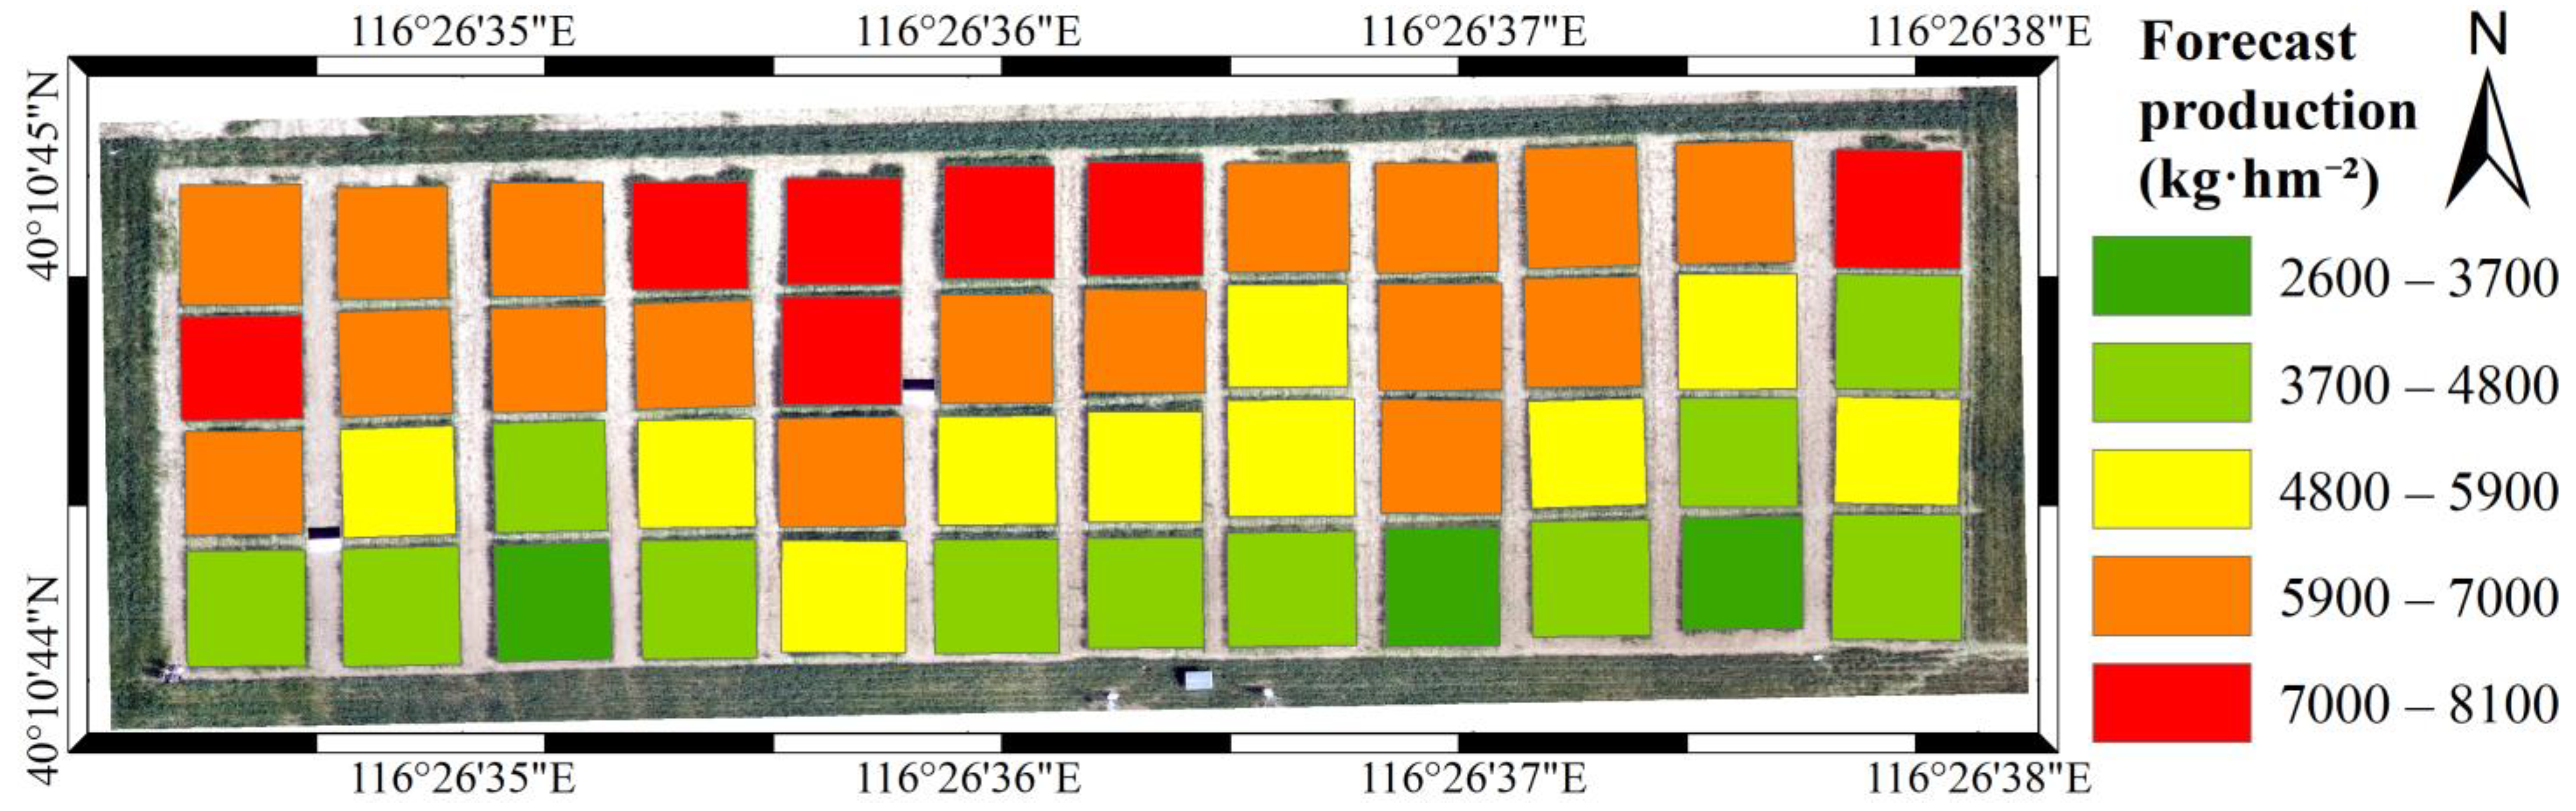
A winter wheat yield distribution map can be used to more effectively monitor winter wheat yield distribution and provide a more scientific method for guiding fertilization and irrigation, and increasing yield.
Of course, current research and modeling methods also have some limitations. Firstly, this study only used color indexes and texture features extracted from RGB images, which can affect the accuracy of yield prediction. Further research should consider the use of high-spectral-resolution data. The applicability of the model needs to be validated in the future by considering the use of data collected from more years and locations.

Author Contributions

Conceptualization, H.F., F.Y. and Y.L.; methodology, H.F. and F.Y.; software, X.M.; validation, L.G., Y.L. and J.T.; formal analysis, Y.X.; investigation, H.F. and F.Y.; resources, H.F.; data curation, F.Y.; writing—original draft preparation, F.Y. and Y.L.; writing—review and editing, H.F. and F.Y.; visualization, L.G.; supervision, J.Y.; project administration, H.F.; funding acquisition, H.F. All authors have read and agreed to the published version of the manuscript.

Funding

This research was funded by The National Key Research and Development Program of China (No. 2022YFD2001104, 2023YFD2000102); Henan University of Engineering College Student Innovation and Entrepreneurship Training Program Project (No. 202311517028); Key Research Projects of Higher Education Institutions in Henan Province (No. 24B420004).

Institutional Review Board Statement

Not applicable.

Data Availability Statement

The data presented in this paper are part of an ongoing study and the dataset is difficult to access; permission from the corresponding author is required to access the dataset.

Conflicts of Interest

The authors declare no conflicts of interest.

References

  1. Liu, Y.; Feng, H.K.; Yue, J.B.; Li, Z.H.; Yang, G.J.; Song, X.Y.; Yang, X.D.; Zhao, Y. Remote-sensing estimation of potato above-ground biomass based on spectral and spatial features extracted from high-definition digital camera images. Comput. Electron. Agr. 2022, 198, 107089. [Google Scholar] [CrossRef]
  2. Geipel, J.; Link, J.; Claupein, W. Combined spectral and spatial modeling of corn yield based on aerial images and crop surface models acquired with an unmanned aircraft system. Remote Sens. 2014, 6, 10335–10355. [Google Scholar] [CrossRef]
  3. Wang, L.; Tian, Y.; Yao, X.; Zhu, Y.; Cao, W.X. Predicting grain yield and protein content in wheat by fusing multi-sensor and multi-temporal remote-sensing images. Field Crop. Res. 2014, 164, 178–188. [Google Scholar] [CrossRef]
  4. Noureldin, N.; Aboelghar, M.; Saudy, H.; Ali, A. Rice yield forecasting models using satellite imagery in Egypt. Egypt. J. Remote Sens. Space Sci. 2013, 16, 125–131. [Google Scholar] [CrossRef]
  5. Wang, J.H.; Zhao, C.J.; Huang, W.J. Fundamentals and Applications of Quantitative Remote Sensing in Agriculture; Science Press: Beijing, China, 2008. [Google Scholar]
  6. Zhu, W.X.; Li, S.J.; Zhang, X.B.; Li, Y.; Sun, Z.G. Estimation of winter wheat yield using optimal vegetation indices from unmanned aerial vehicle remote sensing. Trans. Chin. Soc. Agric. Eng. 2018, 34, 78–86. [Google Scholar]
  7. Liu, J.M.; Zhou, Z.; He, X.X.; Wang, P.X.; Huang, J.X. Winter Wheat Yield Estimation Method Based on NDWI and Convolutional Neural Network. Trans. Chin. Soc. Agric. Mach. 2021, 52, 273–280. [Google Scholar]
  8. Zhou, X.; Zheng, H.B.; Xu, X.Q.; He, J.Y.; Ge, X.K.; Yao, X.; Cheng, T.; Zhu, Y.; Cao, W.X.; Tian, Y.C. Predicting grain yield in rice using multi-temporal vegetation indices from UAV-based multispectral and digital imagery. ISPRS J. Photogramm. 2017, 130, 246–255. [Google Scholar] [CrossRef]
  9. Tao, H.L.; Xu, L.J.; Feng, H.K.; Yang, G.J.; Yang, X.D.; Niu, Y.C. Winter Wheat Yield Estimation Based on UAV Hyperspectral Remote Sensing Data. Trans. Chin. Soc. Agric. Mach. 2020, 51, 146–155. [Google Scholar]
  10. Zhang, M.N.; Feng, A.J.; Zhou, J.F.; Lv, X.L. Cotton yield prediction using remote visual and spectral images captured by UAV system. Trans. Chin. Soc. Agric. Eng. 2019, 35, 91–98. [Google Scholar]
  11. Fei, S.; Chen, Z.; Li, L.; Ma, Y.; Xiao, W. Bayesian model averaging to improve the yield prediction in wheat breeding trials. Agric. For. Meteorol. 2023, 328, 109237. [Google Scholar] [CrossRef]
  12. Tao, H.L.; Feng, H.K.; Xu, L.J.; Miao, M.K.; Yang, G.J.; Yang, X.D.; Fan, L. Estimation of the yield and plant height of winter wheat using UAV-based hyperspectral images. Sensors 2020, 20, 1231. [Google Scholar] [CrossRef]
  13. Huang, J.X.; Huang, H.; Ma, H.Y.; Zhuo, W.; Huang, R.; Gao, X.R.; Liu, J.M.; Su, W.; Li, L.; Zhang, X.D.; et al. Review on data assimilation of remote sensing and crop growth models. Trans. Chin. Soc. Agric. Eng. 2018, 34, 144–156. [Google Scholar]
  14. Pantazi, X.E.; Moshou, D.; Alexandridis, T.; Whetton, R.L.; Mouazen, A.M. Wheat yield prediction using machine learning and advanced sensing techniques. Comput. Electron. Agric. 2016, 121, 57–65. [Google Scholar] [CrossRef]
  15. Huang, J.; Tian, L.; Liang, S.; Ma, H.; Becker-Reshef, I.; Huang, Y.B.; Su, W.; Zhang, X.D.; Zhu, D.H.; Wu, W.B. Improving winter wheat yield estimation by assimilation of the leaf area index from Landsat TM and MODIS data into the WOFOST model. Agric. For. Meteorol. 2015, 204, 106–121. [Google Scholar] [CrossRef]
  16. Wang, L.G.; Zheng, G.Q.; Guo, Y.; He, J.; Cheng, Y.Z. Prediction of Winter Wheat Yield Based on Fusing Multi-source Spatio-temporal Data. Trans. Chin. Soc. Agric. Mach. 2022, 53, 198–204. [Google Scholar]
  17. Zhang, N.; Liu, X.; Ren, J.; Wu, S.; Li, F. Estimating the winter wheat harvest index with canopy hyperspectral remote sensing data based on the dynamic fraction of post-anthesis phase biomass accumulation. Int. J. Remote Sens. 2022, 43, 2029–2058. [Google Scholar] [CrossRef]
  18. Huang, J.; Ma, H.; Sedano, F.; Lewis, P.; Liang, S.; Wu, Q.L.; Su, W.; Zhang, X.D.; Zhu, D.H. Evaluation of regional estimates of winter wheat yield by assimilating three remotely sensed reflectance datasets into the coupled WOFOST–PROSAIL model. Eur. J. Agron. 2019, 102, 1–13. [Google Scholar] [CrossRef]
  19. Liu, Y.; Feng, H.K.; Yue, J.B.; Fan, Y.G.; Bian, M.B.; Ma, Y.P.; Jin, X.L.; Song, X.Y.; Yang, G.J. Estimating potato above-ground biomass by using integrated unmanned aerial system-based optical, structural, and textural canopy measurements. Comput. Electron. Agr. 2023, 213, 108229. [Google Scholar] [CrossRef]
  20. Schwalbert, R.A.; Amado, T.; Corassa, G.; Pott, L.P.; Prasad, P.V.; Ciampitti, I.A. Satellite-based soybean yield forecast: Integrating machine learning and weather data for improving crop yield prediction in southern Brazil. Agric. For. Meteorol. 2020, 284, 107886. [Google Scholar] [CrossRef]
  21. Liu, Y.; Feng, H.K.; Yue, J.B.; Jin, X.L.; Li, Z.H.; Yang, G.J. Estimation of potato above-ground biomass based on unmanned aerial vehicle red-green-blue images with different texture features and crop height. Front. Plant Sci. 2022, 13, 938216. [Google Scholar] [CrossRef]
  22. Ma, Y.R.; Ma, L.L.; Zhang, Q.; Huang, C.P.; Yi, X.; Chen, X.Y.; Hou, T.Y.; Lv, X.; Zhang, Z. Cotton yield estimation based on vegetation indices and texture features derived from RGB image. Front. Plant Sci. 2022, 13, 925986. [Google Scholar] [CrossRef] [PubMed]
  23. Qu, H.C.; Zheng, C.F.; Ji, H.; Barai, K.; Zhang, Y.J. A fast and efficient approach to estimate wild blueberry yield using machine learning with drone photography: Flight altitude, sampling method and model effects. Comput. Electron. Agric. 2024, 216, 108543. [Google Scholar] [CrossRef]
  24. Maimaitijiang, M.; Sagan, V.; Sidike, P.; Hartling, S.; Esposito, F.; Fritschi, F.B. Soybean yield prediction from UAV using multimodal data fusion and deep learning. Remote Sens. Environ. 2020, 237, 111599. [Google Scholar] [CrossRef]
  25. Wang, Y.M.; Zhang, Z.; Feng, L.W.; Du, Q.Y.; Runge, T. Combining Multi-Source Data and Machine Learning Approaches to Predict Winter Wheat Yield in the Conterminous United States. Remote Sens. 2020, 12, 1232. [Google Scholar] [CrossRef]
  26. Feng, L.W.; Zhang, Z.; Ma, Y.C.; Du, Q.Y.; Williams, P.; Drewry, J.; Luck, B. Alfalfa yield prediction using UAV-based hyperspectral imagery and ensemble learning. Remote Sens. 2020, 12, 2028. [Google Scholar] [CrossRef]
  27. Fei, S.P.; Hassan, M.A.; He, Z.H.; Chen, Z.; Shu, M.Y.; Wang, J.K.; Li, C.C.; Xiao, Y.G. Assessment of ensemble learning to predict wheat grain yield based on UAV-multispectral reflectance. Remote Sens. 2021, 13, 2338. [Google Scholar] [CrossRef]
  28. Cui, Y.X.; Ji, Y.S.; Liu, R.; Li, W.Y.; Liu, Y.J.; Liu, Z.H.; Zong, X.; Yang, T. Faba bean (Vicia faba L.) yield estimation based on dual-sensor data. Drones 2023, 7, 378. [Google Scholar] [CrossRef]
  29. Alabi, T.R.; Abebe, A.T.; Chigeza, G.; Fowobaje, K.R. Estimation of soybean grain yield from multispectral high-resolution UAV data with machine learning models in West Africa. Remote Sens. Appl. Soc. Environ. 2022, 27, 100782. [Google Scholar] [CrossRef]
  30. Cheng, Q.; Xu, H.; Cao, Y.; Duan, F.; Chen, Z. Grain yield prediction of Winter Wheat using Multi-temporal UAV base on multispectral vegetation index. Trans. Chin. Soc. Agric. Mach. 2021, 52, 160–167. [Google Scholar]
  31. Fan, J.H.; Zhou, J.; Wang, B.W.; Kaeppler, S.M.; Lima, D.C.; Zhang, Z. Estimation of maize yield and flowering time using multi-temporal UAV-based hyperspectral data. Remote Sens. 2022, 14, 3052. [Google Scholar] [CrossRef]
  32. Liu, Y.; Feng, H.K.; Yue, J.B.; Jin, X.L.; Fan, Y.G.; Chen, R.Q.; Bian, M.B.; Ma, Y.P.; Song, X.Y.; Yang, G.J. Improved potato AGB estimates based on UAV RGB and hyperspectral images. Comput. Electron. Agr. 2023, 214, 108260. [Google Scholar] [CrossRef]
  33. Dai, J.G.; Jiang, N.; Xue, J.L.; Zhang, G.S.; He, X.L. Method for predicting cotton yield based on CNN-BiLSTM. Trans. Chin. Soc. Agric. Eng. 2021, 37, 152–159. [Google Scholar]
  34. Zhang, J.; Qiu, X.; Wu, Y.; Zhu, Y.; Cao, Q.; Liu, X.; Cao, W. Combining texture, color, and vegetation indices from fixed-wing UAS imagery to estimate wheat growth parameters using multivariate regression methods. Comput. Electron. Agric. 2021, 185, 106138. [Google Scholar] [CrossRef]
  35. He, C.L.; Zheng, S.L.; Wan, N.X.; Zhao, T.; Yuan, J.C.; He, W.; Hu, J. Potato spectrum and the digital image feature parameters on the response of the nitrogen level and its application. Spectrosc. Spect. Anal. 2016, 36, 2930–2936. [Google Scholar]
  36. Som-ard, J.; Hossain, M.D.; Ninsawat, S.; Veerachitt, V. Pre-harvest sugarcane yield estimation using UAV-based RGB images and ground observation. Sugar Tech 2018, 20, 645–657. [Google Scholar] [CrossRef]
  37. Bendig, J.; Yu, K.; Aasen, H.; Bolten, A.; Bennertz, S.; Broscheit, J.; Gnyp, M.L.; Bareth, G. Combining UAV-based plant height from crop surface models, visible, and near infrared vegetation indices for biomass monitoring in barley. Int. J. Appl. Earth Obs. Geoinf. 2015, 39, 79–87. [Google Scholar] [CrossRef]
  38. Pei, H.J.; Feng, H.K.; Li, C.C.; Jin, X.L.; Li, Z.H.; Yang, G.J. Remote sensing monitoring of winter wheat growth with UAV based on comprehensive index. Trans. Chin. Soc. Agric. Eng. 2017, 33, 74–82. [Google Scholar]
  39. Vol, N. Color indices for weed identification under various soil, residue, and lighting conditions. Trans. ASAE 1995, 38, 259–269. [Google Scholar]
  40. Gao, C.F.; Ji, X.J.; He, Q.; Gong, Z.; Sun, H.G.; Wen, T.; Guo, W. Monitoring of wheat fusarium head blight on spectral and textural analysis of UAV multispectral imagery. Agriculture 2023, 13, 293. [Google Scholar] [CrossRef]
  41. Gitelson, A.; Kaufman, Y.J.; Stark, R.; Rundquist, D. Novel algorithms for remote estimation of vegetation fraction. Remote Sens. Environ. 2002, 80, 76–87. [Google Scholar] [CrossRef]
  42. Wold, S.; Sjöström, M.; Eriksson, L. PLS-regression: A basic tool of chemometrics. Chemom. Intell. Lab. Syst. 2001, 58, 109–130. [Google Scholar] [CrossRef]
  43. Meyer, G.E.; Neto, J.C. Verification of color vegetation indices for automated crop imaging applications. Comput. Electron. Agr. 2008, 63, 282–293. [Google Scholar] [CrossRef]
  44. Breiman, L. Random forests. Mach. Learn. 2001, 45, 5–32. [Google Scholar] [CrossRef]
  45. Wang, J.; Si, H.; Gao, Z.; Shi, L. Winter wheat yield prediction using an LSTM model from MODIS LAI products. Agriculture 2022, 12, 1707. [Google Scholar] [CrossRef]
  46. Zhao, Y.S. Principles and Methods of Remote Sensing Applications; Science Press: Beijing, China, 2013. [Google Scholar]
  47. Liu, X.Y.; Zhong, X.C.; Chen, C.; Liu, T.; Sun, C.M.; Li, D.S.; Liu, E.P.; Wang, J.J.; Ding, D.W.; Huo, Z.Y. Prediction of Wheat Yield Using Color and Texture Feature Data of UAV Image at Early Growth Stage. J. Triticeae Crops 2020, 40, 1002–1007. [Google Scholar]
Figure 1. Experimental design: (1) J9843—Jing 9843, ZM175—ZhongMai 175; (2) nitrogen treatments, N1—0 nitrogen, N2—1/2 normal nitrogen, N3—normal nitrogen, N4—3/2 normal nitrogen; (3) water treatments, W1—rainfall, W2—normal water, W3—2 times normal water.
Agriculture 14 00581 g001
Figure 2. Verification results of different stages’ yield prediction model by using the PLSR method based on color indexes.
Agriculture 14 00581 g002
Figure 3. Verification results of different stages’ yield prediction using the RF method based on color indexes.
Agriculture 14 00581 g003
Figure 4. Distribution of optimal model yield based on color feature indexes.
Agriculture 14 00581 g004
Figure 5. Verification results of different stages’ yield prediction model by using the PLSR method based on texture features.
Agriculture 14 00581 g005
Figure 6. Verification results of different stages’ yield prediction using the RF method based on texture features.
Agriculture 14 00581 g006
Figure 7. Distribution of optimal model yield based on texture features.
Agriculture 14 00581 g007
Figure 8. Verification results of different stages’ yield prediction model by using the PLSR method based on fusion of color indexes and texture features.
Agriculture 14 00581 g008
Figure 9. Verification results of different stages’ yield prediction using the RF method based on the fusion of color indexes and texture features.
Agriculture 14 00581 g009
Figure 10. Distribution of optimal model yield based on color index and texture features.
Agriculture 14 00581 g010
Table 1. Descriptive statistics of yield (kg/hm2) for the calibration and validation datasets.
DatasetMinMeanMaxStandard DeviationCoefficient of Variation (%)
Calibration334556698792148426.60
Validation374461498362119820.12
Table 2. Color index.
Color Feature IndexFormulaReferences
RR = RRed band
GG = GGreen band
BB = BBlue band
rr = R/(R + G + B)Normalized red band
gg = G/(R + G + B)Normalized green band
bb = B/(R + G + B)Normalized blue band
r/br/b[33]
g/bg/b[33]
rbrb[33]
r + br + b[33]
gbgb[33]
(rb)/(r + b)(rb)/(r + b)[33]
(rgb)/(r + g)(rgb)/(r + g)[21]
EXGEXG = 2gbr[34]
GRVIGRVI = (gr)/(g + r)[35]
MGRVIMGRVI = (g2r2)/(g2 + r2)[25]
RGBVIRGBVI = (g2br)/(g2 + br)[35]
WIWI = (gb)/(rg)[35]
EXREXR = 1.4rg[35]
NDINDI = (rg)/(r + g + 0.01)[36]
VARIVARI = (gr)/(g + rb)[37]
EXGREXGR = 3g −2.4rb[38]
Table 3. Correlation between color index and yield.
Color Feature IndexFlagging StageFlowering StageFilling Stage
r−0.6763 **−0.7635 **−0.7521 **
VARI0.6806 **0.7609 **0.7327 **
EXR−0.6813 **−0.7604 **−0.7395 **
GRVI0.6798 **0.7579 **0.7336 **
NDI−0.6797 **−0.7579 **−0.7336 **
MGRVI0.6796 **0.7568 **0.7335 **
(rgb)/(r + g)−0.6696 **−0.7552 **−0.7484 **
EXGR0.6485 **0.7315 **0.7100 **
rb−0.6495 **−0.7161 **−0.7187 **
r/b−0.6436 **−0.7092 **−0.7034 **
(r-b)/(r + b)−0.6442 **−0.7082 **−0.6938 **
g0.5325 **0.6841 **0.6721 **
EXG0.5325 **0.6841 **0.6721 **
r + b−0.5325 **−0.6841 **−0.6721 **
RGBVI0.4580 **0.6642 **0.6454 **
b0.5832 **0.4528 **0.3710 **
gb−0.2965 *0.3410 *0.4420 **
g/b−0.3921 **0.2056 NS0.3212 NS
WI0.4178 **0.0698 NS0.0811 NS
Note: * indicates significance at the 0.05 level, ** indicates significance at the 0.01 level, and NS indicates not relevant.
Table 4. Correlation between texture features and yield.
Texture FeaturesFlagging StageFlowering StageFilling Stage
MEAN_R−0.5296 **−0.5052 **−0.6263 **
VAR_R−0.2586 *−0.0513 NS0.2215 NS
HOM_R0.4229 **0.0778 NS−0.2890 *
CON_R−0.0325 NS−0.0808 NS0.0694 NS
DIS_R−0.3215 *−0.0759 NS0.2374 NS
ENT_R−0.4844 **−0.0404 NS0.3418 *
SEC_R0.4950 **0.0228 NS−0.3488 *
COR_R−0.0650 NS−0.3299 *0.1795 NS
MEAN_G−0.5001 **−0.5136 **−0.5169 **
VAR_G−0.2943 *−0.0517 NS0.2152 NS
HOM_G0.4404 **0.0541 NS−0.3058 *
CON_G−0.0525 NS−0.0760 NS0.0702 NS
DIS_G−0.3520 *−0.0645 NS0.2417 NS
ENT_G−0.4878 **0.0050 NS0.3595 **
SEC_G0.4966 **−0.0270 NS−0.3676 **
COR_G−0.0602 NS−0.3814 **0.2121 NS
MEAN_B−0.4145 **−0.4318 **−0.5373 **
VARE_B−0.2831 *−0.0493 NS0.1471 NS
HOM_B0.4265 **0.0639 NS−0.2477 NS
CON_B−0.0500 NS−0.0764 NS0.0530 NS
DIS_B−0.3405 *−0.0659 NS0.1776 NS
ENT_B−0.4718 **−0.0126 NS0.3010 *
SEC_B0.4798 **−0.0081 NS−0.3072 *
COR_B−0.0495 NS−0.3905 **0.1893 NS
Note: * indicates significant at the 0.05 level, ** indicates significant at the 0.01 level, and NS indicates not relevant.
Table 5. Analysis results of color indexes and yield.
Flagging StageFlowering StageFilling Stage
ModelingTestingModelingTestingModelingTesting
R2RMSE
(kg·hm−2)
R2RMSE
(kg·hm−2)
R2RMSE
(kg·hm−2)
R2RMSE
(kg·hm−2)
R2RMSE
(kg·hm−2)
R2RMSE
(kg·hm−2)
PLSR0.68848.680.361654.290.70808.950.60905.400.75738.480.241145.22
RF0.521052.530.341626.260.67857.280.431079.480.66936.620.371150.43
Table 6. Analysis results of texture features and yield.
Flagging StageFlowering StageFilling Stage
ModelingTestingModelingTestingModelingTesting
R2RMSE
(kg·hm−2)
R2RMSE
(kg·hm−2)
R2RMSE
(kg·hm−2)
R2RMSE
(kg·hm−2)
R2RMSE
(kg·hm−2)
R2RMSE
(kg·hm−2)
PLSR0.491056.40.271765.350.491056.200.251133.590.71794.770.401241.21
RF0.161396.380.161390.630.431125.970.361115.120.451110.890.301192.71
Table 7. Modeling and verification of fusion index and yield.
Flagging StageFlowering StageFilling Stage
ModelingTestingModelingTestingModelingTesting
R2RMSE
(kg·hm−2)
R2RMSE
(kg·hm−2)
R2RMSE
(kg·hm−2)
R2RMSE
(kg·hm−2)
R2RMSE
(kg·hm−2)
R2RMSE
(kg·hm−2)
PLSR0.73775.750.321406.080.72780.210.60801.950.76728.850. 52859.94
RF0.57975.470.381523.900.70804.740.52928.460.701163.960.411081.54
Disclaimer/Publisher’s Note: The statements, opinions and data contained in all publications are solely those of the individual author(s) and contributor(s) and not of MDPI and/or the editor(s). MDPI and/or the editor(s) disclaim responsibility for any injury to people or property resulting from any ideas, methods, instructions or products referred to in the content.

