
Estimating Corn Growth Parameters by Integrating Optical and Synthetic Aperture Radar Features into the Water Cloud Model

 ,
,
Abstract
1. Introduction
2. Materials and Methods
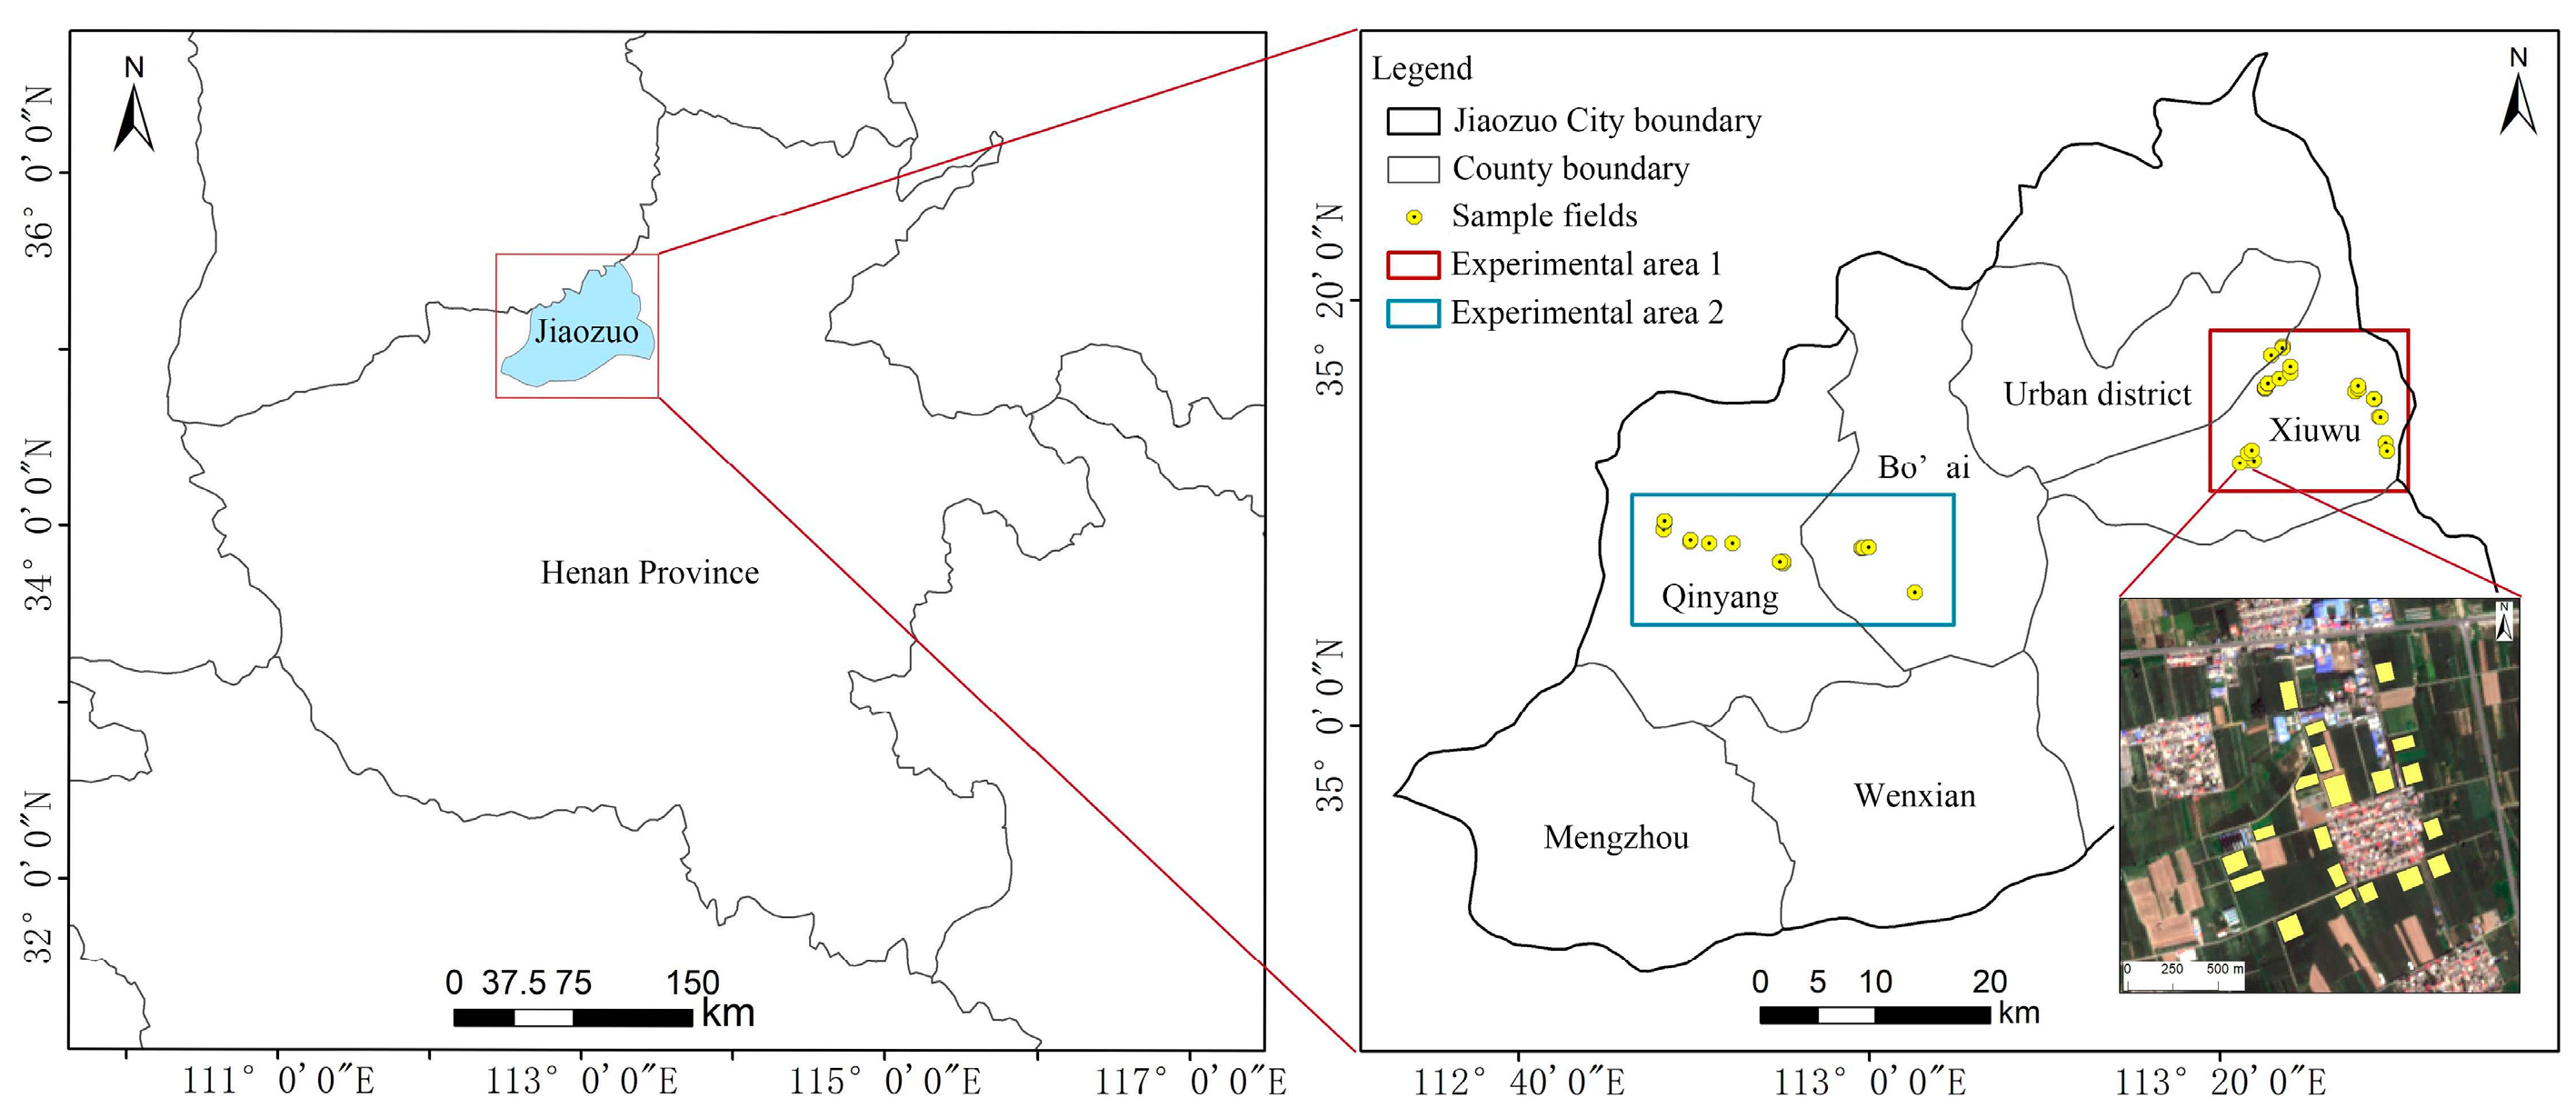
2.1. Experimental Area
2.2. In Situ Data
2.3. Image Data Collection
2.4. Image Feature Extraction
2.5. VIDRI Model Construction
3. Results
3.1. Correlation Analysis
3.2. Estimation Model and Accuracy
3.3. Accuracy Verification
4. Discussion
5. Conclusions
Author Contributions
Funding
Institutional Review Board Statement
Data Availability Statement
Acknowledgments
Conflicts of Interest
References
- Mandal, D.; Kumar, V.; Ratha, D.; Dey, S.; Rao, Y.S. Dual polarimetric radar vegetation index for crop growth monitoring using sentinel-1 SAR data. Remote Sens. Environ. 2020, 247, 111954. [Google Scholar] [CrossRef]
- Wang, H.Q.; Magagi, R.; Goïta, K.; Duguay, Y.; Trudel, M.; Muhuri, A. Retrieval performances of different crop growth descriptors from full- and compact-polarimetric SAR decompositions. Remote Sens. Environ. 2023, 285, 113381. [Google Scholar] [CrossRef]
- Jia, X.Q.; Feng, M.C.; Yang, W.D.; Wang, C.; Zhang, S. Hyperspectral estimation of aboveground dry biomass of winter wheat based on the combination of vegetation indices. Chin. J. Ecol. 2018, 37, 424–429. [Google Scholar]
- Qiao, L.; Tang, W.; Gao, D.; Zhao, R.; An, L.; Li, M.; Sun, H.; Song, D. UAV based chlorophyll content estimation by evaluating vegetation index responses under different crop coverages. Comput. Electron. Agric. 2022, 196, 106775. [Google Scholar] [CrossRef]
- Delegido, J.; Verrelst, J.; Meza, C.M.; Rivera, J.P.; Alonso, L.; Moreno, J. A red-edge spectral index for remote sensing estimation of green LAI over agroecosystems. Eur. J. Agron. 2013, 46, 42–52. [Google Scholar] [CrossRef]
- Rehman, T.H.; Reis, A.; Akbar, N.; Linquist, B.A. Use of Normalized Difference Vegetation Index to Assess N Status and Predict Grain Yield in Rice. Agron. J. 2019, 111, 2889–2898. [Google Scholar] [CrossRef]
- Dong, T.; Liu, J.; Shang, J.; Qian, B.; Ma, B.; Kovacs, J.M.; Walters, D.; Jiao, X.; Geng, X.; Shi, Y. Assessment of red-edge vegetation indices for crop leaf area index estimation. Remote Sens. Environ. 2018, 222, 133–143. [Google Scholar] [CrossRef]
- Bazezew, M.N.; Belay, A.T.; Guda, S.T.; Kleinn, C. Developing Maize Yield Predictive Models from Sentinel-2 MSI Derived Vegetation Indices: An Approach to an Early Warning System on Yield Fluctuation and Food Security. PFG—J. Photogramm. Remote Sens. Geoinf. Sci. 2021, 89, 535–548. [Google Scholar] [CrossRef]
- Liu, C.A.; Chen, Z.X.; Shao, Y.; Chen, J.S.; Hasi, T.; Pan, H.Z. Research advances of SAR remote sensing for agriculture applications: A review. J. Integr. Agric. 2019, 18, 506–525. [Google Scholar] [CrossRef]
- Romero-Puig, N.; Lopez-Sanchez, J.M. Comparing In-SAR Methodologies for the Retrieval of Paddy Rice Height with TanDEM-X Data. In Proceedings of the IGARSS 2020—IEEE International Geoscience and Remote Sensing Symposium (IGARSS), Waikoloa, HI, USA, 26 September–2 October 2020. [Google Scholar]
- Yadav, V.P.; Prasad, R.; Bala, R. Leaf area index estimation of wheat crop using modified water cloud model from the time series SAR and optical satellite data. Geocart. Int. 2021, 36, 791–802. [Google Scholar] [CrossRef]
- Castillo, J.; Apan, A.A.; Maraseni, T.N.; Salmo, S.G.I. Estimation and mapping of above-ground biomass of mangrove forests and their replacement land uses in the Philippines using Sentinel imagery. ISPRS J. Photogramm. Remote Sens. 2017, 134, 70–85. [Google Scholar] [CrossRef]
- Xiuliang, J.; Guijun, Y.; Xingang, X.; Hao, Y.; Haikuan, F.; Zhenhai, L.; Jiaxiao, S.; Yubin, L.; Chunjiang, Z. Combined Multi-Temporal Optical and Radar Parameters for Estimating LAI and Biomass in Winter Wheat Using HJ and RADARSAR-2 Data. Remote Sens. 2015, 7, 13251. [Google Scholar] [CrossRef]
- Luo, P.; Liao, J.J.; Shen, G.Z. Combining Spectral and Texture Features for Estimating Leaf Area Index and Biomass of Maize Using Sentinel-1/2, and Landsat-8 Data. IEEE Access 2020, 8, 53614–53626. [Google Scholar] [CrossRef]
- Abdikan, S.; Sekertekin, A.; Narin, O.G.; Delen, A.; Sanli, F.B. A comparative analysis of SLR, MLR, ANN, XGBoost and CNN for crop height estimation of sunflower using Sentinel-1 and Sentinel-2. Adv. Space Res. 2023, 71, 3045–3059. [Google Scholar] [CrossRef]
- Yeasin, M.; Haldar, D.; Kumar, S.; Paul, R.K.; Ghosh, S. Machine Learning Techniques for Phenology Assessment of Sugarcane Using Conjunctive SAR and Optical Data. Remote Sens. 2022, 14, 3249. [Google Scholar] [CrossRef]
- Tao, L.; Li, J.; Jiang, J.; Chen, X. Leaf Area Index Inversion of Winter Wheat Using RADARSAT-2 Data and Modified Water cloud Model. J. Triticeae Crops 2016, 36, 236–242. [Google Scholar]
- Bao, Y.; Zhang, Y.; Wang, J.; Min, J. Surface soil moisture estimation over dense crop using Envisat ASAR and Landsat TM imagery: An approach. Int. J. Remote Sens. 2014, 35, 6190–6212. [Google Scholar] [CrossRef]
- Davitt, A.; Winter, J.M.; Mcdonald, K. Integrated crop growth and radiometric modeling to support Sentinel synthetic aperture radar observations of agricultural fields. J. Appl. Remote Sens. 2020, 14, 044508. [Google Scholar] [CrossRef]
- Ramesh, N.; Heiko, B.; Kevin, T.; Keith, M.; Sarah, J.; France, G.; Charles, G.; Yadvinder, M.; Geoff, B.; Sam, D.; et al. Airborne S-Band SAR for Forest Biophysical Retrieval in Temperate Mixed Forests of the UK. Remote Sens. 2016, 8, 609. [Google Scholar] [CrossRef]
- Zhang, H.B.; Wang, C.C.; Zhu, J.J.; Fu, H.Q.; Han, W.T.; Xie, H.Q. Forest Aboveground Biomass Estimation in Subtropical Mountain Areas Based on Improved Water Cloud Model and PolSAR Decomposition Using L-Band PolSAR Data. Forests 2023, 14, 2303. [Google Scholar] [CrossRef]
- Dave, R.; Saha, K.; Kushwaha, A.; Pandey, D.K.; Vithalpura, M.; Parath, N.; Murugesan, A. Application of sentinel-1 SAR-derived vegetation descriptors for soil moisture retrieval and plant height prediction during the wheat growth cycle. Int. J. Remote Sens. 2023, 44, 786–801. [Google Scholar] [CrossRef]
- Yang, Z.; Li, K.; Shao, Y.; Brisco, B.; Liu, L. Estimation of Paddy Rice Variables with a Modified Water Cloud Model and Improved Polarimetric Decomposition Using Multi-Temporal RADARSAT-2 Images. Remote Sens. 2016, 8, 878. [Google Scholar] [CrossRef]
- Kweon, S.K.; Oh, Y.A. Modified Water-Cloud Model with Leaf Angle Parameters for Microwave Backscattering from Agricultural Fields. IEEE Trans. Geosci. Remote Sens. 2015, 53, 2802–2809. [Google Scholar] [CrossRef]
- Bai, X.; He, B.; Li, X.; Zeng, J.; Wang, X.; Wang, Z.; Zeng, Y.; Su, Z. First Assessment of Sentinel-1A Data for Surface Soil Moisture Estimations Using a Coupled Water Cloud Model and Advanced Integral Equation Model over the Tibetan Plateau. Remote Sens. 2017, 9, 714. [Google Scholar] [CrossRef]
- Ahmadian, N.; Ullmann, T.; Verrelst, J.; Borg, E.; Conrad, C. Biomass Assessment of Agricultural Crops Using Multi-temporal Dual Polarimetric TerraSAR-X Data. PFG—J. Photogramm. Remote Sens. Geoinf. Sci. 2019, 87, 159–175. [Google Scholar] [CrossRef] [PubMed]
- Chauhan, S.; Srivastava, H.S.; Patel, P. Crop Height Estimation Using RISAT-1 Hybrid Polarized Synthetic Aperture Radar Data. IEEE J. Sel. Top. Appl. Earth Obs. Remote Sens. 2019, 12, 2928–2933. [Google Scholar] [CrossRef]
- Bleiholder, H.; Kirfel, H.; Langeluddeke, P.; Stauss, R.; Van, D.B.T. A Uniform Code for the Phenological Stages of Crops and Weeds. Pesqui. Agropecu. Bras. 1991, 26, 1423–1429. [Google Scholar]
- Zadoks, J.C.; Chang, T.T.; Konzak, C.F. A decimal code for the growth stages of cereals. Weed Res. 1974, 14, 415–421. [Google Scholar] [CrossRef]
- QX/T 361-2016; Specification for Agricultural Meteorological Observation Maize. China Meteorological Administration: Beijing, China, 2016.
- Wang, Y.; Fang, S.; Zhao, L.; Huang, X. Estimation of maize plant height in North China by means of backscattering coefficient and depolarization parameters using Sentinel-1 dual-pol SAR data. Int. J. Remote Sens. 2022, 43, 1960–1982. [Google Scholar] [CrossRef]
- Rouse, J.W.; Haas, R.H.; Schell, J.A.; Deering, D.W. Monitoring Vegetation Systems in the Great Plains with Erts. NASA Spec. Publ. 1974, 351, 309. [Google Scholar]
- Fernandez-Manso, A.; Fernandez-Manso, O.; Quintano, C. SENTINEL-2A red-edge spectral indices suitability for discriminating burn severity. Int. J. Appl. Earth Obs. Geoinf. 2016, 50, 170–175. [Google Scholar] [CrossRef]
- Mercier, A.; Betbeder, J.; Baudry, J.; Roux, V.L.; Hubert-Moy, L. Evaluation of Sentinel-1 & 2 time series for predicting wheat and rapeseed phenological stages. ISPRS J. Photogramm. Remote Sens. 2020, 163, 231–256. [Google Scholar]
- Attema, E.; Ulaby, F.T. Vegetation modeled as a water cloud. Radio Sci. 1978, 13, 357–364. [Google Scholar] [CrossRef]
- Lievens, H.; Verhoest, N. On the Retrieval of Soil Moisture in Wheat Fields from L-Band SAR Based on Water Cloud Modeling, the IEM, and Effective Roughness Parameters. IEEE Geosci. Remote Sens. Lett. 2011, 8, 740–744. [Google Scholar] [CrossRef]
- Kokhan, S.; Vostokov, A. Using Vegetative Indices to Quantify Agricultural Crop Characteristics. J. Ecol. Eng. 2020, 21, 120–127. [Google Scholar] [CrossRef] [PubMed]
- Dong, T.; Meng, J.; Shang, J.; Liu, J.; Wu, B. Evaluation of Chlorophyll-Related Vegetation Indices Using Simulated Sentinel-2 Data for Estimation of Crop Fraction of Absorbed Photosynthetically Active Radiation. IEEE J. Sel. Top. Appl. Earth Obs. Remote Sens. 2015, 8, 4049–4059. [Google Scholar] [CrossRef]
- Baghdadi, N.; El Hajj, M.; Zribi, M.; Bousbih, S. Calibration of the water cloud model at C-Band for winter crop fields and grasslands. Remote Sens. 2018, 9, 13. [Google Scholar] [CrossRef]
- Li, J.H.; Wang, S.S. Using SAR-Derived Vegetation Descriptors in a Water Cloud Model to Improve Soil Moisture Retrieval. Remote Sens. 2018, 10, 1370. [Google Scholar] [CrossRef]
- Wang, R.; Chen, J.M.; He, L.M.; Liu, J.E.; Shang, J.L.; Liu, J.G.; Dong, T.F. A novel semi-empirical model for crop leaf area index retrieval using SAR co- and cross-polarizations. Remote Sens. Environ. 2023, 296, 113727. [Google Scholar] [CrossRef]
- David, R.M.; Rosser, N.J.; Donoghue, D.N.M. Improving above ground biomass estimates of Southern Africa dryland forests by combining Sentinel-1 SAR and Sentinel-2 multispectral imagery. Remote Sens. Environ. 2022, 282, 113232. [Google Scholar] [CrossRef]
- Gao, S.; Niu, Z.; Huang, N.; Hou, X. Estimating the Leaf Area Index, height and biomass of maize using HJ-1 and RADARSAT-2—ScienceDirect. Int. J. Appl. Earth Obs. Geoinf. 2013, 24, 1–8. [Google Scholar]
- Hosseini, M.; Mcnairn, H.; Mitchell, S.; Robertson, L.D.; Davidson, A.; Homayouni, S. Integration of synthetic aperture radar and optical satellite data for corn biomass estimation. Methodsx 2020, 7, 100857. [Google Scholar] [CrossRef] [PubMed]
- Caicoya, A.T.; Kugler, F.; Pardini, M.; Hajnsek, I.; Papathanassiou, K. Vertical forest structure characterization for the estimation of Above Ground Biomass: First experimental results using SAR vertical reflectivity profiles. In Proceedings of the IEEE Joint International Geoscience and Remote Sensing Symposium (IGARSS)/35th Canadian Symposium on Remote Sensing, Quebec City, QC, Canada, 13–18 July 2014. [Google Scholar]


| No. | Phonology Stages | Morphological Characteristics | BBCH Code |
|---|---|---|---|
| 1 | Emergence | Expose the first leaf from the tooth sheath. | 10 |
| 2 | Three Leaves | Expose the third leaf from the second leaf sheath. | 13 |
| 3 | Seven Leaves | Expose the seventh leaf from the sixth leaf sheath. | 17 |
| 4 | Jointing | The round and hard stem nodes can be felt near the ground. | 31 |
| 5 | Tasseling | The top spikelet of the male spike protrudes from the leaf sheath. | 51 |
| 6 | Male florescence | The anthers in the upper part of the male spike are exposed, and pollen is scattered. | 55 |
| 7 | Silking | Floral filaments are exposed in the bracts of female spikes in plants. | 61 |
| 8 | Milk ripening | The shape of the grains has reached normal size, and the lower middle grains of the fruit inflorescence are filled with thick white milk. | 79 |
| 9 | Maturity | More than 80% of plants have yellowed outer bracts, dried filaments, and hardened grains. | 89 |
| Experimental | Types | Orbits | Platform | Acquisition Date | Phenology |
|---|---|---|---|---|---|
| area 1 | Optical | / | Sentinel-2A | 26 July 2021 | Late jointing |
| / | Sentinel-2B | 31 July 2021 | Tasseling | ||
| SAR | 40 | Sentinel-1A | 27 July 2021 | Late jointing | |
| 113 | Sentinel-1A | 1 August 2021 | Tasseling | ||
| area 2 | Optical | / | Sentinel-2A | 26 July 2021 | Late jointing |
| / | Sentinel-2B | 31 July 2021 | Tasseling | ||
| SAR | 113 | Sentinel-1A | 1 August 2021 | Tasseling | |
| 113 | Sentinel-1A | 13 August 2021 | Flowering |
| VIopt | Plant Height | BBCH | VIDRI | Plant Height | BBCH |
|---|---|---|---|---|---|
| NDVI | 0.35 | 0.08 | NDVIDRI | 0.47 | 0.28 |
| NDVIre1 | 0.50 | 0.37 | NDVIre1DRI | 0.58 | 0.45 |
| NDVIre2 | 0.69 | 0.71 | NDVIre2DRI | 0.74 | 0.75 |
| S2REP | 0.69 | 0.72 | S2REPDRI | 0.75 | 0.75 |
| VI Types | VIs | Models | R2 | RMSE (cm) | nRMSE |
|---|---|---|---|---|---|
| VIopt | NDVI | y = 178.13x + 80.74 | 0.12 | 29.15 | 20.84% |
| NDVIre1 | y = 219.38x + 80.63 | 0.25 | 26.96 | 19.27% | |
| NDVIre2 | y = 635.14x + 130.06 | 0.47 | 22.64 | 16.18% | |
| S2REP | y = 331.55x − 2.14 | 0.48 | 22.45 | 16.05% | |
| VIDRI | NDVIDRI | y = 171.42x + 78.57 | 0.22 | 27.47 | 19.64% |
| NDVIre1DRI | y = 203.65x + 83.28 | 0.34 | 25.33 | 18.11% | |
| NDVIre2DRI | y = 616.50x + 127.89 | 0.55 | 20.99 | 15.00% | |
| S2REPDRI | y = 283.30x + 19.20 | 0.57 | 20.48 | 14.64% |
| VI Types | VIs | Models | R2 | RMSE (cm) | nRMSE |
|---|---|---|---|---|---|
| VIopt | NDVI | y = 4.55x + 45.10 | 0.006 | 1.93 | 24.17% |
| NDVIre1 | y = 17.51x + 37.55 | 0.14 | 1.80 | 22.49% | |
| NDVIre2 | y = 51.64x + 41.35 | 0.50 | 1.36 | 17.04% | |
| S2REP | y = 24.36x + 32.39 | 0.53 | 1.33 | 16.60% | |
| VIDRI | NDVIDRI | y = 8.36x + 41.79 | 0.08 | 1.86 | 23.24% |
| NDVIre1DRI | y = 13.72x + 39.44 | 0.20 | 1.73 | 21.58% | |
| NDVIre2DRI | y = 48.30x + 41.43 | 0.56 | 1.26 | 15.79% | |
| S2REPDRI | y = 19.24x + 35.07 | 0.57 | 1.27 | 15.91% |
| Parameters | VI Types | VIs | Models | R2 | RMSE (cm) | nRMSE |
|---|---|---|---|---|---|---|
| Plant height | VIopt | NDVIre2 | y = 1078.6x + 62.80 | 0.52 | 28.38 | 15.42% |
| S2REP | y = 531.55x − 140.36 | 0.59 | 26.31 | 14.30% | ||
| VIDRI | NDVIre2DRI | y = 1072.6x + 64.47 | 0.55 | 27.28 | 14.83% | |
| S2REPDRI | y = 505.89x − 121.17 | 0.63 | 25.51 | 13.86% | ||
| BBCH | VIopt | NDVIre2 | y = 45.40x + 40.97 | 0.49 | 1.29 | 16.12% |
| S2REP | y = 23.23x + 31.84 | 0.59 | 1.15 | 14.37% | ||
| VIDRI | NDVIre2DRI | y = 45.44x + 41.00 | 0.52 | 1.25 | 15.62% | |
| S2REPDRI | y = 22.27x + 32.57 | 0.64 | 1.09 | 13.62% |
Disclaimer/Publisher’s Note: The statements, opinions and data contained in all publications are solely those of the individual author(s) and contributor(s) and not of MDPI and/or the editor(s). MDPI and/or the editor(s) disclaim responsibility for any injury to people or property resulting from any ideas, methods, instructions or products referred to in the content. |
© 2024 by the authors. Licensee MDPI, Basel, Switzerland. This article is an open access article distributed under the terms and conditions of the Creative Commons Attribution (CC BY) license (https://creativecommons.org/licenses/by/4.0/).
Share and Cite
Wang, Y.; Wu, Z.; Luo, S.; Liu, X.; Liu, S.; Huang, X. Estimating Corn Growth Parameters by Integrating Optical and Synthetic Aperture Radar Features into the Water Cloud Model. Agriculture 2024, 14, 695. https://doi.org/10.3390/agriculture14050695
Wang Y, Wu Z, Luo S, Liu X, Liu S, Huang X. Estimating Corn Growth Parameters by Integrating Optical and Synthetic Aperture Radar Features into the Water Cloud Model. Agriculture. 2024; 14(5):695. https://doi.org/10.3390/agriculture14050695
Chicago/Turabian StyleWang, Yanyan, Zhaocong Wu, Shanjun Luo, Xinyan Liu, Shuaibing Liu, and Xinxin Huang. 2024. "Estimating Corn Growth Parameters by Integrating Optical and Synthetic Aperture Radar Features into the Water Cloud Model" Agriculture 14, no. 5: 695. https://doi.org/10.3390/agriculture14050695
APA StyleWang, Y., Wu, Z., Luo, S., Liu, X., Liu, S., & Huang, X. (2024). Estimating Corn Growth Parameters by Integrating Optical and Synthetic Aperture Radar Features into the Water Cloud Model. Agriculture, 14(5), 695. https://doi.org/10.3390/agriculture14050695