Article

Study on the Temperature and Water Distribution of Hot Air in Red Loam Based on Soil Continuous Cropping Obstacles

1
College of Mechanical and Electrical Engineering, Yunnan Agricultural University, Kunming 650201, China
2
The Key Laboratory for Crop Production and Smart Agriculture of Yunnan Province, Kunming 650201, China
3
College of Plant Protection, Yunnan Agricultural University, Kunming 650201, China
4
Institute of Technology, Dehong Teachers’ College, Dehong 678400, China
*
Author to whom correspondence should be addressed.
Agriculture 2024, 14(4), 588; https://doi.org/10.3390/agriculture14040588
Submission received: 6 March 2024 / Revised: 27 March 2024 / Accepted: 4 April 2024 / Published: 8 April 2024

Abstract

:
In recent years, the problematic circumstances of the constant cropping problem in facility crops have become increasingly serious. Compared to chemical disinfection, soil steam disinfestation offers the benefits of environmental protection and being pollution-free, which can effectively reduce the problem of constant cropping in crops. However, during the steam disinfection procedure, a large quantity of liquid water is formed due to the condensation of high-temperature steam, which causes soil pore blockage, seriously affecting the mass and heat transfer efficacy of steam and, thus, affecting the disinfection efficiency. Therefore, to solve this problem, this paper proposes the use of hot air dehumidification to remove excess water from soil pores and achieve the goal of dredging the pores. However, further exploration is needed on how to efficiently remove excess water from different pore structures through hot air applications. Therefore, this paper first used CFD simulation technology to simulate and analyze the hot air flow field, mass, and heat transfer in soil aggregates of different sizes (<2 mm to >8 mm). Then, based on the soil hot air heating experimental platform, research was conducted on the mass and heat transfer mechanism of hot air under diverse soil pore conditions. The results show that as the soil particle size increases from <2 mm to >8 mm, the number of soil macropores also increases, which makes the soil prone to the formation of macropore thermal currents, and the efficiency of hot air heating for dehumidification first increases and then decreases. Among them, the 4–6 mm treatment has the best dehumidification effect through hot air heating, with a deep soil temperature of up to 90 °C and a water content reduction of 6%. The 4–6 mm treatment has a high-temperature heating and dehumidification area of 15–20 cm deep. The above results lay the theoretical foundations for the parameters of hot air heating and dehumidification operations, as well as the placement of the hot air pipe. This paper aims to combine hot air dehumidification technology, for the removal of excess water from soil, and dredging soil pores, ultimately achieving the goal of improving soil steam disinfection efficiency.

1. Introduction

For a long time, the problem of continuous cropping in facility crops (vegetables, melons, and Chinese herbs, etc.) has been serious, particularly for root-type Chinese medicinal herbs like Panax notoginseng. Many soil-borne diseases can infect crop roots, seriously affecting their growth quality, resulting in a decrease in their yield and quality and, ultimately, reducing the income of farmers [1,2].
Soil disinfection methods are an important factor in resolving the continuous cropping obstacle problem [3,4]. To pursue economic benefits, farmers apply large quantities of chemical reagents to diseased fields to reduce economic losses, such as those from methyl bromide fumigation. However, the long-term application of chemical agents not only leads to resistance of pathogenic bacteria, but also results in issues like excessive pesticide residues in medicinal materials and soil environmental pollution [5,6]. The soil steam disinfection method is an applied physical disinfection technique that can efficiently kill damaging bacteria and fungi, such as Fusarium and F. oxysporum. It offers advantages like environmental protection, being pollution-free, and allowing crops to be sown shortly after disinfection treatment [3,4,5,6,7]. Meanwhile, Xu Yulong et al. found that applying the soil steam disinfection method can effectively overcome crop continuous cropping obstacles, improve soil particle structure, and extend the life of the soil [8]. Therefore, the soil-applied physical disinfection technique is appropriate for resolving the issue of constant cropping in facility crop cultivation.
Previous studies have found that when steam disinfection is carried out on Yunnan red loam, the steam condenses into a liquid phase and a significant amount of condensed liquid blocks the pores of the soil, seriously affecting the mass and heat transfer efficiency of the steam [9]. To solve the problem of steam condensation blocking soil pores, the first thing is to remove the condensation that is clogging the pores in the soil. According to previous research on the sludge drying process, hot air heating is used to remove excess water from the sludge [10,11]. Building on the concept of hot air heating for dehumidification, to more effectively clear blocked pores and improve steam diffusion efficiency, it is essential to further investigate the impact of hot air on water heating and evaporation in soil pores of different sizes. Previous researchers have conducted in-depth research on the distribution of liquid water in soil macropores and micropores, but the definition and differentiation of pore size by experts from various countries are still in the stage of being customized, while the definition of both large and small pores is still relatively vague across the globe. In this regard, our research group has already explored the diffusion law of steam in different pore structures in the early stages, distinguishing between macropore flow and small pore matrix flow [12,13]. However, the effect of diverse red loam pore arrangements on hot air, heat, and mass transfer remains unknown; specifically, the flow of hot air through different pores.
In summary, based on previous research, the particle size of soil aggregates was divided the following five groups: <2 mm, 2–4 mm, 4–6 mm, 6–8 mm, and >8 mm. Considering the pore structure formed by the soil aggregates mentioned above, the impact of the different pore structures of soil on the heat and mass transfer of hot air was explored, to provide a theoretical basis for hot air dehumidification operation parameters and the placement of hot air pipes.

2. Materials and Methods

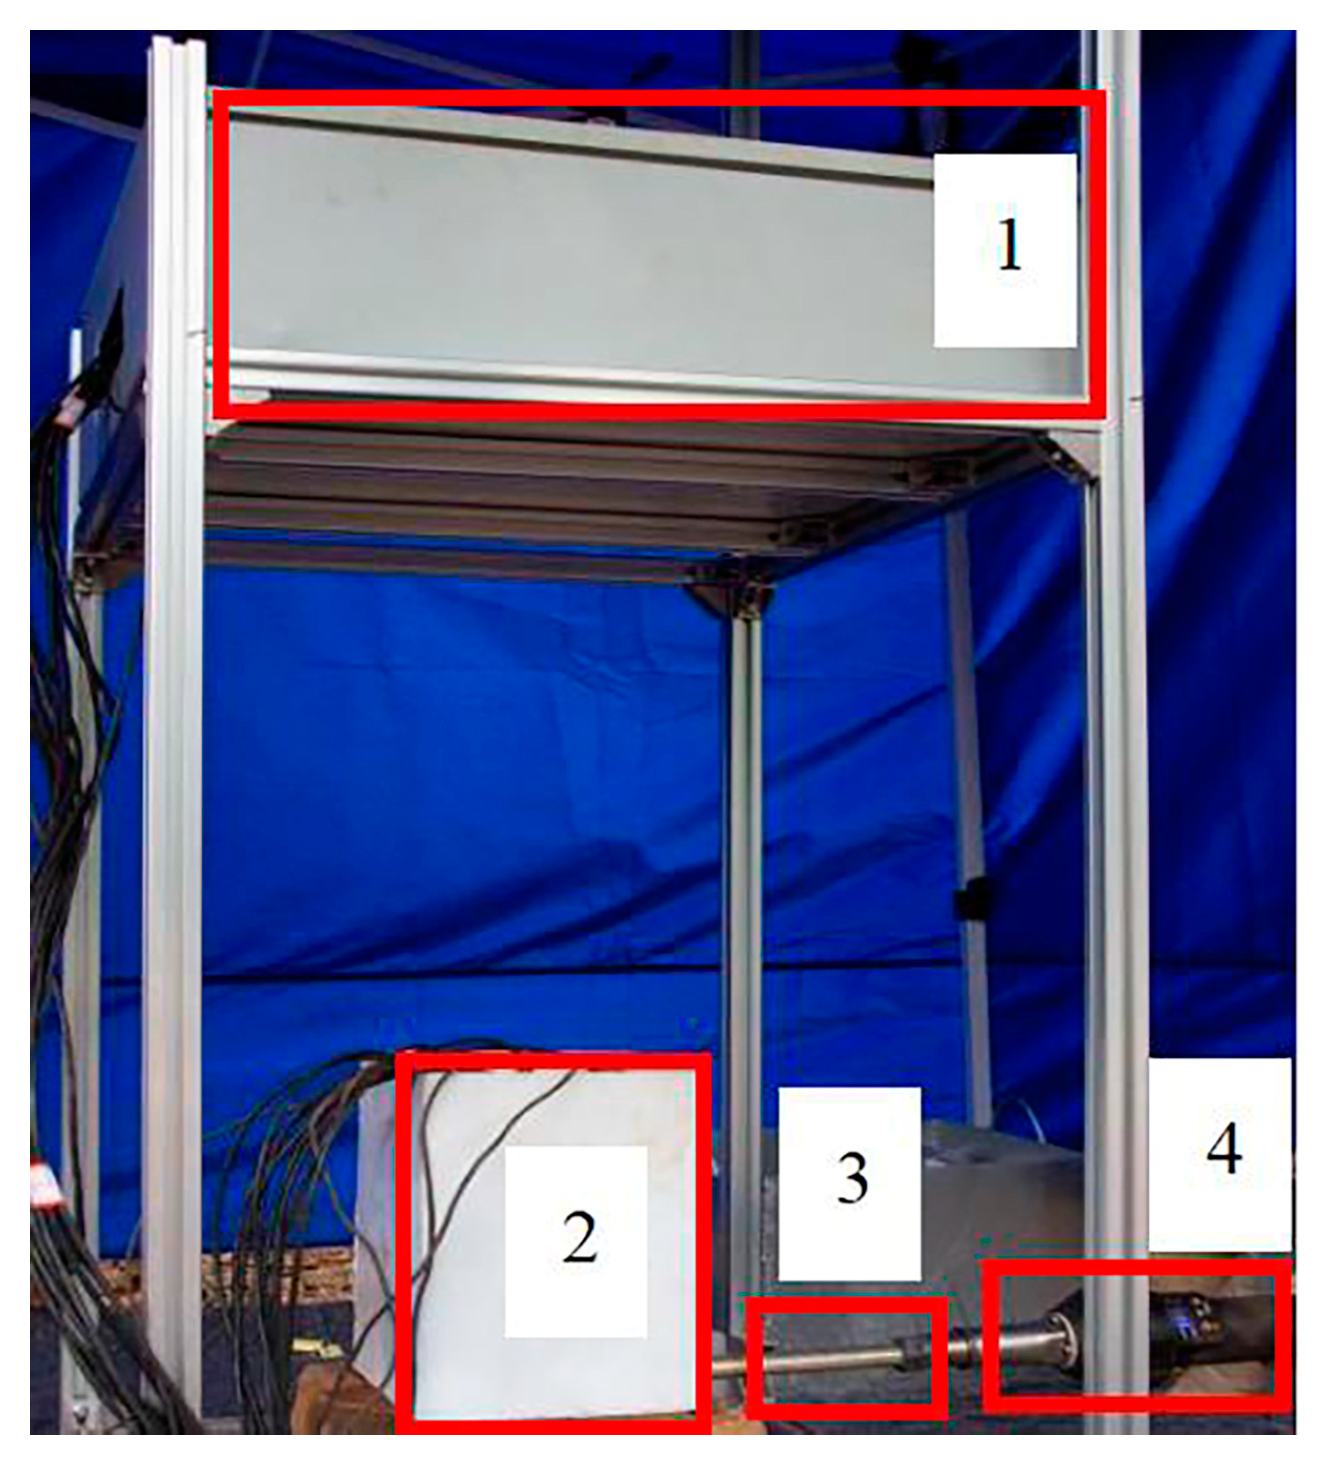
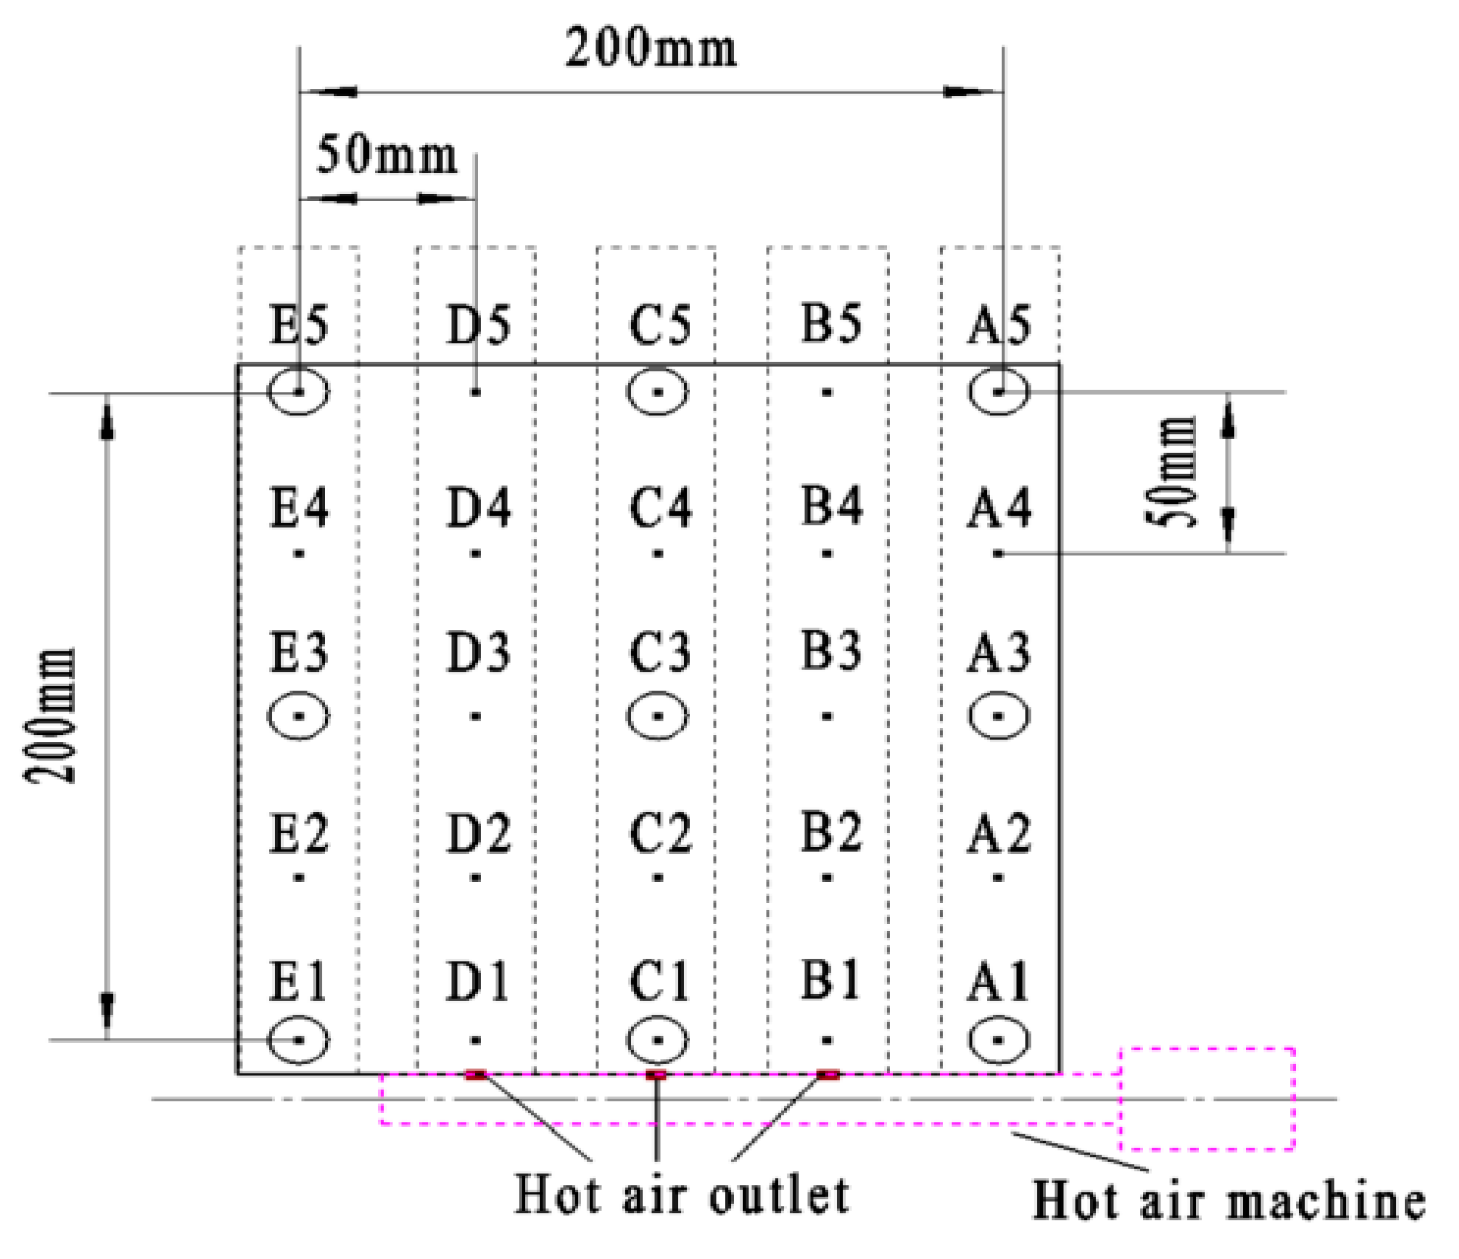
2.1. Test Materials and Equipment

The test hot air pipe has a diameter of 2 cm, a length of 30 cm, and a wall thickness of 0.2 cm. One end of the test hot air pipe is closed and the other end serves as an inlet. To ensure the uniform heating of the soil, the air outlet of the hot air pipe is uniformly arranged in an axial direction of 5 cm and a circumferential direction of 120 °, with a total of 9 × 0.3 cm for the air outlet. The soil samples (39.47% Clay, 35.32% Slit, 25.21% Sand) were taken from a test site at Yunnan Agricultural University (102°45′12′ E and 25°8′27′ N) [9] and the soil’s physical parameters are illustrated in Table 1.
The hot air testing system comprises a temperature and water content data acquisition system, a soil tank (length 20 cm × width 20 cm × height 30 cm), a hot air pipe, and a hot air fan SDL-1600X (Fuzhou Sidanli Welding Technology Co., Ltd., Fujian, China). The hot air pipe is connected to the hot air fan and the hot air pipe is horizontally inserted into the bottom of the soil tank. The layout is displayed in Figure 1. Before testing, the temperature and water content sensors were calibrated and confirmed to be functioning normally.

2.2. Test Process

Before sieving the soil sample, it was necessary to ensure that the water content was consistent and the soil water content was 20 ± 1.5%. The soil samples were sieved into 5 levels using a test sieve and the particles of soil had sizes of <2 mm, 2–4 mm, 4–6 mm, 6–8 mm, and >8 mm, correspondingly. The collected Yunnan red loam was sieved to obtain a vertical profile of soil pores and Image J (National Institutes of Health Bethesda, MD, USA) was used for the calibration, binarization, noise reduction, corrosion expansion, and watershed segmentation of the acquired images [12]. Finally, the treated soil was placed into a transparent soil tank (length 20 cm × width 20 cm × height 30 cm) for the steam disinfection test of the soil.
The initial soil temperature was 25 ± 2.5 °C. The data collection system collected data every ten seconds and the distribution positions of each sensor are shown in Figure 2. The velocity of the hot air fan was adjusted to ensure that the air outlet temperature of the hot air pipe was 2.5 m/s. The heating temperature of the hot air fan was adjusted to 200 °C and the test time was 600 s. Each test group was repeated three times, fifteen groups were performed, and the results were the average of the three trials.

2.3. Simulation of Hot Air Heat and Mass Transfer

2.3.1. Selection of a Mathematical Model

The application of hot air in porous media plays a role in drying and dehumidification, with more research focused on food drying and sludge drying. In recent years, with the in-depth study of hot air heat and mass transfer simulation by experts from various countries, various porous media heat and mass transfer models and sludge drying kinetics models have been extensively studied and applied. In a different manner from previous studies, the soil studied in this paper is Yunnan red loam and the soil is screened to form five different soil pore structures.
Based on previous research on various heat and mass transfer models for hot air, this paper first uses the Navier–Stokes (N-S) equation to simulate the flow of hot air in soil pores and then uses the porous medium heat transfer equation presented by Phillip [14,15] to numerically simulate the distribution of soil temperature.
The soil’s physical properties are displayed in Table 1 and the physical properties of hot air [16] are displayed in Table 2.

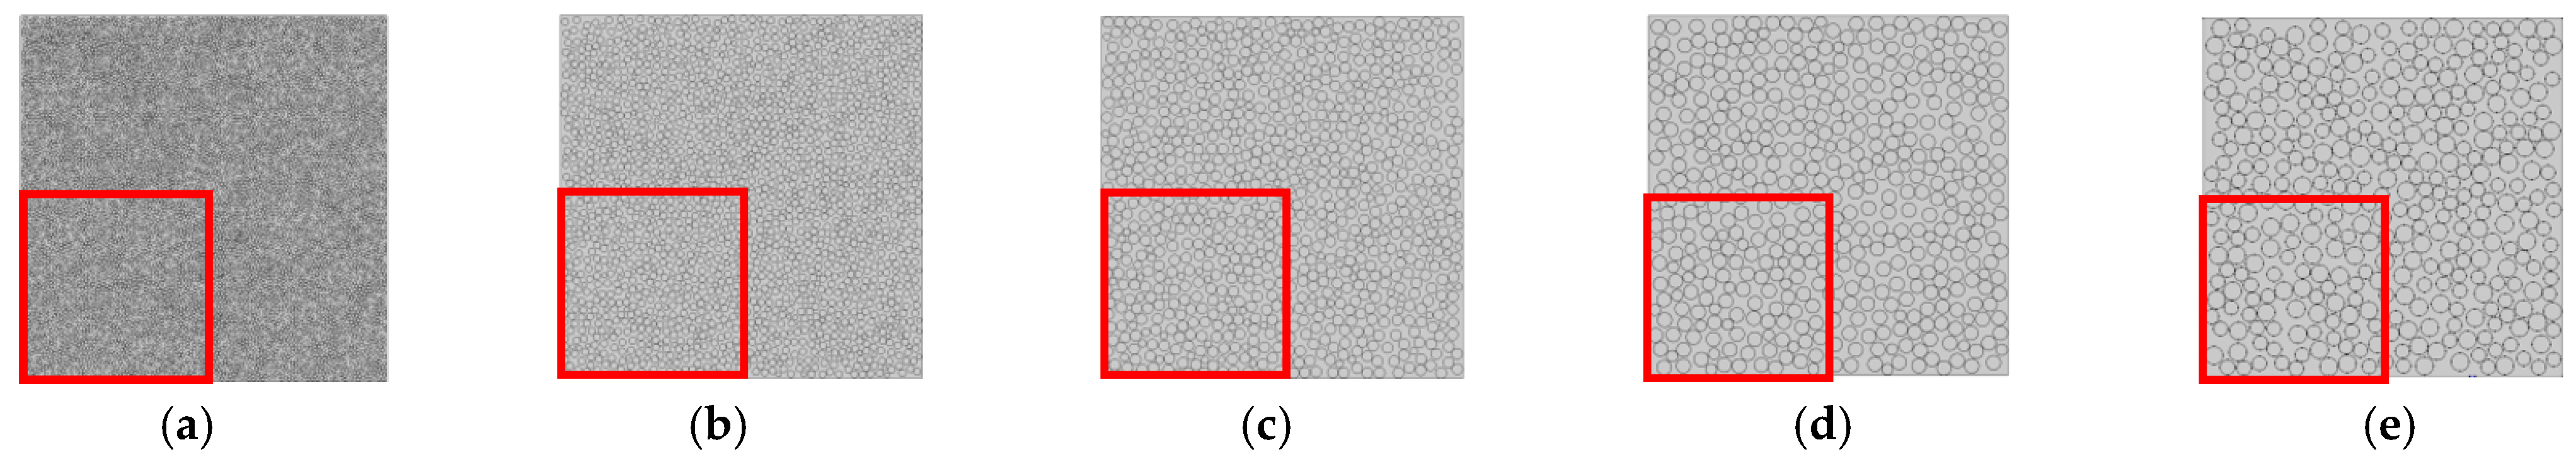
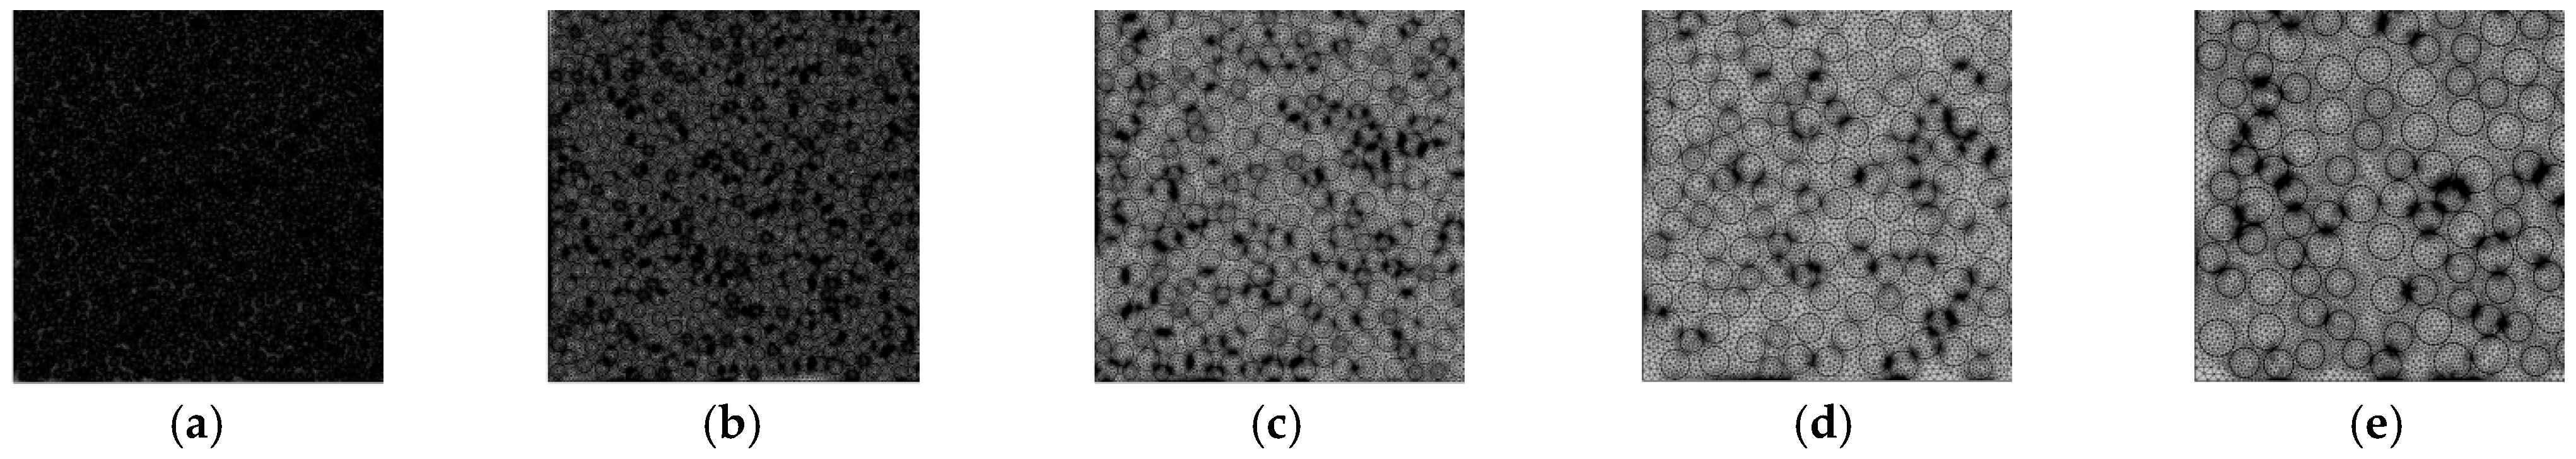
2.3.2. Soil Pattern Establishment

On the basis of previous research and soil aggregate particle size division, this paper has conducted a more detailed division of the range of soil particles, which are <2 mm, 2–4 mm, 4–6 mm, 6–8 mm, and >8 mm, respectively. Due to the complexity of the appearance and pore structure of soil aggregates and the general simplification of soil particles and aggregates into circular shapes in soil science [17,18], this study established a simplified circular particle discrete model for soil aggregates (Figure 3). We used COMSOL Multiphysics (COMSOL Inc) to triangulate the created model. The number of grid units corresponding to each treatment group is approximately 117–2257 million and the number of grid nodes is 59–113 million, as shown in Figure 4.

2.3.3. Establishment of Soil Hot Air Heating Model

Referring to Figure 2, we established a soil hot air heating model. The hot air inlet is set as the “hot air velocity inlet”, the soil surface is set as the hot air outlet, the pressure outlet boundary condition is set, and the static pressure is zero. The size of the hot air inlet is 3 mm, the distance between each outlet is 50 mm, and the test area is 20 cm × 20 cm = 400 cm2.

3. Results

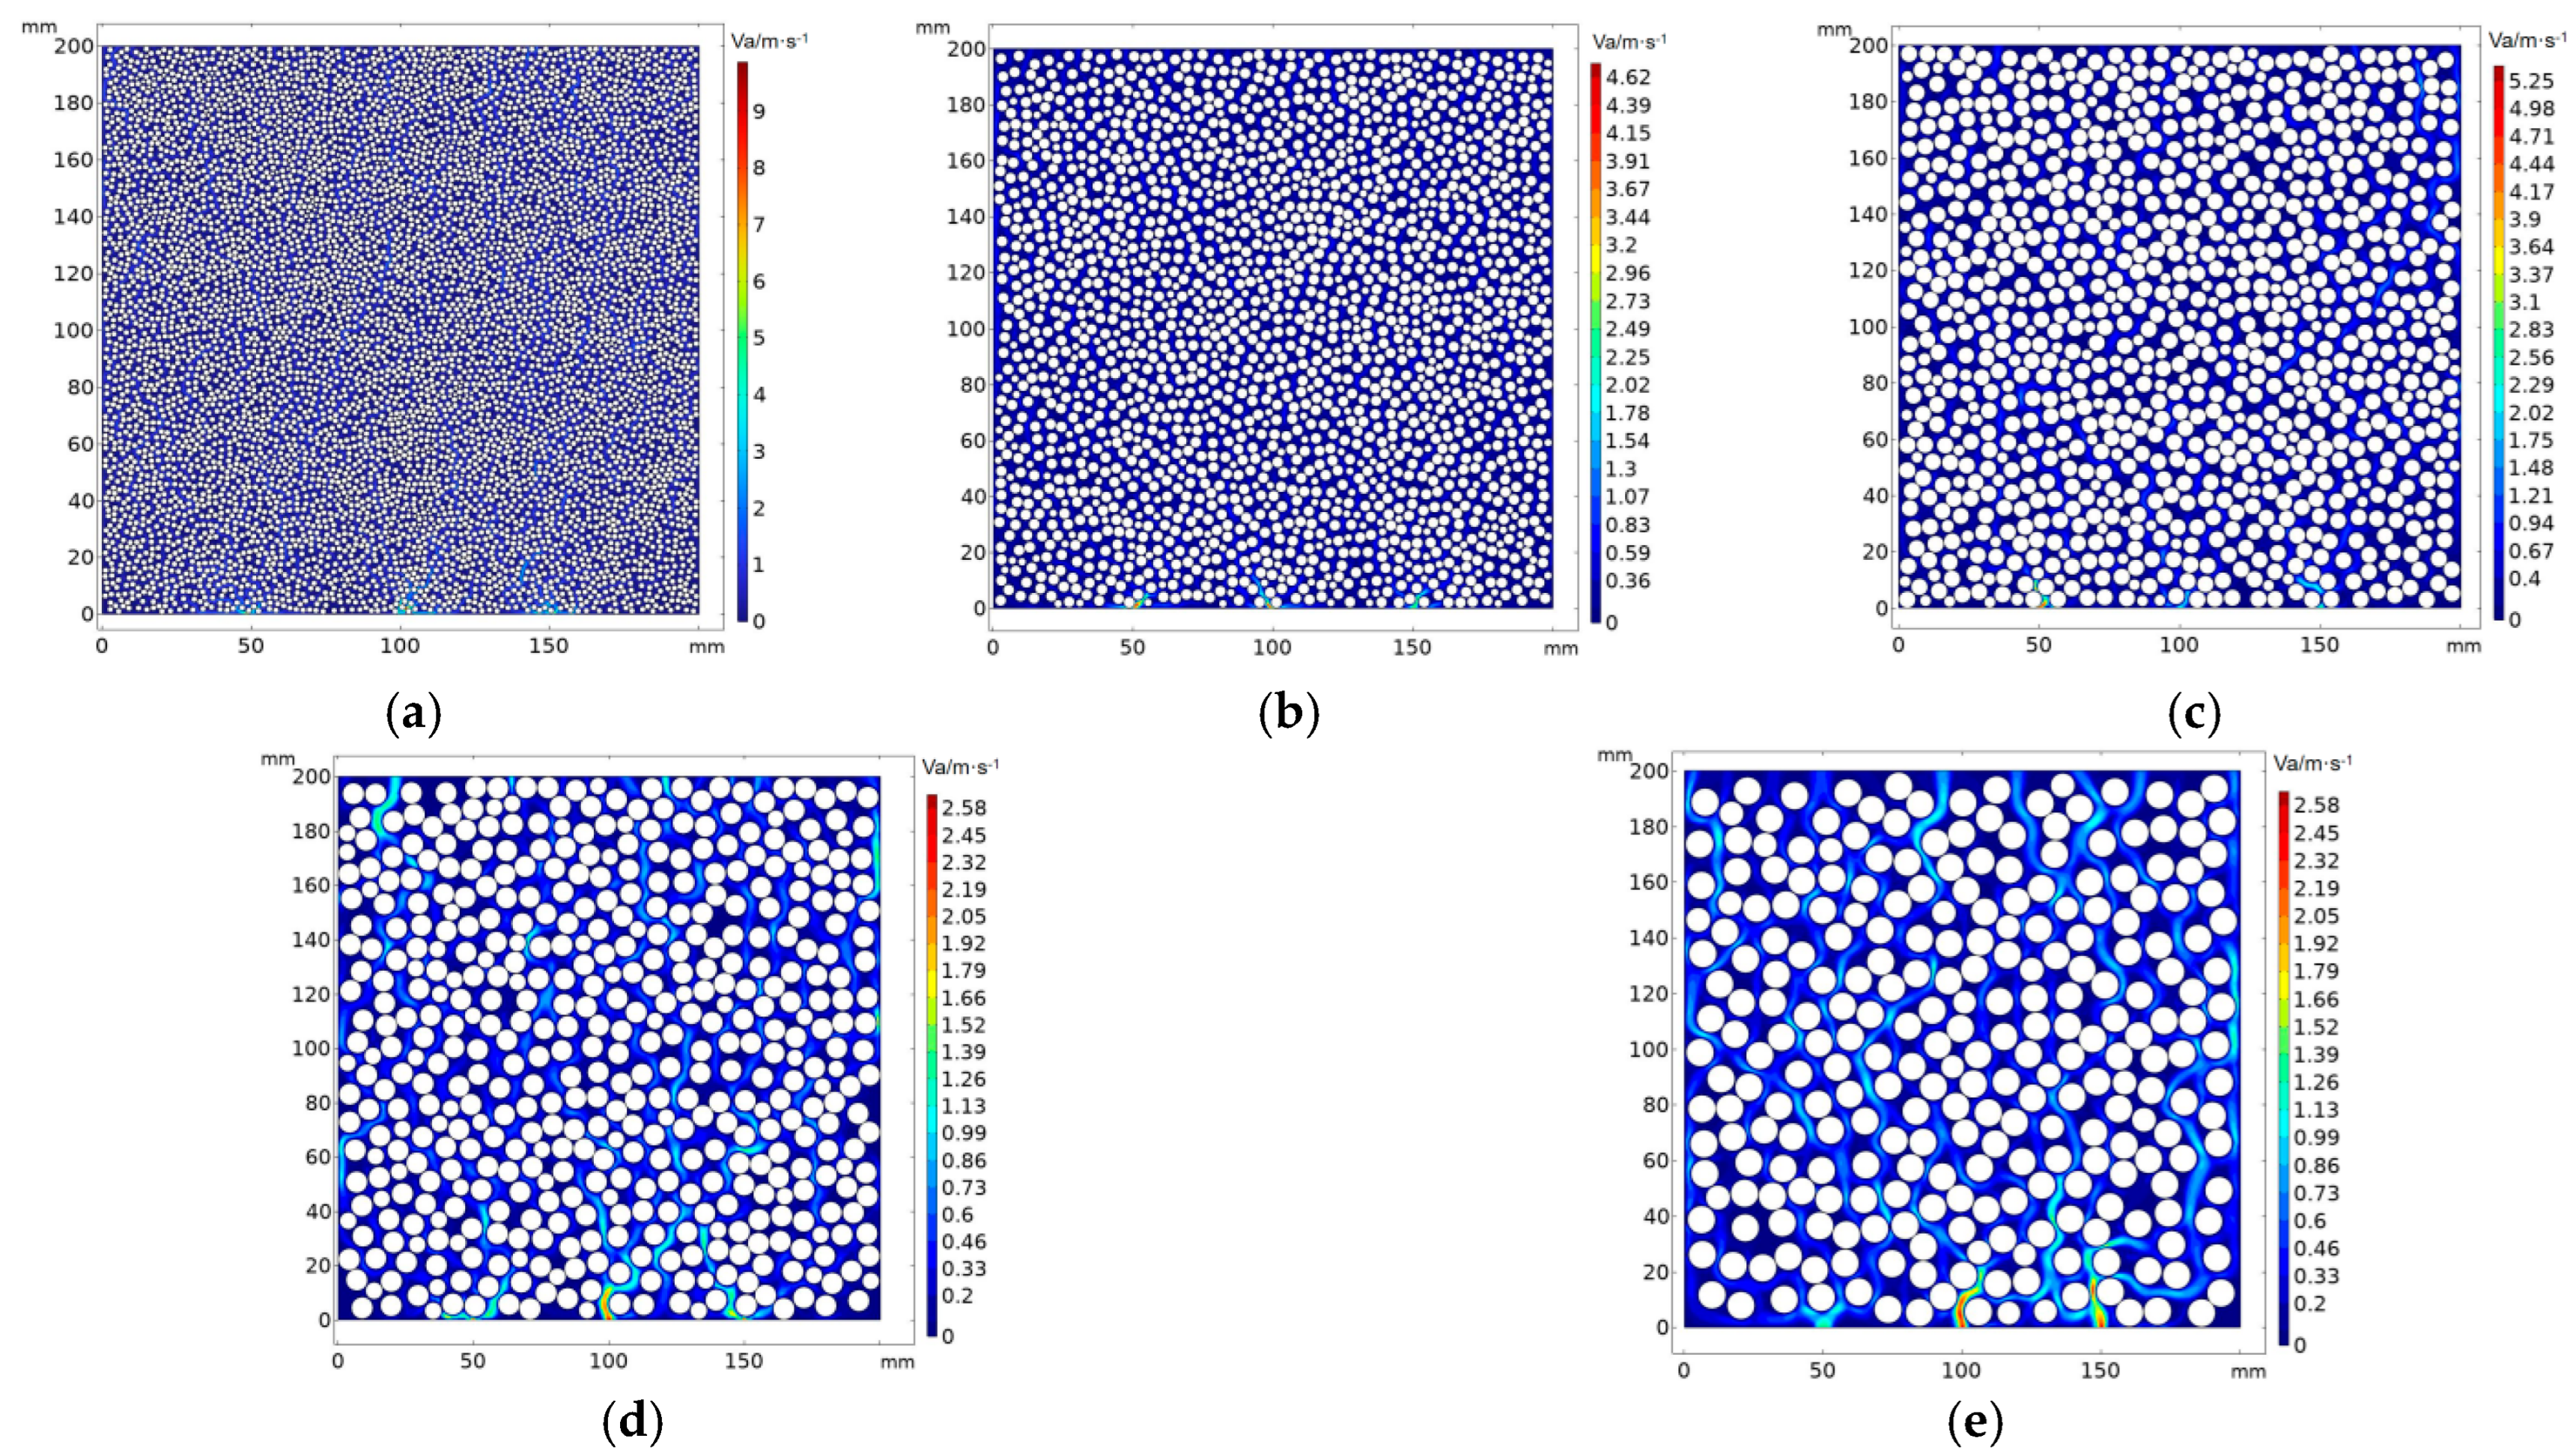
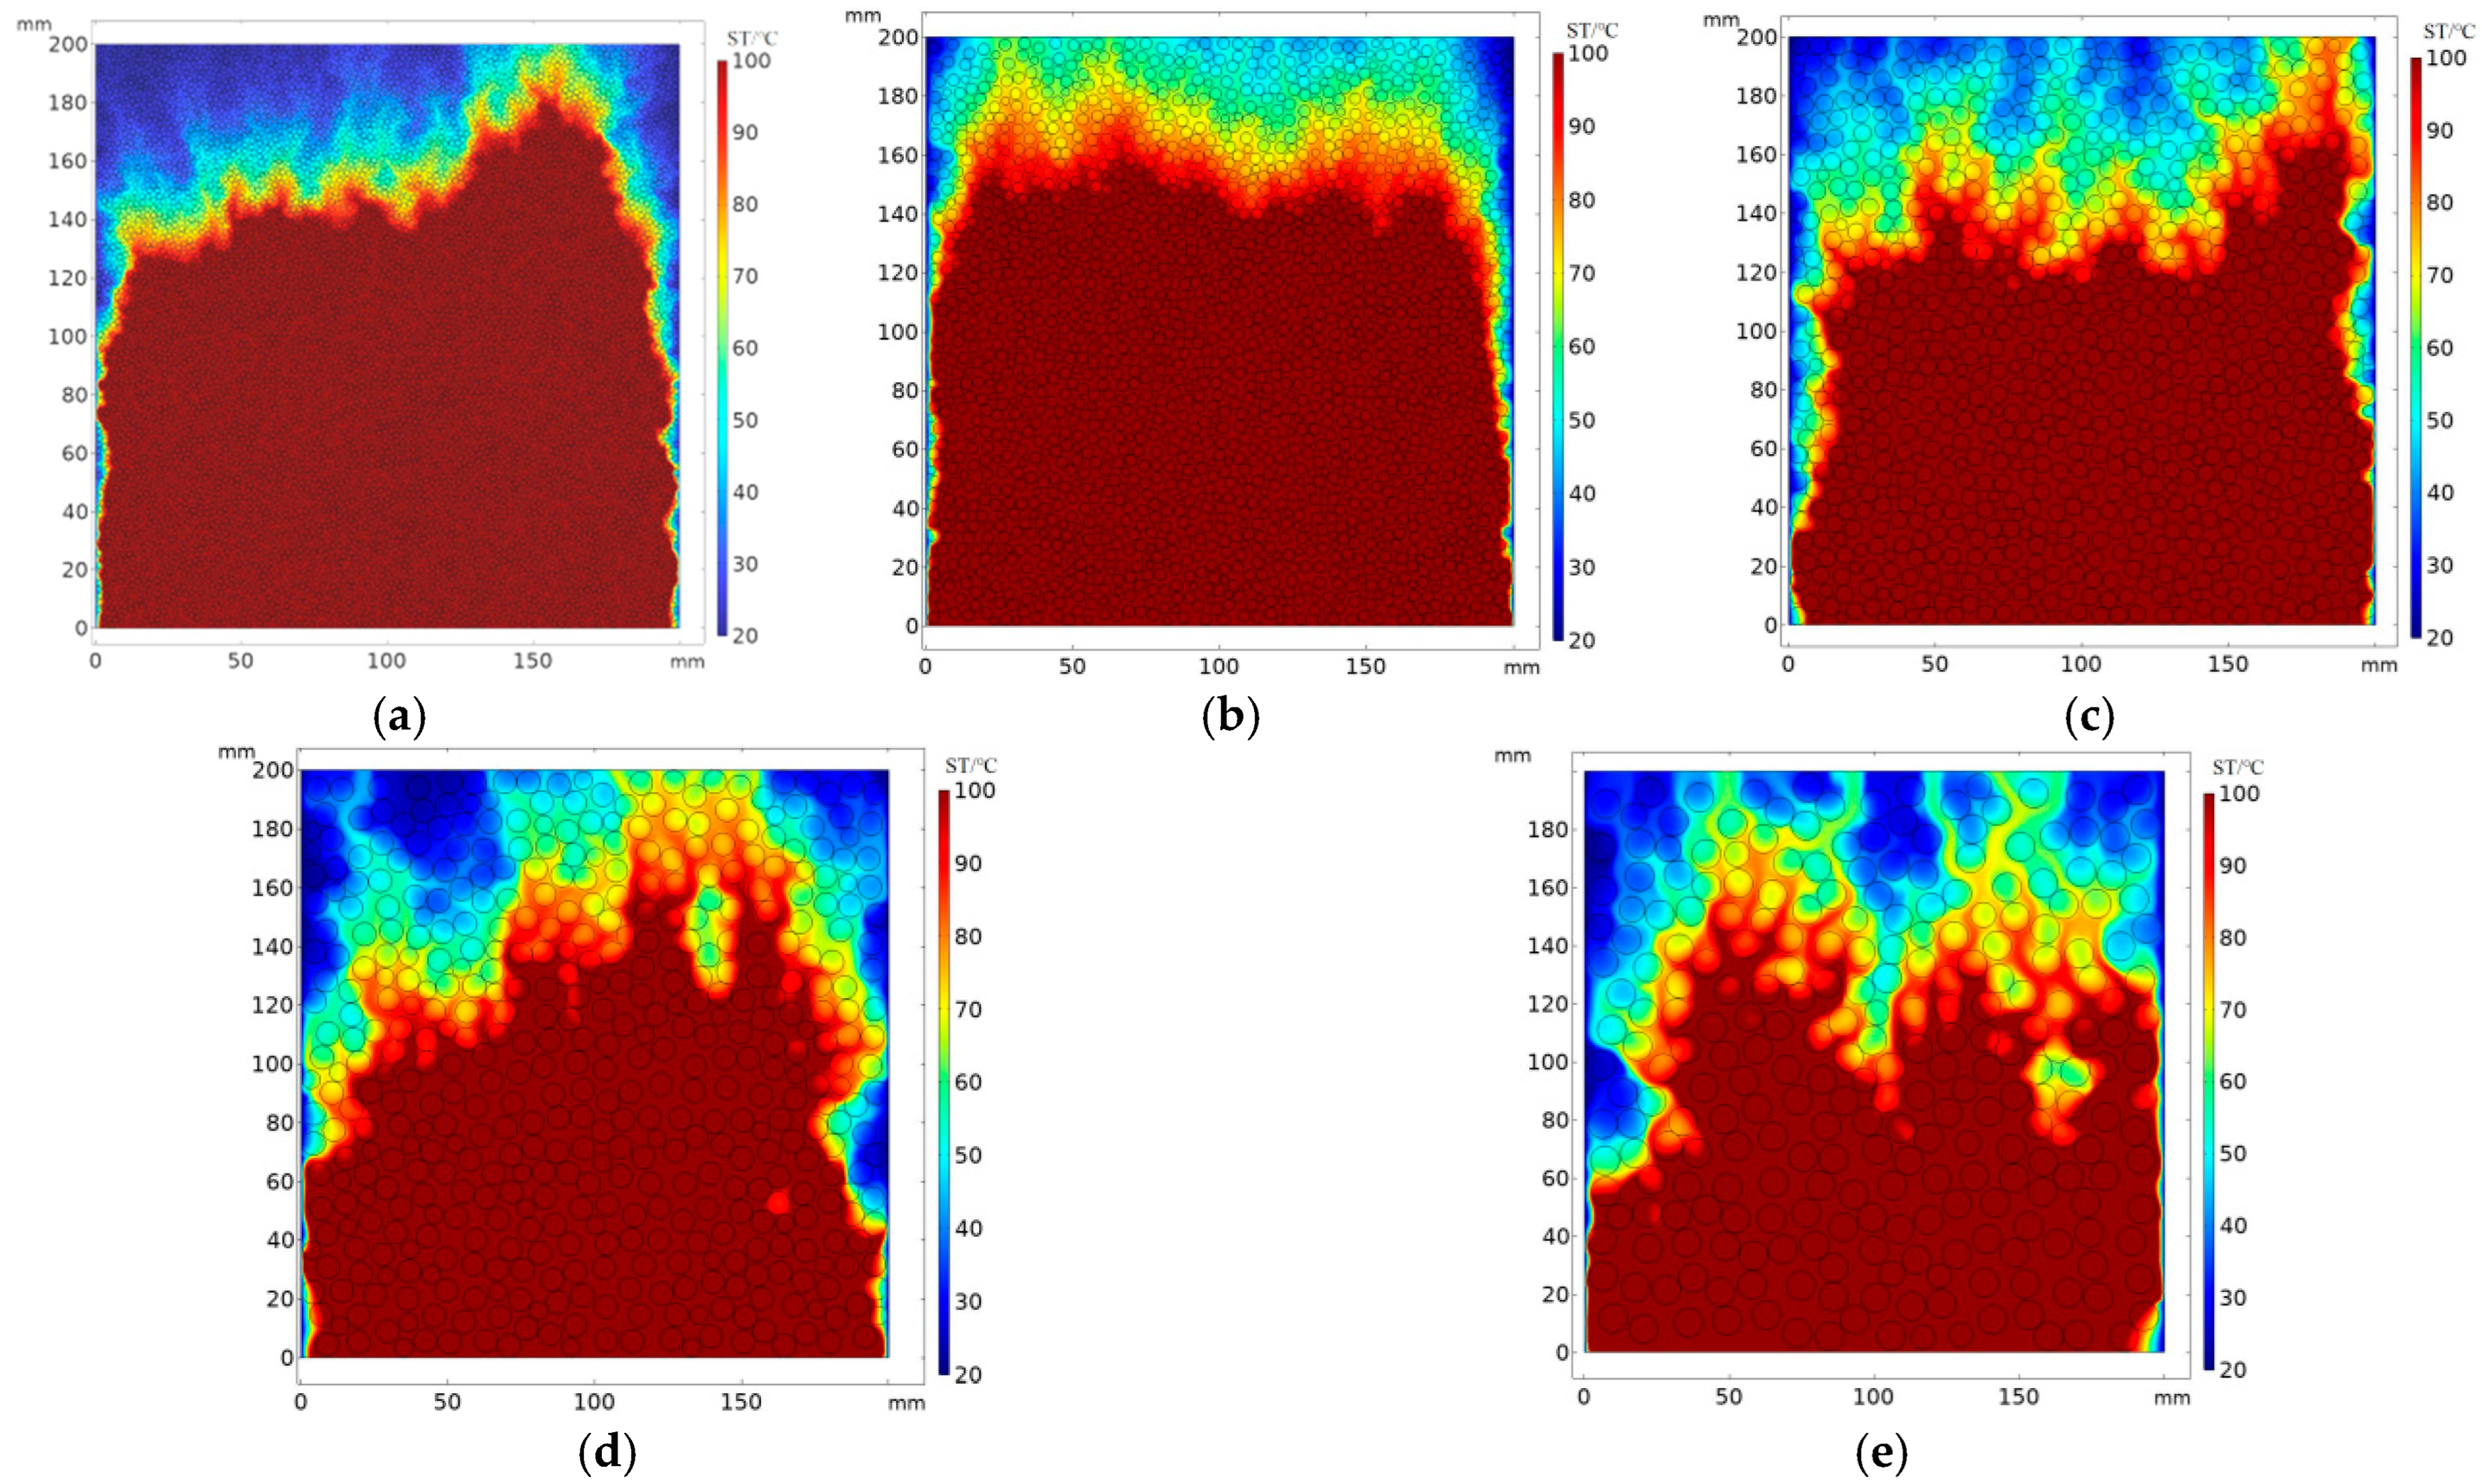
3.1. Simulation Result Analysis

The simulation results of the hot air flow field are as follows. As shown in Figure 5, it can be seen that as the soil aggregate particles increase, the number of soil macropores gradually increases and the maximum flow rate gradually decreases. The hot air gradually forms a macroporous flow and dissipates into the air, which is beneficial for the circulation of hot air and the removal of water.
Figure 6 shows the temperature cloud map when hot air comes into contact with the soil surface. Based on Figure 5, it can also be seen that with the increase in soil aggregate particles, the number of soil macropores gradually increases and the thermal current gradually transitions from a uniformly distributed matrix flow to an irregularly diffused macropore thermal current, which is dissipated into the air. For example, the temperature field distribution of the <2 mm and 2–4 mm treatments is relatively uniform and the thermal current of the 6–8 mm and >8 mm treatments is irregularly distributed. To further determine the effectiveness of hot air heating and dehumidification, it is necessary to explore the coupling effects of hot air heating and dehumidification in different pore structures through experiments.

3.2. Analysis of Test Results

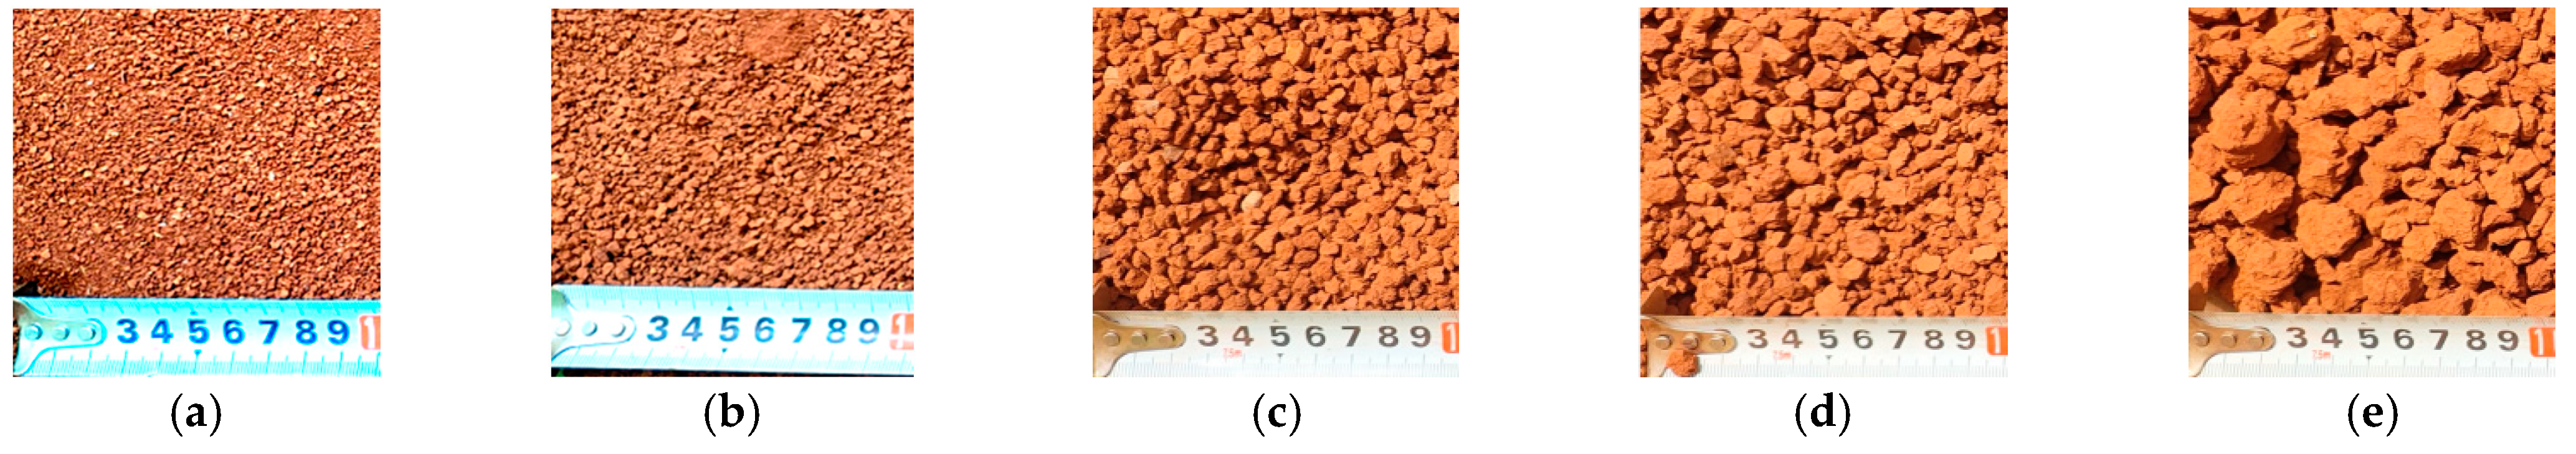
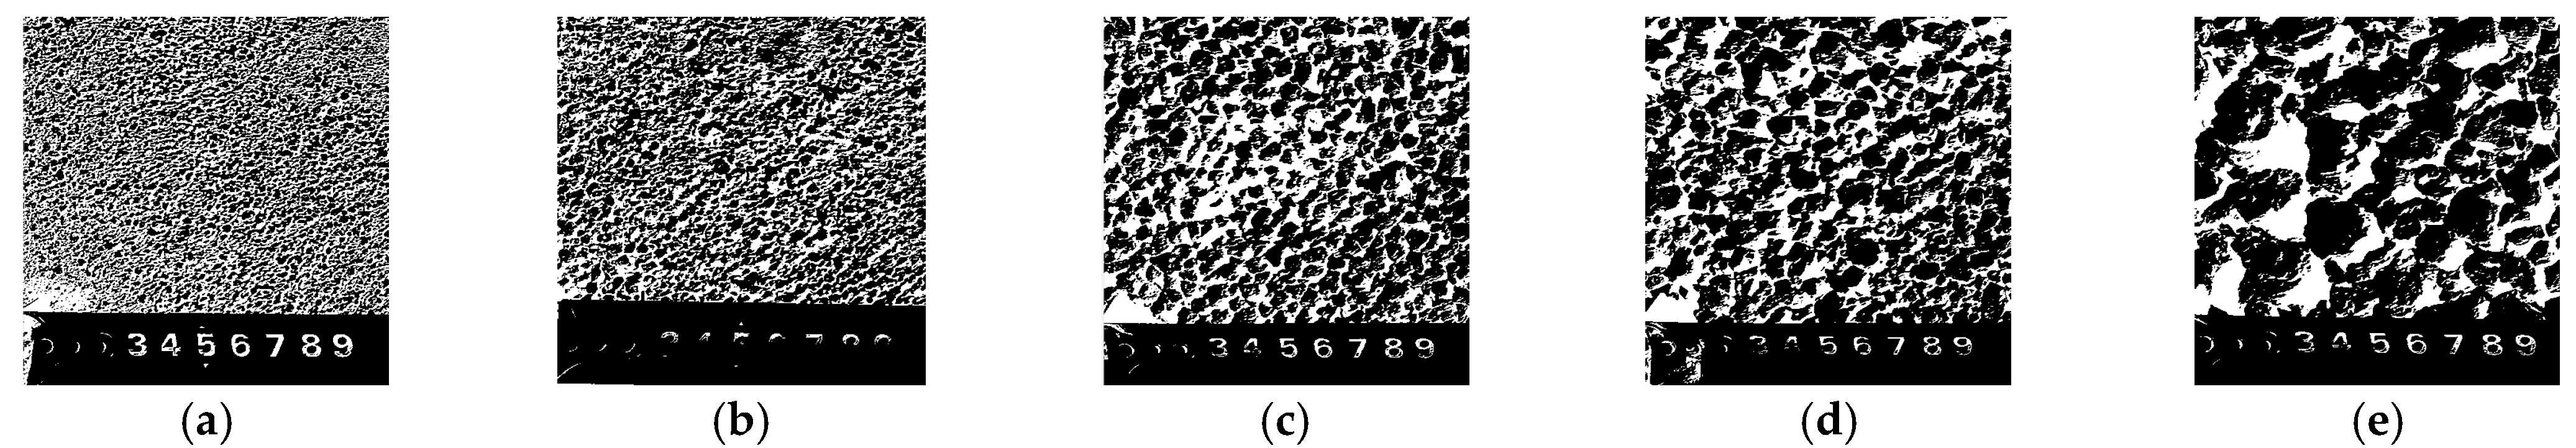
3.2.1. Analysis of Soil Pore Structure

From Figure 7 and Figure 8, it can be seen that as the particle size of the soil aggregates increases, the number of large pores gradually increases. As shown in Figure 8a,e, the <2 mm treatment has more small pores with dense distribution, while the >8 mm treatment has more large pores with dispersed distribution. The increase in small pores can easily lead to the formation of small pore hot air flow and the diffusion of hot air is hindered, resulting in a poor heating effect. The increase in macropores leads to the formation of a macroporous hot air flow, which is more easily diffused and has a good heating effect. The pore structure in the simulation model is consistent with the actual soil pore structure.

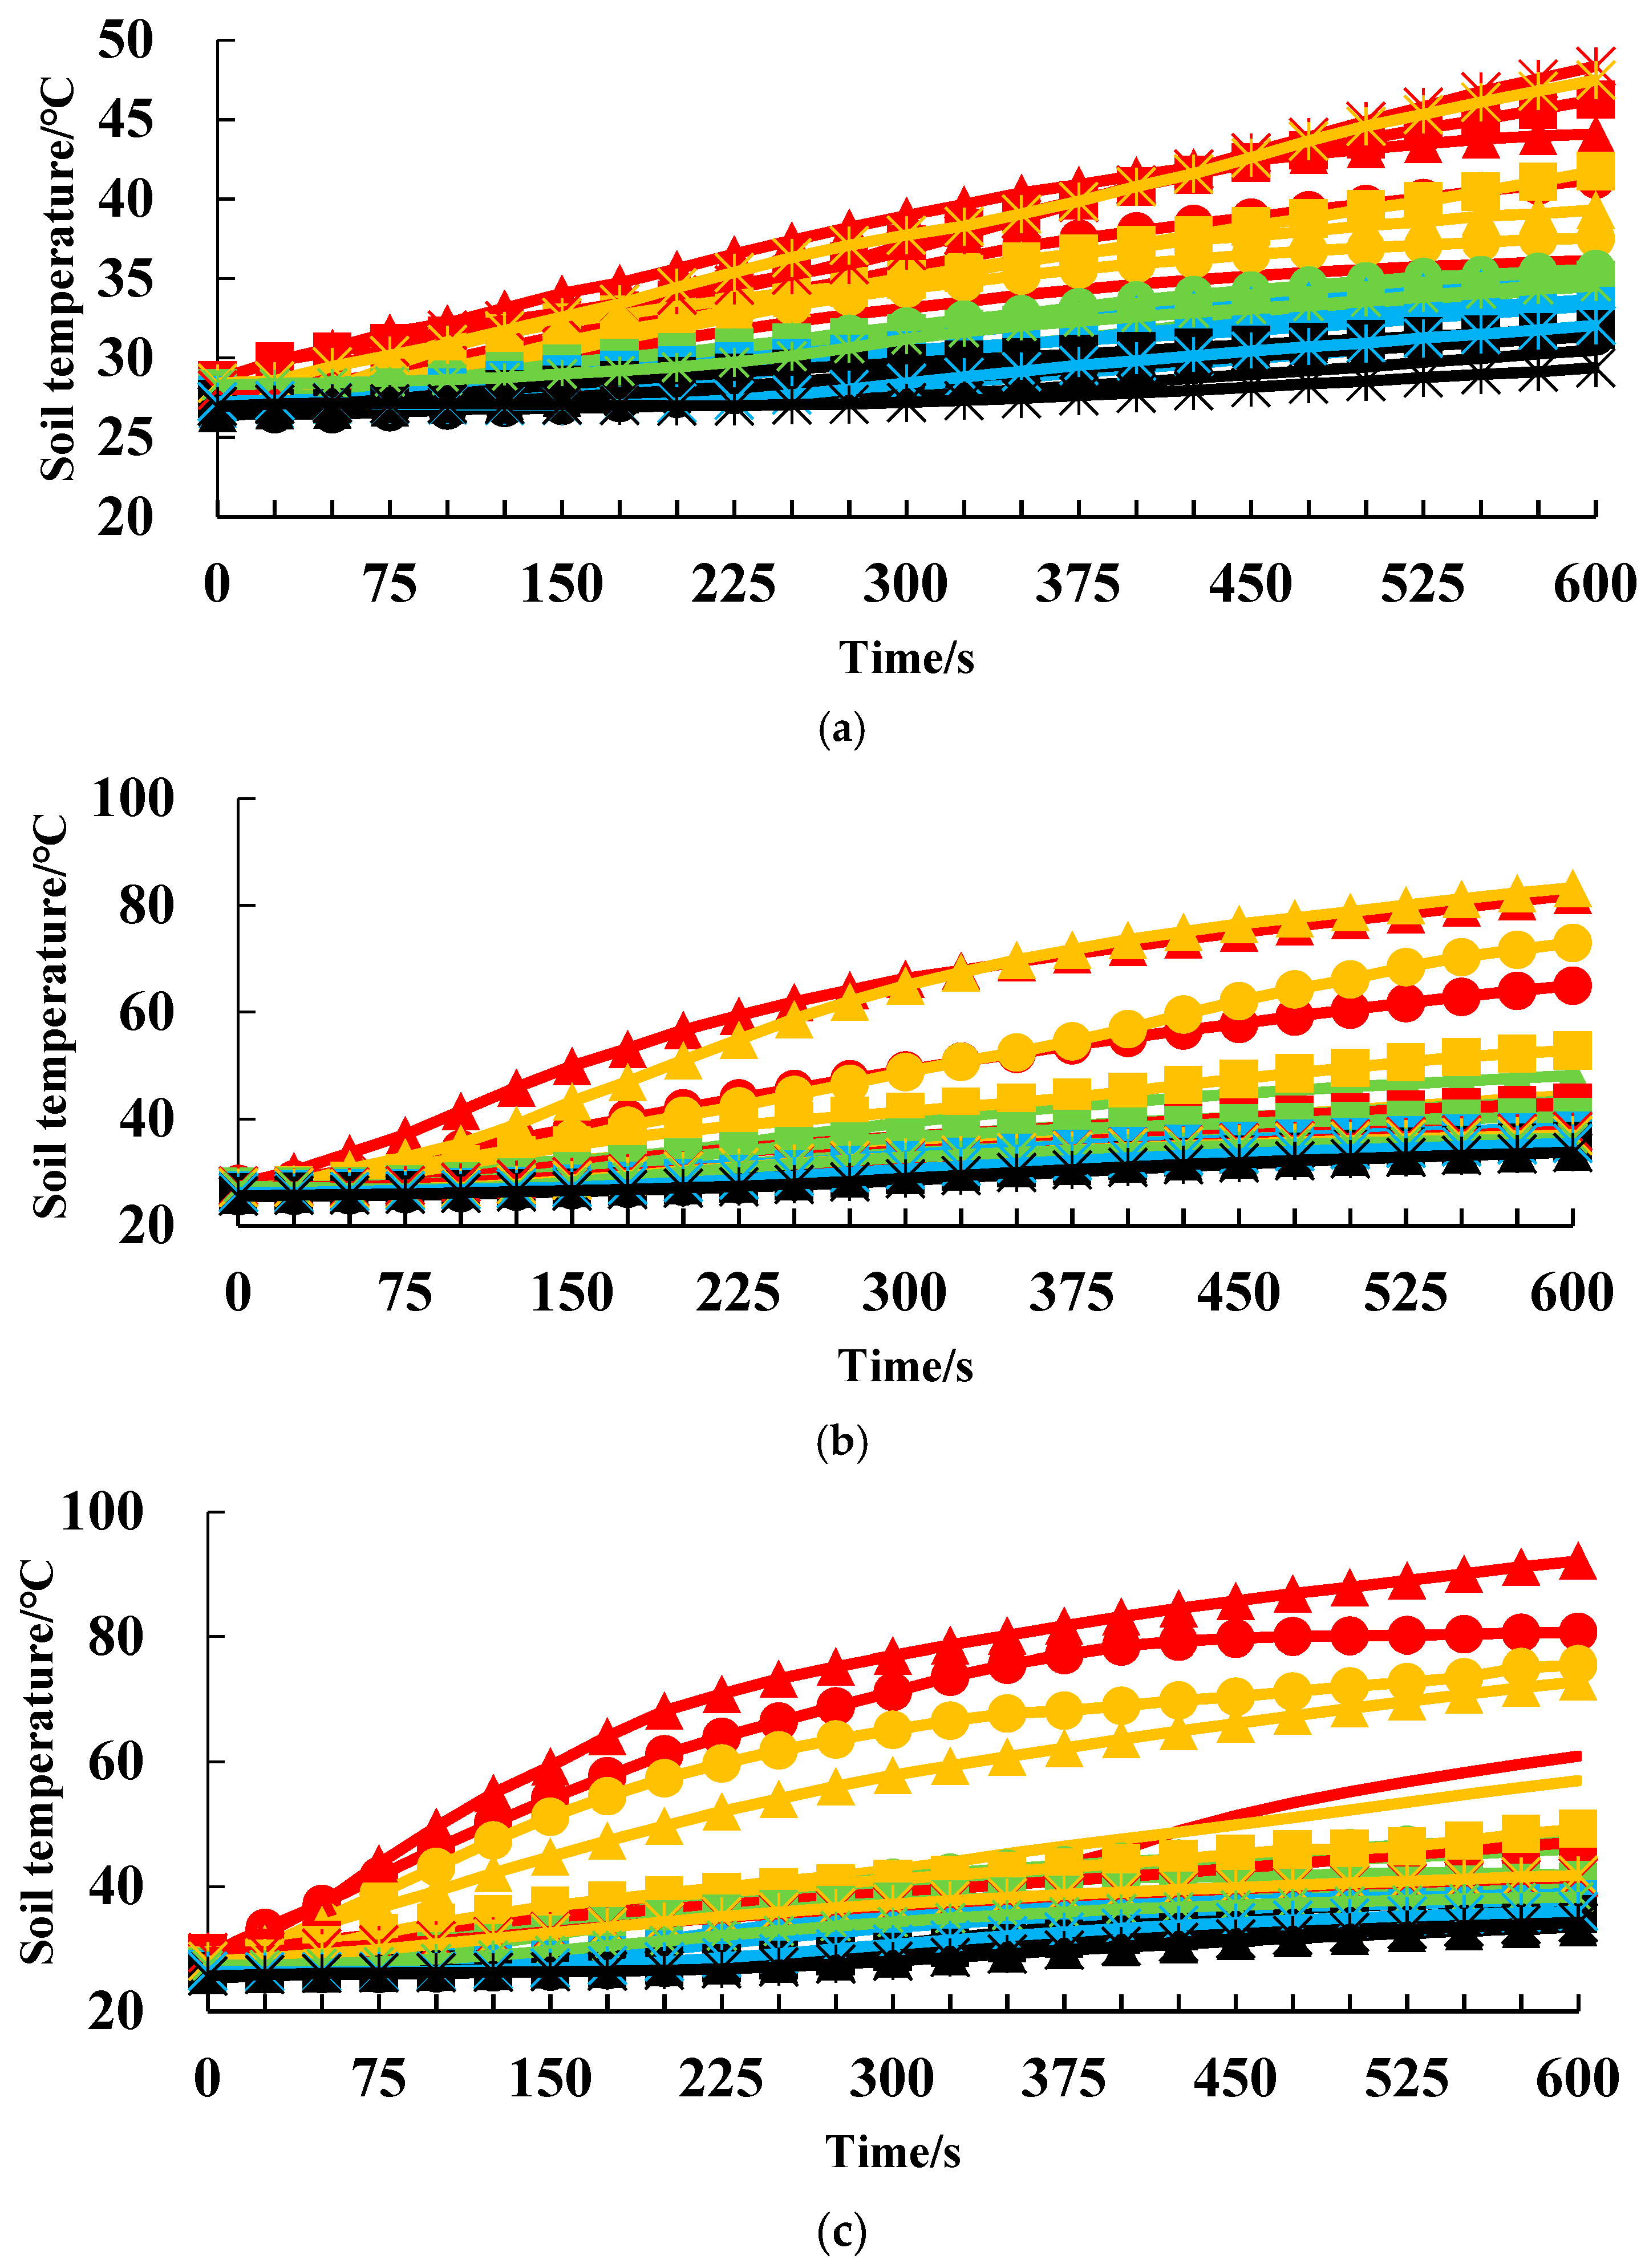
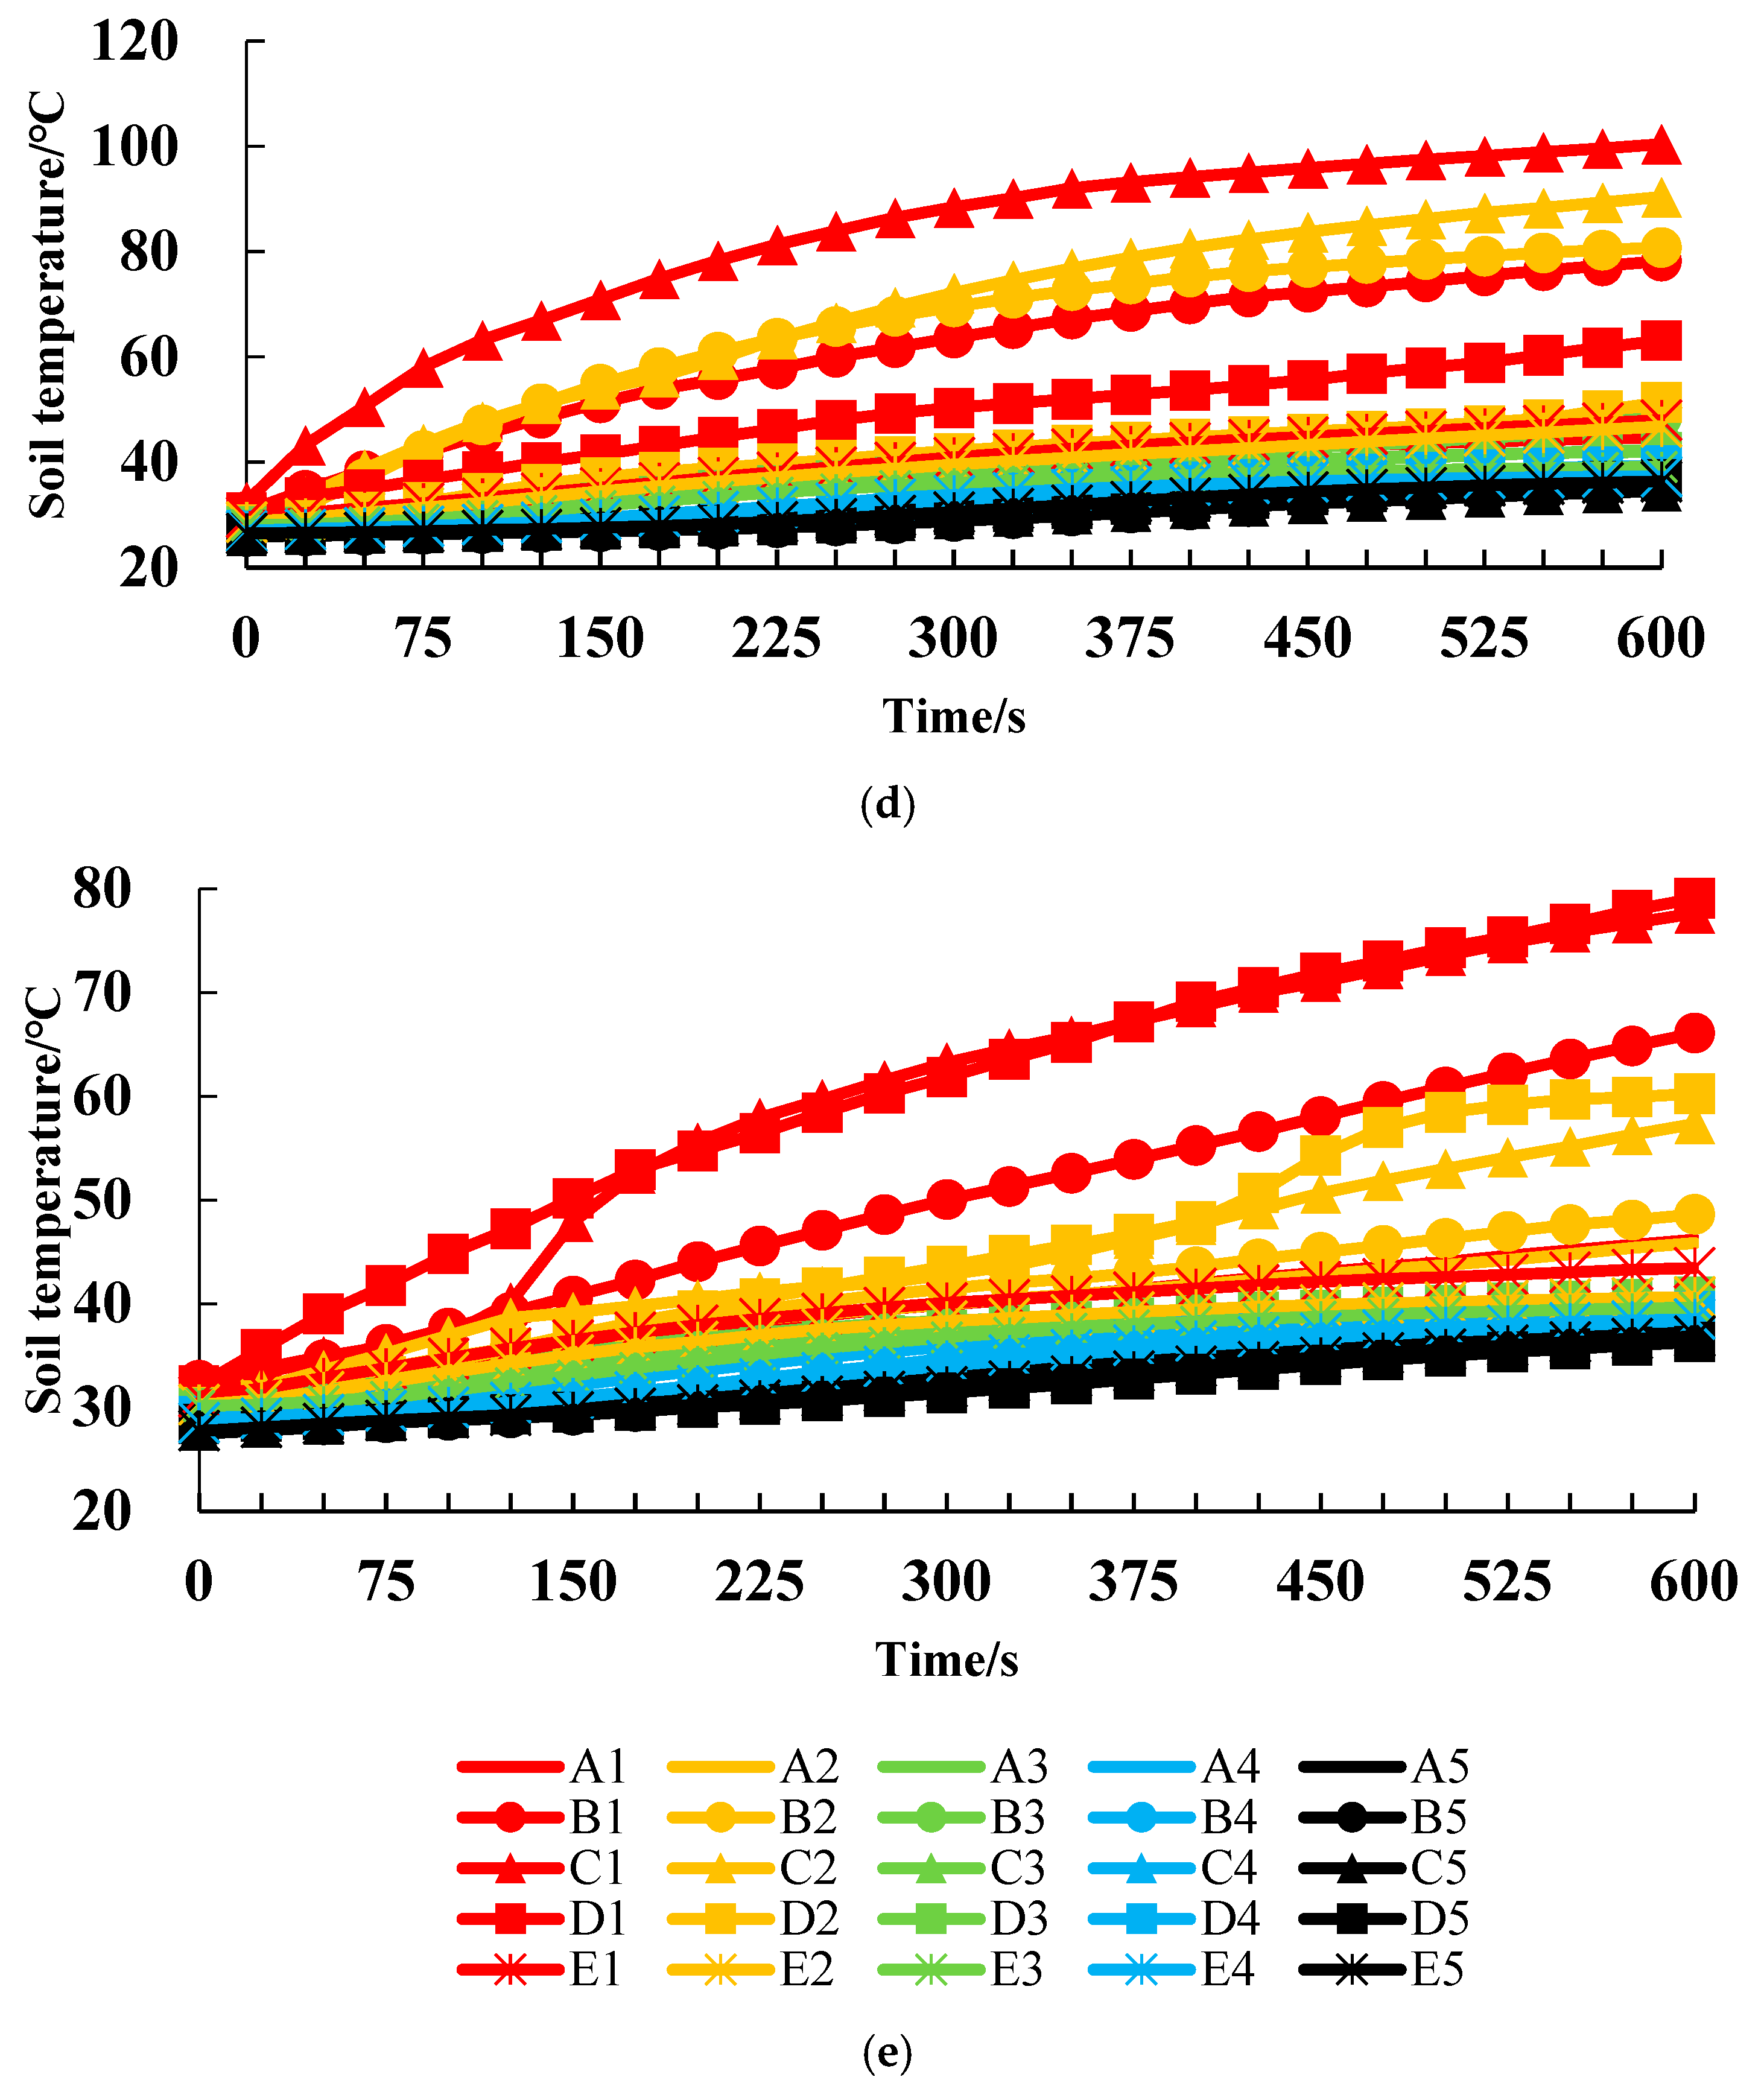
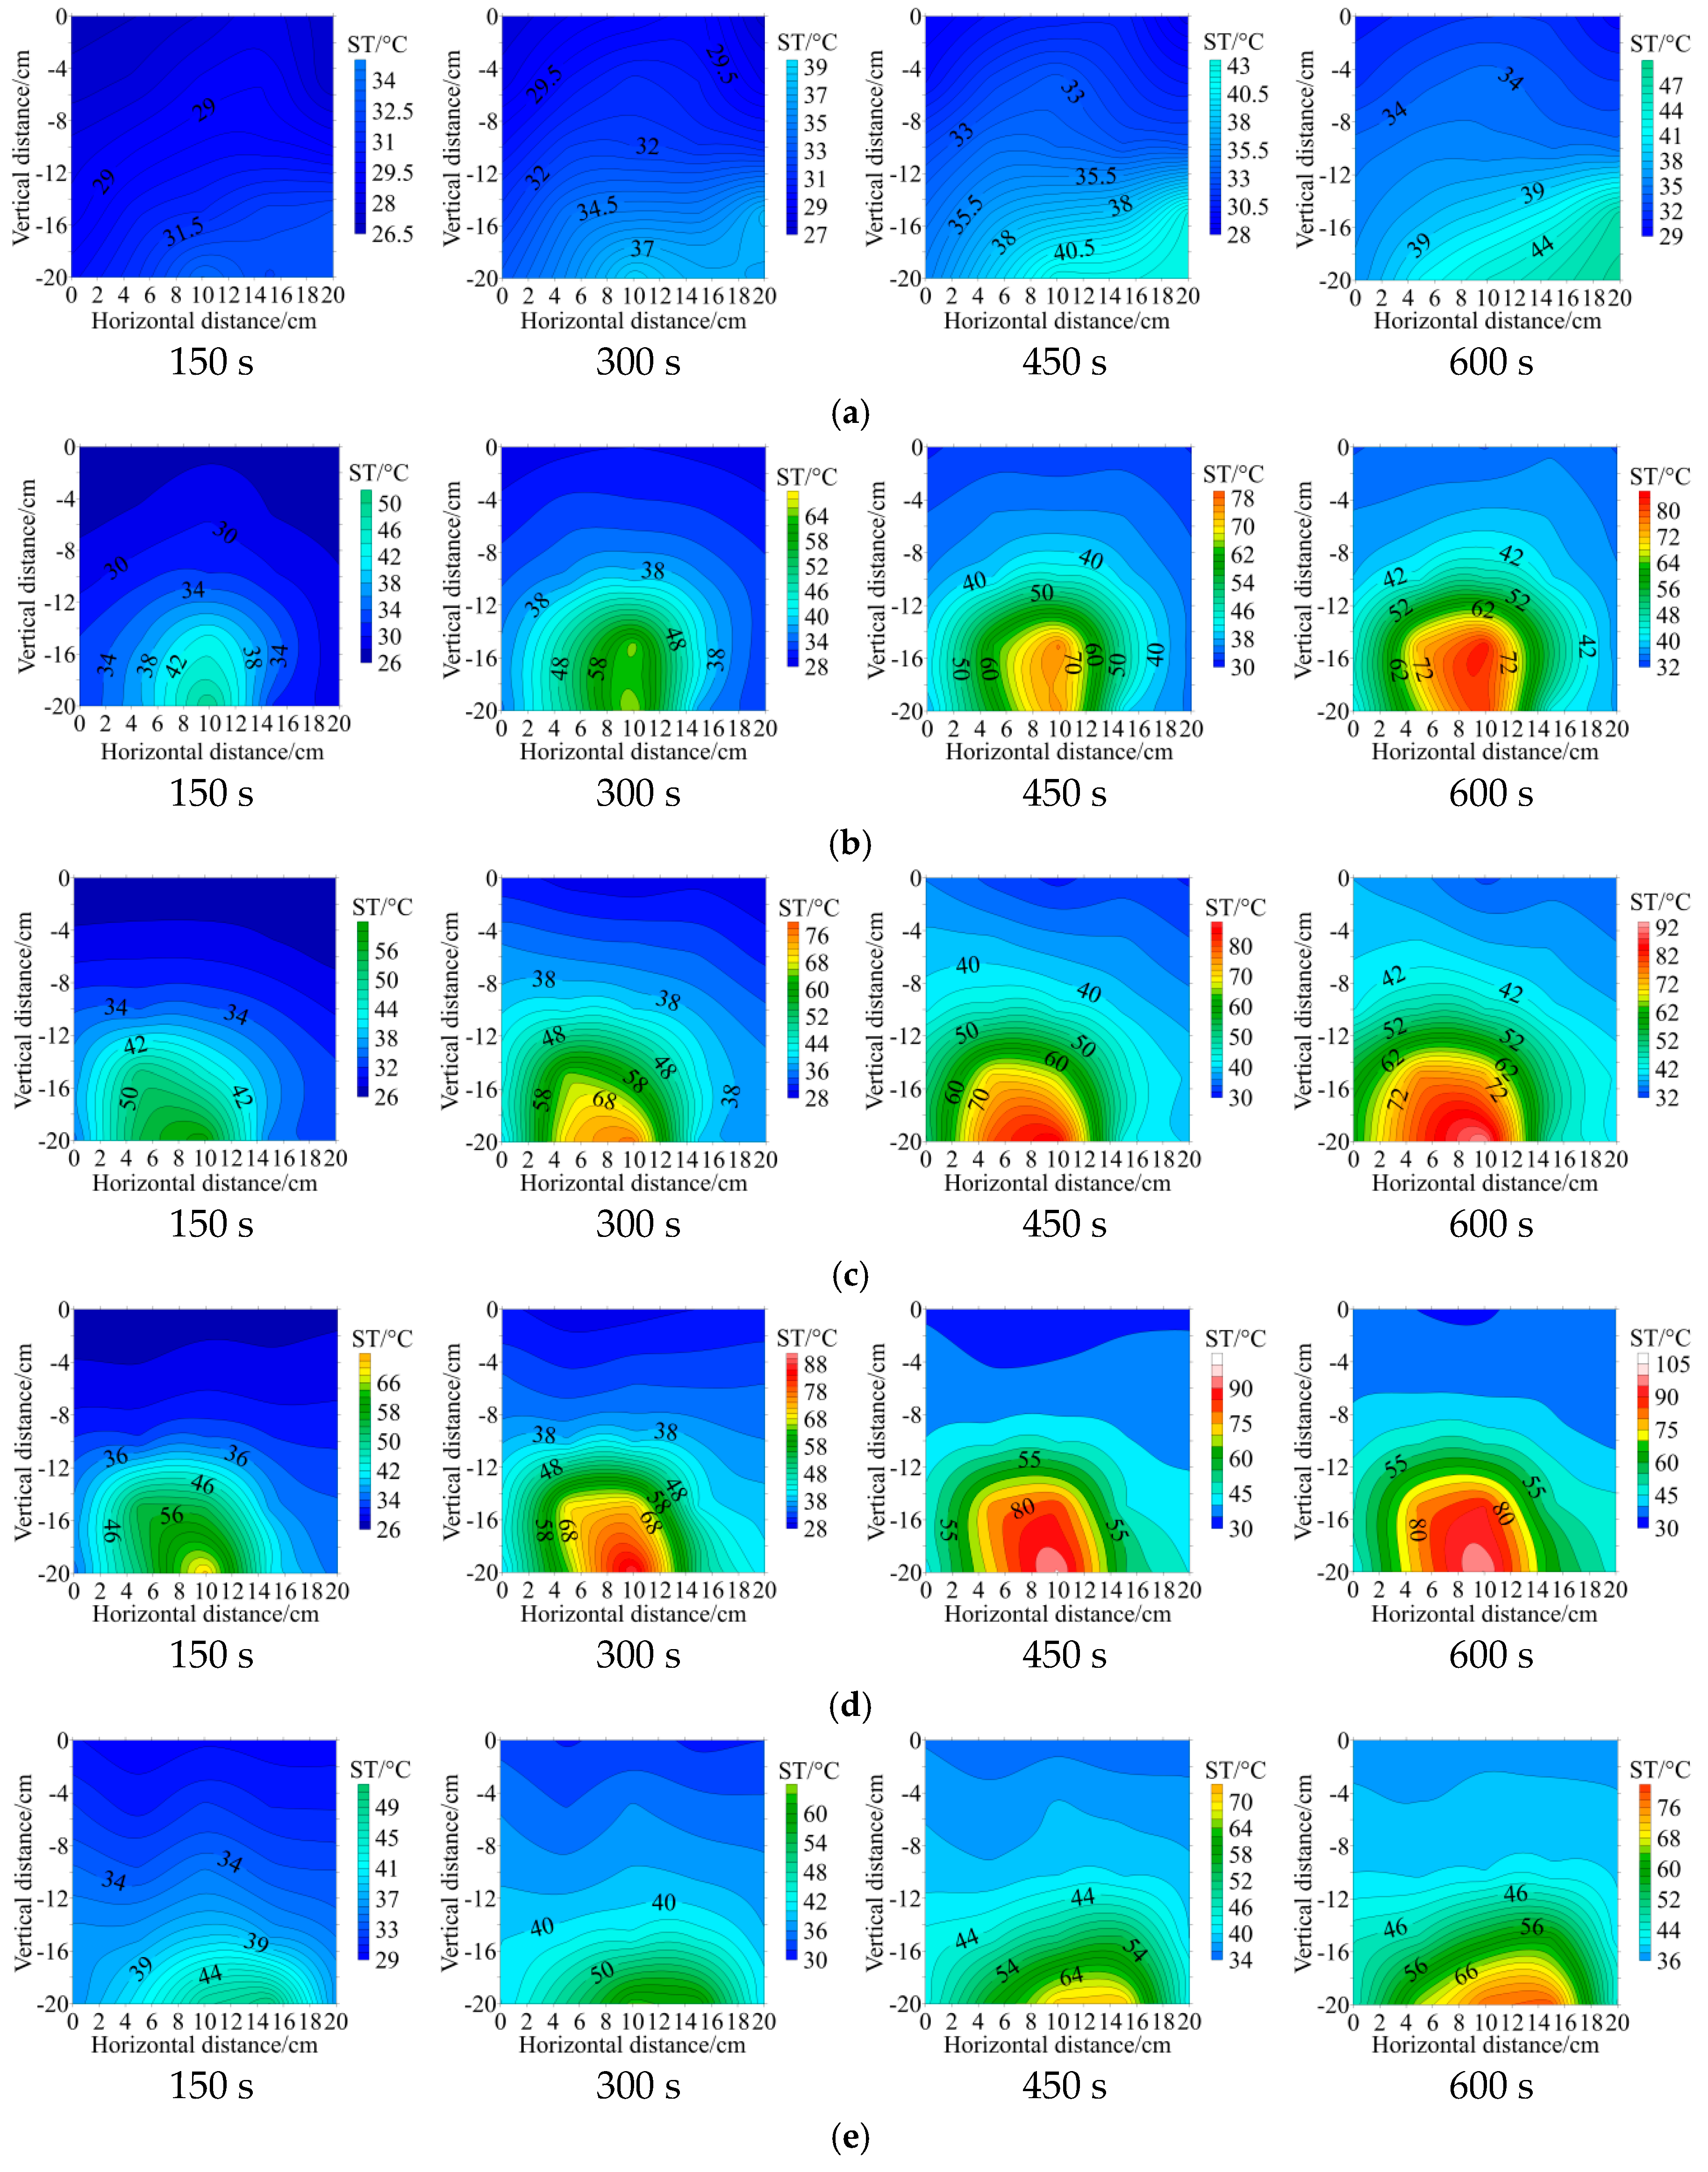
3.2.2. Analysis of Soil Temperature

From Figure 9, it can be seen that as the ventilation time of the hot air increases, the soil temperature slowly increases and the heat transfer rate of the hot air is lower. Within 600 s of ventilation, the deep soil temperature (A1-E1, A2-E2) changes between 45 and 100 °C, while the surface soil temperature (A5-E5) changes to be around 30 °C. The heating rate of the deep soil is greater than that of the surface soil.
From Figure 9a,c,d, the highest deep soil temperature of the 6–8 mm treatment group was 100 °C at the end of ventilation, followed by the 4–6 mm treatment group, while the lowest temperature of the <2 mm treatment group was only 48 °C. Based on Figure 8, it can be seen that this is mainly because the 4–6 mm and 6–8 mm treatment groups have more large pores, which easily form a large pore thermal current and help to improve the heating rate and heating range of the hot air. However, the <2 mm treatment group is composed of small pores with finer pores and the formation of a small pore thermal current is affected by pore resistance, resulting in an impact on the heating rate and diffusion range of the hot air.
From Figure 9a–c, the heating rate of the 2–4 mm treatment group is higher than that of the <2 mm treatment group, but lower than that of the 4–6 mm treatment group. The highest temperature of the 2–4 mm treatment group can reach 83 °C. Based on Figure 9, it can be seen that this is because the pore structure (number of large and small pores) of the 2–4 mm treatment group is between the <2 mm and 4–6 mm treatment groups, while the 2–4 mm treatment group has more large pores than the <2 mm treatment group, making it easier for hot air to diffuse.
Further analysis of Figure 9c,d, and e shows that the heating rate of the >8 mm treatment group is lower than that of the 4–6 mm and 6–8 mm treatment groups. The main reason may be that although the >8 mm treatment group has more macropores and hot air is more prone to diffusion, excessive macropores can also cause the formation of an excessive macropore thermal current, leading to ineffective heat loss.
From Figure 10a, it can be seen that throughout 600 s of ventilation, the temperature field of the <2 mm treatment group did not change significantly and the heating effect of hot air was not significant. As can be seen from Figure 10b–e, the high temperature areas (ST > 80 °C) of the 2–4 mm to >8 mm treatment groups are mainly concentrated at the layer depth of 16–20 cm (from ventilation 450 s to 600 s).
As can be seen from Figure 10, the 4–6 mm and 6–8 mm treatment groups have the largest range of high temperature areas and the hot air heating effect is the best. The 2–4 mm and >8 mm treatment group followed; for the <2 mm treatment group, without high temperature area, the hot air heating effect is the worst. This is mainly related to the soil pore structure and different forms of thermal current (large pore hot air flow and small pore hot air flow) will be generated after ventilation, and its heat transfer, heating effect, and high temperature area will be different. It can also be seen from Figure 10 that soil temperature increases significantly after 300–450 s of ventilation, which will heat the water in the soil and remove excess water.

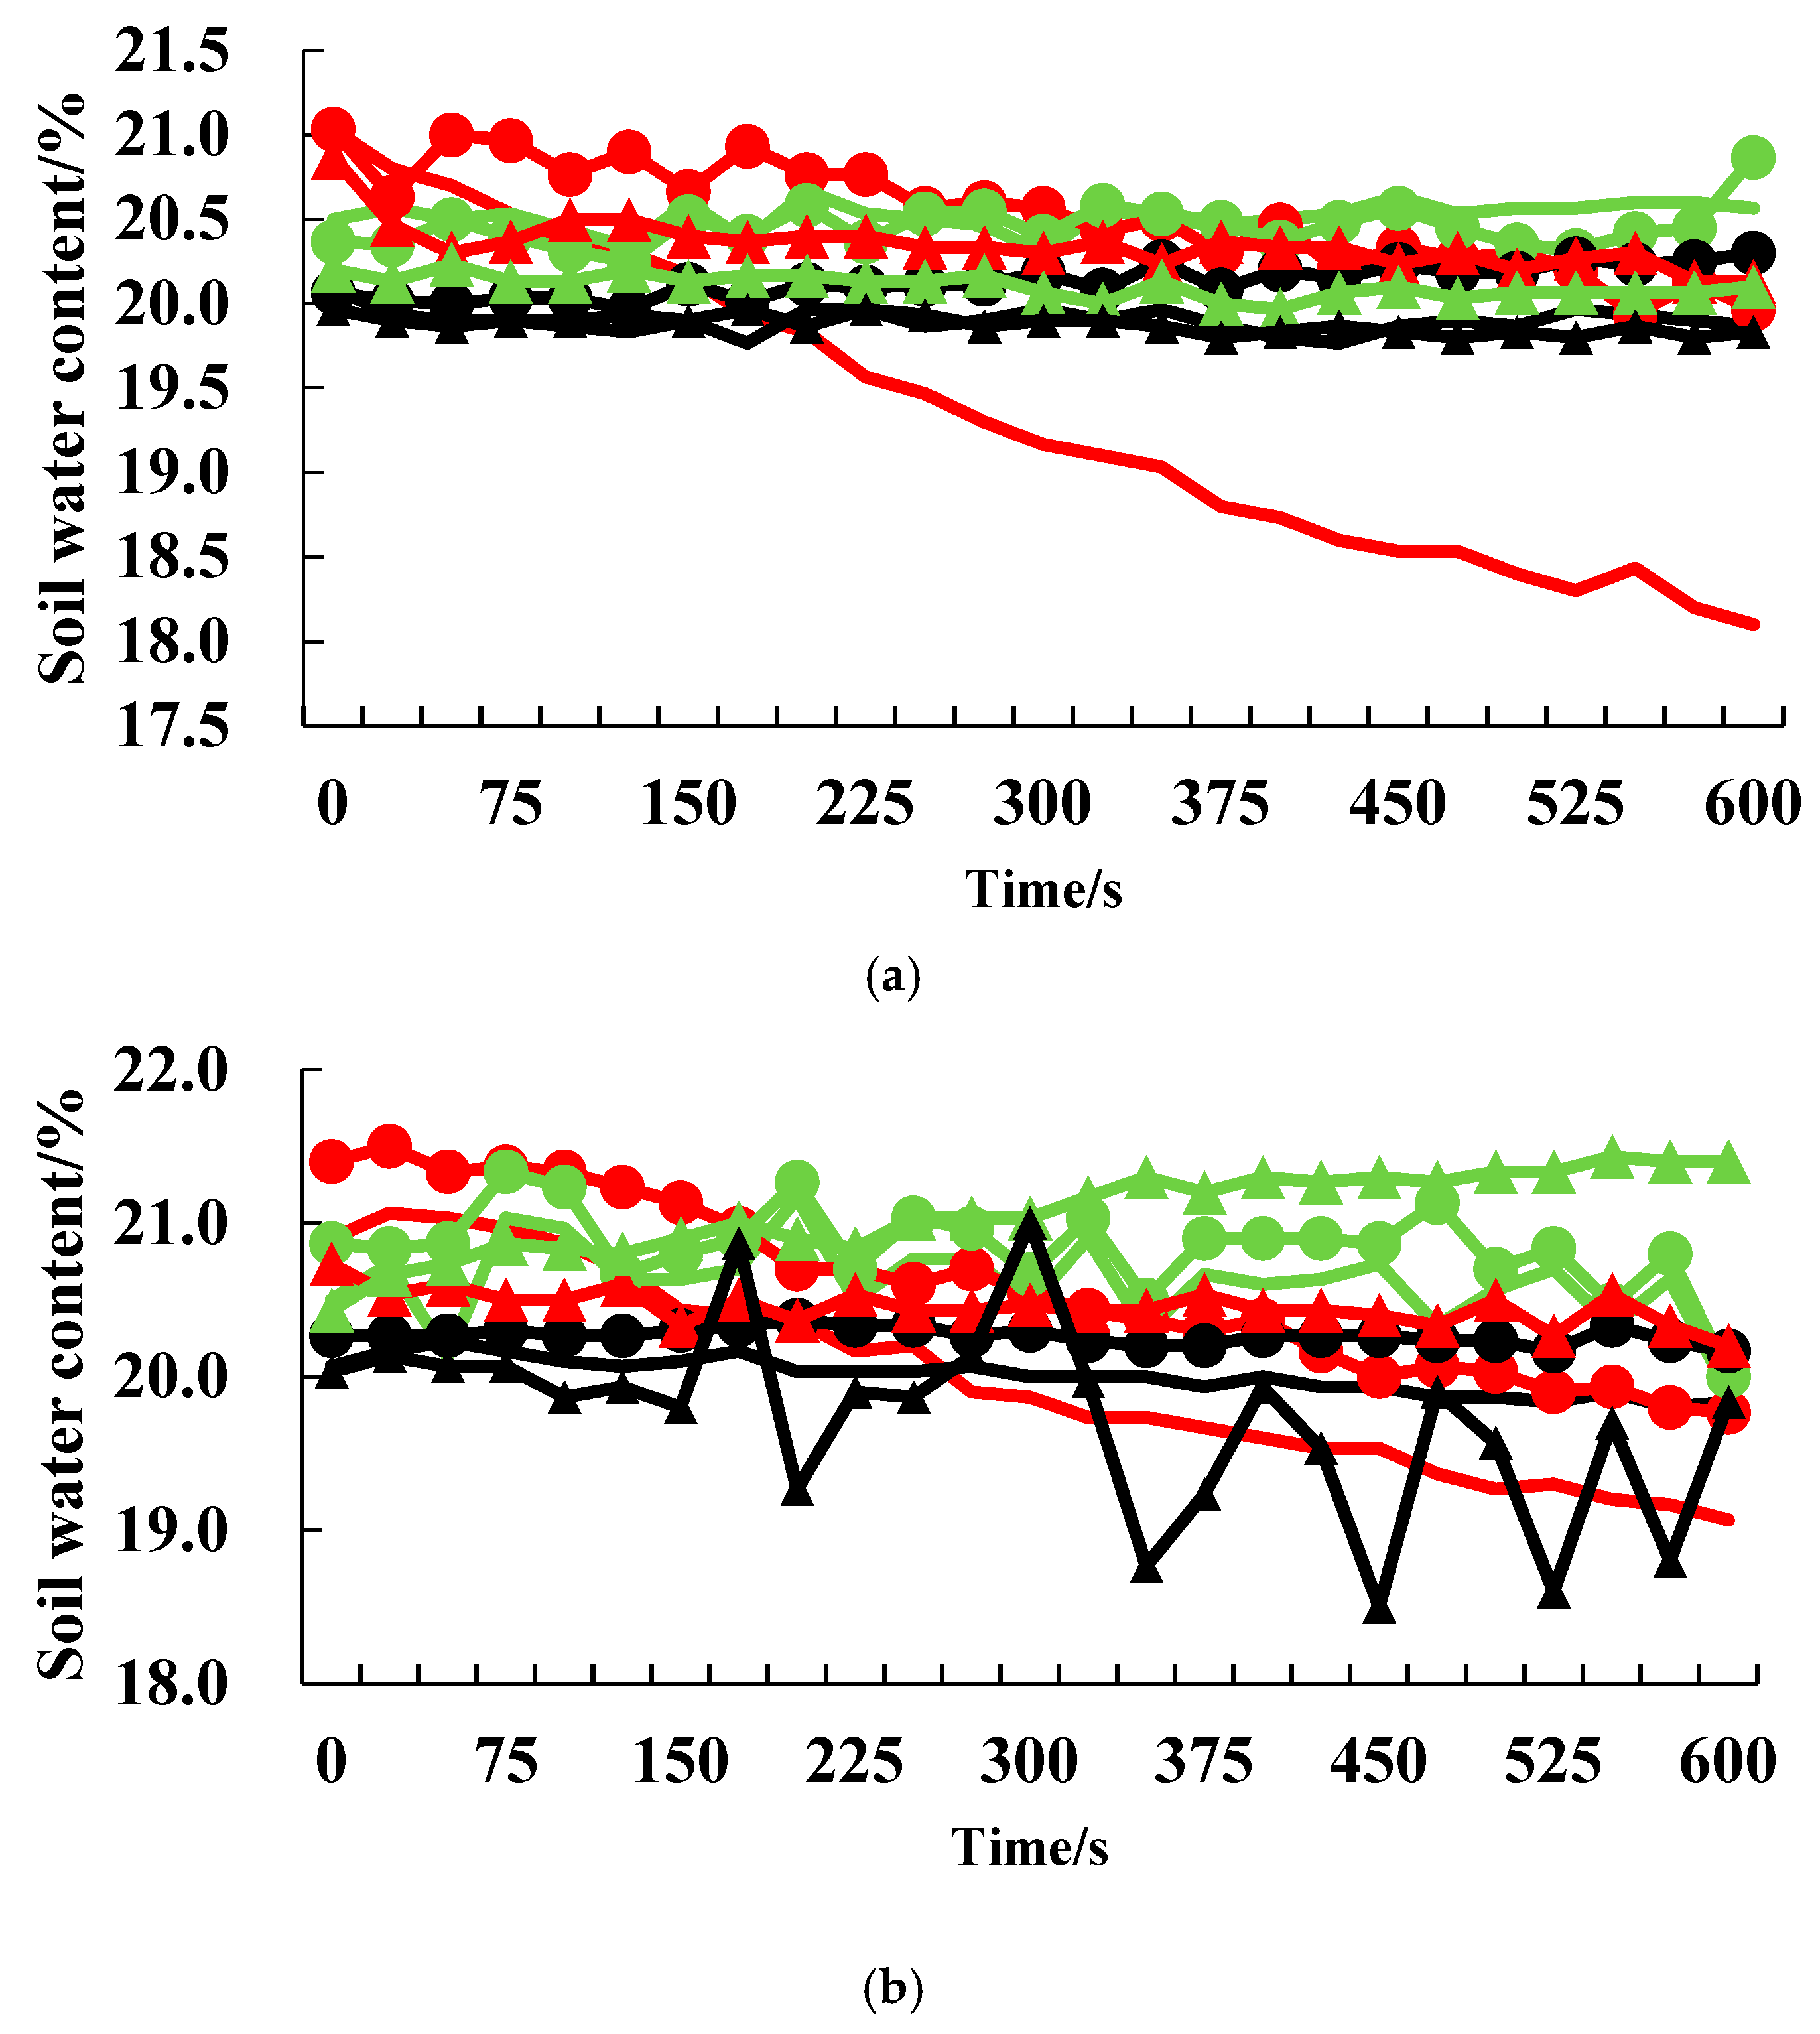
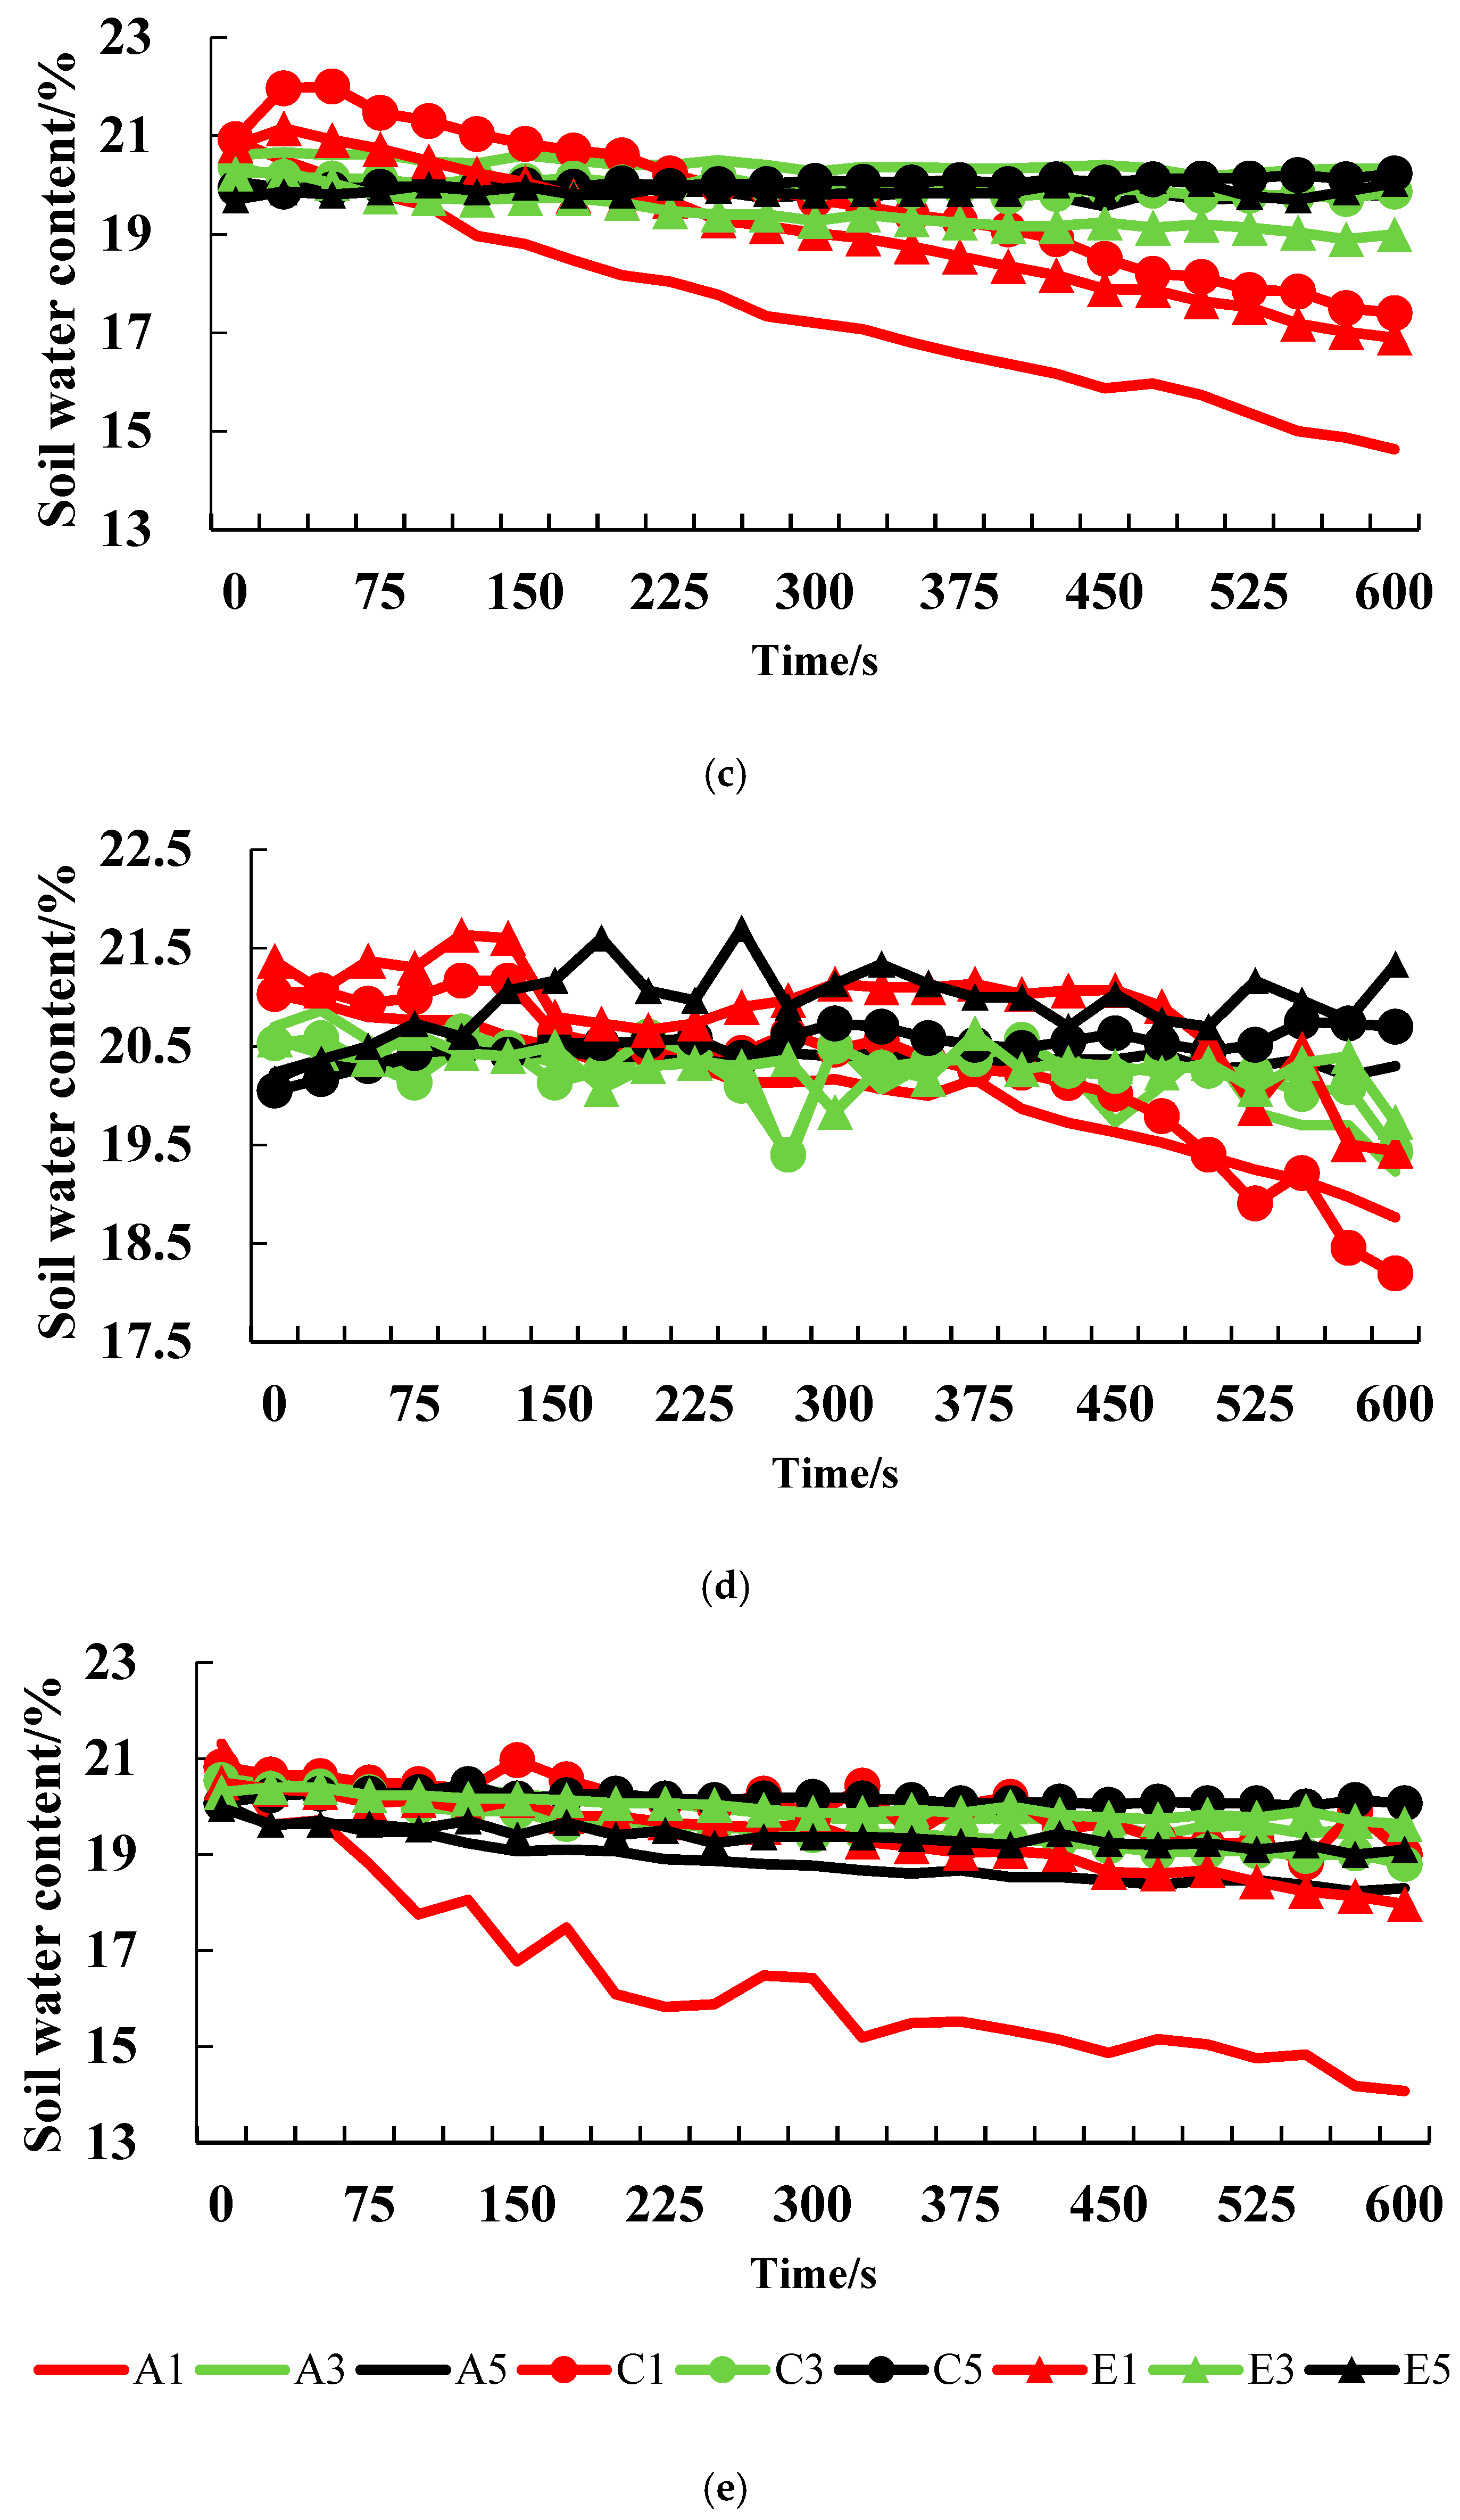
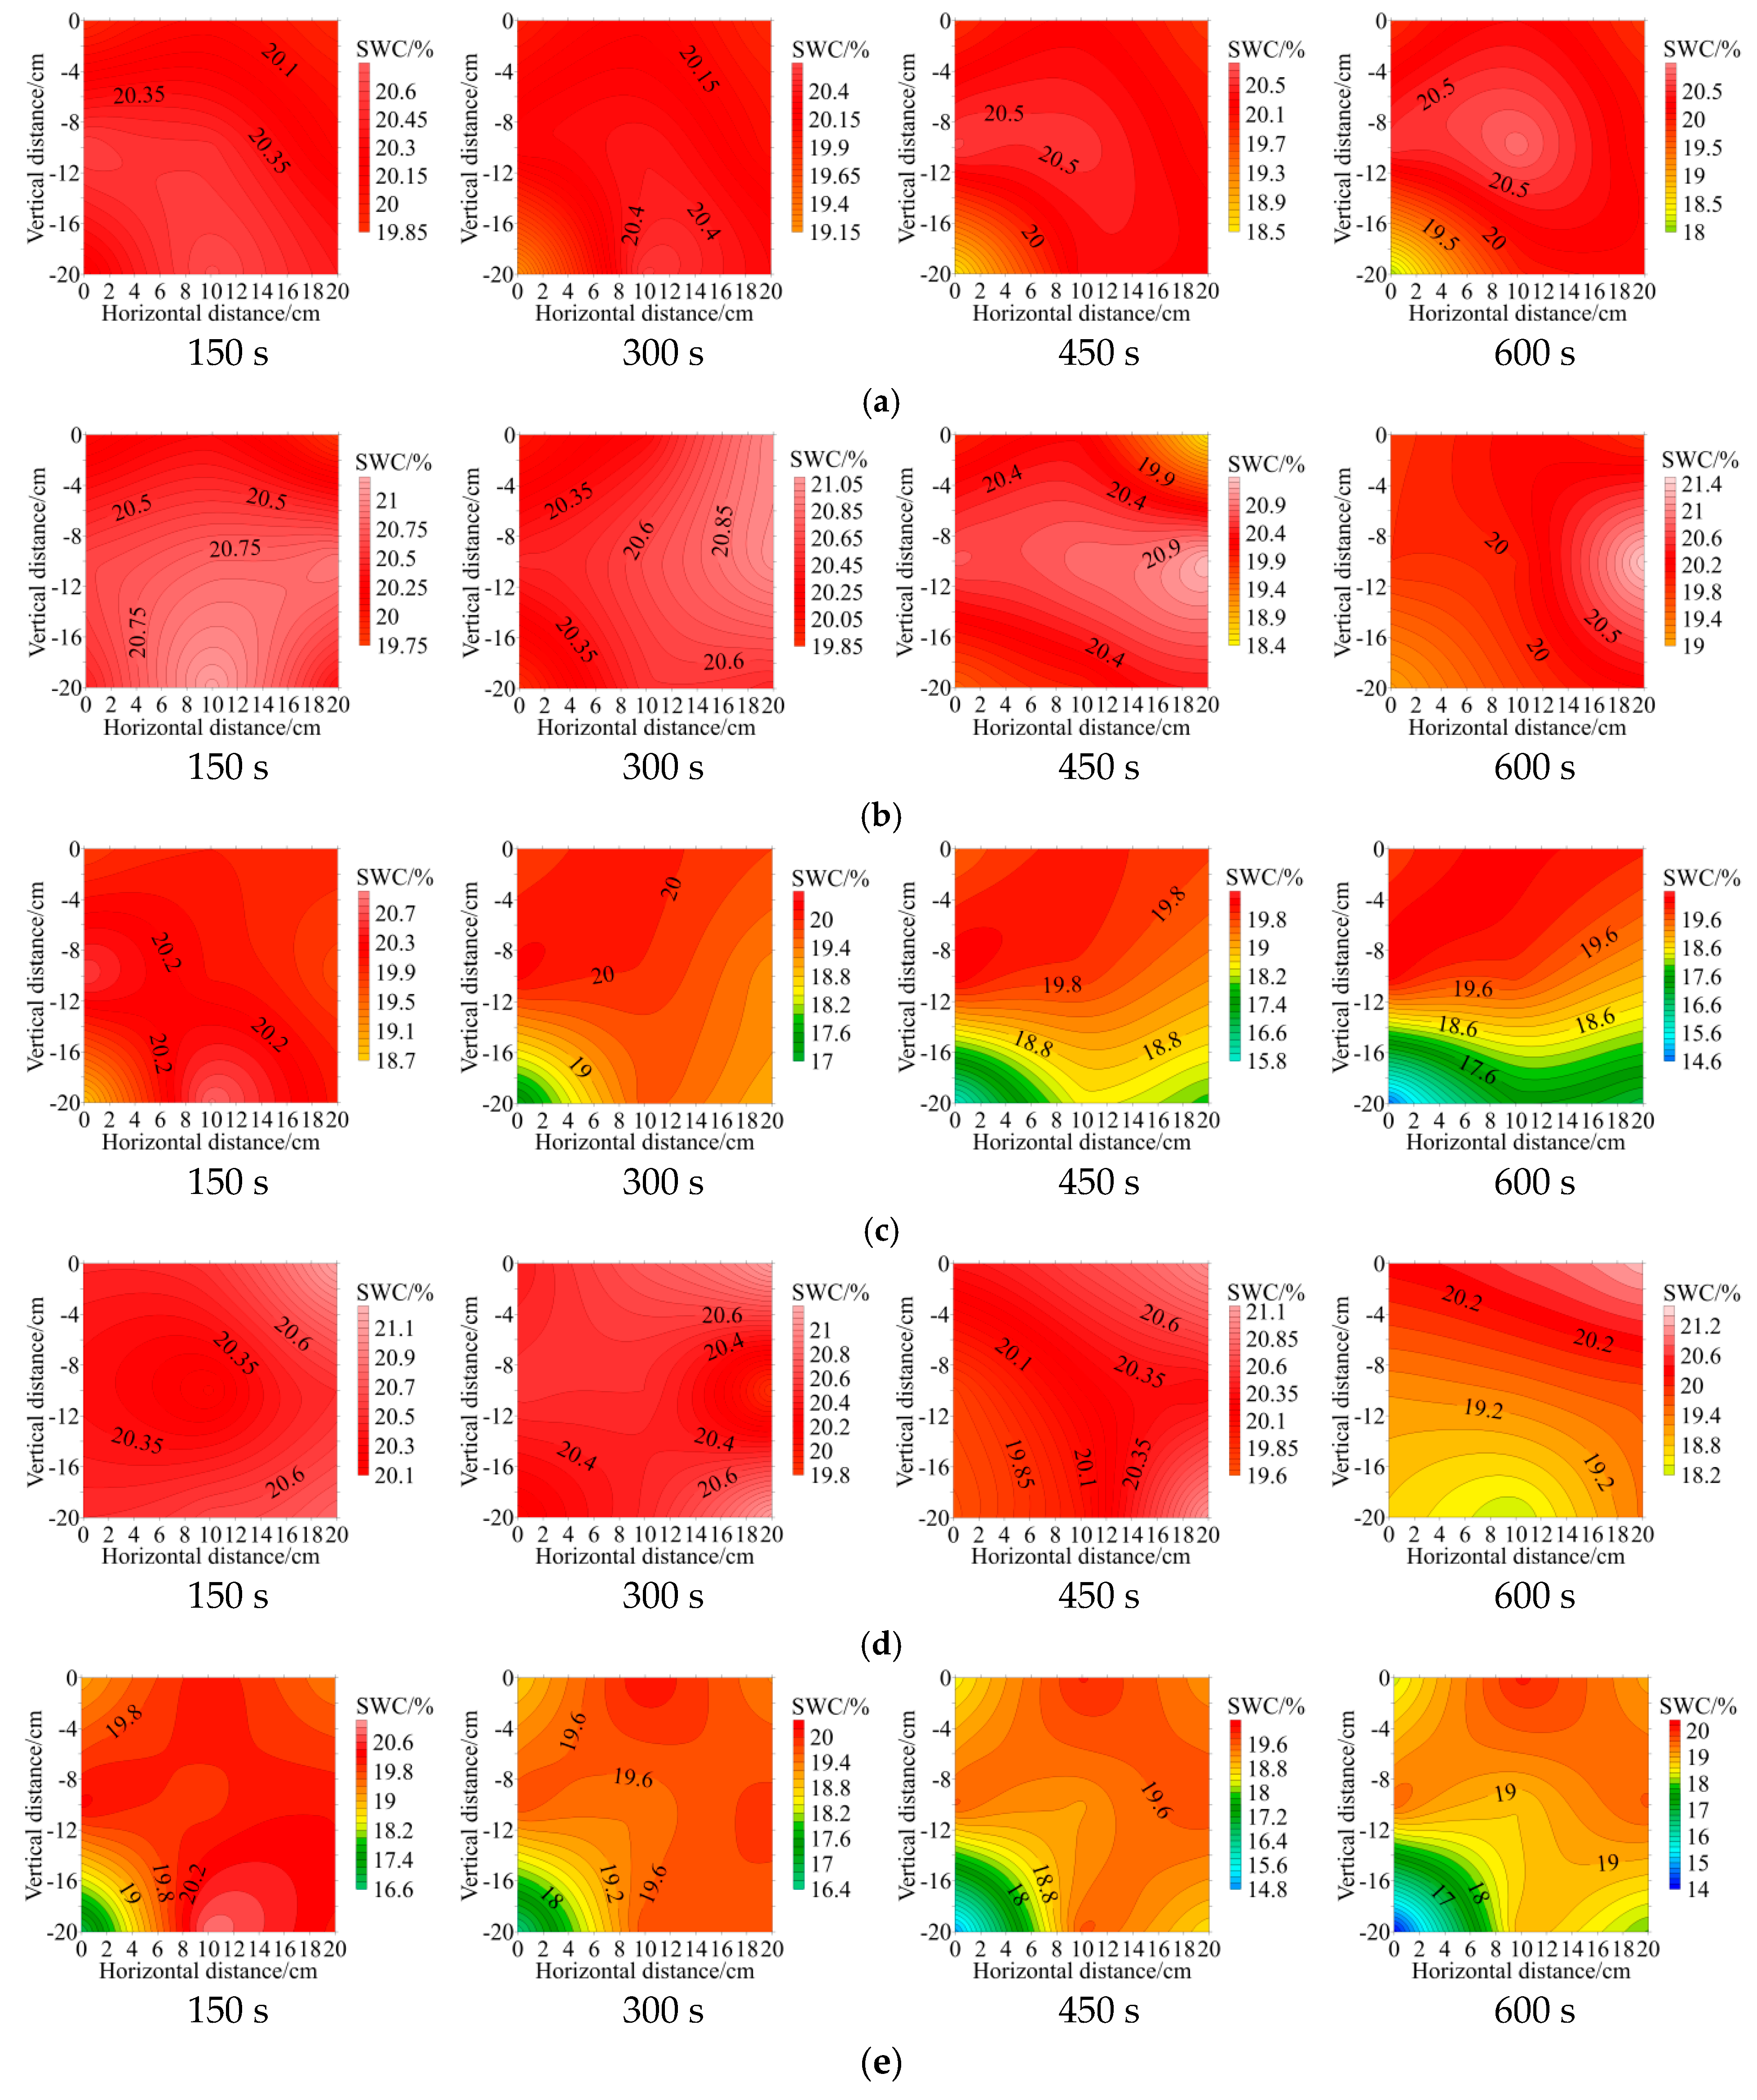
3.2.3. Analysis of Soil Water Content

From Figure 11, as the ventilation time increases, the deep soil water content slowly decreases. Within 600 s of ventilation, the water content of the deep soil varies between 14 and 21%, while the water content of the surface soil does not change much. The rate of decrease of the deep soil water content is greater than that of the surface soil water content.
From Figure 11a,b, it can be observed that at the end of 600 s, the deep water content of soil (A1, C1, and E1) of the <2 mm and 2–4 mm treatment groups gradually decreased, with A1 having the fastest rate of decrease in water content. From Figure 11a,b, except for the soil water content of the deep layer, the soil water content of the middle layer and surface layer will increase, such as is the case with the water content at the C3 layer of the soil treated with <2 mm gradually increasing from 20.4% to 20.9%. The water content at layer E3 in the 2–4 mm-treated soil gradually increased from 20.4% to 21.4%. This may be because after the hot air heats the deep soil water into water vapor, the water vapor condenses again above the middle layer of the soil and forms water droplets, causing the soil water content to rise slightly.
From Figure 11c,d, it could be observed that the deep water content of soil (A1, C1, and E1) of the 4–6 mm and 6–8 mm treatment groups decreased faster than that of the <2 mm and 2–4 mm treatment groups. For example, the deep soil water content (A1) of the 4–6 mm treatment group decreased from 20.8% to 14.6% (a decrease of 6.2%), while the deep soil water content of the <2 mm and 2–4 mm treatment groups decreased only by 3%. As this was analyzed using temperature field analysis, this observation is mainly because the 4–6 mm and 6–8 mm treatment groups have more large pores, which are prone to the formation of a large pore hot air flow and helps improve the heating rate of hot air and the ability to remove water. However, the <2 mm and 2–4 mm treatment groups are made up of small pores with relatively dense pores, forming a small pore hot air flow. The pore resistance affects the heating rate and diffusion range of the thermal current and excess water vapor cannot be dissipated. Although the 4–6 mm and 6–8 mm treatment groups have many large pores, there is still some water vapor that cannot be dissipated in a timely manner, leading to an increase in some water content test points, such as C5 and E5 in the 4–6 mm treatment group, as well as A5, C5, and E5 in the 6–8 mm treatment group.
Further analysis of Figure 11c,d, and e showed that the water content at A1 of the >8 mm treatment group decreases rapidly, while the water content at other locations does not decrease significantly. This is because the number of large pores in the soil in the >8 mm treatment group is the largest and the hot air flow is easier to diffuse. However, because the pores of the soil are too large, the hot air fails to heat the soil to remove excess water and the hot air is lost to the air, resulting in a less significant reduction in soil water content.
From the water content distribution Figure 12a,b, during the ventilation time, the water content of the <2 mm and 2–4 mm treatment groups changed slightly, only a small portion of the deep soil water content decreased and the effect of hot air heating was not significant, which is consistent with the temperature field analysis. From Figure 12c–e, compared with the <2 mm and 2–4 mm treatment groups, the water content in the deep and middle layers of the 4–6 mm to >8 mm treatment groups decreased significantly. The hot air heating with the 4–6 mm treatment group has the best dehumidification effect in the deep and middle layers; 6–8 mm and >8 mm processing followed by <2 mm and 2–4 mm hot air heating has the worst dehumidification effect, which is consistent with the temperature field analysis. From Figure 12, the soil water content significantly decreased after 300 s of ventilation, which is consistent with the significant changes in the temperature field.

4. Discussion

Steam will produce condensation when it cools, which will plug the soil pores and reduce the disinfection efficiency in the process of steam disinfection of Yunnan red loam [12]. In this study, the pore structure of red soil aggregates of different sizes was studied first. The results showed that the number of macropores increased gradually with the increase in the particle size of soil aggregates, which was consistent with previous studies. Then, the method of hot air drying [10,11] was used to blow hot air into the wet soil to solve the problem of excessive moisture in the soil pores. The study found that hot air would produce different forms of heat flow under different sized pore structures, thus producing different heat and mass transfer rules. Specifically, with the increase in soil particle size, the soil pores will be larger and more easily form a large pore heat flow. The efficiency of hot air heating and water removal first increases and then decreases. The main soil type studied in this paper is Yunnan red loam that has a high content of clay and silt particles. This can be used as a reference for similar types of soils around the world, such as clay or loam [17], in the study of steam disinfection hot air dehumidification.
The hot air dehumidification of porous media mainly uses hot air as the drying medium and uses high temperature hot air to heat liquid water into steam to remove excess water in porous media [10,11]. Among them, the pore structure has a significant effect on the dehumidification effect of hot air. As in this study, the <2 mm and 2–4 mm treatment groups correspond to a large number of small pores and the diffusion of hot air in pores will be affected by a greater resistance during operation. This results in a slow soil temperature rise and an insignificant decrease in water content, resulting in a poor dehumidification effect of hot air heating. The 4–6 mm, 6–8 mm, and >8 mm treatment groups correspond to a large number of large pores and the hot air is easy to spread. The heating effect is obvious and the soil temperature and water content changes are significant, among which, the hot air treated with 4–6 mm has a good effect of heating and dehumidifying, followed by the 6–8 mm and >8 mm treatment groups. This is because the soil pores corresponding to the 6–8 mm and >8 mm treatment groups are too large and the hot air will spread more easily, but it will also appear that the hot air does not have enough time to heat the excess water in the soil and remove it and the hot air heat will be lost. Through the above analysis and discussion, too large or too small soil pores will lead to a decrease in hot air dehumidification efficiency [18]. Therefore, how to construct suitable soil pores and improve the water removal rate needs to be further studied, especially in conjunction with steam disinfection.
The test results also found that with the change of ventilation time, the soil water content in different layers also changed differently. After the soil in the deep layer was dehumidified, the water content of the soil in the deep layer decreased significantly, but the water content of the surface soil only increased slightly. This may be because the steam in the deep soil could not be discharged quickly, resulting in the liquid water formed by steam condensation re-humidifying the surface soil [9], especially in soil with more small pores. In addition, the high temperature and water content reduction area of the 4–6 mm treatment is mainly concentrated at the depth of 15–20 cm in the soil temperature and water content distribution figures, which indicates that the distance of the drying range of hot air heating is about 5 cm in the vertical direction. Therefore, it is necessary to further study the effect of a multi-layer hot air pipe in the vertical direction on the heating and dehumidification of wet soil and determine the best layout plan of the hot air pipe in the vertical direction, which can provide a theoretical basis for the reasonable layout of the hot air pipe [9].

5. Conclusions

In the process of steam disinfection, a large amount of liquid water will be formed by steam condensation, which will block up soil pores and seriously affect the steam heating efficiency. Therefore, the change of soil pore structure under the condition of different sized red loam aggregates were studied first, and then the effect of soil pore structure on steam heating efficiency was investigated. Finally, the coupling mechanism between soil pore condition and steam heating efficiency was studied to remove excess water and dredge soil pores.
As the particle size of soil aggregates increases, the soil pores also become larger, forming a large pore thermal current. The dehumidification efficiency of hot air heating first increases and then decreases. Among them, the hot air heating of the 4–6 mm treatment group has the best dehumidification effect, whereby the deep soil temperature can reach 90 °C and the water content can be reduced by 6%. The high-temperature heating and dehumidification area of the 4–6 mm treatment group after ventilation is 15–20 cm deep.
This paper lays the theoretical foundations for the working parameters of hot air heating and dehumidification and the position arrangement of hot air pipes. Furthermore, considering that the pore structure has been found to be related to the removal of moisture by hot air, we will continue to study and regulate soil pore structure from the perspective of changing suitable soil pores. Furthermore, we will also study the hot air flow velocity and temperature, as well as the hot air pipe structure parameters based on the above findings.

Author Contributions

Conceptualization, Z.Y. and M.A.; methodology, Z.Y. and M.A.; software, Z.Y.; validation, Z.Y., M.A., Y.Y., A.X., J.C., J.Y. and P.F.; formal analysis, Z.Y. and M.A.; data curation, Z.Y. and M.A.; writing—original draft preparation, Z.Y. and M.A.; writing—review and editing, Z.Y. and M.A.; visualization, Z.Y. and M.A.; supervision, Y.Y., Y.L., J.L., Y.W. and Y.Z.; project administration, Z.Y. and Y.Z.; funding acquisition, Z.Y., Y.Y. and Y.Z. All authors have read and agreed to the published version of the manuscript.

Funding

This research was funded/supported by the National Natural Science Foundation (32201689); the Youth Project of the Natural science foundation of Yunnan province (202201AU070190); the Key Laboratory for crop production and smart agriculture project of Yunnan province (2022ZHNY08); the Project of the Department of Education of Yunnan Province (2023J1709); the Research start-up Fund Project of YNAU (KY2022–12); the Project fund of the Key science and Technology of Yunnan Province (202102AE090042–06-04); and the 2023 College Student Innovation and Entrepreneurship Project (S202310676027).

Institutional Review Board Statement

Not applicable.

Data Availability Statement

All the data has been presented in this paper.

Acknowledgments

We thank Jin Chen, Zaiwang Sun, Zixing Zeng, and Zhengguang Li for helping with the work.

Conflicts of Interest

The authors declare no conflicts of interest.

References

  1. Zhang, J.L. Research progress on root rot of Panax notoginseng and its biological control. Rural Econ. Sci.-Technol. 2022, 33, 50–52. (in Chinese). [Google Scholar]
  2. Song, Y.; Wang, S.B.; Zhang, Y.J.; Li, L.; Zhang, Y.Q.; Yang, Z.J. Progress in research and application of soil steam disinfection technology. J. Chin. Agric. Mech. 2022, 43, 199–206. (in Chinese). [Google Scholar]
  3. Nishimura, A.; Asai, M.; Shibuya, T.; Kurokawa, S.; Nakamura, H. A steaming method for killing weed seeds produced in the current year under untilled conditions. Crop Prot. 2015, 71, 125–131. [Google Scholar] [CrossRef]
  4. Van Loenen, M.C.A.; Turbett, Y.; Mullins, C.E.; Feilden, N.E.H.; Wilson, M.J.; Leifert, C.; Seel, W.E. Low temperature-short duration steaming of soil kills soil-borne pathogens, nematode pests and weed seeds. Eur. J. Plant Pathol. 2003, 109, 993–1002. [Google Scholar] [CrossRef]
  5. Gay, P.; Piccarolo, P.; Aimonino, D.R.; Tortia, C. A high efficiency steam soil disinfestation system, part I: Physical background and steam supply optimisation. Biosyst. Eng. 2010, 107, 74–85. [Google Scholar] [CrossRef]
  6. Gay, P.; Piccarolo, P.; Aimonino, D.R.; Tortia, C. A high efficiency steam soil disinfestation system, part II: Design and testing. Biosyst. Eng. 2010, 107, 194–201. [Google Scholar] [CrossRef]
  7. Peruzzi, A.; Raffaelli, M.; Ginanni, M.; Fontanelli, M.; Frasconi, C. An innovative self-propelled machine for soil disinfection using steam and chemicals in an exothermic reaction. Biosyst. Eng. 2011, 110, 434–442. [Google Scholar] [CrossRef]
  8. Wang, X.G. Research progress on continuous cropping obstacle of rhizome medicinal plants. Heilongjiang Agric. Sci. 2024, 3, 110–115. (in Chinese). [Google Scholar]
  9. Zhang, Y.J.; Song, Y.; Yang, Z.J.; Yang, W.C.; Ameen, M.; Chen, J.; Wang, D.; Huang, G.L. Effects of steam disinfection pipe structure parameters on the heating efficiency of red loam steam disinfection. Trans. CSAE 2023, 39, 112–121. (in Chinese). [Google Scholar]
  10. Zheng, Q.S.; Hu, Z.Y.; Li, P.G.; Ni, L.; Huang, G.Y.; Yao, Y.; Zhou, L.Y. Effects of air parameters on sewage sludge drying characteristics and regression analyses of drying model coefficients. Appl. Therm. Eng. 2021, 198, 117501. [Google Scholar] [CrossRef]
  11. Wulyapash, W.; Phongphiphat, A.; Towprayoon, S. Comparative study of hot air drying and microwave drying for dewatered sludge. Clean Technol. Environ. Policy 2022, 24, 423–436. [Google Scholar] [CrossRef]
  12. Yang, Z.J.; Wang, X.C.; Ameen, M. Influence of soil particle size on the temperature field and energy consumption of injected steam soil disinfection. Processes 2020, 8, 241. [Google Scholar] [CrossRef]
  13. Zhang, Z.B.; Zhou, H.; Zhao, Q.G.; Lin, H.; Peng, X. Characteristics of cracks in two paddy soils and their impacts on preferential flow. Geoderma 2014, 228–229, 114–121. [Google Scholar] [CrossRef]
  14. Philip, J.R.; De Vries, D.A. Moisture movement in porous materials under temperature gradients. Eos Trans. Am. Geophys. Union 1957, 38, 222–232. [Google Scholar]
  15. Yang, Z.J.; Wang, X.C.; Ameen, M. Influence of the spacing of steam-injecting pipes on the energy consumption and soil temperature field for clay-Loam disinfection. Energies 2019, 12, 3209. [Google Scholar] [CrossRef]
  16. Yang, S.M.; Tao, W.S. Heat Transfer; Higher Education Press: Beijing, China, 2006; p. 559. [Google Scholar]
  17. Lin, D.Y. Soil Science; China Forestry Press: Beijing, China, 2002; pp. 61–66. [Google Scholar]
  18. Yang, Z.J.; Wang, D.; Ameen, M.; Chen, J.; Zeng, Z.X.; Sun, Z.W.; Wang, D.B.; Qian, Z.Y.; Zhang, Y.J. Influence of pore structure on steam disinfection heat and mass transfer in Yunnan red loam. Therm. Sci. Eng. Prog. 2024, 47, 102312. [Google Scholar]
Figure 1. Hot air test bench. 1—Temperature and water content of data acquisition system. 2—Soil tank. 3—Hot air pipe. 4—Hot air fan.
Agriculture 14 00588 g001
Figure 2. Sensor distribution diagram. The dots represent the temperature sensors and the circles represent the water content sensor.
Agriculture 14 00588 g002
Figure 3. Soil model. (a) <2 mm; (b) 2–4 mm; (c) 4–6 mm; (d) 6–8 mm; and (e) >8 mm.
Agriculture 14 00588 g003
Figure 4. Meshing. (a) <2 mm; (b) 2–4 mm; (c) 4–6 mm; (d) 6–8 mm; and (e) >8 mm. Note: the meshing is in the red box of the soil model (Figure 3).
Agriculture 14 00588 g004
Figure 5. Hot air velocity simulation cloud with different pore structures. (a) <2 mm; (b) 2–4 mm; (c) 4–6 mm; (d) 6–8 mm; and (e) >8 mm.
Agriculture 14 00588 g005
Figure 6. Simulation of hot air temperature field in different pore structures. (a) <2 mm; (b) 2–4 mm; (c) 4–6 mm; (d) 6–8 mm; and (e) >8 mm.
Agriculture 14 00588 g006
Figure 7. Yunnan red loam sample. (a) <2 mm; (b) 2–4 mm; (c) 4–6 mm; (d) 6–8 mm; and (e) >8 mm.
Agriculture 14 00588 g007
Figure 8. Image processing. (a) <2 mm; (b) 2–4 mm; (c) 4–6 mm; (d) 6–8 mm; and (e) >8 mm. Note: the black space in the figure represents soil particles, while the white space represents pores.
Agriculture 14 00588 g008
Figure 9. Soil temperature varies with time. (a) <2 mm; (b) 2–4 mm; (c) 4–6 mm; (d) 6–8 mm; and (e) >8 mm. Note: A1-E5 refers to Figure 2.
Agriculture 14 00588 g009aAgriculture 14 00588 g009b
Figure 10. Soil temperature (ST) distribution. (a) <2 mm; (b) 2–4 mm; (c) 4–6 mm; (d) 6–8 mm; and (e) >8 mm. Note: 150 s, 300 s, 450 s, and 600 s indicate the time. The same applies below.
Agriculture 14 00588 g010
Figure 11. Soil water content varies with time. (a) <2 mm; (b) 2–4 mm; (c) 4–6 mm; (d) 6–8 mm; and (e) >8 mm.
Agriculture 14 00588 g011aAgriculture 14 00588 g011b
Figure 12. Soil water content (SWC) distribution. (a) <2 mm; (b) 2–4 mm; (c) 4–6 mm; (d) 6–8 mm; and (e) >8 mm.
Agriculture 14 00588 g012
Table 1. Soil physical parameters.
Soil Temperature °CSoil Water Content %Soil Particle Density (kg/m3)Soil Specific Heat (J/(kg·K))Soil Thermal Conductivity (W/(m·K))
25 ± 2.520 ± 1.5176017530.484
Table 2. Fluid parameters.
Ambient Temperature °CHot Air Velocity (m/s)Hot Air Fan Temperature °CHot Air Density (J/(kg·K))Hot Air Thermal Conductivity (W/(m·K))Hot Air Specific Heat (kJ/(kg·K))
25 ± 2.52.6520017533.93 × 1021.026
Disclaimer/Publisher’s Note: The statements, opinions and data contained in all publications are solely those of the individual author(s) and contributor(s) and not of MDPI and/or the editor(s). MDPI and/or the editor(s) disclaim responsibility for any injury to people or property resulting from any ideas, methods, instructions or products referred to in the content.

