Article

A Lightweight Deep Learning Semantic Segmentation Model for Optical-Image-Based Post-Harvest Fruit Ripeness Analysis of Sugar Apples (Annona squamosa)

1
School of Physics and Materials Science, Guangzhou University, Guangzhou 510006, China
2
School of Mechanical and Electrical Engineering, Guangzhou University, Guangzhou 510006, China
3
School of Life Sciences, Guangzhou University, Guangzhou 510006, China
4
School of Biomedical and Pharmaceutical Sciences, Guangdong University of Technology, Guangzhou 510006, China
*
Author to whom correspondence should be addressed.
Agriculture 2024, 14(4), 591; https://doi.org/10.3390/agriculture14040591
Submission received: 1 February 2024 / Revised: 23 March 2024 / Accepted: 24 March 2024 / Published: 8 April 2024
(This article belongs to the Special Issue Computer Vision and Artificial Intelligence in Agriculture)

Abstract

:
The sugar apple (Annona squamosa) is valued for its taste, nutritional richness, and versatility, making it suitable for fresh consumption and medicinal use with significant commercial potential. Widely found in the tropical Americas and Asia’s tropical or subtropical regions, it faces challenges in post-harvest ripeness assessment, predominantly reliant on manual inspection, leading to inefficiency and high labor costs. This paper explores the application of computer vision techniques in detecting ripeness levels of harvested sugar apples and proposes an improved deep learning model (ECD-DeepLabv3+) specifically designed for ripeness detection tasks. Firstly, the proposed model adopts a lightweight backbone (MobileNetV2), reducing complexity while maintaining performance through MobileNetV2′s unique design. Secondly, it incorporates the efficient channel attention (ECA) module to enhance focus on the input image and capture crucial feature information. Additionally, a Dense ASPP module is introduced, which enhances the model’s perceptual ability and expands the receptive field by stacking feature maps processed with different dilation rates. Lastly, the proposed model emphasizes the spatial information of sugar apples at different ripeness levels by the coordinate attention (CA) module. Model performance is validated using a self-made dataset of harvested optical images categorized into three ripeness levels. The proposed model (ECD-DeepLabv3+) achieves values of 89.95% for MIoU, 94.58% for MPA, 96.60% for PA, and 94.61% for MF1, respectively. Compared to the original DeepLabv3+, it greatly reduces the number of model parameters (Params) and floating-point operations (Flops) by 89.20% and 69.09%, respectively. Moreover, the proposed method could be directly applied to optical images obtained from the surface of the sugar apple, which provides a potential solution for the detection of post-harvest fruit ripeness.

1. Introduction

Fruits are crucial for human health; multiple studies indicate that consuming fresh fruits can promote human physical well-being [1,2,3]. However, eating stale or spoiled fruits can trigger outbreaks of foodborne diseases, potentially leading to serious public health issues [4]. Among numerous fruits, the sugar apple (Annona squamosa) [5], which belongs to the genus Annona of the family Annonaceae, is often cultivated in tropical and subtropical regions and is also known as the custard apple and sweetsop. Due to its sweet and distinctive taste, it has gained favor among a vast number of consumers [6]. Furthermore, it can be also used for anti-cancer, anti-obesity, and lipid-lowering processes and as an insecticidal agent [7,8,9]. However, fruits like sugar apples are highly prone to decay, making them challenging to consume fresh and resulting in significant waste [6,10]. Therefore, the determination process of fruits is widely considered crucial for both producers and processors [11]. In modern agriculture, ensuring the quality of fruits is of paramount importance for enhancing the entire agricultural sector. However, previous studies indicate that determining the ripeness of fruits like watermelon solely based on surface characteristics, such as size or external color, through manual observation is quite challenging. Comprehensive considerations of various factors are necessary unless assisted by experienced individuals [12]. Therefore, proposing methods to detect the ripeness of easily perishable fruits (such as sugar apples) can reduce post-harvest losses and lower costs.
In recent decades, in order to reduce the cost of manual differentiation of post-harvest fruit ripeness, scientists have proposed a lot of methods for the detection of fruit ripeness. Elektrik [13] employed near-infrared spectroscopy to assess the ripeness of a watermelon by calculating the reflectance on the surface of the watermelon. The gathered data underwent statistical analysis for the purpose of grading and assessing the ripeness of watermelons. Hasanuddin et al. [14] designed a 0.5 μm thick zinc oxide sensitive layer on a LiNbO3 piezoelectric substrate specifically for sensing ethylene (C2H4) gas, aiming to discern the ripeness of fruits. ArrÁZola et al. [15] evaluated five maturity levels of Tainong papaya fruits through the examination of mechanical resistance and the application of finite element analysis (FEA); an in-depth analysis was conducted. Phoophuangpairoj [16] created an acoustic model of a knocking sound based on the Hidden Markov model of syllables and proposed a new approach for recognizing durian ripe and raw impact signals, with an average ripening recognition rate of more than 90.0%. González-Araiza et al. [17] designed a non-destructive device based on electrical bioimpedance measurements to obtain the impedance spectrum of the whole fruit and, thus, analyze the ripeness of strawberry fruits.
With the development of artificial intelligence, the deep learning approach has received a lot of attention from scientists in the fields of post-harvest fruit ripeness detection, quality inspection, cultivation, and production process [18,19,20,21]. Xiao et al. [22] employed a hybrid approach involving the Transformer model within the domain of natural language processing and the deep learning model to classify apples of different levels of ripeness, which makes it easier to combine multimodal data and provides greater flexibility in modeling. Appe et al. [23] enhanced the YOLOV5 by incorporating the Convolutional Block Attention module for the automatic classification of tomato multi-classes with an average accuracy of 88.1%. Kim et al. [24] proposed a dual-path model through semantic segmentation, which achieves 90.33% accuracy and 71.15% recognition of strawberry ripeness and fruit stalk coordinates regarding the task of strawberry ripeness and fruit stalk coordinate detection. Zhao et al. [25] proposed a new single-stage instance segmentation model. In total, 72.12% average precision (AP) was achieved on a home-made peach ripeness classification dataset. However, there is currently limited research on using computer vision techniques to detect post-harvest sugar apple ripeness and the performance is still to be further improved. Sanchez et al. [26] used the YOLO model to classify sugar apple ripeness and achieved 86.84% in terms of average accuracy performance. On the other hand, the object detection algorithm primarily identifies and locates objects using rectangular bounding boxes. When applied to fruit ripeness detection, simple bounding boxes face challenges in accuracy and detail due to complex color and texture variations [27]. Furthermore, object detection lacks detailed semantic information at the pixel level, which may make it challenging to accurately assess fruit ripeness. In addition, existing models often have large model parameters and floating-point operations, demanding high hardware requirements and lacking practicality on embedded devices.
Compared to object detection, semantic segmentation offers detailed pixel-level annotations and assigns semantic labels to each pixel in an image. This enables a more precise segmentation of sugar apples, providing accurate and comprehensive information for ripeness detection [27]. This advantage, especially in analyzing color and texture features, makes it a promising direction for advancing sugar apple ripeness detection. Therefore, this paper introduces an improved semantic segmentation method (ECD-DeepLabv3+) for post-harvest sugar apple ripeness segmentation. In order to enhance the model’s performance and streamline its complexity, we substituted the initial backbone network with MobileNetV2 in DeepLabv3+ and integrated the efficient channel attention (ECA) module to establish connectivity between the encoding and decoding regions. The ASPP module in DeepLabv3+ was replaced with a dense connection approach (Dense ASPP) to reduce the loss of the sugar apple’s image feature information. Finally, the Dense ASPP module incorporated a coordinate attention (CA) module to enhance the model’s understanding of the sugar apple’s coordinate information. To evaluate the performance of the ECD-DeepLabv3+ model, a self-made dataset was built up, which includes 1600 optical images focusing on the ripening of sugar apples after harvest. Experimental results show that the proposed model achieved better results in terms of MIoU, MPA, PA, MF1, Model Params, and Flops. Using the improved segmentation algorithm, we conducted ripeness detection on harvested sugar apples, aiming to provide a possible method for automatically screening the ripeness of sugar apples and other fruits. The primary contribution of this paper can be summarized as follows:
  • This paper explored, for the first time, the feasibility of applying semantic segmentation techniques to the detection of sugar apple (Annona squamosa) ripeness;
  • This paper proposed an improved semantic segmentation model (ECD-DeepLabv3+) which, while significantly reducing model complexity (Model Params and Flops), achieves enhancements in performance metrics, such as MIoU, MPA, MF1, and PA;
  • This paper created a semantic segmentation dataset for post-harvest sugar apple optical images to evaluate the performance of the ECD-DeepLabv3+.

2. Materials and Methods

2.1. Dataset

The aim of this paper is to explore the utilization of semantic segmentation techniques to detect ripeness in post-harvest sugar apples and to achieve automatic classification of sugar apples at different ripeness levels using artificial intelligence. However, to our knowledge, there is currently no publicly available semantic segmentation dataset specifically designed for assessing sugar apple ripeness. Therefore, in this paper, a self-made semantic segmentation dataset comprising 30 sugar apples, 4 kiwis, and 3 pineapples for sugar apple ripeness assessment has been created to validate the performance of the proposed model (all of these fruits are obtained from Guangzhou, China). A total of 1000 images were collected, each containing sugar apples at different levels of ripeness (unripe, ripe, and bad). To ensure the robustness of the model, among these 1000 images, there were 935 images, including kiwis and pineapples, with features similar to those of sugar apples (each image containing multiple categories, with kiwis and pineapples labeled as “other”). Additionally, background interference caused by the peeling of sugar apple skin during ripening or impact processes was introduced (the ‘background’ category is labeled in each image). We used Labelme for image annotation and, after careful inspection by the experienced biologists, the dataset was randomly and evenly divided into three groups in a ratio of 6:2:2, namely, the training set containing 600 images, the validation set containing 200 images, and the test set containing 200 images. The dataset was labeled into five categories: unripe, ripe, bad, other, and background. After the dataset division, this paper increased the number of optical images within the training set through horizontal flipping, vertical flipping, and random changes in brightness. The ultimate training set comprises 1200 images, supplemented by 200 images each for both the validation and test sets, culminating in a total dataset size of 1600 images. Compared to the scale of the semantic segmentation datasets used in references [28,29,30,31], our dataset, consisting of 1600 images, is reasonable and reliable.

2.2. Image Preprocessing

As these images were captured by different smartphones (iPhone 11, HUAWEI Mate20, and HUAWEI nova9), they had varying pixels (3024 × 3024, 2976 × 2976, and 3072 × 3072). It is worth mentioning that all the equipment used to collect the dataset was manufactured in China. To standardize the dataset, we used OpenCV (version 4.7.0) to resize them to a uniform resolution of 512 × 512 pixels. Some images from the self-made dataset are shown in Figure 1.

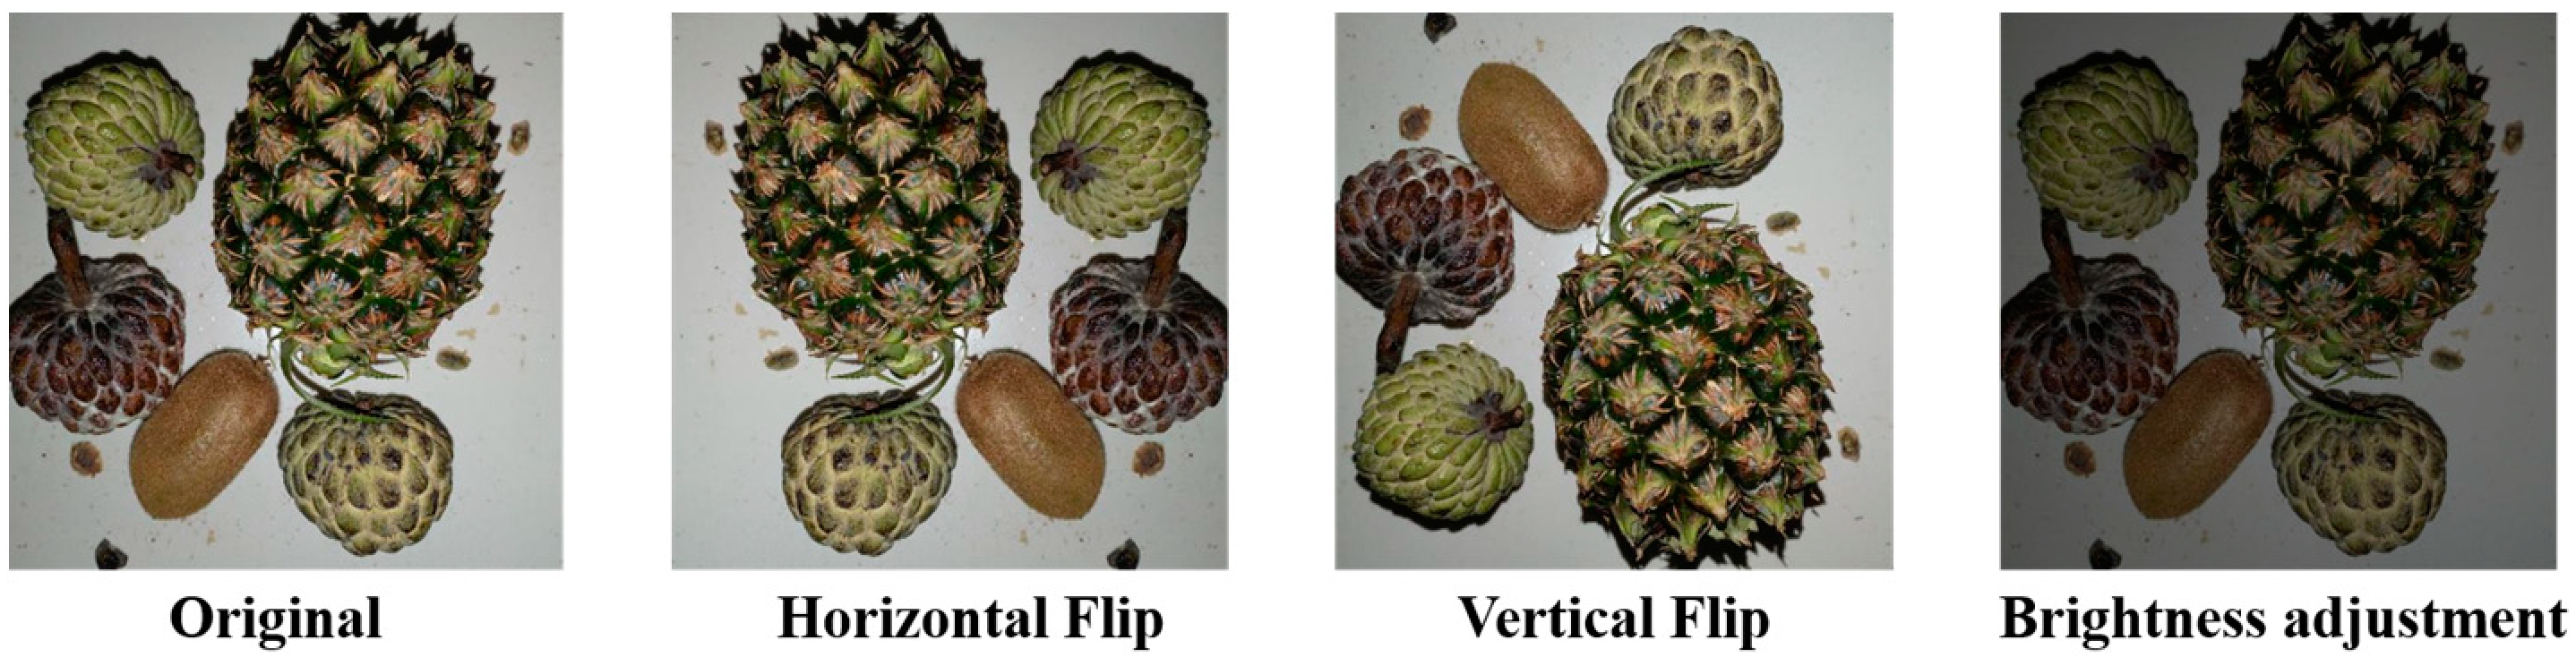
2.3. Data Augmentation

The technique of data augmentation [32] is a method that enhances the performance of deep learning models by introducing diversity through transformations and expansions on the original data. By incorporating various changes, such as rotation, flipping, and brightness adjustments, data augmentation creates a more diverse set of samples, expanding the training dataset and enabling the model to comprehensively learn features. The strength of this approach lies in its ability to improve the generalization of the proposed model, reduce the risk of overfitting, and provide solutions when faced with limited data or a lack of diversity. By simulating variations present in real-world scenarios, data augmentation helps the model adapt to different environments and conditions, thus improving its robustness. This paper primarily employs horizontal flipping and vertical flipping to enhance the recognition accuracy of flipped targets, as well as utilizing brightness adjustments to enhance the model’s robustness to different lighting environments. Specifically, after considering the trade-off between the training time cost and model performance, the training set (containing 600 images) in the original dataset is randomly augmented using the three forms of image enhancement mentioned above, expanding the training set to 1200 images. The images for each category in the dataset are detailed in Table 1, with multiple category annotations per image. Following the completion of data augmentation, the dataset comprises 1600 images, including 1217 images containing “Unripe” fruit, 1581 images containing “Ripe” fruit, 1372 images containing “Bad” fruit, and 1516 images containing “Other” fruit (among which 1297 contain kiwifruit, 627 contain pineapple, and 408 contain both kiwifruit and pineapple). Each image includes annotations for the background. Figure 2 illustrates the effects of horizontal flipping, vertical flipping, and brightness adjustments.

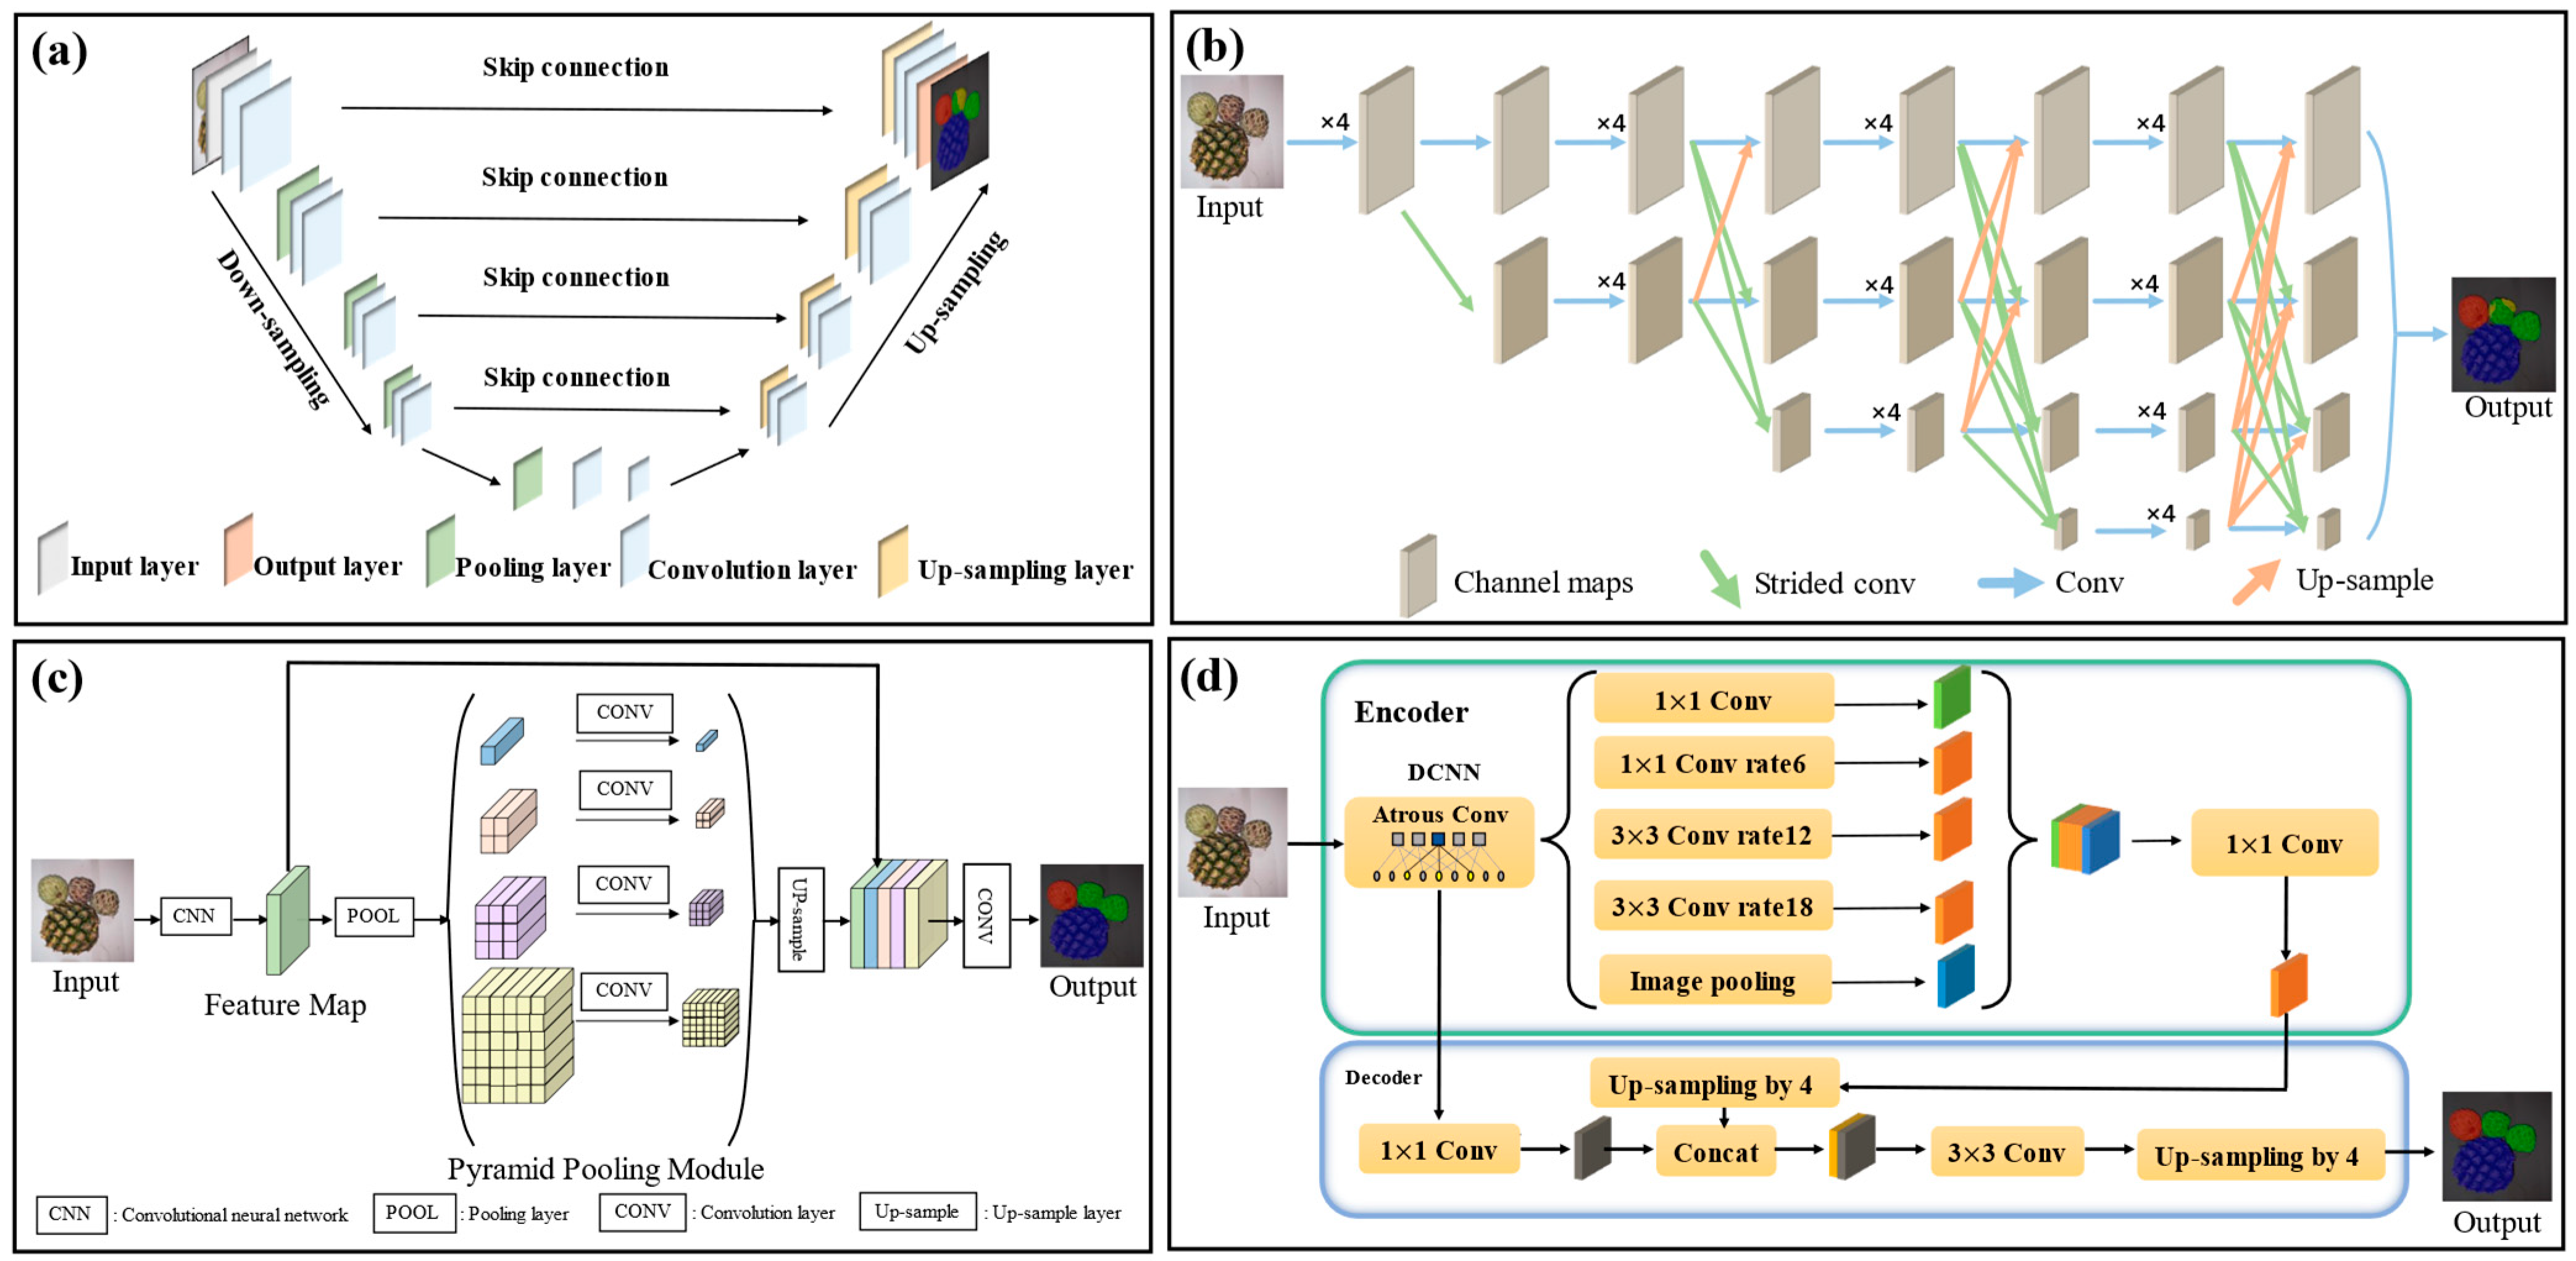
2.4. Four Well-Known Models Being Compared

As artificial intelligence (AI) advances, computer vision technology finds extensive applications in diverse fields, including agriculture, engineering, medicine, and beyond. Within the realm of computer vision, three main tasks prevail: object detection, image classification, and semantic segmentation. Compared to the former two tasks, semantic segmentation has attracted considerable attention from scholars due to its finer target localization, comprehensive understanding of global scenes, and advantages in handling multiple objects. Four well-known semantic segmentation models (HR-Net, U-Net, PSPNet, and DeepLabv3+) are illustrated in Figure 3.

2.4.1. U-Net

U-Net is a fully convolutional neural network proposed by Ronneberger et al. [33] distinguished by the integration of feature maps across the channel dimension at the same level between the encoder and decoder through skip connections (as shown in Figure 3a). This design facilitates the fusion of contextual information from deep network features with shallow network images, promoting multiscale feature integration and mitigating the loss of image information.

2.4.2. HRNet

HRNet, or High-Resolution Network, is a deep learning architecture proposed by Wang et al. [34]. This network places a significant emphasis on high-resolution images, utilizing a high-resolution feature pyramid network structure to effectively capture fine features in images (as shown in Figure 3b). HRNet achieves heightened sensitivity to details by preserving the flow of high-resolution information, avoiding resolution loss. Unlike traditional networks, HRNet is capable of simultaneously handling feature maps of different resolutions, enabling comprehensive feature learning while maintaining high resolution. This design has led to outstanding performances for HRNet in image processing tasks.

2.4.3. PSPNet

PSPNet, short for Pyramid Scene Parsing Network, is a deep learning network proposed by Zhao et al. [35]. This network adopts a structure known as pyramid spatial pooling, enhancing image segmentation by incorporating multiscale global information (as shown in Figure 3c). In PSPNet, different-sized pooling kernels are introduced to capture contextual information at various scales. This design contributes to an improved understanding of scenes, enabling the network to better adapt to objects and structures of varying scales. Ultimately, PSPNet achieves enhanced accuracy and effectiveness in image segmentation through the fusion of multiscale contextual information.

2.4.4. DeepLabv3+

DeepLabv3+ is proposed by Chen et al. [36]. The network adopts an encoder–decoder structure, utilizing Xception as the backbone (as shown in Figure 3d). The design includes an atrous spatial pyramid pooling (ASPP) module, where atrous convolutions with different atrous rates are employed to extract features at various resolutions, enhancing the richness of contextual information. After up-sampling the deep feature maps, they are fused once again with low-level layer features, resulting in higher segmentation accuracy.

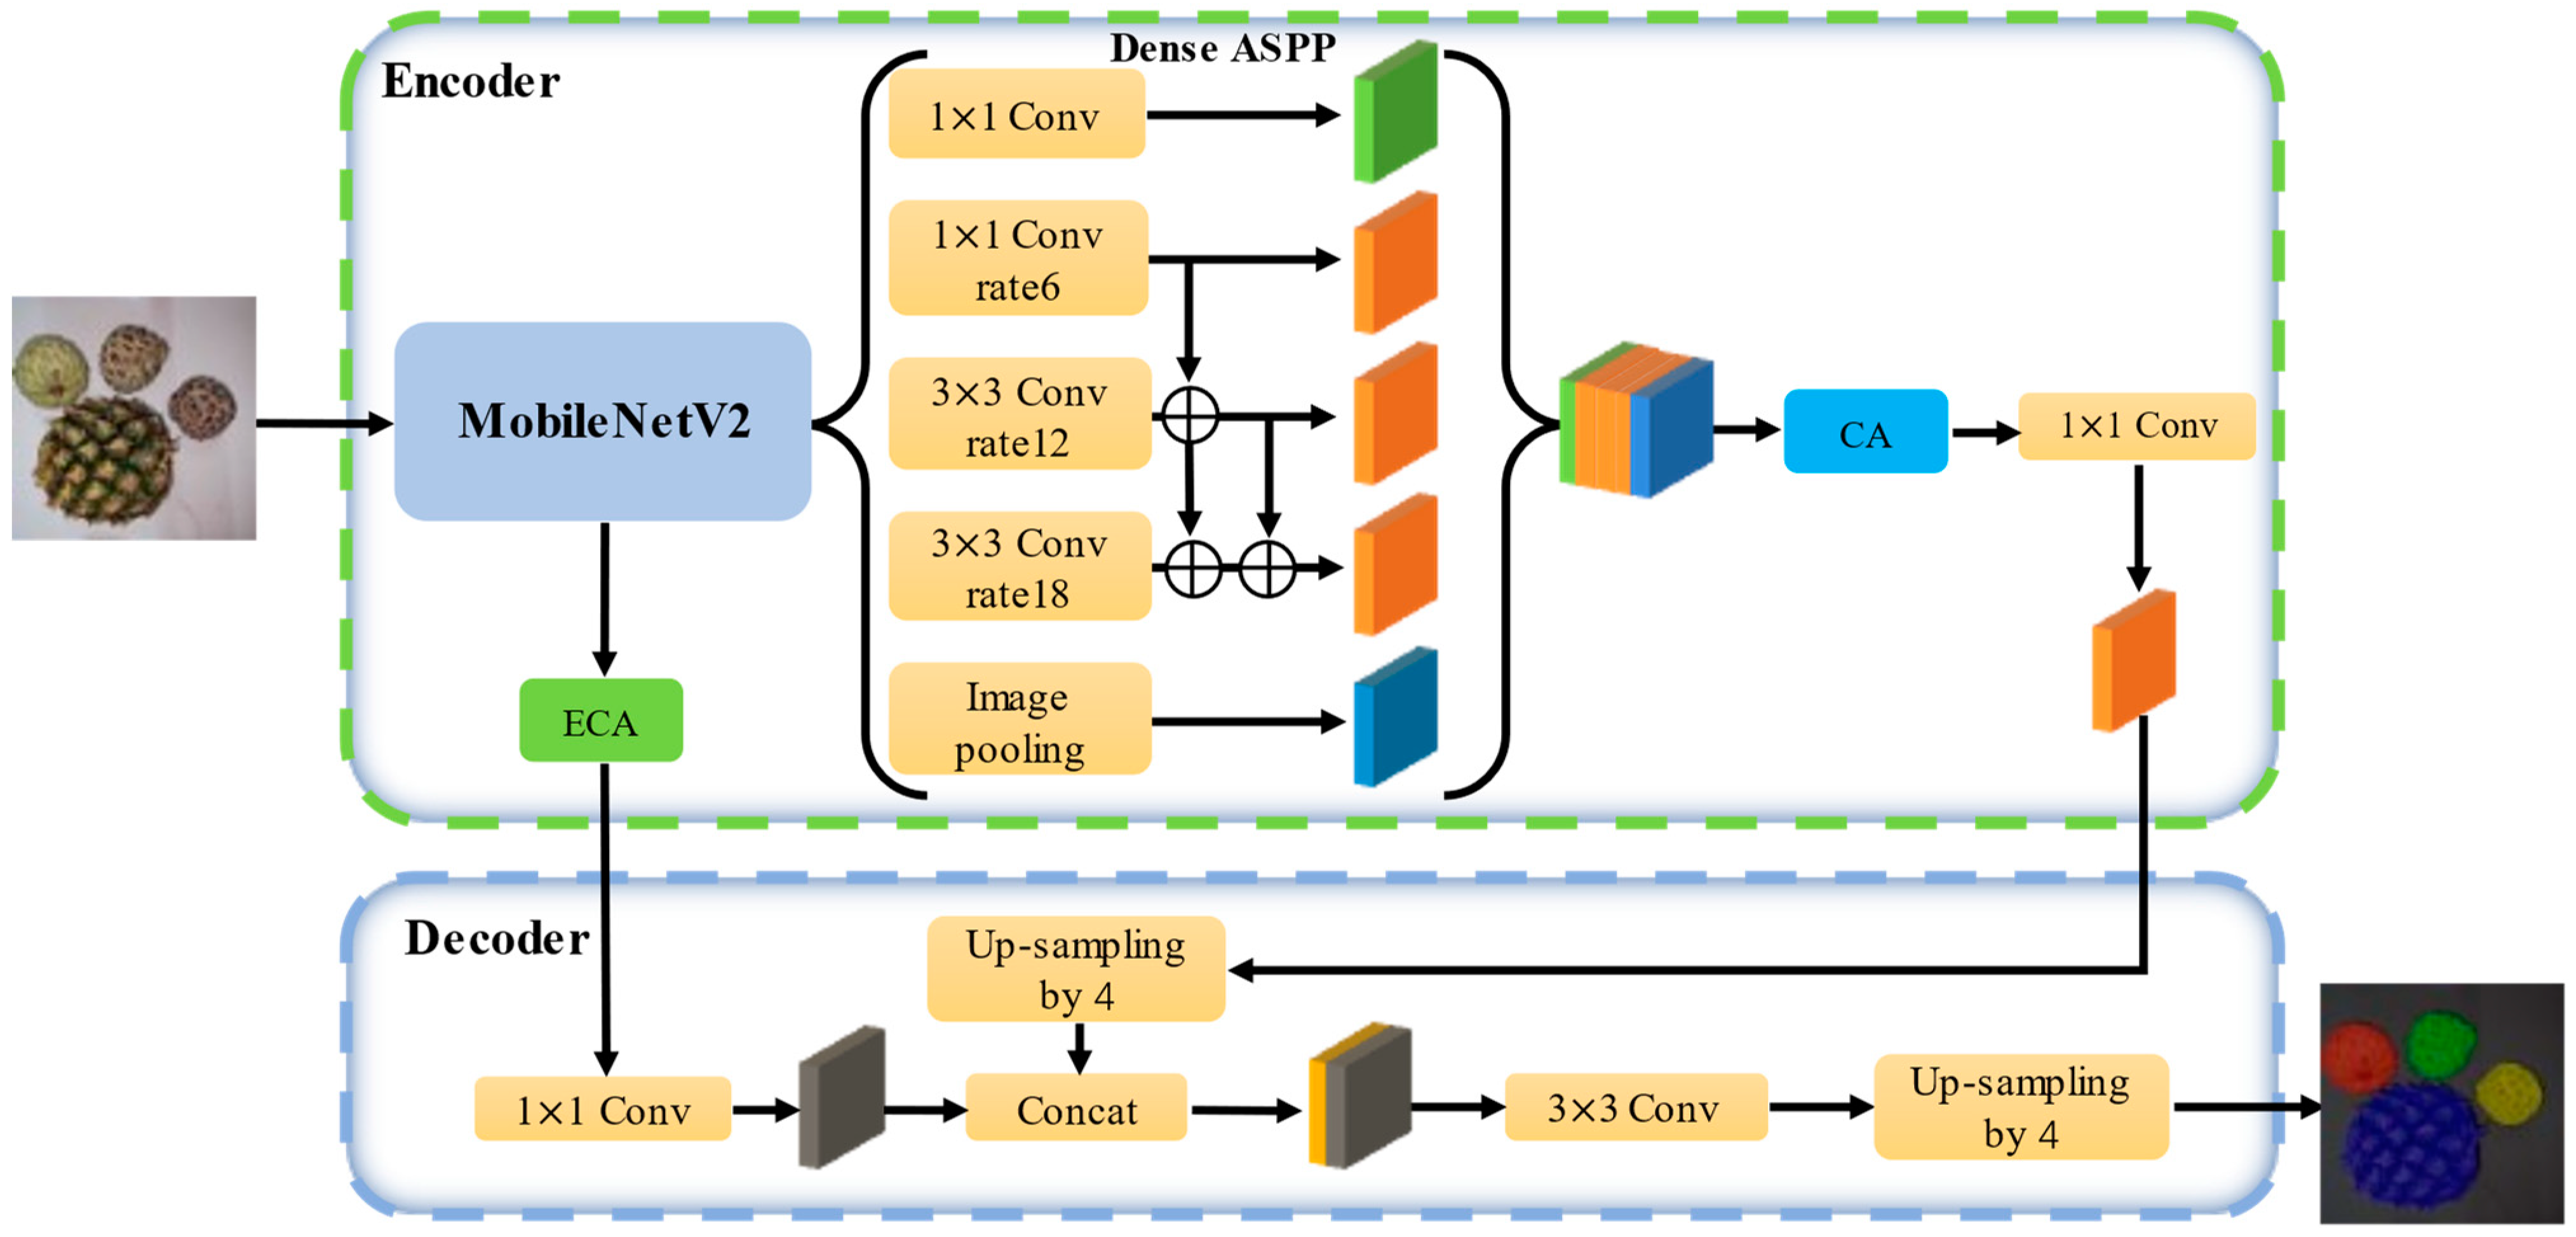
2.5. Architecture of the Proposed ECD-DeepLabv3+

This paper proposes an enhanced semantic segmentation model based on DeepLabv3+ (as shown in Figure 4), enhancing the detection performance of ripeness in post-harvest sugar apples while reducing the model’s complexity. The improvement made to the model architecture encompasses three key aspects:
i.
Replacing the backbone with MobileNetV2 and introducing an efficient channel attention (ECA) module in the junction between the encoding and decoding regions, which can substantially decrease the complexity of the model, including parameters (Params) and floating-point operations (Flops), while simultaneously boosting its capabilities;
ii.
Following the feature maps output by ASPP in DeepLabv3+, adding the coordinate attention (CA) module to improve attention towards the positional and long-range dependency information of post-harvest sugar apple images;
iii.
Merging the densely connected atrous spatial pyramid pooling (Dense ASPP), which can minimize overlooked pixel features, preserving the completeness of feature information and achieving an enlarged receptive field.
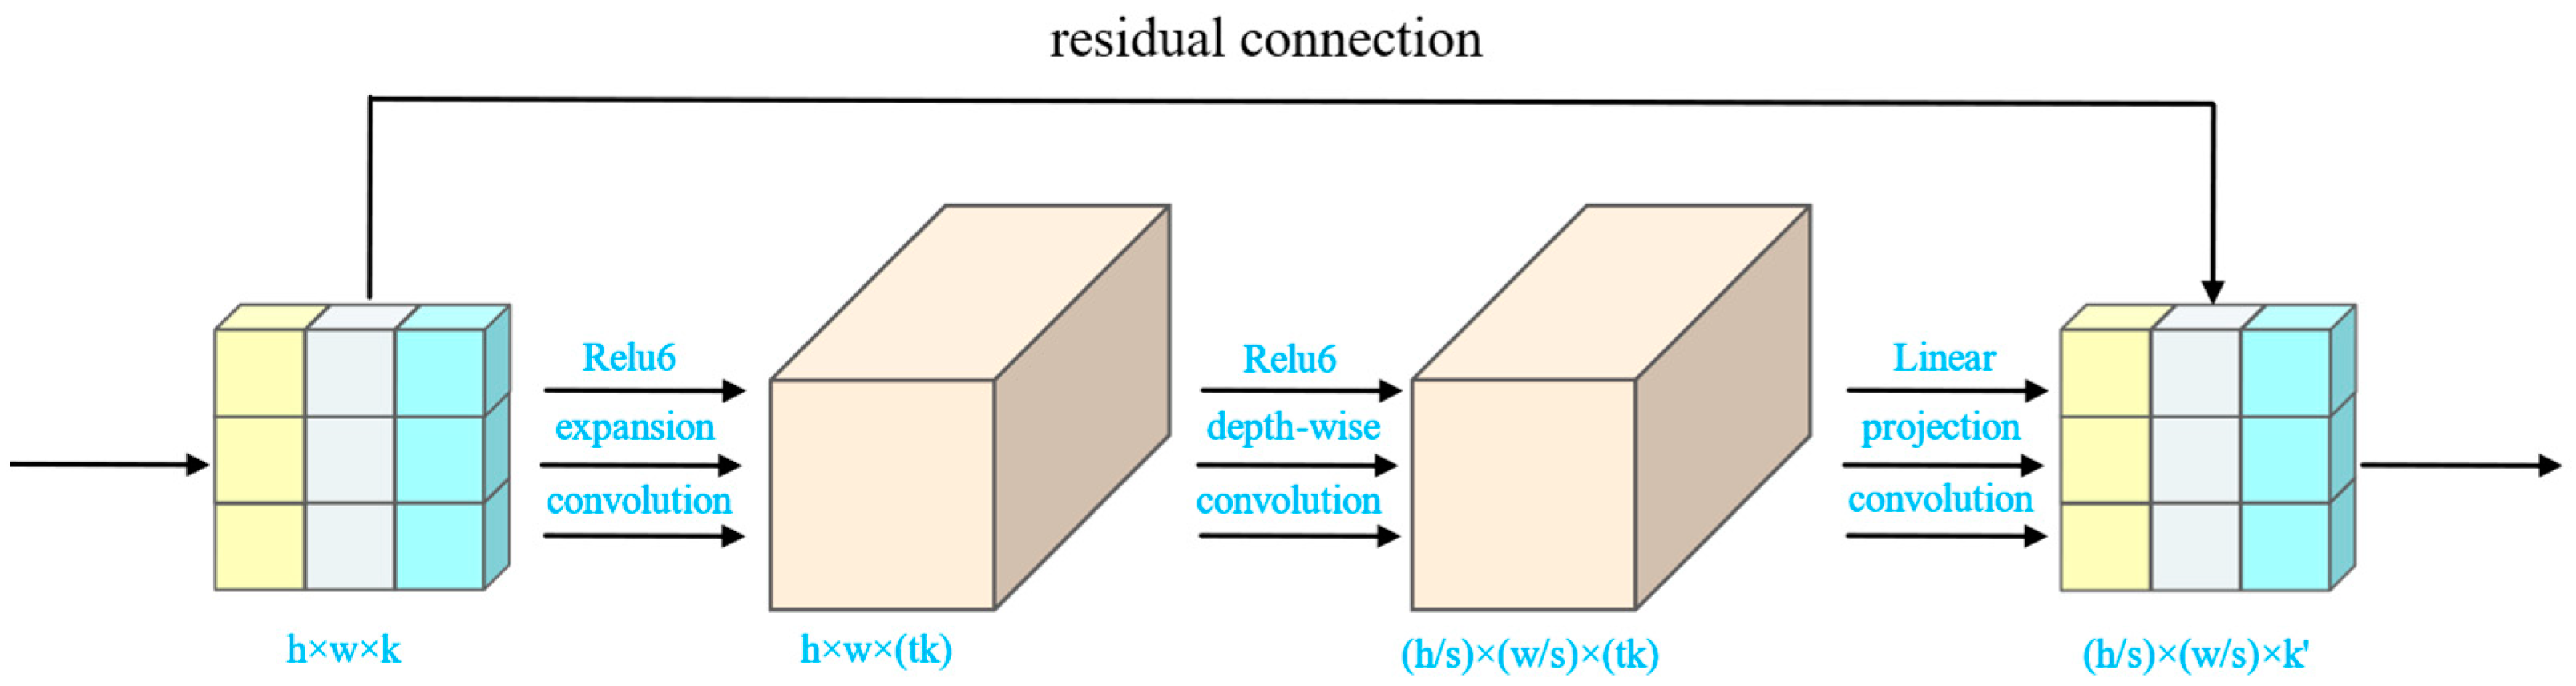
2.5.1. MobileNetv2

MobileNetV2, proposed by Sandler et al. [37], is a neural network known for its lightweight design, designed to address the demand for efficient image recognition in resource-constrained environments. Emphasizing lightweight feel and efficiency, the model incorporates innovative designs, such as depth-wise separable convolutions, residual connections, and inverted residual structures, to enable real-time image processing on small devices. Figure 5 illustrates the inverted residual block of MobileNetV2. Compared to Xception, MobileNetV2 focuses more on the model’s light weight and efficiency, achieving satisfactory performance with relatively small parameters and computational complexity. This makes MobileNetV2 an ideal choice for practical deployment in scenarios with limited resources, particularly on mobile devices.
The creators of MobileNetV2 took into consideration the practical application requirements, leading to widespread adoption in edge computing and mobile devices. In comparison to DeepLabv3+ with Xception as the backbone, DeepLabv3+ with MobileNetV2 as the backbone demonstrates better performance in the segmentation task of ripeness detection in post-harvest sugar apples. Moreover, it significantly reduces the number of parameters and floating-point operations. Hence, in this paper, we adopt MobileNetV2 as the backbone for our proposed model (ECD-DeepLabv3+).

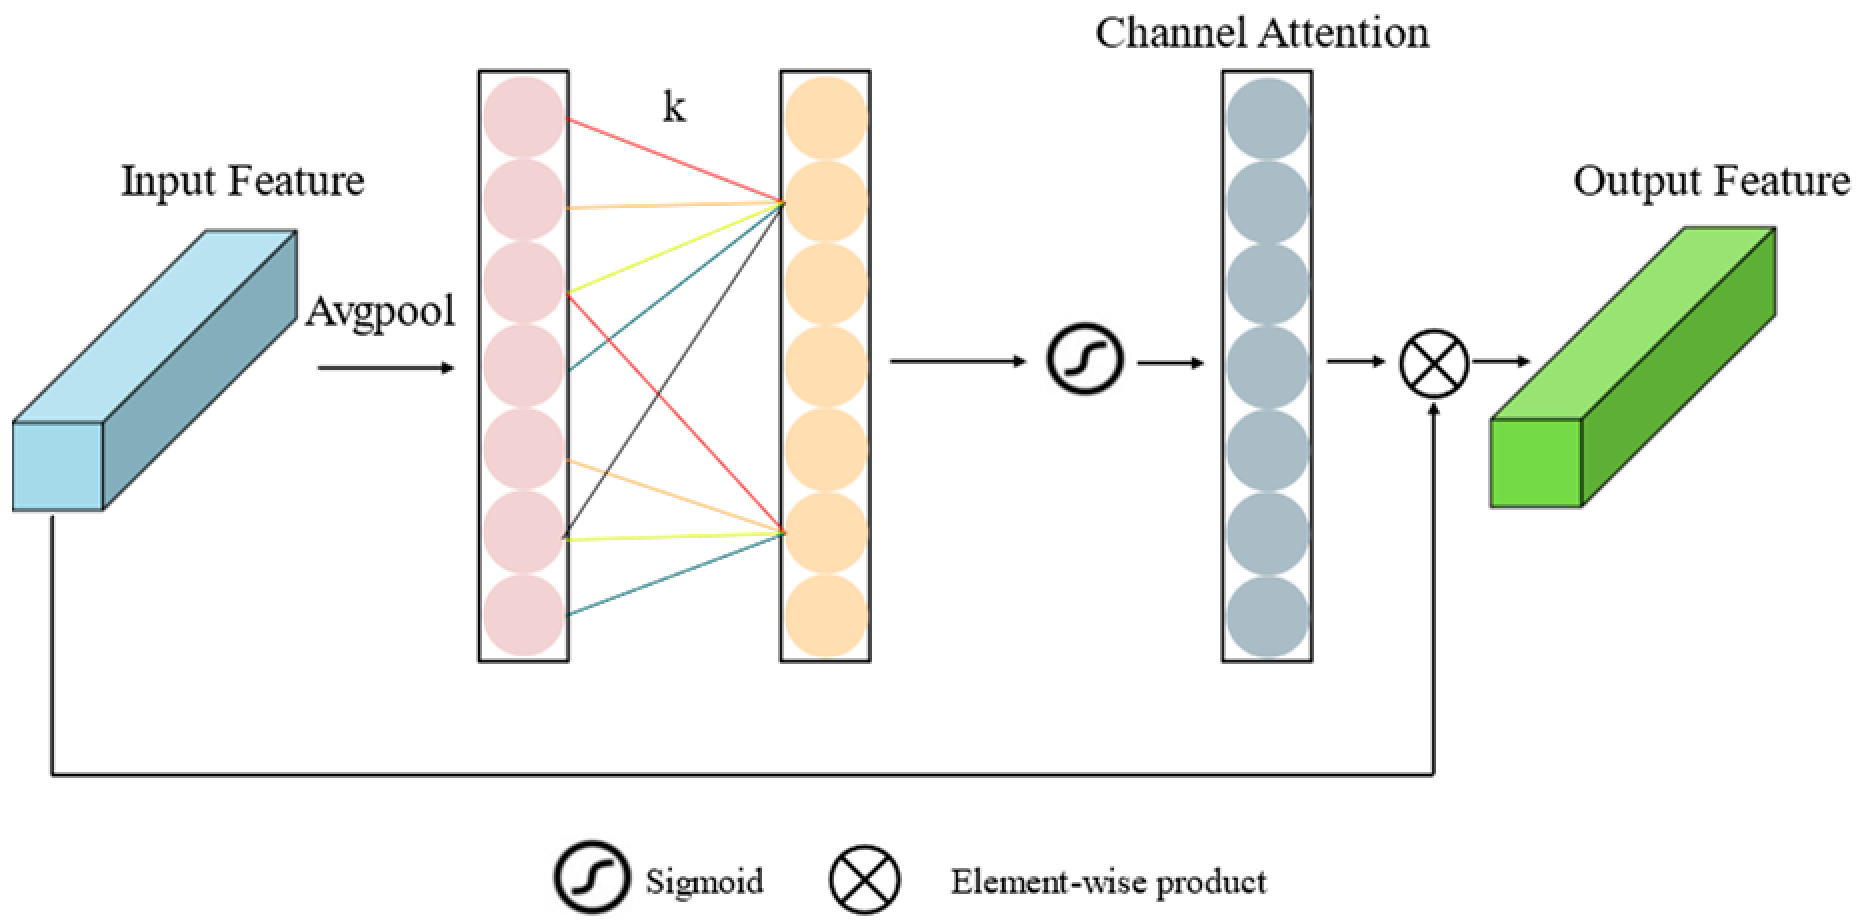
2.5.2. Efficient Channel Attention

Efficient channel attention (ECA) is a lightweight attention mechanism designed for image processing and computer vision tasks [38]. The approach aims to enhance the model’s focus on crucial features in the channel dimension while reducing computational and parameter complexity. ECA achieves this by introducing an adaptive and lightweight attention weight for each channel, enabling the model to capture key information in images more accurately without introducing significant computational overhead. Figure 6 illustrates the specific structure of the ECA.
As depicted in the illustration, the ideal span for the exchange of channel data, denoted as k, corresponds to the dimension of the one-dimensional convolution kernel. This is determined using the following formula:
k = log 2 ( C ) γ + b γ o d d
where C signifies the count of feature channels and b and γ are typically assigned the values of 1 and 2, respectively. Additionally, w denotes the ultimate channel attention and it is computed according to the subsequent equation:
w = σ ( C 1 D k ( A v g P o o l ( F ) ) )
where F denotes the incoming feature, C1Dk symbolizes the one-dimensional convolution, employing a convolution kernel of size k, and σ represents the Sigmoid function.
In comparison to traditional attention mechanisms, ECA effectively reduces the demand for computational resources while maintaining model performance, making it an ideal choice for image processing in resource-constrained environments. The design philosophy of ECA aligns with the objectives of this paper, which focuses on designing a lightweight semantic segmentation network for assessing the ripeness of post-harvest sugar apples. Consequently, ECA is incorporated at the connections linking the encoder and decoder in this paper to enhance the model’s ability to capture critical information in images with greater precision.

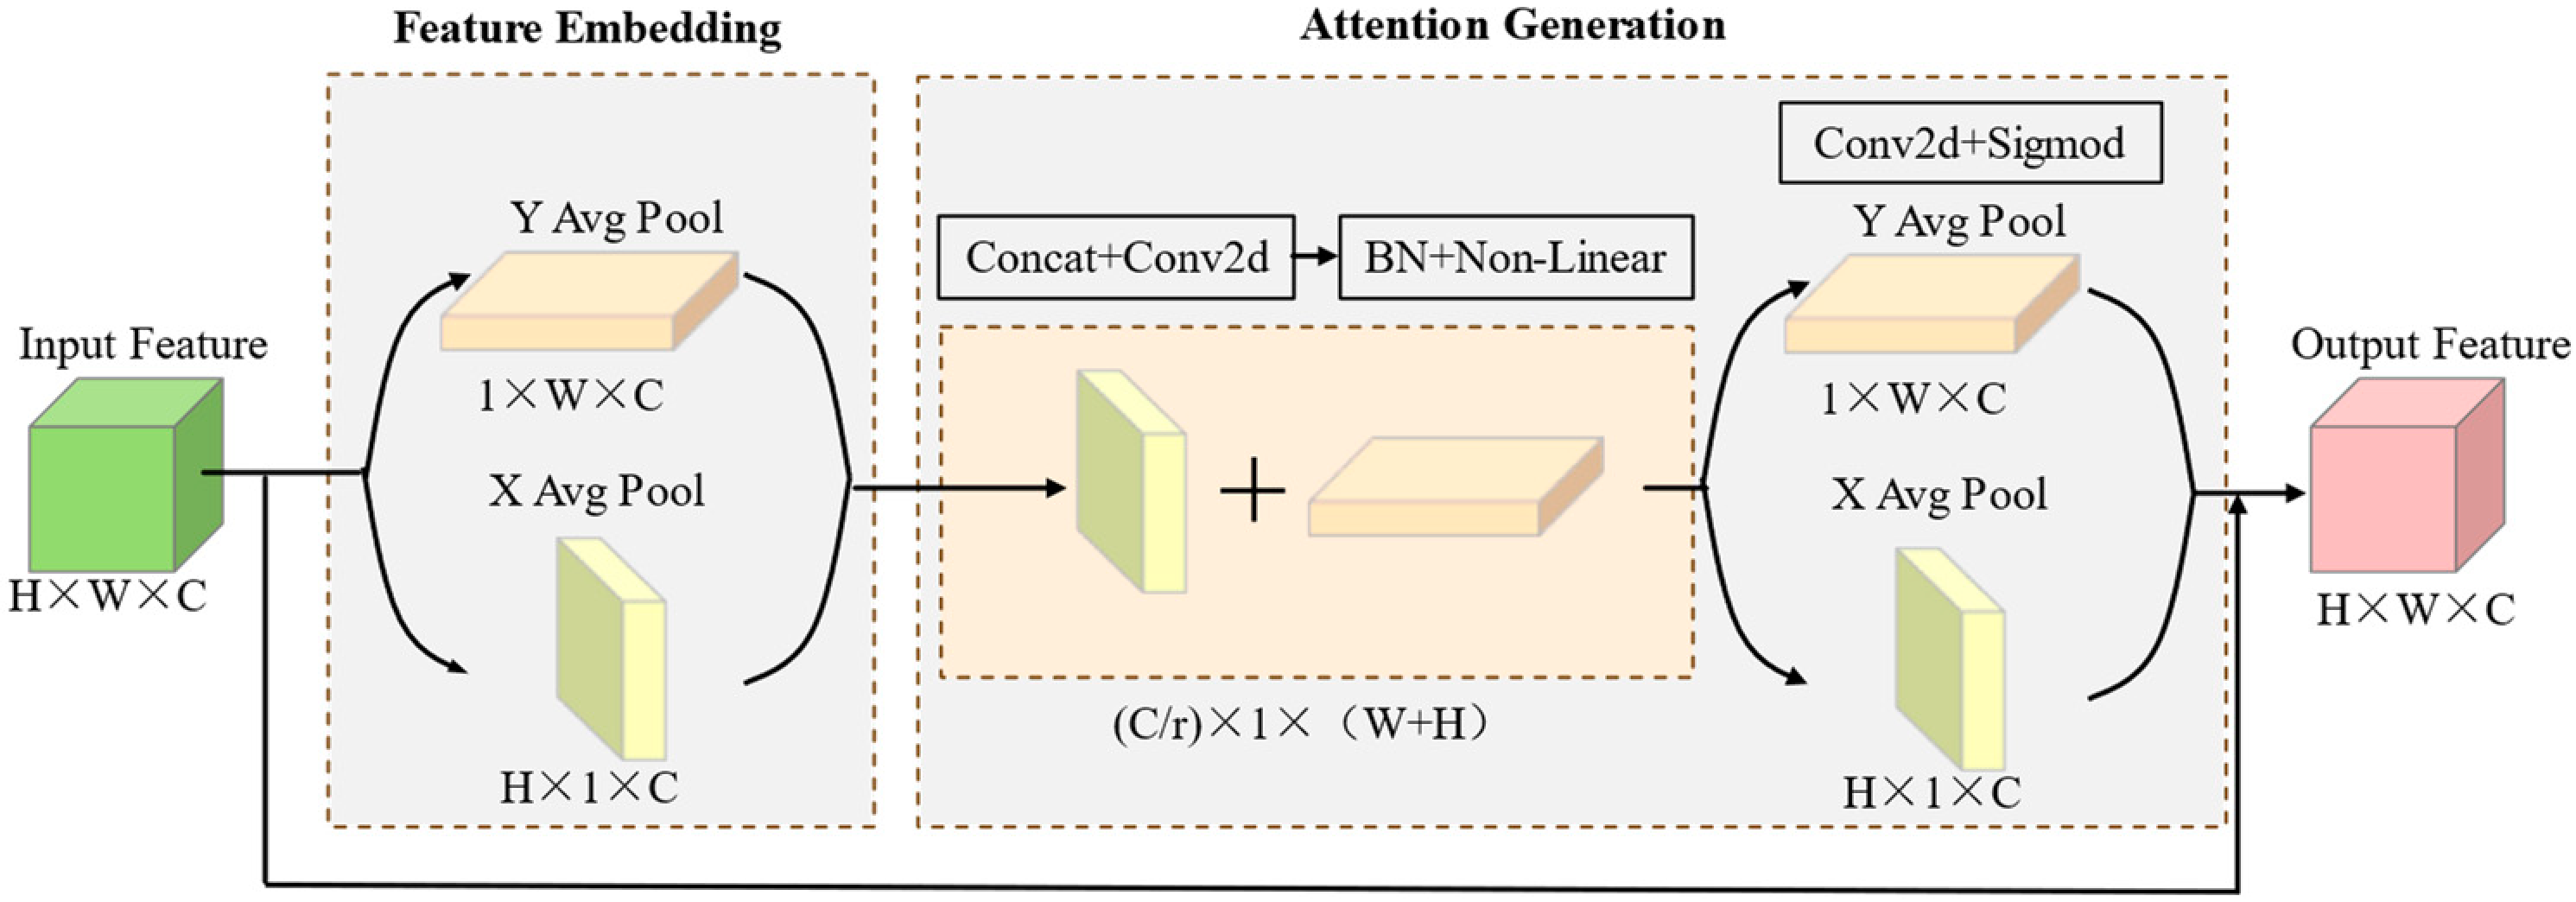
2.5.3. Coordinate Attention
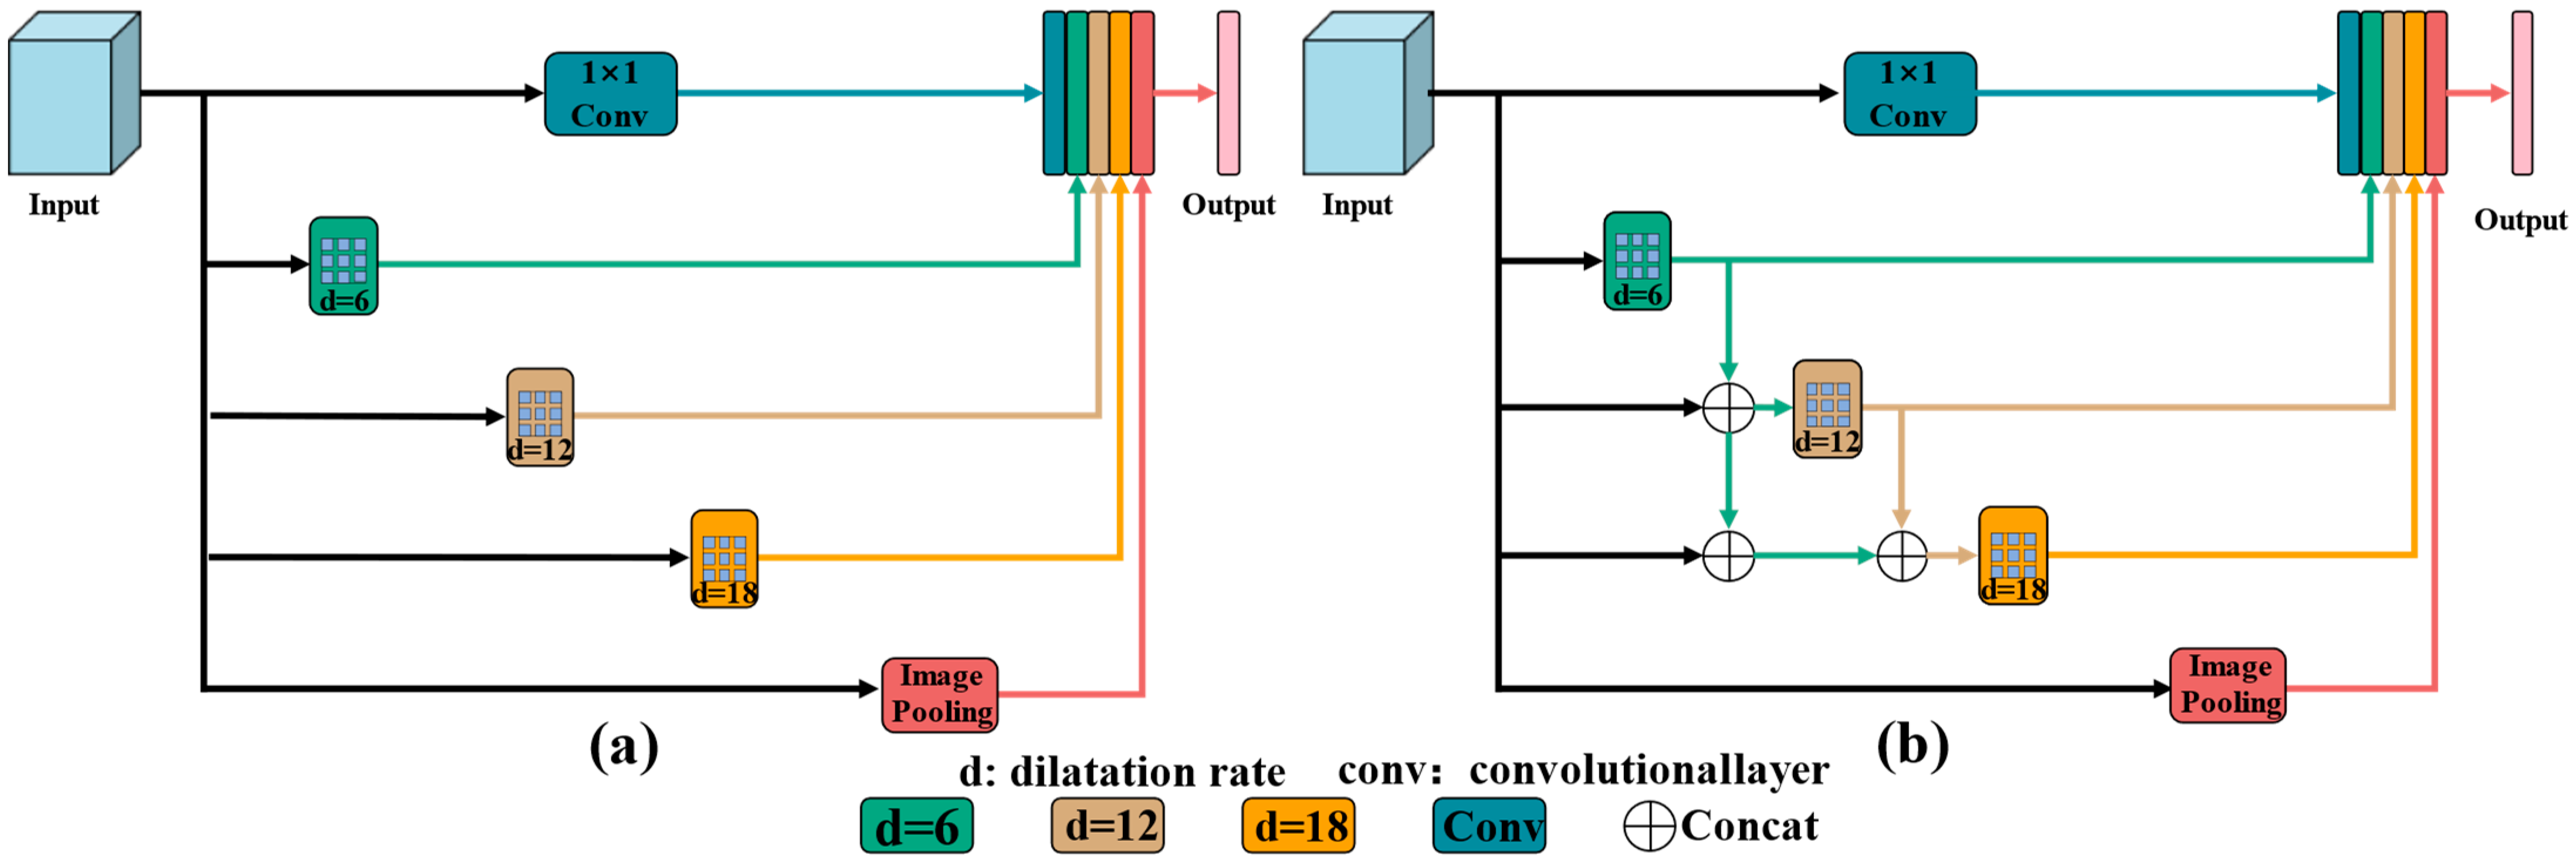
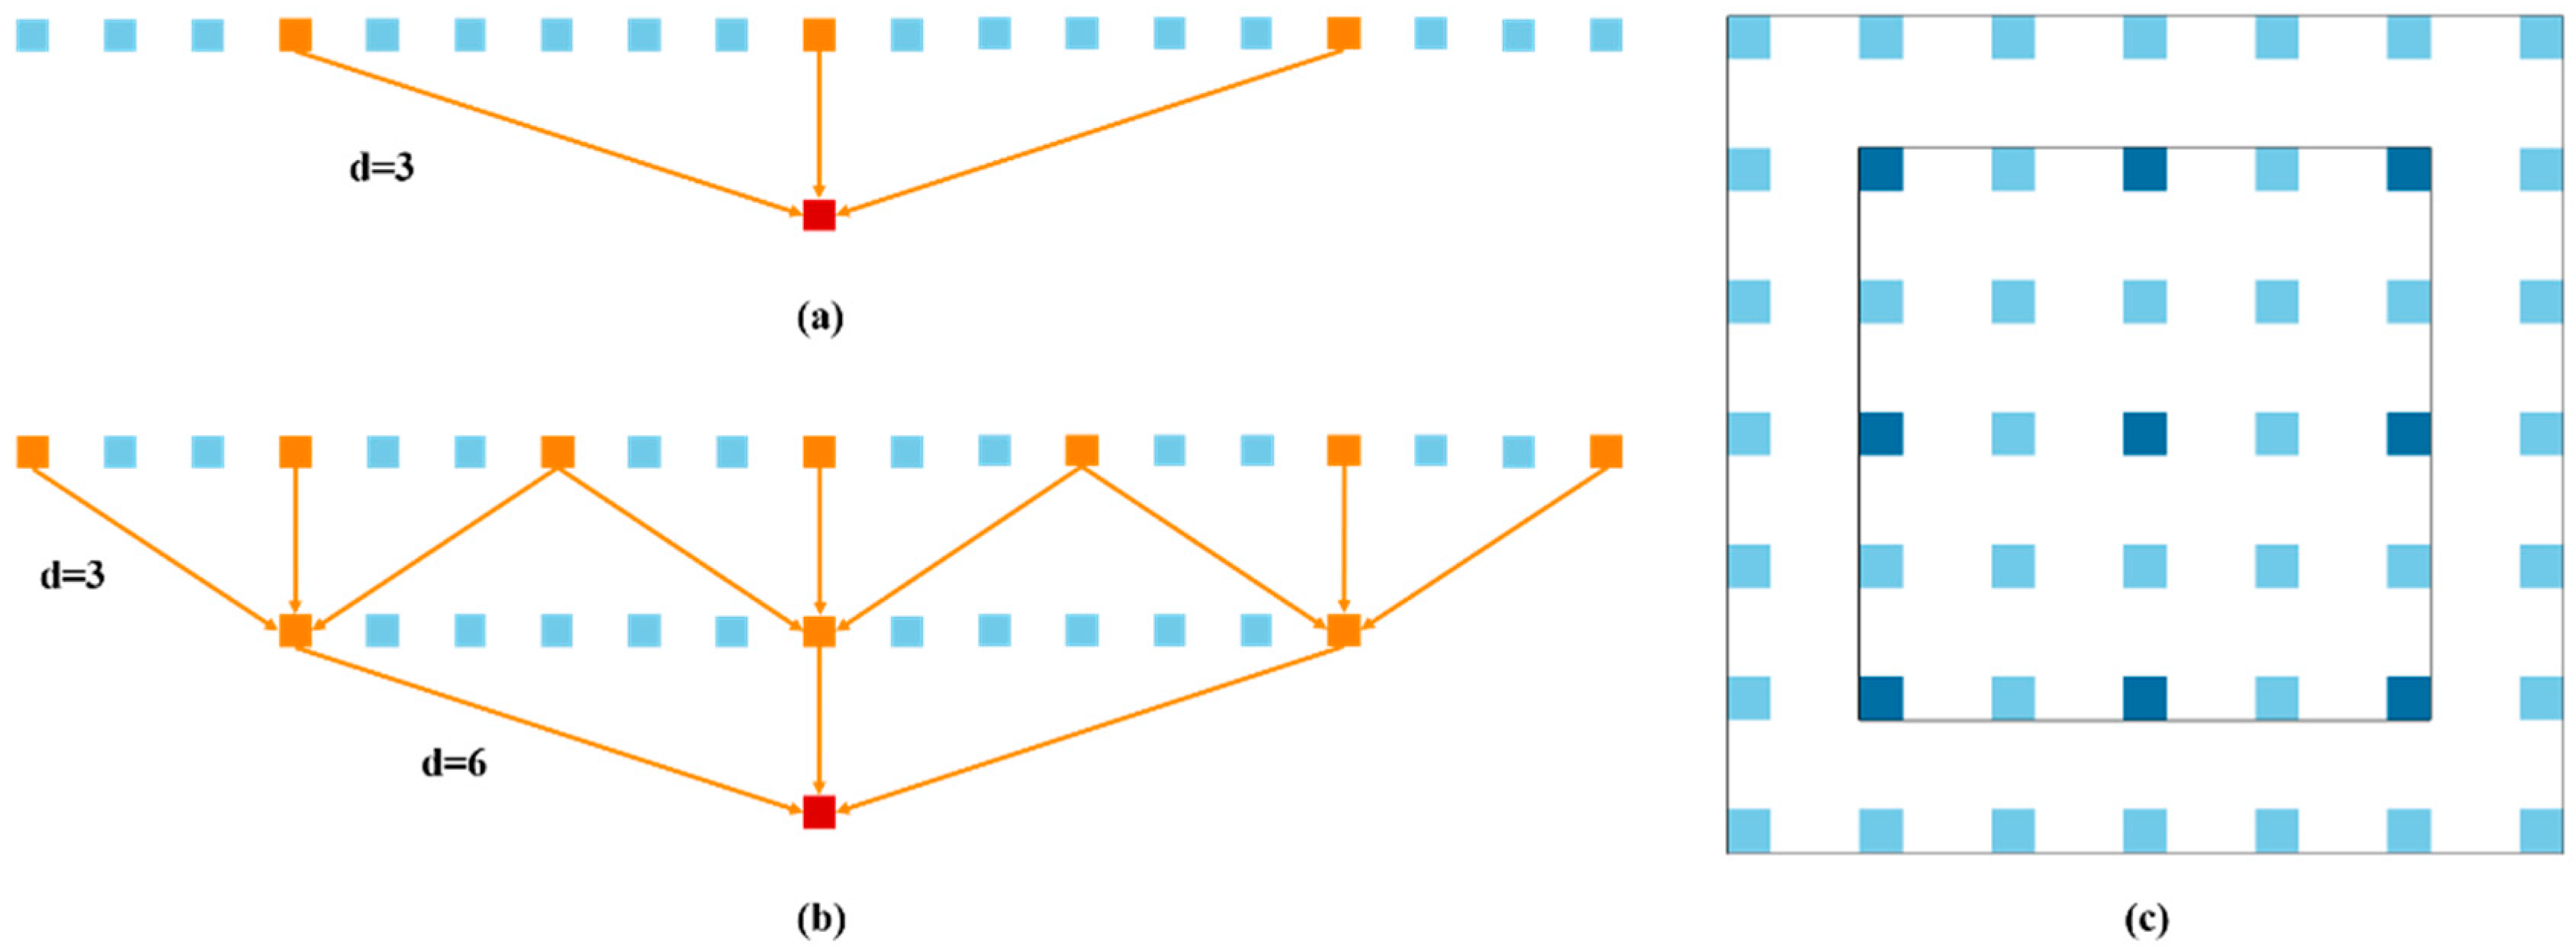
Traditional attention mechanisms, constrained by convolutional computations, primarily focus on capturing local relationships and exhibit limitations in modeling distant dependencies. To overcome this challenge, the coordinate attention mechanism is proposed by Hou et al. [39]. This mechanism conducts feature-aware operations across spatial coordinates and encompasses two pivotal stages: coordinate attention embedding and coordinate attention generation. The architecture is illustrated in Figure 7.
During the coordinate attention embedding process, the attention mechanism applied to individual channels within the input feature map is divided into two one-dimensional processes for feature encoding. These dual feature encodings execute feature consolidation along both the x and y directions, encompassing horizontal and vertical orientations. Subsequently, encoding is carried out for each channel along the horizontal and vertical coordinates using pooling operations.
During the generation of coordinate attention, the feature map tensors obtained from two distinct directions, horizontal and vertical, undergo convolutional operations to adapt their channel dimensions, aligning with the channel count in the input. Ultimately, an activation function, which can modify the output of the attention module, is employed. The formula for the coordinate attention process is outlined as follows:
z c h = 1 W 0 i < W x c ( h , i )
where h stands for the height parameter of the pooling kernels, z h c signifies the output of the c-th channel at the height h, and the input of the c-th channel is represented by xc.
z c w = 1 H 0 j < H x c ( j , w )
where w is the width parameter of the pooling kernels and z w c denotes the output of the c-th channel at width w.
u = δ ( C o n v ( [ z h , z w ] ) )
where [·,·] denotes the connectivity operation from the spatial dimension, δ stands for the non-linear activation function, and u is the mid-level feature mapping that is achieved by merging the feature both vertically and horizontally. Conv is the convolutional operation.
g h = σ ( C o n v ( u h ) )
g w = σ ( C o n v ( u w ) )
where gw and gh are tensors with the same channel number as the input, obtained by transforming uw and uh, respectively. The sigmoid function is represented by σ while uh and uw are the two tensors obtained by decomposing u along the spatial dimension.
y c ( i , j ) = x c ( i , j ) × g c h ( i ) × g c w ( j )
where the output of the c-th channel in the equation is represented by yc.
In order to improve the model’s localization and feature extraction capabilities in the sugar apple ripeness segmentation task, we introduced the coordinate attention mechanism into the feature map after the fusion of the ASPP module. This allows the model to adaptively learn feature information and details from post-harvest sugar apple images of different ripeness levels, accurately capturing the precise location of the target object and long-range dependency information.

2.5.4. Dense ASPP

In the ASPP module of the DeepLabv3+ model (Figure 8a), the parallel-connected atrous convolutions exhibit discreteness in the image space, leading to the loss of feature information and a reduction in the accuracy of image segmentation. We introduced the Dense ASPP [40] in DeepLabv3+, as illustrated in Figure 8b. This improvement allowed DeepLabv3+ to sample pixels more densely, obtaining a broader receptive field and enhancing the segmentation performance of the model on post-harvest sugar apple images.
In the context of dense pixel sampling, the pixel sampling rate associated with atrous convolution appears notably sparse. As illustrated in Figure 9a, within one-dimensional atrous convolution featuring an atrous rate of 6, merely 3 pixels are engaged in the computation for such a substantial convolution kernel at any given moment. Despite achieving a broader receptive field, this approach results in the omission of considerable information. Following the integration of the densely linked ASPP module, pixel sampling undergoes intensification, securing the integrity of feature information. As depicted in Figure 9b, the atrous rate incrementally escalates layer by layer, involving seven pixels in the convolutional computation within the obtained convolutional result. This configuration is richer in pixel information compared to the atrous convolution depicted in Figure 9a. As demonstrated in Figure 9c, within two-dimensional atrous convolution, the count of the pixels engaged in feature extraction reaches 49 when each densely connected atrous convolution layer is employed. In contrast, a solitary atrous convolution layer encompasses merely 9 pixels in feature extraction. Convolution layers featuring a higher atrous rate tend to neglect adjacent pixel features. Consequently, by amalgamating convolution layers with varying atrous rates, the preservation of feature information integrity can be assured and the receptive field can be expanded.
The size of the receptive field can be calculated using the following formula:
R = ( r 1 ) × ( k 1 ) + k
where r represents the atrous rate of the atrous convolution, k represents the kernel size of the atrous convolution, and R represents the size of the receptive field.
If two atrous convolutional layers are stacked together, a larger receptive field can be obtained. The formula for calculating the size of the stacked receptive field is as follows:
R = R 1 + R 2 1
where R1 and R2 represent the receptive field sizes provided by the adjacent two atrous convolutional layers and R represents the stacked receptive field.
Table 2 illustrates the receptive fields obtained through both the original ASPP configuration and the utilization of a densely linked stacked atrous convolution. In the initial DeepLabv3+ model, the ASPP module operates independently, with no information exchange between its branches. After passing through each atrous convolutional layer, the feature maps are directly concatenated. As detailed in Table 2, the receptive fields are 13, 25, and 37 for atrous rates of 6, 12, and 18, respectively.
In contrast, the densely linked ASPP structure enhances the reutilization of feature information across diverse layers, consequently augmenting the receptive field. Notably, the receptive fields are 37 when connecting branches with atrous rates of 6 and 12 and 61 when connecting branches with atrous rates of 12 and 18. For the scenario where all three branches with atrous rates of 6, 12, and 18 are connected, the receptive field expands to 73.

2.6. Evaluation Indicators

In this paper, we comprehensively evaluate the performance of the mentioned model in the sugar apple ripeness classification task from two aspects: model performance and model complexity. For the validation of model performance, we employ four evaluation metrics: Mean Intersection over Union (MIoU), Mean Pixel Accuracy (MPA), Pixel Accuracy (PA), and Mean F1 Score (MF1). MIoU primarily assesses the segmentation performance of models, measuring the accuracy of pixel segmentation for each class. MPA is used to gauge the classification accuracy at the pixel level, calculating its average. It focuses on the model’s accuracy in pixel-level classification. PA is utilized to evaluate the overall accuracy of the model at the pixel level, i.e., the proportion of correctly classified pixels to the total number of pixels. MF1 serves as a comprehensive metric, offering a balanced evaluation of model performance. It assesses the accuracy of predicted positives among the true positives and evaluates the model’s capability to correctly identify true positives. In doing so, the MF1 achieves equilibrium between different aspects of model performance, resulting in a thorough and nuanced assessment. Four basic metrics can be obtained by comparing the predictions of the model with the dataset labeling, such as False Negative (FN), True Negative (TN), True Positive (TP), and False Positive (FP). These basic metrics allow further calculation of the previously mentioned metrics (MIoU, MPA, PA, and MF1). The formulas for these metrics are as follows:
M P A = 1 n i = 1 n T P + T N F N + F P + T P + T N
M I o U = 1 n i = 1 n T P F N + F P + T P
P A = T P + T N F N + F P + T P + T N
M F 1 = 1 n i = 1 n 2 × T P ( 2 × T P + F N + F P )
On the other hand, for the validation of model complexity, we primarily focus on the size of model parameters and floating-point operations per second (Flops). Understanding the size of the model’s parameters aids in assessing its demands on storage and computational resources while considering the model’s Flops helps evaluate its computational efficiency during actual runtime. Flops are commonly used to measure the speed of a system in handling tasks involving a large number of numerical calculations, particularly in scenarios, such as scientific computing and deep learning, that require extensive floating-point operations. The formulas for these metrics can be listed as follows:
P a r a m s = C 0 × ( k w × k h × C i + 1 )
where C₀ stands for the output channel number, (·) stands for the parameters of a convolution kernel, kw represents the convolution kernel width, kh represents the convolution kernel height, Cᵢ represents the input channel number, and kw × kh × Cᵢ represents the number of weights in a convolution kernel.
If the convolution kernel is square, i.e., kw = kh = k, then the above formula becomes:
P a r a m s = C 0 × ( k 2 × C i + 1 )
Additionally, since batch normalization (BN) was employed in the model design, the +1 term in the calculation is removed. Furthermore, considering the use of square convolution kernels, the final formula for the parameters is listed as follows:
P a r a m s = C 0 × ( k 2 × k 0 × C i )
And the Flops can be calculated as follows:
F l o p s = [ ( C i × k w × k h ) + ( C I × k w × k h 1 ) ] × C 0 × W × H
where [·] represents the computational cost, including both multiplication and addition, required to compute a single point in the feature map through a convolution operation. The term Ci × kw × kh accounts for the multiplication cost within a single convolution operation, Ci × kw × kh − 1 represents the addition cost in a single convolution operation, and the +1 term corresponds to the bias. H and W stand for the width and length of the feature map, respectively, and C0 × W × H denotes the total number of elements in the feature map.
If the convolutional kernel is square, meaning kw = kh = k, and batch normalization (BN) is applied, the calculation formula is modified to:
F l o p s = 2 × C i × k 2 × C 0 × W × H

3. Results

3.1. Experiment Details

The details of the experimental platform’s hardware and software parameters used for the experiment can be seen in Table 3.
The training process is divided into two phases: freeze training and unfreeze training, aimed at accelerating the model training speed. Further details of the experiment can be found in Table 4.
In addition, the loss curves and accuracy curves in the training process are also presented in Figure 10. As depicted in Figure 10a, the training loss and validation loss converge simultaneously, both are at low values, and the validation loss is slightly higher than the training loss. Moreover, as illustrated in Figure 10b, the training and validation accuracy converge simultaneously, both at high values over 90%. The training accuracy is slightly higher than the validation accuracy, suggesting that the model is striving to achieve performance akin to that of the training set, rather than deviating significantly. Therefore, it can be concluded that there is no overfitting observed in the models presented in this paper.

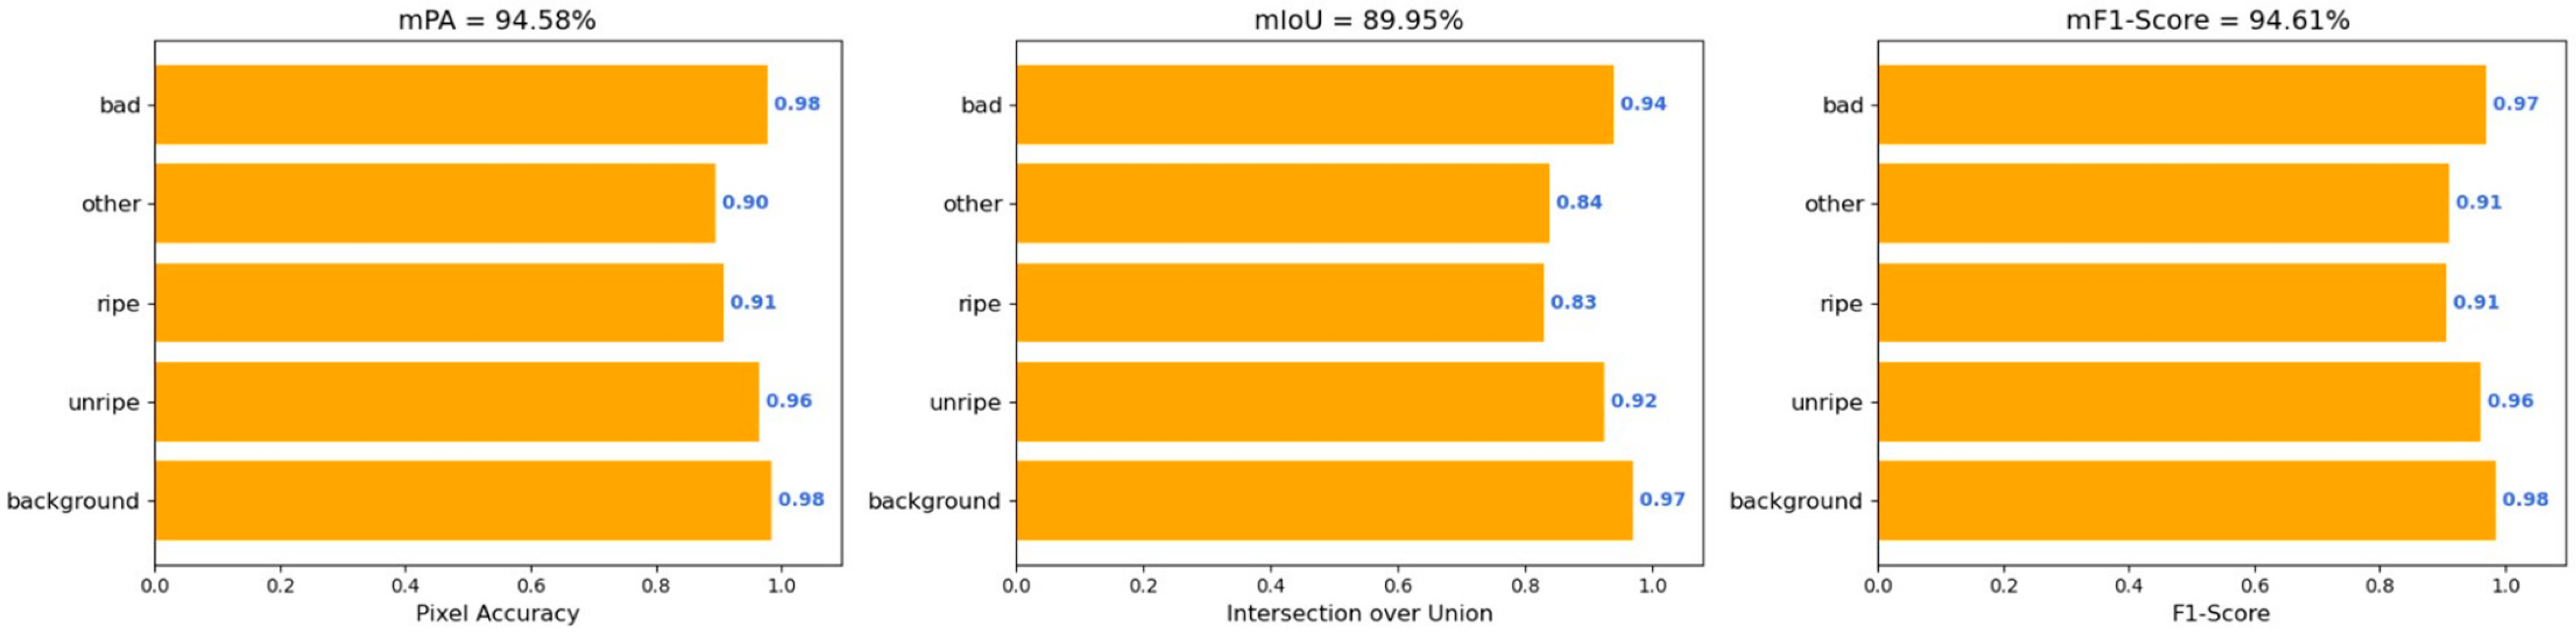
3.2. Quantitative Analysis

Within this section, an evaluation is conducted on existing semantic segmentation methods, encompassing DeepLabv3+, PSPNet, HRNet, and U-Net models utilizing various backbones (Xception, MobileNetV2), and the newly introduced model (ECD-DeepLabv3+). In the experiments, a consistent dataset (self-made post-harvest sugar apple dataset) is employed for both training and testing to maintain comparability and consistency in the independent variable. The quantitative comparison results of these models are presented in Table 5. It can be seen that DeepLabv3+ has the best comprehensive performance among the four well-known semantic segmentation models, with the best performance on MIoU, PA, and MF1; however, its model complexity is high so this paper makes a series of improvements to DeepLabv3+ based on maintaining its performance.
As can be seen in Table 5, after replacing the backbone with the original DeepLabv3+ (MobileNetV2-DeepLabv3+), the model exhibits superior performance in the comparisons of Params and Flops with values of 5.81 M and 52.89 G, respectively. Notably, when compared with Xception-DeepLabv3+ (baseline), MobileNetV2-DeepLabv3+ shows significant improvements of 89.33% and 68.30% in Params and Flops, respectively, and a slight increase in other metrics (MIoU, MPA, PA, MF1).
After accomplishing the task of reducing model complexity, further exploration was conducted to enhance the performance of the model in the post-harvest sugar apple ripeness detection task while maintaining low model complexity. As evident from Table 5, compared to DeepLabv3+ (Xception), the proposed model (ECD-DeepLabv3+) exhibits reductions of 89.20% and 68.09% in Params and Flops, respectively. Additionally, there are improvements of 2.13%, 1.77%, 0.62%, and 1.27% in MIoU, MPA, PA, and MF1, respectively. These results show that the proposed method improves the detection of different ripeness levels of post-harvest sugar apples by better extracting the sugar apple image features and enhancing the focus on the information of the coordinates where the fenugreek features are located. Figure 11 plots the results of the ECD-DeepLabv3+ model in each of the evaluation metrics in the different categories, providing a clearer and easier comparison between the categorization results and the actual predictions, demonstrating the performance of our model. Combining Figure 11 and Table 5, it can be seen that the proposed model exhibits excellent performance both in terms of the overall average performance (MPA, MIoU, and MF1), the overall performance (PA, Params, and Flops), and the performance specific to the individual categories in the dataset.

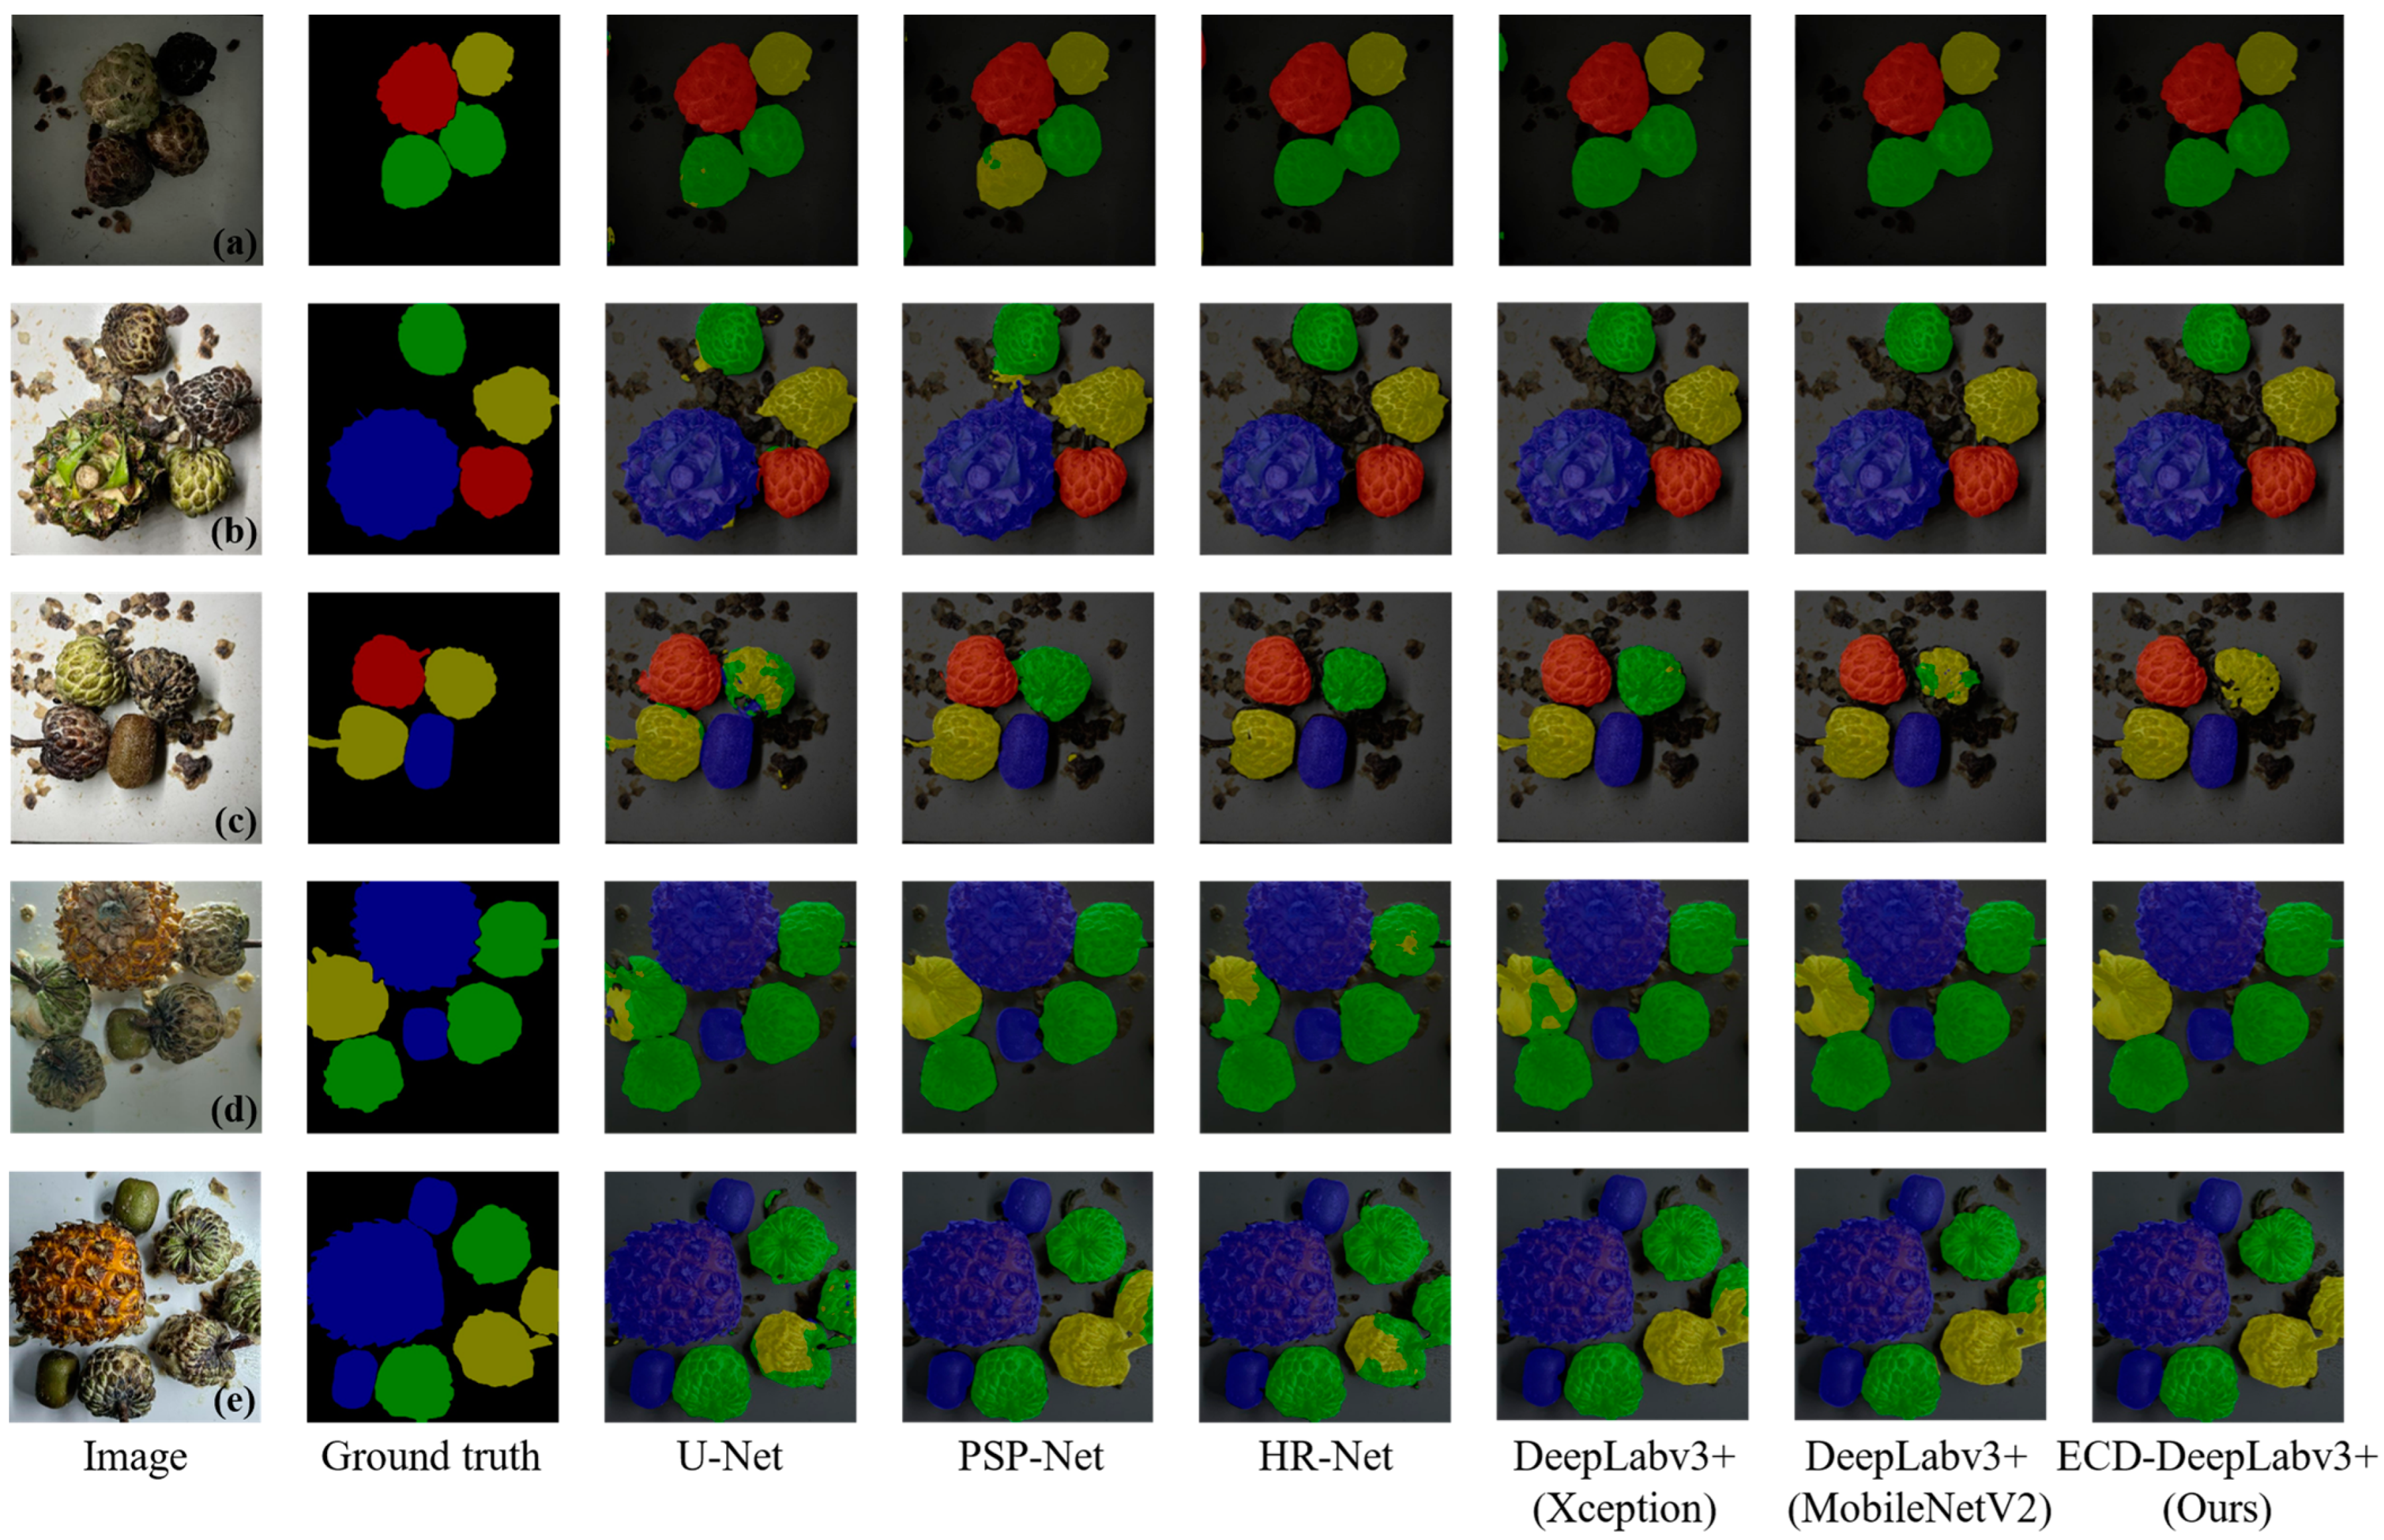
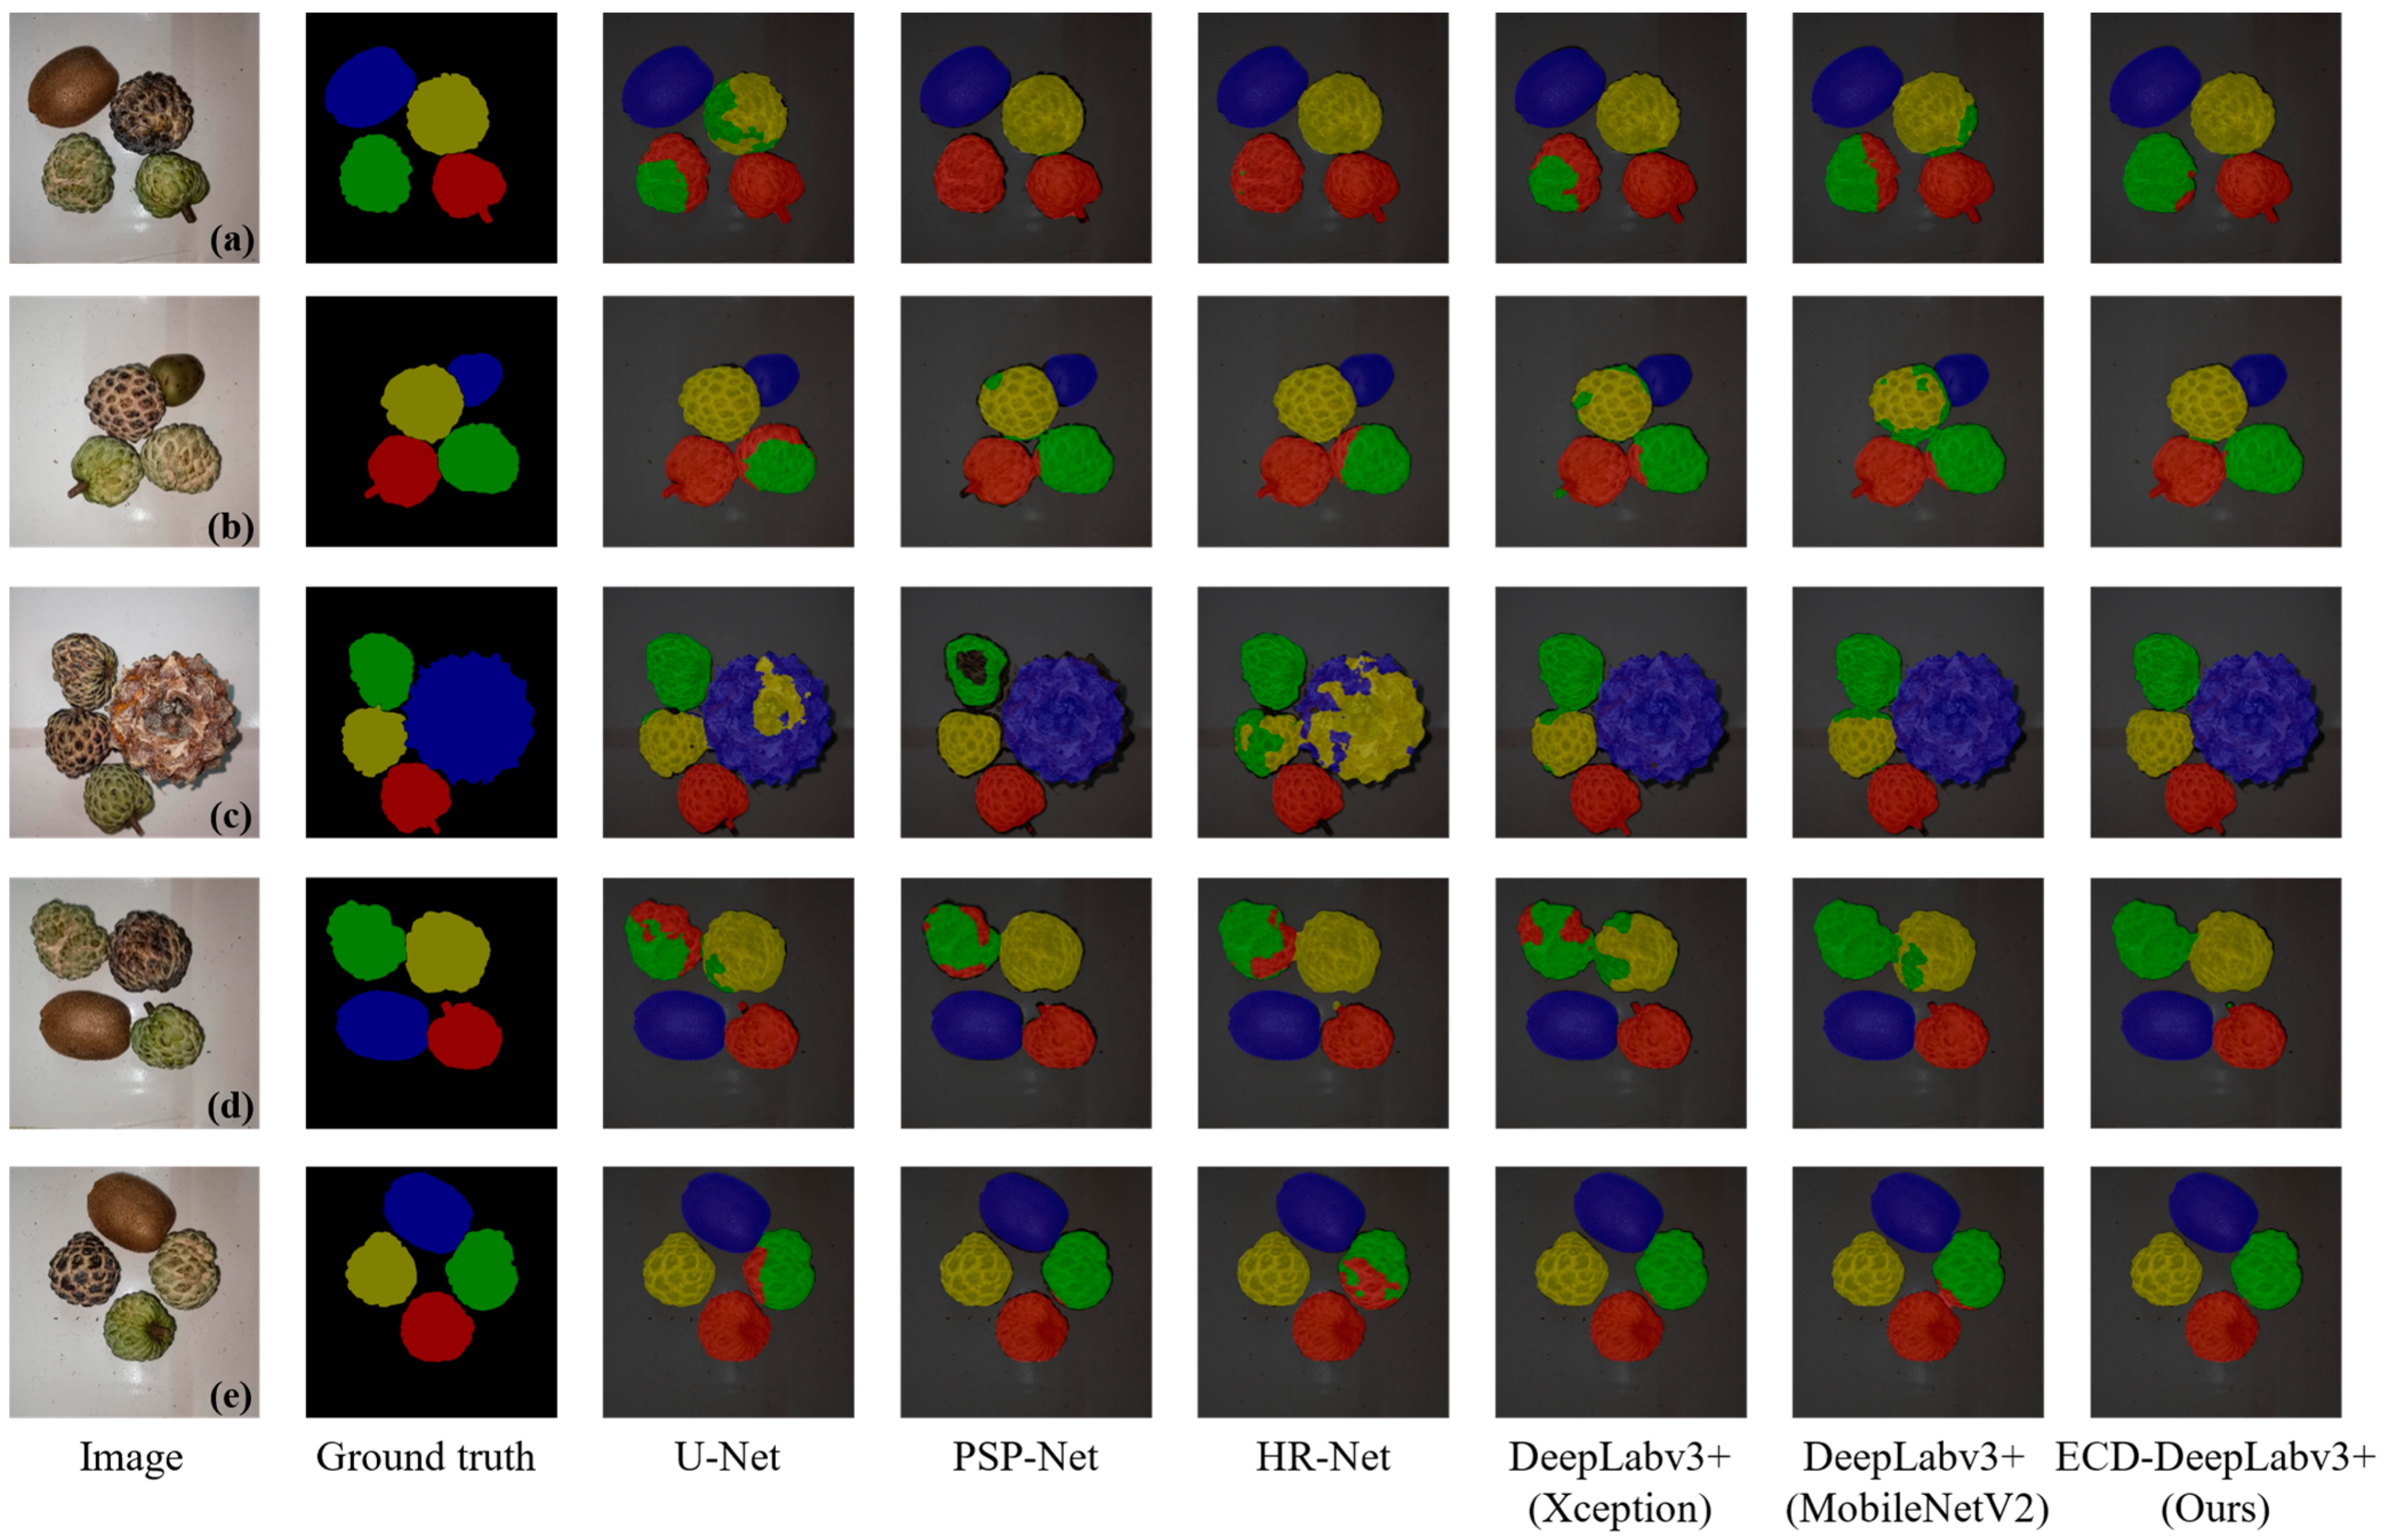
3.3. Qualitative Analysis

In order to better verify the performance of the proposed model, we conducted a qualitative analysis of six models (U-Net, PSP-Net, HR-Net, DeepLabv3+ with two different backbones, and ECD-DeepLabv3+). On our self-made dataset, which includes clean backgrounds and backgrounds with interference (such as ripe sugar apple or skin peeling caused by impact), the experimental results show that our proposed ECD-DeepLabv3+ model demonstrates better performance in terms of segmentation accuracy, segmentation detail, and robustness under two different background situations. It is worth mentioning that, to ensure the rigor of the experiment, all images used to evaluate the model performance are not included in the model training.
Figure 12 shows the segmentation results of each model for the different the ripeness of the sugar apple under a clean background (non-interference situation). As can be seen in Figure 12, compared with the five models, the segmentation result of our proposed model (ECD-DeepLabv3+) performs the best. Figure 12a,b indicate that for ripe and bad sugar apples, the five compared models all have serious segmentation errors while the proposed model (ECD-DeepLabv3+) still maintains high accuracy, overall performing the best. Figure 12c shows that the U-Net, PSP-Net, and HR-Net models all have segmentation errors or under-segmentation for the ripe sugar apple or other fruits (pineapple) while DeepLabv3+ (Xception) and DeepLabv3+ (MobileNetV2) perform better but still have some segmentation errors. In contrast, our proposed model accurately segments each type. Figure 12d shows that the five compared models all have different degrees of segmentation errors when classifying the ripe sugar apple and bad sugar apple. But our proposed model has relatively high prediction accuracy. Figure 12e presents that the four models, U-Net, HR-Net, DeepLabv3+ (Xception), and DeepLabv3+ (MobileNetV2), all have serious segmentation errors when identifying the unripe sugar apple and ripe sugar apple. PSP-Net has slight segmentation errors; in contrast, our proposed model still maintains stable segmentation accuracy.
Figure 13 highlights the ripeness detection results of various models when the background has noise interference caused by sugar apple skin peeling. As shown in Figure 13a, except for U-Net and PSP-Net, which have slight segmentation errors, other models all have considerable accuracy; however, in some details, the segmentation results of the other three models (HR-Net, DeepLabv3+ (MobileNetV2), DeepLabv3+ (Xception)) are affected by the proximity of the fruit, which causes some adhesion. Compared to the above models, our proposed model performs the best in detail. In Figure 13b, the U-Net and PSP-Net model results have segmentation errors for the ripe sugar apple and unripe sugar apple while HR-Net, DeepLabv3+ (Xception), and DeepLabv3+ (MobileNetV2) all have different degrees of under-segmentation and our proposed model performs relatively well. Figure 13c shows that U-Net and PSP-Net are disturbed by the background and the peeled outer skin is wrongly segmented; HR-Net, DeepLabv3+ (Xception), and DeepLabv3+ (MobileNetV2) all have serious segmentation errors and our proposed model performs better but there is still a slight under-segmentation phenomenon. In Figure 13d, all five compared models have under-segmentation and segmentation errors for the bad sugar apple target with severe skin peeling; in contrast, our proposed model performs better. Figure 13e fully reflects the situation where the background noise caused by sugar apple skin peeling affects the segmentation results to a certain extent; in addition to the five compared models all having different degrees of segmentation errors for the bad sugar apple, U-Net and HR-Net are affected by the peeled skin. Both wrongly segment the background skin while PSP-Net, DeepLabv3+ (Xception), and DeepLabv3+ (MobileNetV2) are not affected by the background; however, all have different degrees of segmentation errors for the bad sugar apple target and our proposed model shows better accuracy and completeness.

3.4. Ablaton Analysis

Ablation experiments with module removal are performed to assess the influence of each component on the efficacy of the proposed model. Table 6 presents the outcomes of semantic segmentation applied to post-harvest fenugreek images, considering various combinations of methodologies. In contrast to (1) and (2), notable reductions of 89.38% in Params and 68.30% in Flops are evident when transitioning from Xception to MobileNetV2 as the backbone. This highlights the substantial simplification achieved by MobileNetV2 in the model’s complexity. Moreover, there is a positive impact on the four evaluation indicators: MIoU, MPA, PA, and MF1. According to the results (1) and (3), it can be observed that by incorporating ECA between the encoding and decoding regions to adjust channel weights, the overall performance of the model has slightly improved. The values of MIoU, MPA, PA, and MF1 have increased by 0.87%, 0.91%, 0.22%, and 0.54%, respectively. Based on the results comparison of (1) and (4), it can be seen that after the introduction of coordinate attention branching in the feature map after ASPP output, the performance of the model upgraded by 1.16%, 0.98%, 0.27%, and 0.7% on MIoU, MPA, PA, and MF1, respectively, which shows that this method effectively improves the attention of the target objectives. Compared to the results comparison of (1) and (5), after substituting the initial ASPP module with the Dense ASPP module, improvements in model performance were observed, resulting in an increase of 1.23%, 1.03%, 0.29%, and 0.76% in MIoU, MPA, PA, and MF1 values, respectively. According to the results of Method (6), it is evident that incorporating all the improvements simultaneously significantly reduces the model’s complexity and enhances overall performance. The values of MIoU, MPA, PA, and MF1 are 89.95%, 94.58%, 96.60%, and 94.61%, respectively. The Params and Flops are 5.91 M, and 53.24 G, respectively. Compared to the original model (Method (1)), the proposed model achieves improvements of 2.13%, 1.77%, 0.62%, and 1.27% in MIoU, MPA, PA, and MF1, respectively, while reducing Params and Flops by 89.2% and 69.09%.

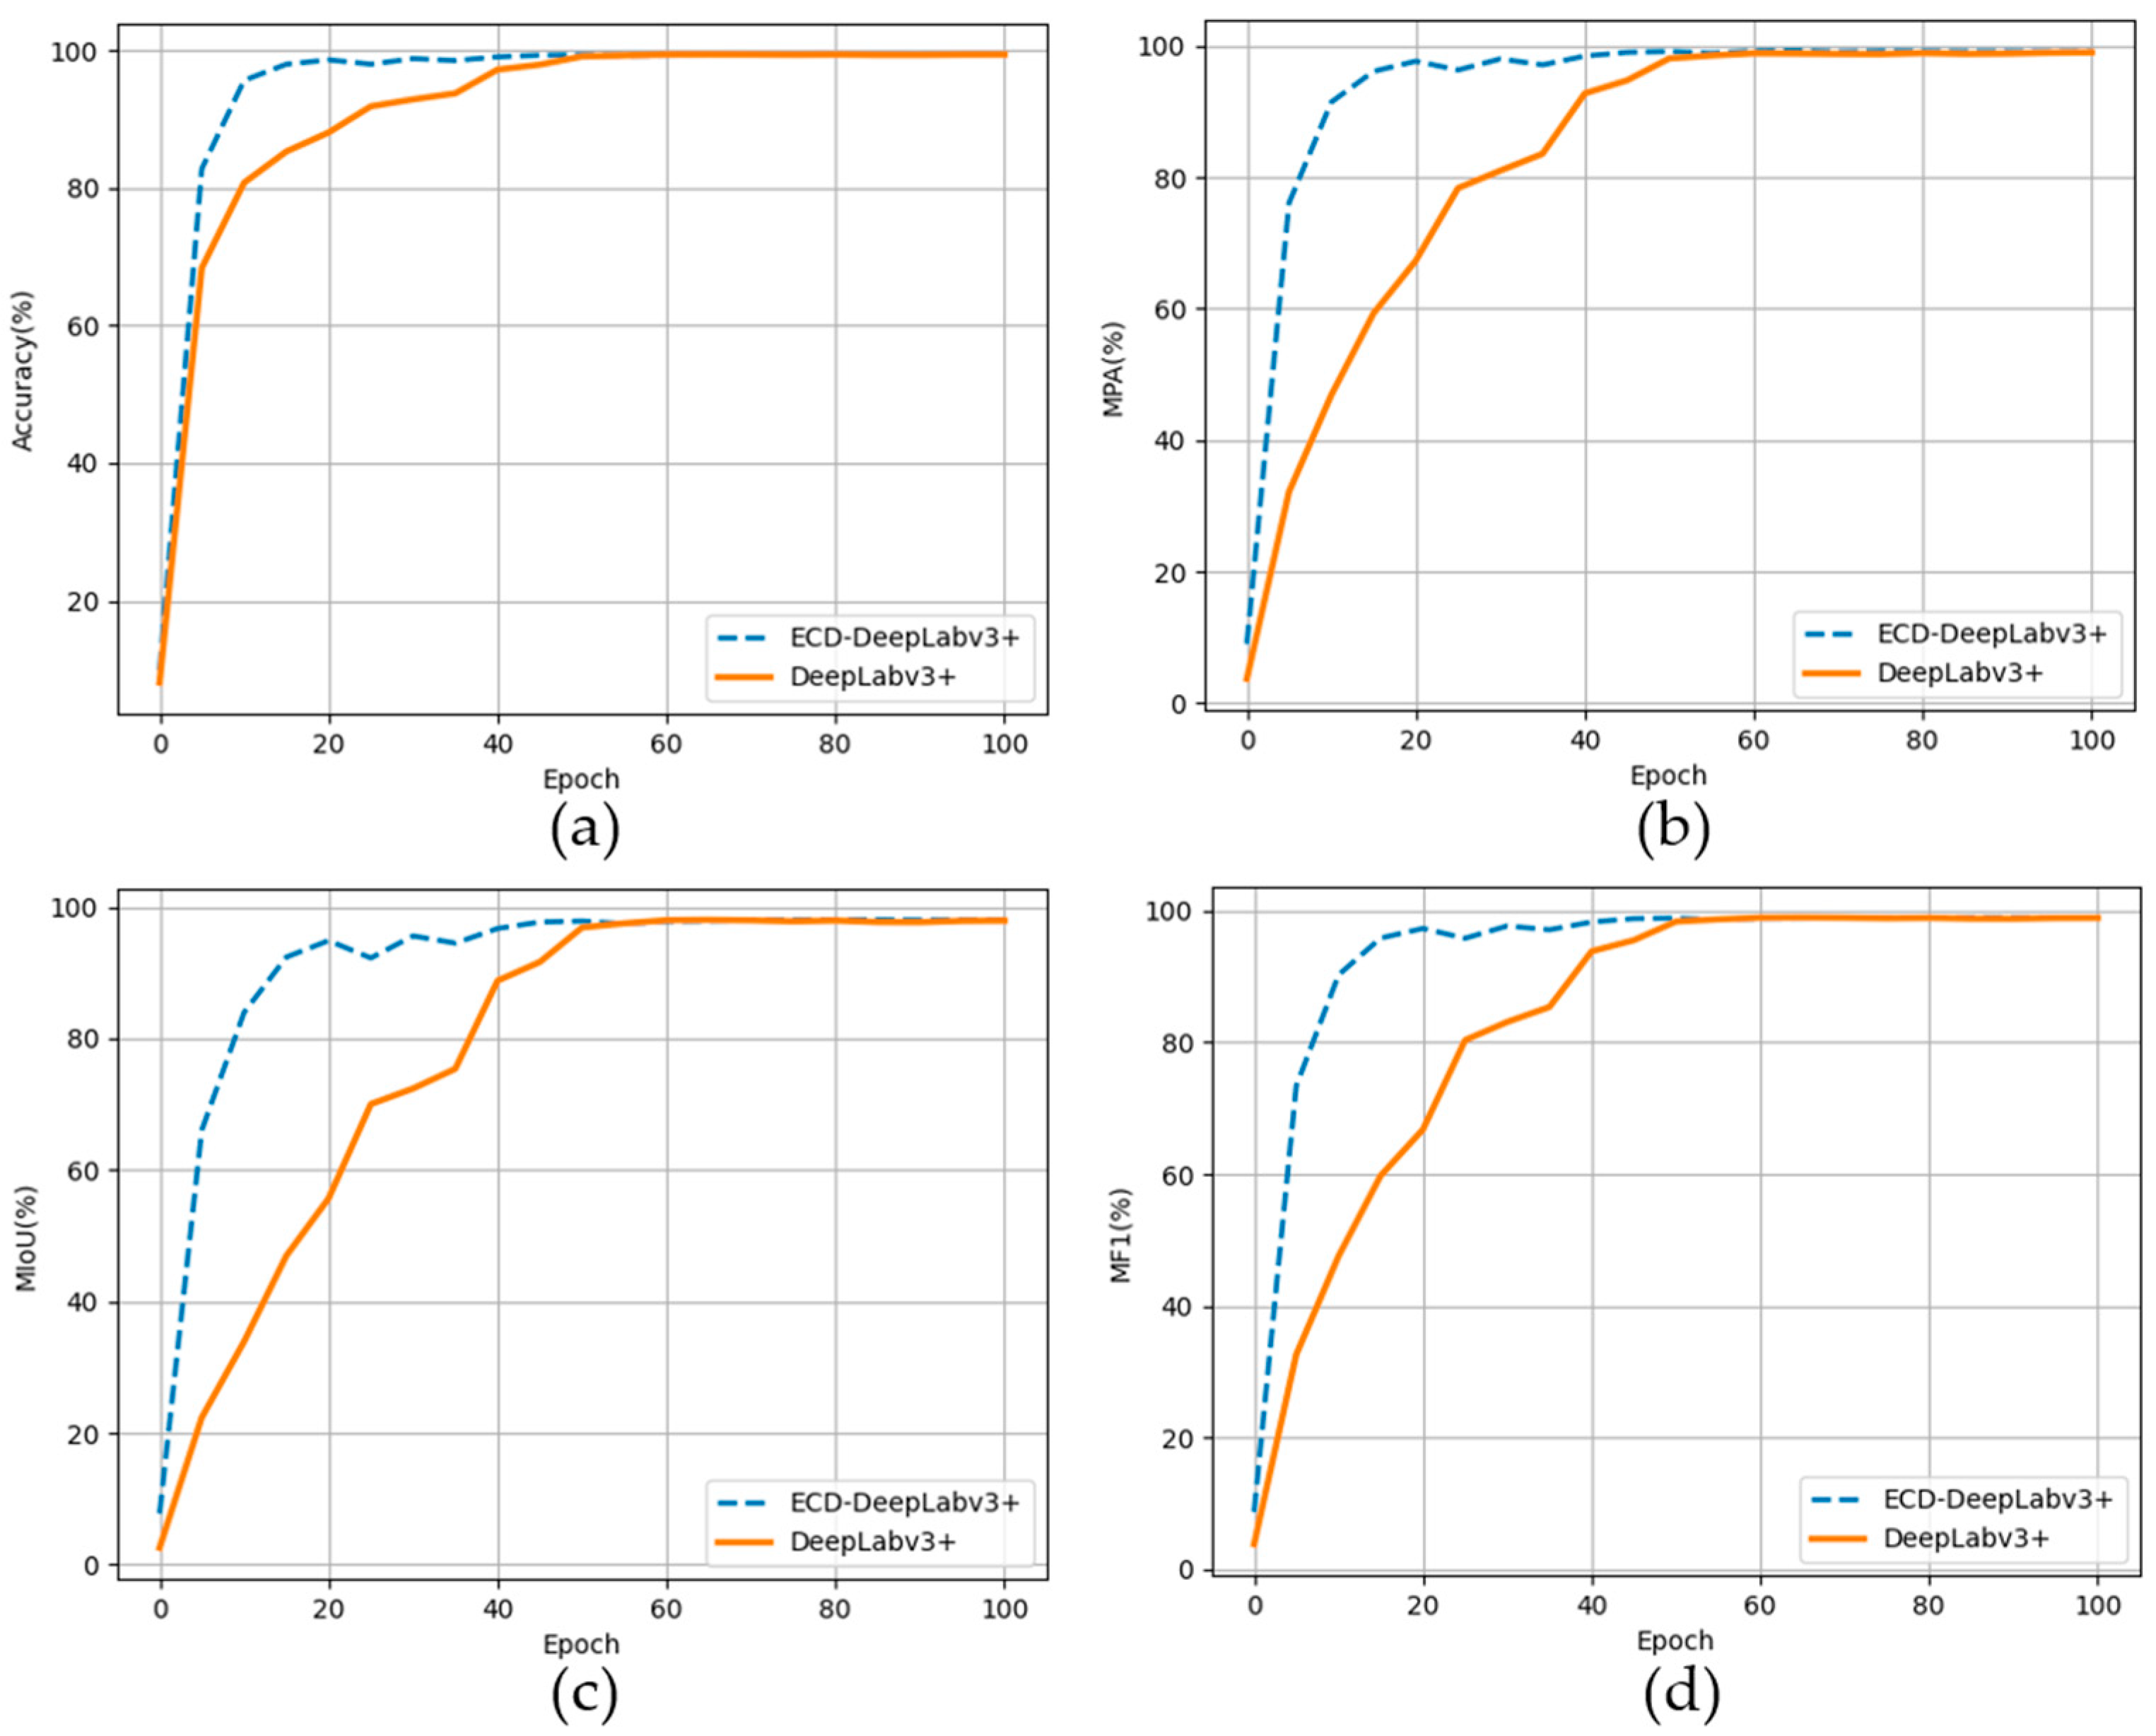
3.5. Generalizability Analysis

To investigate the generalizability of the proposed model in this paper to other tasks, an open-source dataset focusing on apples was selected after considering its relevance to the topic of fruits and the number of images available. This dataset, obtained from Baidu’s Paddle Deep Learning platform, comprises a semantic segmentation dataset with five categories, including three types of apples, pears, and peaches, totaling 758 images. This dataset can be obtained from https://aistudio.baidu.com/datasetdetail/114414 (accessed on 16 March 2024). A portion of the images is illustrated in Figure 14.
In the same experimental settings, the DeepLabv3+ and ECD-DeepLabv3+ models were further compared. Upon analysis of Table 7 and Figure 14, it is evident that due to the smaller background noise and the simpler task of this open-source dataset, both DeepLabv3+ and ECD-DeepLabv3+ demonstrate high performance. And the performance of the proposed ECD-DeepLabv3+ in this task still slightly surpasses that of DeepLabv3+. Furthermore, the training processes of the two models were explored, with Figure 15 illustrating the training curves of Pixel Accuracy, MPA, MIoU, and MF1 on the validation set for both models. It is apparent from the figure that ECD-DeepLabv3+ not only exhibits a faster improvement speed across all evaluation metrics but also converges earlier, further demonstrating its superiority in optimization and generalization capabilities. Additionally, it is worth mentioning that the proposed model has significantly reduced complexity (Params and Flops), facilitating easier deployment to embedded systems.

4. Discussion

The task of accurately and automatically classifying the ripeness of fruits is a meaningful one because the current sorting of fruit ripeness is still predominantly manual. This reliance on manual labor may lead to sorting errors due to insufficient human experience and result in low efficiency [41,42]. Currently, to address the inefficiency caused by manual labor in fruit ripeness classification, numerous computer-vision-based methods for fruit ripeness detection have been proposed. Although these methods have demonstrated good performance (with average accuracy exceeding 85% for sugar apple [26] and strawberry [24] ripeness tasks using YOLO object detection and semantic segmentation algorithms, respectively), there is still significant room for improvement in performance. Moreover, object detection methods have limitations in expressing information while semantic segmentation methods can provide more detailed and specific information [27]. It is worth mentioning that the proposed approach in this paper not only improves performance but also reduces model complexity, avoiding limitations associated with deploying models to embedded devices due to large model parameters and floating-point computational requirements [43,44].
Nowadays, semantic segmentation techniques have been applied in many fields of agriculture, for example, plant leaf disease segmentation [45], plant flower segmentation [46], specific whole plants [47], and so on [48,49]. Inspired by the aforementioned research, this paper explores the feasibility of applying semantic segmentation techniques to the task of sugar apple ripeness detection and proposes an improved semantic segmentation model (ECD-DeepLabv3+). To validate the performance of the proposed model, we created a dataset with 1600 optical images of sugar apples at different ripeness levels on various backgrounds. Detailed quantitative and qualitative analysis experiments were conducted on each model. The experimental results indicate that, under consistent experimental hardware parameters, model training hyperparameters, and datasets, the proposed model exhibits better performance and lower model complexity. The values for MIoU, MPA, PA, and MF1 for ECD-DeepLabv3+ are 89.95%, 94.58%, 96.60%, and 94.61%, respectively. The model Params and Flops are 5.91 M and 53.24 G, respectively. Compared to the original DeepLabv3+ model, this approach achieves improvements of 2.13%, 1.77%, 0.62%, and 1.27% in MIoU, MPA, PA, and MF1 and achieves reductions of 89.20% and 68.09% in Params and Flops, respectively. The above results indicate that by utilizing the semantic segmentation model proposed in this paper, it may be more convenient to deploy deep learning models in embedded devices. Additionally, through computer vision technology, it offers a potential method for better assessing the ripeness of fruits, such as sugar apples. This could contribute to the automated classification of fruits like sugar apples.
Furthermore, compared to other imaging methods, optical images not only possess real-time characteristics but are also more easily integrated with embedded devices, allowing the model to directly output the ripeness of sugar apples based on their visual appearance. In addition, we employed transfer learning techniques to initialize the model training weights [50], adopting a training strategy that combines freeze training and non-freeze training (30% freeze, 70% non-freeze), which maximizes the utilization of generic features learned on a large-scale dataset (vocdevkit2007), preserving these features by freezing lower-level weights. Subsequently, fine-tuning is performed on the target task to adapt to specific domain requirements. This training strategy not only expedites model convergence and mitigates overfitting risks but also enhances the model’s performance in real applications [51,52].
Compared to existing computer vision methods for detecting the ripeness of sugar apples, we have, for the first time, utilized semantic segmentation technology in our research; the proposed enhanced model demonstrates superior performance. On the other hand, by assigning semantic labels to each pixel in the image, we achieve pixel-level segmentation, providing more detailed information. However, it is worth noting that creating a dataset for semantic segmentation is more challenging and time consuming compared to datasets used in object detection.
In the future, we will explore how to reduce the model’s reliance on data scale through few-shot learning, aiming to decrease the workload associated with data collection and annotation. Additionally, we plan to deploy the proposed model in embedded devices to validate its performance in such environments. On the other hand, we also intend to investigate the performance of the proposed model in various fruit ripeness detection tasks, such as bananas, apples, and others.

5. Conclusions

This paper delves into the feasibility of using deep-learning-based computer vision methods for detecting different ripeness levels of harvested sugar apples. To meet the lightweight deployment requirements of embedded models and further enhance performance, a lightweight deep learning model named ECD-DeepLabv3+ is proposed, which is based on the best-performing DeepLabv3+ after comparing four well-known semantic segmentation models (U-Net, PSPNet, HRNet, and DeepLabv3+). By replacing the backbone with MobilNetV2, the complexity of the model has been greatly reduced. In addition, the combination of ECA, CA, and Dense ASPP modules has improved the performance of the model. The MIoU, MPA, PA, and MF1 values of the proposed model on the customized dataset are 89.95%, 94.58%, 96.60%, and 94.61% and the Params and Flops are 5.91 M and 53.24 G, respectively. In comparison to the original DeepLabv3+ model, this approach achieves reductions of 89.20% and 68.09% in Params and Flops, respectively. Simultaneously, on a custom dataset, it demonstrates improvements of 2.13%, 1.77%, 0.62%, and 1.27% in MIoU, MPA, PA, and MF1, respectively. Moreover, the ablation experiments show that each module is effective in the method proposed in this paper. Finally, through further experimentation on other publicly available datasets with DeepLabv3+ and ECD-DeepLabv3+, the superiority of our proposed model in terms of performance and complexity is further affirmed, making it better suited for embedded devices and offering a potential solution for digital agriculture.

Author Contributions

Conceptualization, Z.X. and Y.W.; Methodology, Z.X.; Validation, Z.X.; Investigation, Z.X. and Z.K.; Resources, W.W.; Data curation, Z.X., Z.K., K.C. and Y.W.; Writing—original draft preparation, Z.X., Y.W., Z.K. and K.C.; Writing—review and editing, Z.X., W.W. and Y.T.; Visualization, Z.X., Z.K. and K.C.; Supervision, W.W. and Y.T.; Project administration, W.W. and Z.X.; Funding acquisition, W.W. All authors have read and agreed to the published version of the manuscript.

Funding

This research was funded by the National Natural Science Foundation of China (Grant No. 82001983, 52275097); the Guangdong Basic and Applied Basic Research Foundation (Grant No. 2019A1515111202); the Science and Technology Program of Guangzhou, China (No. 202002030269); the Guangdong Science and Technology Innovation Strategy Special Funds (No. pdjh2024b302); and the Student Innovation Training Program of Guangzhou University (No. XJ202311078127). It is acknowledged that financial support also comes from the program of the China Scholarships Council (No. 202108440270) as well.

Institutional Review Board Statement

Not applicable.

Data Availability Statement

The dataset used in this research can be obtained upon reasonable request from the corresponding author. This dataset is not available to the public because of laboratory privacy concerns.

Conflicts of Interest

The authors declare no conflict of interest.

References

  1. Yousuf, B.; Qadri, O.S.; Srivastava, A.K. Recent developments in shelf-life extension of fresh-cut fruits and vegetables by application of different edible coatings: A review. LWT-Food Sci. Technol. 2018, 89, 198–209. [Google Scholar] [CrossRef]
  2. Heasley, C.; Clayton, B.; Muileboom, J.; Schwanke, A.; Rathnayake, S.; Richter, A.; Little, M. “I was eating more fruits and veggies than I have in years”: A mixed methods evaluation of a fresh food prescription intervention. Arch. Public Health 2021, 79, 16. [Google Scholar] [CrossRef] [PubMed]
  3. Davis, A.-A. Synthesizing Oral and Systemic Health in a Food Desert. J. Healthc. Sci. Humanit. 2019, 9, 51–67. [Google Scholar] [PubMed]
  4. Ma, L.; Zhang, M.; Bhandari, B.; Gao, Z.X. Recent developments in novel shelf life extension technologies of fresh-cut fruits and vegetables. Trends Food Sci. Technol. 2017, 64, 23–38. [Google Scholar] [CrossRef]
  5. Gargade, A.; Khandekar, S.A. IEEE: A Review: Custard Apple Leaf Parameter Analysis and Leaf Disease Detection using Digital Image Processing. In Proceedings of the 3rd International Conference on Computing Methodologies and Communication (ICCMC), Erode, India, 27–29 March 2019; IEEE: Piscataway, NJ, USA, 2019; pp. 267–271. [Google Scholar]
  6. Mo, Y.W.; Gong, D.Q.; Liang, G.B.; Han, R.H.; Xie, J.H.; Li, W.C. Enhanced preservation effects of sugar apple fruits by salicylic acid treatment during post-harvest storage. J. Sci. Food Agric. 2008, 88, 2693–2699. [Google Scholar] [CrossRef]
  7. Kumar, M.; Changan, S.; Tomar, M.; Prajapati, U.; Saurabh, V.; Hasan, M.; Sasi, M.; Maheshwari, C.; Singh, S.; Dhumal, S.; et al. Custard Apple (Annona squamosa L.) Leaves: Nutritional Composition, Phytochemical Profile, and Health-Promoting Biological Activities. Biomolecules 2021, 11, 614. [Google Scholar] [CrossRef] [PubMed]
  8. Yadav, S. Management of Oral Squamous Papilloma Using Annona squamosa (Custard Apple) Leaves: A Novel Case. Cureus J. Med. Sci. 2023, 15, e34806. [Google Scholar] [CrossRef]
  9. Kumari, N.; Prakash, S.; Kumar, M.; Radha; Zhang, B.H.; Sheri, V.; Rais, N.; Chandran, D.; Dey, A.; Sarkar, T.; et al. Seed Waste from Custard Apple (Annona squamosa L.): A Comprehensive Insight on Bioactive Compounds, Health Promoting Activity and Safety Profile. Processes 2022, 10, 2119. [Google Scholar] [CrossRef]
  10. Mosca, J.L.; Alves, R.E.; Filgueiras, H.A.C. Harvest and postharvest handling of sugar-apple and soursop: Current research status in Brazil and review of recommended techniques. In Proceedings of the International Symposium on Effect of Preharvest and Postharvest Factors on Storage of Fruit, Warsaw, Poland, 3–7 August 1997; International Society for Horticultural Science: Leuven, Belgium, 1997; pp. 273–280. [Google Scholar]
  11. Tian, H.-q.; Ying, Y.-b.; Lu, H.-s.; Fu, X.-p.; Yu, H.-y. Measurement of soluble solids content in watermelon by Vis/NIR diffuse transmittance technique. J. Zhejiang Univ. Sci. B 2007, 8, 105–110. [Google Scholar] [CrossRef] [PubMed]
  12. Abdullah, N.E.; Hashim, H.; Yusof, Y.W.M.; Osman, F.N.; Kusim, A.S.; Adam, M.S. IEEE: A Characterization of Watermelon Leaf Diseases using Fuzzy Logic. In Proceedings of the IEEE Symposium on Business, Engineering and Industrial Applications (ISBEIA), Bandung, Indonesia, 23–26 September 2012; IEEE: Piscataway, NJ, USA, 2012; pp. 1–6. [Google Scholar]
  13. Abdullah, N.E.; Hashim, H.; Sulaiman, M.F.; Madzhi, N.K.; Sampian, A.F.M.; Ismail, F.A. A Rudimentary Optical System in Detecting Ripeness of Red Watermelon. In Proceedings of the 4th International Conference on Electronic Devices, Systems and Applications (ICEDSA), Kuala Lumpur, Malaysia, 14–15 September 2015; Iop Publishing Ltd.: Bristol, UK, 2015. [Google Scholar]
  14. Hasanuddin, N.H.; Wahid, M.H.A.; Shahimin, M.M.; Hambali, I.; Nazir, N.S.; Khairuddin, N.Z.; Ramli, M.M.; Isa, S.S.M. Design and Development of ZnO Based Gas Sensor for Fruit Ripening Detection. In Proceedings of the 2nd International Conference on Green Design and Manufacture (IConGDM), Phuket, Thailand, 1–2 May 2016; E D P Sciences: Les Ulis, France, 2016. [Google Scholar]
  15. ArrÁZola, G.; Villadiego, F.; Alvis, A. Mechanical properties and simulation of finite element firmness in Carica papaya L. Tainung F1 cultivated on the high Sinu (Cordoba-Colombia). Rev. Colomb. Cienc. Hortícolas 2021, 15, e10809. [Google Scholar] [CrossRef]
  16. Phoophuangpairoj, R. Computerized Unripe and Ripe Durian Striking Sound Recognition Using Syllable-based HMMs. In Proceedings of the 2nd International Conference on Mechanics and Control Engineering (ICMCE 2013), Beijing, China, 1–2 September 2013; Trans Tech Publications Ltd.: Wollerau, Switzerland, 2013; pp. 927–935. [Google Scholar]
  17. González-Araiza, J.R.; Ortiz-Sánchez, M.C.; Vargas-Luna, F.M.; Cabrera-Sixto, J.M. Application of electrical bio-impedance for the evaluation of strawberry ripeness. Int. J. Food Prop. 2017, 20, 1044–1050. [Google Scholar] [CrossRef]
  18. Ji, W.; Pan, Y.; Xu, B.; Wang, J. A real-time apple targets detection method for picking robot based on ShufflenetV2-YOLOX. Agriculture 2022, 12, 856. [Google Scholar] [CrossRef]
  19. Ji, W.; Zhang, T.; Xu, B.; He, G. Apple recognition and picking sequence planning for harvesting robot in the complex environment. J. Agric. Eng. 2023, 55, 1549. [Google Scholar] [CrossRef]
  20. Kamilaris, A.; Prenafeta-Boldú, F.X. Deep learning in agriculture: A survey. Comput. Electron. Agric. 2018, 147, 70–90. [Google Scholar] [CrossRef]
  21. Li, K.S.; Wang, J.C.; Jalil, H.; Wang, H. A fast and lightweight detection algorithm for passion fruit pests based on improved YOLOv5. Comput. Electron. Agric. 2023, 204, 107534. [Google Scholar] [CrossRef]
  22. Xiao, B.J.; Nguyen, M.; Yan, W.Q. Apple ripeness identification from digital images using transformers. Multimed. Tools Appl. 2023, 83, 7811–7825. [Google Scholar] [CrossRef]
  23. Appe, S.N.; Arulselvi, G.; Balaji, G.N. CAM-YOLO: Tomato detection and classification based on improved YOLOv5 using combining attention mechanism. PeerJ Comput. Sci. 2023, 9, e1463. [Google Scholar] [CrossRef] [PubMed]
  24. Kim, S.J.; Jeong, S.; Kim, H.; Jeong, S.; Yun, G.Y.; Park, K. IEEE: Detecting Ripeness of Strawberry and Coordinates of Strawberry Stalk using Deep Learning. In Proceedings of the 13th International Conference on Ubiquitous and Future Networks (ICUFN), Electr Network, Barcelona, Spain, 5–8 July 2022; IEEE: Piscataway, NJ, USA, 2022; pp. 454–458. [Google Scholar]
  25. Zhao, Z.; Hicks, Y.; Sun, X.F.; Luo, C.X. Peach ripeness classification based on a new one-stage instance segmentation model. Comput. Electron. Agric. 2023, 214, 108369. [Google Scholar] [CrossRef]
  26. Sanchez, R.B.; Angelo, C.; Esteves, J.; Linsangan, N.B. Determination of Sugar Apple Ripeness via Image Processing Using Convolutional Neural Network. In Proceedings of the 2023 15th International Conference on Computer and Automation Engineering (ICCAE), Sydney, Australia, 3–5 March 2023; pp. 333–337. [Google Scholar]
  27. Peng, H.X.; Xue, C.; Shao, Y.Y.; Chen, K.Y.; Xiong, J.T.; Xie, Z.H.; Zhang, L.H. Semantic Segmentation of Litchi Branches Using DeepLabV3+ Model. IEEE Access 2020, 8, 164546–164555. [Google Scholar] [CrossRef]
  28. Al-Abri, A.S.; Mahgoub, O.; Kadim, I.T.; Al-Marzooqi, W.; Goddard, S.R. Effects of feeding fish-wheat bran meal on performance and meat quality of Omani sheep. J. Appl. Anim. Res. 2017, 45, 234–238. [Google Scholar] [CrossRef]
  29. Choi, W.; Cha, Y.J. SDDNet: Real-Time Crack Segmentation. IEEE Trans. Ind. Electron. 2020, 67, 8016–8025. [Google Scholar] [CrossRef]
  30. Feng, C.C.; Zhang, H.; Wang, H.R.; Wang, S.; Li, Y.L. Automatic Pixel-Level Crack Detection on Dam Surface Using Deep Convolutional Network. Sensors 2020, 20, 2069. [Google Scholar] [CrossRef] [PubMed]
  31. Xu, Y.Q.; Xu, G.X.; An, Z.L.; Liu, Y.B. EPSTO-ARIMA: Electric Power Stochastic Optimization Predicting Based on ARIMA. In Proceedings of the 2021 IEEE 9th International Conference on Smart City and Informatization (iSCI), Shenyang, China, 18–22 October 2021; IEEE: Piscataway, NJ, USA, 2021; pp. 70–75. [Google Scholar]
  32. Mumuni, A.; Mumuni, F. Data augmentation: A comprehensive survey of modern approaches. Array 2022, 16, 100258. [Google Scholar] [CrossRef]
  33. Ronneberger, O.; Fischer, P.; Brox, T. U-Net: Convolutional Networks for Biomedical Image Segmentation. In Proceedings of the 18th International Conference on Medical Image Computing and Computer-Assisted Intervention (MICCAI), Munich, Germany, 5–9 October 2015; Springer International Publishing Ag: Cham, Switzerland, 2015; pp. 234–241. [Google Scholar]
  34. Wang, J.D.; Sun, K.; Cheng, T.H.; Jiang, B.R.; Deng, C.R.; Zhao, Y.; Liu, D.; Mu, Y.D.; Tan, M.K.; Wang, X.G.; et al. Deep High-Resolution Representation Learning for Visual Recognition. IEEE Trans. Pattern Anal. Mach. Intell. 2021, 43, 3349–3364. [Google Scholar] [CrossRef] [PubMed]
  35. Zhao, H.S.; Shi, J.P.; Qi, X.J.; Wang, X.G.; Jia, J.Y. IEEE: Pyramid Scene Parsing Network. In Proceedings of the 30th IEEE/CVF Conference on Computer Vision and Pattern Recognition (CVPR), Honolulu, HI, USA, 21–26 July 2017; IEEE: Piscataway, NJ, USA, 2017; pp. 6230–6239. [Google Scholar]
  36. Chen, L.C.E.; Zhu, Y.K.; Papandreou, G.; Schroff, F.; Adam, H. Encoder-Decoder with Atrous Separable Convolution for Semantic Image Segmentation. In Proceedings of the 15th European Conference on Computer Vision (ECCV), Munich, Germany, 8–14 September 2018; Springer International Publishing Ag: Cham, Switzerland, 2018; pp. 833–851. [Google Scholar]
  37. Sandler, M.; Howard, A.; Zhu, M.L.; Zhmoginov, A.; Chen, L.C. IEEE: MobileNetV2: Inverted Residuals and Linear Bottlenecks. In Proceedings of the 31st IEEE/CVF Conference on Computer Vision and Pattern Recognition (CVPR), Salt Lake City, UT, USA, 18–23 June 2018; IEEE: Piscataway, NJ, USA, 2018; pp. 4510–4520. [Google Scholar]
  38. Wang, Q.; Aramoon, O.; Qiu, P.F.; Qu, G. IEEE: Efficient Transfer Learning on Modeling Physical Unclonable Functions. In Proceedings of the 21st International Symposium on Quality Electronic Design (ISQED), Santa Clara, CA, USA, 25–26 March 2020; IEEE: Piscataway, NJ, USA, 2020; pp. 1–6. [Google Scholar]
  39. Hou, Q.B.; Zhou, D.Q.; Feng, J.S.; Ieee Comp, S.O.C. Coordinate Attention for Efficient Mobile Network Design. In Proceedings of the IEEE/CVF Conference on Computer Vision and Pattern Recognition (CVPR), Electr Network, Virtual, 19–25 June 2021; IEEE Computer Soc: Piscataway, NJ, USA, 2021; pp. 13708–13717. [Google Scholar]
  40. Fu, H.X.; Meng, D.; Li, W.H.; Wang, Y.C. Bridge Crack Semantic Segmentation Based on Improved Deeplabv3+. J. Mar. Sci. Eng. 2021, 9, 671. [Google Scholar] [CrossRef]
  41. Mainasara, M.M.; Abu Bakar, M.F.; Mohamed, M.; Linatoc, A.C.; Sabran, F. Sugar Apple—Annona squamosa Linn. In Exotic Fruits; Rodrigues, S., de Oliveira Silva, E., de Brito, E.S., Eds.; Academic Press: Cambridge, MA, USA, 2018; pp. 397–402. [Google Scholar] [CrossRef]
  42. Roy, K.; Chaudhuri, S.S.; Pramanik, S. Deep learning based real-time Industrial framework for rotten and fresh fruit detection using semantic segmentation. Microsyst. Technol. 2021, 27, 3365–3375. [Google Scholar] [CrossRef]
  43. Fang, H.R.; Deng, J.; Bai, Y.X.; Feng, B.; Li, S.; Shao, S.Y.; Chen, D.S. CLFormer: A Lightweight Transformer Based on Convolutional Embedding and Linear Self-Attention with Strong Robustness for Bearing Fault Diagnosis Under Limited Sample Conditions. IEEE Trans. Instrum. Meas. 2022, 71, 8. [Google Scholar] [CrossRef]
  44. He, Y.; Wang, Y.F.; He, L.L.; Pan, G.Y.; Ma, H. IEEE: ART: An Efficient Transformer with Atrous Residual Learning for Medical Images. In Proceedings of the IEEE International Conference on Multimedia and Expo (ICME), Brisbane, Australia, 10–14 July 2023; IEEE: Piscataway, NJ, USA, 2023; pp. 1907–1912. [Google Scholar]
  45. Wang, C.S.; Du, P.F.; Wu, H.R.; Li, J.X.; Zhao, C.J.; Zhu, H.J. A cucumber leaf disease severity classification method based on the fusion of DeepLabV3+and U-Net. Comput. Electron. Agric. 2021, 189, 106373. [Google Scholar] [CrossRef]
  46. Dias, P.A.; Tabb, A.; Medeiros, H. Apple flower detection using deep convolutional networks. Comput. Ind. 2018, 99, 17–28. [Google Scholar] [CrossRef]
  47. Kolhar, S.; Jagtap, J. Convolutional neural network based encoder-decoder architectures for semantic segmentation of plants. Ecol. Inform. 2021, 64, 101373. [Google Scholar] [CrossRef]
  48. Hussein, B.R.; Malik, O.A.; Ong, W.H.; Slik, J.W.F. Automated Extraction of Phenotypic Leaf Traits of Individual Intact Herbarium Leaves from Herbarium Specimen Images Using Deep Learning Based Semantic Segmentation. Sensors 2021, 21, 4549. [Google Scholar] [CrossRef] [PubMed]
  49. Li, Q.W.; Jia, W.K.; Sun, M.L.; Hou, S.J.; Zheng, Y.J. A novel green apple segmentation algorithm based on ensemble U-Net under complex orchard environment. Comput. Electron. Agric. 2021, 180, 105900. [Google Scholar] [CrossRef]
  50. Xu, Y.L.; Zhao, B.; Zhai, Y.T.; Chen, Q.Y.; Zhou, Y. Maize Diseases Identification Method Based on Multi-Scale Convolutional Global Pooling Neural Network. IEEE Access 2021, 9, 27959–27970. [Google Scholar] [CrossRef]
  51. Emami, S.; Martínez-Muñoz, G. A Gradient Boosting Approach for Training Convolutional and Deep Neural Networks. IEEE Open J. Signal Process. 2023, 4, 313–321. [Google Scholar] [CrossRef]
  52. Yang, H.; Weng, F.Z.; Anderson, K. Estimation of ATMS Antenna Emission From Cold Space Observations. IEEE Trans. Geosci. Remote Sens. 2016, 54, 4479–4487. [Google Scholar] [CrossRef]
Figure 1. Some images from the self-made dataset.
Agriculture 14 00591 g001
Figure 2. Effects of horizontal flipping, vertical flipping, and brightness adjustments.
Agriculture 14 00591 g002
Figure 3. Four well-known semantic segmentation models. (a) U-Net, (b) HRNet, (c) PSPNet, (d) DeepLabv3.
Agriculture 14 00591 g003
Figure 4. Architecture of the proposed ECD-DeepLabv3+.
Agriculture 14 00591 g004
Figure 5. Inverted residual block of MobilenetV2.
Agriculture 14 00591 g005
Figure 6. Efficient channel attention module.
Agriculture 14 00591 g006
Figure 7. Coordinate attention module.
Agriculture 14 00591 g007
Figure 8. ASPP and Dense ASPP of DeepLabv3+ (a) ASPP, (b) Dense ASPP.
Agriculture 14 00591 g008
Figure 9. Illustration of atrous convolution. (a) One-dimensional atrous convolution, (b) One-dimensional atrous convolution with the densely linked method, (c) Two-dimensional atrous convolution with the densely linked method.
Agriculture 14 00591 g009
Figure 10. Training process. (a) Loss curves, (b) Accuracy curves.
Agriculture 14 00591 g010
Figure 11. Results of various evaluation indicators in each category of ECD-Deeplabv3+.
Agriculture 14 00591 g011
Figure 12. Segmentation results on the clean background.
Agriculture 14 00591 g012
Figure 13. Segmentation results on the complex background.
Agriculture 14 00591 g013
Figure 14. Images for each category in the open-source dataset.
Agriculture 14 00591 g014
Figure 15. The training curves of the metrics in other datasets. (a) Accuracy, (b) MPA, (c) MIoU, (d) MF1.
Agriculture 14 00591 g015
Table 1. Number of images for each category in the dataset (except background).
CategoryTrain (Original)Train (Augmented)ValTestTotal (Original)Total (Augmented)
Unripe4498981621577681217
Ripe59511901961959861581
Bad50210041871818701372
Other (Kiwifruit)50310061461457941297
Other (Pineapple)2314627788396627
Other (Total)58111621561989351516
Background600120020020010001600
Table 2. Receptive field of ASPP and Dense ASPP (kernel size = 3).
ASPPDense ASPP
Atrous RateReceptive FieldAtrous RateReceptive Field
6136, 1237
122512, 1861
18376, 12, 1873
Table 3. Experimental platform’s environment settings.
ParameterConfiguration
CPUIntel Xeon E5-2678 V3 processor
GPUNVIDIA GeForce RTX 3090
CUDA versionCUDA 12.2
Operating systemWindows 10
Programming languagePython 3.9
Deep learning frameworkPytorch 2.0.0
Table 4. Experimental hyperparameter settings.
ParameterFreeze TrainUnfreeze Train
Epoch3070
Batch size 84
OptimizerSGDSGD
Min learning rate7 × 10−57 × 10−5
Table 5. Performance of the six models.
ModelMIoU (%)MPA (%)PA (%)MF1 (%)Params (M)Flops (G)
U-Net87.0393.2295.7792.8624.89451.77
HRNet86.5593.0195.392.5729.5490.97
PSPNet87.5592.4195.5693.2546.71118.43
DeepLabv3+ (Xception)87.82 92.81 95.98 93.34 54.71 166.86
DeepLabv3+ (MobileNetv2)88.26 93.46 96.0593.625.8152.89
ECD-DeepLabv3+ (Ours)89.9594.5896.694.615.9153.24
Table 6. Results of the ablation experiments.
MethodMobileNetv2ECACA Dense MIoU (%)MPA (%)PA (%)MF1 (%)Params (M)Flops (G)
(1) 87.82 92.81 95.98 93.34 54.71 166.86
(2) 88.26 93.46 96.05 93.62 5.81 52.89
(3) 88.69 93.72 96.20 93.88 5.81 52.89
(4) 88.98 93.79 96.25 94.04 5.83 52.89
(5) 89.05 93.84 96.27 94.10 5.90 53.23
(6)89.95 94.58 96.60 94.61 5.91 53.24
Table 7. Performance of DeepLabv3+ and ECD-DeepLabv3+ on open-source dataset.
ModelMIoU (%)MPA (%)PA (%)MF1 (%)Params (M)Flops (G)
DeepLabv3+98.0399.0699.3599.0054.71 166.86
ECD-DeepLabv3+98.0899.0899.3599.035.91 53.24
Disclaimer/Publisher’s Note: The statements, opinions and data contained in all publications are solely those of the individual author(s) and contributor(s) and not of MDPI and/or the editor(s). MDPI and/or the editor(s) disclaim responsibility for any injury to people or property resulting from any ideas, methods, instructions or products referred to in the content.

