Abstract
Prickly pears (Opuntia ficus-indica), which are well known for their beneficial properties for human health, are the subject of many studies due to their high content of bioactive compounds. However, the presence of spines on the fruit’s surface is a factor that limits consumption. Therefore, the viability and nutritional quality of peeled and packaged white, orange, and pink prickly pears were studied during storage. Refrigerated whole fruits stored at 8 °C and 85% RH for 0, 1, 2, 3, or 4 weeks were electrically peeled and packaged with micro-perforated film. At each time point, their microbial quality; physical parameters, such as hardness, texture, and color; and chemical parameters, including pH, titratable acidity, total soluble solids content, sugar content, ascorbic acid content, antioxidant capacity, and total phenol content, were analyzed. The mesophilic aerobic counts were lower than the values established by Spanish legislation (7 log (CFU/g f.w.)) until day 8 after packaging (or until day 6 after 4 weeks of storage). The hardness, texture, pH, sugar content, ascorbic acid content, and antioxidant capacity decreased significantly between day 0 and day 8 after packaging, independently of the number of weeks for which the whole fruits had been refrigerated previously. Furthermore, the changes in the parameters analyzed for whole fruits during storage were less remarkable. The evaluation of the sensory features was positive throughout the preserved period. The minimally processed prickly pears retained suitable microbial, nutritional, and sensory qualities when the whole fruits had been refrigerated for 1, 2, 3, or 4 weeks, facilitating their management in small processing companies.
1. Introduction
Minimally processed fruits and vegetables have gained consumers’ attention and demand due to their fresh-like characteristics, safety, nutritional quality, health properties, and convenience [1,2]. Opuntia fruits are rich in fiber, minerals, vitamins, and a wide variety of compounds with antioxidant capacity, such as phenolics, flavonoids, and betalains, which have a potential preventive effect against chronic diseases and contribute to the control of hyperglycemia or high blood cholesterol levels [3,4,5,6]. Furthermore, recent research has reported that the antioxidants from pink, orange, and white prickly pear varieties native to the Canary Islands maintain stability as they pass through the gastrointestinal tract and are readily absorbed by the human body. [7]. However, the presence of spines and glochids on the fruit’s surface reduces the commercialization of these cactus fruits; thus, ready-to-eat (fresh-cut) cactus fruits have a higher demand in the market than whole fruits [8].
Nevertheless, the commercialization of minimally processed prickly pears faces some problems, as they are more perishable than raw materials due to the exposure of tissues to light and oxygen, increased enzyme activity, biochemical changes, and microbial proliferation [2,9]. In addition, seasonality in the production and harvest of prickly pears must be taken into account. In the Canary Islands (Spain), prickly pears are harvested from July to February, depending on the area and altitude of the growing location. Moreover, it is well known that adequate storage conditions postharvest enable the fruits to maintain optimal characteristics for an extended period, thus increasing their shelf life and the temporary availability of fruits in the markets. Therefore, processing industries can be supplied with these fruits for longer periods, thus achieving the production of minimally processed prickly pears that are safe and have a high quality. Gómes and Camelo [10] reported that tomatoes stored at 12 °C in a controlled atmosphere for 21 days retained the optimal characteristics of color and firmness according to the consumers’ preferences. Likewise, Ulloa et al. [11] observed that pineapples stored at 7.5 °C for 21 days and, subsequently, at 18 °C for 4 days showed a higher chlorophyll content and fewer external color changes, a lower respiration rate and less weight loss and mold development than those stored at 15 °C for 21 days.
The selection of optimal conditions for the conservation of minimally processed prickly pears will keep the microbial and nutritional qualities of the fruits high until consumption. In a previous study, these conditions were evaluated, and it was observed that the sanitization of fruits with cold chlorinated water (200 mg/kg); peeling with an electric peeler instead of manually with a knife; packaging with micro-perforated film (polypropylene, 52 µm, supplied by Amcor Flexibles, Burgos, Spain, with a permeability to O2 and CO2 of 19,200 mL/m−1 d atm; and cold storage at 7 °C extended the shelf life of the product by 8 days. In addition, electrically peeled prickly pears retain some of the pericarp, which has a high content of ascorbic acid and total phenolics, according to our previous study [12]. According to many authors, the most effective methods for prolonging the postharvest storage of fruits and vegetables are using modified atmosphere packaging (MAP) and a controlled atmosphere (CA), but these may not be affordable for all products [13]. The use of edible films and coatings, calcium salt applications, ultraviolet radiation, and cold storage are also widely used preservation techniques for minimally processed products [14,15]. Numerous authors have reported that the application of suitable preservation techniques enables products, for example, cactus pears [16], mangoes [17], pineapples [18], and lychees [19], among others, to obtain similar characteristics to fresh products, with a shelf life of 7–13 days.
The seasonality of prickly pears leads to the study of the maximum storage time of whole fruits until they are minimally processed so that the commercial life of the product is not compromised in terms of nutritional and hygienic–sanitary qualities. Moreover, the procedure and technologies used for fruit preservation ought to be simple and accessible for small- and medium-sized companies.
In this work, we have studied the microbiological and nutritional viability of minimally processed prickly pears after 1, 2, 3, or 4 weeks of storage as whole products in a cold chamber. The results obtained may contribute to revaluing these fruits and increase their processing and consumption.
2. Materials and Methods
2.1. Plant Material, Sample Preparation, Packaging, and Storage
Prickly pears (O. ficus-indica L. Mill.) were collected from a private commercial farm managed by a local farmer located in Fasnia, Tenerife, Spain (28°14′10.97″ N, 16°26′19.9″ W, 478 m above sea level), in August 2019. This is a rainfed crop with limited irrigation throughout the year. About 20 kg of different colored (white, orange, and pink, locally known as “Blanco”, “Colorado”, and “Morado”, respectively) flesh prickly pears were harvested. Healthy fruits and without any damage were selected to ensure optimal quality and duration throughout the storage time of the study.
Cold chlorinated water (200 mg/kg, pH 6.5–7.5) was used to wash the fruits. After washing and air-drying, the fruits were stored in a cold chamber at 8 °C and 85% relative humidity (RH) for 4 weeks. Before cold storage, the whole fruits were minimally processed into six to nine trays. Then, after each storage week (1, 2, 3, and 4 weeks), the whole fruits were processed. The fruits were mechanically peeled (Orange Peel, Pelamatic S.L., Valencia, Spain), and the fruits’ distal parts were cut manually. The peeled fruits were washed for 1 min in cold, chlorinated water (50 mg/kg), packed in plastic trays (polypropylene, 172 mm × 130 mm × 50 mm, Technopak Plastics S.L., Barcelona, Spain), and sealed with micro-perforated film (polypropylene, 52 µm, with a permeability to O2 and CO2 of 19,200 mL/m−1 d atm, supplied by Amcor-Flexibles, Burgos, Spain). The minimally processed prickly pear trays were analyzed on the day of preparation and after 1, 3, 6, and 8 days of cold storage.
The samples were differentiated by the following factors: white, orange, and pink prickly pears; the number of weeks of whole fruit storage (from 1 to 4 weeks); and the storage time of the minimally processed prickly pears (from 1 to 8 days).
2.2. Proximate Composition Analysis
In order to globally characterize the plant material, analysis of the centesimal composition of each prickly pear variety was conducted in accordance with The Official Methods of the Association of Official Analytical Chemists (AOAC, 2016) [20]. Moisture was determined using the oven-drying method (AOAC method 952.08) and ash by incineration at 550 °C until a constant weight was obtained (AOAC method 930.30).
Approximately 4 g of dried sample was weighed into an extraction cartridge to determine the fat content; this was introduced into a Soxhlet extraction system (Buchi E-816, Flawil, Switzerland, and the samples were extracted with petroleum ether (AOAC method 948.15). Crude protein was determined from the nitrogen content according to the Kjeldahl method (AOAC method 992.23). A total of 0.2 g of dried sample was weighed and introduced into the digestion system at 400 °C (Kejldatherm KB8S Gerhardt, Königswinter, Germany). The solution obtained was diluted and introduced into the distillation system (Vadopest 300 Gerhardt, Königswinter, Switzerland). Dietary fiber was determined according to the enzymatic gravimetric method (AOAC method 985.29). A total of 1 g of dry sample was weighedand digested with heat using α-amylase, protease, and amyloglucosidase (Megazyme International Ireland, Bray, Ireland). Subsequently, the soluble fiber was precipitated by adding ethanol (95%). The filtration process was carried out using a fiber analyzer system (Fibertec system E, Barcelona, Spain). All the results are expressed as a percentage (g/100 g of fresh weight, f.w.).
2.3. Physicochemical Analyses
The physicochemical parameters of the minimally processed prickly pears were studied throughout the days of storage (from 0 to 8 days), taking into account the time for which the whole fruits were previously cold-stored (from 1 to 4 weeks).
The texture (N·s/g f.w.) was analyzed using a Kramer cell (TA-HD-Plus, Aname, Madrid, Spain), and hardness (expressed as °Durofel) was determined using a durometer (Durofel, Agro-Technologie, Tarascon, France). A Minolta Chroma Meter CR-300 (Konica Minolta, Inc., Wheeling, WV, USA) was used to measure the color parameters (L, a*, and b*) through a transparent tray. Based on the previously measured parameters, the hue angle (H° = tan−1 (b*/a*)), chroma (C* = [(a*)2 + (b*)2]0.5), Browning index or color loss (∆E = [(L* − L*i)2 + (a* − a*i)2 + (b* − b*i)2]0.5), and whiteness index (WI = 100 − [(100 − L*)2 + (a*)2 + (b*)2]0.5) [21] were calculated.
The samples from each storage time were minced and homogenized for chemical analysis. In accordance with the official AOAC methods, the total soluble solids (TSS) content (AOAC method 932.12) (Refractometer ATC-1, ATAGO, Tokyo, Japan), pH (AOAC method 981.12), and total acidity (TA) (AOAC method 942.15) (Titralab AT1000, Düsseldorf, Germany) were determined [20,22]. Sugar contents were determined via high-performance liquid chromatography (HPLC) [23] (Waters 2690 HPLC, Waltham, MA, USA) and are expressed as a percentage (g/100 g f.w.).
2.4. Microbiological Analysis
In order to evaluate the microbial quality and, therefore, the commercial life of the minimally processed prickly pears, aerobic mesophiles, psychrophiles, and mold and yeast loads were analyzed at each storage time. A total of 54 mL of 0.1% peptone water was used to homogenize 6 g of the sample (Stomacher 80 Biomaster, Seward Limited, High Salvington, UK). Plate count agar (PCA) was used to inoculate the aerobic mesophiles and psychrophiles. The aerobic mesophiles were incubated at 30 °C for 72 h, and the psychrophiles were incubated at 5 °C for 7 days. The molds and yeasts were inoculated and incubated in Glucose Chloramphenicol Agar (GCA) at 25 °C for 5 days. The results of the microbiological counts are expressed as log(colony-forming units (CFU)/g f.w.) and were compared with the legal values according to the Spanish legislation regarding minimally processed vegetables [24].
2.5. Sensorial Evaluation
A group of 15 regular consumers of prickly pears conducted the sensory evaluation of the minimally processed prickly pears at 0, 1, 3, 6, and 8 days of storage. This evaluation process was repeated for the minimally processed prickly pears previously stored as whole fruits for 1, 2, 3, or 4 weeks. Other authors reported a similar number of panelists [12,18,25,26,27]. Fruit slices between 0.5 and 1 cm thick were served in an isolated and illuminated area at room temperature (20 °C).
According to a linear scale from 0 (non-acceptable) to 10 (very acceptable) points, the sensory attributes of color, smell, taste, and overall acceptability were evaluated to compare the preferences of the panelists for the prickly pears at 0 days (control) and 8 days of minimal processing. On the other hand, the panelists were asked for a description of the fruits’ color (pale, normal/bright, or brown), sweetness (tasteless, normal, or very sweet), smell (unpleasant, normal, or pleasant), and texture (hard, normal, or slimy), and they decided on whether they would buy the product or not.
2.6. Gas Composition
The gas composition (% CO2 and% O2) inside the trays was determined using a compact PBI Dansensor Checkmate 9900 (Madrid, Spain). The measurements were carried out using a septum fixed to the unopened trays.
2.7. Bioactive Compounds and Antioxidant Capacity Analysis
Ascorbic acid was extracted using a metaphosphoric acid solution (3%, w/w) and was determined by using the 2,6-dichlorophenol indophenol titration procedure (AOAC method 967.21) [20]. The total phenolic content was determined in extracts of 1 g of pulp with 10 mL of 80% methanol according to the Folin–Ciocalteu method, and the results are expressed as mg of gallic acid equivalents, (GAE)/100 g f.w. [28]. The antioxidant capacity was determined for the same extract by using free radical DPPH (2,2-diphenyl-1-picryl hydrazyl) [29], and the results are expressed as mg of Trolox (6-hydroxy-2,5,7,8-tetramethylchroman-2-carboxylic acid) equivalents, (TE)/100 g f.w.
2.8. Data Presentation and Statistical Analysis
All the tests were carried out in triplicate. All the data are expressed as mean ± standard deviation (SD). SPSS version 25.0 (SPSS Inc., Chicago, IL, USA) software was used for data analysis. The obtained results were evaluated with analysis of variance (ANOVA), and the significant differences among samples were determined using Duncan’s multiple range test at a 5% level of significance in homogeneous groups established according to the dependent variable (days of storage as minimally processed prickly pears, weeks of storage in a refrigerated chamber as whole fruit, and the pulp color of the prickly pears).
2.9. Ethical Statements
All the subjects gave informed consent for inclusion before they participated in the study. The study was conducted in accordance with the Declaration of Helsinki, and the protocol was approved by the Brazilian Ethics Committee under number 845 894/2014.
3. Results and Discussion
3.1. Plant Material Characterization
The white prickly pears were slightly smaller (medium weight of 112 ± 12 g) than the orange and pink prickly pears (medium weights of 123 ± 13 g and 147 ± 17 g, respectively). The results of proximate composition analysis (Table 1) showed a greater similarity between the orange and pink prickly pears compared to the white ones.

Table 1.
Percentage (g/100 g f.w.) of protein, fat, ash, total dietary fiber, and moisture of the varieties of prickly pears (Opuntia ficus-indica) used in the study.
3.2. Microbiological Analysis
The mesophile load for the limited commercial life of the three varieties of minimally processed prickly pears was tested via assays. After 0, 1, 2, and 3 weeks of previous storage as a whole, refrigerated product, the minimally processed prickly pears did not exceed the limit counts (7 log(CFU/g f.w.)) established in Spain for ready-to-eat fruits and vegetables according to the Real Decreto 3484/2000 [24] in any case. However, the minimally processed prickly pears obtained after 4 weeks of storage showed counts higher than those allowed by legislation from 8 days of storage (Figure 1). The preservation time of the whole fruits increased the aerobic mesophile load significantly in the minimally processed prickly pears, regardless of the variety. Likewise, significant differences were observed in the microbiological counts between the initial day and day 8 of packaging. The psychrophilic and mold and yeast counts increased significantly with the storage time, but remained at counts lower than 7 log(CFU/g f.w.) in all the cases (Table 2). Some authors reported similar results in yeast counts for fruit stored at 4 °C until the eighth day of storage in a controlled atmosphere and until the end of the storage time in a modified atmosphere [30]. Aghdam and Bodbodak [31] and Acuña et al. [32] reported that low-temperature storage is commonly employed as a postharvest technique for delaying senescence in vegetables and ornamentals, upholding their postharvest quality, and this constitutes the basis of the conservation and protection technology for fresh fruit and vegetable products. Minimally processed vegetables require the maintenance of the “cold chain” during production and distribution as an essential condition for their adequate conservation, with a shelf life of around 7 days [33]. Other authors reported an increase in the mesophile and psychrophile counts after 13 days of storage [8] in prickly pears packed in a passive, modified atmosphere. According to Allegra et al. [30], mesophilic aerobic microorganisms have the highest count after 12 days of storage for minimally processed prickly pears. Palma et al. [34] and Piga et al. [9] reported the remarkable proliferation of microorganisms during the storage time for minimally processed prickly pears.
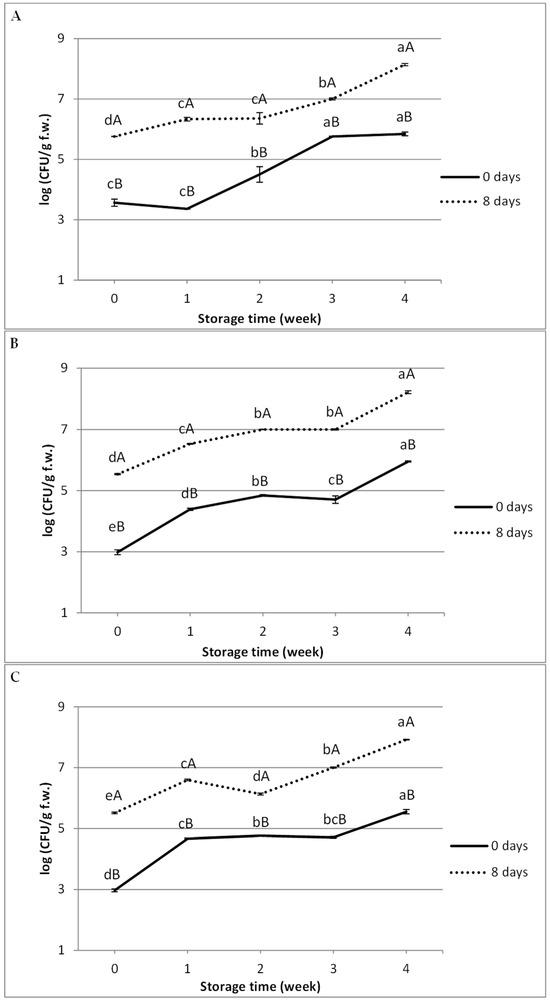
Figure 1.
Evolution of aerobic mesophiles in white (A), orange (B), and pink (C) minimally processed prickly pears. The different lowercase letters indicate significant differences between storage weeks (p < 0.05), and the different capital letters indicate significant differences between 0 and 8 days of storage for minimally processed prickly pears (p < 0.05).
Table 2.
Evolution of psychrophiles, mold, and yeast in white, orange, and pink minimally processed prickly pears.
3.3. Sensorial Evaluation
Figure 2 shows that the minimally processed fruits at the beginning and the expiration day were very similar when non refrigerated whole fruits or those stored for 4 weeks were used. The panelists gave similar scores for the overall appearance, color, taste, and smell of the minimally processed prickly pears at the beginning (0 days) and on the expiration day (8 days, or 6 days in the case of whole fruits stored for 4 weeks) (Figure 3), regardless of the number of weeks for which the unprocessed whole fruits were stored. The average scores were 6.6 ± 0.8, 6.9 ± 0.9, and 7.2 ± 0.9 for the minimally processed white prickly pears after 0, 2, and 4 weeks of storage as unprocessed fruits, respectively. In the case of the orange variety, the scores were 7.7 ± 0.9, 7.6 ± 0.5, and 8.0 ± 0.5, respectively, and the pink prickly pears were scored 7.6 ± 0.7, 7.5 ± 0.7, and 7.2 ± 0.6, respectively. The tasters gave scores of higher than six for the minimally processed prickly pears in all the cases.

Figure 2.
Appearance of minimally processed prickly pears at the beginning and the end of the cold storage using (A) fruits without any cold storage (control) and (B) fruits refrigerated for 4 weeks.
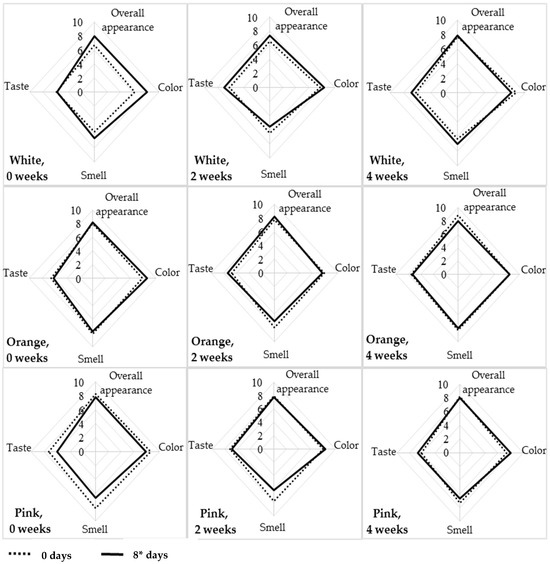
Figure 3.
Evaluation of the color, smell, taste, and overall appearance of white, orange, and pink minimally processed prickly pears at 0 and 8* days after processing (6 days for those stored for 4 weeks microbiological limit).
Table 3 shows the tasters’ responses to whether they would buy the minimally processed prickly pears. In general, the acceptance of the minimally processed prickly pears did not decrease with both the storage of the whole fruits and the days after preparation. The tasters preferred the orange and pink prickly pears over the white version, regardless of the storage times.
Table 3.
Tasters’ responses to whether they would buy the minimally processed prickly pears (%).
3.4. Gas Composition
Figure 4 shows a decrease in O2 concentration and an increase in CO2 concentration between days 0 and 8 of storage for the minimally processed prickly pears in all the cases (from weeks 0 to 4). An inversely proportional relationship was observed between the O2 and CO2 concentrations. On the other hand, the gas concentrations inside the trays were significantly different according to the number of weeks that the whole fruits were stored.
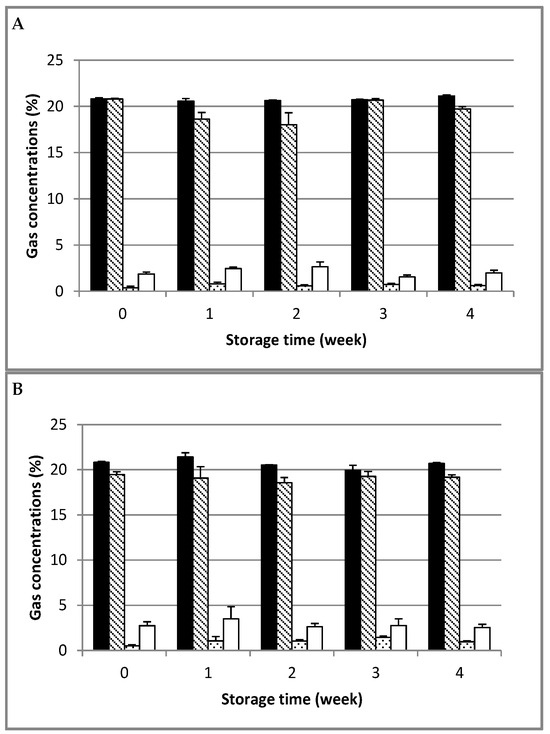
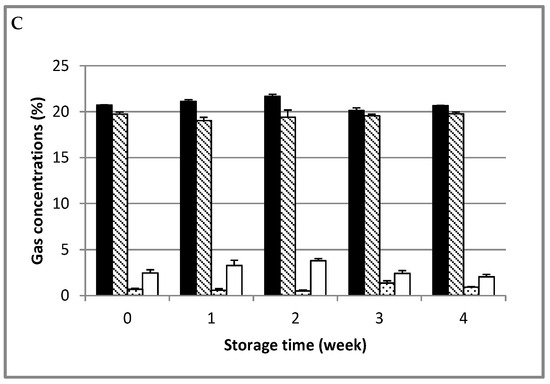
Figure 4.
O2 (black and diagonal lines columns) and CO2 (dots and white columns) concentration evolution inside white (A), orange (B), and pink (C) minimally processed prickly pear trays.
The O2 concentration was greater than 18.0%, and the CO2 concentration was less than 3.8% in all the cases. The fresh-cut cactus pears’ shelf-life, quality, safety, and acceptability are influenced by low O2 and high CO2 concentrations in the bags [8,30]. According to García and Barret [31], it is important to avoid low levels of O2 and high levels of CO2, which lead to anaerobic respiration, resulting in the development of off-flavors and off-odors and increasing the susceptibility to decay.
3.5. Physicochemical Analyses
3.5.1. Color
The brightness (L) values were significantly different depending on the number of weeks for which the whole fruits were stored, except for the pink prickly pears at 0 days. Nevertheless, no clear trend was observed for the increase or decrease in this parameter (Table 4). These differences can be explained by the nature of the fruits processed at each time. In addition, the L values of the pink and orange minimally processed prickly pears were significantly lower at 0 days than they were at 8 days of processing after 1 and 3 weeks of storage as whole fruits and after 2 and 4 weeks, respectively, while in the case of white prickly pears, there were significant L value differences, but these did not follow a clear trend. In general, the L values tend to stabilize as the number of weeks stored as an unprocessed product increases.
Table 4.
Evolution of color parameters (L, H°, C*, and WI) in white, orange, and pink minimally processed prickly pears.
The tonality (H°) of fruits after 8 days was significantly different depending on the number of weeks they had been stored as whole fruits. However, in general, the tonality remained constant in the minimally processed prickly pears at 0 days. In the case of the white prickly pears, a significant decrease in H° values was observed between the initial and final days of storage (except for week 3), while for the orange variety, the H° values did not show significant differences; for the pink variety, the behavior of this parameter was very variable. Aguayo et al. [35] reported no significant decrease in the H° values for fresh-cut apple slices under modified atmosphere conditions over 28 days. In general, the chromaticity (C*) values remained constant between 0 and 8 days of minimally processed fruit storage for the white and pink prickly pears, while a significant decrease was observed for the orange variety. No clear trend in C* values was observed, depending on the number of weeks of storage as a whole product.
Table 4 shows that the whiteness index (WI) significantly increased between the initial and final days of minimally processed fruit storage in the cases of the orange and pink prickly pears. However, this behavior was not observed for the white variety. Significantly more color (∆E) (Figure 5) was lost in the minimally processed prickly pears without previous storage as a whole fruit (0 weeks). Allegra et al. [30] and Ochoa-Velasco and Guerrero-Beltrán [36] reported losses of color, especially after 7 days of storage. Figure 5 shows that the ∆E of the minimally processed prickly pears decreased as the number of weeks of storage as a whole product increased.
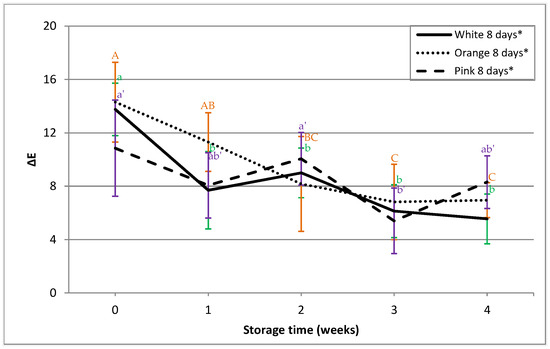
Figure 5.
∆E evolution for minimally processed prickly pears at 8 days. * The final recordings were taken after 6 days for those stored for 4 weeks (microbiological limit). The different green lowercase letters, orange capital letters, and purple lowercase’ letters indicate the significant differences between storage weeks (p < 0.05) in the white, orange, and pink prickly pears, respectively.
3.5.2. Hardness and Texture
The hardness and texture of the minimally processed prickly pears decreased significantly between 0 and 8 days of storage. In the case of hardness, this fact was observed especially in the unprocessed fruits stored for a few weeks (from 0 to 2 weeks). From the third week of unprocessed fruit storage, the hardness did not change significantly in the minimally processed fruits with the storage time. The white prickly pears showed higher mean values for texture than the orange and pink varieties during their shelf life (10.2 ± 3.6 versus 9.3 ± 3.7 y, 9.8 ± 3.0 N s/g f.w., respectively).
3.5.3. Total Soluble Solids Content (TSS), pH, and Total Acidity (TA)
The TSS values ranged from 10.27 to 14.87 °Brix for all the three varieties (Table 5). Marques et al. [37] and Martins et al. [38] obtained similar contents in other prickly pear varieties. For the orange and pink minimally processed prickly pears, in general, the TSS content did not show significant differences between 0 and 8 days of storage, and it was significantly different depending on the number of weeks that the whole fruits had been stored, except for the pink minimally processed prickly pears at 0 days of storage. For the white prickly pears, the TSS content was significantly higher at 0 days than 8 days of processing, except after 4 weeks of storage as whole fruits. Cefola et al. [8] and Ochoa-Velasco and Guerrero-Beltrán [36] reported higher TSS contents for longer ripening and storage times at 4 °C.
Table 5.
TSS, pH, TA, and sugars in white, orange, and pink minimally processed prickly pears.
Higher pH values and lower TA values were observed in the minimally processed prickly pears at 0 days compared to those at 8 days of storage. A significant increase in TA was observed in all the samples with storage time. A trend of an increase or decrease in the pH or TA with the number of weeks the whole product had been stored was not observed in the minimally processed prickly pears. Similar changes in the pH and TA have been reported for prickly pears of the “Gialla” variety and Opuntia albicarpa when stored at 4 °C for 9 or 16 days, respectively, by Piga et al. [9] and Ochoa-Velasco and Guerrero-Beltrán [36]. In addition, Del Nobile et al. [16] found a steady decrease in pH values with the storage time of minimally processed prickly pears subjected to three different treatments, likely as a consequence of fermentation by yeast [9].
3.5.4. Sugars
The total sugar content ranged from 7.05 ± 0.08 to 11.70 ± 0.11 g/100 g f.w., and the most-abundant sugars were glucose, fructose, and sucrose, in that order (Table 5). Similar sugar contents were reported by Palma et al. [34] and Kyriacou et al. [39]. The total sugar content decreased significantly between day 0 and day 8 of storage in the orange (except for week 0) and pink (except for weeks 2 and 3) minimally processed prickly pears. However, this was not observed in the white variety. After 8 days of minimally processed fruit storage, a significant decrease in total sugar content was observed, depending on the number of weeks the whole fruit had been stored, especially in the white and orange prickly pears.
The glucose mean values at initial storage time (day 0) were 5.15 ± 0.32, 6.04 ± 0.59, and 5.71 ± 0.46 g/100 g f.w. for the white, orange, and pink prickly pears, respectively. For the orange (except for weeks 0 and 3) and pink varieties (except for week 3), the glucose content at 8 days was significantly lower than that at 0 days, whereas in the case of the white prickly pears, a clear trend was not observed. The fructose mean values at day 0 of storage were 3.65 ± 0.25, 4.53 ± 0.40, and 4.12 ± 0.43 g/100 g f.w. for the white, orange, and pink prickly pears, respectively. In the case of the orange and pink prickly pears, a significant decrease in fructose content was observed between 0 and 8 days of storage, except when the minimally processed prickly pears were prepared with whole fruits stored for 0 weeks or 0 and 3 weeks, respectively. The glucose and fructose content of minimally processed prickly pears decreased at 8 days, depending on the number of weeks they were stored as a whole fruit. Palma et al. [34] reported a decrease in fructose and glucose composition with the storage time for different varieties of minimally processed prickly pears, although these changes were slight and generally not significant. The sucrose mean content at 0 days of storage was 0.31 ± 0.09, 0.25 ± 0.05, and 0.31 ± 0.04 g/100 g f.w. for the white, orange, and pink prickly pears, respectively. A very significant decrease in the sucrose content was observed in the minimally processed fruits between days 0 and 8 of storage (approximately 50%). The sucrose content was independent of the time for which the whole fruits were stored.
3.6. Bioactive Compounds and Antioxidant Capacity Analysis
The orange and pink prickly pears showed a higher ascorbic acid content than the white variety at 0 days (14.56 ± 1.21 and 15.95 ± 1.02 versus 8.68 ± 0.80 mg/100 g f.w., respectively) (Table 6). In the three varieties, the ascorbic acid content decreased very significantly with the storage time, both in the minimally processed prickly pears and in the whole fruits during the weeks of storage. The ascorbic acid losses between day 0 and day 8 of processed fruit storage ranged from 42% (week 0) to 57% (week 4) for the white prickly pears, from 46% (week 0) to 94% (week 4) for the orange variety, and from 22% (week 0) to 75% (week 4) for the pink variety. The degradation rates of ascorbic acid depend on the genotype, maturity stage, and storage conditions, leading to its decrease with storage time in most horticultural products. [34]. Furthermore, Lee and Kader [40] and Gil et al. [1] reported that the rate of degradation can be especially high in minimally processed fruits and vegetables, reaching losses greater than 50%.
Table 6.
Ascorbic acid, total phenolics, and antioxidant capacity (DPPH) in white, orange, and pink minimally processed prickly pears.
The antioxidant activity (DPPH) is higher in the orange and pink prickly pears than in the white prickly pears, according to Ochoa-Velasco and Guerrero-Beltrán [36]. Similar to ascorbic acid, the antioxidant capacity was significantly lower on day 8 of processed fruit storage than day 0, and, in addition, it decreased throughout the weeks of storage as unprocessed fruit in all the cases. Panza et al. [2] reported similar results, and they indicated that the antioxidant activity decreased over time in the control samples of ready-to-eat prickly pears and in those treated with different coats due to factors such as exposure of tissue to light, air, enzymatic activity, and chemical degradation.
The total phenolic content decreased significantly between 0 and 8 days of storage for the minimally processed prickly pears, especially in the fruits that were processed without prior storage (week 0) and in the case of the white prickly pears in week 1 and the orange ones in week 2. In the rest of the samples (from weeks 1 to 4), no significantly lower values were observed between days 0 and 8 of processed fruit storage, and even a slight increase was detected in some cases. No clear trends were observed for the total phenolic content, depending on the week of previous storage as a whole product. According to Ochoa-Velasco and Guerrero-Beltrán [36], the phenolic content in white prickly pears reduced slightly during storage, and it significantly increased after 4 days of storage for the red prickly pears. However, Palma et al. [34] indicated that in the “Bianca” and “Gialla” varieties, the phenolic compound content decreased with the storage time.
4. Conclusions
Minimally processed prickly pears had a shelf life of 8 days when using whole fruits stored at 8 °C and 85% RH for 0, 1, 2, or 3 weeks, but this was only 6 days when the whole fruits were cold-stored for 4 weeks. After this, the samples exceeded the aerobic mesophile counts established by Spanish legislation.
Throughout weeks of storage as unprocessed fruits, significant decreases in ascorbic acid content and antioxidant capacity were observed. The Browning index (∆E) was higher during the first weeks of storage. The rest of the parameters either did not change significantly or changed without following a clear trend. During the storage period for minimally processed prickly pears, between 0 and 8 days, more remarkable changes were observed. The hardness, texture, pH, and tonality (H°) of the white prickly pears, the total sugar content and glucose content of the orange and pink prickly pears, and the sucrose content, ascorbic acid content, and antioxidant capacity decreased significantly between days 0 and 8 of storage, whereas the total acidity (TA) and whiteness index (WI) of the orange and pink prickly pears increased significantly between the initial day and the expiration day. In addition, the O2 concentrations decreased slightly, and the CO2 concentrations increased inside the trays between days 0 and 8 of storage.
The sensory evaluation of the minimally processed fruits was positive (score higher than six) from the initial storage day to the expiration date, regardless of the number of weeks of previously unprocessed fruit storage, and it did not decrease over time.
After 4 weeks of unprocessed fruit storage at 8 °C, the minimally processed prickly pears maintained appropriate microbial, nutritional, and sensory qualities, as demonstrated by the findings of this study. Therefore, it is possible to extend the period of commercial availability of these fruits. Furthermore, this study used simple and accessible technologies optimized in a previous study that can be applied by small- and medium-sized agro-industries.
Author Contributions
Conceptualization, M.G.L. and G.L.D.-D.; methodology, M.G.L., G.L.D.-D., E.M.R.-R. and M.P.C.; software, E.M.R.-R. and G.L.D.-D.; validation, E.M.R.-R., G.L.D.-D. and M.G.L.; formal analysis, G.L.D.-D. and E.M.R.-R.; investigation, G.L.D.-D., M.G.L., E.M.R.-R. and M.P.C.; resources, M.G.L.; data curation, G.L.D.-D. and E.M.R.-R.; writing—original draft preparation, G.L.D.-D.; writing—review and editing, M.G.L., E.M.R.-R. and M.P.C.; visualization, G.L.D.-D., M.G.L. and E.M.R.-R.; supervision, M.G.L. and E.M.R.-R.; project administration, M.G.L.; funding acquisition, M.G.L. All authors have read and agreed to the published version of the manuscript.
Funding
This research was funded by “Instituto Nacional de Investigación y Tecnología Agraria y Alimentaria (INIA)”, grant number RTA 2015-00044-C2 “Estudio integral de aprovechamiento de Opuntia (Tuna o Higo Chumbo) para la obtención de derivados e ingredientes funcionales mediante la aplicación de tecnologías innovadoras”.
Institutional Review Board Statement
Not applicable.
Data Availability Statement
Data will be made available upon reasonable request.
Acknowledgments
The authors would like to acknowledge the support and collaboration given by the orchardists involved.
Conflicts of Interest
The authors declare no conflicts of interest.
References
- Gil, M.I.; Aguayo, E.; Kader, A.A. Quality Changes and Nutrient Retention in Fresh-Cut versus Whole Fruits during Storage. J. Agric. Food Chem. 2006, 54, 4284–4296. [Google Scholar] [CrossRef]
- Panza, O.; Lacivita, V.; Conte, A.; Del Nobile, M.A. Quality Preservation of Ready-to-Eat Prickly Pears by Peels Recycling. Foods 2022, 11, 2016. [Google Scholar] [CrossRef]
- Hernández-Pérez, T.; Carrillo-López, A.; Guevara-Lara, F.; Cruz-Hernández, A.; Paredes-López, O. Biochemical and Nutritional Characterization of Three Prickly Pear Species with Different Ripening Behavior. Plant Foods Hum. Nutr. 2005, 60, 195–200. [Google Scholar] [CrossRef]
- Cano, M.P.; Gómez-Maqueo, A.; García-Cayuela, T.; Welti-Chanes, J. Characterization of Carotenoid Profile of Spanish Sanguinos and Verdal Prickly Pear (Opuntia ficus-indica, spp.) Tissues. Food Chem. 2017, 237, 612–622. [Google Scholar] [CrossRef]
- Silva, M.A.; Albuquerque, T.G.; Pereira, P.; Ramalho, R.; Vicente, F.; Oliveira, M.B.P.P.; Costa, H.S. Opuntia ficus-indica (L.) Mill.: A Multi-Benefit Potential to Be Exploited. Molecules 2021, 26, 951. [Google Scholar] [CrossRef]
- Gómez-Maqueo, A.; Steurer, D.; Welti-Chanes, J.; Cano, M.P. Bioaccessibility of Antioxidants in Prickly Pear Fruits Treated with High Hydrostatic Pressure: An Application for Healthier Foods. Molecules 2021, 26, 5252. [Google Scholar] [CrossRef]
- Gómez-Maqueo, A.; Antunes-Ricardo, M.; Welti-Chanes, J.; Cano, M.P. Digestive Stability and Bioaccessibility of Antioxidants in Prickly Pear Fruits from the Canary Islands: Healthy Foods and Ingredients. Antioxidants 2020, 9, 164. [Google Scholar] [CrossRef]
- Cefola, M.; Renna, M.; Pace, B. Marketability of Ready-to-Eat Cactus Pear as Affected by Temperature and Modified Atmosphere. J. Food Sci. Technol. 2014, 51, 25–33. [Google Scholar] [CrossRef]
- Piga, A.; Caro, A.D.; Pinna, I.; Agabbio, M. Changes in Ascorbic Acid, Polyphenol Content and Antioxidant Activity in Minimally Processed Cactus Pear Fruits. LWT Food Sci. Technol. 2003, 2, 257–262. [Google Scholar] [CrossRef]
- Gómez, P.A.; Camelo, A.F.L. Calidad Postcosecha de Tomates Almacenados en Atmósferas Controladas. Hortic. Bras. 2002, 20, 38–43. [Google Scholar] [CrossRef]
- Ulloa, L.; Sáenz, M.V.; Castro, J.; Ulloa, L.; Sáenz, M.V.; Castro, J. Efecto del Almacenamiento a Diferentes Temperaturas sobre el Desarrollo de Color Externo y la Calidad de Frutos de Piña cv. Dorada Extra Dulce. Agron. Costarric. 2015, 39, 9–20. [Google Scholar] [CrossRef]
- Díaz-Delgado, G.L.; Rodríguez-Rodríguez, E.M.; Dorta, E.; Lobo, M.G. Effects of Peeling, Film Packaging, and Cold Storage on the Quality of Minimally Processed Prickly Pears (Opuntia ficus-indica L. Mill.). Agriculture 2022, 12, 281. [Google Scholar] [CrossRef]
- Saberi Riseh, R.; Vatankhah, M.; Hassanisaadi, M.; Shafiei-Hematabad, Z.; Kennedy, J.F. Advancements in Coating Technologies: Unveiling the Potential of Chitosan for the Preservation of Fruits and Vegetables. Int. J. Biol. Macromol. 2024, 254, 127677. [Google Scholar] [CrossRef]
- Kahramanoglu, I.; Usanmaz, S.; Okatan, V.; Wan, C. Preserving Postharvest Storage Quality of Fresh-Cut Cactus Pears by Using Different Bio-Materials. CABI Agric. Biosci. 2020, 1, 7. [Google Scholar] [CrossRef]
- Ferreira Gomes, B.A.; Silveira Alexandre, A.C.; Vieira de Andrade, G.A.; Pereira Zanzini, A.P.; de Barros, H.E.; dos Santos Ferraz e Silva, L.M.; Costa, P.A.; de Barros Vilas Boas, E.V. Recent Advances in Processing and Preservation of Minimally Processed Fruits and Vegetables: A Review—Part 2: Physical Methods and Global Market Outlook. Food Chem. Adv. 2023, 2, 100304. [Google Scholar] [CrossRef]
- Del Nobile, M.A.; Conte, A.; Scrocco, C.; Brescia, I. New Strategies for Minimally Processed Cactus Pear Packaging. Innov. Food Sci. Emerg. Technol. 2009, 10, 356–362. [Google Scholar] [CrossRef]
- Silva, F.A.; Finkler, L.; Finkler, C.L.L. Effect of Edible Coatings Based on Alginate/Pectin on Quality Preservation of Minimally Processed “Espada” Mangoes. J. Food Sci. Technol. 2018, 55, 5055–5063. [Google Scholar] [CrossRef]
- Padrón Mederos, M.A.; Rodríguez-Galdón, B.; Díaz-Romero, C.; Lobo, G.; Rodríguez-Rodríguez, E. Quality Evaluation of Minimally Fresh-Cut Processed Pineapples. LWT 2020, 129, 109607. [Google Scholar] [CrossRef]
- Mphahlele, R.R.; Caleb, O.J.; Ngcobo, M.E.K. Effects of Packaging and Duration on Quality of Minimally Processed and Unpitted Litchi Cv. “Mauritius” under Low Storage Temperature. Heliyon 2020, 6, e03229. [Google Scholar] [CrossRef]
- AOAC. Official Methods of Analysis of AOAC International, 20th ed.; AOAC International: Gaithersburg, MD, USA, 2016. [Google Scholar]
- Aguayo, E.; Allende, A.; Artés, F. Keeping Quality and Safety of Minimal Fresh Processed Melon. Eur. Food Res. Technol. 2003, 216, 494–499. [Google Scholar] [CrossRef]
- Horwitz, W.; Latimer, G.W.; Association of Official Analytical Chemists International. Official Methods of Analysis of AOAC International; AOAC International: Gaithersburg, MD, USA, 2006; ISBN 978-0-935584-77-6. [Google Scholar]
- Rodríguez-Galdón, B.; Tascón-Rodríguez, C.; Rodríguez-Rodríguez, E.M.; Díaz-Romero, C. Fructans and Major Compounds in Onion Cultivars (Allium cepa). J. Food Compos. Anal. 2009, 22, 25–32. [Google Scholar] [CrossRef]
- Real Decreto 3484/2000, de 29 de Diciembre, por el que se Establecen las Normas de Higiene para la Elaboración, Distribución y Comercio de Comidas Preparadas. Boletín Oficial del Estado (BOE), de 12 de Enero de 2001. Volume BOE-A-2001-809, pp. 1435–1441. Available online: https://www.boe.es/eli/es/rd/2000/12/29/3484/con (accessed on 20 December 2023).
- Escalona, V.H.; Aguayo, E.; Artés, F. Quality and Physiological Changes of Fresh-Cut Kohlrabi. HortScience 2003, 38, 1148–1152. [Google Scholar] [CrossRef]
- Karacay, E.; Ayhan, Z. Microbial, Physical, Chemical and Sensory Qualities of Minimally Processed and Modified Atmosphere Packaged “Ready To Eat” Orange Segments. Int. J. Food Prop. 2010, 13, 960–971. [Google Scholar] [CrossRef]
- Panadés, G.; Chiralt, A.; Fito, P.; Rodríguez, I.; Nuñez, M.; Albors, A.; Jiménez, R. Influence of Operating Conditions on Sensory Quality of Minimally Processed Osmotically Dehydrated Guava. J. Food Qual. 2003, 26, 91–103. [Google Scholar] [CrossRef]
- Kujala, T.S.; Loponen, J.M.; Klika, K.D.; Pihlaja, K. Phenolics and Betacyanins in Red Beetroot (Beta Vulgaris) Root: Distribution and Effect of Cold Storage on the Content of Total Phenolics and Three Individual Compounds. J. Agric. Food Chem. 2000, 48, 5338–5342. [Google Scholar] [CrossRef] [PubMed]
- Bondet, V.; Brand-Williams, W.; Berset, C. Kinetics and Mechanisms of Antioxidant Activity Using the DPPH. Free Radical Method. LWT Food Sci. Technol. 1997, 30, 609–615. [Google Scholar] [CrossRef]
- Allegra, A.; Sortino, G.; Miciletta, G.; Riotto, M.; Fasciana, T.; Inglese, P. The Influence of Harvest Period and Fruit Ripeness at Harvest on Minimally Processed Cactus Pears (Opuntia ficus-indica L. Mill.) Stored under Passive Atmosphere. Postharvest Biol. Technol. 2015, 104, 57–62. [Google Scholar] [CrossRef]
- Aghdam, M.S.; Bodbodak, S. Postharvest Heat Treatment for Mitigation of Chilling Injury in Fruits and Vegetables. Food Bioprocess Technol. 2014, 7, 37–53. [Google Scholar] [CrossRef]
- Acuña, L.E.; Aguirre, C.; Burdyn, L.; Carbajo, M.S.; Cocco, M.; Colodner, A.; Comerio, R.M.; Di Masi, S.; Flores, C.; Frusso, E.; et al. Manual de Poscosecha de Frutas. Manejo Integrado de Patógenos 2019. ISBN 978-987-833-312-0. Available online: https://alimentosargentinos.magyp.gob.ar/HomeAlimentos/PDA/documentos/manual_poscosecha_frutas_INTA.pdf (accessed on 20 December 2023).
- Garcia, E.; Barrett, D.M. Preservative Treatments for Fresh-Cut Fruits and Vegetables. In Fresh-Cut Fruits and Vegetables: Science, Technology, and Market; CRC Press: Boca Raton, FL, USA, 2002; pp. 267–303. [Google Scholar]
- Palma, A.; Continella, A.; Malfa, S.; D’aquino, S. Changes in Physiological and Some Nutritional, Nutraceuticals, Chemical-Physical, Microbiological and Sensory Quality Minimally Processed Cactus Pears Cvs “Bianca”, “Gialla” and “Rossa” Stored under Passive Modified Atmosphere. J. Sci. Food Agric. 2017, 98, 1839–1849. [Google Scholar] [CrossRef]
- Aguayo, E.; Requejo-Jackman, C.; Stanley, R.; Woolf, A. Effect of Calcium Ascorbate Treatments and Storage Atmosphere on Antioxidant Activity and Quality of Fresh-Cut Apple Slices. Postharvest Biol. Technol. 2010, 57, 52–60. [Google Scholar] [CrossRef]
- Ochoa Velasco, C.E.; Guerrero-Beltran, J. Postharvest Quality of Peeled Prickly Pear Fruit Treated with Acetic Acid and Chitosan. Postharvest Biol. Technol. 2014, 92, 139–145. [Google Scholar] [CrossRef]
- Marques, K.M.; Miguel, A.C.A.; Galati, V.C.; Morgado, C.M.A.; Mattiuz, C.F.M.; Mattiuz, B. Minimally Processed Prickly Pear Stored under Different Temperatures and Packaging. AJAR 2015, 10, 1810–1816. [Google Scholar] [CrossRef]
- Martins, M.; Ribeiro, M.H.; Almeida, C.M.M. Physicochemical, Nutritional, and Medicinal Properties of Opuntia ficus-indica (L.) Mill. and Its Main Agro-Industrial Use: A Review. Plants 2023, 12, 1512. [Google Scholar] [CrossRef] [PubMed]
- Kyriacou, M.C.; Emmanouilidou, M.G.; Soteriou, G.A. Asynchronous Ripening Behavior of Cactus Pear (Opuntia ficus-indica) Cultivars with Respect to Physicochemical and Physiological Attributes. Food Chem. 2016, 211, 598–607. [Google Scholar] [CrossRef] [PubMed]
- Lee, S.K.; Kader, A.A. Preharvest and Postharvest Factors Influencing Vitamin C Content of Horticultural Crops. Postharvest Biol. Technol. 2000, 20, 207–220. [Google Scholar] [CrossRef]


Disclaimer/Publisher’s Note: The statements, opinions and data contained in all publications are solely those of the individual author(s) and contributor(s) and not of MDPI and/or the editor(s). MDPI and/or the editor(s) disclaim responsibility for any injury to people or property resulting from any ideas, methods, instructions or products referred to in the content. |
© 2024 by the authors. Licensee MDPI, Basel, Switzerland. This article is an open access article distributed under the terms and conditions of the Creative Commons Attribution (CC BY) license (https://creativecommons.org/licenses/by/4.0/).