Article

Sorting of Mountage Cocoons Based on MobileSAM and Target Detection

1
College of Mechanical and Electrical Engineering, Shandong Agriculture University, Tai’an 271018, China
2
Sericulture Technology Promotion Station of Guangxi Zhuang Autonomous Region, Nanning 530000, China
3
Guangxi Key Laboratory of Silkworm Genetic Improvement and Efficient Breeding, Nanning 530000, China
4
Shandong Engineering Research Center of Intelligent Agricultural Equipment, Tai’an 271018, China
5
Shandong Key Laboratory of Horticultural Machinery and Equipment, Tai’an 271018, China
*
Author to whom correspondence should be addressed.
Agriculture 2024, 14(4), 599; https://doi.org/10.3390/agriculture14040599
Submission received: 29 February 2024 / Revised: 3 April 2024 / Accepted: 4 April 2024 / Published: 10 April 2024
(This article belongs to the Section Digital Agriculture)

Abstract

:
The classification of silkworm cocoons is essential prior to silk reeling and serves as a key step in improving the quality of raw silk. At present, cocoon classification mainly relies on manual sorting, which is labor-intensive and inefficient. In this paper, a cocoon detection algorithm S-YOLOv8_c based on the cooperation of MobileSAM and YOLOv8 for the mountage cocoons was proposed. The MobileSAM with a designed area thresholding algorithm was used for the semantic segmentation of mountage cocoon images, which could mitigate the effect of complex backgrounds and maximize the discriminability of cocoon features. Subsequently, the BiFPN was added to the neck of YOLOv8 to improve the multiscale feature fusion capability. The loss function was replaced with the WIoU, and a dynamic non-monotonic focusing mechanism was introduced to improve the generalization ability. In addition, the GAM was incorporated into the head to focus on detailed cocoon information. Finally, the S-YOLOv8_c achieved a good detection accuracy on the test set, with a mAP of 95.8%. Furthermore, to experimentally validate the sorting ability, we deployed the proposed model onto the self-developed Cartesian coordinate automatic cocoon harvester, which indicated that it would effectively meet the requirements of accurate and efficient cocoon sorting.

1. Introduction

Sericulture is a traditional industry in China with a long history and significant economic value. In 2022, China’s silkworm cocoon production reached 802,400 t. The production of cocoons and raw silk accounted for more than 70% of the global production, ranking first in the world [1].
The quality of silkworm cocoons is one of the decisive factors for the quality of silk. It is necessary to sort silkworm cocoons before reeling. According to production needs, silkworm cocoons are classified into reelable cocoons, double cocoons, and waste cocoons. Reelable cocoons are used for reeling certified silk, which has a normal cocoon shape, color, folds, and cocoon layer thickness. Double cocoons contain two or more silkworm chrysalises, usually with larger volumes and abnormal wrinkles. They cannot be used for reeling but are a high-quality raw material used to make silk quilts. Waste cocoons, including yellow spotted cocoons, cocoons pressed by a cocooning frame, cocoons contaminated by oil, perforated cocoons, etc. [2], are not suitable for silk reeling or silk quilt production. Traditional silkworm cocoon sorting relies on manual screening, which is labor-intensive, affected by subjective factors, and results in low sorting efficiency [3].
Grid mountage is widely used for cocooning, with a popularity rate of more than 45% in China [4] (Figure 1). In China and Japan, some grid mountage silk reeling devices have been developed. However, due to the lack of efficient silkworm cocoon classification algorithms, the current technology can only achieve indiscriminate cocoon harvesting. The sorting of cocoons still relies on subsequent manuals. In recent years, the widespread adoption of artificial intelligence in agriculture has led to the exploration and implementation of machine vision technology for cocoon detection [5].
Prasobhkumar et al. [6,7] presented a novel cocoon quality assessment system consisting of a conditioned illumination unit, an image acquisition unit, and a processing unit. The camera first acquired the images of cocoons, and then quantitative statistics on cocoon size, shape, and color were performed using morphological operations and ellipse fitting. Furthermore, the cocoons were automatically classified into good cocoons and four defective categories of waste cocoons. The method was validated using 137 silkworm cocoon samples with 100% accuracy.
Wang et al. [8] developed the algorithms for silkworm cocoon counting and classification. For cocoon counting, the K-means method was used to segment cocoon images first. Then, the separated cocoon images were obtained by distance transformation and morphological operations. Finally, the algorithm counted the number of cocoons by traversing the connected component. For cocoon classification, an improved AlexNet neural network was employed to classify the cocoons. By replacing local response normalization with batch normalization in conv1 and conv2, the generalization ability of the network was improved, and an accuracy of 95.93% was achieved.
Zhou et al. [9] proposed a silkworm cocoon recognition model based on convolutional neural network and image processing. By using principal component analysis and color space conversion, the issue of surface texture blurring caused by cocoon garments is addressed. The recognition accuracy of the cocoon pressed by the cocooning frame and spotted cocoon was effectively improved, and the accuracy of the model was 96%.
Sun et al. [10] implemented the intelligent identification of group cocoon species based on multi-scale retinex with color restoration and convolution block attention module. They used the MSRCR to obtain multi-scale high-frequency detail images, and a convolution block attention module was incorporated into the YOLOv3 model to increase the weight of effective features. The mean average accuracy was 85.52%, which was 4.85% better than the original algorithm.
The aforementioned studies focus on the detection and classification of harvested silkworm cocoons. In the classification of mountage cocoons, Liu et al. [11,12] proposed a waste cocoon detection method based on Fuzzy C-means clustering (FCM) and HSV color model. Firstly, FCM segmentation was applied to the original image of the mountage cocoons to eliminate the mountage. And the individual cocoon was extracted using the masked operation. According to the proportion of specific color components in the color histogram, which was obtained by accumulating the color of HSV, the yellow spotted cocoon was judged one by one. The correct proportion of waste cocoon detection was 81.2%. However, using image processing algorithms for feature extraction requires engineers to fine-tune parameters according to different batches of images, so its ability to generalize across different image sets is quite limited. Therefore, they proposed to use FCN instead of FCM for image segmentation and constructed a cocoon classification model based on the interpretability of CNN. After being pruned, the model was deployed on Jetson Nano, with an average accuracy of 88.7%. The error rate for detecting double cocoons was relatively high.
The above studies have all paid attention to the fine-grained nature of cocoon features. They used algorithms to highlight the fine-grained features of cocoons and combined them with deep learning models for cocoon detection. This provides significant inspiration for our research. For silkworm cocoons within the grid mountage, we develop a robust, efficient, and accurate visual classification model and validate it on an automatic cocoon harvestor. The main contributions of this paper are as follows.
(1)
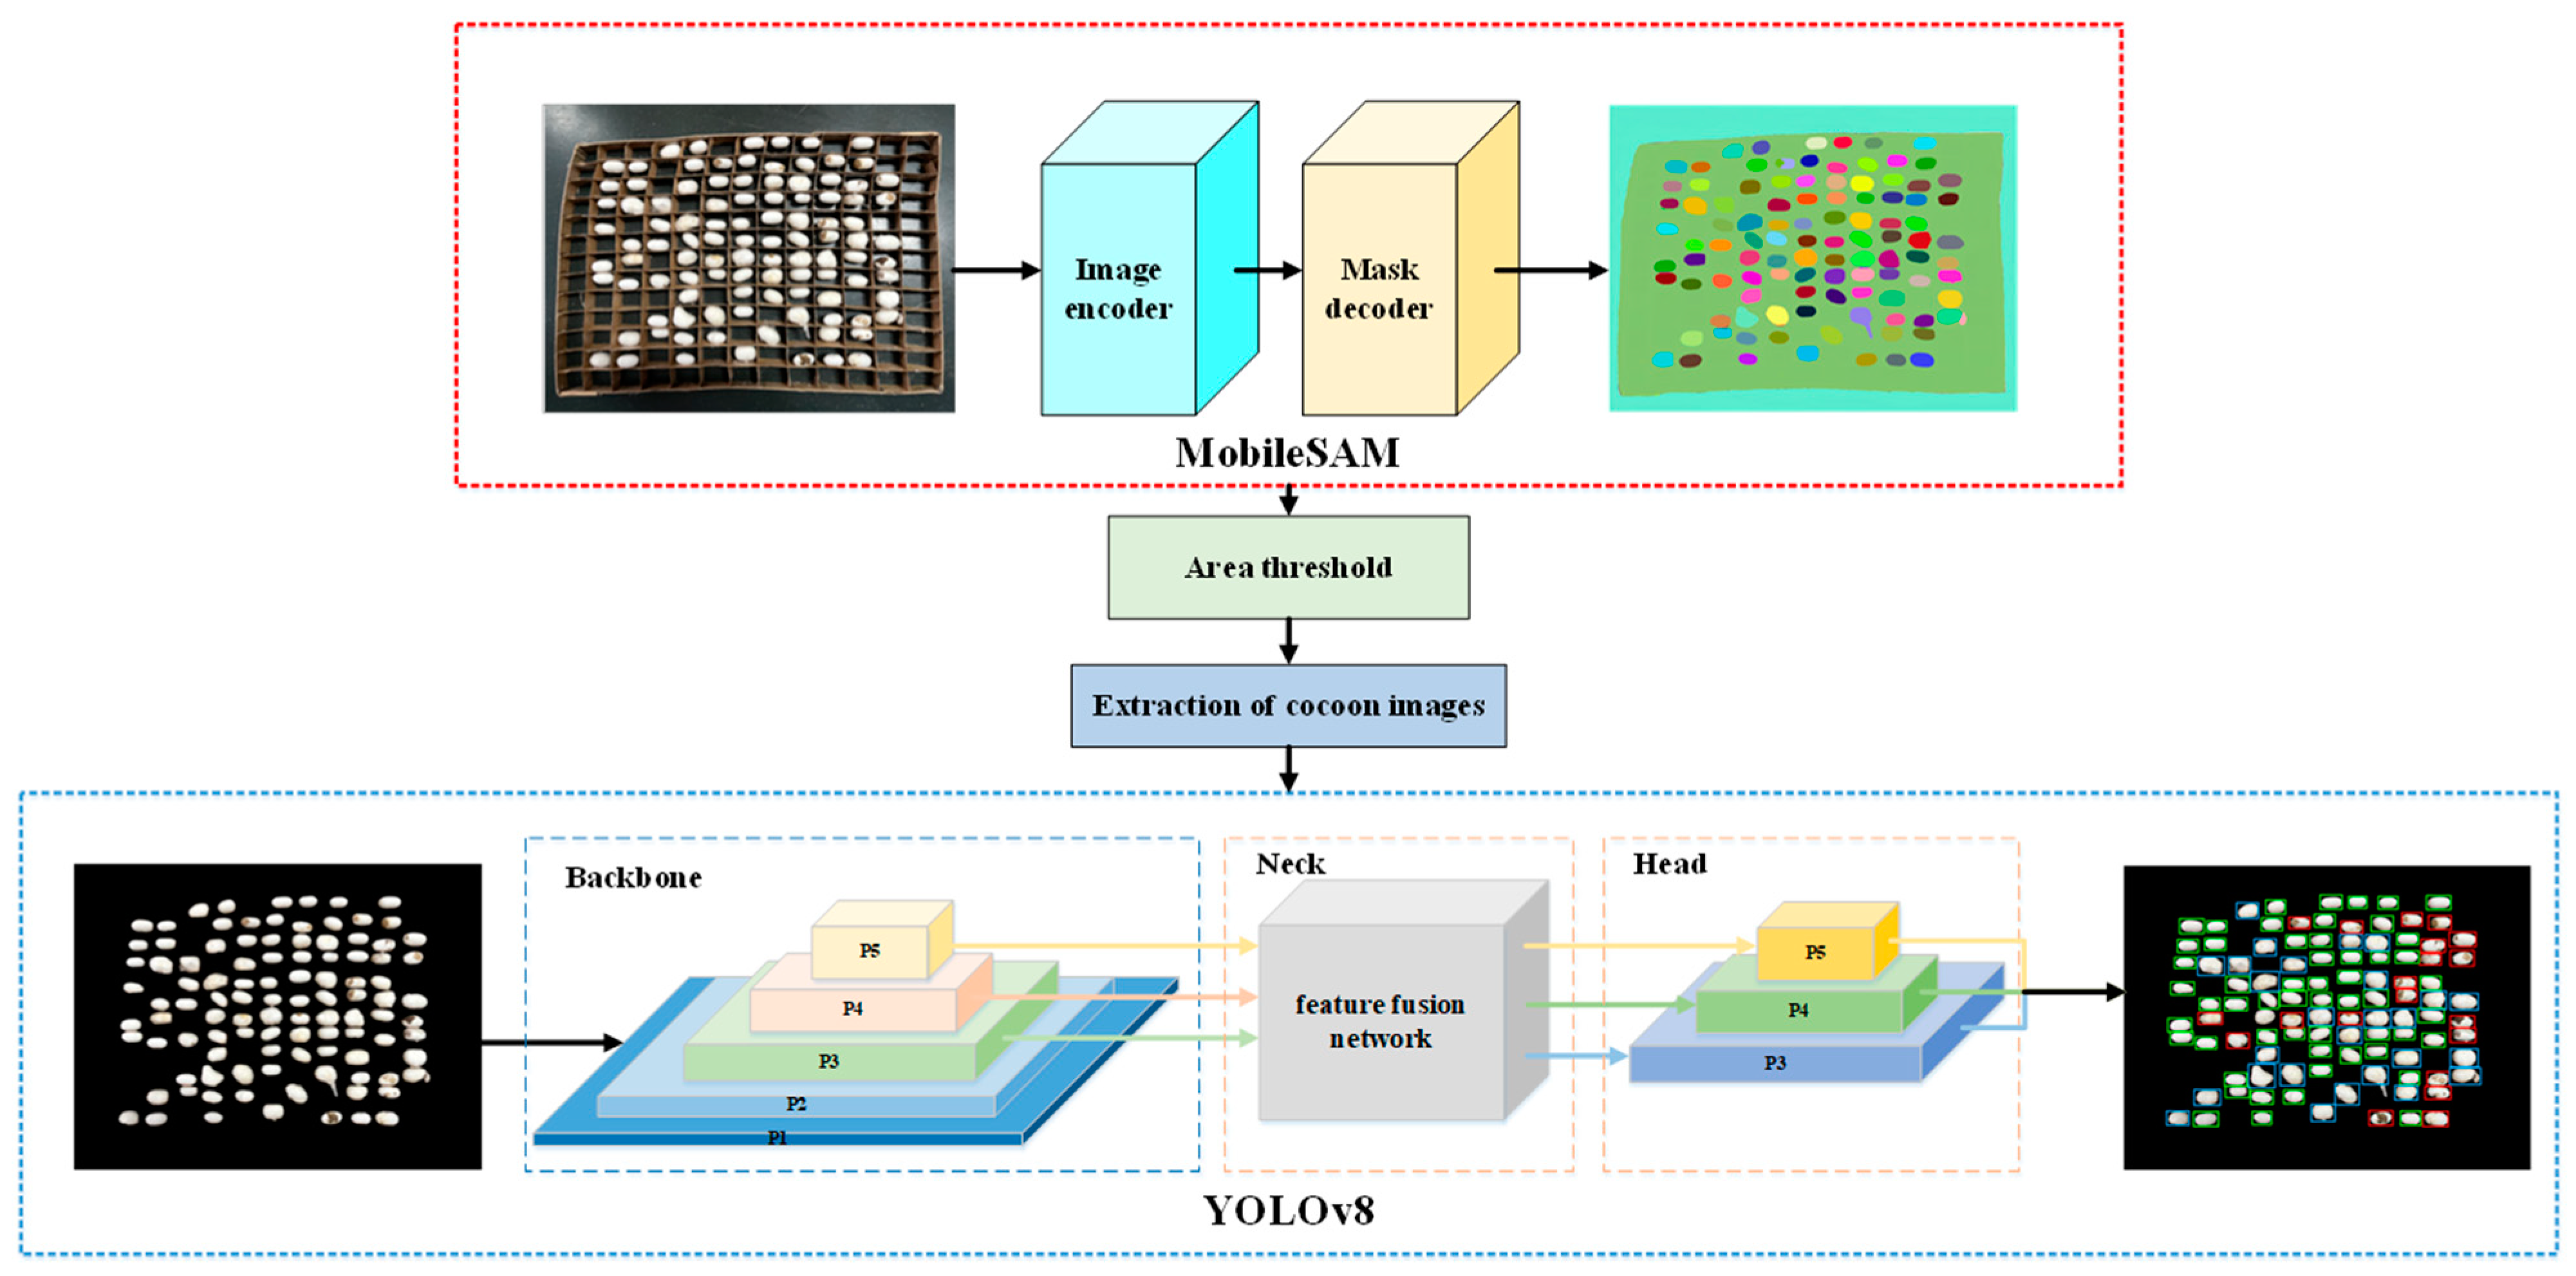
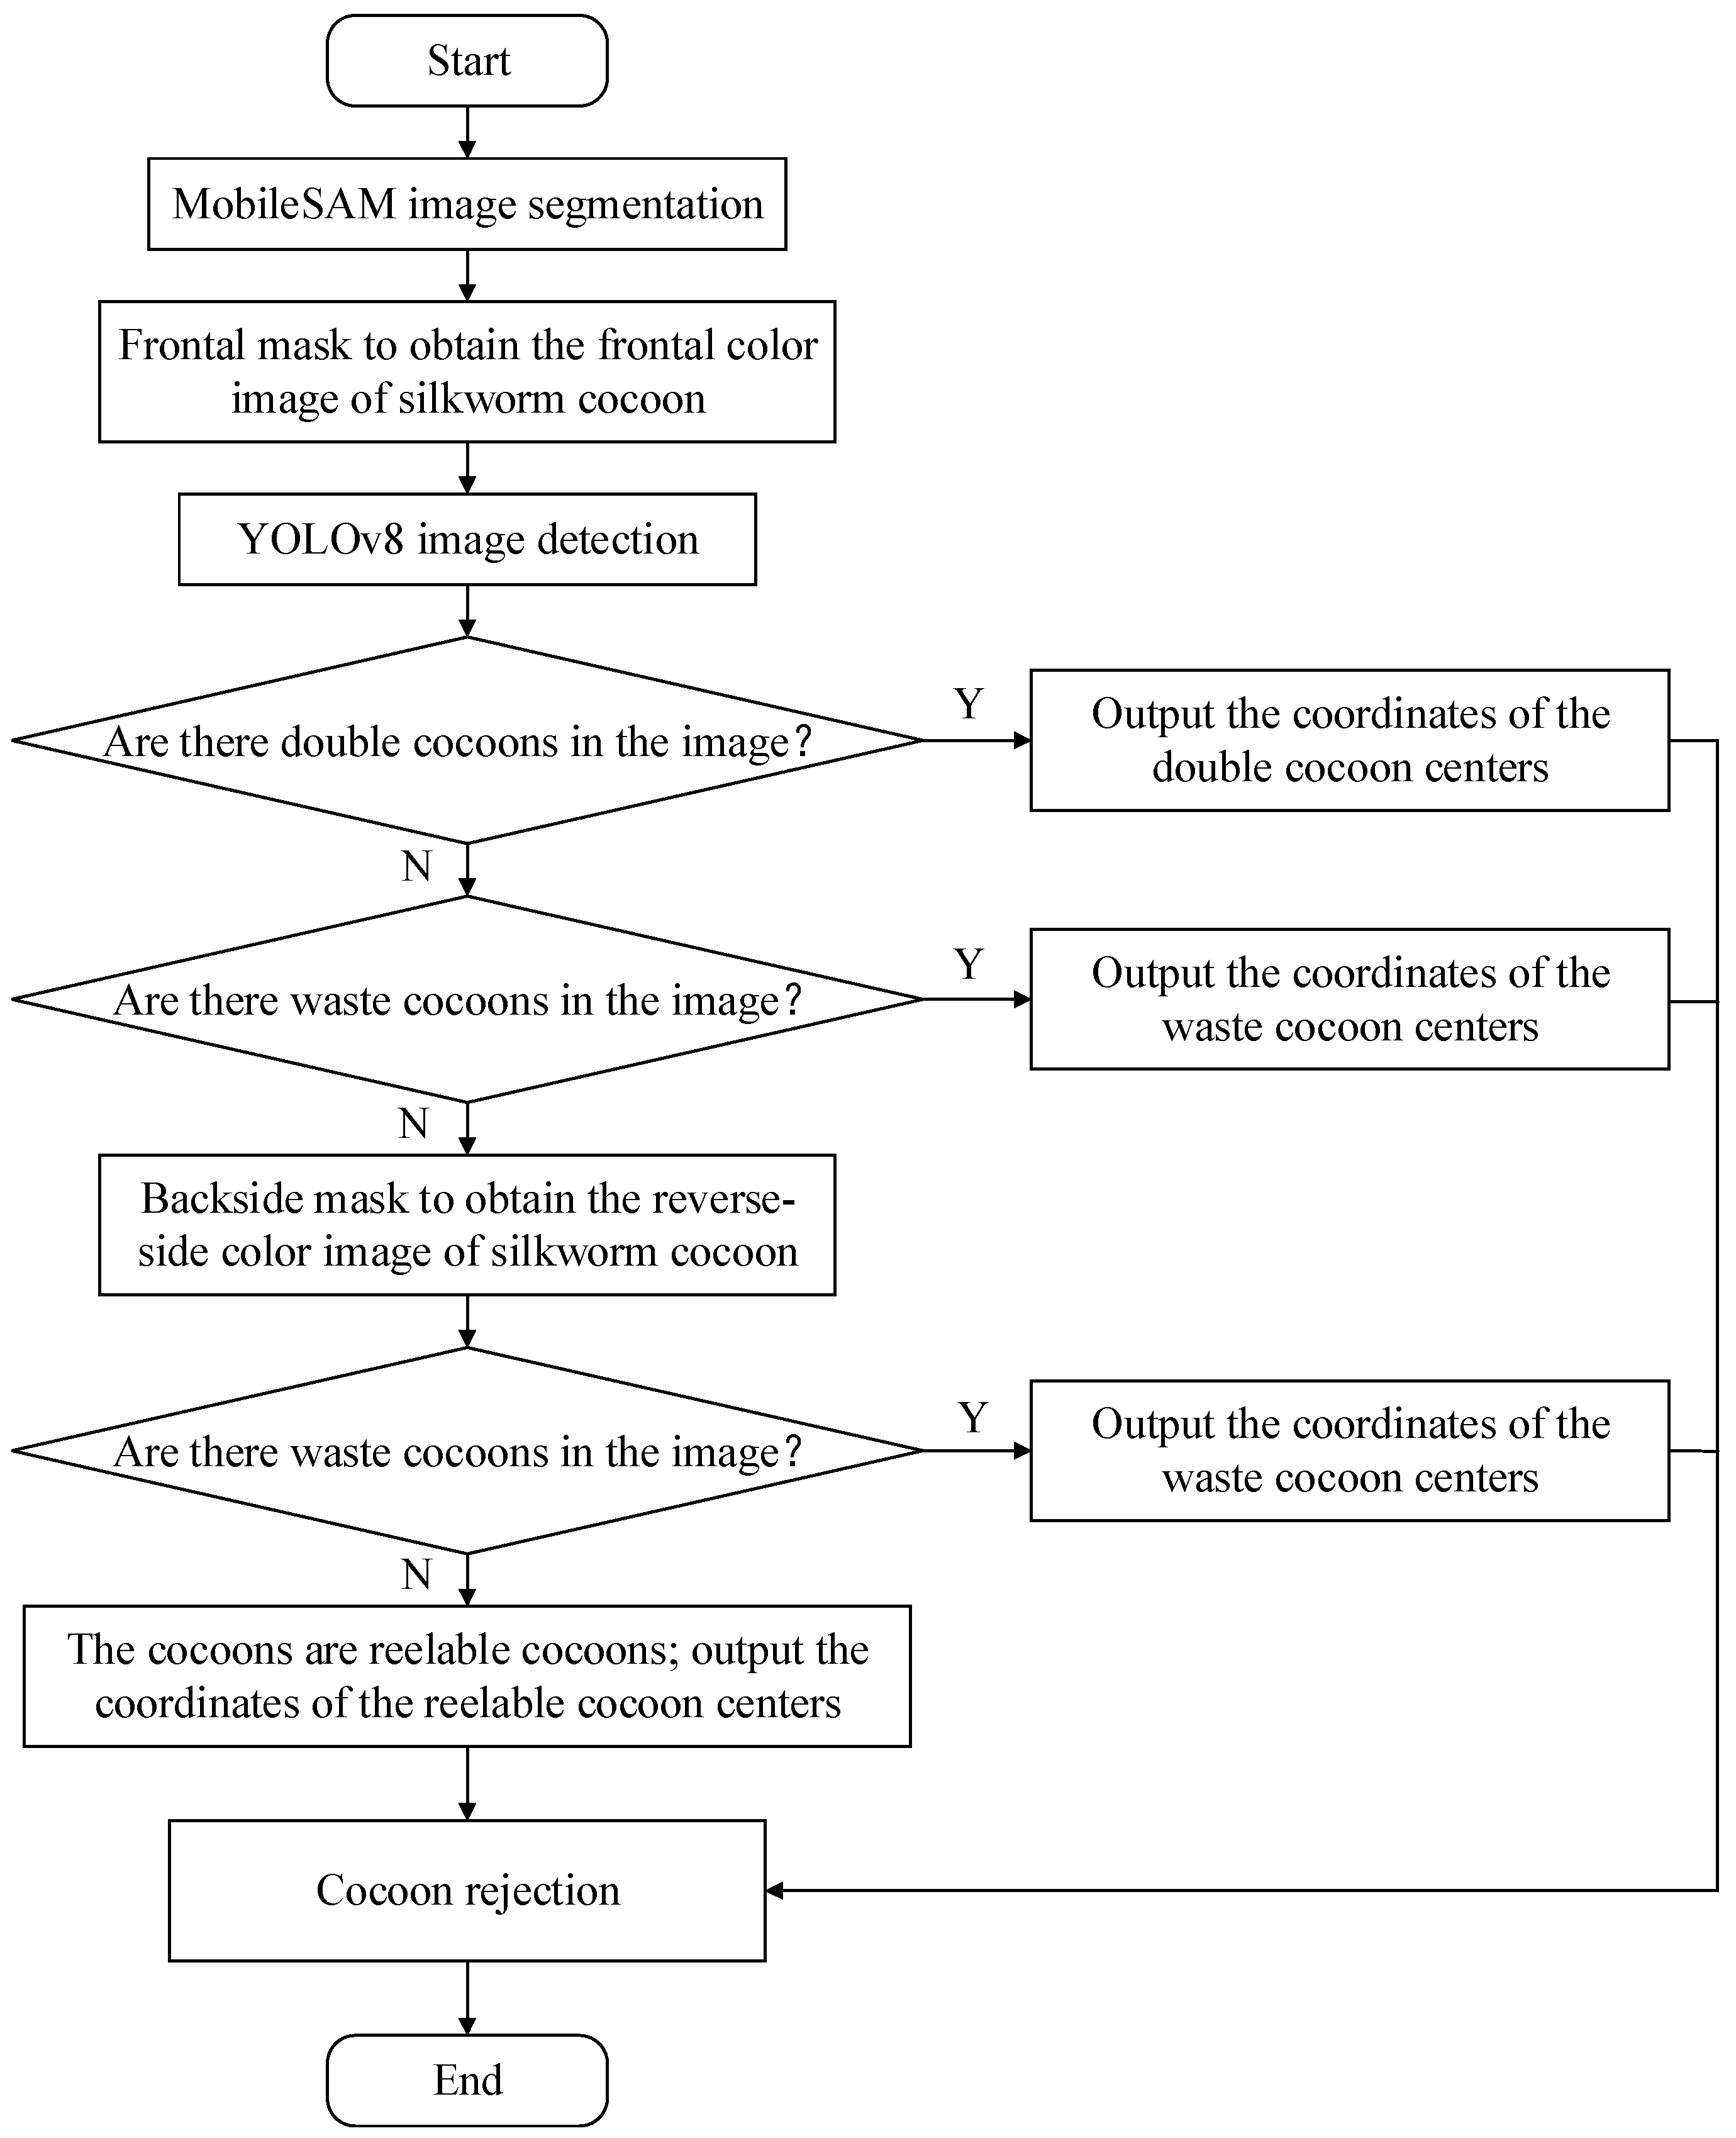
To address the issue of inaccurate detection of double cocoons and waste cocoons with minor defects, a cooperation detection approach is employed, integrating image segmentation and target detection methodologies. By extracting the cocoon image from the entire image of the mountage, the complexity of the image is reduced, and the target feature difference is maximized.
(2)
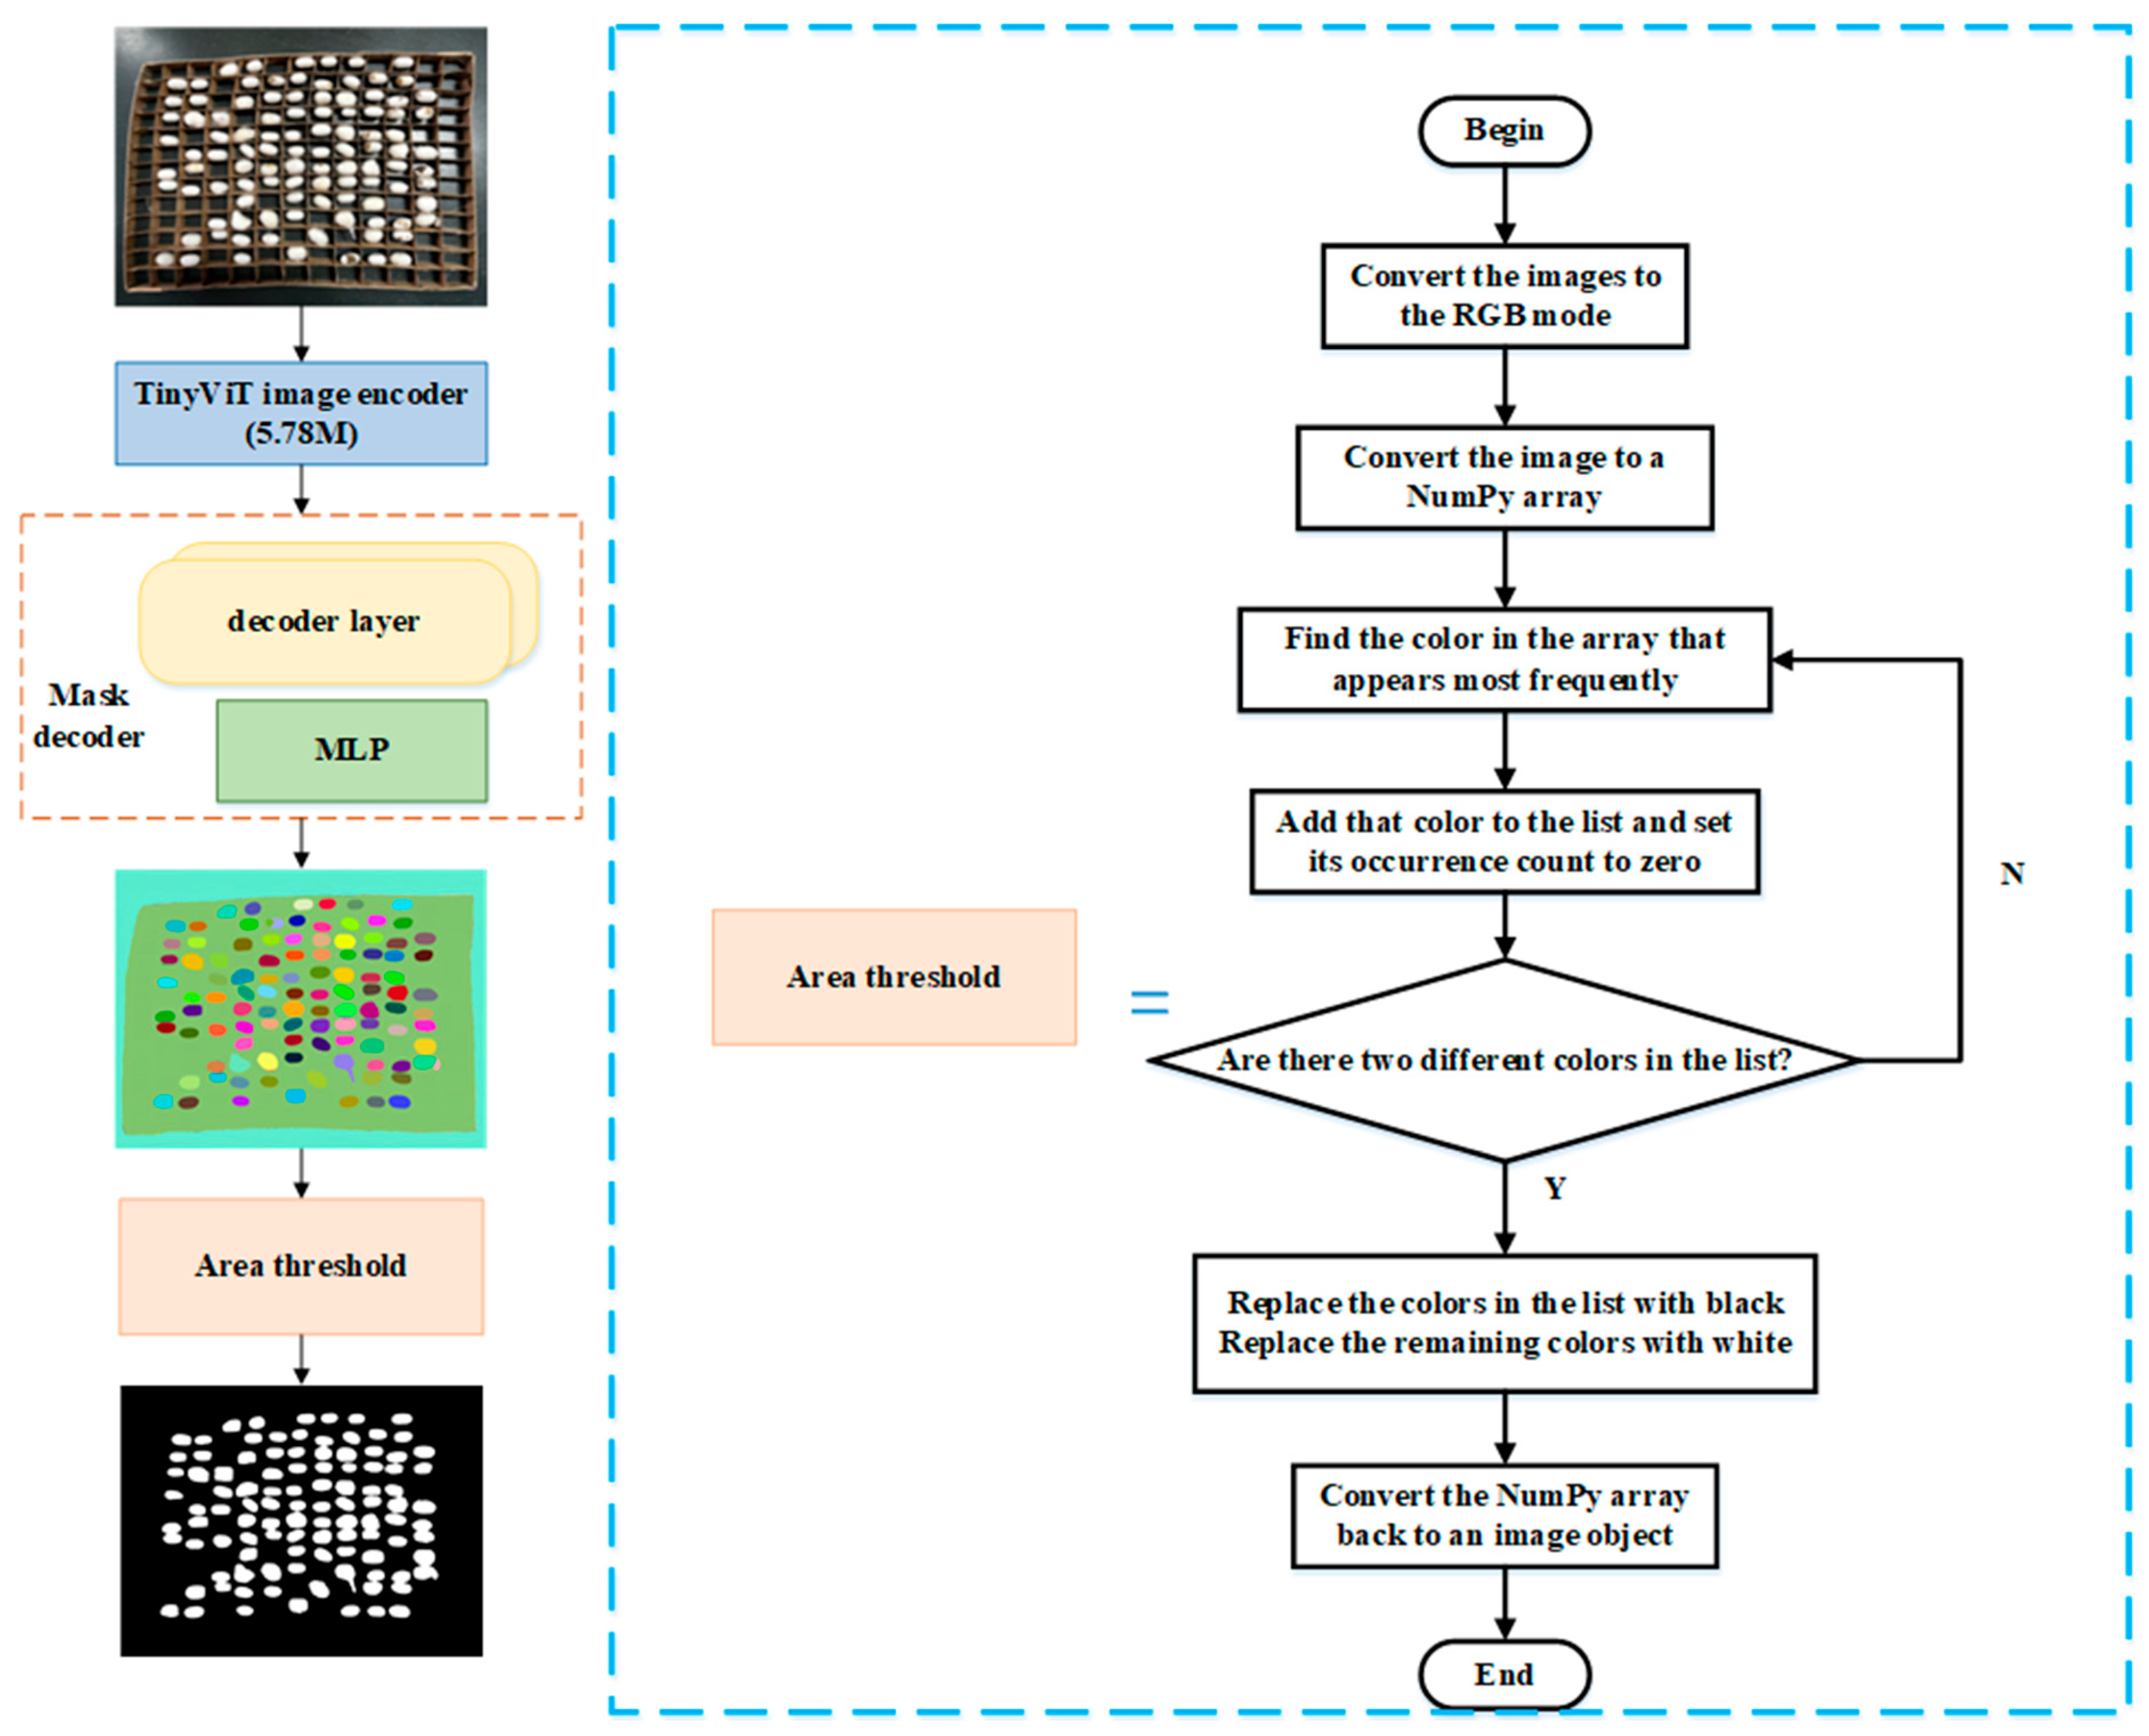
MobileSAM (Mobile segment anything model) [13] is used for the semantic segmentation of mountage cocoons. Based on the characteristics of the segmented images, we design an area threshold algorithm at the output end of SAM, which achieves the unsupervised learning of cocoon image extraction. This approach significantly reduces the workload associated with pixel-level labeling and training, which is essential for the segmentation network.
(3)
In order to detect fine-grained features of cocoons, the BiFPN (Bi-directional Feature Pyramid Network) [14] is utilized for multi-scale feature fusion. Similarly, the Global Attention Module (GAM) [15] is introduced to enhance network performance by reducing information diffusion and amplifying global interactions. In addition, the CIoU [16] loss function is replaced with the WIoU (Wise-IoU) [17], which alleviates the impact of low-quality images on model detection and improves detection speed.

2. Materials and Methods
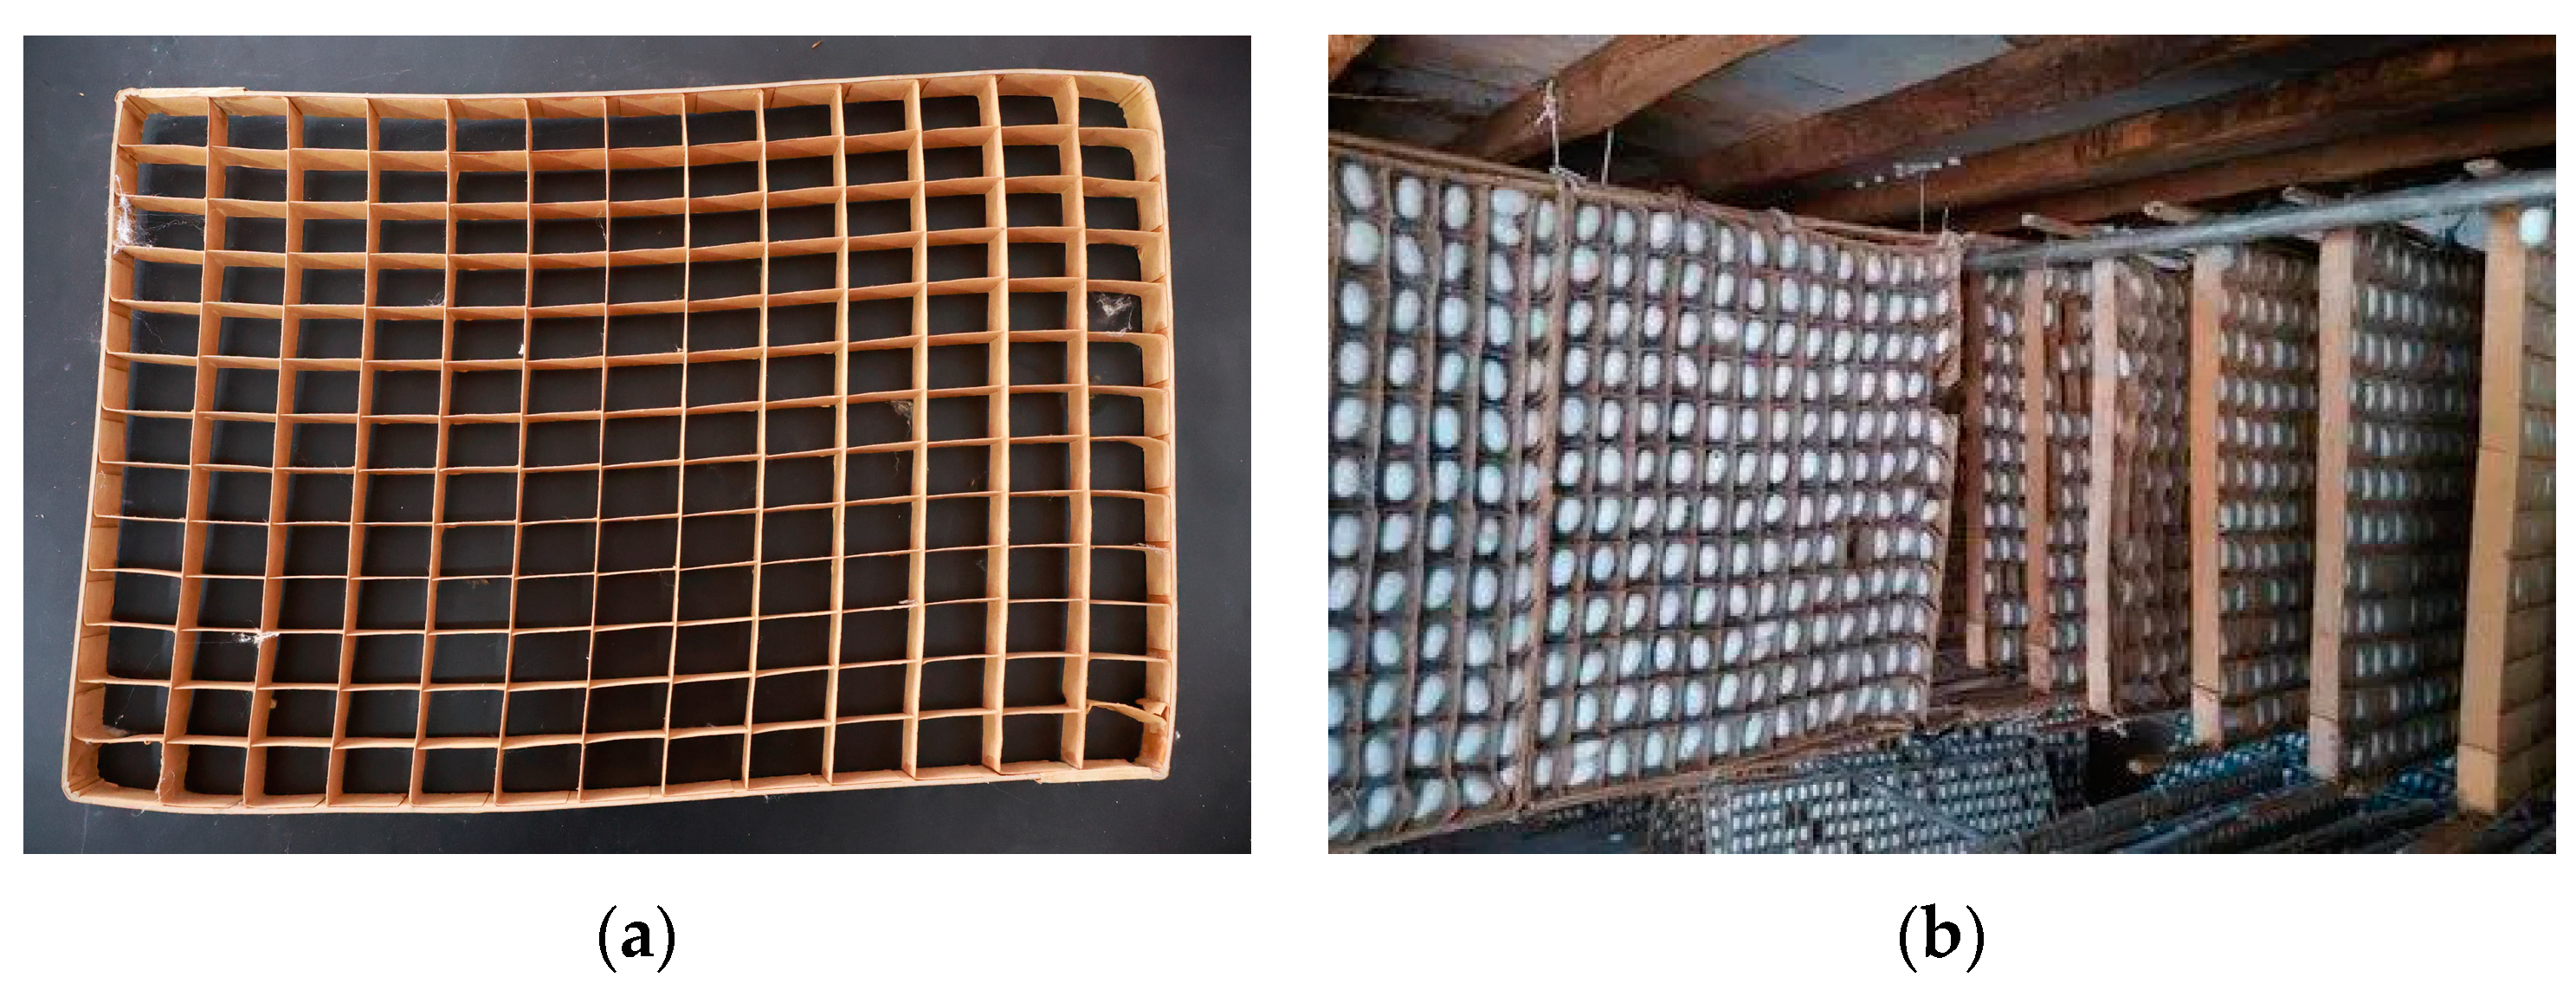
2.1. Materials

2.1.1. Dataset

The mountage cocoons used in the experiments were sourced from Yunkang NO. 1, provided by HaiTong Cocoon Silk Co., Ltd. in Rizhao City, Shandong Province, China, and the photographs were taken around May 2023. The specifications of the grid mountage were 585 mm × 390 mm, with a single grid size of 45 mm × 30 mm. The outer frame was made of 3 mm thick cardboard, while the internal grid consisted of 0.5 mm thick and thin cardboard. Each mountage encompassed 13 × 13 (169) grids. Image data were captured using an industrial camera (JIERUIWEITONG Co. Ltd., Shanghai, China) equipped with adjustable resolution and variable focus.
The camera was fixed above the mountage at a distance of 50 cm. Vertical photographs of both sides of the mountage cocoons were taken under different lighting conditions. A total of 210 mountage cocoon images were acquired. To enhance the generalization of the network, data augmentation operations such as translation, horizontal flipping, gauss noise addition, and brightness adjustment were applied to the original images. The dataset was expanded to 1050 images, with each mountage cocoon image containing 96 to 161 silkworm cocoons. The expanded dataset was randomly divided into a training set, a validation set, and a test set in a ratio of 8:1:1, i.e., 80% for the training set, 10% for the validation set, and 10% for the testing set, respectively. The training set consisted of 840 images, the validation set consisted of 105 images, and the test set consisted of 105 images, as shown in Table 1.

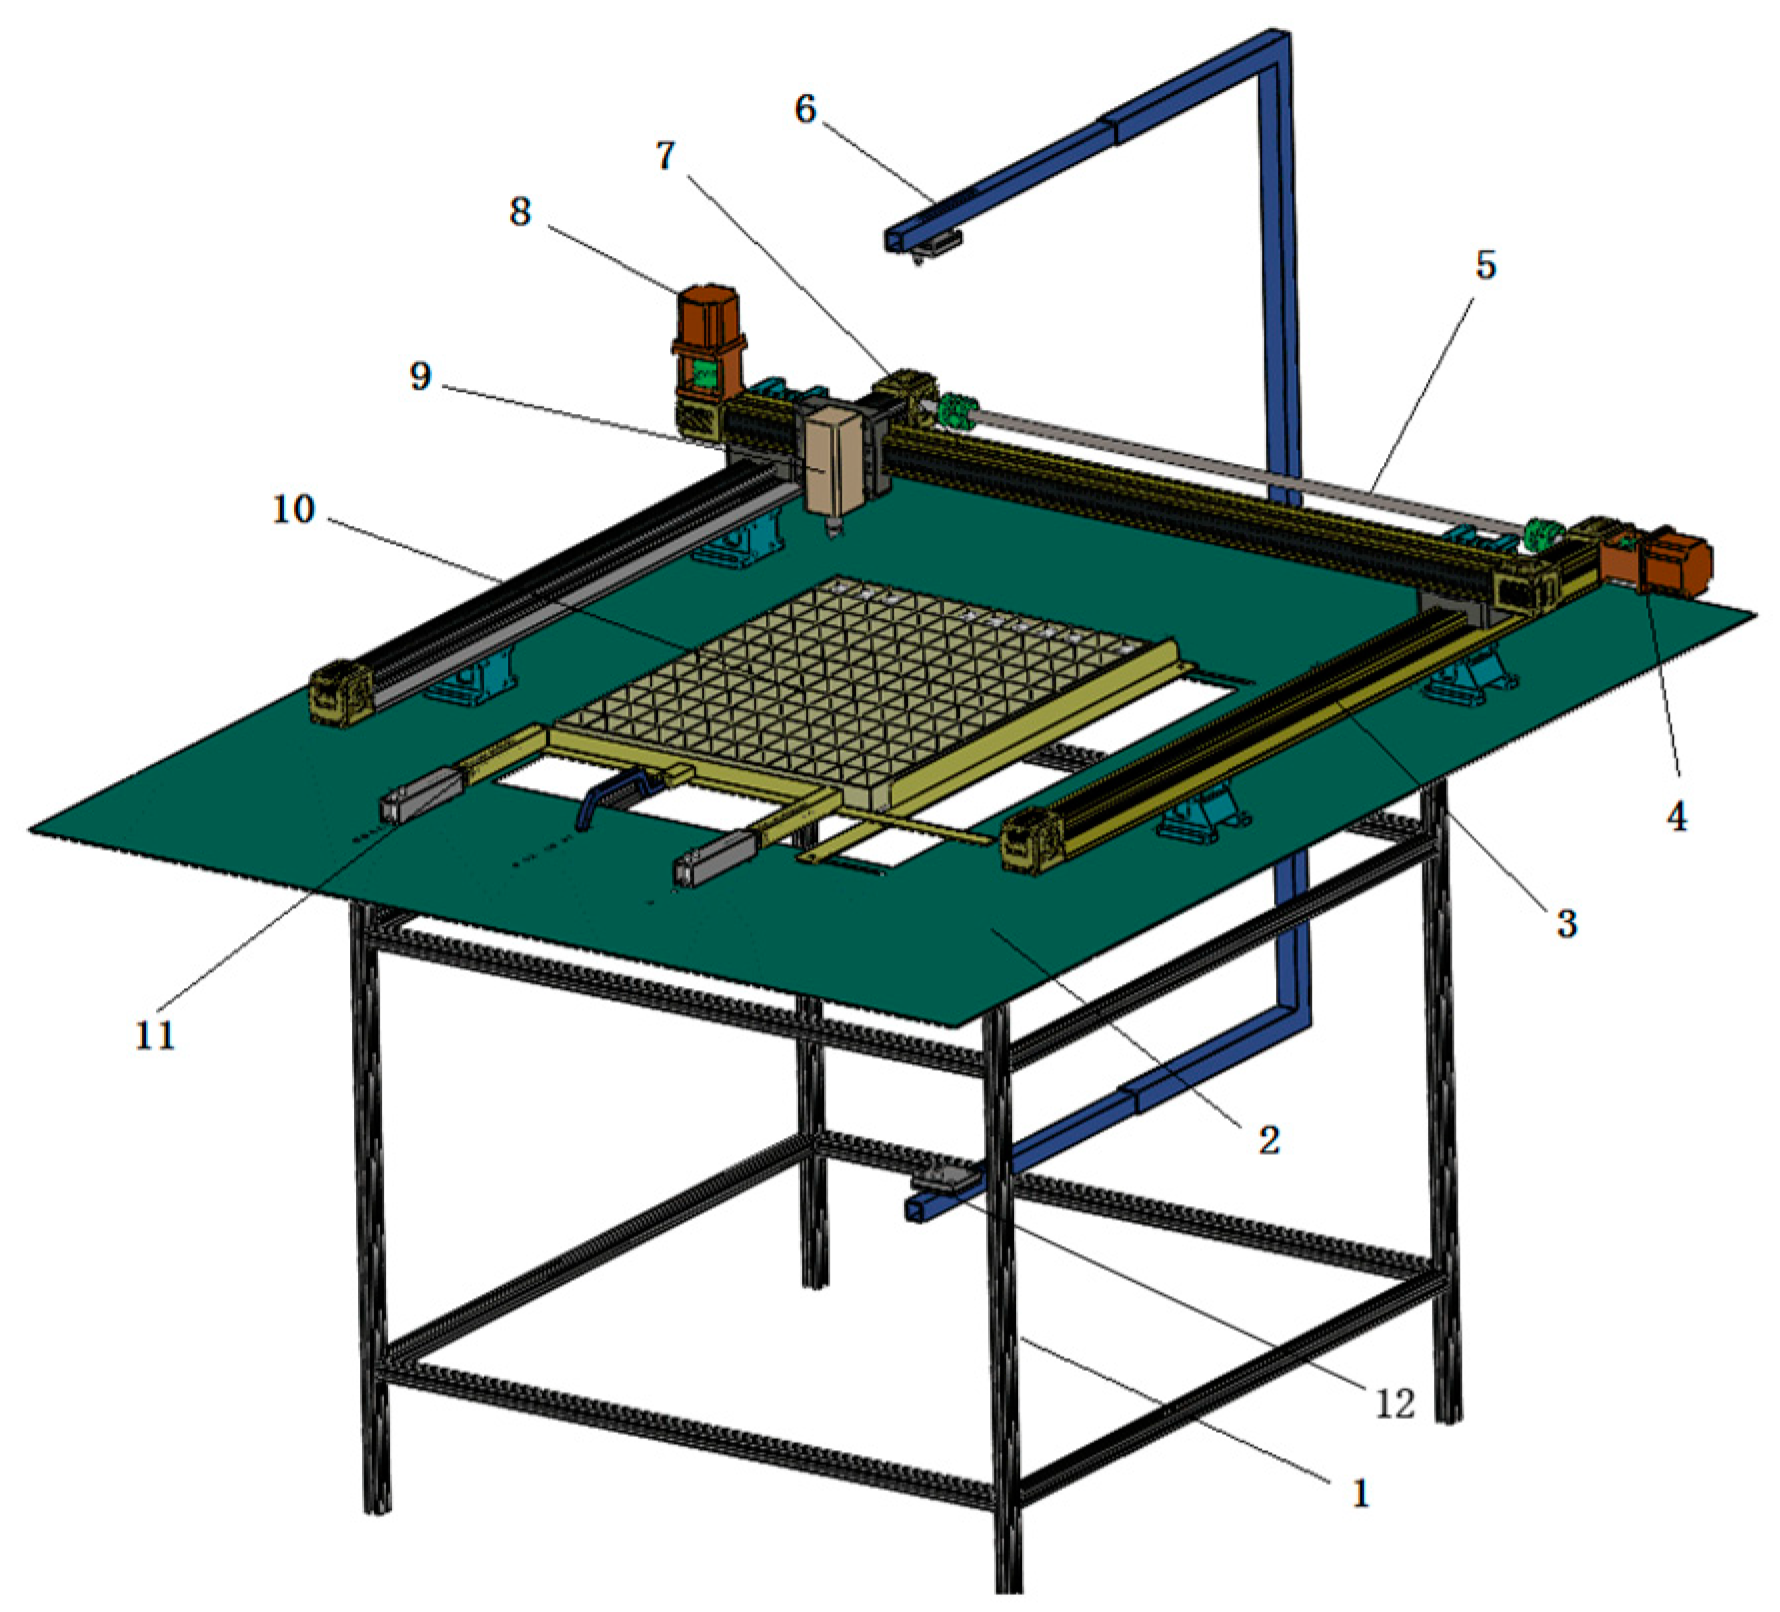
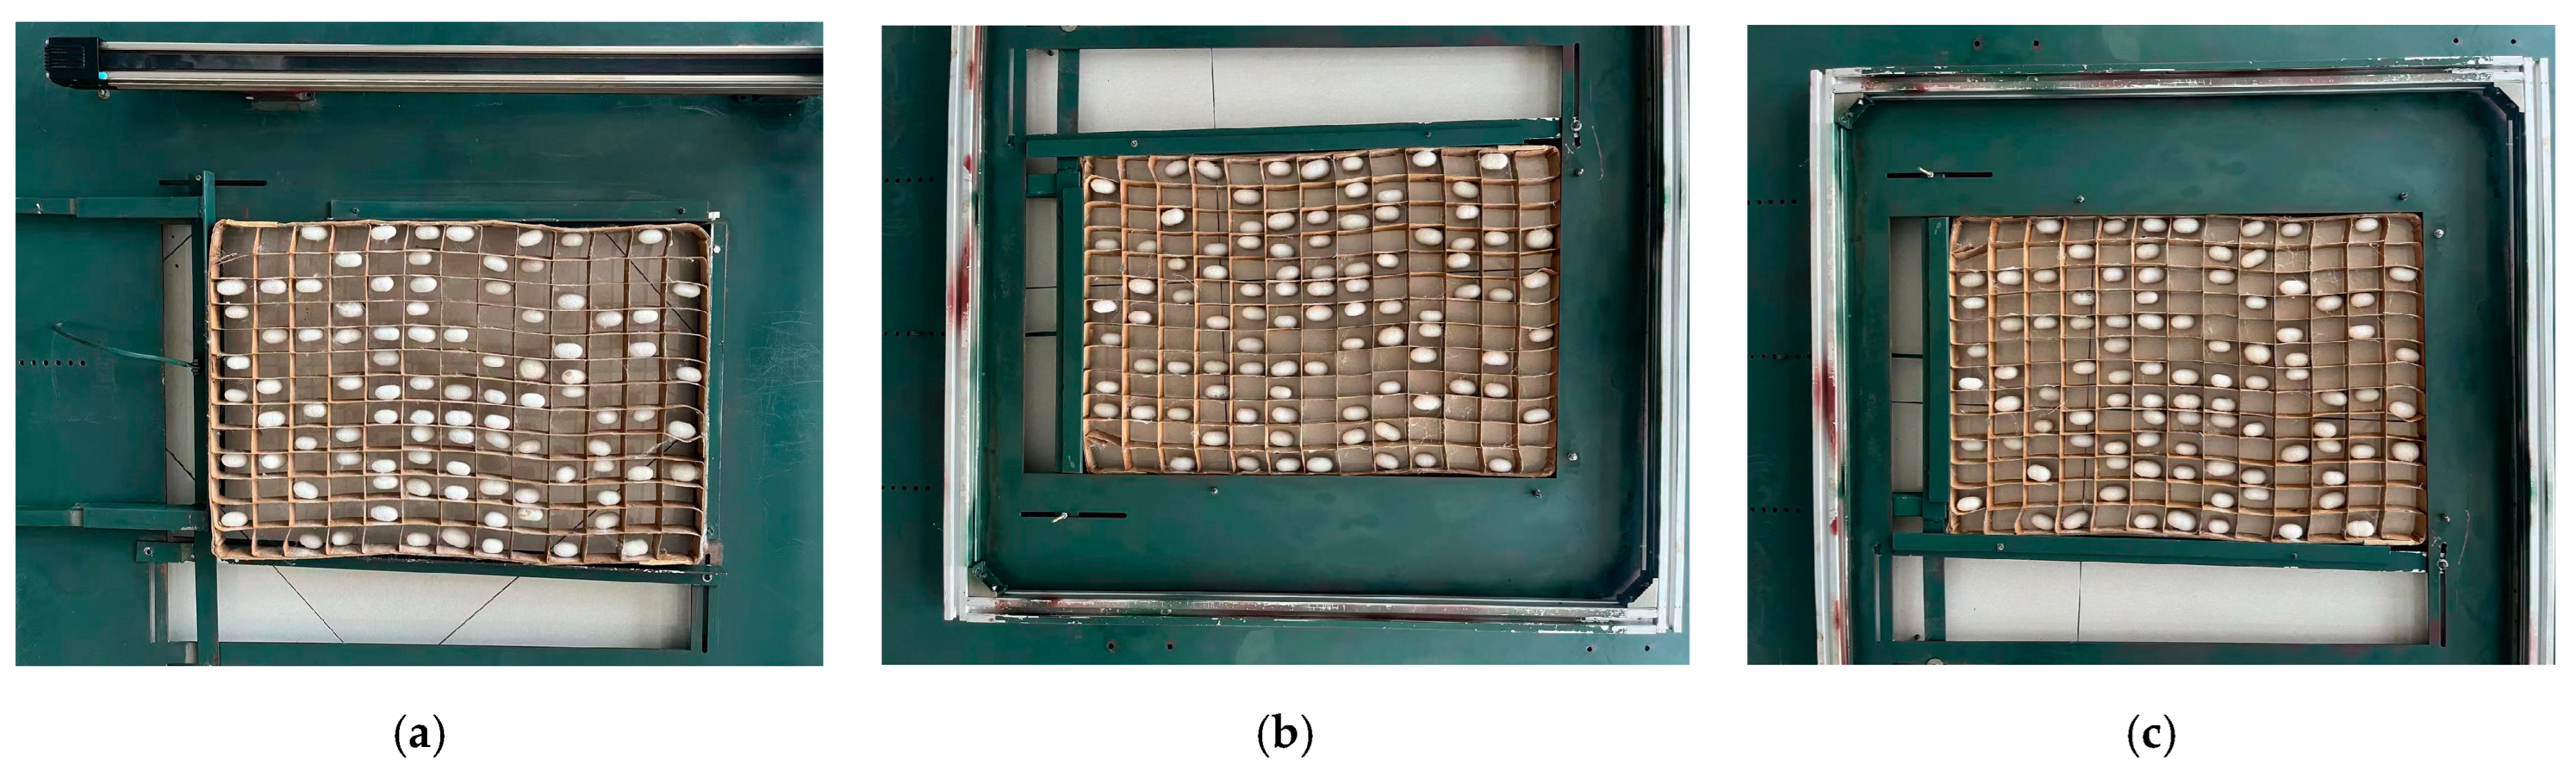
2.1.2. Cartesian Coordinate Automatic Cocoon Harvestor Setup

The structure diagram of the cartesian coordinate automatic cocoon harvestor (Figure 2) primarily consists of a picking mechanism, a visual acquisition device, and a control system. The picking mechanism includes x-axis guide rails, y-axis guide rails, and an electromagnetic picker. The x-axis guide rails consist of two synchronized guides connected by a transmission shaft, each with 1 m. The y-axis guide rail, equipped with an electromagnetic picker, is 1 m and moves along the x-axis guide rails. The electromagnetic picker comprises an electromagnet with a 60 mm trip and a one-way travel time of 0.5 s, along with a cocoon-picking head used for picking silkworm cocoons. The length of the silkworm cocoon is 33.5 mm ± 4.1 mm, and the diameter (long axis of the elliptical incision) is 18.4 mm ± 4.8 mm. The cartesian coordinate automatic cocoon harvestor achieves accurate positioning of the silkworm cocoons, with a maximum positioning deviation of 3.0 mm. The cocoon positioning is based on the central coordinates, and the positioning deviation does not affect the electromagnetic picker’s ability to pick cocoons, which meets precision requirements.
The vision system uses two cameras positioned above and below the work table. The control system is managed by a host computer, which controls the cameras for mountage cocoon image acquisition. The central coordinates of the silkworm cocoons are transmitted to the STM32 controller via the RS232 serial port. The STM32 controller, in turn, regulates the x-axis and y-axis stepper motors to position the electromagnetic picker precisely at the cocoon location. Activating the power supply allows the electromagnetic picker to perform the picking of silkworm cocoons. After successful picking, the picker places the corresponding classification box according to the quality of the cocoons, and the STM32 controller deactivates the power, releasing the electromagnetic picker and preparing it for the subsequent cocoon retrieval. This process continues iteratively until all mountage cocoons are picked, completing the sorting task.

2.1.3. Experimental Platform

The hardware platform for model training and testing is the HP Z820 workstation, with the key configurations shown in Table 2.

2.1.4. Evaluation Indicators

To evaluate the performance of the model, several metrics are used as evaluation indicators, including precision ( P ), recall ( R ), F 1 score, average precision ( A P ), and mean average precision ( m A P ) for all categories with a confidence threshold of 0.5. The calculations are performed according to the following formulas.
P = T P T P + F P × 100 %
R = T P T P + F N × 100 %
F 1 = 2 P R P + R
A P = 0 1 P ( R ) d R
m A P = i = 0 c A P i C
where T P is true positives, F N is false negatives, F P is false positives, and C is the total number of target categories detected.

2.2. Methods

The silkworm cocoons are similar in shape, color, and size, with variation limited to details such as texture and local color. This falls within the scope of fine-grained image classification. To minimize interference from background factors and emphasize the algorithm’s focus on silkworm cocoons, a two-step strategy was employed: Initially, MobileSAM was used for semantic segmentation, complemented by area threshold filtering to extract silkworm cocoons from mountage images. Following this, the YOLOv8 target detection model was developed for cocoon classification. Based on the attributes specific to the silkworm cocoon, enhancements such as feature fusion, attention mechanisms, and optimizations to the loss function were integrated into the YOLOv8 framework. Finally, to validate the effectiveness of the algorithm, a classification and picking experiment was performed on mountage cocoons using the cartesian coordinate automatic cocoon harvestor. The specific algorithm flow is shown in Figure 3.

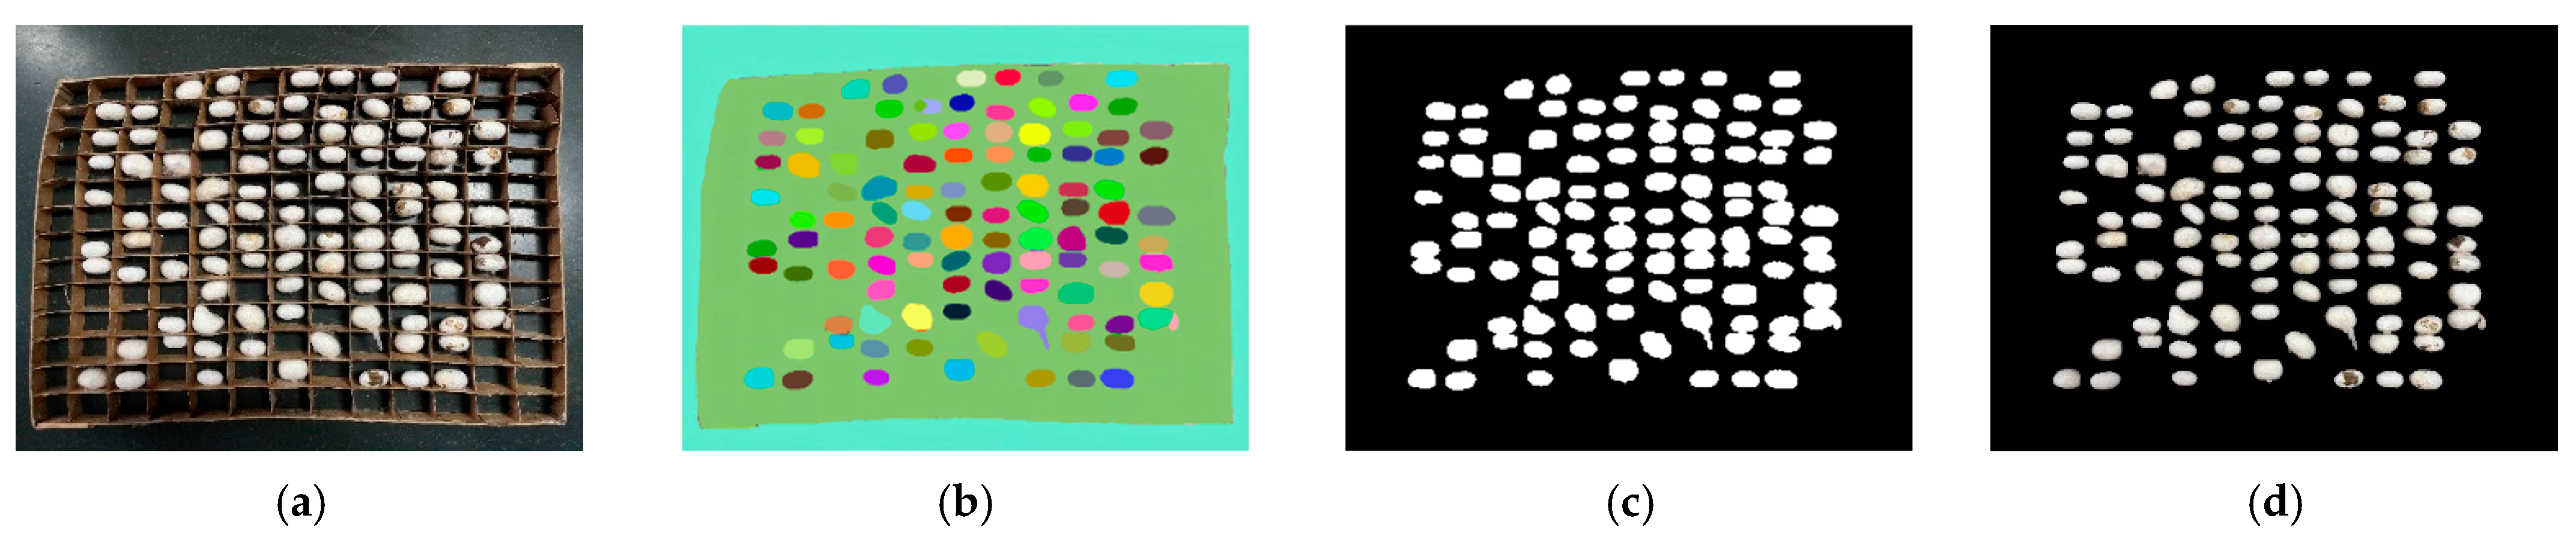
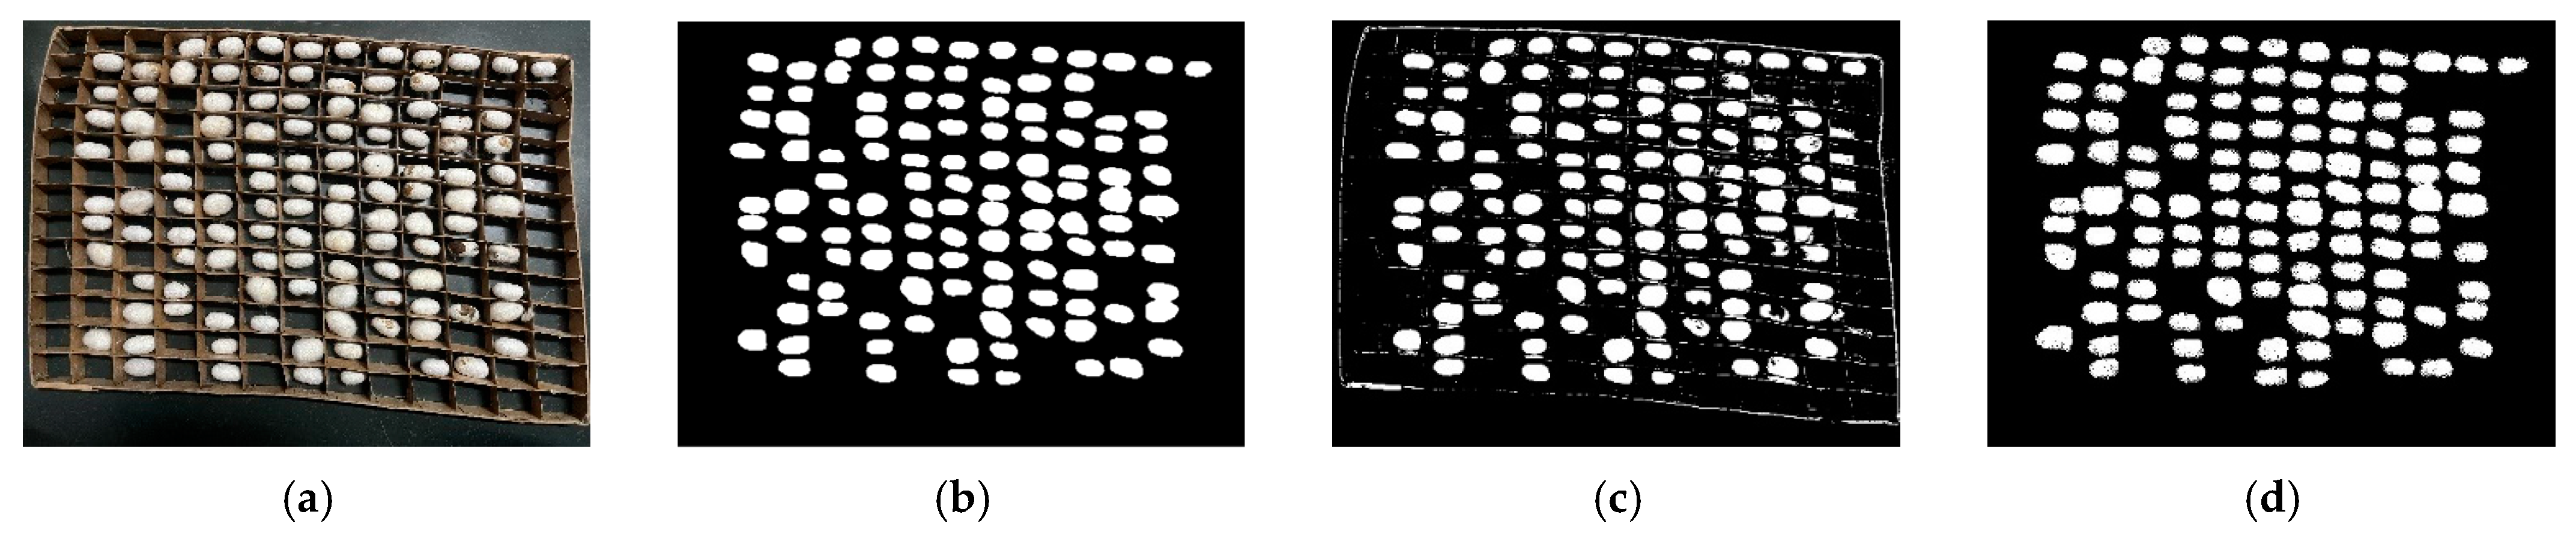
2.2.1. Segmentation Model Based on MobileSAM and Area Threshold

Segment Anything Model (SAM) [18] is a segmentation model proposed by Meta in April 2023. It is trained by using the Segment Anything 1-Billion (SA-1B) mask dataset, which contains over 11 million images and more than a billion masks. SAM demonstrates the capability to automatically identify potential objects within an image and generate unlabeled masks without the need for additional training. However, SAM’s backbone uses a Vision Transformer (ViT) [19], characterized by a large number of parameters and imposing high hardware requirements. Consequently, we opted for a more lightweight model, MobileSAM, for the semantic segmentation of mountage cocoon images.
The architecture of MobileSAM comprises two parts: the Image Encoder and the Mask Decoder. For the Image Encoder, MobileSAM replaces the original ViT in SAM with a lightweight ViT [20]. This lightweight ViT achieves a reduction in parameters from 632 M to 5.78 M via the implementation of knowledge distillation. In particular, the lightweight ViT incorporates a non-overlapping window attention structure, mitigating the computational load associated with high-resolution inputs and thereby achieving model lightweightness. Via the Image Encoder, the image is transformed into image embeddings.
The Mask Decoder employs two decoder layers, each of which includes both self-attention and cross-attention mechanisms in two directions for updating all image embeddings. Following the execution of two decoder layers, image embedding is upsampled. Subsequently, a multi-layer perceptron (MLP) maps the output token to a dynamic linear classifier, which computes the mask foreground probability at each image location.
The masks generated by MobileSAM retain semantic information for various objects such as silkworm cocoons, mountage, background, etc. However, we only need silkworm cocoon masks. Therefore, we designed an adaptive area threshold filtering algorithm. Initially, the algorithm identifies the mountage mask and background mask based on the area of the mask color. Subsequently, the color values for these two masks are set to 0, while the colors corresponding to silkworm cocoon masks are set to 1. This process results in a binary segmentation image for silkworm cocoons. This segmented image is then masked to the original color image, resulting in a final-colored image that exclusively preserves the silkworm cocoons (Figure 4).

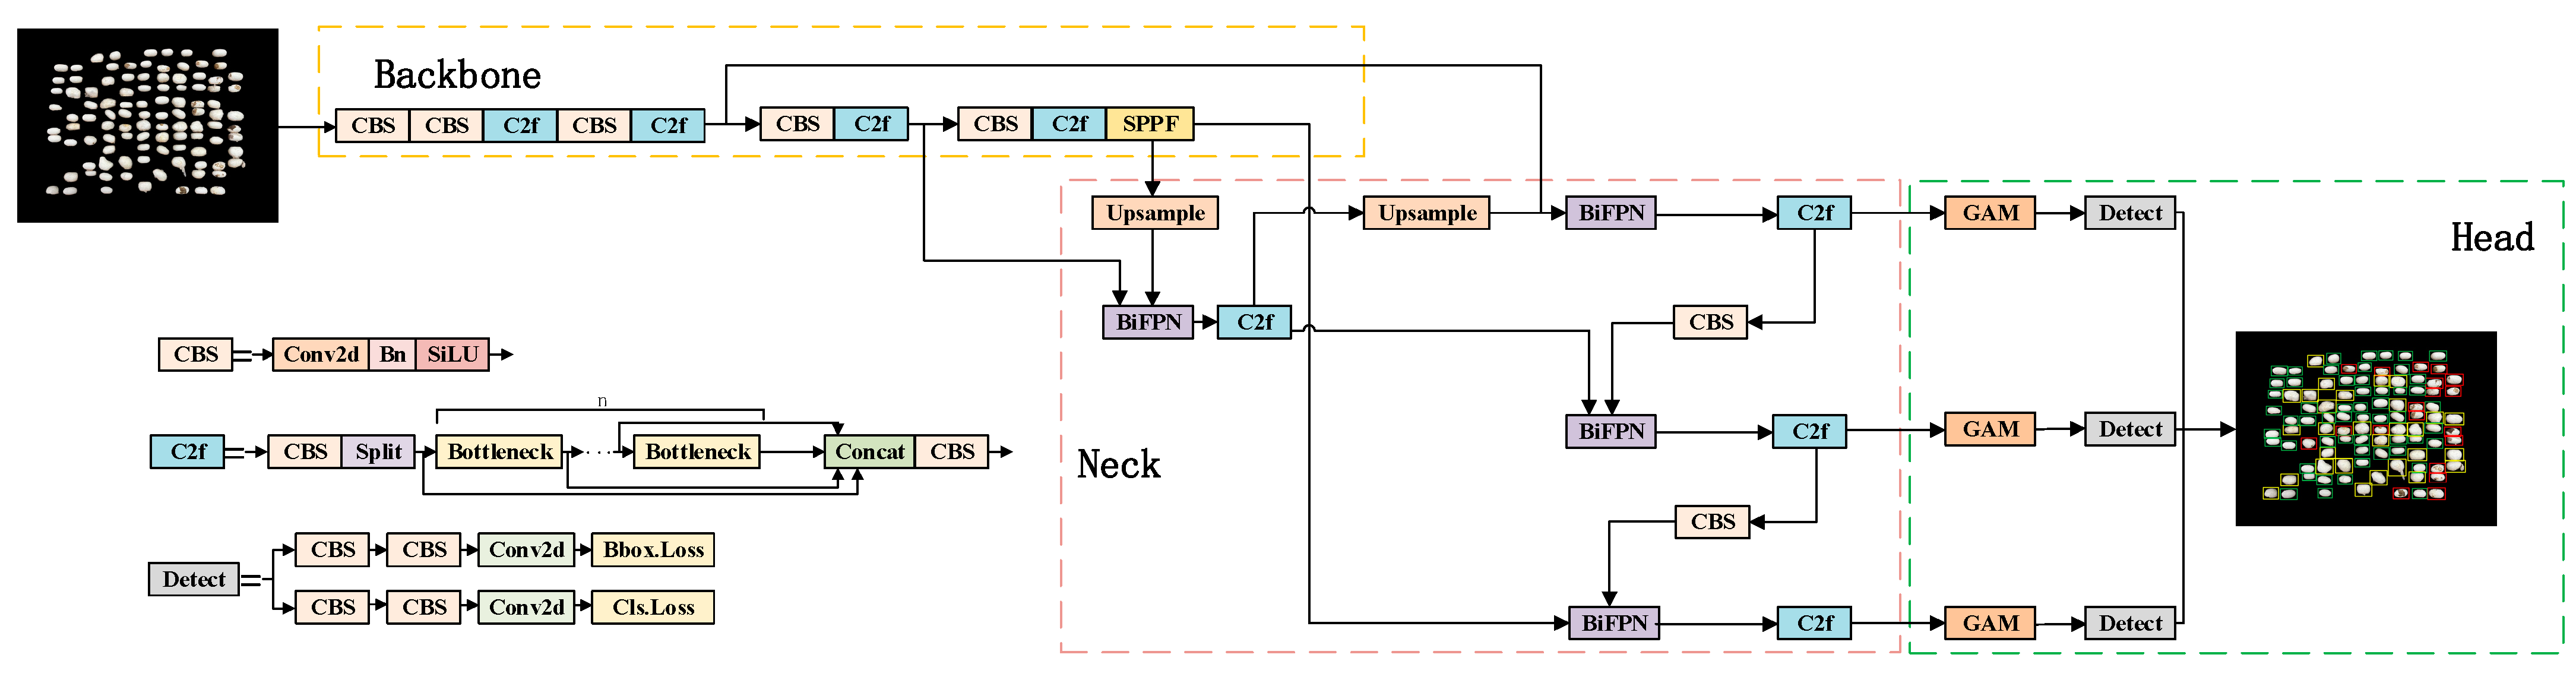
2.2.2. Establishment and Improvement in YOLOv8 Model

(1)
YOLOv8 model structure.
The detection and classification of extracted silkworm cocoons are based on the current classical one-stage algorithm YOLOv8 [21]. Compared with other models in the YOLO [22,23], it exhibits faster speed and higher accuracy.
YOLOv8 mainly consists of a backbone feature extractor, a feature fusion network, and an end-to-end decoupled prediction head. The input employs adaptive image scaling to adjust the input size, coupled with mosaic data augmentation to enhance the model’s robustness. The backbone comprises CBS modules, C2f modules, and SPPF modules. The CBS module includes convolutional layers, batch normalization, and the SiLU activation function. The C2f module draws inspiration from the C3 module for feature extraction. It introduces skip connections and additional split operations to ensure lightweight while obtaining richer gradient flow information. SPPF module performs feature fusion via convolution and three max-pooling operations. It adaptively integrates features from various scales, thereby enhancing the model’s feature extraction capability.
The neck processes features extracted by the backbone. It employs the PANet structure with top-down and down-top cross-layer connections, achieving comprehensive feature fusion. The head adopts a decoupled head structure, separating detection and classification. By using score-weighted classification and regression, it effectively determines positive and negative samples. This approach enhances the model’s performance.
(2)
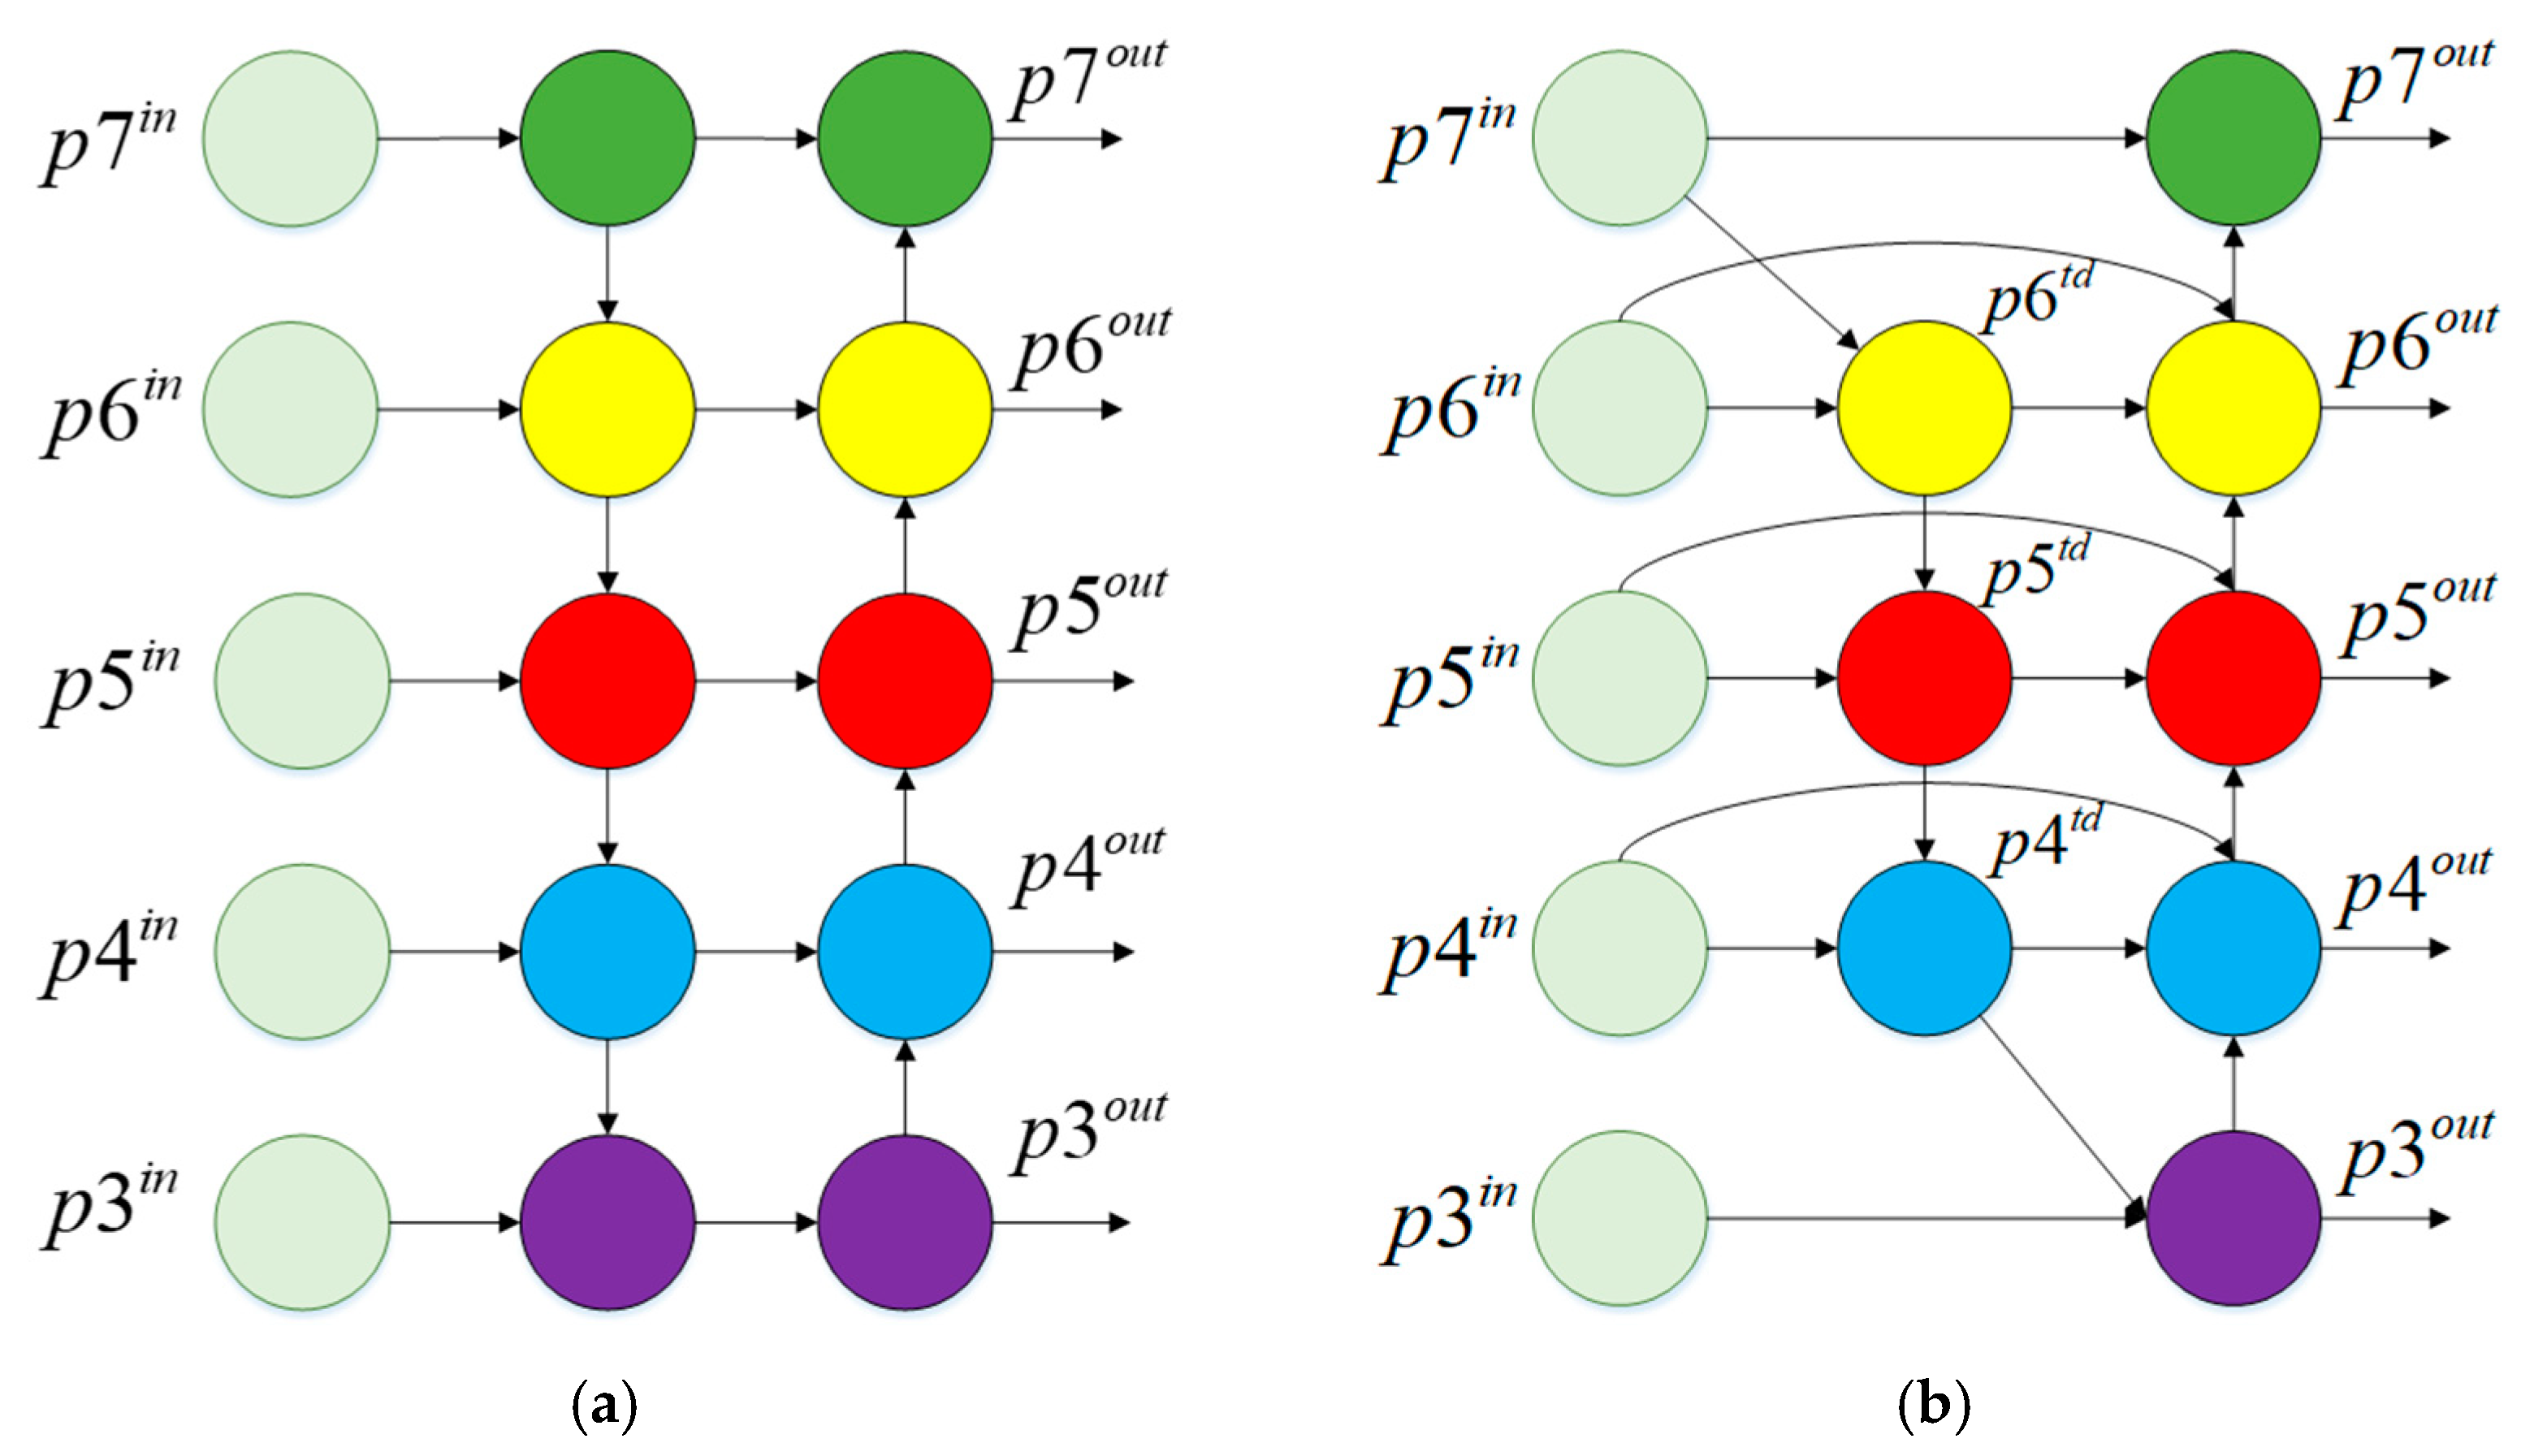
Multiscale feature fusion.
Due to the varying scales in the feature extraction network, shallow-layer networks often show better detection results for smaller-scale targets due to their larger-scale high-resolution feature maps. On the other hand, deep-layer networks contain more semantic information and larger receptive fields for small-scale feature maps. Via lateral connections and a pyramid-like hierarchical structure, the PANet [24] in the YOLOv8’s neck integrates features from different scales to enhance positional information. However, the accuracy of small-scale target detection is low because of the lack of raw feature information extracted by the backbone. The differences between cocoons are mostly subtle local details, requiring more accurate target detection. We replaced the YOLOv8 feature fusion network with the BiFPN (Bidirectional Feature Pyramid Network).
The BiFPN structure is shown in Figure 5b. It removes some nodes with only one input edge and adds the skip connections from the original input to the output node, which reduces the computational complexity. As the skip connections in the BiFPN can greatly preserve the original information in the feature maps, it improves the information exchange between different scales and levels in silkworm cocoon images. In addition, the p 3 i n large-scale feature map has a better effect on detecting small targets, such as the surface of the cocoon, thus improving the network’s ability to detect subtle features in cocoon images. The model’s generalization is further improved. The feature fusion formula of the BiFPN is as follows.
O = i W i e + i W j I i
where O stands for output, I i stands for input, and e is the minimal learning rate used to constrain numerical oscillations. W i and W j stand for weights.
Taking the p 6 as an example, the corresponding formula describes the situation of the two fused features illustrated in Figure 5b at the p 6 .
P 6 t d = C o n v ( w 1 P 6 i n + w 2 R e s i z e ( P 7 i n ) w 1 + w 2 + ε )
P 6 o u t = C o n v ( w 1 P 6 i n + w 2 P 6 t d + w 3 R e s i z e ( P 5 o u t ) w 1 + w 2 + w 3 + ε )
where C o n v represents the convolution, and R e s i z e stands for downsampling. w is the weight of each layer, used to describe the importance of each feature in the feature fusion, ε is a minimal non-zero constant to prevent the denominator from being 0.
The BiFPN improves the feature map scale via upsampling and convolution operations to achieve top-down fusion. A weighted feature fusion mechanism is used to achieve skip connections, thus introducing large-scale feature maps into the neck. Simultaneously, the feature map scale is reduced via downsampling and convolution operations to achieve bottom-up fusion. It ensures the comprehensive fusion of feature maps at different scales, preserving the original features and further improving the accuracy of the network in detecting cocoon defects.
(3)
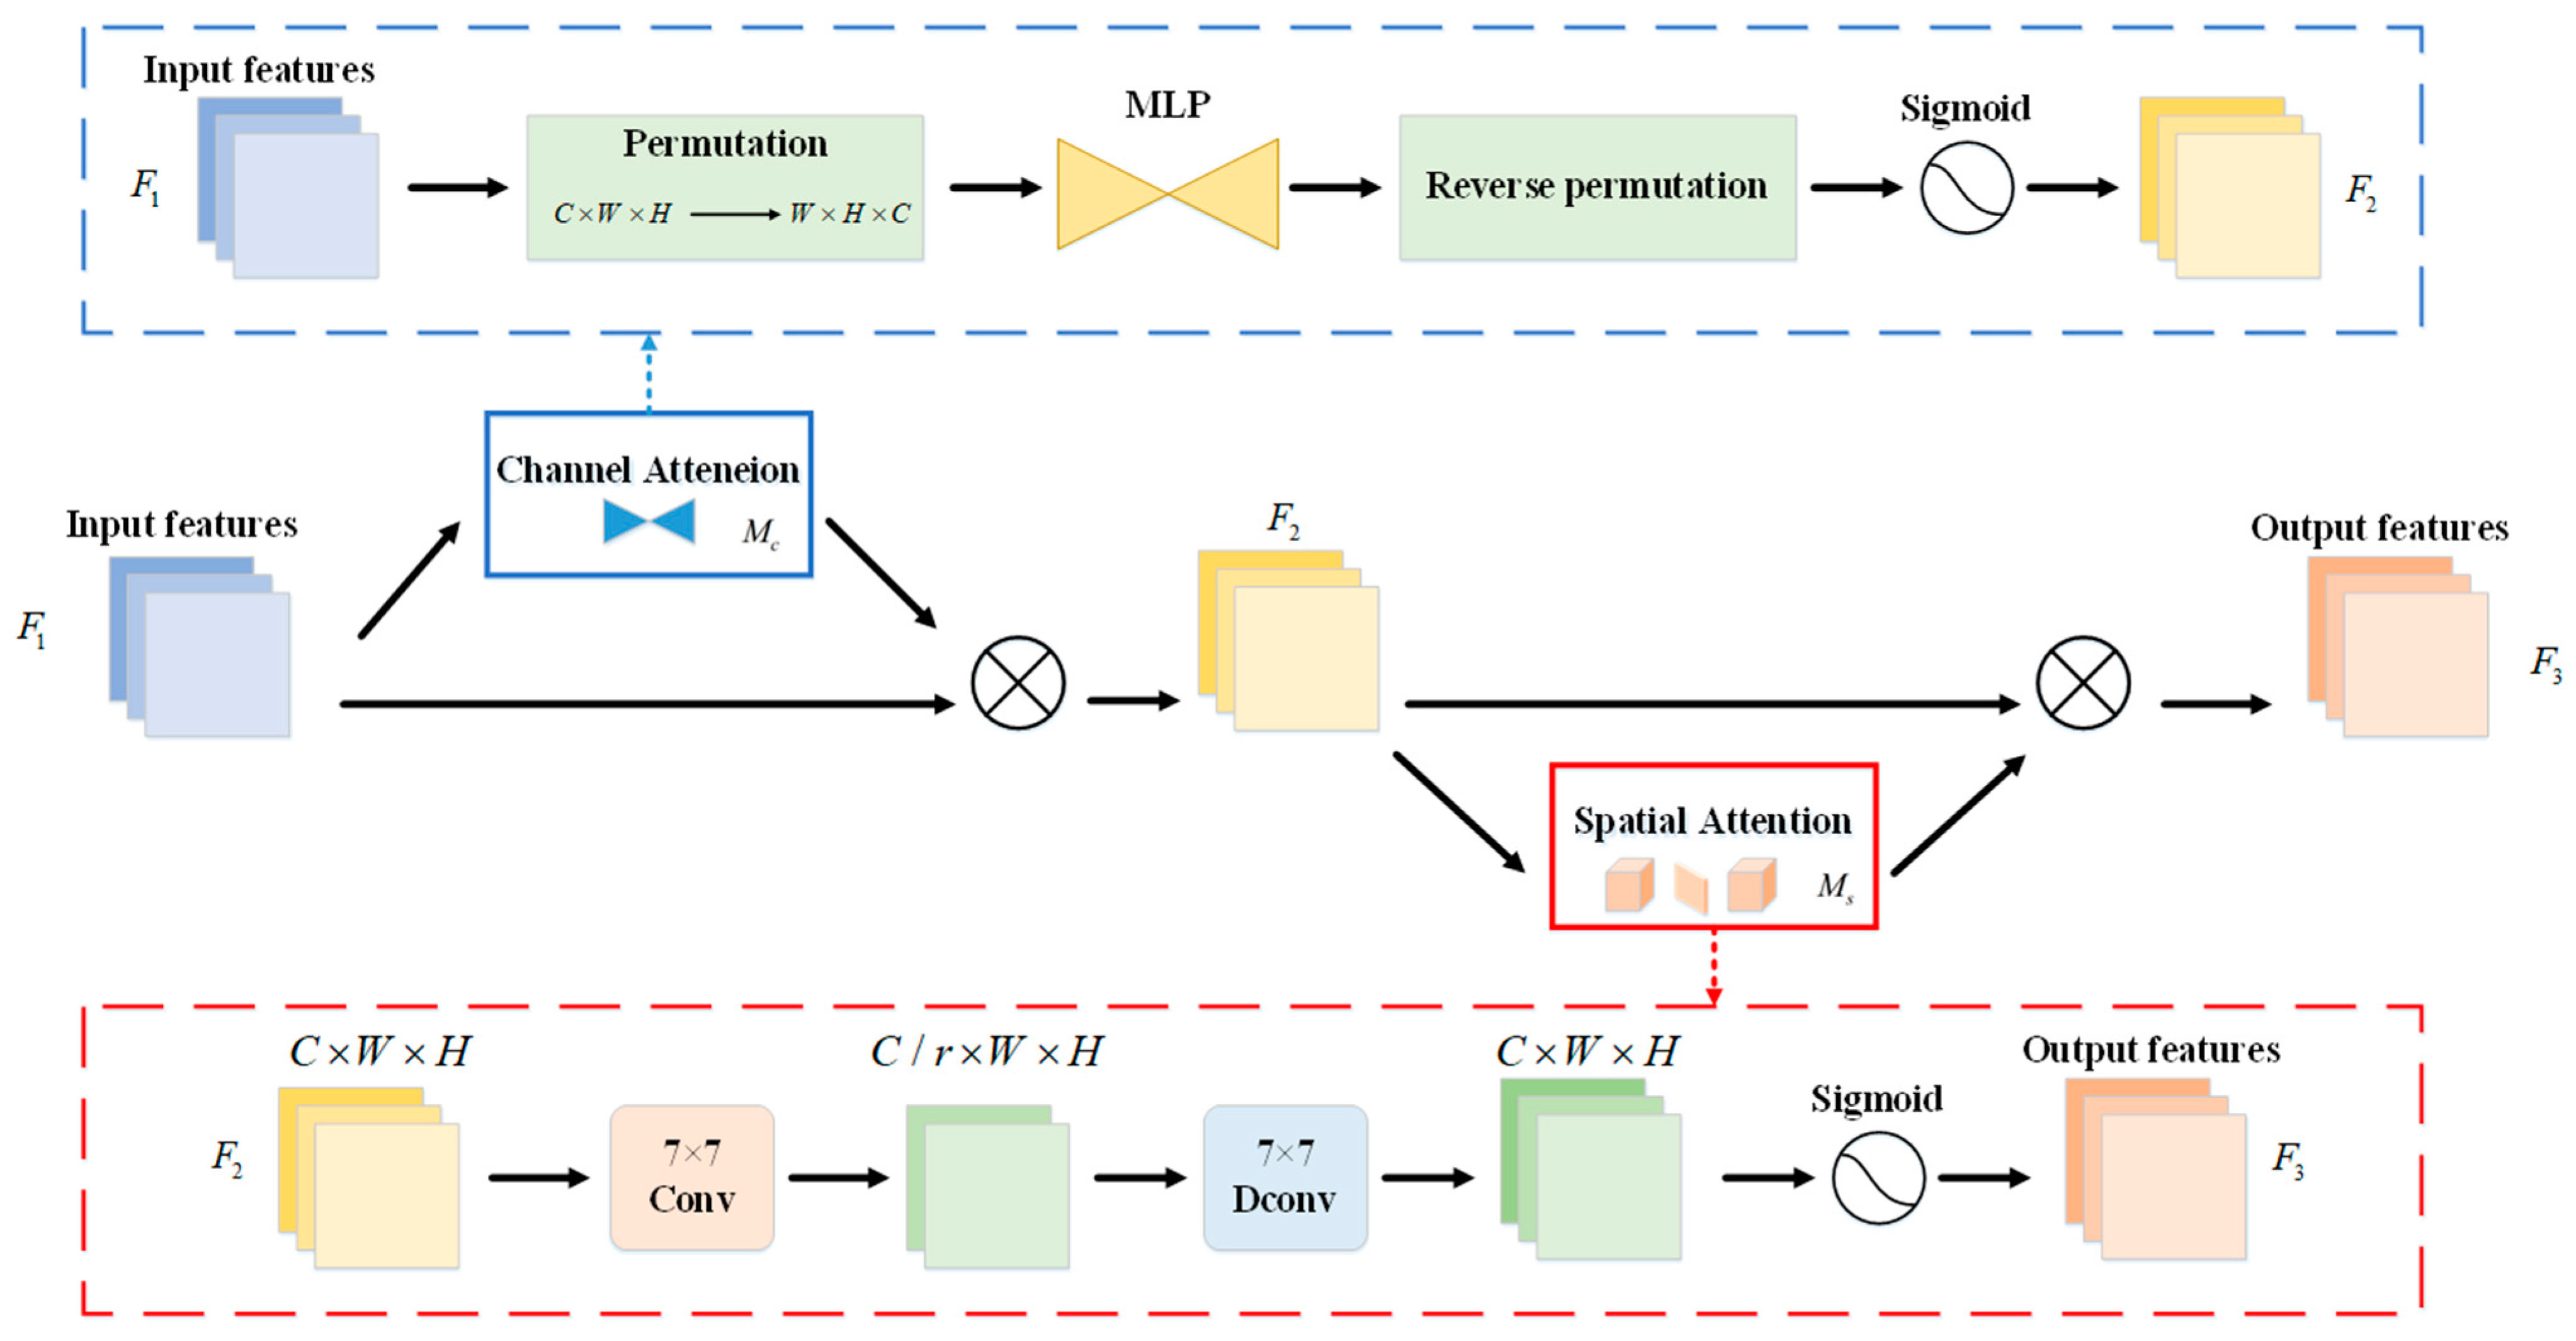
Add an attention mechanism for double cocoon recognition.
The surface color of both the reelable cocoon and the double cocoon is uniformly white, and their RGB images are shown in Figure 6. The most reliable feature for detecting them is surface texture. The texture of the reelable cocoon is more regular and smoother, while the texture of the double cocoon is complex and rough. However, a mountage cocoon image contains about 100 cocoon images. The pixel of a single cocoon image is too small, making it difficult for the model to effectively focus on the cocoon texture. The attention mechanism can quickly scan the image, identify areas of interest, and perform more operations on specific areas, which is an effective method to improve detection efficiency. In this paper, the Global Attention Mechanism (GAM) is introduced in the YOLOv8 to improve the detection performance. Its structure is shown in Figure 7.
The input feature map F 1 R C × H × W , middle feature map F 2 , and output feature map F 3 are defined. The expressions are
F 2 = M c F 1 F 1
F 3 = M s F 2 F 2
where M c and M s are the channel and spatial attention feature maps, respectively; denotes element-wise multiplication.
After F 1 input, 1D convolution is performed by the channel attention submodule. The obtained convolution result is multiplied element-wise by the F 1 to obtain the F 2 . Subsequently, 2D convolution is applied to F 2 in the spatial attention submodule, and the result is element-wise multiplied with F 2 to obtain the F 3 . The channel attention submodule uses 3D permutation to retain information across three dimensions. It then magnifies cross-dimension channel–spatial dependencies with a two-layer MLP. Finally, a 1D convolutional feature map is obtained via reverse permutation. To focus on spatial information, two convolutional layers are used for spatial information fusion after F 2 input in the spatial attention submodule. Meanwhile, max-pooling reduces the information and contributes negatively.
The GAM can improve the performance of the model by reducing the information reduction and magnifying global dimension-interactive features. In this paper, we integrate the GAM into the Head of the YOLOv8 for network optimization. By combining channel attention and spatial attention, the network effectively focuses on feature information, improving the accuracy of double cocoon detection at a lower computational cost.
(4)
Optimization of the loss function for the waste cocoon recognition.
The waste cocoon contains many types, and defects are expressed in various forms. As shown in Figure 8, perforated cocoons are characterized by the presence of holes in the cocoon layer, with relatively small hole areas, while decayed cocoons exhibit surface contamination areas larger than 1 cm2. Minor surface defects may easily be ignored by the model and misidentified as reelable cocoons. On the contrary, with serious surface defects, the features of the cocoon will not be obvious, and the outline will be blurred, resulting in false negatives.
During the training, blindly reinforcing the bounding-box regression for low-quality samples will cause the model to optimize similarity unreasonably, which will reduce the detection accuracy. The loss of the YOLOv8 model consists of loss_iou (location loss) and loss_cls (classification loss). In this paper, to address issues with low-quality data during model training, we improve the loss_iou in the YOLOv8 by replacing the original CIoU with WIoU.
Wise-IoU (WIoU) is an IoU-based loss with a dynamic non-monotonic focusing mechanism. This focusing mechanism uses the outlier degree instead of IoU to evaluate the quality of anchor boxes and provides a wise gradient gain allocation strategy. The strategy reduces the harmful gradients produced by allocating small-quality gradient gain to low-quality examples while enhancing the focusing ability of ordinary-quality anchor boxes to improve model detection performance for waste cocoons. Assuming that the corresponding position of ( x , y ) in the target box is ( x g t , y g t ) , its formula is
L W I o U = L I o U * L I o U ¯ δ α β δ exp x x g t 2 ( y y g t ) 2 W g 2 + H g 2 L I o U
L I o U = 1 I o U
where I o U stands for Intersection over Union; W g and H g are the width and height of the overlap between the predicted box and the real box; α and δ are learning parameters. L I o U ¯ is the dynamic average Intersection over Union with momentum m; L I o U * is the constant to which the variable L I o U ¯ is transformed.
WIoU can effectively address the issue of low-quality samples in the detection of waste cocoons. Moreover, since the calculation of the aspect ratio scale of the CIoU bounding box is eliminated and replaced with a dynamic non-monotonic focusing mechanism that requires less calculation, the model inference speed has been improved.
At this point, this paper completed improvements to the YOLOv8 neck and loss function, as well as the addition of attention mechanisms. The improved model structure is shown in Figure 9. In the neck, the BiFPN was integrated for feature fusion, and the WIoU loss function was employed to reduce the negative effects of low-quality samples. Finally, the GAM was added to the head to enhance its feature extraction capability.

3. Experimental Results and Discussions

3.1. Silkworm Cocoon Sorting Experiment

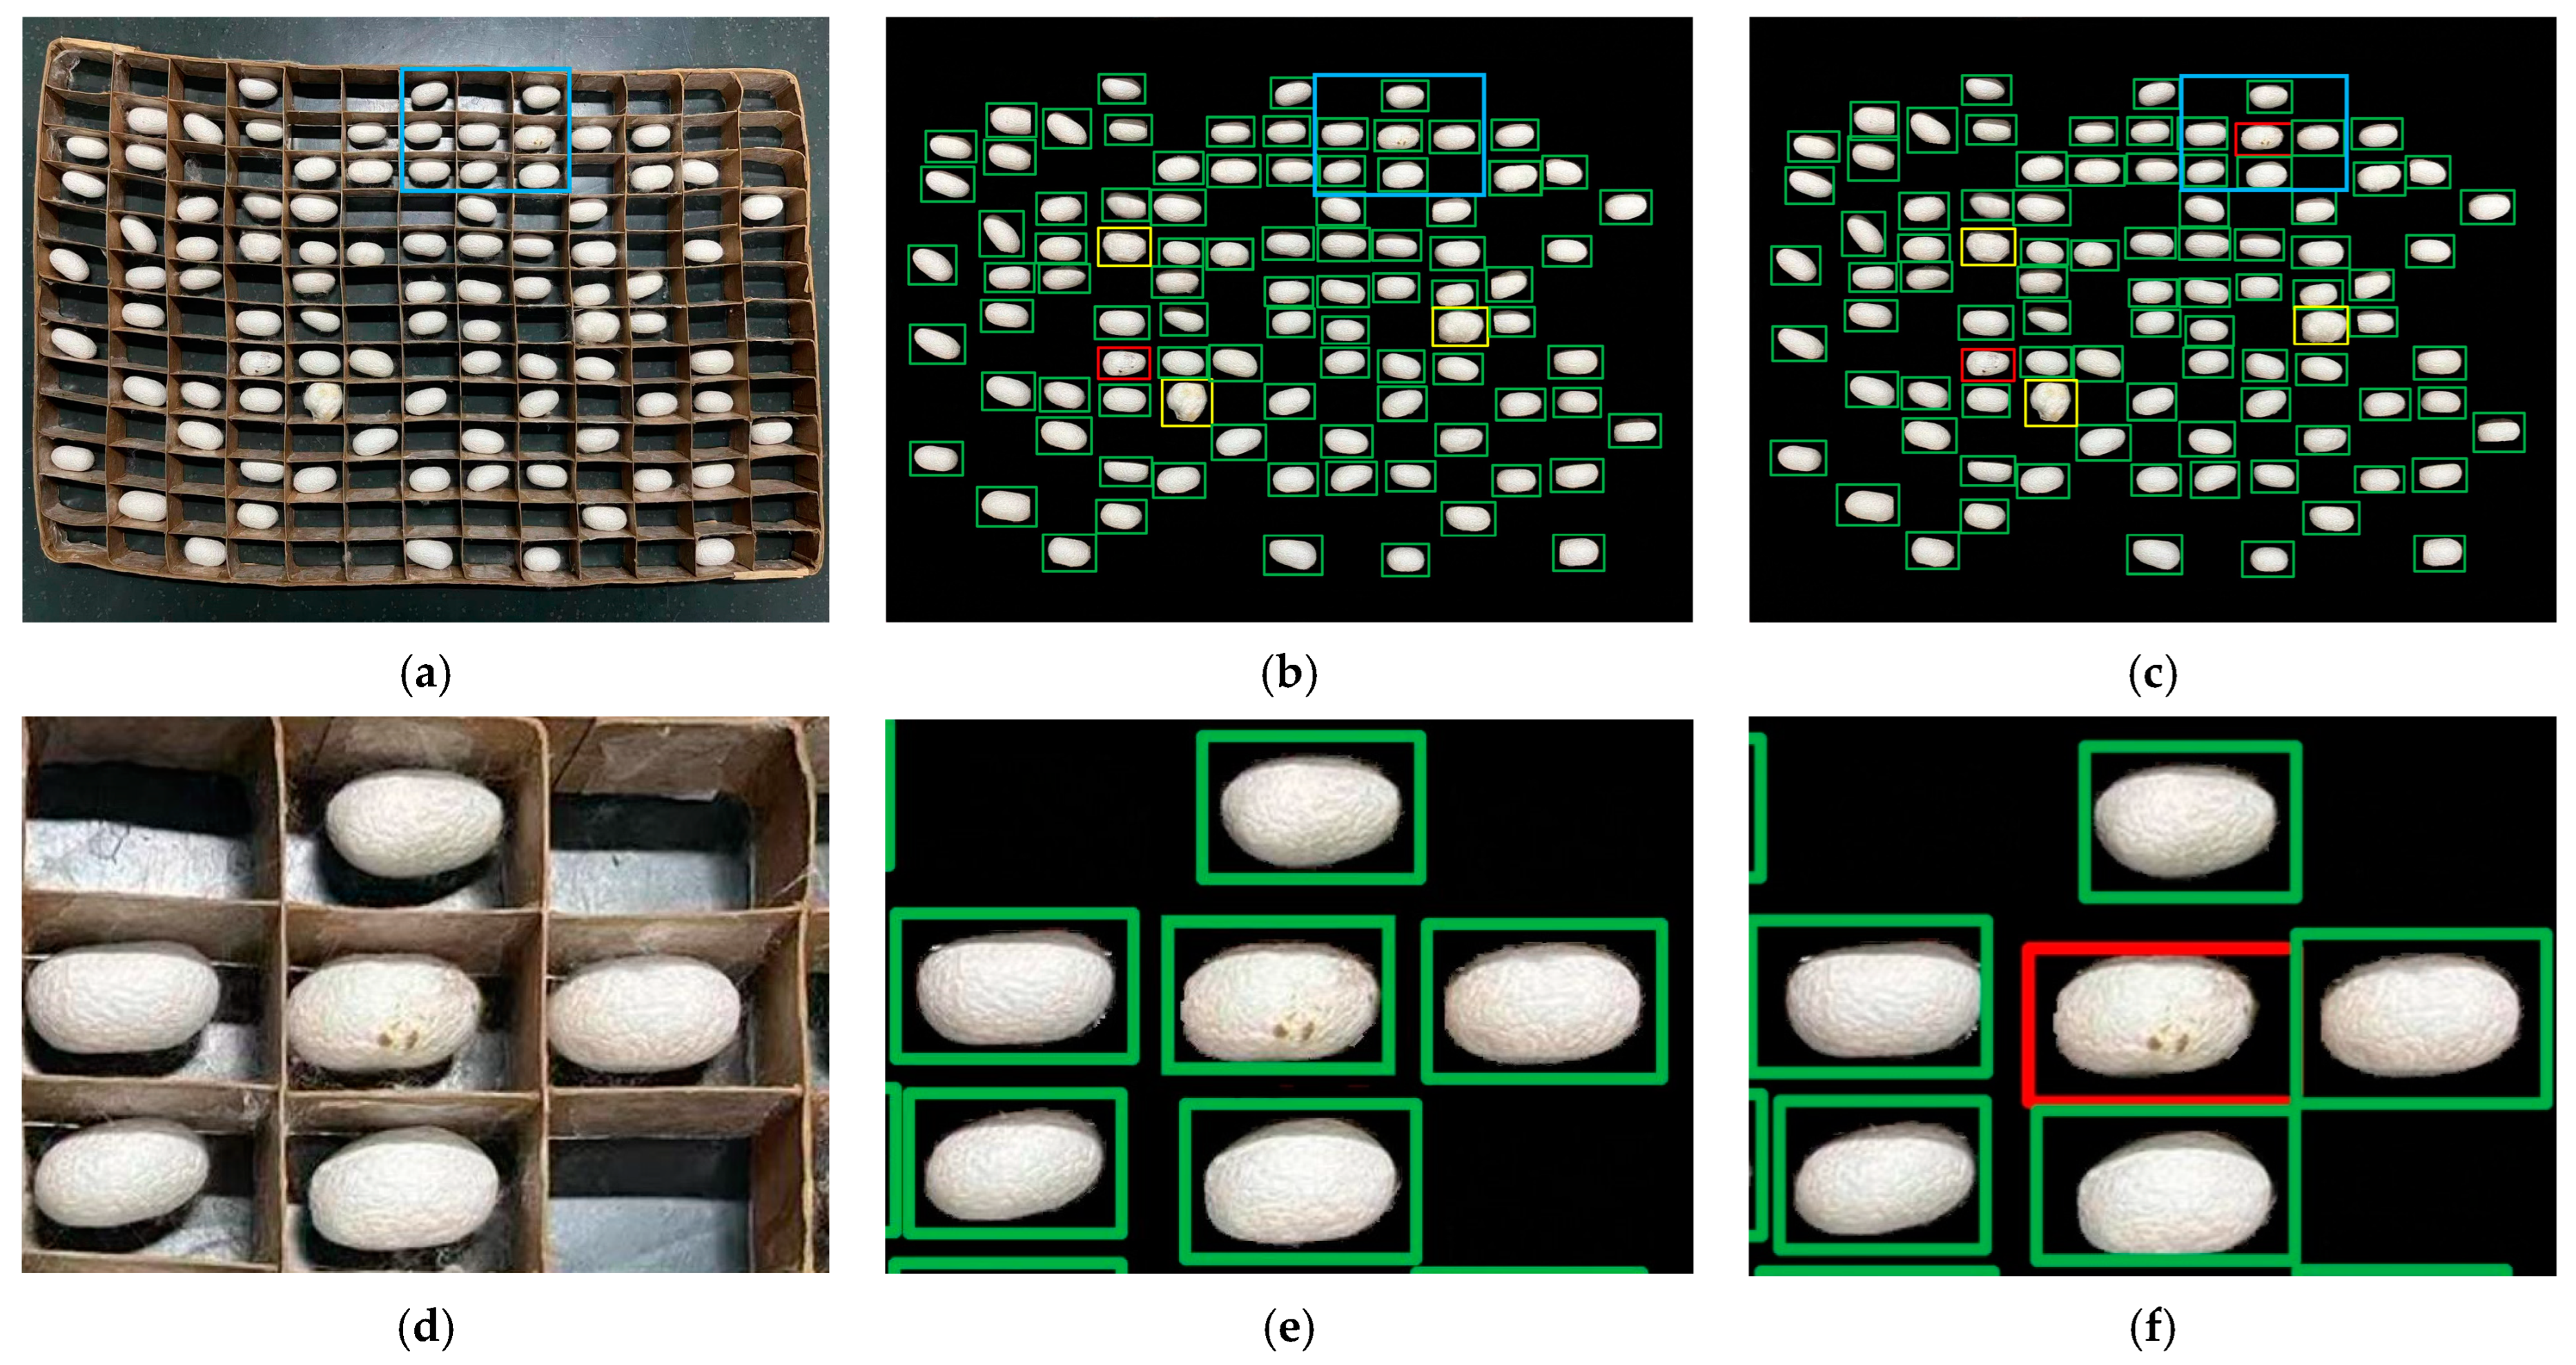
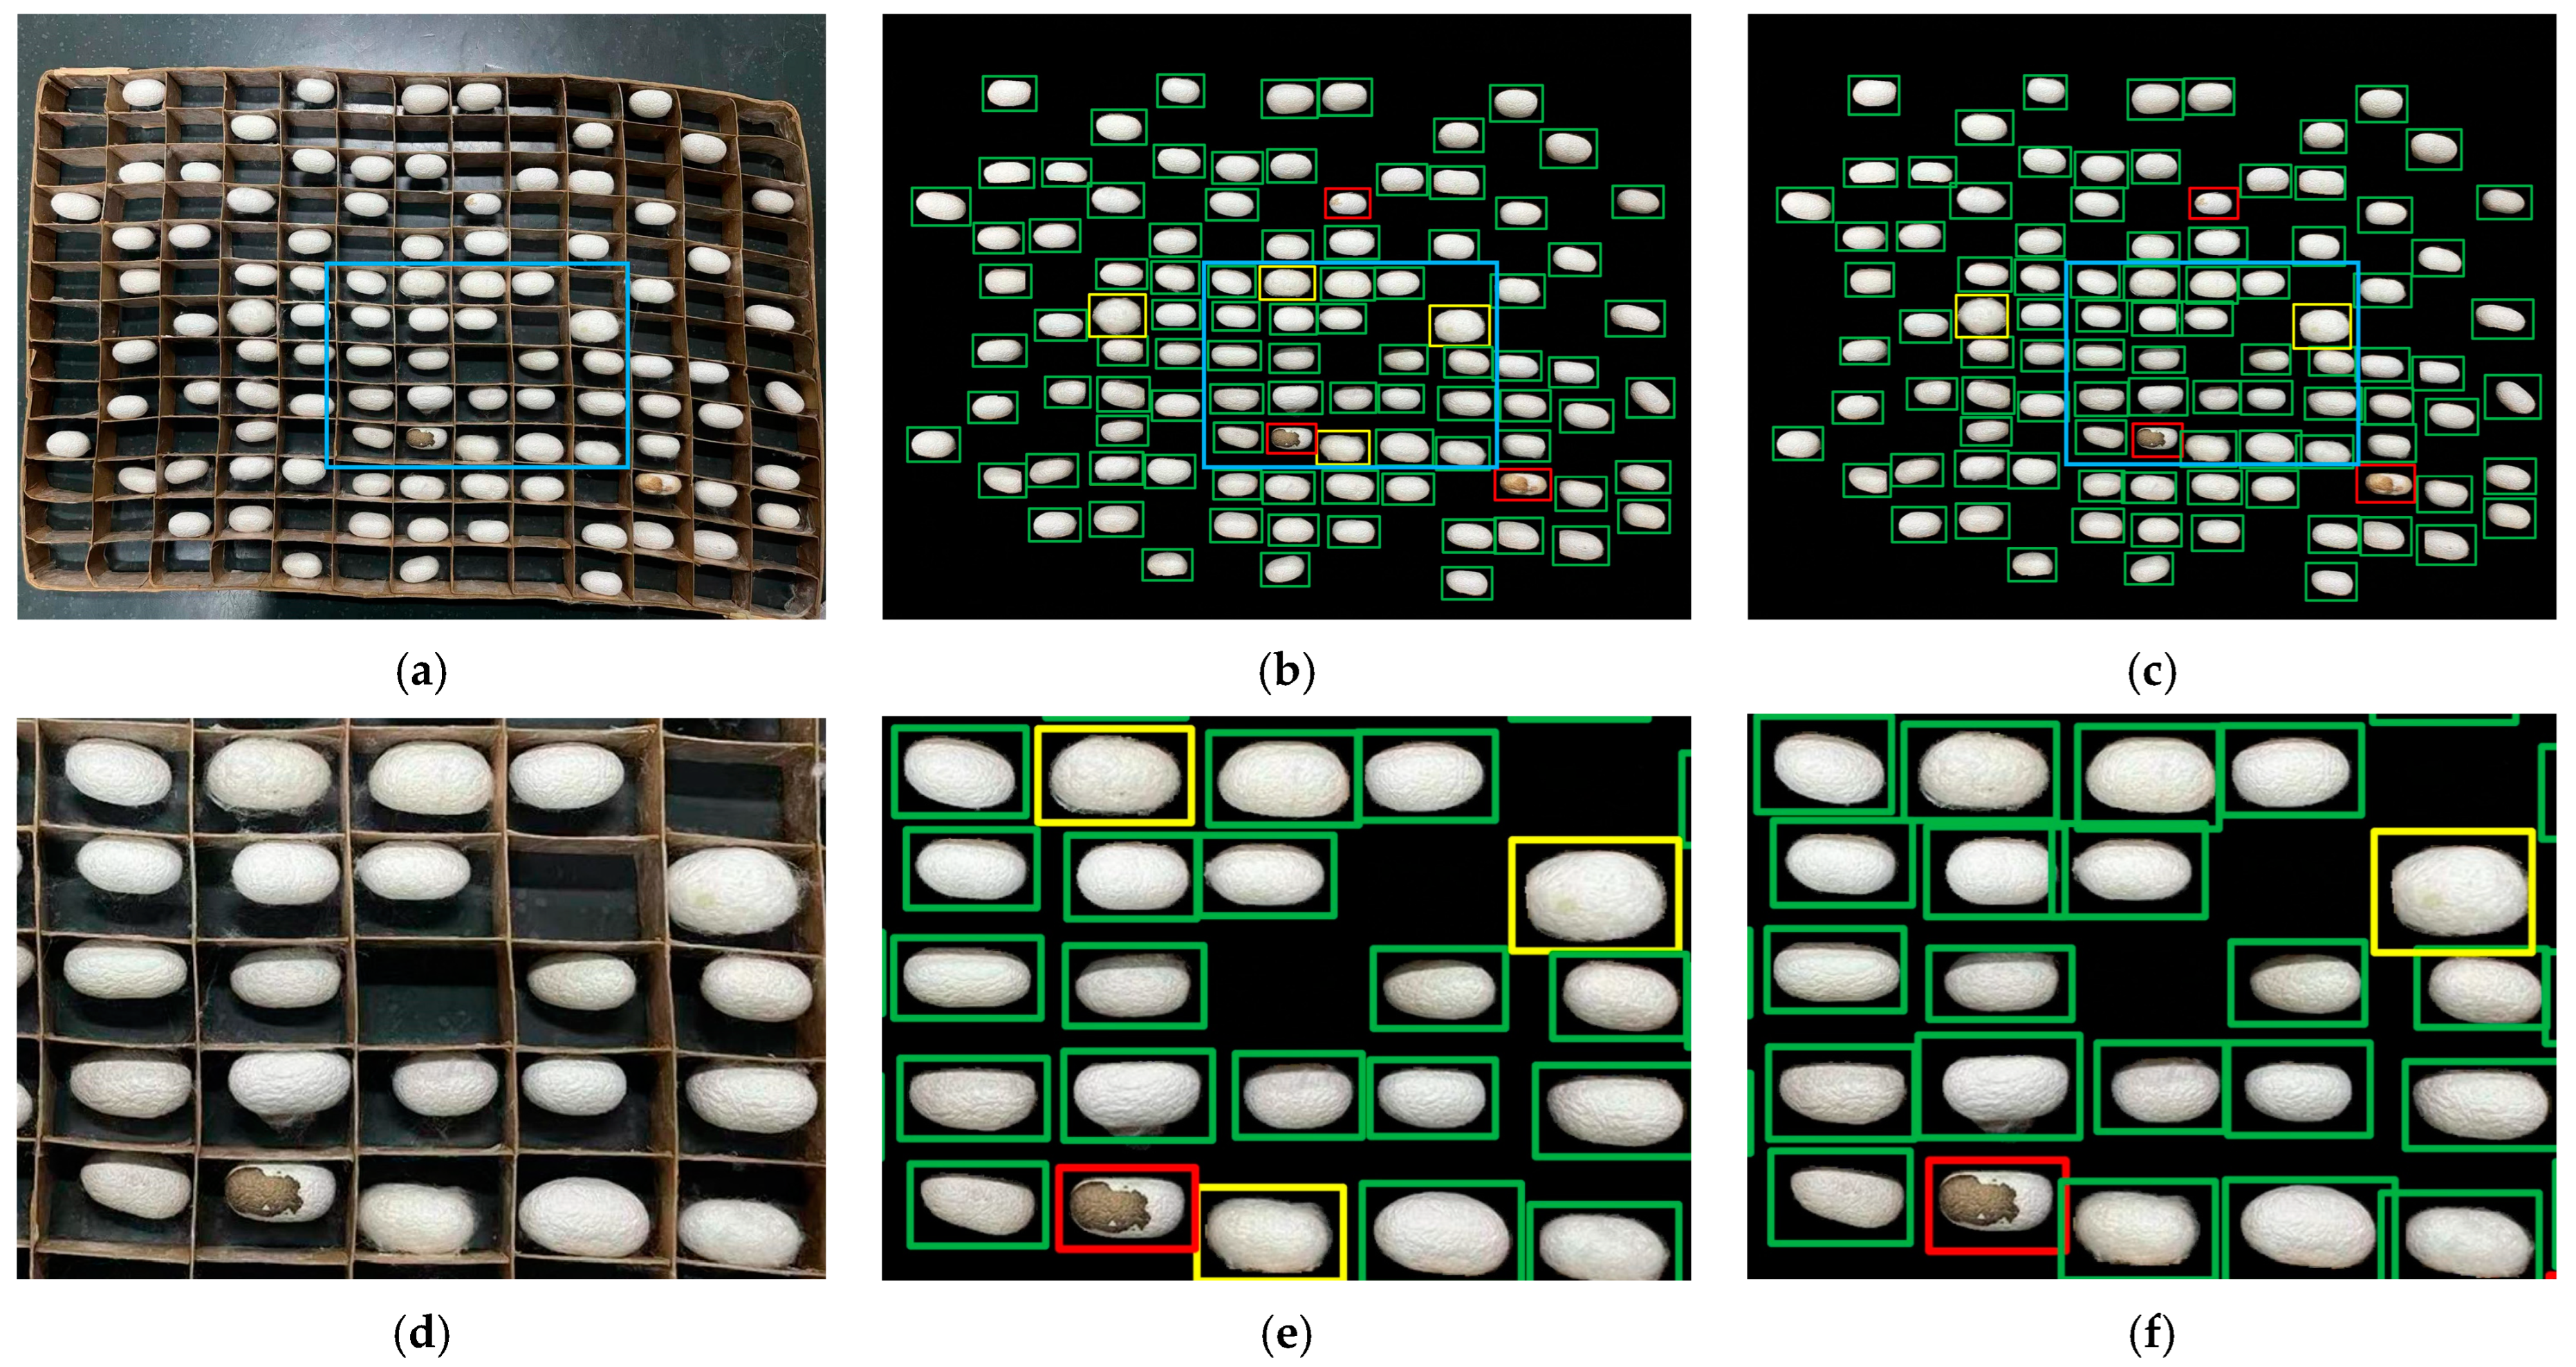
3.1.1. Silkworm Cocoon Segmentation Experiment

MobileSAM is used for image segmentation on the dataset, with the weight file selected as mobile_sam.pt. The segmentation mode is set to automatic segmentation without prompting. The segmentation process and results using MobileSAM and the area threshold are shown in Figure 10.
To comparatively demonstrate the segmentation accuracy of MobileSAM, cocoon images are segmented using MobileSAM, FCM, and FCN, respectively. The comparison results are shown in Figure 11.
Comparing the three segmentation methods, it can be seen that MobileSAM eliminates the mountage image accurately, segments the cocoon mask with clear boundaries, and retains all the features of the cocoon images. FCM also successfully segments the cocoon masks but does not completely eliminate the mountage image. In addition, the segmented cocoon masks are affected by surface defects, resulting in incomplete feature preservation. FCN successfully eliminates the mountage image, but the segmented image has more noise, and the outline of the cocoon masks is unclear.

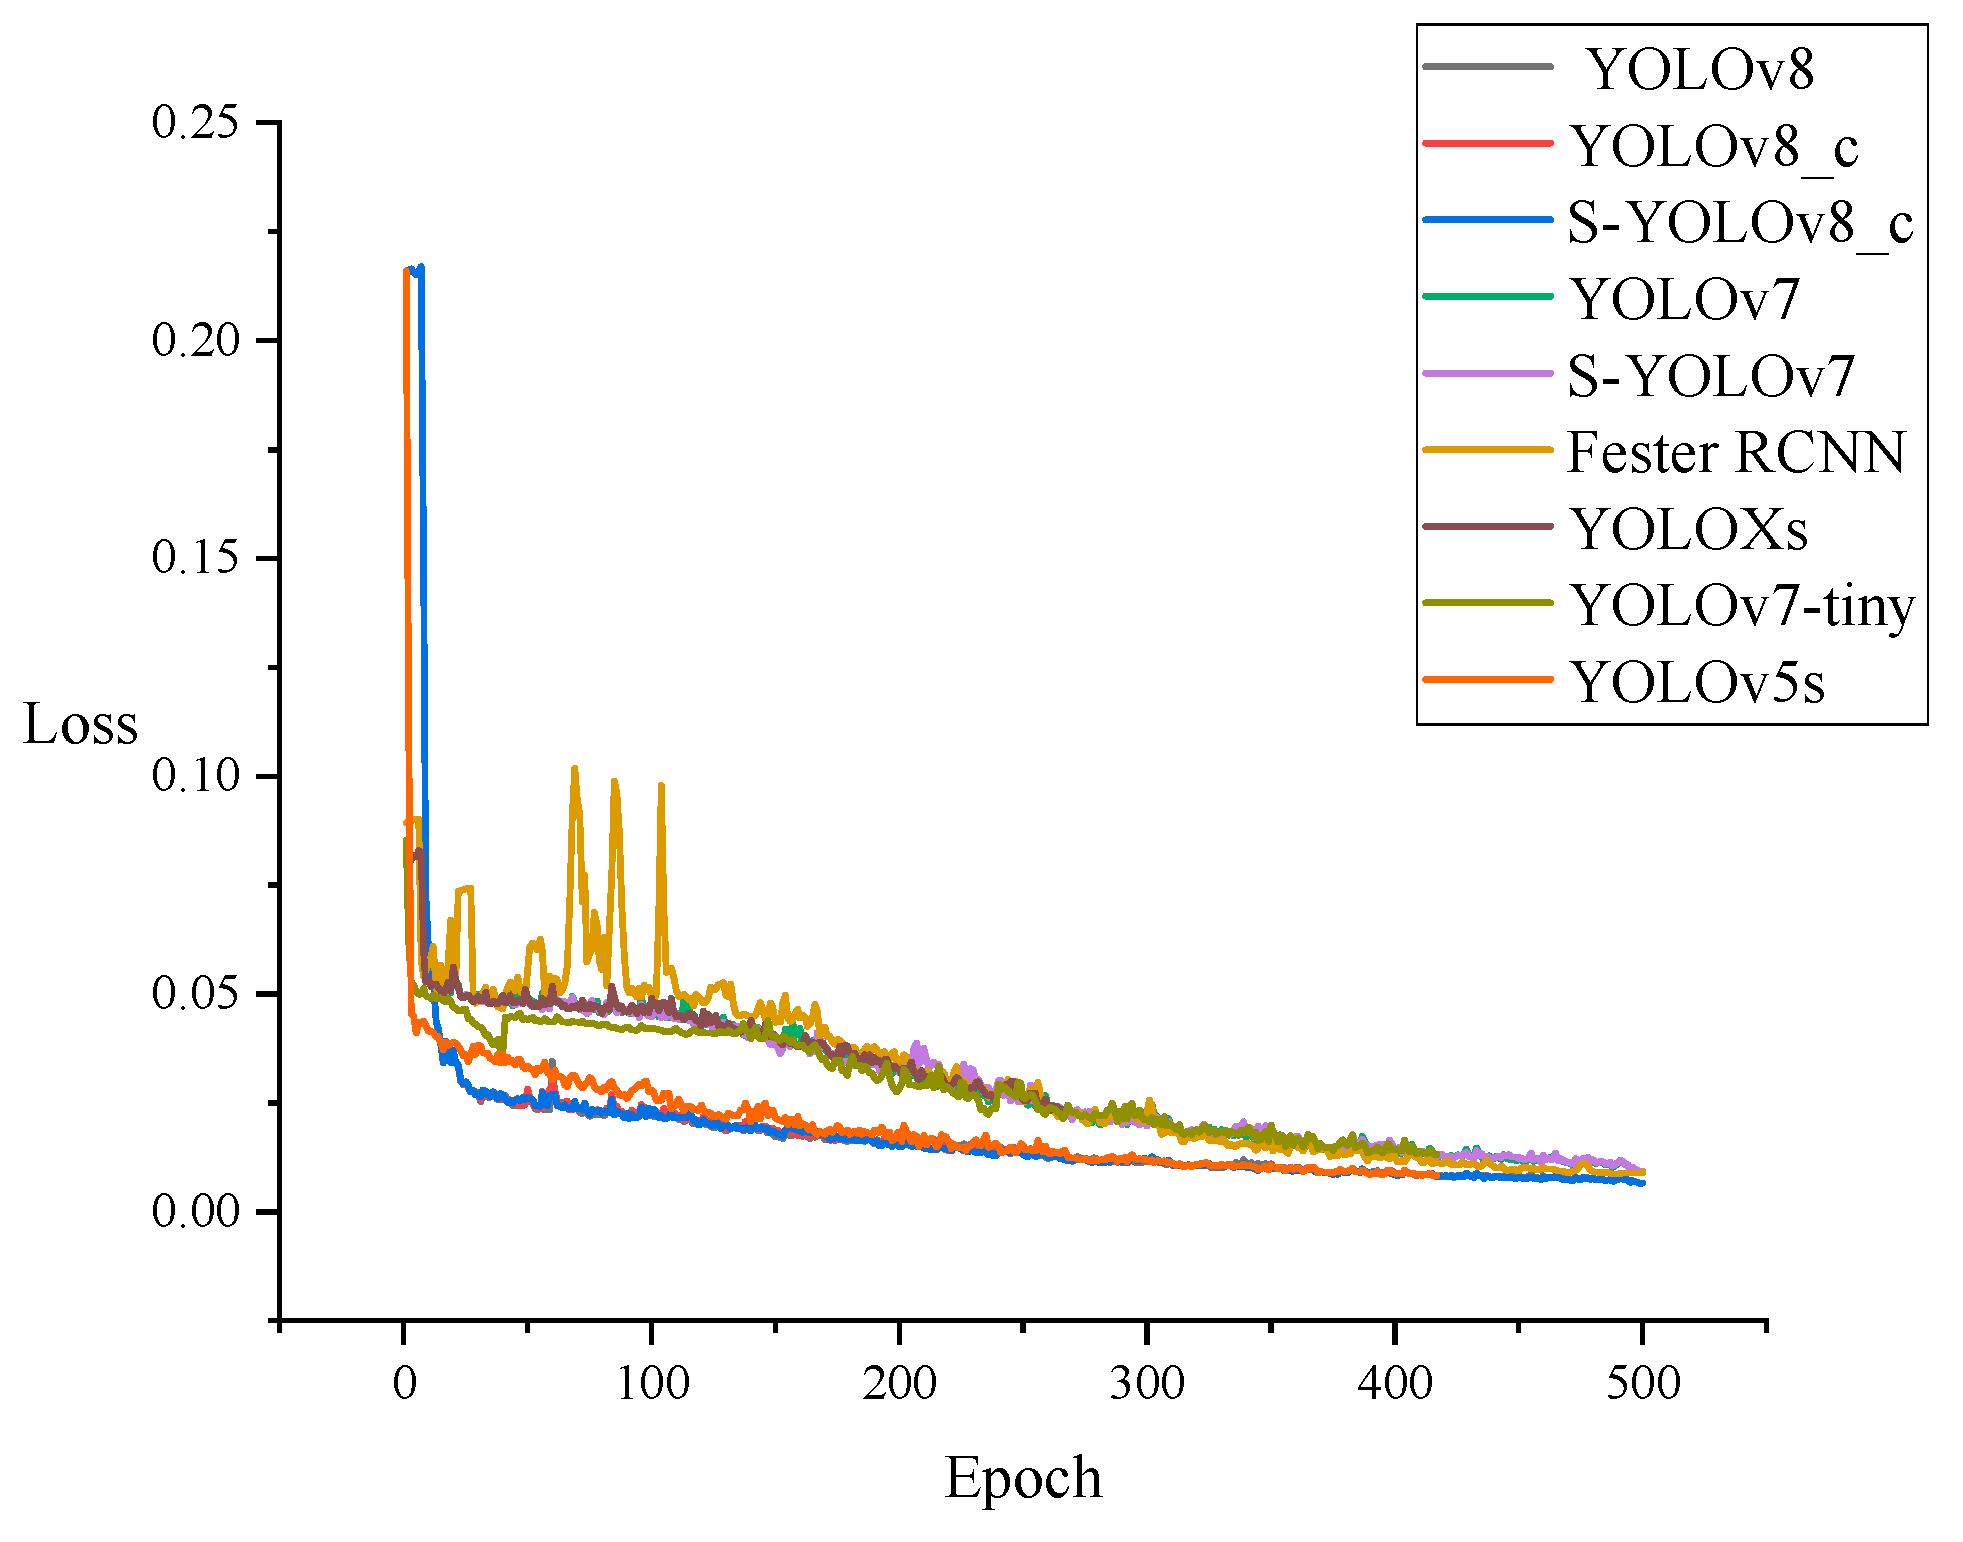
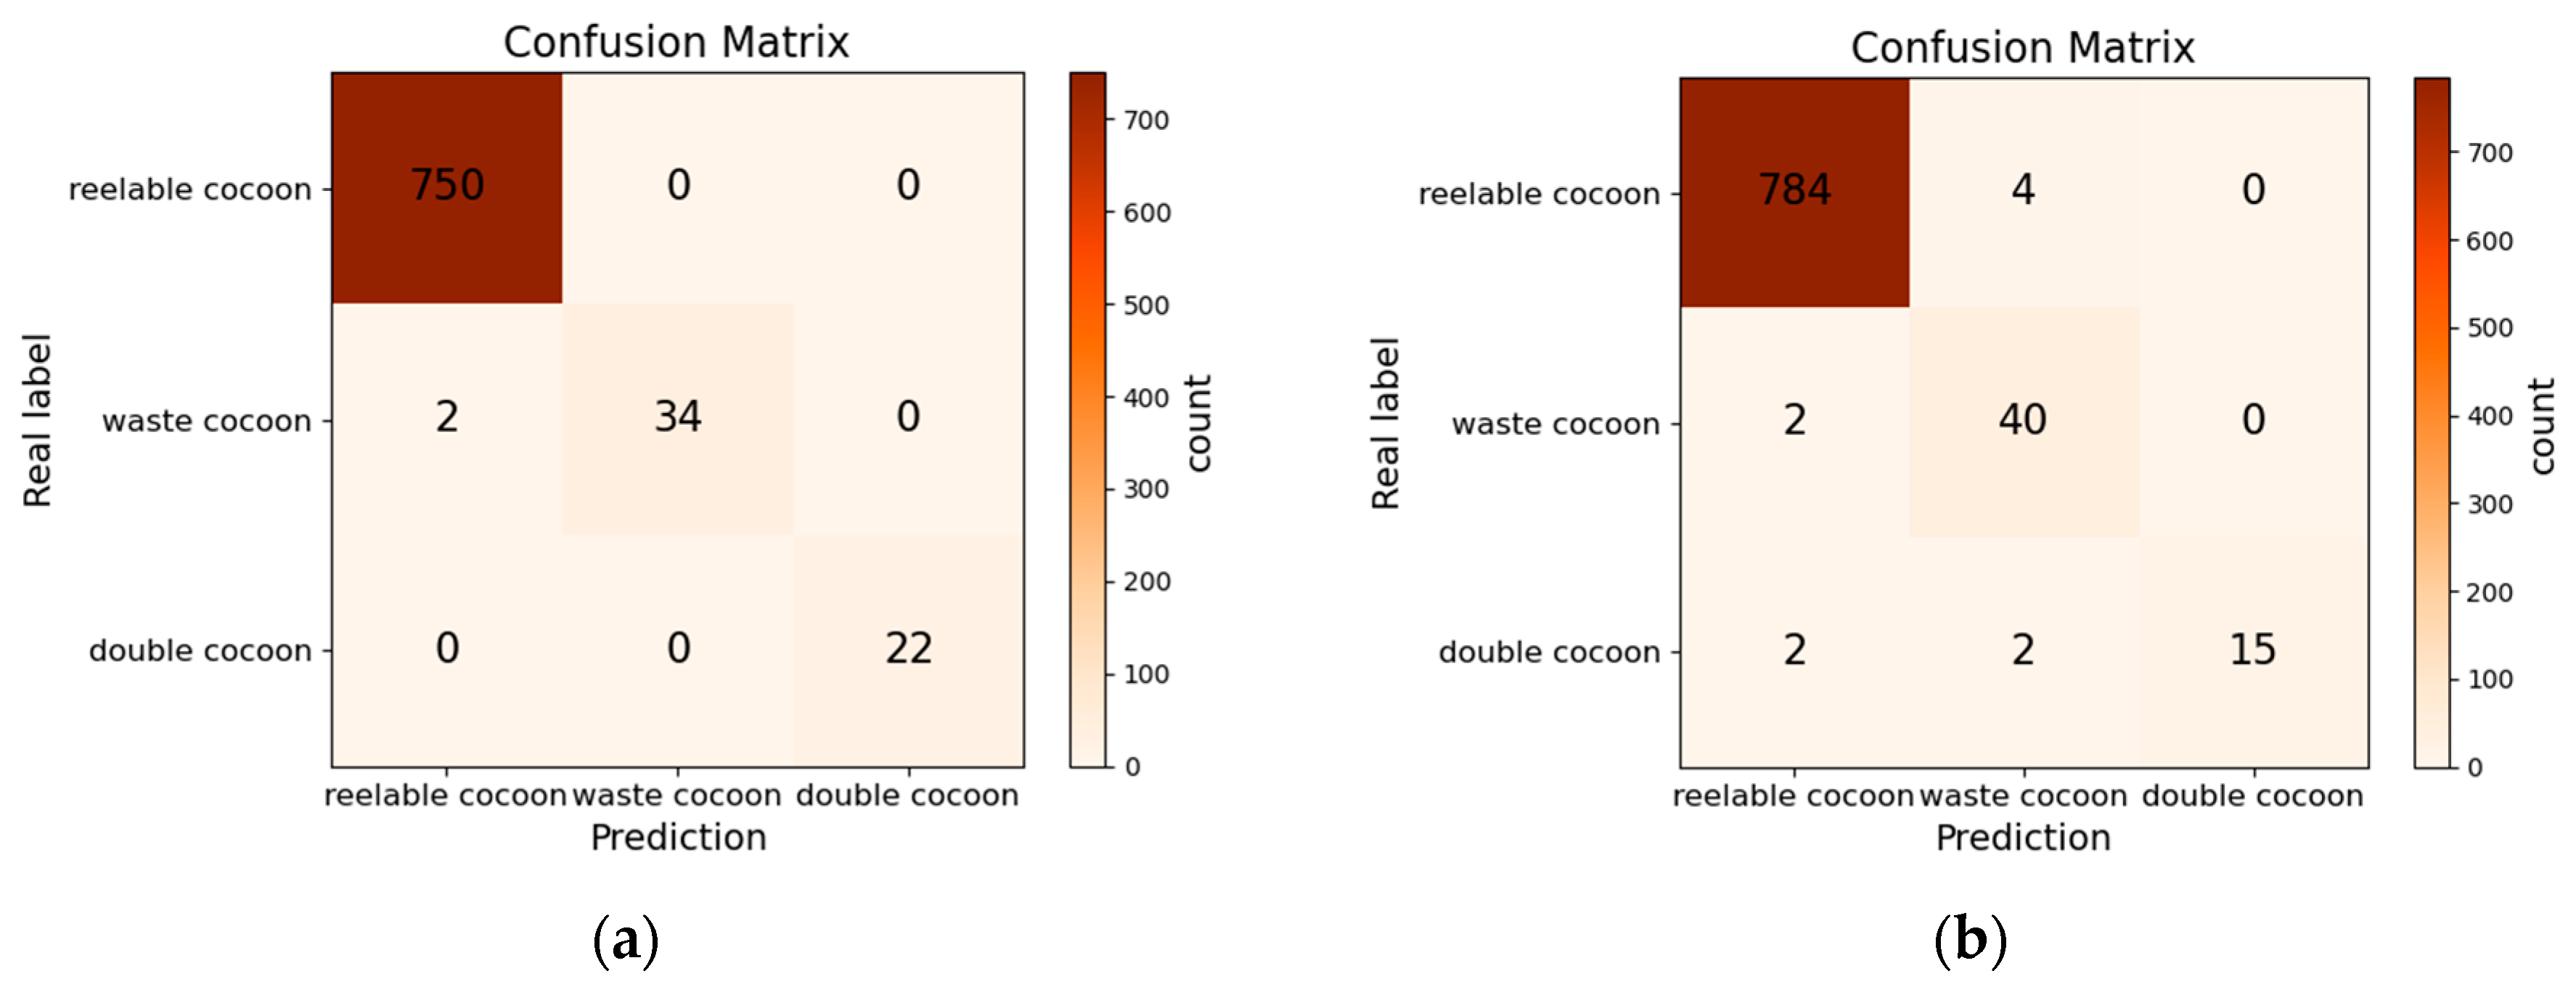
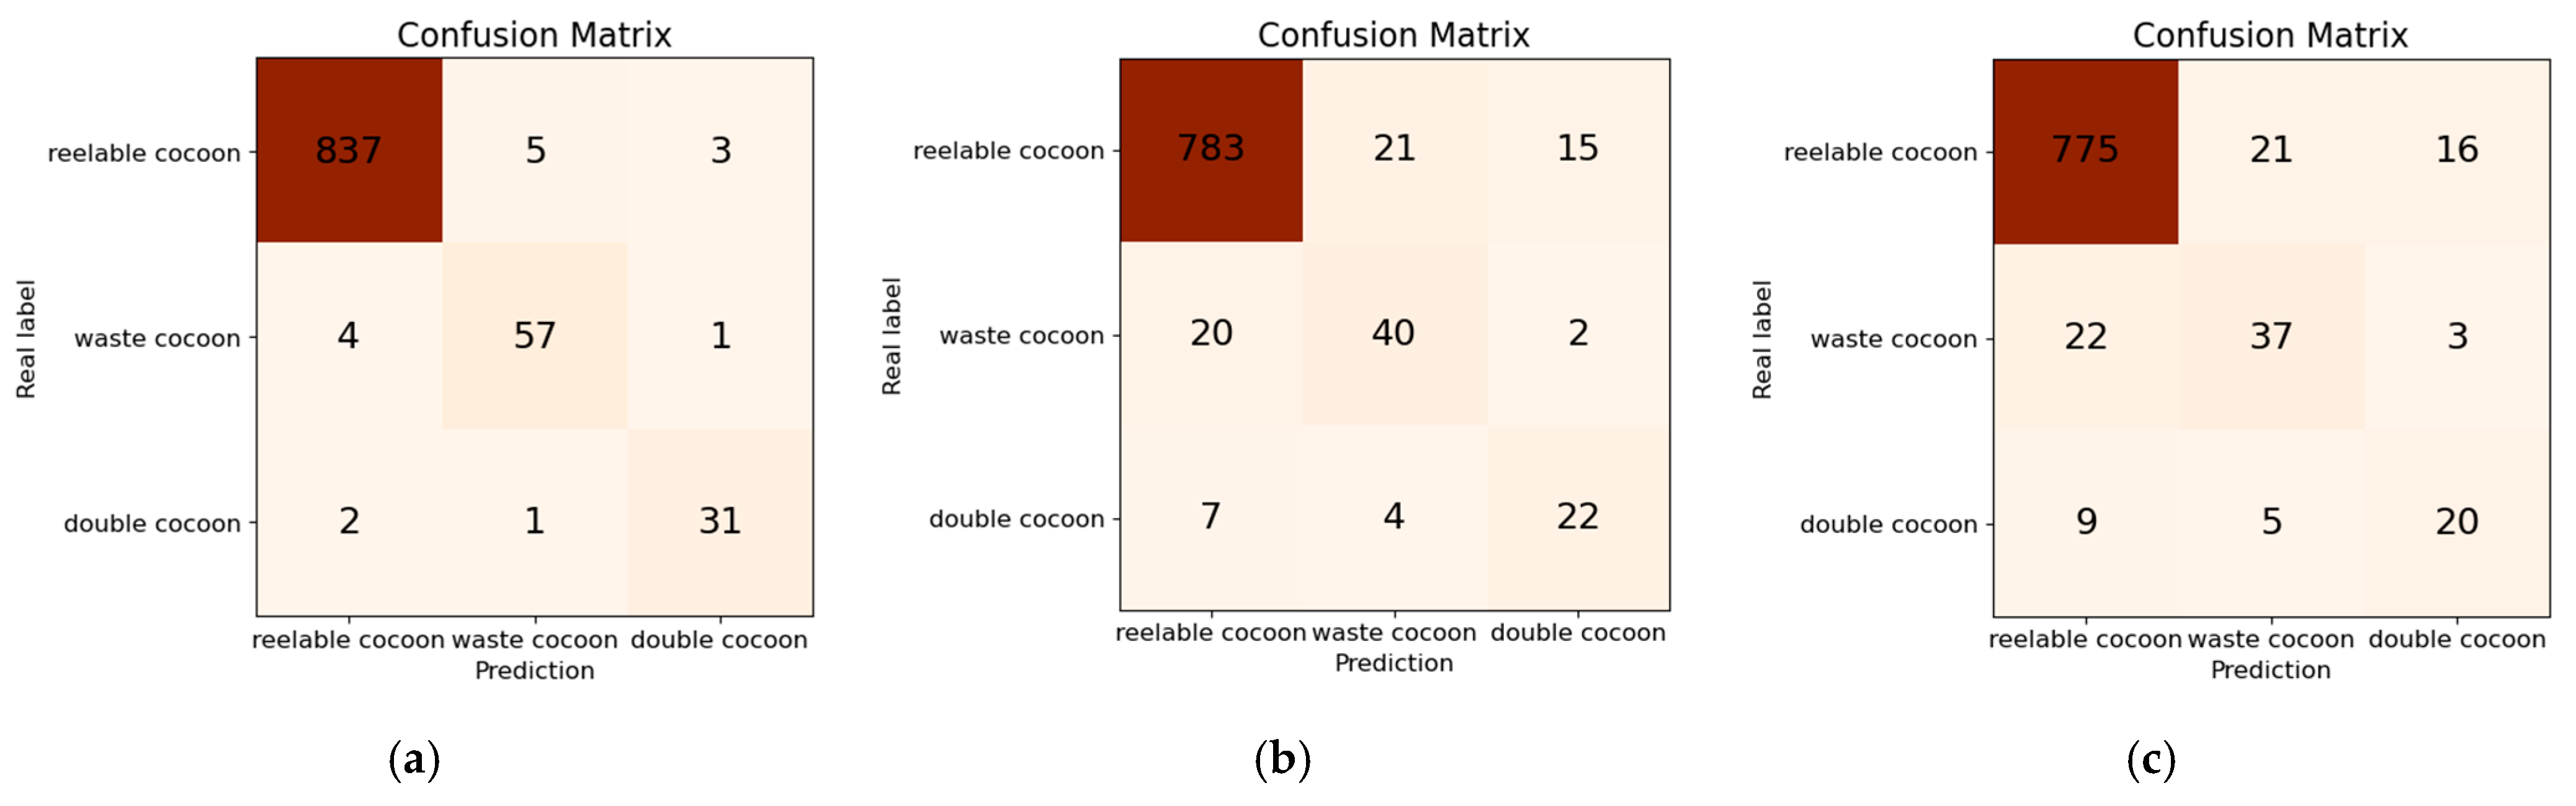
3.1.2. Silkworm Cocoon Detection Experiment

With respect to the cocoon images segmented with MobileSAM, the improved YOLOv8, named YOLOXv8_c, is further used for cocoon detection. The proposed method combining MobileSAM and the improved YOLOv8 is named S-YOLOv8_c.
To verify the effectiveness of the proposed model, a qualitative comparison of the detection performance is carried out between S-YOLOv8_c and other commonly used target detection models, including Faster RCNN [25], YOLOv7, and YOLOv8. For the comparison, Faster RCNN uses ResNet50 as the backbone network. Additionally, the proposed model is compared with YOLOXs [26], YOLOv7-tiny, and YOLOv5s in terms of lightweight performance. The comparison results and training curves are shown in Table 3 and Figure 12.
As shown in Table 3, the cooperation detection models, S-YOLOv8_c and S-YOLOv7, show a significant improvement in detection accuracy compared to independent detection models YOLOv8_c and S-YOLOv7. The mAP is increased by 5% and 5.4%, respectively. Among the three cooperation models, S-YOLOv8_c achieved the highest mAP with 95.8%. However, due to the addition of the image segmentation module, the time required for model inference inevitably increased by 17.6 ms, 21.6 ms, and 23.6 ms, respectively.
In terms of lightweight performance, S-YOLOv8_c has the fastest inference speed among the cooperation detection models. Although YOLOXs, YOLOv7-tiny, and YOLOv5s have faster inference speeds than S-YOLOv8_c, these three models have much lower detection accuracy, with mAP of 68.3%, 70.2%, and 65.7%, respectively, showing a significant gap compared to S-YOLOv8_c which has mAP of 95.8%.
Therefore, taking detection accuracy and inference speed into account, the proposed S-YOLOv8_c exhibits the best performance for cocoon detection.

3.2. Ablation Study

In order to verify the improvement effects of different improvement measures on the performance of the cocoon detection algorithm, an ablation experiment is performed in this section. The improvement measures are sequentially added to the S-YOLOv8 network, and the comparison results are shown in Table 4.
Table 4 shows that all three measures have a positive impact on the model’s detection accuracy. The BiFPN shows the most significant improvement effect, increasing the mAP by 3.3%. Improving the loss function increases the sensitivity of the model to cocoon features and improves the ability to detect poor-quality samples. Benefitting from the loss function improvement, the waste cocoon missed in Figure 13e was successfully detected, which was labeled with a red box in Figure 13f. As a whole, the F1 score for the detection of waste cocoons is increased by 6.5%. When GAM is added, the model pays more attention to the surface texture of the cocoon, improving the detection accuracy of the double cocoon. With the help of the GAM, two reelable cocoons, which were misclassified as a double cocoon with yellow labeled boxes in Figure 14e, have been correctly classified with green labeled boxes in Figure 14f. These three measures could significantly improve the detection performance of the model with a mAP of 95.8%, 5.6% higher than the original model.
In terms of inference speed, because WIoU has a simpler structure and fewer parameters than CIoU, the inference speed is improved. After simultaneous improvement with three measures, the model’s inference speed reached 35.1 ms per image, which was an increase of 18.75% from the original.
Based on the above analysis, S-YOLOv8_c is not only more accurate than S-YOLOv8 but also has a faster inference speed, striking a balance between accuracy and light weight. This makes it well suited for deployment on low-cost and low-processing-power devices with limited computing resources.

3.3. Experiments in Different Brightness

The variability in lighting leads to variations in the brightness of the captured images. To test the impact of lighting conditions on detection accuracy, we selected 10 high-brightness and low-brightness images, respectively, from the test set to evaluate the robustness of the model. The confusion matrix and the comparison images are shown in Figure 15 and Figure 16, respectively.
In conditions of high brightness, there are a total of 812 cocoons, comprising 754 reelable cocoons, 36 waste cocoons, and 22 double cocoons. The model detected 808 cocoons successfully. There are four reelable cocoons missed and two waste cocoons misclassified as reelable cocoons, while all double cocoons were accurately detected. Under low brightness conditions, there are a total of 851 cocoons, comprising 790 reelable cocoons, 42 waste cocoons, and 19 double cocoons. The model successfully detected 849 cocoons and missed only 2 cocoons. The number of true positives for waste cocoons is 40, with a detection accuracy of 95.2%. However, due to the difficulty in identifying the surface textures of double cocoons, four double cocoons were not recognized, with an identification accuracy of 78.9%.
Figure 16a shows a high-brightness image of the mountage cocoons image containing two waste cocoons and two double cocoons. The model accurately detects both waste and double cocoons with no false positives. Figure 16b is a low-brightness image containing five waste cocoons and two double cocoons. The model correctly detects waste cocoons but misidentifies one double cocoon as a reelable cocoon. The experimental results showed that our method is more suitable for detecting brighter images. During practical applications, we will install additional lighting devices to ensure the brightness of the images.

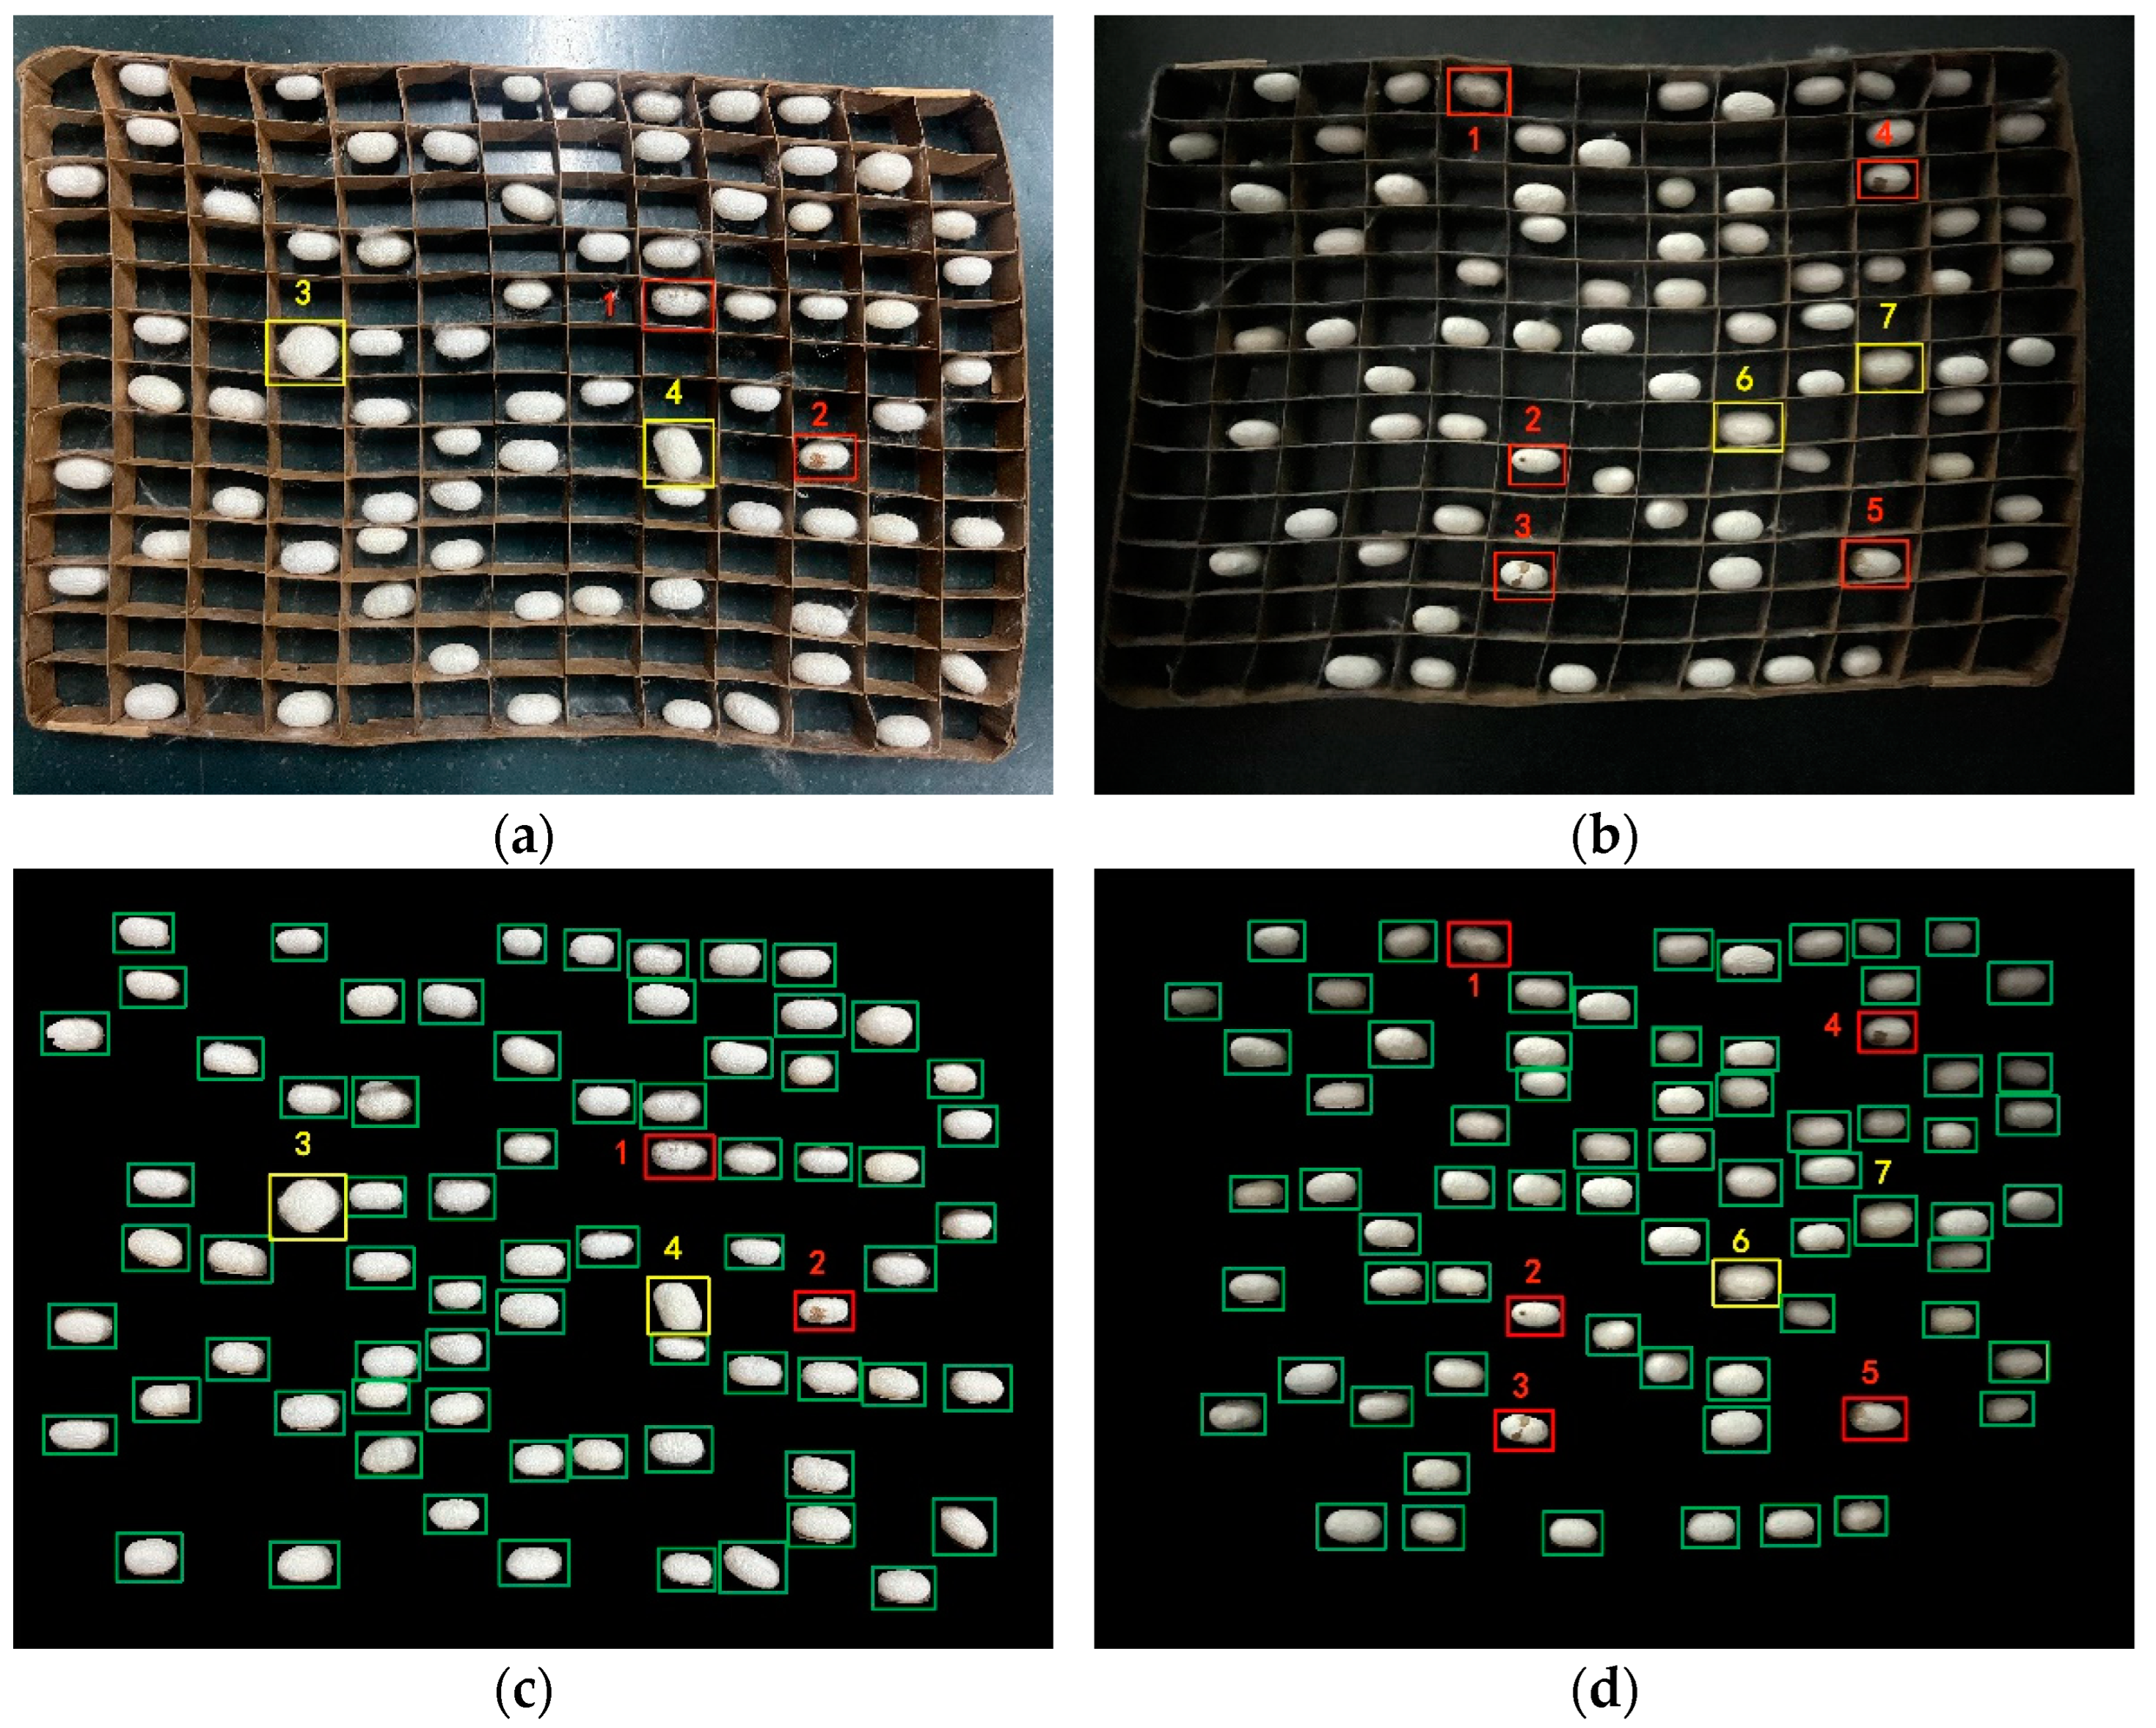
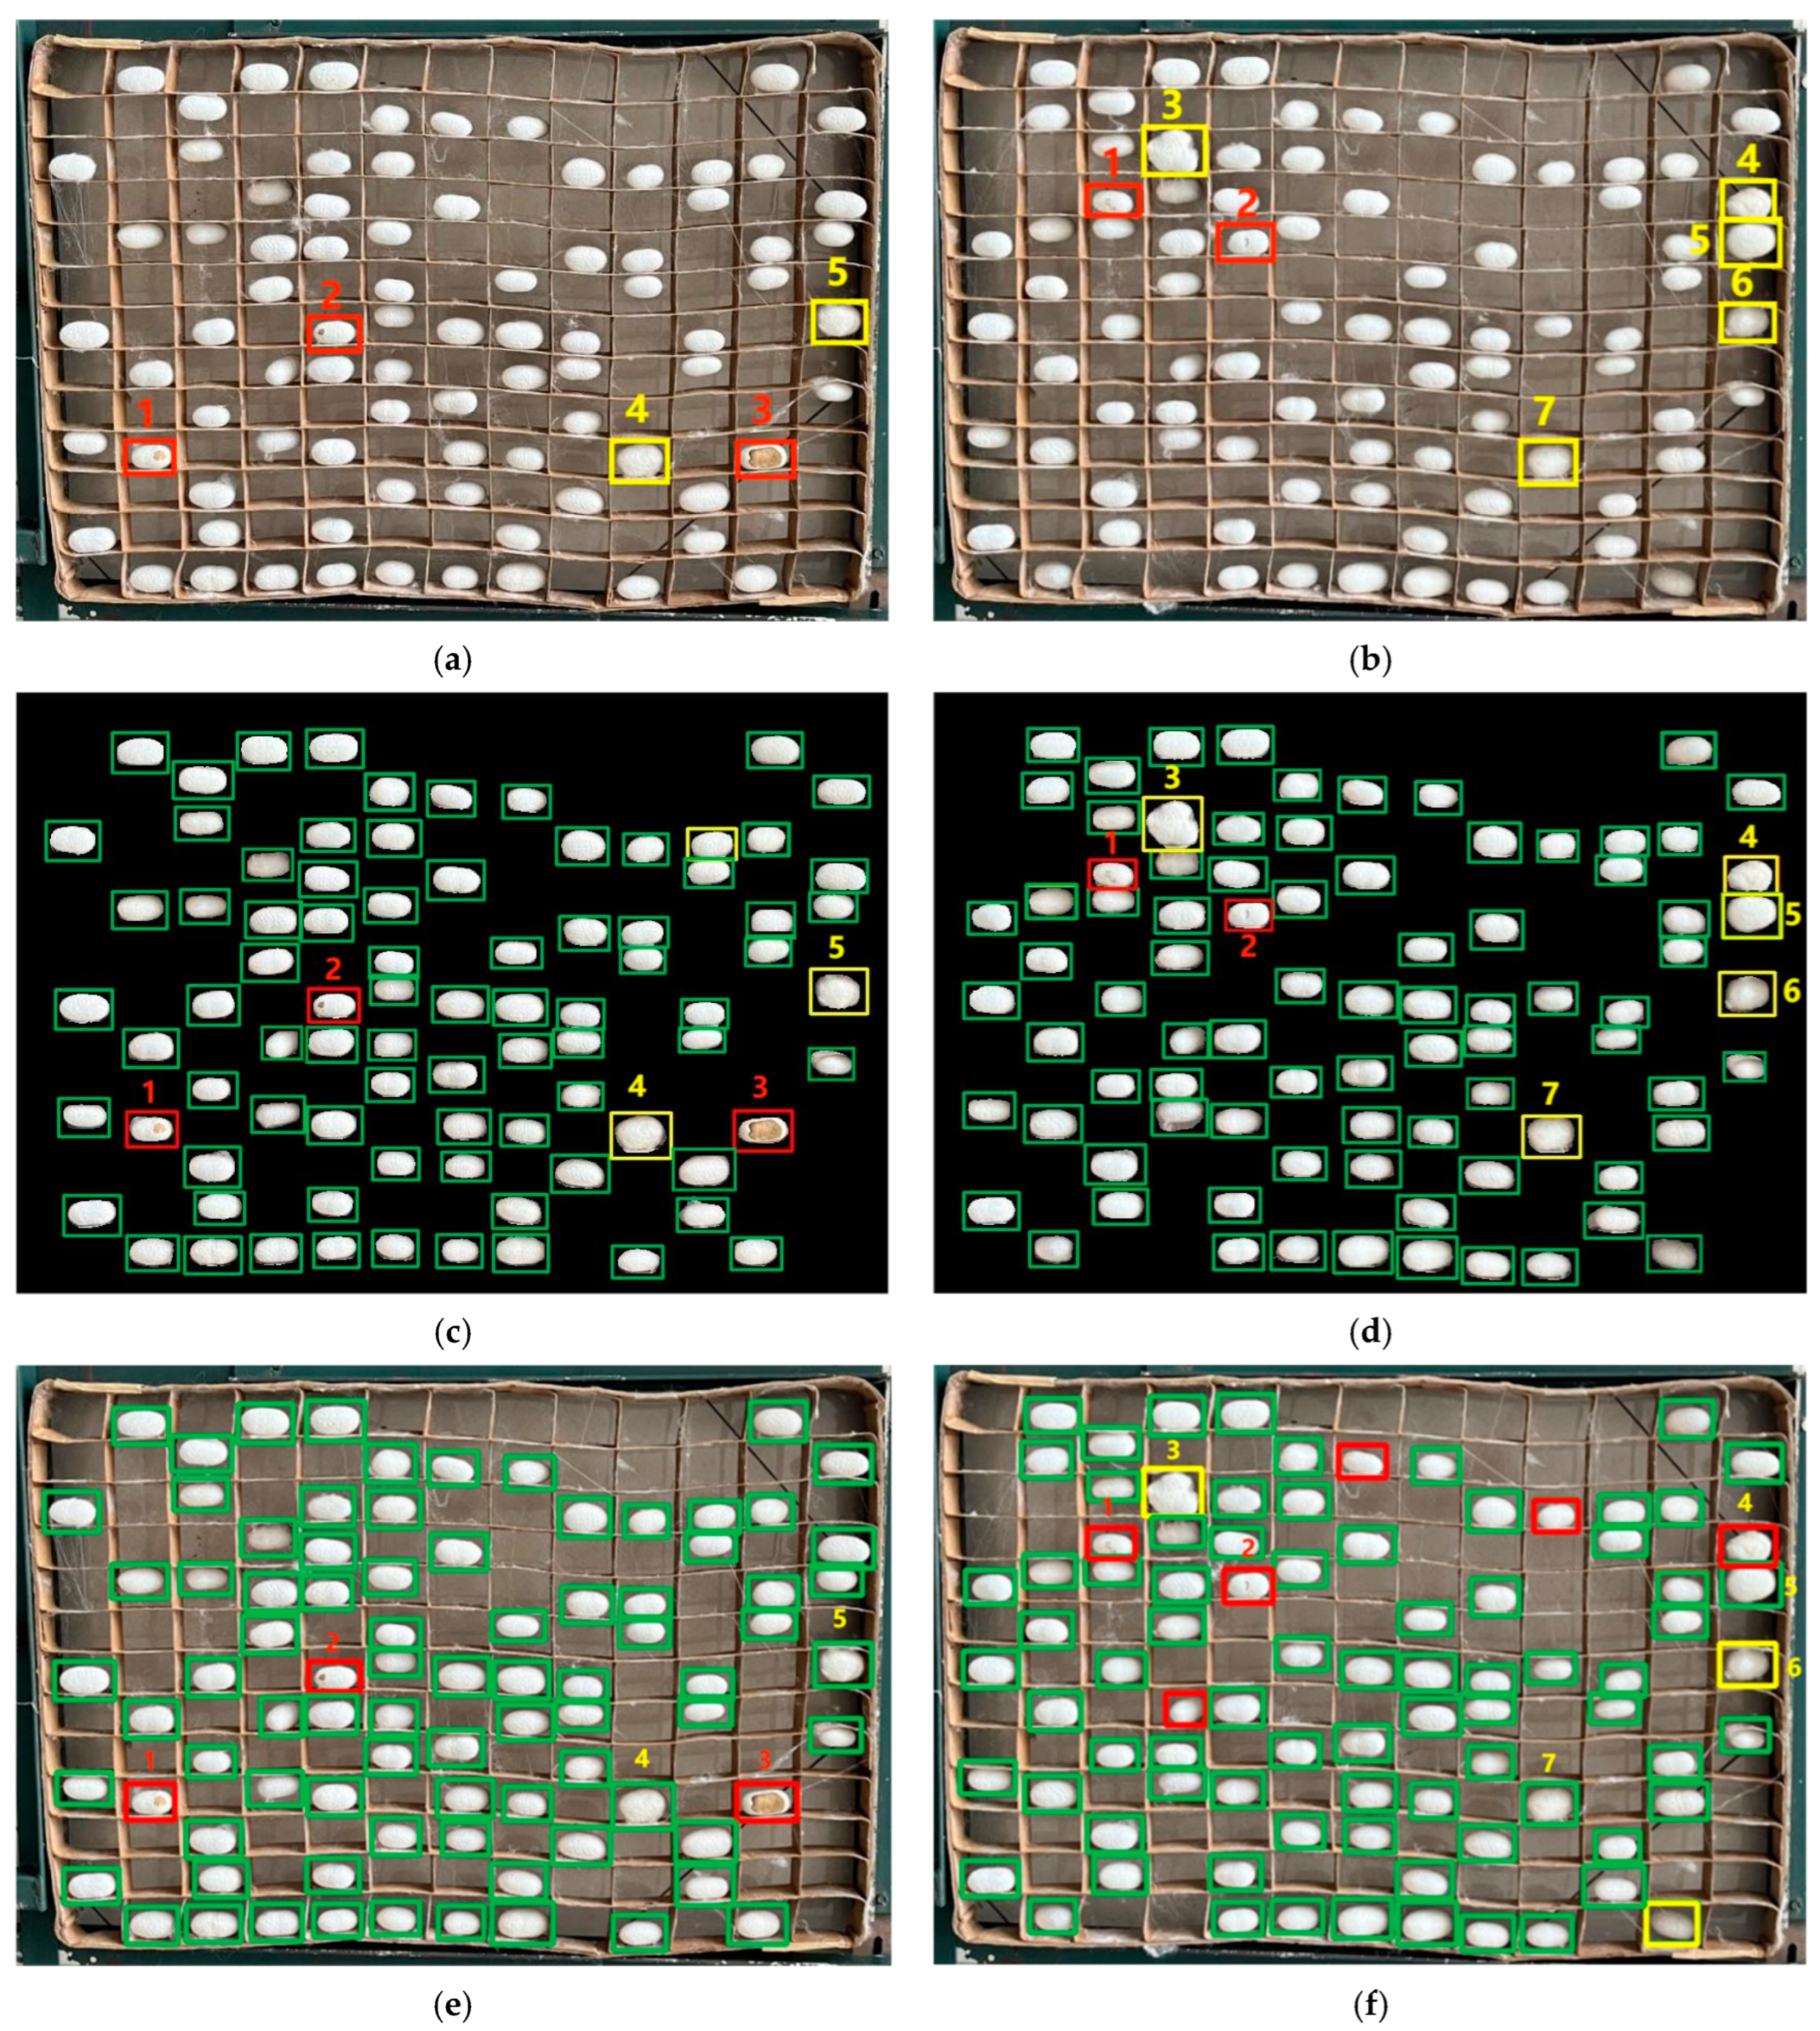
3.4. Algorithm Validation Experiment Based on Cartesian Coordinate Automatic Cocoon Harvestor

The mountage was fixed on the test bench. Two cameras are placed 50 cm above and below the mountage, both facing the center of the mountage. The images are collected under natural light. The image collected by the camera above is the original frontal image of the mountage cocoons, as shown in Figure 17a. The image collected by the camera below is the original rear image of the cocoons, as shown in Figure 17b. In order to ensure the same position of a cocoon in the image from both sides, the image collected by the camera below is vertically mirrored to obtain the rear image of the mountage, as shown in Figure 17c. After vertical mirroring, the position of the same cocoon in the front and back images is one-to-one. The collected cocoon images are fed into the S-YOLOv8_c to detect reelable cocoons, double cocoons, and waste cocoons. In addition, visual measurement and localization are performed to calculate the center point coordinates of the cocoons. Then, the PC host computer transmits the center point coordinates of the cocoons to the STM32 controller via the RS232 serial port. After receiving the cocoon coordinates, the STM32 controller processes the stepper motors of the X-axis and Y-axis to position the electromagnetic picker at the location of the cocoon. The electromagnetic relay is then controlled to power the electromagnetic picker, allowing the electromagnetic picker to pick the cocoon. The detection process is illustrated in Figure 18.
To intuitively demonstrate the detection performance of the proposed algorithm, picking experiments are performed with 10 randomly selected mountages under various lighting conditions. The detection results are compared between YOLOv8, YOLOv7, and our model. The confusion matrix and the comparison images are shown in Figure 19 and Figure 20, respectively.
In the picking experiment with 10 mountage cocoons, there are a total of 947 cocoons, including 851 reelable cocoons, 34 double cocoons, and 62 waste cocoons. The confusion matrix shows that S-YOLOv8_c has a significantly higher number of true positives for cocoons compared to YOLOv8 and YOLOv7. This is especially true for the detection of double cocoons and waste cocoons. S-YOLOv8_c detected 941 cocoons and missed only 6 cocoons. The number of true positives for waste and double cocoons is 57 and 31, with detection accuracies of 91.9% and 91.2%, respectively. YOLOv8 detected 819 cocoons and missed 33 cocoons. The detection accuracies for waste and double cocoons are 64.5% and 64.7%, correctly detecting 40 and 22 cocoons, respectively. YOLOv7 detected 812 cocoons and missed 39 cocoons. The detection accuracies for waste and double cocoons are lower, at 59.6% and 58.8%, correctly detecting 37 and 20 cocoons, respectively. During manual sorting, double cocoons and reelable cocoons are easily confused because of their similar appearance and color. S-YOLOv8_c has only 5 such misclassifications, while YOLOv8 and YOLOv7 have 22 and 25, respectively. This indicates that S-YOLOv8_c is more accurate in distinguishing fine-grained features of cocoons. S-YOLOv8_c exhibits superior recall and precision rates compared to other models. It indicates that the cooperation detection strategy is more effective in highlighting the feature differences in mountage cocoons. The method proposed in this paper is suitable for the sorting of mountage cocoons.
Based on the manual classification, there are two double cocoons and three waste cocoons in Figure 20a. S-YOLOv8_c correctly detects waste and double cocoons but misidentifies one reelable cocoon as a double cocoon. YOLOv8 correctly detects waste cocoons but fails to detect double cocoons. YOLOv7 has trouble recognizing cocoon features. It detects two waste cocoons and no double cocoons. It also misidentifies one waste cocoon as a double cocoon. There are two waste cocoons and five double cocoons in Figure 20b. Both waste cocoons have minor surface defects. S-YOLOv8_c accurately detects both waste and double cocoons without any false positives. YOLOv8 successfully detects two waste cocoons and two double cocoons but incorrectly detects three reelable cocoons and one double cocoon as waste cocoons and incorrectly detects one reelable cocoon as a double cocoon. YOLOv7 also detects two waste cocoons and two double cocoons but has a higher false positive rate. It falsely detects seven reelable cocoons and one double cocoon as waste cocoons and falsely detects one double cocoon as a reelable cocoon. Via the comparison of the detection results, it can be observed that the improved algorithm achieves a higher detection accuracy and shows a significant improvement compared to the original YOLOv8 and YOLOv7.

4. Conclusions

In this study, a model combining segmentation and target detection is proposed for the sorting of mountage cocoons. By using the constructed MobileSAM to extract cocoon images, the influence of mounting and background on the detection accuracy can be effectively filtered out. This allows the target detection model to focus more on the cocoon, resulting in a significant improvement in cocoon detection accuracy. Experimental results showed that the cooperative detection model S-YOLOv8_c had a significant improvement in detection accuracy compared to the independent detection model YOLOv8_c, with the mAP increased by 5%.
Ablation experiments indicated that BiFPN enhanced the feature extraction capability of the model, thereby improving the detection accuracy. The addition of GAM significantly improved the detection ability of double cocoons. The WIoU mitigated the impact of low-quality images on model detection and improved detection speed. The combination of the three leads to the maximum performance improvement with a mAP of 95.8%, an increase of 5.6% increase. Furthermore, the average detection time is 35.1 ms per frame, showing an increase of 18.75% in detection speed.
Due to insufficient experience and limited capabilities, the cooperative detection model still exhibits high computational complexity and slow detection speed compared to the independent detection models. In the future, we will focus on network pruning to enhance the detection speed of the model while maintaining accuracy.

Author Contributions

Conceptualization, M.L. and F.L.; methodology, M.L.; software, M.C.; validation, F.T. and M.C.; formal analysis, Y.L. and M.C.; investigation, C.S.; resources, W.W., Z.S., and G.Z.; data curation, J.Z. and X.X.; writing—original draft preparation, M.C.; writing—review and editing, M.L., Y.Y., and M.C.; supervision, Y.Y.; funding acquisition, M.L. and Y.Y. All authors have read and agreed to the published version of the manuscript.

Funding

This research was funded by the National Natural Science Foundation of China (No.32001419), Shandong Province Key Research and Development Plan Project (No.2022TZXD0042), China Agriculture Research System of MOF and MARA (No.CARS-18-ZJ0402), National Key Research and Development Project (No.2023YFD1600900), and Shandong Province Technical System of Sericulture Industry, China (No.SDAIT-18-06).

Institutional Review Board Statement

Not applicable.

Data Availability Statement

The data are available from the corresponding author upon reasonable request.

Conflicts of Interest

The authors declare no conflicts of interest.

References

  1. Qian, Y.; Liu, W.; Liu, E. Data report: Analysis on operation of Chinese silk industry in 2022 and prospect in 2023. J. Silk 2023, 60, 59–163. [Google Scholar]
  2. GB/T 9111-2015; Methods of Mulberry Silkworm Dried Cocoons. China National Standardization Administration, General Administration of Quality Supervision, Inspection and Quarantine of the People's Republic of China: Beijing, China, 2015.
  3. Li, J.; Feng, H. Review and Prospects of 40 Years of Reform and Development of China’s Sericulture Industry. China Seric. 2019, 40, e0220912. [Google Scholar]
  4. Fu, S.; Wei, G.; Wang, L. Effects of Mountage on Silkworm Cocoon Yield, Quality and Feeding Efficiency. J. Zhejiang Agric. Sci. 2013, 5, 34–337. [Google Scholar]
  5. Bian, K.; Yang, H.; Lu, Y. Application Review of Deep Learning in Detection and Identification of Agricultural Pests and Diseases. Softw. Guide 2021, 20, 26–33. [Google Scholar]
  6. Prasobhkumar, P.P.; Francis, C.R.; Gorthi, S.S. Automated quality assessment of cocoons using a smart camera based system. Eng. Agric. Environ. Food 2018, 11, 202–210. [Google Scholar] [CrossRef]
  7. Prasobhkumar, P.; Francis, C.; Gorthi, S.S. Cocoon quality assessment system using vibration impact acoustic emission processing. Eng. Agric. Environ. Food 2019, 12, 556–563. [Google Scholar] [CrossRef]
  8. Wang, Q.; Li, Z.; Gu, T.; Ye, F.; Wang, X. Cocoons counting and classification based on image processing. In Proceedings of the 2020 13th International Congress on Image and Signal Processing, BioMedical Engineering and Informatics (CISP-BMEI), Chengdu, China, 17–19 October 2020; pp. 148–152. [Google Scholar]
  9. Zhou, X.; Han, Z.; Liu, C. Silkworm Cocoon Identification Method Based on Improved Convolution Neural Network and Image Processing. J. Chin. Agric. Mech. 2023, 44, 100. [Google Scholar]
  10. Sun, W.; Yang, C.; Shao, T.; Liang, M.; Zheng, J. Intelligence Recognition Algorithm of Group Cocoons Based on MSRCR and CBAM. J. Silk 2022, 59, 58–65. [Google Scholar]
  11. Liu, M.; Xu, R.; Yan, X.; Yan, Y.; Li, F.; Liu, S. Detection and Elimination of Yellow Spotted Cocoon in Mountage Based on FCM Algorithm and HSV Color Model. Trans. Chin. Soc. Agric. Mach. 2018, 49, 31–38. [Google Scholar]
  12. Liu, M.; Xu, R.; Li, F.; Song, Z.; Yan, Y.; Han, S. Algorithm and Experiment of Cocoon Segmentation and Location Based on Color and Area Feature. Trans. Chin. Soc. Agric. Mach. 2018, 49, 43–50. [Google Scholar]
  13. Zhang, C.; Han, D.; Qiao, Y.; Kim, J.U.; Bae, S.-H.; Lee, S.; Hong, C.S. Faster Segment Anything: Towards Lightweight SAM for Mobile Applications. arXiv 2023, arXiv:2306.14289. [Google Scholar]
  14. Tan, M.; Pang, R.; Le, Q.V. Efficientdet: Scalable and efficient object detection. In Proceedings of the IEEE/CVF Conference on Computer Vision and Pattern Recognition, Seattle, WA, USA, 14–19 June 2020; pp. 10781–10790. [Google Scholar]
  15. Liu, Y.; Shao, Z.; Hoffmann, N. Global attention mechanism: Retain information to enhance channel-spatial interactions. arXiv 2021, arXiv:2112.05561. [Google Scholar]
  16. Zheng, Z.; Wang, P.; Liu, W.; Li, J.; Ye, R.; Ren, D. Distance-IoU loss: Faster and better learning for bounding box regression. In Proceedings of the AAAI Conference on Artificial Intelligence, New York, NY, USA, 7–12 February 2020; pp. 12993–13000. [Google Scholar]
  17. Tong, Z.; Chen, Y.; Xu, Z.; Yu, R. Wise-IoU: Bounding Box Regression Loss with Dynamic Focusing Mechanism. arXiv 2023, arXiv:2301.10051. [Google Scholar]
  18. Kirillov, A.; Mintun, E.; Ravi, N.; Mao, H.; Rolland, C.; Gustafson, L.; Xiao, T.; Whitehead, S.; Berg, A.C.; Lo, W.-Y. Segment anything. arXiv 2023, arXiv:2304.02643. [Google Scholar]
  19. Dosovitskiy, A.; Beyer, L.; Kolesnikov, A.; Weissenborn, D.; Zhai, X.; Unterthiner, T.; Dehghani, M.; Minderer, M.; Heigold, G.; Gelly, S. An image is worth 16 × 16 words: Transformers for image recognition at scale. arXiv 2020, arXiv:2010.11929. [Google Scholar]
  20. Li, Y.; Mao, H.; Girshick, R.; He, K. Exploring plain vision transformer backbones for object detection. In Proceedings of the 17th European Conference on Computer Vision, Tel Aviv, Israel, 23–27 October 2022; pp. 280–296. [Google Scholar]
  21. Lou, H.; Duan, X.; Guo, J.; Liu, H.; Gu, J.; Bi, L.; Chen, H. DC-YOLOv8: Small-Size Object Detection Algorithm Based on Camera Sensor. Electronics 2023, 12, 2323. [Google Scholar] [CrossRef]
  22. Redmon, J.; Divvala, S.; Girshick, R.; Farhadi, A. You only look once: Unified, real-time object detection. In Proceedings of the IEEE Conference on Computer Vision and Pattern Recognition, Las Vegas, NV, USA, 27–30 June 2016; pp. 779–788. [Google Scholar]
  23. Redmon, J.; Farhadi, A. YOLO9000: Better, faster, stronger. In Proceedings of the IEEE Conference on Computer Vision and Pattern Recognition, Honolulu, HI, USA, 21–26 July 2017; pp. 7263–7271. [Google Scholar]
  24. Liu, S.; Qi, L.; Qin, H.; Shi, J.; Jia, J. Path aggregation network for instance segmentation. In Proceedings of the IEEE Conference on Computer Vision and Pattern Recognition, Salt Lake City, UT, USA, 18–23 June 2018; pp. 8759–8768. [Google Scholar]
  25. Ren, S.; He, K.; Girshick, R.; Sun, J. Faster r-cnn: Towards real-time object detection with region proposal networks. Adv. Neural Inf. Process. Syst. 2015, 28, 1–9. [Google Scholar] [CrossRef] [PubMed]
  26. Ge, Z.; Liu, S.; Wang, F.; Li, Z.; Sun, J. Yolox: Exceeding yolo series in 2021. arXiv 2021, arXiv:2107.08430. [Google Scholar]
Figure 1. The grid mountage image. (a) The grid mountage without silkworm cocoons. (b) The grid mountage in the cocoon spinning room.
Agriculture 14 00599 g001
Figure 2. The structure diagram of cartesian coordinate automatic cocoon harvestor. 1. Frame 2. WorkTable 3. x-axis guide rail 4. x-axis stepper motor 5. Transmission shaft 6. Top camera 7. y-axis guide rail 8. y-axis stepper motor 9. Electromagnetic picker 10. Mountage cocoons 11. Mountage clamping device 12. Bottom camera.
Agriculture 14 00599 g002
Figure 3. Flowchart of cooperation cocoon detection algorithm.
Agriculture 14 00599 g003
Figure 4. Segmentation and extraction process of silkworm cocoon.
Agriculture 14 00599 g004
Figure 5. Feature fusion network structure diagram. (a) PAN structure diagram. A top-down pathway has been introduced for the fusion of multi-scale features from levels 3 to 7 (P3–P7), and an additional bottom-up pathway has been added. (b) BiFPN structure diagram. The nodes that have only one input edge are removed, and an additional edge is added from the original input to the output node if they are at the same level.
Agriculture 14 00599 g005
Figure 6. RGB images of double cocoon and reelable cocoon. (a) Double cocoon. (b) Reelable cocoon.
Agriculture 14 00599 g006
Figure 7. Global Attention Mechanism structure diagram. Conv represents the convolution. Dconv stands for downsampling. MLP is the multi-layer perceptron. r represents the reduction ratio. C , W , and H are parameters used to represent the size of the feature map.
Agriculture 14 00599 g007
Figure 8. RGB images of perforated cocoon and decayed cocoon. (a) Perforated cocoon. (b) Decayed cocoon.
Agriculture 14 00599 g008
Figure 9. Improved YOLOv8 structure diagram. The model added the GAM to all three decoupling head branches in the target detection head. Conv2d represents a convolution, and the CBS module consists of a Conv2d, a Batch Normalization (BN) structure, and a SILU activation function. The C2f module consists of CBS, split, and bottleneck structures.
Agriculture 14 00599 g009
Figure 10. Segmentation process and results of mountage silkworm cocoon image. (a) Original image. (b) Original segmented image with the two largest different green areas corresponding to the mountage and background and the colored elliptical area as cocoons. (c) Binary-segmented image with the background and mountage removed based on area threshold algorithm. (d) RGB image of the extracted cocoons. Different colors in (b) represent different masks.
Agriculture 14 00599 g010
Figure 11. Comparison of segmentation results with different algorithms. (a) Original image. (b) Segmented image with MobileSAM and the area threshold. (c) Segmented image with FCM. (d) Segmented image with FCN.
Agriculture 14 00599 g011
Figure 12. Training curves of different models.
Agriculture 14 00599 g012
Figure 13. The detection results with and without the loss of function improvement. (a) Original image. (b) Detection results without improvement. (c) Detection results with improvement. (d) The zoomed view of the blue box in (a). (e) The zoomed view of the blue box in (b). (f) The zoomed view of the blue box in (c). The green, red, and yellow boxes in (b,c,e,f) are the detected reelable cocoons, waste cocoons, and double cocoons, respectively.
Agriculture 14 00599 g013
Figure 14. The detection results with and without the GAM. (a) Original image. (b) Detection results without the GAM. (c) Detection results with the GAM. (d) The zoomed view of the blue box in (a). (e) The zoomed view of the blue box in (b). (f) The zoomed view of the blue box in (c). The green, red, and yellow boxes in (b,c,e,f) are the detected reelable cocoons, waste cocoons, and double cocoons, respectively.
Agriculture 14 00599 g014
Figure 15. Confusion matrix. (a) High brightness. (b) Low brightness. The numbers in (a,b) represent the quantity of silkworm cocoons.
Agriculture 14 00599 g015
Figure 16. Detection results of different brightnesses. (a) Mountage cocoons image in high brightness. (b) Mountage cocoons image in low brightness. (c) Detection results in high brightness. (d) Detection results in low brightness. Note: The red and yellow boxes in (a,b) are manually marked waste cocoons and double cocoons, respectively. The green, red, and yellow boxes in (c,d) are the detected reelable cocoons, waste cocoons, and double cocoons, respectively. The numbers representing waste cocoons and double cocoons are determined through manual classification.
Agriculture 14 00599 g016
Figure 17. Collected images of mountage cocoons. (a) Original frontal image. (b) Original rear image. (c) Vertically mirrored image from the reverse side.
Agriculture 14 00599 g017
Figure 18. The detection process of mountage cocoons.
Agriculture 14 00599 g018
Figure 19. Confusion matrix. (a) S_YOLOv8-c. (b) YOLOv8. (c) YOLOv7. The numbers in (a,b) represent the quantity of silkworm cocoons.
Agriculture 14 00599 g019
Figure 20. Detection results of YOLOv8, YOLOv7, and our model. (a,b) are two randomly selected images from the set of 10 test images. (c,d) are the detection results of S_YOLOv8-c. (e,f) are the detection results of YOLOv8. (g,h) are the detection results of YOLOv7. Note: The red and yellow boxes in (a,b) are manually marked waste cocoons and double cocoons, respectively. The green, red, and yellow boxes in (c,h) are the detected reelable cocoons, waste cocoons, and double cocoons, respectively. The numbers representing waste cocoons and double cocoons are determined through manual classification.
Agriculture 14 00599 g020aAgriculture 14 00599 g020b
Table 1. Dataset image grouping information.
Dataset ClassificationImage ClassificationNumber of Images
Training setreelable cocoon70,761
waste cocoon6551
double cocoon3246
Validation setreelable cocoon7510
waste cocoon986
double cocoon632
Test setreelable cocoon7327
waste cocoon1067
double cocoon681
Table 2. Key configurations of the hardware platform.
ConfigurationParameter
CPUIntel Xeon Gold 5218R
Memory128G
GPUGeForce RTX 3090
Accelerated environmentCUDA 11.1 cuDNN 8.0.5
Operating systemWindows 10.0
Development environmentPython 3.9 Pytorch 1.9.1
Table 3. Comparison of detection performance of different models.
ModelmAP/%F1/%
Reelable cocoon
F1/%
Waste cocoon
F1/%
Double cocoon
Avg (FTime)/ms
YOLOv885.489.863.060.422.1
YOLOv8_c90.893.786.382.317.5
S-YOLOv8_c95.898.693.991.935.1
YOLOv783.190.361.456.525.5
S-YOLOv788.591.286.975.147.1
Fester RCNN82.185.075.671.265.7
YOLOXs68.374.141.740.415.4
YOLOv7-tiny70.276.646.152.614.9
YOLOv5s65.771.557.245.816.3
Table 4. Ablation study of different improvement measures for the S-YOLOv8 network. √ means adding the improvement. A~F represents models incorporating the respective improvements.".
MeasureBiFPNWIoUGAMmAP/%F1/%
Reelable cocoon
F1/%
Waste cocoon
F1/%
Double cocoon
Avg (FTime)/ms
S-YOLOv8 90.292.785.183.243.2
A××93.595.188.783.445.6
B××92.794.391.683.731.5
C××92.393.686.989.644.1
D×95.497.792.691.133.6
E×94.796.490.189.947.1
F×93.995.489.588.233.1
Ours95.898.693.991.935.1
Disclaimer/Publisher’s Note: The statements, opinions and data contained in all publications are solely those of the individual author(s) and contributor(s) and not of MDPI and/or the editor(s). MDPI and/or the editor(s) disclaim responsibility for any injury to people or property resulting from any ideas, methods, instructions or products referred to in the content.

