Article

The Identification of Drought Tolerance Candidate Genes in Oryza sativa L. ssp. Japonica Seedlings through Genome-Wide Association Study and Linkage Mapping

1
College of Agriculture, Northeast Agricultural University, Harbin 150030, China
2
Key Laboratory of Germplasm Enhancement, Physiology and Ecology of Food Crops in Cold Region, Ministry of Education, Northeast Agricultural University, Harbin 150030, China
*
Authors to whom correspondence should be addressed.
Agriculture 2024, 14(4), 603; https://doi.org/10.3390/agriculture14040603
Submission received: 11 March 2024 / Revised: 8 April 2024 / Accepted: 8 April 2024 / Published: 10 April 2024
(This article belongs to the Special Issue Agricultural Crops Subjected to Drought and Salinity Stress)

Abstract

:
Drought stress poses a significant threat to rice production, necessitating the identification of genes associated with drought tolerance. This study employed a combination of genome-wide association study (GWAS) and linkage mapping to pinpoint seedling drought tolerance genes in Japonica rice. Using the leaf rolling scale (LRS) as the phenotypic index, we assessed rice drought tolerance under polyethylene glycol-induced drought during the seedling stage. A lead SNP C8_28933410 by GWAS was identified, which was located within qLRS-8-1 identified by linkage mapping on chromosome 8. Combing the LD block analyses and QTL interval, a 138.6 kb overlap interval was considered as the candidate region. Haplotype analysis, qRT-PCR, sequence analysis, and mutant phenotype verification led to the speculation that LOC_Os08g05520 is a candidate gene associated with drought tolerance. Our findings provide a valuable reference for breeders aiming to enhance rice drought tolerance.

1. Introduction

Rice is one of the main staple food crops globally, sustaining over four billion people. With increasing food demand due to industrialization and population growth, rice production faces significant opportunities and challenges. Approximately half of the world’s rice production is affected to some extent by arid conditions [1]. Therefore, there is an urgent need for the development of drought-tolerant rice varieties in breeding programs. Breeders commonly employ leaf rolling as a negative selection criterion, where a plant with more rolled leaves under drought conditions is considered drought sensitive, serving as an indicator of drought severity. Leaf rolling quantitative trait loci (QTL) have been studied across different genetic backgrounds of rice. qLRS1.1, identified through meta-analysis, was found to reside in the same genomic region related to the leaf rolling score (LRS) [2,3,4]. Furthermore, qLRI1-1, qLRI9-1, and qLRI10-1 were identified as the leaf rolling indices on chromosomes 1, 9, and 10, which explained 18.8%, 6.7%, and 8.3% of the phenotypic variance, respectively [5]. Meta-QTLs found that qLRI9-1 was co-located with DRO1 (deeper rooting 1) in the same region, which was a quantitative trait locus controlling root growth angle and negatively regulated by auxin in rice [6]. To date, 35 rolled-leaf mutants in rice have been identified, with several representative rolled-leaf genes successfully cloned, for example, OsAGO7 (ZIP/Ago7) [7], OsCOW1/NAL7 (narrow leaf 7) [8], SLL1 (shallot-like 1) [9], ADL1 (adaxialized leaf 1) [10], LC2 (leaf inclination 2) [11], NRL1 (narrow and rolled leaf 1) [12,13], ACL1 (abaxially curled leaf 1) [14], ROC5 (rice outermost cell-specific gene 5) [15], CFL1 (curly flag leaf 1) [16], RL14 (rolling-leaf 14) [17], SRL1 (semi-rolled leaf 1) [18], OsZHD1 (a zinc finger homeodomain 1) [19], OsMYB103L (R2R3-MYB transcription factor) [20], SLL2 (shallot-like 2) [21], REL1 (rolled and erect leaf 1) [22], and SRL2 (semi-rolled leaf 2) [23]. While most cloned rolled-leaf genes are associated with rice vesicular cells, only a few are related to the paraxial or distal polarity of rice leaf development.
The combination of genome-wide association study and linkage mapping provides a novel approach for the dissection of complex traits in crops. Generally, the joint analysis of these two methods enhances the reliability and accuracy of trait mapping. This has been demonstrated in various crops, revealing traits such as plant height and ear position [24], male inflorescence size [25], husk traits [26], Fusarium verticillioides seed rot resistance [27], thermotolerance of seed-set [28], and flower time-related traits [29] in maize. Coincident regions have also been identified for panicle traits in wheat [30]. Similarly, qAT11 has been identified as a primary alkali tolerance QTL in rice [31]. These studies underscore the feasibility of identifying QTLs or genes associated with seedling drought through the integration of GWAS and linkage mapping.
In this study, we employed a joint analysis method to determine the genetic basis of drought tolerance in rice seedlings. Our findings highlight LOC_Os08g05520 as a new candidate gene crucial for drought tolerance in rice breeding.

2. Materials and Methods

2.1. Plant Materials

The natural population consisted of 295 Japonica rice varieties originating from the three northeastern provinces of China, Russia, Japan, North Korea, and the Republic of Korea This natural population was also used in previous studies [31,32]. The RIL (Recombinant Inbred Lines) consists of 195 individuals constructed by KY131 (drought sensitive) and XBJZ (drought tolerant).

2.2. Drought Tolerance Evaluation at the Seedling Stage

The rice kernels were dried in a 40 °C oven for 7 days to break dormancy [33]. The seed surface was disinfected with 2.5% sodium hypochlorite for 30 min, rinsed with sterile water three times, and then immersed in distilled water for 2 days at 30 °C in a dark environment. Sixty seeds with the same bud length were divided into two parts and cultured in chernozem soil, with 10 seeds per treatment for three replicates. The seeds were grown in a light incubator at 27 °C during the day and 22 °C at night with a relative humidity of 70%. At the two leaves and one core stage, Yoshida nutrient solution (pH = 5.5, 460.854 mg/L) was added to the control every 7 days. Simultaneously, Yoshida plus 20% PEG-6000 nutrient solution (pH = 5.5, 460.854 mg/L) was used for treatment for 10 days. After 10 days of drought stress, LRS was evaluated in three replicates based on the standard evaluation system [34]. Leaf begins to fold (V-shaped) means LRS equals 1; deep leaf fold (deep V) means LRS equals 3; the blade is U-shaped means LRS equals 5; blade edges fastened together (O type) means LRS equals 7; and tightly crimped blade means LRS equals 9. GWAS and linkage analyses were performed using the mean values of three replicates of the LRS.

2.3. GWAS for Leaf Rolling

A total of 788,369 SNPs with minor allele frequency (MAF) ≥ 5% and missing rate ≤ 20% were selected for GWAS [32]. Considering the group structure and kinship, TASSEL 5.0 [35] was used for association analysis of the LRS using a mixed linear model (MLM). The number of valid and independent SNPs was counted using GEC software (http://pmglab.top/gec/#/download, accessed on 1 May 2021), considering p < 5.46 × 10⁻⁶ as the threshold to determine the significance of SNP marker association with LRS. If at least two significant SNPs were located in the same LD (linkage disequilibrium) interval, these SNPs were defined as the same QTL, and the SNP with the smallest p value was regarded as the lead SNP. Manhattan maps and Q-Q plots were created using the CMplot package in R 3.3.2.

2.4. QTL Mapping for LRS

The linkage group was constructed using 527 bin markers and the 10 K Array genotype technique at the MOLBREEDING Biotech Company. The total length of the genetic map was 1875.6 cM, and the mean distance between the markers was 3.58 cM (Figure S1). QTL mapping was performed using the inclusive composite interval mapping (ICIM) method and QTL IciMapping Version 4.2 (https://isbreeding.caas.cn/rj/qtllcmapping/, accessed on 1 May 2021). The threshold for QTL identification (LOD score) was set to 3.0, and the step was set to 1 cM.

2.5. Haplotype Analysis and Quantitative Real Time PCR

In this study, the co-localisation intervals between GWAS and linkage mapping were regarded as important QTLs. In GWAS, if a significant site is a false positive, the site can be visually judged by LD block analysis. LDBlockShow was a fast and convenient tool for visualization LD and haplotype blocks based on variant call format files. To rule out false positive sites, the lead SNPs ± 2 Mb as a block were analysed by LDBlockShow [36]. SNPs with non-synonymous mutations (including the promoter region 1500 bp before ATG and exons of candidate genes) were downloaded from the Rice SNP-Seek Database (https://snp-seek.irri.org/_snp.zul, accessed on 1 May 2021). Haplotype analysis was performed on 295 japonica rice varieties using Origin Pro 2019b software, and the database which was utilized was “GWAS for Leaf Rolling in 2.3”. The expression of candidate genes in the leaves was evaluated using qRT-PCR. After 24 h of drought stress with 20% PEG-6000, fresh leaves of KY131 and XBJZ were sampled under 20% PEG-6000 and control conditions. Total RNA was extracted using the TranZol Up RNA Kit (Trans Gen Biotech, Beijing, China). cDNA was synthesised from the total RNA using the HiFiScript cDNA Synthesis Kit (Cwbio, Beijing, China). qRT-PCR analysis was performed using a Roche LightCycler96 (Roche, Basel, Switzerland). All primer sequences are listed in Table S1. Relative gene expression quantity was calculated using the 2−ΔΔCt method [37].

2.6. Prediction of Candidate Genes and Sequence Alignment

Based on the results of haplotype and gene expression analyses, LOC_Os08g05520 was predicted to be a candidate gene. Thereafter, the candidate gene was cloned by PCR, and at the same time, sequencing was completed in KY131 and XBJZ. SnapGene software (https://www.snapgene.com/, accessed on 1 May 2021) was used for sequence alignment.

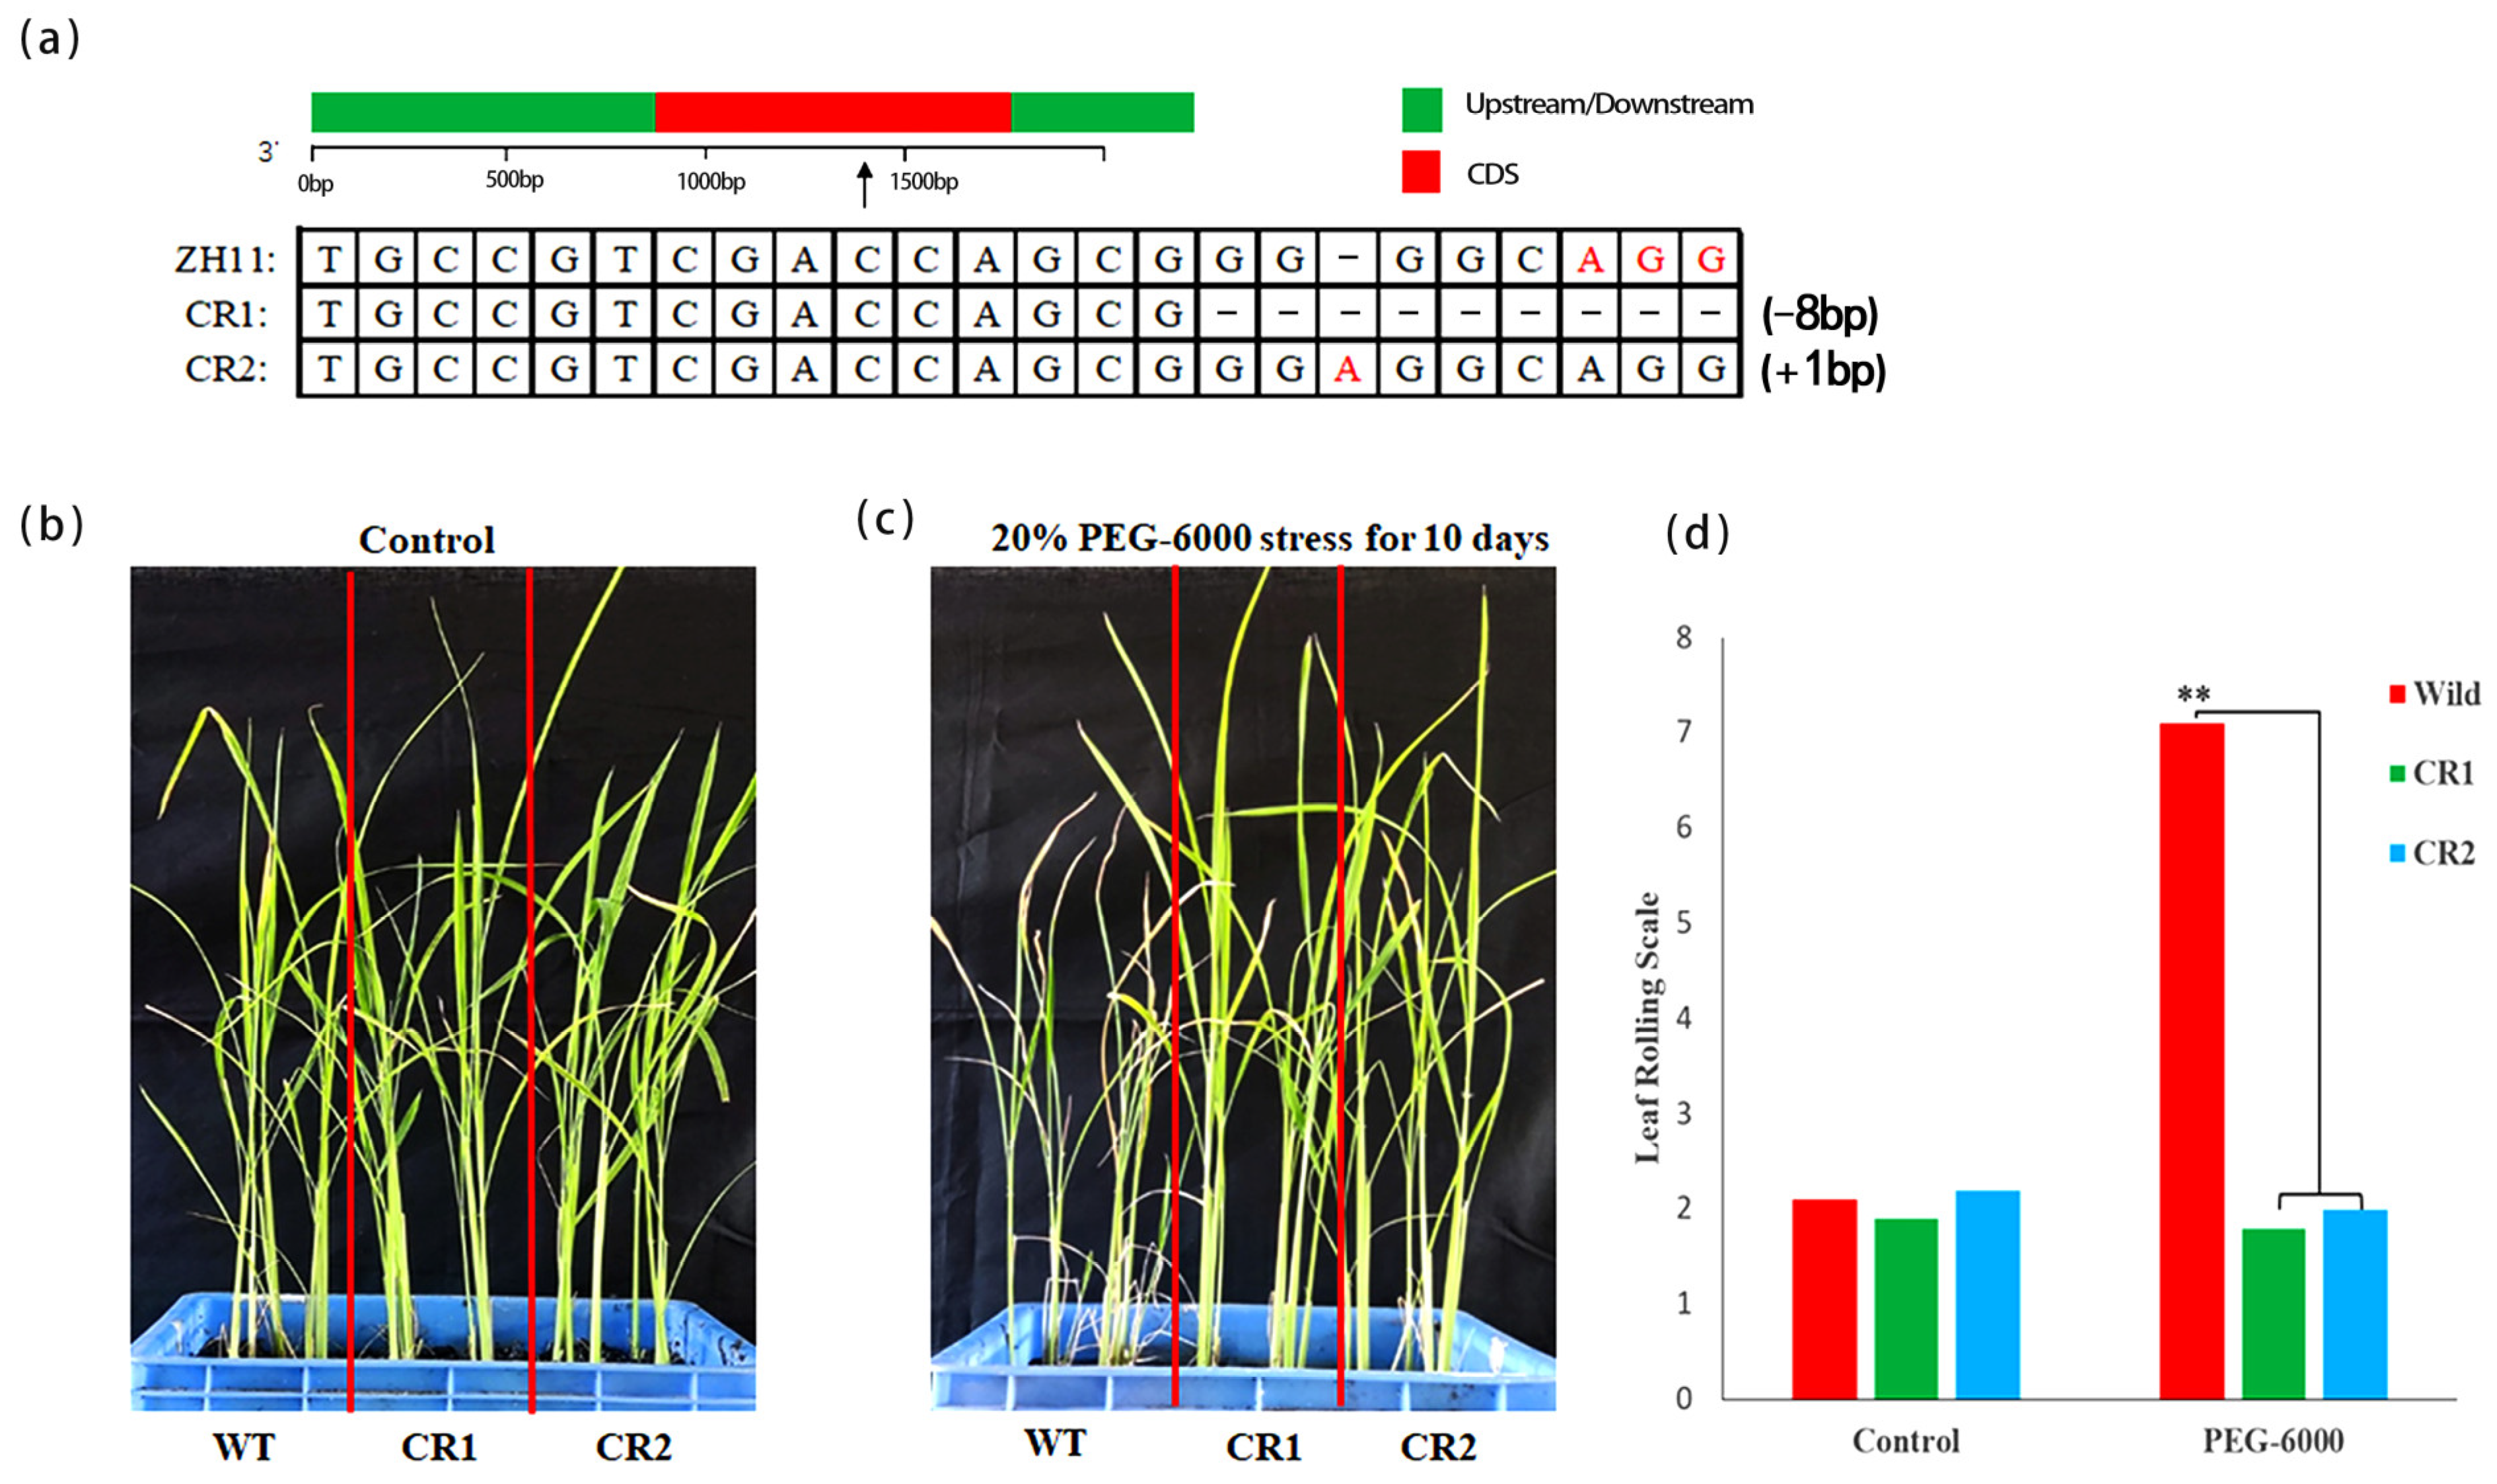
2.7. Acquisition of LOC_Os08g05520 Mutants

The mutant seeds of the T1 generation with a ZH11 genetic background were obtained from BIOGLE GENETECH (http://www.biogle.cn/, accessed on 1 May 2021), which was created using CRISPR/Cas9 in August 2020. During the next two seasons, the T1 seeds were planted in the field for seed propagation and separation. Finally, two homozygous T3 generation lines (named CR1 and CR2) were selected in October 2022, which had sufficient seeds for drought tolerance identification.
In osmotic stress, ZH11 wild, CR1, and CR2 were planted in two rows in one pool under two conditions (20% PEG-6000 treatment and control) for 10 days at the two leaves and one core stage. LRS was investigated with three repeats. In addition to osmotic stress, we analysed the differences in LRS between the mutants and wild type using the water deprivation method. The control was cultured under normal conditions. For the drought treatment, the plants were deprived of water for 20 days at the three-leaf stage. LRS and plant height were investigated with three repeats after 20 days’ cultivation. The mutant and wild plants were then transplanted into pots for recovery culturing under the same cultivation conditions as those used in field production. At the maturity stage, plant heights, tillering numbers, effective panicle numbers, grain numbers per spike, thousand-grain weights, and yields per plant were measured in triplicate in the treatment and control groups. Significance analysis (p < 0.05) and mapping were performed using the Origin software package (OriginLab origin 2019b).

3. Results

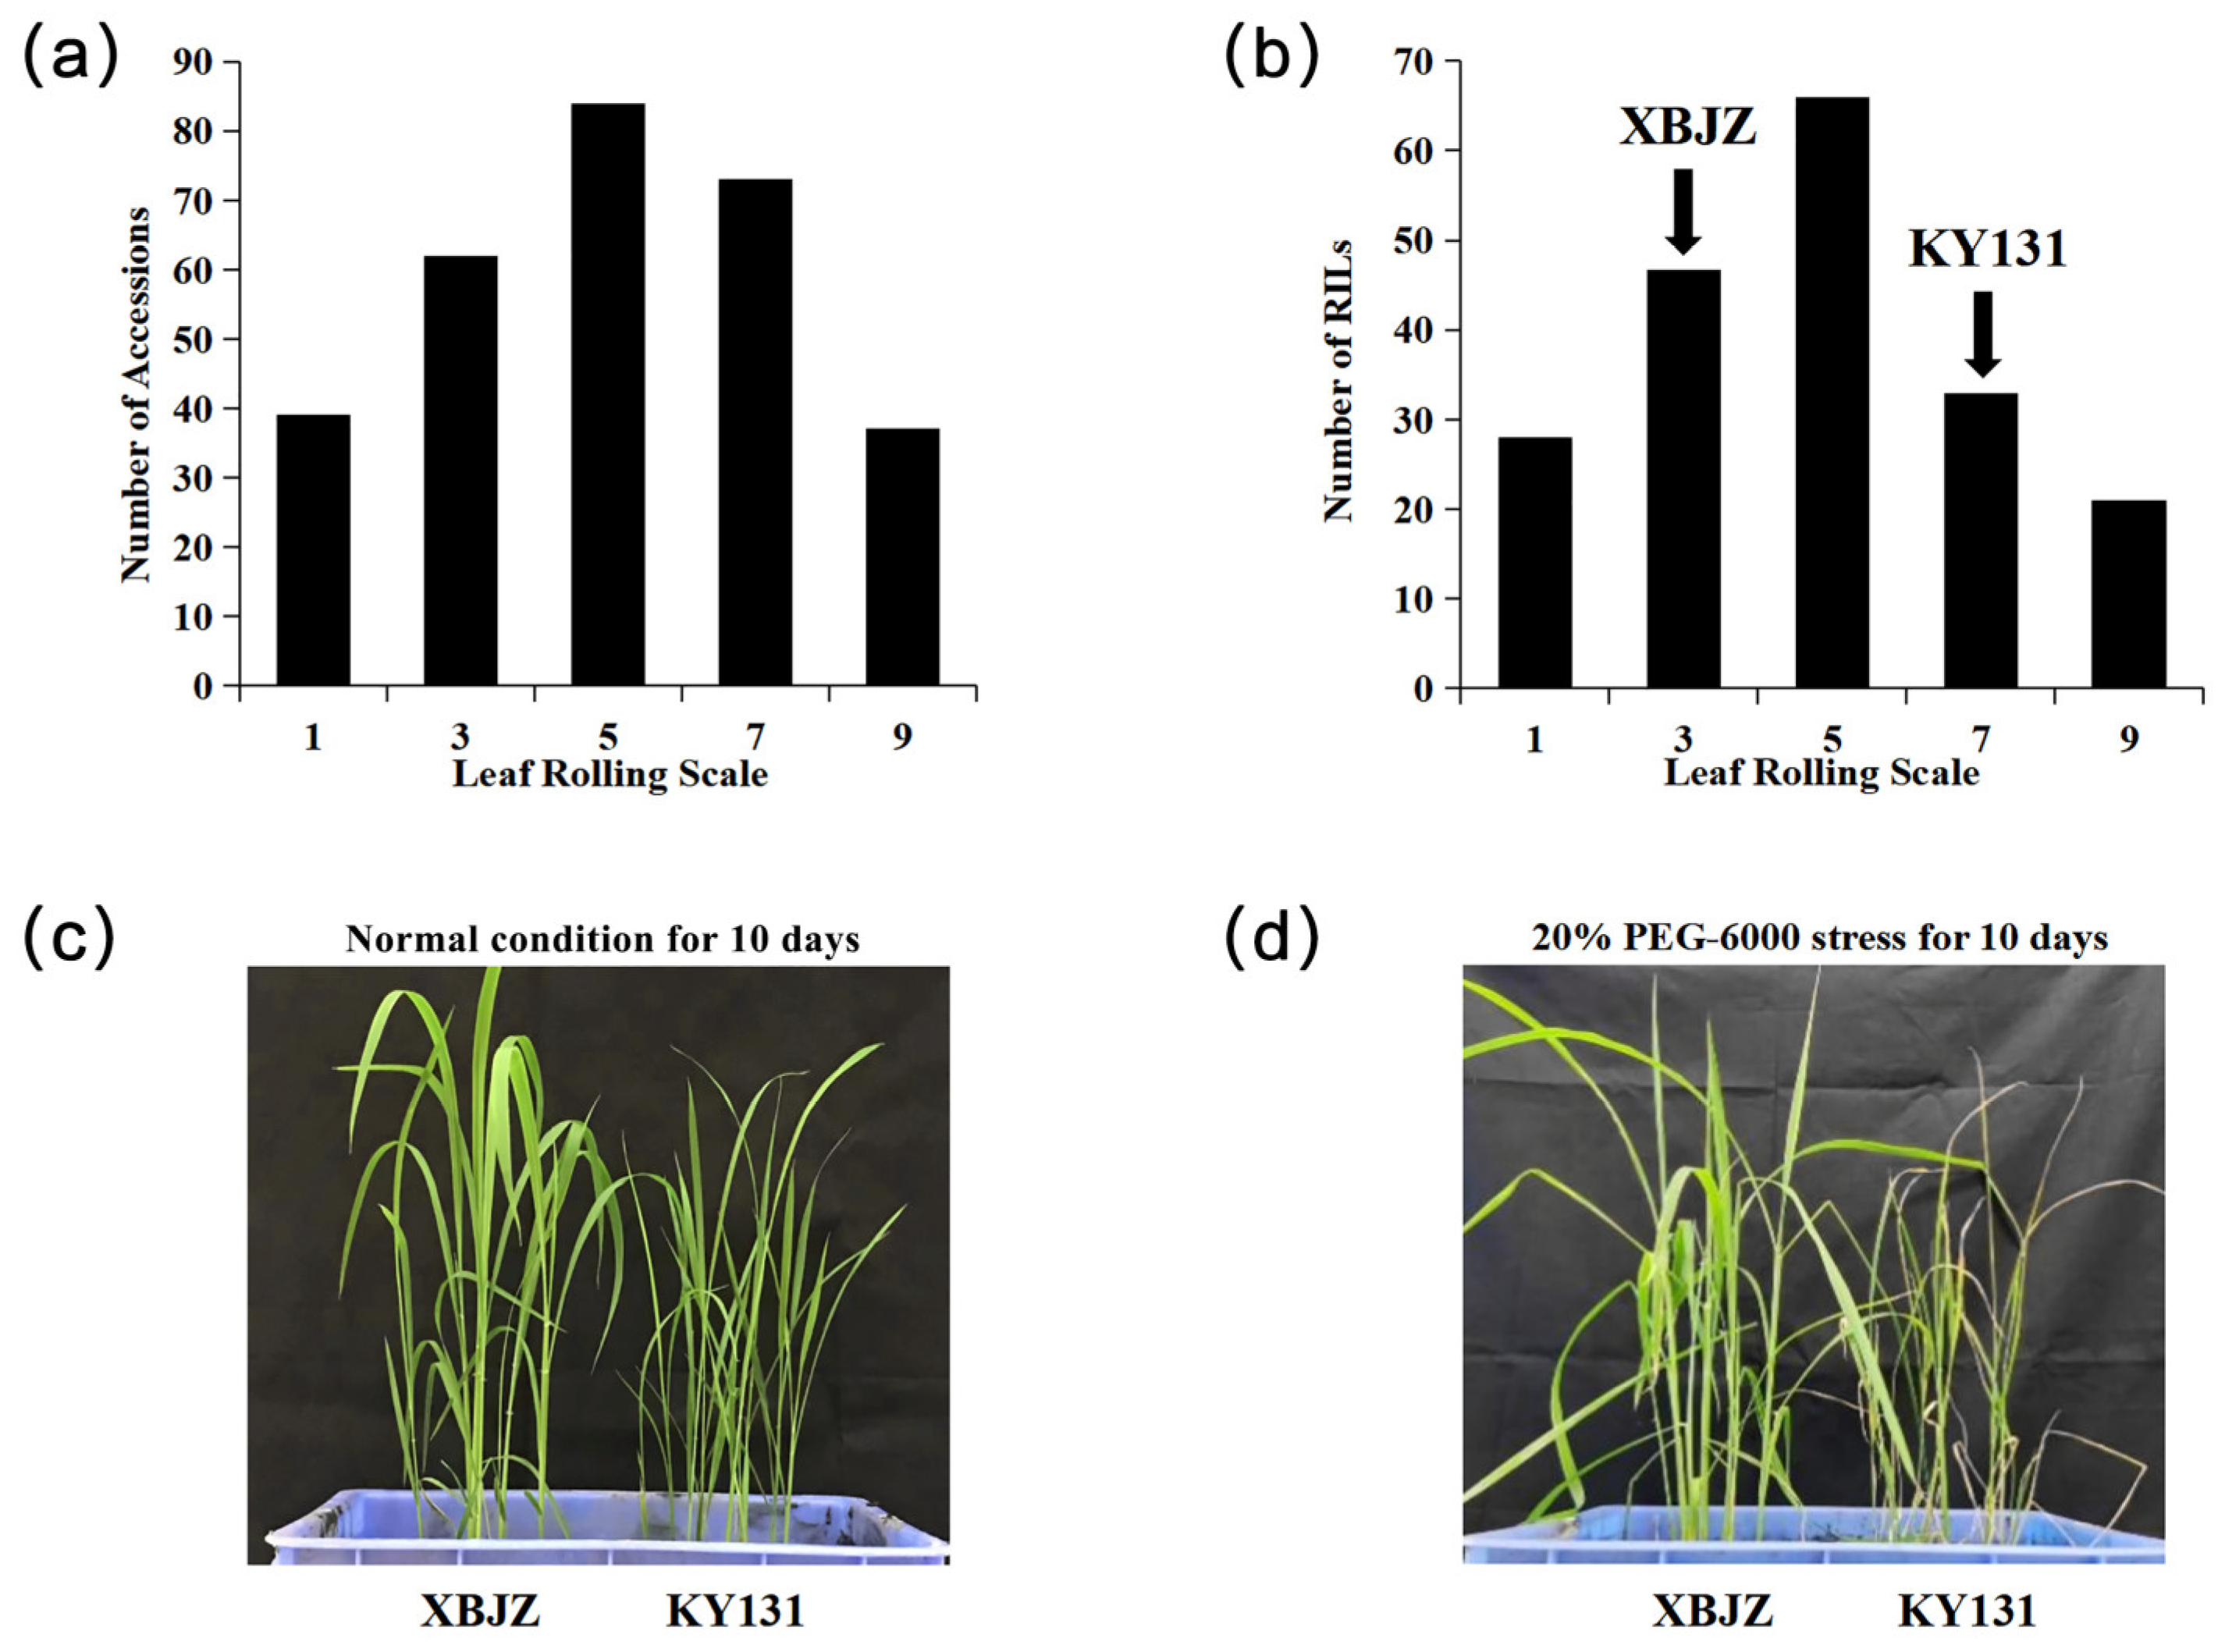
3.1. Phenotypic Variation

The mean values, standard deviations, and ranges for the natural population and 195 RILs are listed in Table S2. LRS varied significantly among the 295 accessions, ranging from 1.0 to 9.0, with a mean value of 5.0. The mean LRS for the 195 RILs was 4.7, with a range from 1.0 to 9.0. The frequency distribution of leaf rolling among the 295 accessions and the RIL population is shown in Figure 1a,b. The parents’ performance under normal conditions and drought stress is illustrated in Figure 1c,d. The LRS of the parents under drought treatment was graded as 3.0 and 7.0, respectively. The distribution of phenotypic values basically conforms to normal distribution both in the natural and linkage population. All these prove that leaf rolling character belongs to quantitative character inheritance.

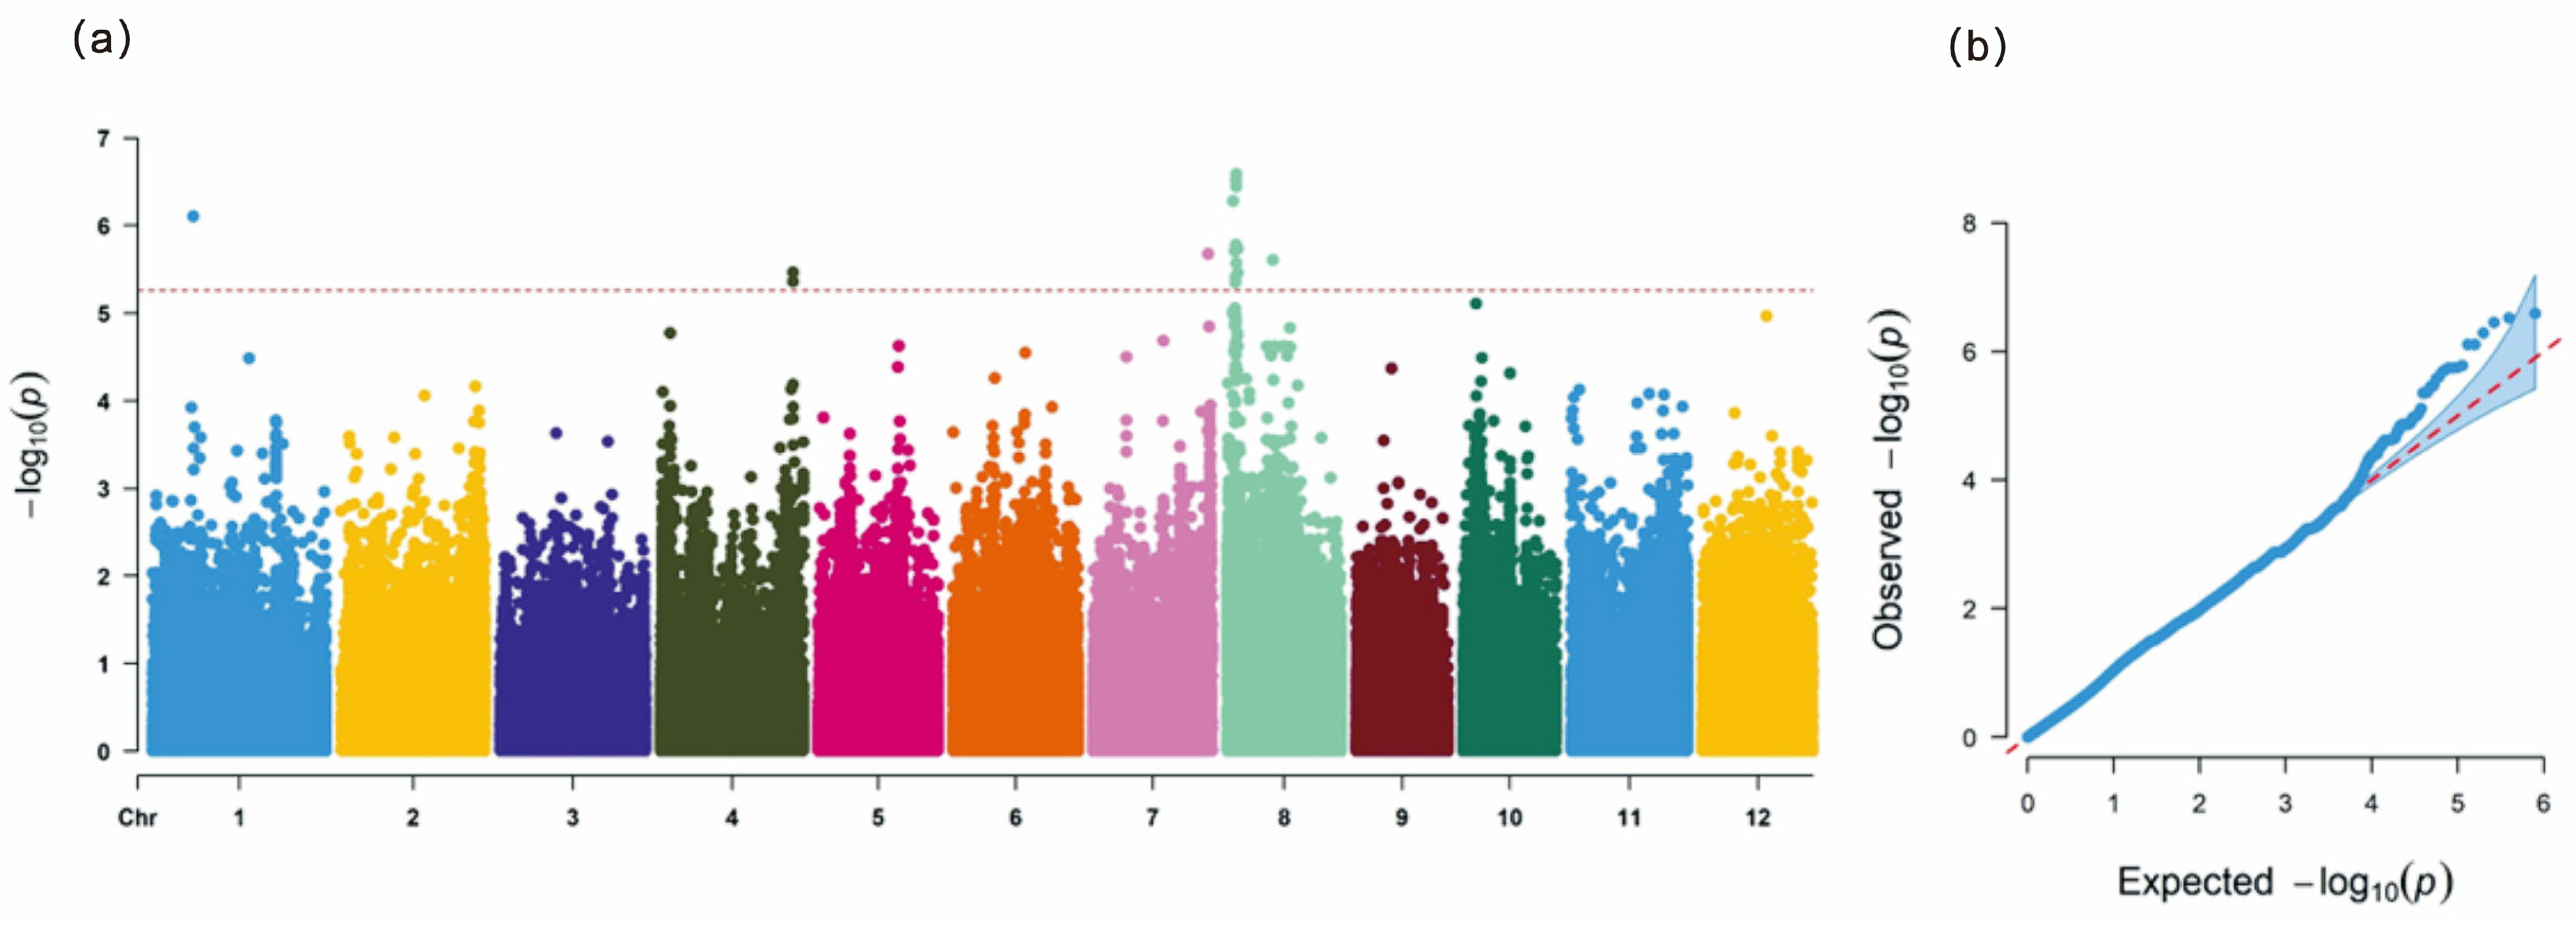
3.2. GWAS for LRS in Natural Population

The GWAS results are showed in Manhattan and Q-Q plots in Figure 2a,b, respectively. Eight SNPs were significantly associated with leaf rolling (Table 1). These SNPs were located on chromosomes 1, 4, 7, and 8, with R2 values ranging from 10.11% to 14.16%. While sporadically distributed on chromosomes 1, 4, and 7, they exhibited a significant association with leaf rolling. Notably, on chromosome 8, four SNPs were distributed in clusters that were significantly associated with leaf rolling, indicating linkage disequilibrium among these SNPs. The bottom left corner of the Q-Q plots showed that the model was reasonable, and the top right corner showed that the correlation sites were found.

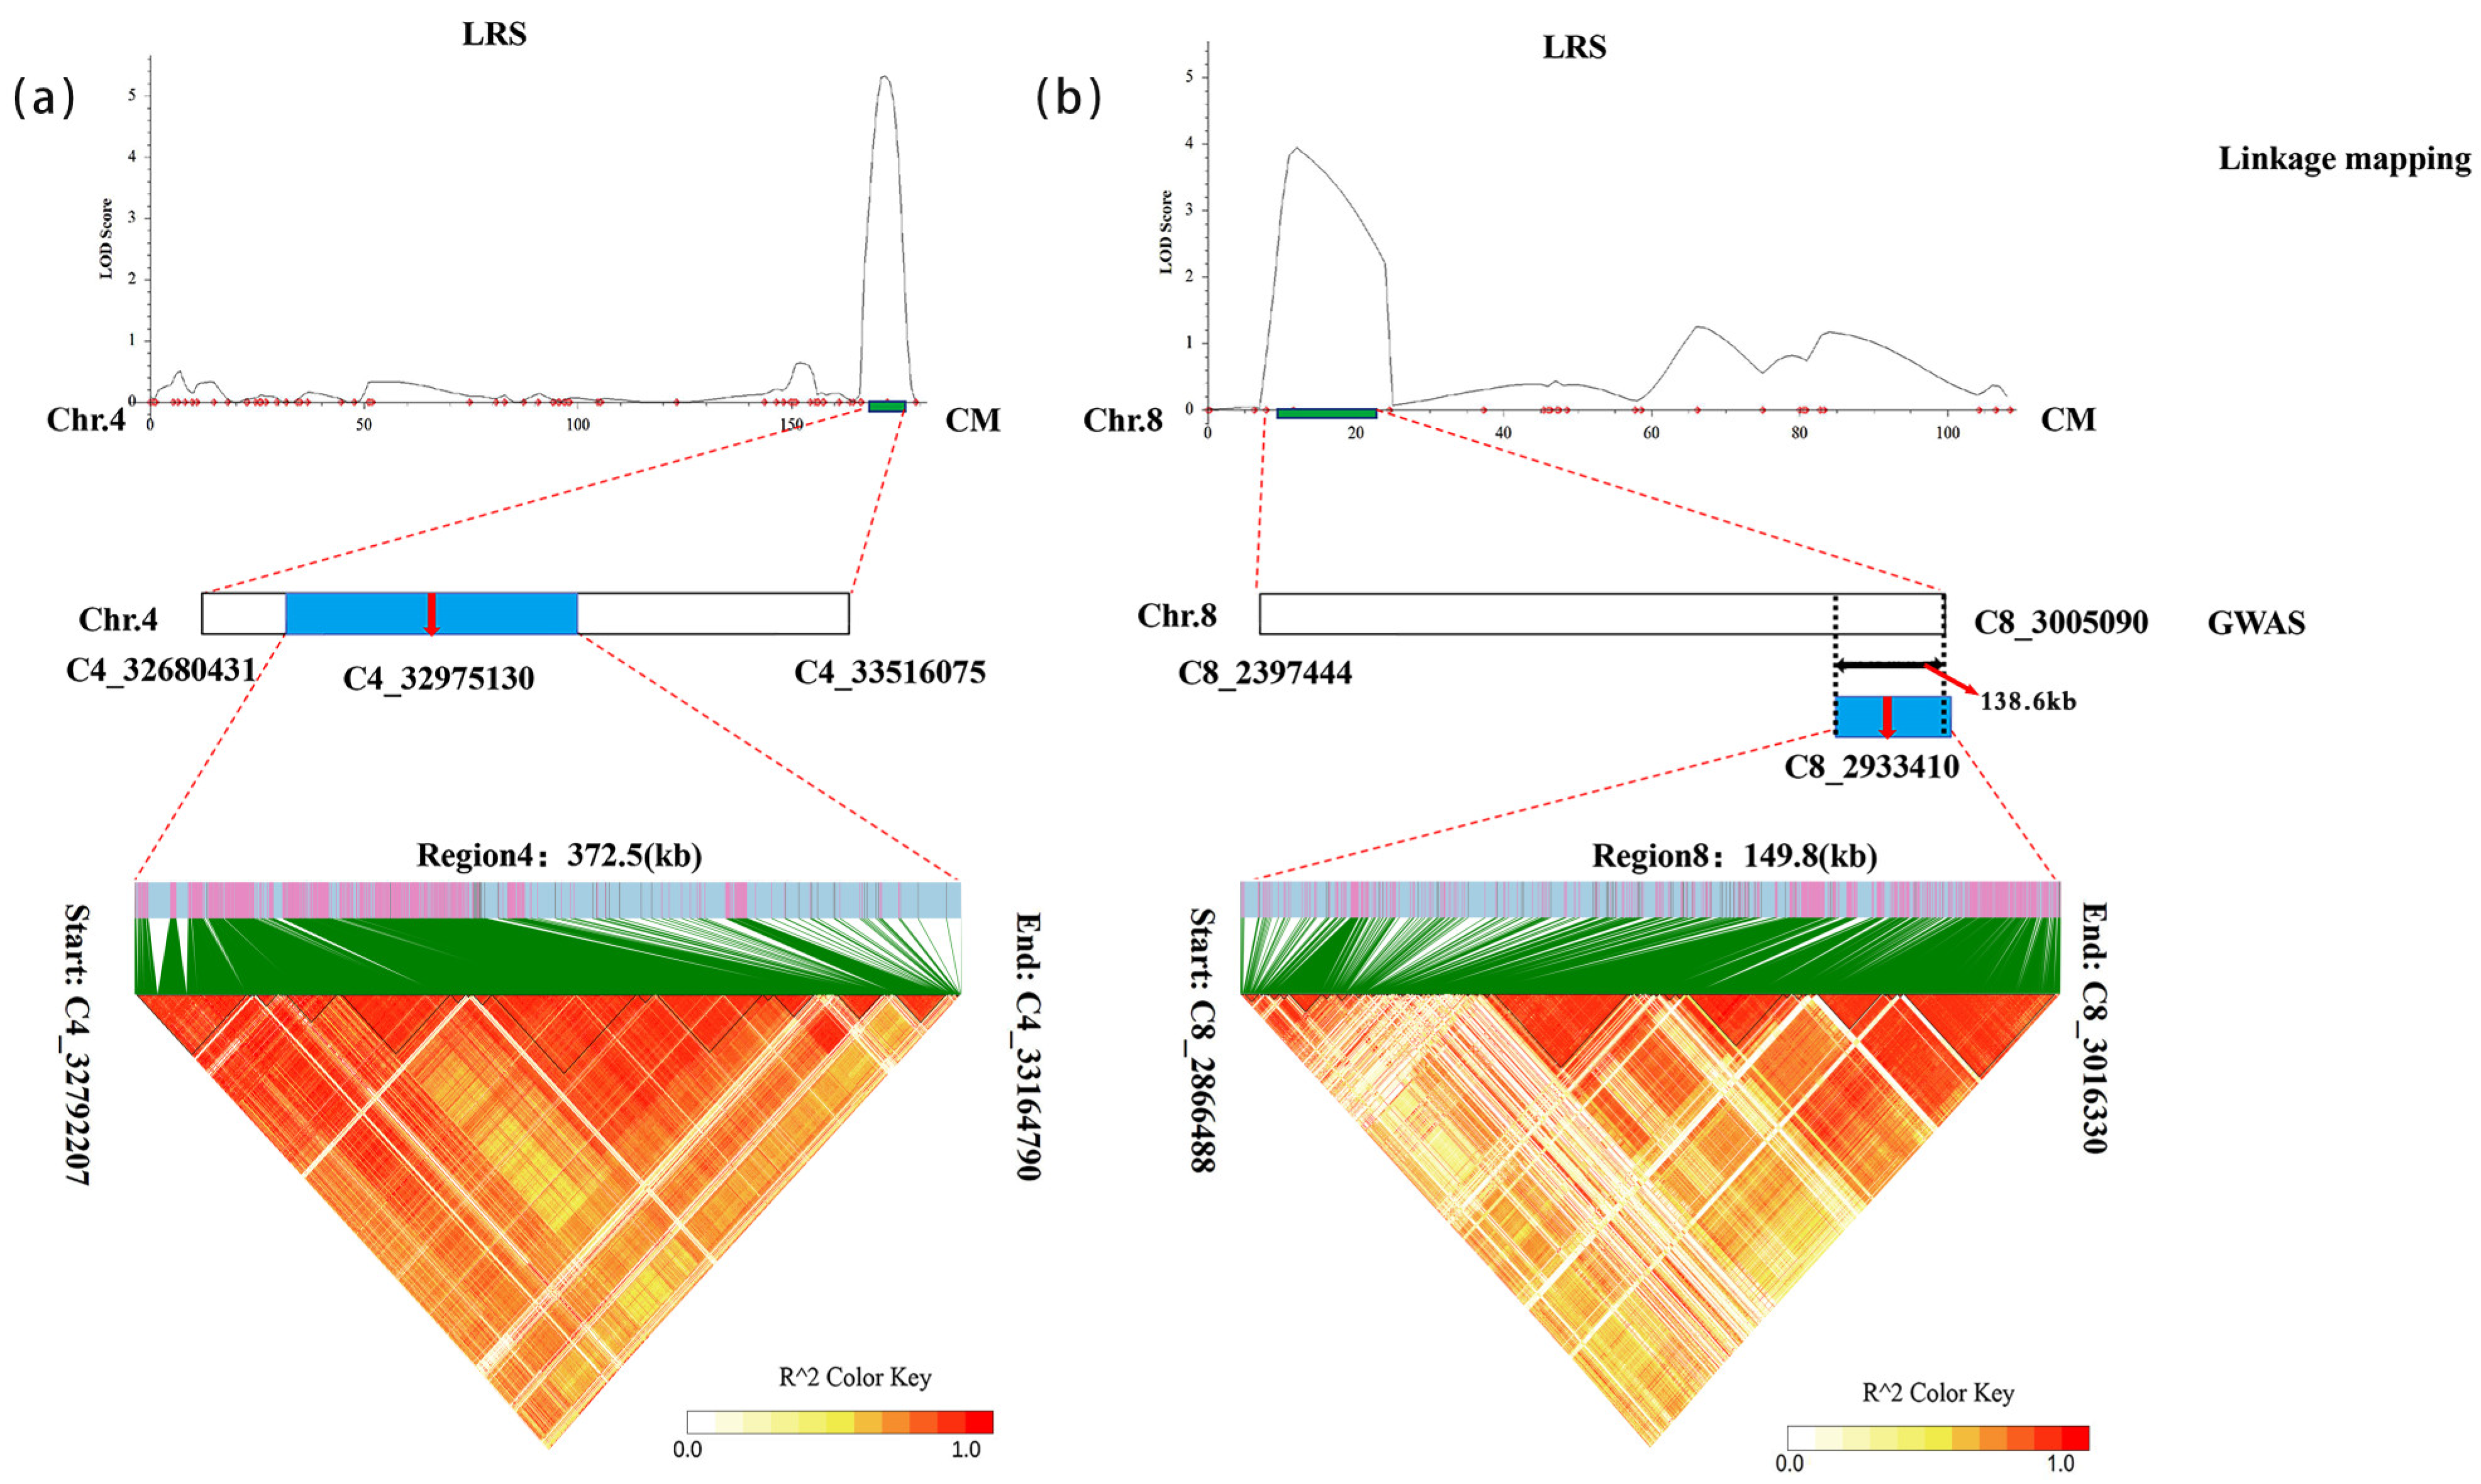
3.3. Linkage Mapping for LRS in RIL Population

Two QTLs associated with LRS were localised on chromosomes 4 and 8 (Table 2; Figure S1), with LOD values of 5.32 and 3.94, respectively. qLRS-4-1 was located between markers C4_32680431 and C4_33516075, elucidating 14.69% of the phenotypic variation. In addition, qLRS-8-1 was located between markers C8_2397444 and C8_3005090, accounting for 9.94% of the phenotypic variation.

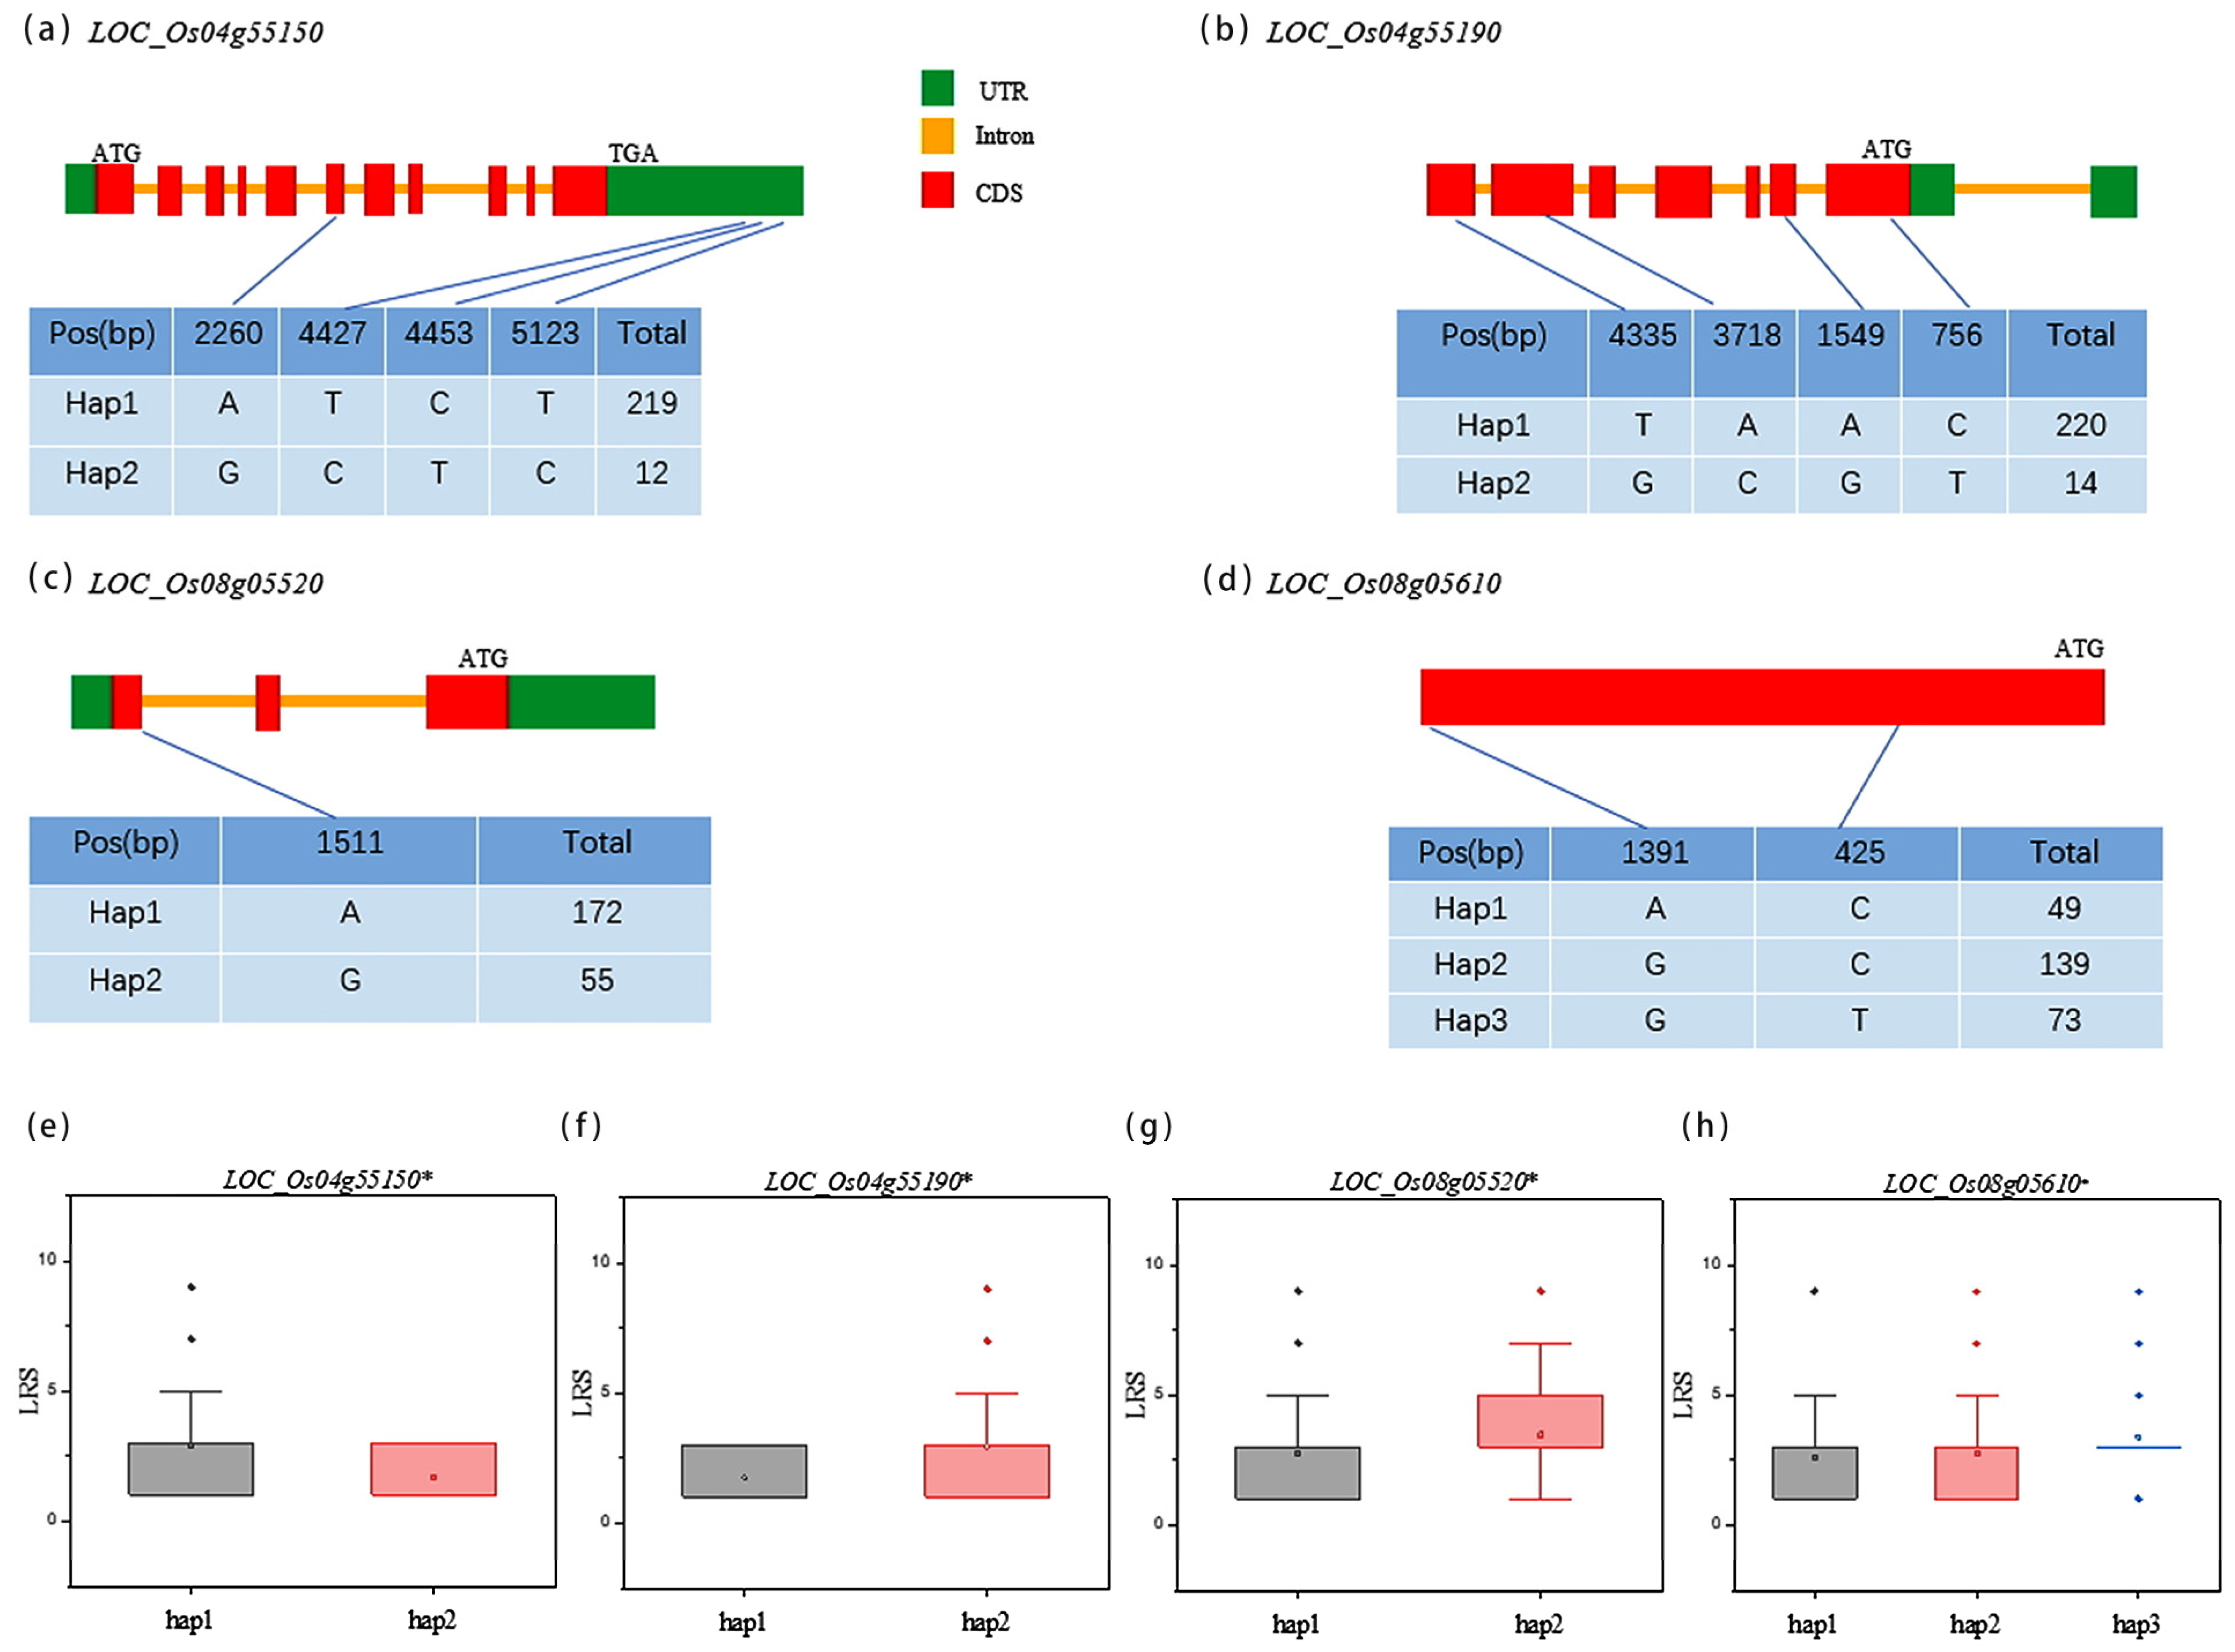
3.4. Haplotype Analysis of Candidate Genes

By comparing the results of GWAS and linkage analysis, the lead SNPs Chr4_32975130 and Chr8_2933410 were located in the qLRS-4-1 and qLRS-8-1 intervals, respectively (Figure 3a,b). LDBlockShow analysis revealed 57 candidate genes between C4_32792207 and C4_33164790 (Table S3) and 22 candidate genes between C8_2866488 and C8_3016330 (Table S4). 57 candidate genes include 41 expressed proteins, eight retrotransposon proteins, one putative protein, and seven known functional genes. Twenty-two candidate genes include 21 expression proteins and one retrotransposon protein. Based on the overlapping region of the linkage mapping, the range was further narrowed from 149.8 kb to 138.6 kb. Haplotype analysis of these genes was performed, revealing significant differences in the haplotypes of four genes (LOC_Os04g55150, LOC_Os04g55190, LOC_Os08g05520, and LOC_Os08g05610) compared to those of LRS (Figure 4e–h). Among the four candidate genes, there were totals of 231, 234, 227, and 261 varieties with haplotypes, respectively. Among these genes, except for three non-synonymous mutations in LOC_Os04g55150 in the untranslated regions, all other non-synonymous mutations were in exons (Figure 4a–d).

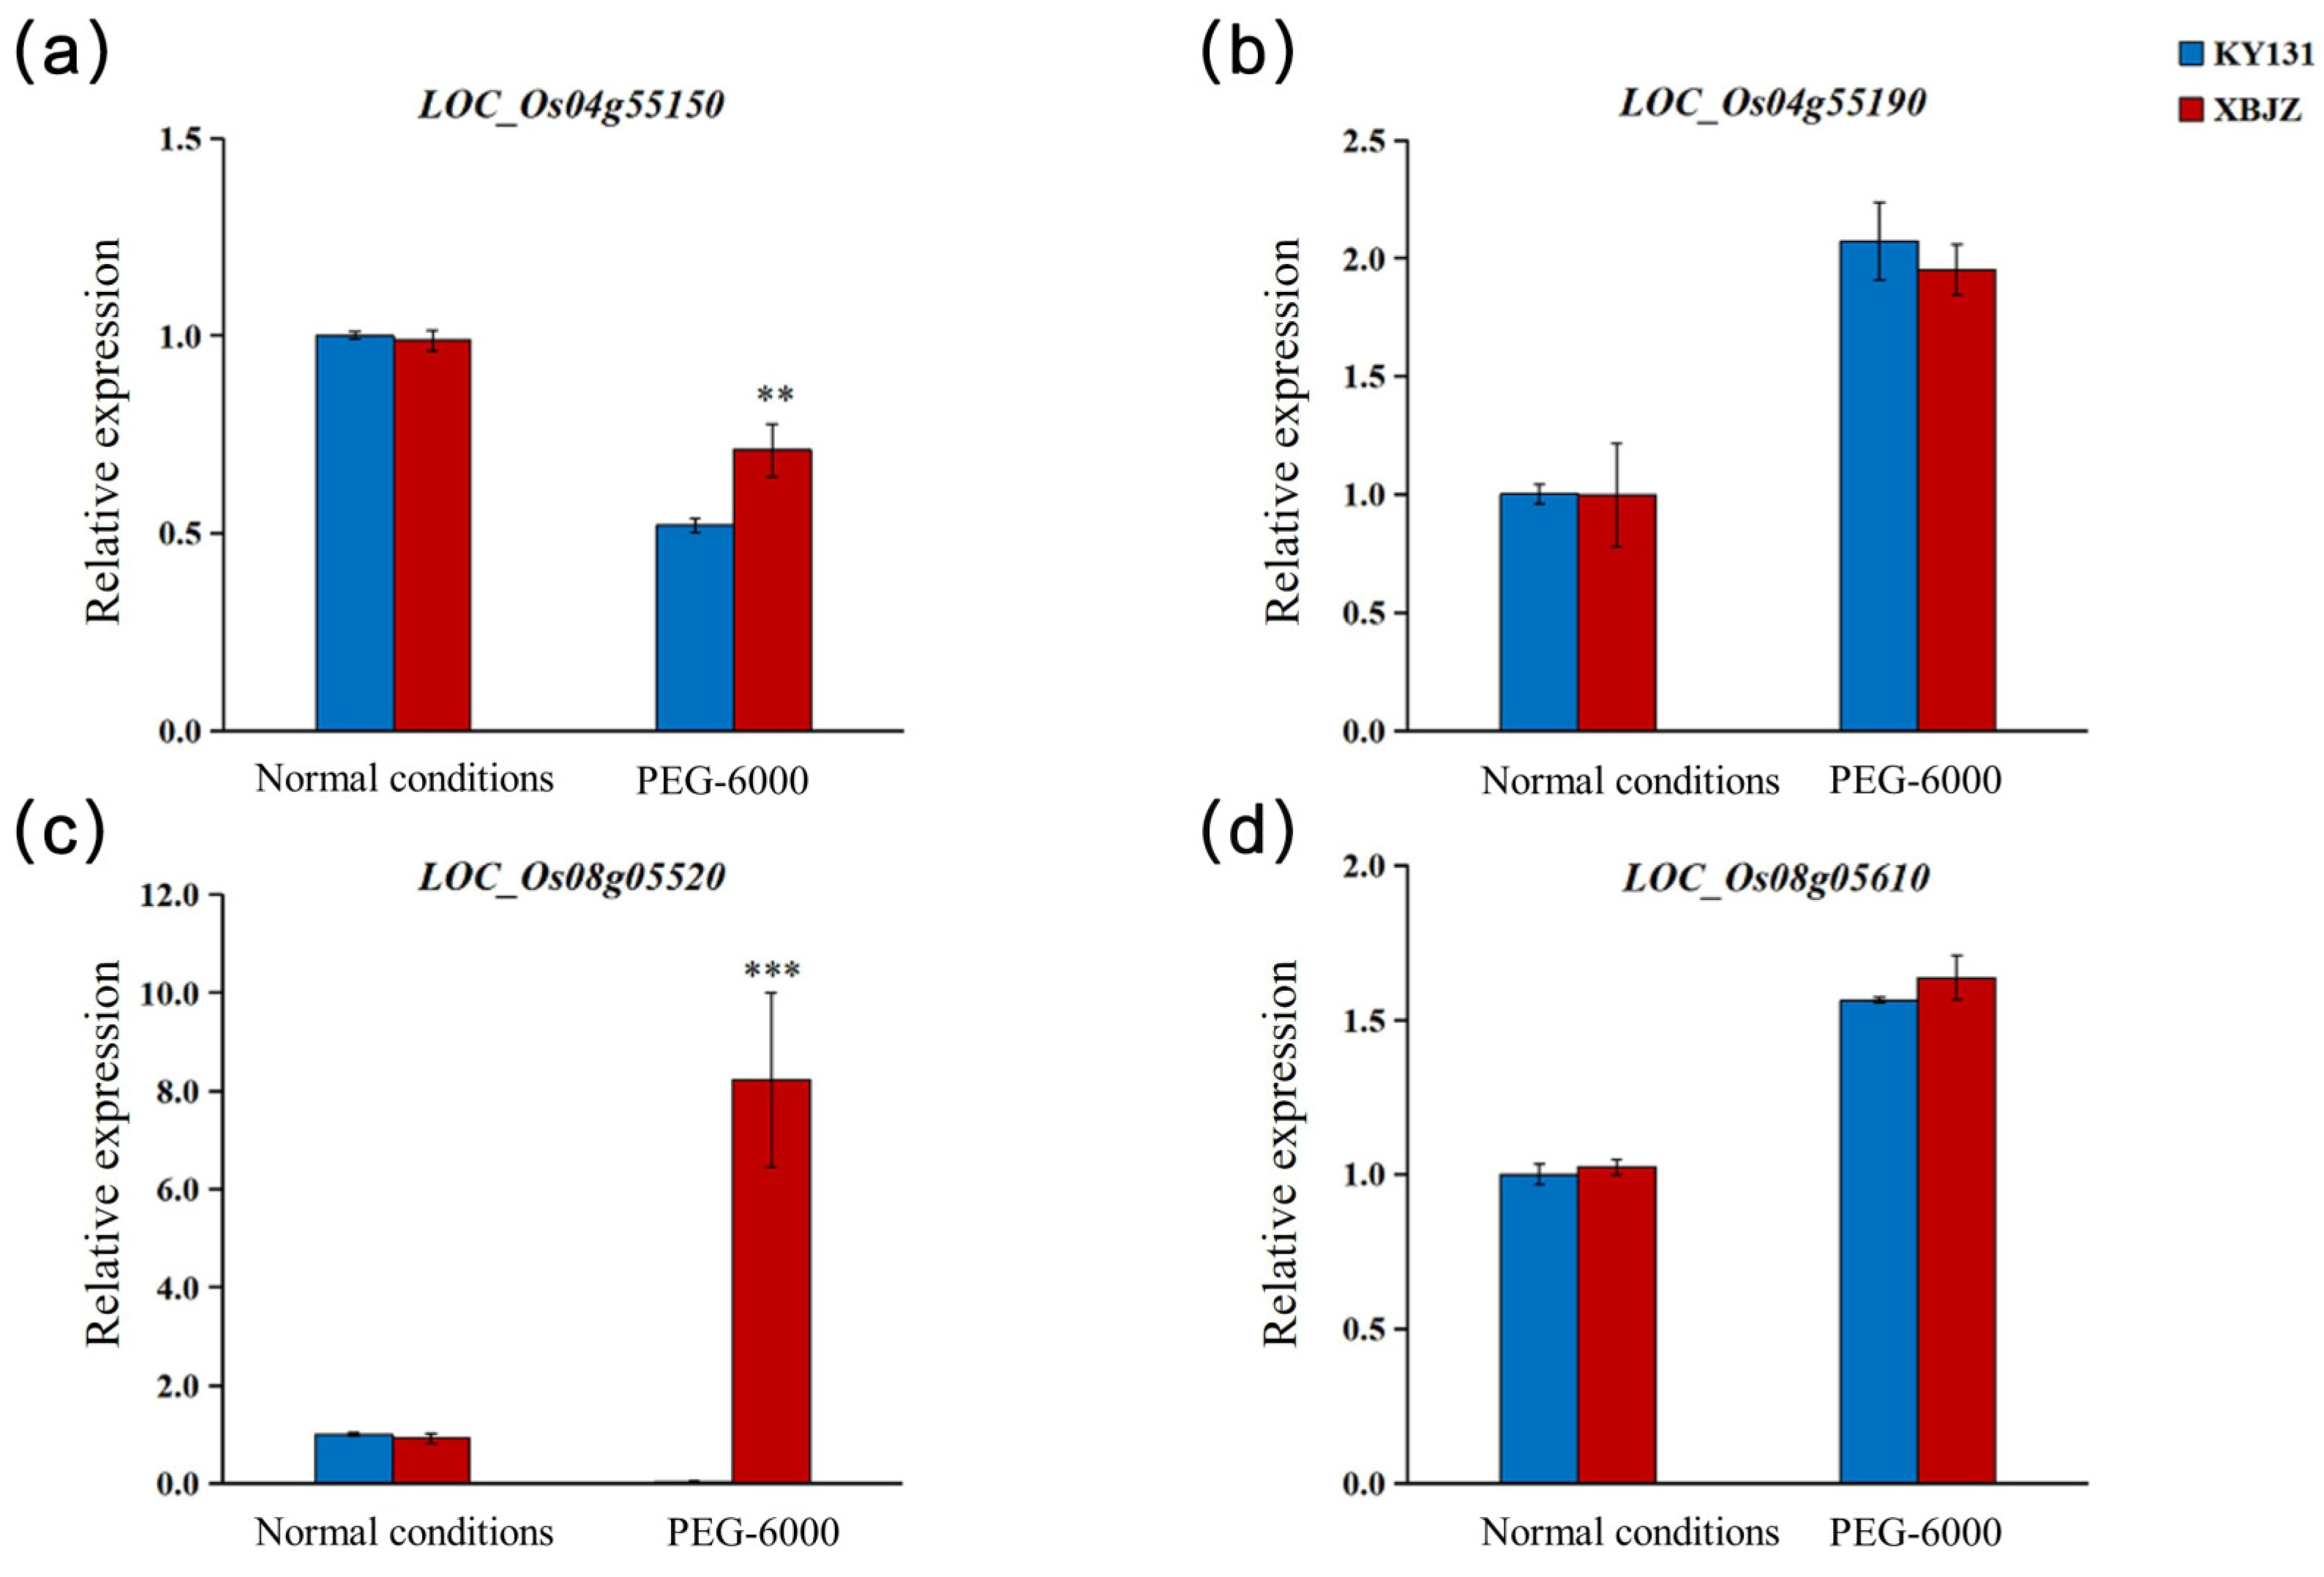
3.5. Gene Expression and Sequence Analysis of Candidate Genes

The expression of the four genes in the leaves was evaluated using qRT-PCR, and the results from the average of three replicates are shown in Figure 5. Under control conditions, no differences were observed in the expression levels of the four genes between the parents. However, under drought treatment, the expression levels of two genes showed significant differences between the parents (Figure 5a,c). There were no differences between LOC_Os04g55190 and LOC_Os08g05610 (Figure 5b,d). Taking the fact that KY131 is drought-sensitive and the variety XBJZ is drought-tolerant into consideration, LOC_Os04g55150 and LOC_Os08g05520 can be regarded as the candidate genes. Specifically, the expression of LOC_Os08g05520 in XBJZ was significantly upregulated under drought stress compared to that in KY131 (Figure 5c).
LOC_Os04g55150 and LOC_Os08g05520 were sequenced in KY131 and XBJZ, respectively, revealing no differences between the parental sequences of LOC_Os04g55150 (Figure S2). Nevertheless, compared with the sequence of KY131, LOC_Os08g05520 in XBJZ exhibited a 1 bp (A→C) mutation in the promoter region and a 2 bp deletion (A and T) in the first exon. Considering differences in parental drought resistance, we hypothesised that LOC_Os08g05520 was a candidate gene for drought resistance in rice. LOC_Os08g05520 encodes a MYB-like DNA binding domain containing protein that has been previously reported to affect stem degradation in rice [20].

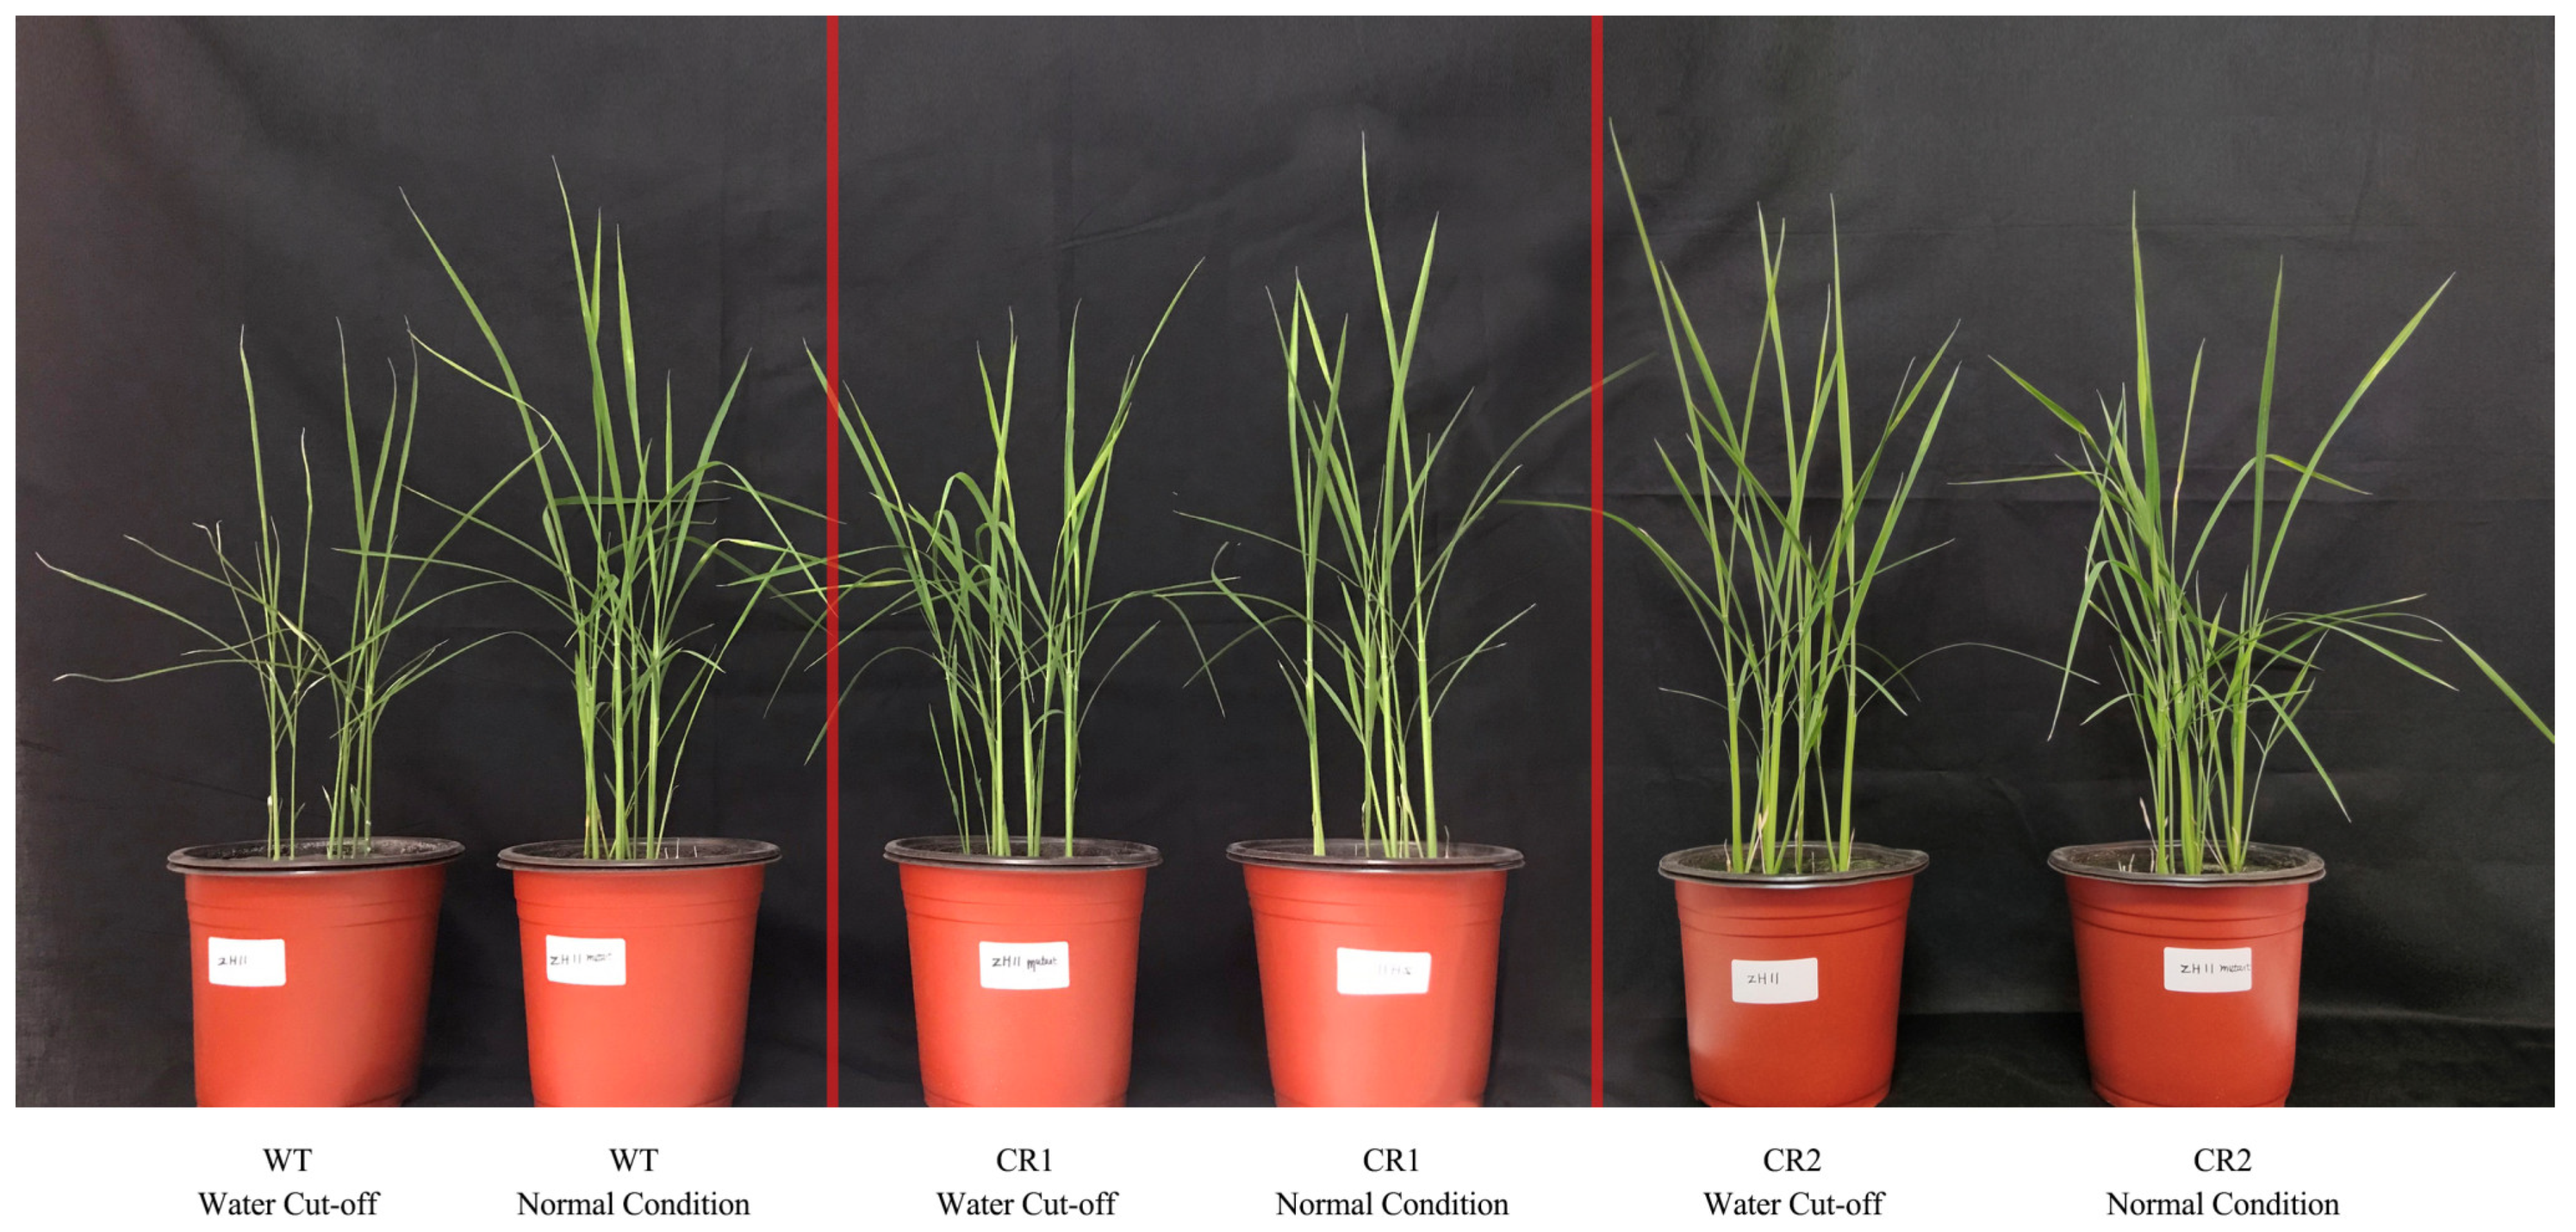
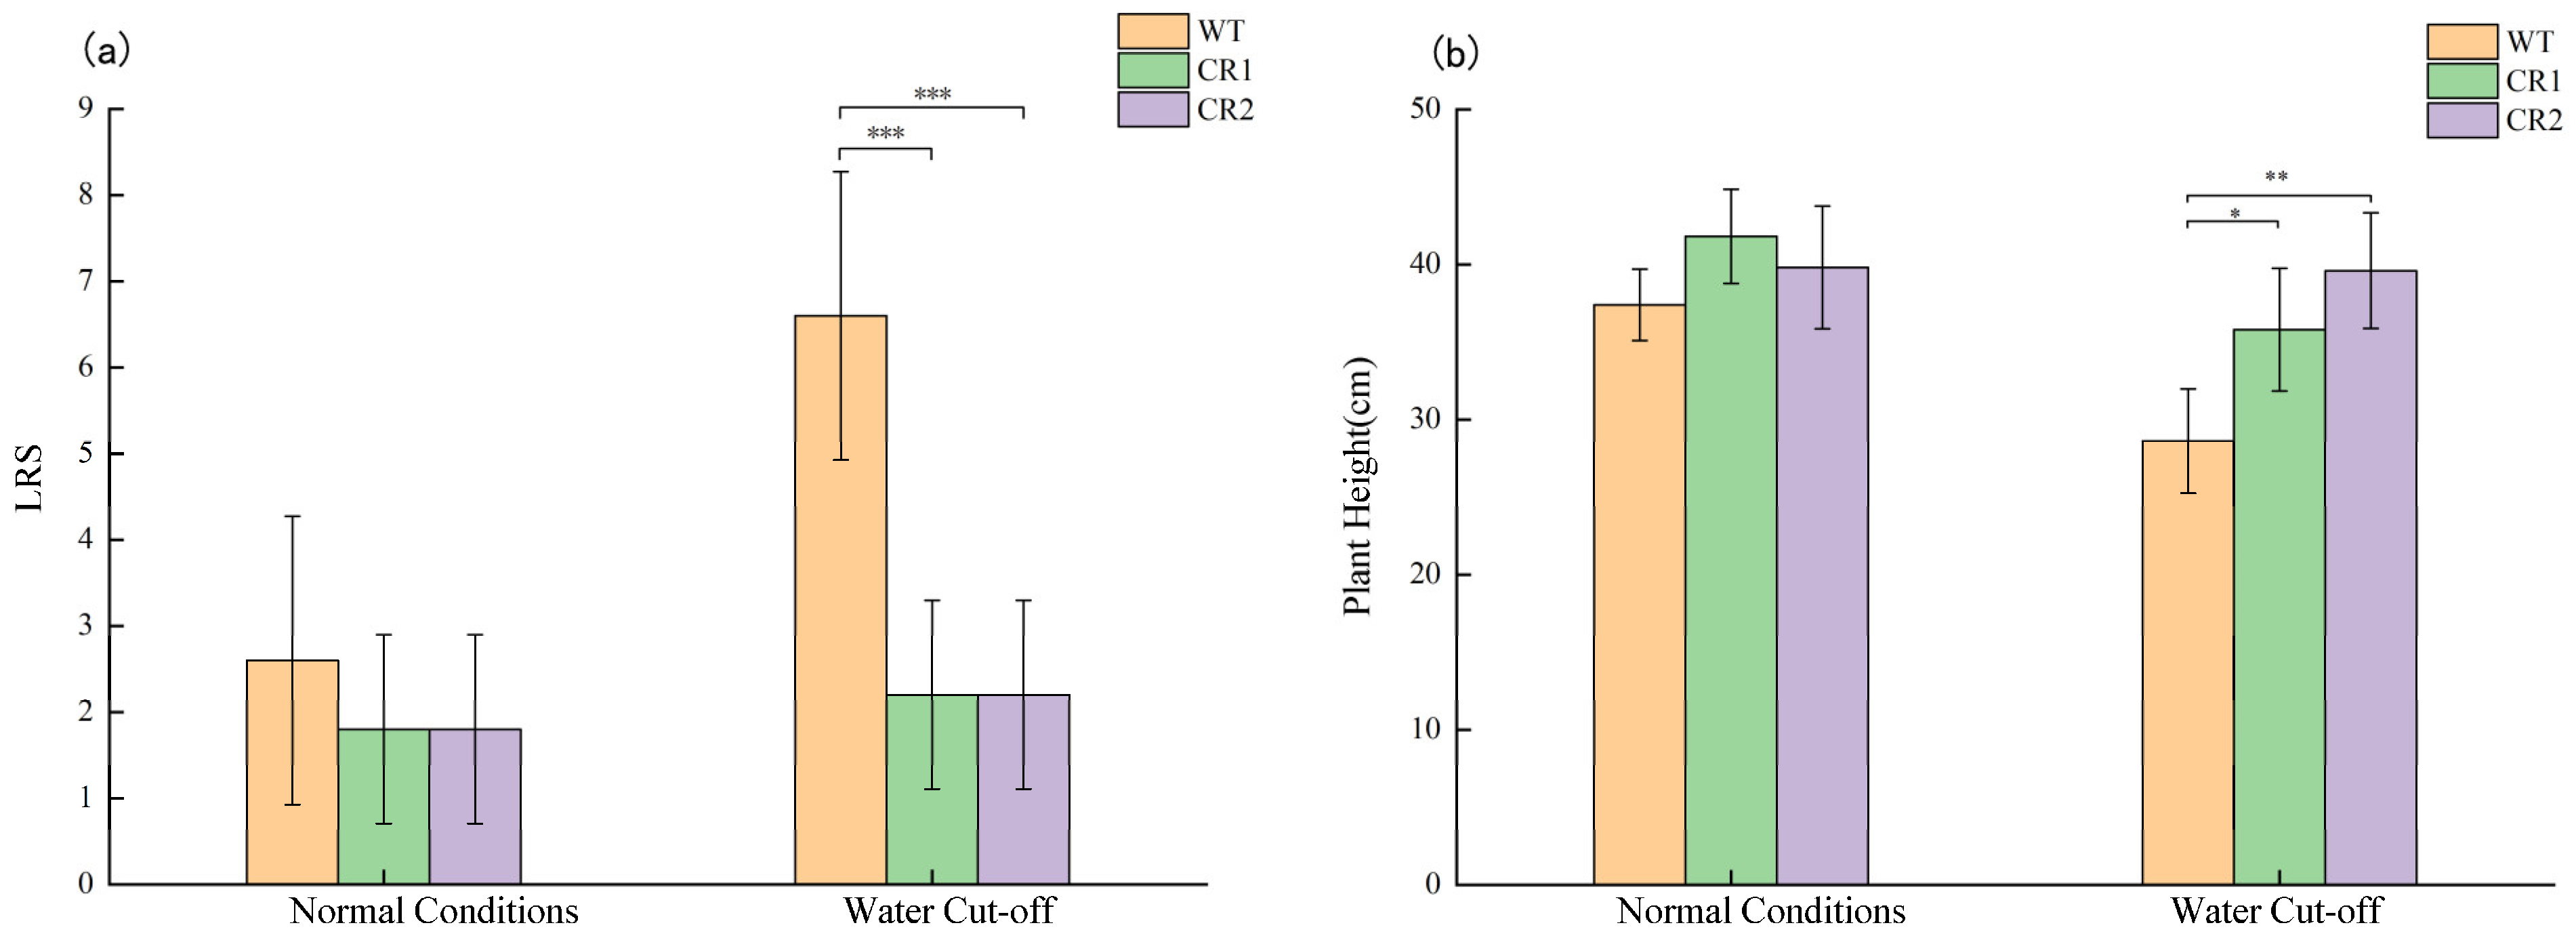
3.6. Drought Tolerant Function Verification by Mutant

To further confirm the function of LOC_Os08g05520 under drought conditions, we generated two homozygous mutant lines (designated as CR1 and CR2). Compared to the wild-type sequences, CR1 exhibited an 8 bp knockout at the target site, while CR2 featured an A base insertion (Figure 6a). Under control conditions, no discernible differences were observed in the growth of mutant and wild-type rice seedlings (Figure 6b). However, under drought treatment conditions, the mutant plants CR1 and CR2 demonstrated enhanced drought tolerance, as evidenced by an average LRS of 1.8 and 2.0, respectively, in contrast to an average LRS of 7.1 in the wild type (Figure 6c,d). This finding underscores the significant contribution of LOC_Os08g05520 knockout to the improvement of drought tolerance in rice.
The performances of the wild type, CR1, and CR2 in the three-leaf stage after 20 d of water deprivation are shown in Figure 7. Under normal conditions, no significant differences in plant height or LRS were observed among the wild type, CR1, and CR2, indicating that the mutants and wild type had a consistent phenotype. The average LRS of the wild type was 2.6 under normal conditions, whereas it was 6.6 after 20 d of water deprivation. Under normal conditions, the average plant height of the wild type was 37.4 cm, but it was 28.6 cm after 20 d of water deprivation. After water deprivation, the LRS of the wild type differed significantly from those of CR1 and CR2 (p < 0.001), as shown in Figure 8a. No difference in LRS was observed between CR1 and CR2, which had a mean LRS of 2.2 that was higher than the mean LRS under normal conditions. After 20 d of water deprivation, the difference in plant height between the wild type and CR1 was significant (p < 0.05), the difference between wild type and CR2 was highly significant (p < 0.01), and no significant difference was observed between CR1 and CR2 (Figure 8b). Thus, the growth of the wild type was strongly affected by water deprivation, which caused the LRS of the leaves to increase and the plant height to decrease. The mutants (CR1 and CR2) were less affected by water deprivation, and their LRS and plant heights were similar to those of the control group.

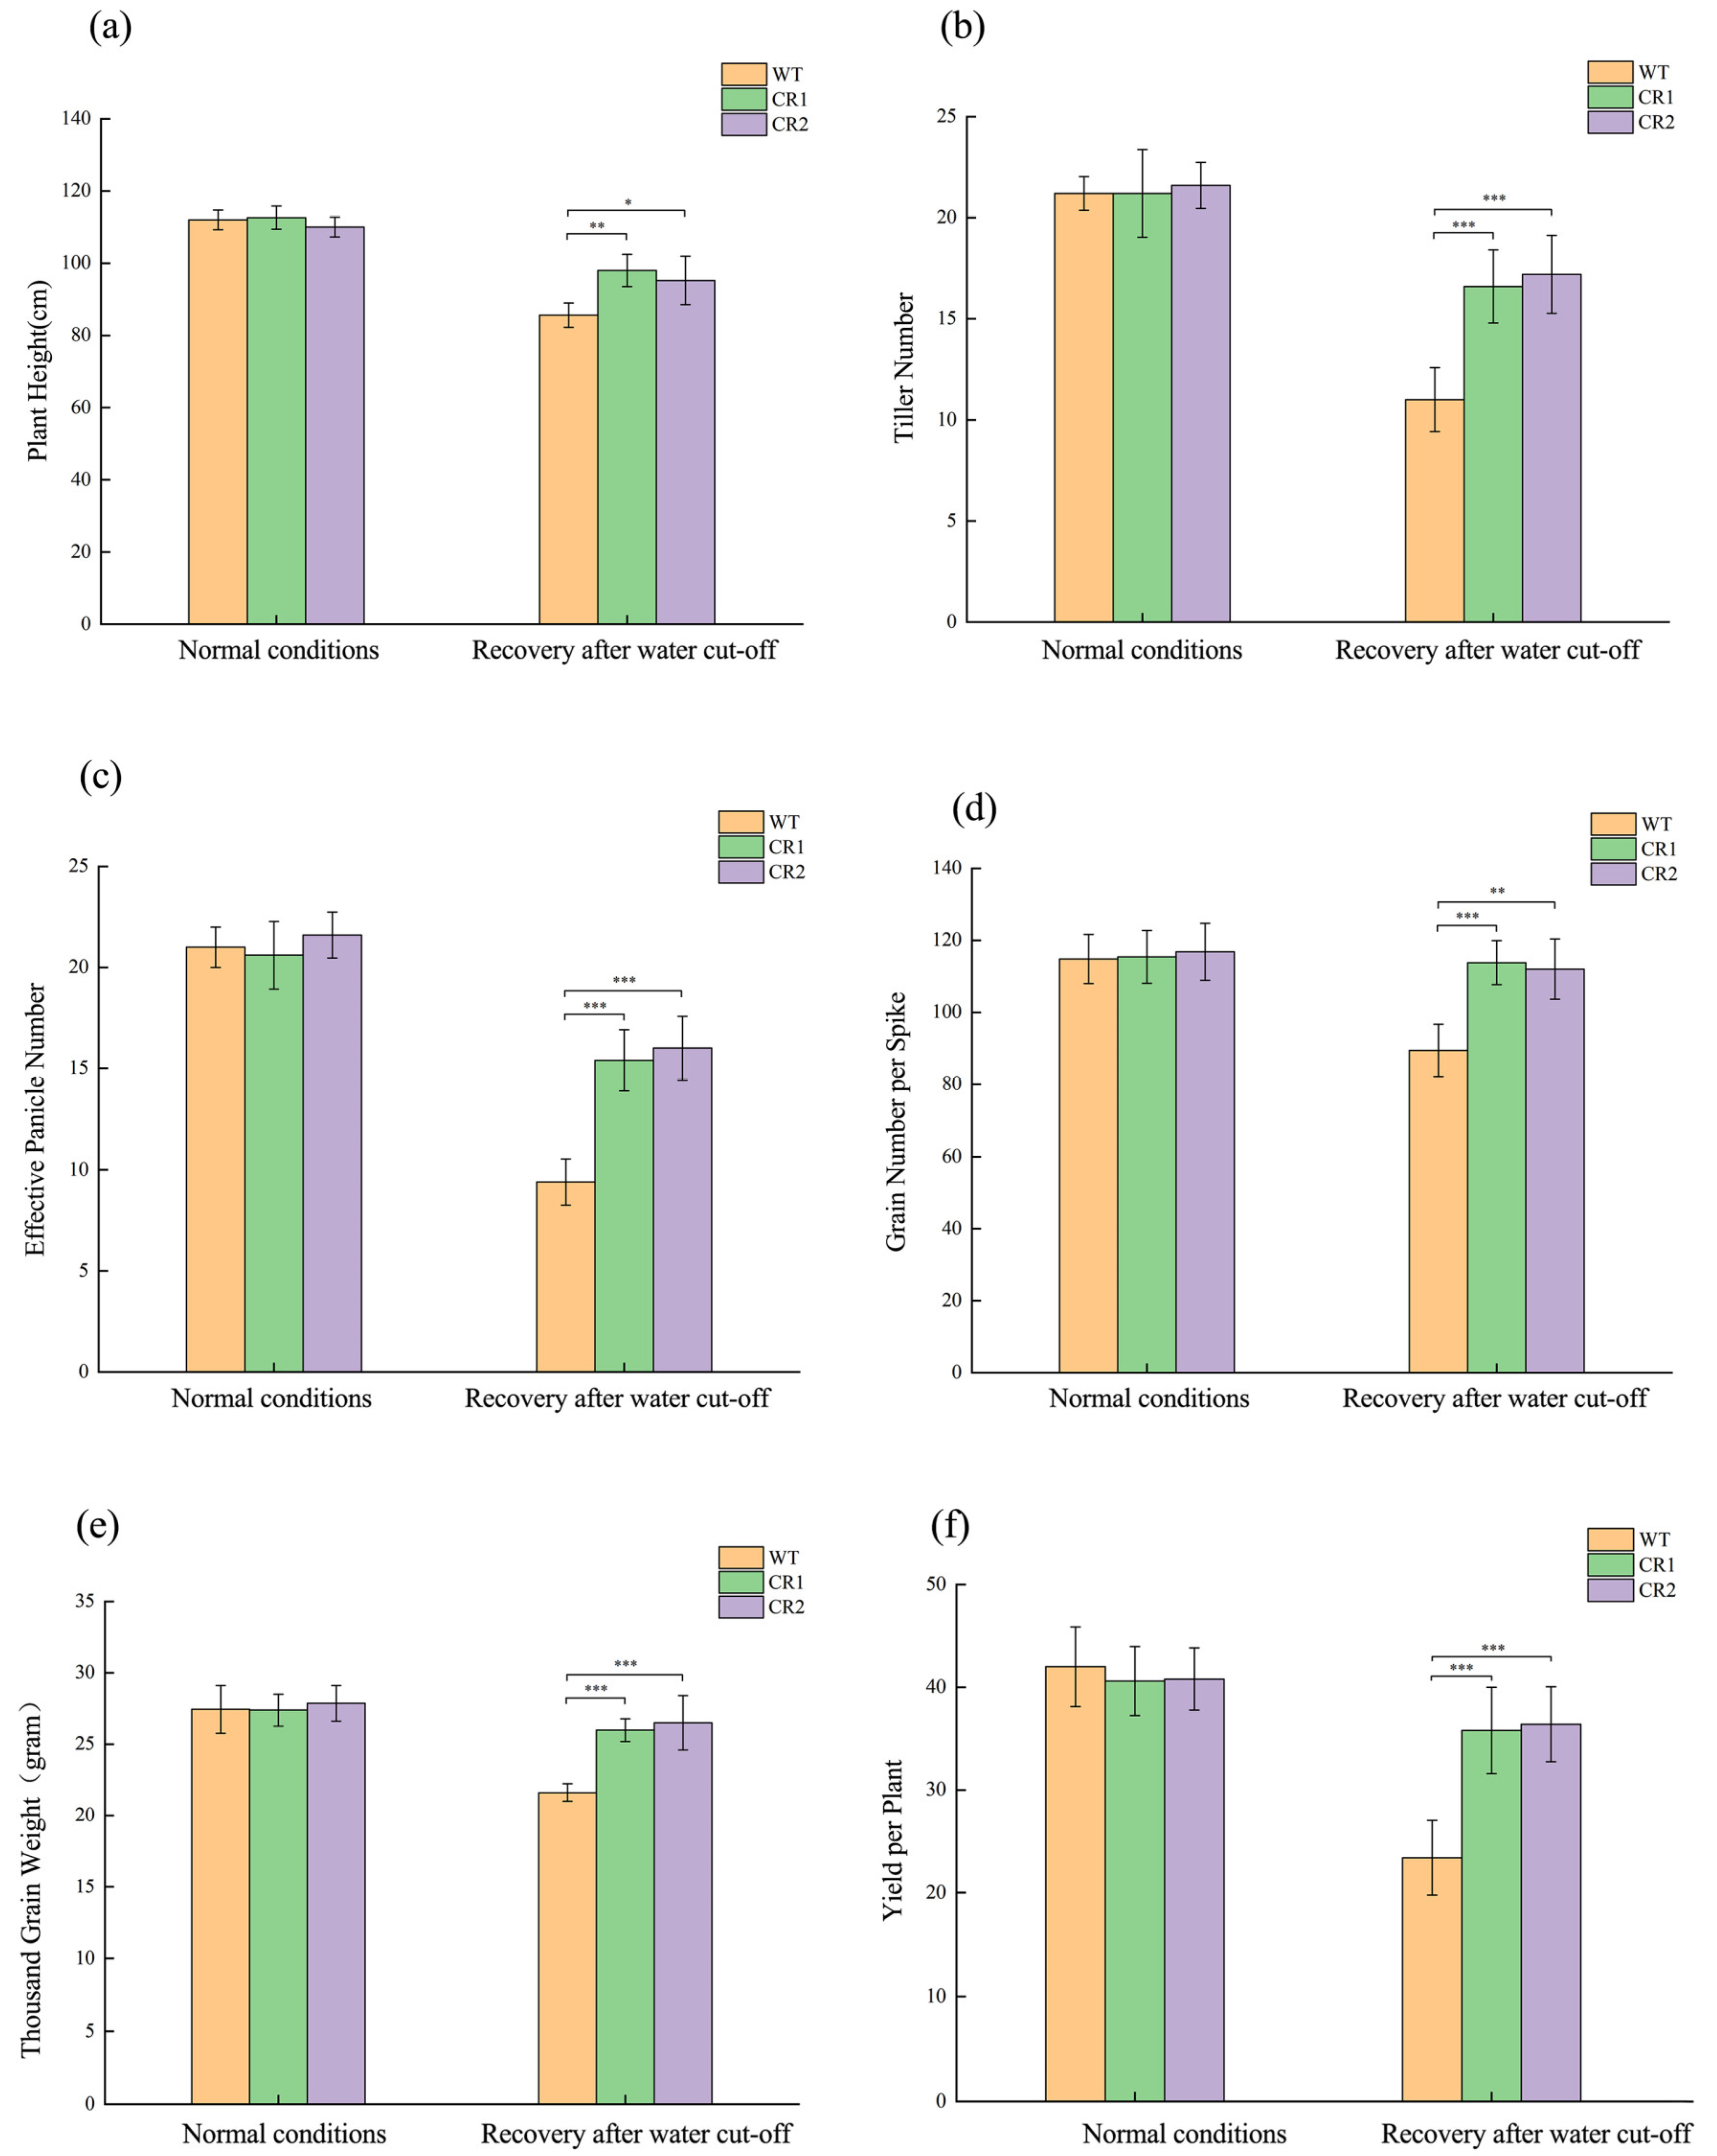
3.7. Comparison of Yield and Yield Components

To verify whether water deprivation and recovery had an effect on the final rice yields of the mutants, we continued to track the plant heights, yields, and yield-component traits of CR1, CR2, and the wild type after recovery and under normal conditions. Under normal conditions, no significant differences in plant height, tillering number, effective panicle number, grain number per spike, thousand-grain weight, or yield per plant were observed among the wild type, CR1, and CR2. According to the average phenotype and variation amplitude, mutants CR1 and CR2 exhibited high consistencies with the wild type. In the water deprivation recovery group, the differences between the wild type and CR1 and between the wild type and CR2 were significant or extremely significant (p < 0.05, p < 0.01, and p < 0.001), whereas the difference between CR1 and CR2 was not significant. Thus, the water deprivation treatment had larger effects on plant height, tillering number, effective panicle number, grain number per spike, thousand-grain weight, and yield per plant in the wild type, but had little effect on the growth and development of CR1 and CR2 (Figure 9a–f).

4. Discussion

The rice seedling stage is sensitive to drought stress, inhibiting vegetative growth and yield. Targeting highly drought-tolerant cultivars with drought-related genes is the most promising method for improving modern crop breeding [42]. This study selected LRS, which has been used for drought tolerance screening [43]. LRS values exhibited a continuous approximately normal distribution. It presents a typical genetic pattern of quantitative traits and is controlled by multiple genes. The identification of these QTLs is beneficial for drought tolerance in the marker-assisted breeding selection of rice.
Parent-based QTL mapping and GWAS are effective and accurate tools for the detection of QTLs for complex traits in crops [44]. The combination of the two methods can effectively improve the breadth and accuracy of QTL detection. The combination of linkage mapping and GWAS has achieved great success in gene mining for complex quantitative traits in rice. For example, a linkage mapping and GWAS joint strategy have been used to identify QTLs associated with grain shape and weight, which revealed the co-detection of the QTLs qGLE-12-1 and qGLE-12-2 (Chromosome 12), qGTE-3-1 (Chromosome 3), and qGWL-5-1 and qLWRL-5-1 (Chromosome 5), associated with grain length, width, and length-width ratio [45]. Similar research strategies have been applied to salinity tolerance at the seedling stage, resulting in the identification of a 195-kb region on chromosome 12 which was selected as the candidate interval based on the overlapping regions in the GWAS and the linkage mapping [46]. These studies demonstrate that the integration of linkage mapping and GWAS provides an excellent method for identifying QTL and molecular markers for rapid breeding deployment. In this study, a lead SNP C8_28933410 by GWAS was identified, which was located within qLRS-8-1 identified by linkage mapping on chromosome 8. Combing the LD block analyses and QTL interval, a 138.6 kb overlap interval was considered as the candidate region.
In this study, eight lead SNPs and two QTLs were identified for leaf rolling scale. In previous studies, some loci were located within the same interval or overlapped with known QTLs. For example, OsJAZ1, which negatively regulates drought resistance in the seedling and reproductive stages of rice by negatively regulating ABA and jasmonic acid signaling [41], was within the qLRS-4-1 identified by linkage mapping. qLRS-4-1 was also located in the same interval as qRL-4-1 [38], identified between RM5473 and RM348. Chr4_32975130 was also detected by GWAS in qRL-4-1 cells, further confirming this candidate region. Similarly, qLRS-8-1 was located at a smaller location interval than qRL-8-1 [39], between RM1235 and RM331. Another important finding was that the five lead SNPs on chromosome 8 were distributed in qRL-8-1. OsMYB103L [20] controlled leaf curling and mechanical strength in rice within qLRS-8-1 was identified by linkage mapping. In our study, GWAS identified two new drought-tolerant QTLs, Chr1_10152936 and Chr7_15152008.
Here, we found that LOC_Os08g05520 is a novel functional gene associated with drought tolerance in rice. LOC_Os08g05520 encodes an R2R3-MYB transcription factor, influencing leaf rolling and mechanical strength in rice, namely OsMYB103L. OsMYB103L interacts with SLR1 (slender rice 1), an inhibitory factor in GA signaling, and is involved in the GA-mediated regulation of the cellulose synthesis pathway. In addition, OsMYB103L directly binds to and regulates the expression of the CESA4, CESA7, CESA9, and BC1 promoters. GA mediates cellulose synthesis and secondary wall formation via the SLR1-MYB103L-CESAs pathway [47]. Researchers have found that the expression levels of several cellulose synthase genes (CESAs) significantly increased, similar to the cellulose content in OsMYB103L overexpressing lines. The knockdown of OsMYB103L by RNA interference leads to the opposite phenotype [20,47,48]. Therefore, we speculate that OsMYB103L may regulate the cellulose content and expression levels of several CESAs to affect drought tolerance in rice.

5. Conclusions

In conclusion, our study successfully identified LOC_Os08g05520 as a pivotal candidate gene associated with drought tolerance in japonica rice seedlings. The findings present a valuable resource for breeders aiming to improve their drought tolerance in rice varieties. Looking ahead, further research could develop into elucidating the specific mechanisms by which LOC_Os08g05520 confers drought tolerance, providing deeper insights into the molecular pathways involved. Additionally, exploring other candidate genes and pathways may offer a more comprehensive understanding of the complex genetic basis of drought tolerance in rice.

Supplementary Materials

The following supporting information can be downloaded at: https://www.mdpi.com/article/10.3390/agriculture14040603/s1, Figure S1: The genetic and linkage group of RIL population. Figure S2: Sequence comparison of LOC_Os08g05520 between parents. Table S1: Primers for qRT-PCR in this study. Table S2: Descriptive statistics for leaf rolling scale in the parents, 195 recombinant inbred lines (RILs), and 295 rice accessions. Table S3: Summary of functional annotation results for genes in the candidate region on chromosome 4. Table S4: Summary of functional annotation results for genes in the candidate region on chromosome 8.

Author Contributions

Conceptualization, J.C., S.X. and D.Z.; Data curation, S.L. and J.W.; Formal analysis, T.L., S.L., S.X. and H.L.; Funding acquisition, W.L. and H.Z.; Investigation, S.L., H.D. and S.X.; Methodology, T.L., H.D., S.X. and H.L.; Project administration, W.L. and H.Z.; Resources, J.W.; Software, T.L., H.D. and J.C.; Supervision, H.L., D.Z., W.L. and H.Z.; Validation, T.L., J.C. and D.Z.; Visualization, J.W., W.L., and H.Z.; Writing—original draft, T.L.; Writing—review and editing, T.L., S.L. and H.Z. All authors have read and agreed to the published version of the manuscript.

Funding

This research received no external funding.

Institutional Review Board Statement

Not applicable.

Data Availability Statement

Data are contained within the article.

Acknowledgments

We appreciate and thank the anonymous reviewers for their helpful comments that led to an overall improvement in the manuscript. We also thank the Journal Editor Board for their help and patience throughout the review process.

Conflicts of Interest

The authors declare no conflicts of interest.

References

  1. Bouman, B.A.M.; Peng, S.; Castañeda, A.R.; Visperas, R.M. Yield and water use of irrigated tropical aerobic rice systems. Agric. Water Manag. 2005, 74, 87–105. [Google Scholar] [CrossRef]
  2. Trijatmiko, K.R.; Supriyanta Prasetiyono, J.; Thomson, M.J.; Vera Cruz, C.M.; Moeljopawiro, S.; Pereira, A. Meta-analysis of quantitative trait loci for grain yield and component traits under reproductive stage drought stress in an upland rice population. Mol. Breed. 2014, 34, 283–295. [Google Scholar] [CrossRef] [PubMed]
  3. Courtois, B.; McLaren, G.; Sinha, P.K.; Prasad, K.; Yadav, R.; Shen, L. Mapping QTLs associated with drought avoidance in upland rice. Mol. Breed. 2000, 6, 55–66. [Google Scholar] [CrossRef]
  4. Price, A.H.; Townend, J.; Jones, M.P.; Audebert, A.; Courtois, B. Mapping QTLs associated with drought avoidance in upland rice grown in the Philippines and West Africa. Plant Mol. Biol. 2002, 48, 683–695. [Google Scholar] [CrossRef] [PubMed]
  5. Han, B.; Wang, J.; Li, Y.; Ma, X.; Jo, S.; Cui, D.; Wang, Y.; Park, D.; Song, Y.; Cao, G.; et al. Identification of quantitative trait loci associated with drought tolerance traits in rice (Oryza sativa L.) under PEG and field drought stress. Euphytica 2018, 214, 74. [Google Scholar] [CrossRef]
  6. Uga, Y.; Sugimoto, K.; Ogawa, S.; Rane, J.; Ishitani, M.; Hara, N.; Kitomi, Y.; Inukai, Y.; Ono, K.; Kanno, N.; et al. Control of root system architecture by DEEPER ROOTING 1 increases rice yield under drought conditions. Nat. Genet. 2013, 45, 1097–1102. [Google Scholar] [CrossRef] [PubMed]
  7. Shi, Z.; Wang, J.; Wan, X.; Shen, G.; Wang, X.; Zhang, J. Over expression of rice OsAGO7 gene induces upward curling of the leaf blade that enhanced erect leaf habit. Planta 2007, 226, 99–108. [Google Scholar] [CrossRef] [PubMed]
  8. Fujino, K.; Matsuda, Y.; Ozawa, K.; Nishimura, T.; Koshiba, T.; Fraaije, M.W.; Sekiguchi, H. NARROW LEAF 7 controls leaf shape mediated by auxin in rice. Mol. Genet. Genom. 2008, 279, 499–507. [Google Scholar] [CrossRef] [PubMed]
  9. Zhang, G.H.; Xu, Q.; Zhu, X.D.; Qian, Q.; Xue, H.W. SHALLOT-LIKE1 is a KANADI transcription factor that modulates rice leaf rolling by regulating leaf abaxial cell development. Plant Cell 2009, 21, 719–735. [Google Scholar] [CrossRef]
  10. Hibara, K.; Obara, M.; Hayashida, E.; Abe, M.; Ishimaru, T.; Satoh, H.; Itoh, J.-I.; Nagato, Y. The ADAXIALIZED LEAF1 gene functions in leaf and embryonic pattern formation in rice. Dev. Biol. 2009, 334, 345–354. [Google Scholar] [CrossRef]
  11. Zhao, S.Q.; Hu, J.; Guo, L.B.; Qian, Q.; Xue, H.W. Rice leaf inclination2, a VIN3-like protein, regulates leaf angle through modulating cell division of the collar. Cell Res. 2010, 20, 935–947. [Google Scholar] [CrossRef] [PubMed]
  12. Wu, C.; Fu, Y.; Hu, G.; Si, H.; Cheng, S.; Liu, W. Isolation and characterization of a rice mutant with narrow and rolled leaves. Planta 2010, 232, 313–324. [Google Scholar] [CrossRef] [PubMed]
  13. Hu, J.; Zhu, L.; Zeng, D.; Gao, Z.; Guo, L.; Fang, Y.; Zhang, G.; Dong, G.; Yan, M.; Liu, J.; et al. Identification and characterization of NARROW AND ROLLED LEAF 1, a novel gene regulating leaf morphology and plant architecture in rice. Plant Mol. Biol. 2010, 73, 283–292. [Google Scholar] [CrossRef] [PubMed]
  14. Li, L.; Shi, Z.Y.; Li, L.; Shen, G.Z.; Wang, X.Q.; An, L.S.; Zhang, J.L. Overexpression of ACL1 (abaxially curled leaf 1) increased bulliform cells and induced abaxial curling of leaf blades in rice. Mol. Plant 2010, 3, 807–817. [Google Scholar] [CrossRef] [PubMed]
  15. Zou, L.P.; Sun, X.H.; Zhang, Z.G.; Liu, P.; Wu, J.X.; Tian, C.J.; Qiu, J.L.; Lu, T.G. Leaf rolling controlled by the homeodomain leucine zipper Class IV gene Roc5 in rice. Plant Physiol. 2011, 156, 1589–1602. [Google Scholar] [CrossRef] [PubMed]
  16. Wu, R.; Li, S.; He, S.; Wassmann, F.; Yu, C.; Qin, G.; Schreiber, L.; Qu, L.J.; Gu, H. CFL1, a WW domain protein, regulates cuticle development by modulating the function of HDG1, a Class IV homeodomain transcription factor, in rice and Arabidopsis. Plant Cell 2011, 23, 3392–3411. [Google Scholar] [CrossRef] [PubMed]
  17. Fang, L.; Zhao, F.; Cong, Y.; Sang, X.; Du, Q.; Wang, D.; Li, Y.; Ling, Y.; Yang, Z.; He, G. Rolling-leaf14 is a 2OG-Fe (II) oxygenase family protein that modulates rice leaf rolling by affecting secondary cell wall formation in leaves. Plant Biotechnol. J. 2012, 10, 524–532. [Google Scholar] [CrossRef] [PubMed]
  18. Xiang, J.J.; Zhang, G.H.; Qian, Q.; Xue, H.W. SEMI-ROLLED LEAF1 encodes a putative glycosylphosphatidylinositol-anchored protein and modulates rice leaf rolling by regulating the formation of bulliform cells. Plant Physiol. 2012, 159, 1488–1500. [Google Scholar] [CrossRef]
  19. Xu, Y.; Wang, Y.; Long, Q.; Huang, J.; Wang, Y.; Zhou, K.; Zheng, M.; Sun, J.; Chen, H.; Chen, S.; et al. Overexpression of OsZHD1, a zinc finger homeodomain class homeobox transcription factor, induces abaxially curled and drooping leaf in rice. Planta 2014, 239, 803–816. [Google Scholar] [CrossRef] [PubMed]
  20. Yang, C.; Li, D.; Liu, X.; Ji, C.; Hao, L.; Zhao, X.; Li, X.; Chen, C.; Cheng, Z.; Zhu, L. OsMYB103L, an R2R3-MYB transcription factor, influences leaf rolling and mechanical strength in rice (Oryza sativa L.). BMC Plant Biol. 2014, 14, 158. [Google Scholar] [CrossRef] [PubMed]
  21. Zhang, J.J.; Wu, S.Y.; Jiang, L.; Wang, J.L.; Zhang, X.; Guo, X.P.; Wu, C.Y.; Wan, J.M. A detailed analysis of the leaf rolling mutant sll2 reveals complex nature in regulation of bulliform cell development in rice (Oryza sativa L.). Plant Biol. 2015, 17, 437–448. [Google Scholar] [CrossRef] [PubMed]
  22. Chen, Q.; Xie, Q.; Gao, J.; Wang, W.; Sun, B.; Liu, B.; Zhu, H.; Peng, H.; Zhao, H.; Liu, C.; et al. Characterization of Rolled and Erect Leaf 1 in regulating leave morphology in rice. J. Exp. Bot. 2015, 66, 6047–6058. [Google Scholar] [CrossRef] [PubMed]
  23. Liu, X.; Li, M.; Liu, K.; Tang, D.; Sun, M.; Li, Y.; Shen, Y.; Du, G.; Cheng, Z. Semi-Rolled Leaf2 modulates rice leaf rolling by regulating abaxial side cell differentiation. J. Exp. Bot. 2016, 67, 2139–2150. [Google Scholar] [CrossRef] [PubMed]
  24. Li, X.; Zhou, Z.; Ding, J.; Wu, Y.; Zhou, B.; Wang, R.; Ma, J.; Wang, S.; Zhang, X.; Xia, Z.; et al. Combined linkage and association mapping reveals QTL and candidate genes for plant and ear height in maize. Front. Plant Sci. 2016, 7, 833. [Google Scholar] [CrossRef] [PubMed]
  25. Wu, X.; Li, Y.; Shi, Y.; Song, Y.; Zhang, D.; Li, C.; Buckler, E.S.; Li, Y.; Zhang, Z.; Wang, T. Joint-linkage mapping and GWAS reveal extensive genetic loci that regulate male inflorescence size in maize. Plant Biotechnol. J. 2016, 14, 1551–1562. [Google Scholar] [CrossRef] [PubMed]
  26. Cui, Z.; Xia, A.; Zhang, A.; Luo, J.; Yang, X.; Zhang, L.; Ruan, Y.; He, Y. Linkage mapping combined with association analysis reveals QTL and candidate genes for three husk traits in maize. Theor. Appl. Genet. 2018, 131, 2131–2144. [Google Scholar] [CrossRef] [PubMed]
  27. Ju, M.; Zhou, Z.; Mu, C.; Zhang, X.; Gao, J.; Liang, Y.; Chen, J.; Wu, Y.; Li, X.; Wang, S.; et al. Dissecting the genetic architecture of Fusarium verticillioides seed rot resistance in maize by combining QTL mapping and genome-wide association analysis. Sci. Rep. 2017, 7, 46446. [Google Scholar] [CrossRef] [PubMed]
  28. Gao, J.; Wang, S.; Zhou, Z.; Wang, S.; Dong, C.; Mu, C.; Song, Y.; Ma, P.; Li, C.; Wang, Z.; et al. Linkage mapping and genome-wide association reveal candidate genes conferring thermotolerance of seed-set in maize. J. Exp. Bot. 2019, 70, 4849–4864. [Google Scholar] [CrossRef] [PubMed]
  29. Shi, J.; Wang, Y.; Wang, C.; Wang, L.; Zeng, W.; Han, G.; Qiu, C.; Wang, T.; Tao, Z.; Wang, K.; et al. Linkage mapping combined with GWAS revealed the genetic structural relationship and candidate genes of maize flowering time-related traits. BMC Plant Biol. 2022, 22, 328. [Google Scholar] [CrossRef]
  30. Liu, K.; Sun, X.; Ning, T.; Duan, X.; Wang, Q.; Liu, T.; An, Y.; Guan, X.; Tian, J.; Chen, J. Genetic dissection of wheat panicle traits using linkage analysis and a genome-wide association study. Theor. Appl. Genet. 2018, 131, 1073–1090. [Google Scholar] [CrossRef] [PubMed]
  31. Li, X.; Zheng, H.; Wu, W.; Liu, H.; Wang, J.; Jia, Y.; Li, J.; Yang, L.; Lei, L.; Zou, D.; et al. QTL mapping and candidate gene analysis for alkali tolerance in japonica rice at the bud stage based on linkage mapping and genome-wide association study. Rice 2020, 13, 48. [Google Scholar] [CrossRef]
  32. Li, N.; Zheng, H.; Cui, J.; Wang, J.; Liu, H.; Sun, J.; Liu, T.; Zhao, H.; Lai, Y.; Zou, D. Genome-wide association study and candidate gene analysis of alkalinity tolerance in japonica rice germplasm at the seedling stage. Rice 2019, 12, 24. [Google Scholar] [CrossRef] [PubMed]
  33. Shiratsuchi, H.; Ohdaira, Y.; Yamaguchi, H.; Fukuda, A. Breaking the dormancy of rice seeds with various dormancy levels using steam and high temperature treatments in a steam nursery cabinet. Plant Prod. Sci. 2017, 20, 183–192. [Google Scholar] [CrossRef]
  34. International Rice Research Institute. Standard Evaluation System for Rice; IRRI: Manila, Philippines, 1996. [Google Scholar]
  35. Bradbury, P.J.; Zhang, Z.; Kroon, D.E.; Casstevens, T.M.; Ramdoss, Y.; Buckler, E.S. TASSEL: Software for association mapping of complex traits in diverse samples. Bioinformatics 2007, 23, 2633–2635. [Google Scholar] [CrossRef] [PubMed]
  36. Dong, S.S.; He, W.M.; Ji, J.J.; Zhang, C.; Guo, Y.; Yang, T.L. LDBlockShow: A fast and convenient tool for visualizing linkage disequilibrium and haplotype blocks based on variant call format files. Brief Bioinform. 2021, 22, bbaa227. [Google Scholar] [CrossRef] [PubMed]
  37. Livak, K.J.; Schmittgen, T.D. Analysis of relative gene expression data using real-time quantitative PCR and the 2−ΔΔCT method. Methods 2001, 25, 402–408. [Google Scholar] [CrossRef] [PubMed]
  38. Gao, Y.; Lu, C.; Wang, M.; Wang, P.; Yan, X.; Xie, K.; Wan, J. QTL mapping for rolled leaf gene in rice. Jiangsu J. Agric. Sci. 2007, 23, 5–10. [Google Scholar]
  39. Yuan, G.; Cheng, B.; Hong, D. Construction of SSR linkage map and analysis of QTLs for rolled leaf in japonica rice. Rice Sci. 2010, 17, 8–34. [Google Scholar]
  40. Zhang, Q.; Zheng, T.; Hoang, L.; Wang, C.; Nafisah; Joseph, C.; Zhang, W.; Xu, J.; Li, Z. Joint mapping and allele mining of the rolled leaf trait in rice (Oryza sativa L.). PLoS ONE 2016, 11, e0158246. [Google Scholar] [CrossRef]
  41. Fu, J.; Wu, H.; Ma, S.; Xiang, D.; Liu, R.; Xiong, L. OsJAZ1 attenuates drought resistance by regulating JA and ABA signaling in rice. Front. Plant Sci. 2017, 8, 2108. [Google Scholar] [CrossRef]
  42. Oladosu, Y.; Rafii, M.Y.; Samuel, C.; Fatai, A.; Magaji, U.; Kareem, I.; Kamarudin, Z.S.; Muhammad, I.; Kolapo, K.K. Drought resistance in rice from conventional to molecular breeding: A review. Int. J. Mol. Sci. 2019, 20, 3519. [Google Scholar] [CrossRef] [PubMed]
  43. Swapna, S.; Shylaraj, K.S. Screening for osmotic stress responses in rice varieties under drought condition. Rice Sci. 2017, 24, 253–263. [Google Scholar] [CrossRef]
  44. Raj, S.R.G.; Nadarajah, K. QTL and Candidate Genes: Techniques and Advancement in Abiotic Stress Resistance Breeding of Major Cereals. Int. J. Mol. Sci. 2023, 24, 6. [Google Scholar] [CrossRef] [PubMed]
  45. Kang, J.-W.; Kabange, N.R.; Phyo, Z.; Park, S.-Y.; Lee, S.-M.; Lee, J.-Y.; Shin, D.; Cho, J.H.; Park, D.-S.; Ko, J.-M.; et al. Combined Linkage Mapping and Genome-Wide Association Study Identified QTLs Associated with Grain Shape and Weight in Rice (Oryza sativa L.). Agronomy 2020, 10, 1532. [Google Scholar] [CrossRef]
  46. Xu, S.; Cui, J.; Cao, H.; Liang, S.; Ma, T.; Liu, H.; Wang, J.; Yang, L.; Xin, W.; Jia, Y.; et al. Identification of candidate genes for salinity tolerance in Japonica rice at the seedling stage based on genome-wide association study and linkage mapping. Front. Plant Sci. 2023, 14, 1184416. [Google Scholar] [CrossRef] [PubMed]
  47. Ye, Y.; Liu, B.; Zhao, M.; Wu, K.; Cheng, W.; Chen, X.; Liu, Q.; Liu, Z.; Fu, X.; Wu, Y. CEF1/OsMYB103L is involved in GA-mediated regulation of secondary wall biosynthesis in rice. Plant Mol. Biol. 2015, 89, 385–401. [Google Scholar] [CrossRef] [PubMed]
  48. Hirano, K.; Kondo, M.; Aya, K.; Miyao, A.; Sato, Y.; Antonio, B.A.; Namiki, N.; Nagamura, Y.; Matsuoka, M. Identification of transcription factors involved in rice secondary cell wall formation. Plant Cell Physiol. 2013, 54, 1791–1802. [Google Scholar] [CrossRef] [PubMed]
Figure 1. LRS variation of 295 accessions, RILs, parental performance under normal and drought conditions. (a) LRS distribution in natural populations. (b) LRS distribution in RILs. (c) performance of two parents under normal condition for 10 days at the two leaves and one core stage. (d) performance of two parents under 20% PEG-6000 stress for 10 days at the two leaves and one core stage.
Agriculture 14 00603 g001
Figure 2. Manhattan plots and quantile-quantile (Q-Q) plots of GWAS for the leaf rolling scale. (a) Manhattan plots for leaf rolling scale. (b) Quantile-quantile (Q-Q) plots for leaf rolling scale.
Agriculture 14 00603 g002
Figure 3. Co-localisation results for the LRS interval obtained through linkage mapping and GWAS. (a) Drought tolerance QTLs were mapped to the interval between markers C4_32680431 and C4_33516075 using linkage mapping. LDBlockShow narrowed down the candidate region to 372.5 kb. (b) Drought tolerance QTLs were mapped to the interval between markers C8_2397444 and C8_3005090 using linkage mapping. LDBlockShow further narrowed the candidate region to 149.8 kb. By intercepting the co-localisation interval, the candidate region was further narrowed to 138.6 kb between markers C8_2866488 and C8_3005090.
Agriculture 14 00603 g003
Figure 4. Structure and haplotype analysis of four candidate genes. (ad) represent the gene structure and the variety number of haplotype combinations of LOC_Os04g55150, LOC_Os04g55190, LOC_Os08g05520, and LOC_Os08g05610. (eh) represent the haplotype analysis of LOC_Os04g55150, LOC_Os04g55190, LOC_Os08g05520, and LOC_Os08g05610. * p < 0.05, based on ANOVA.
Agriculture 14 00603 g004
Figure 5. Expression differences of the four candidate genes under normal conditions and 20% PEG stress after 24 h cultivation. (a) LOC_Os04g55150 expressed under normal conditions and 20% PEG-6000 stress. (b) LOC_Os04g55190 expressed under normal conditions and 20% PEG-6000 stress. (c) LOC_Os08g05520 expressed under normal conditions and 20% PEG-6000 stress. (d) LOC_Os08g05610 expressed under normal conditions and 20% PEG-6000 stress. ** p < 0.01, *** p < 0.001, Students’ t test.
Agriculture 14 00603 g005
Figure 6. Sequence comparison of wild type and mutants, and phenotypic differences between 20% PEG-6000 and normal conditions. (a) DNA sequence comparison between ZH11, CR1, and CR2. (b) ZH11 wild, CR1, and CR2 planted in two rows in one pool under control conditions for 10 days. (c) ZH11 wild, CR1, and CR2 planted in two rows in one pool under 20% PEG-6000 treatment for 10 days. (d) Significant differences in LRS of wild type, CR1, and CR2 (** p < 0.01, Students’ t test).
Agriculture 14 00603 g006
Figure 7. LRS difference between wild type, CR1, and CR2 after 20 days of water cut-off at the three-leaf stage and under normal conditions.
Agriculture 14 00603 g007
Figure 8. Comparison of plant height, LRS of wild type and mutants under 20 days’ water cut-off, and normal conditions at three-leaf stage. (a) LRS. (b) Plant height. *, **, and *** represent the significance of ANOVA at p < 0.05, p < 0.01, and p < 0.001, respectively.
Agriculture 14 00603 g008
Figure 9. Comparison of plant height, yield, and yield component traits of wild type and mutants under 20 d water cut-off recovery and normal conditions at the maturity stage. (a) Plant height. (b) Tiller number. (c) Effective panicle number. (d) Grain number per spike. (e) Thousand grain weight. (f) Yield per plant. *, **, and *** represent the significance of ANOVA at p < 0.05, p < 0.01, and p < 0.001, respectively.
Agriculture 14 00603 g009
Table 1. Lead SNPs for LRS identified by GWAS.
TraitLead SNPChr.Positionp ValueR2 (%)QTL in Previous Study
LRSChr1_101529361101529367.86 × 10−712.2
Chr4_329751304329751303.42 × 10−610.86qRL-4-1 [38]
Chr7_151520087151520082.11 × 10−610.11qRL-7 [39],
qRI7a [40]
Chr8_1427905814279055.22 × 10−714.16qRL-8-1 [39]
Chr8_1941918819419181.95 × 10−611.37
Chr8_2154790821547901.66 × 10−612.8
Chr8_2933410829334101.84 × 10−611.42
Chr8_113240468113240462.45 × 10−611.16
R2 (%): Phenotypic variance explained.
Table 2. QTLs for leaf rolling identified by linkage mapping.
QTLsLeft MarkerRight MarkerChr.LODR2 (%)Additive EffectKnown QTLsKnown Genes
qLRS-4-1C4_32680431C4_3351607545.3214.69−0.78qRL-4-1 [38]OsJAZ1 [41]
qLRS-8-1C8_2397444C8_300509083.949.94−0.64qRL-8-1 [39]OsMYB103L [20]
R2 (%): Phenotypic variance explained.
Disclaimer/Publisher’s Note: The statements, opinions and data contained in all publications are solely those of the individual author(s) and contributor(s) and not of MDPI and/or the editor(s). MDPI and/or the editor(s) disclaim responsibility for any injury to people or property resulting from any ideas, methods, instructions or products referred to in the content.

