Abstract
Soil nutrients are essential for plant growth, and it is crucial to accurately detect their levels. However, current methods for detecting soil nutrients still have low accuracy and high costs. In this study, we propose a multi-source fusion feature approach that combines multispectral image technology with electronic nose gas response technology to achieve rapid, high-precision, and cost-effective detection of soil nutrients, including soil organic matter (SOM), total nitrogen (TN), available potassium (AK), and available phosphorus (AP). To begin, a multispectral camera was used to collect spectral images and extract seven index features. Additionally, an electronic nose was used to collect soil pyrolysis gases to obtain the response curve and extract seven response features. These two sets of features were effectively fused to form a 106 × 98 fusion feature space. Secondly, principal component analysis (PCA) and Pearson correlation coefficient (PCC) algorithms were used to optimize and reduce the dimensionality of the fused feature space. Finally, a predictive model of the relationship between the feature space and the nutrient content of the soil samples was established using the random forest (RF) and partial least squares regression (PLSR) algorithms. The predictive performance of the model was used to evaluate the accuracy of soil nutrient detection. The results showed that the PLSR modeling of the optimized feature space of PCA achieved high accuracy in predicting the levels of main soil nutrients, with R2 values for SOM, TN, AK, and AP of 0.96, 0.95, 0.84, and 0.73, and the RMSE values of 0.56, 0.07, 3.21, and 3.70, respectively. Compared to using only electronic nose gas response technology, the soil nutrient detection with multi-source data features method in this study not only improved the accuracy for SOM and TN but also for metal elements AK and AP in soil. The spectral index features proposed in this study were able to compensate for the limitations of the electronic nose response features, and modeling with the fusion feature space resulted in an accurate prediction of SOM, TN, AK, and AP levels.
1. Introduction
The primary components of soil nutrients, including SOM, TN, AK, and AP, are significant indicators of soil fertility and quality. Therefore, it is imperative to conduct quick and accurate content detection for these essential indicators. The traditional methods for detecting SOM, TN, AK, and AP content mainly involve chemical assays, such as the potassium dichromate volumetric method [1,2], the Kjeldahl nitrogen determination method [3,4], sodium bicarbonate extraction-molybdenum antimony spectrophotometry [5,6], and the ammonium acetate flame photometer method [7]. However, these methods have drawbacks, including long detection times, susceptibility to contamination, and complex operations.
In recent years, satellite remote sensing technology has become widely used for soil nutrient detection. This method involves acquiring multispectral images through satellite remote sensing, calculating various spectral indices based on the spectral bands, and indirectly characterizing soil nutrient information. Researchers such as He [8], Sorenson [9], Gholizadeh [10], and others have utilized Sentinel-2 remote sensing images to predict soil nutrient content by extracting remote sensing spectral indices, integrating phenological parameters, and using bare soil composite images. Machine learning was used to construct a prediction model to predict nutrient content in surface soil. While studies have shown the feasibility of remote sensing methods for predicting soil nutrient content, there are some disadvantages to this approach. These include the complicated pre-processing of remote sensing images, low detection accuracy due to the low spatial resolution, and the inability to detect soil nutrient content in a timely manner due to satellite revisiting. Additionally, it is important to note that remote sensing methods can only gather information about the surface of the soil. However, relying solely on surface information is not reliable for accurately predicting soil nutrients. In most cases, it is necessary to collect soil samples at different depths (10 cm, 20 cm, 30–60 cm, 80 cm, etc.) to accurately predict soil nutrient content. By analyzing the spatial information of soil nutrients, it is possible to accurately predict the content of soil nutrients, which cannot be achieved through remote sensing methods.
Spectrometers are commonly used for detecting soil nutrients due to their fast, non-destructive, and reliable properties [11,12,13,14]. Many researchers have utilized spectrometers to conduct spectral testing on deep mixed soils in dark-room environments. By analyzing the peak variations in the spectral absorption curve to characterize soil nutrient content. Studies have shown that different soil nutrients exhibit strong responses within specific spectral bands [15,16]. However, the use of spectrometers is limited by their high cost and the requirement for fixed darkroom environments, making it difficult to rapidly detect soil nutrient content on a large scale. It has been mentioned that multispectral cameras, with their compact size and cheaper cost, can be a cost-effective alternative to spectrometers [17]. When a multispectral camera captures images of soil, sunlight acts as the light source, illuminating the soil sample. The camera then captures the reflected light [18], which has been absorbed by soil nutrients selectively within specific spectral bands, resulting in single-band spectral images [19]. When experimental conditions and environments are consistent, a higher soil nutrient content will lead to a brighter spectral image, indicating a stronger response in that particular band. Therefore, a more cost-effective multispectral camera can be utilized as a replacement for a spectrometer, significantly reducing the detection cost of soil nutrient content.
Electronic nose technology has been extensively utilized in gas detection [20], whereas its application in soil nutrient content detection has only been proposed in recent years [21,22,23,24]. This technology predicts soil nutrient content by leveraging odor information, aiming to address the limitations of spectrometry and remote sensing spectroscopy, which struggle to simultaneously achieve cost-effectiveness and prediction accuracy. By designing a gas sensor array to obtain information on soil cracking gas combined with machine learning to predict soil nutrient content, this method demonstrates rapid detection performance. However, the gas volatility of salt nutrients such as phosphorus and potassium is limited under high-temperature cracking, resulting in a relatively homogeneous odor. As a result, the detection accuracy for AP and AK content using an electronic nose is not optimal.
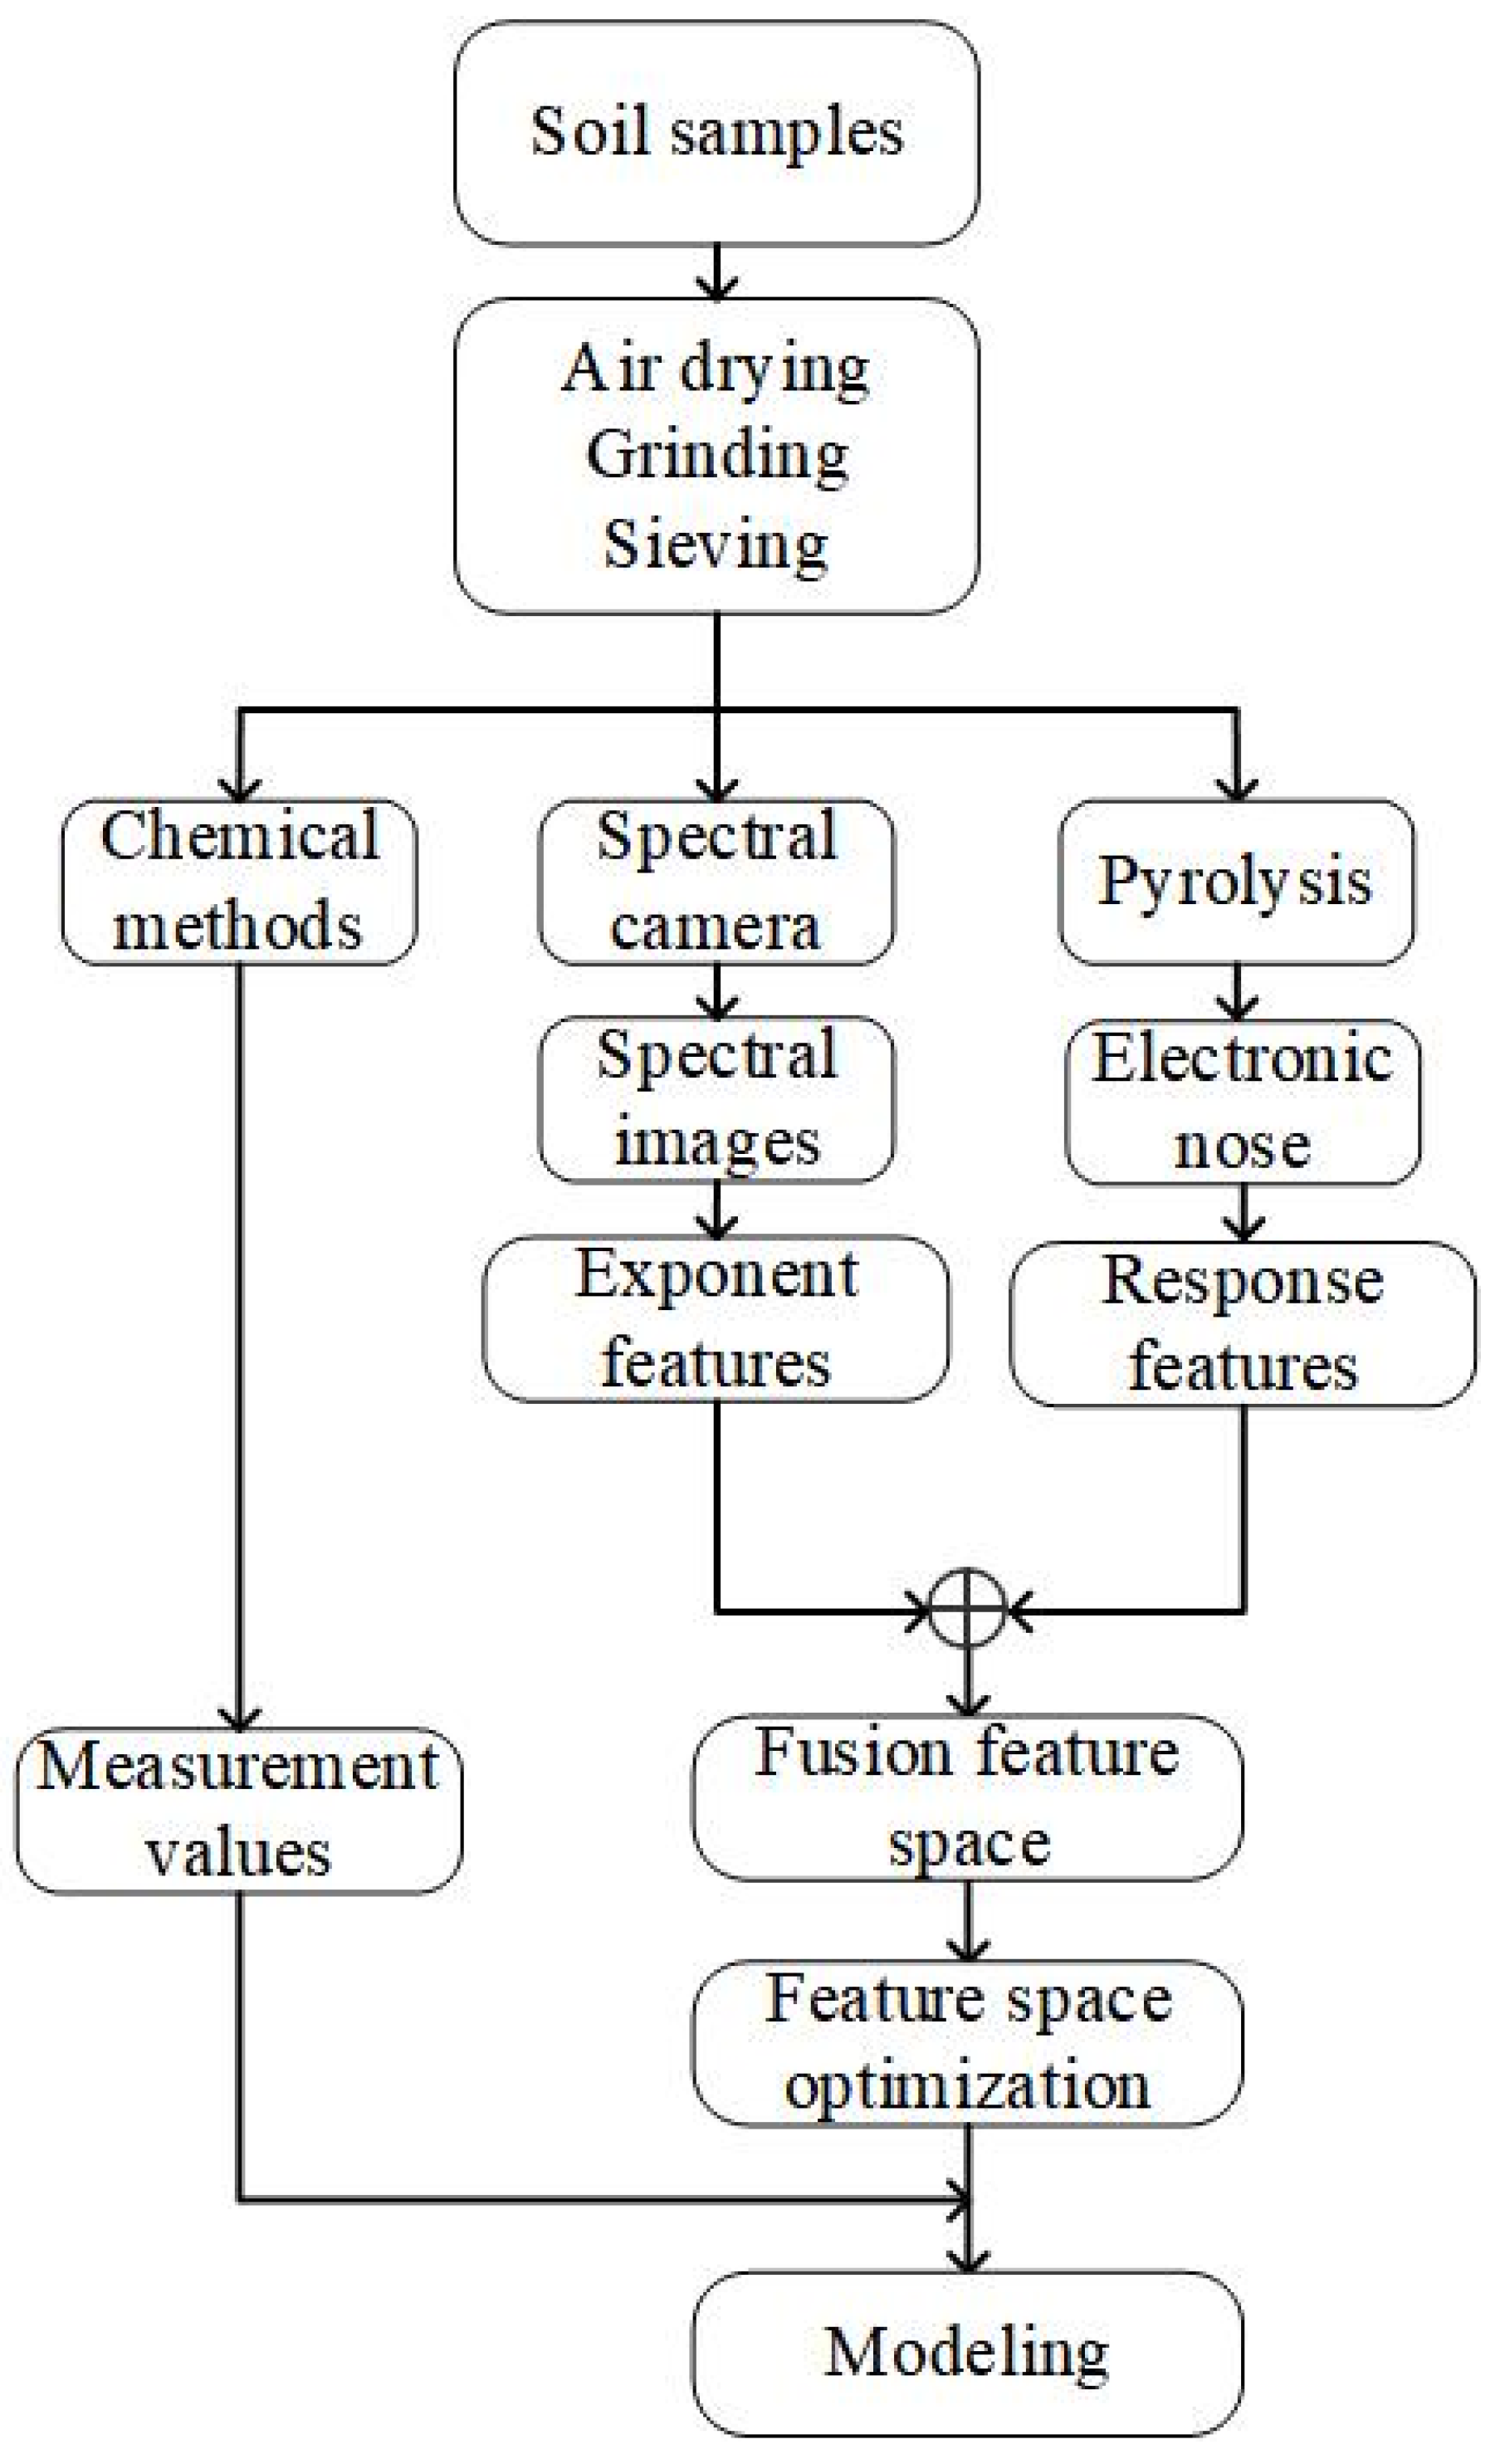
To compensate for the weaknesses of the electronic nose method for detecting main soil nutrient contents, this study proposes a method that utilizes spectral features extracted from soil spectral images to enhance the electronic nose method. This approach aims to provide a rapid, low-cost, and high-precision prediction of SOM, TN, AK, and AP contents. The process of soil nutrient detection in this study is illustrated in Figure 1. Air-dried soil samples were crushed and sieved, then divided into three portions. The first portion was utilized to measure the values of SOM, TN, AK, and AP using chemical detection methods. The second portion was employed to capture spectral images with a spectral camera and extract index features from them. The third portion was subjected to gas thermal cracking in an electronic nose to obtain response features. These response features were then fused and optimized with the index features. Subsequently, the fused and optimized features were used to establish a relationship model between the feature space and the measured values, enabling accurate predictions of soil nutrient content.
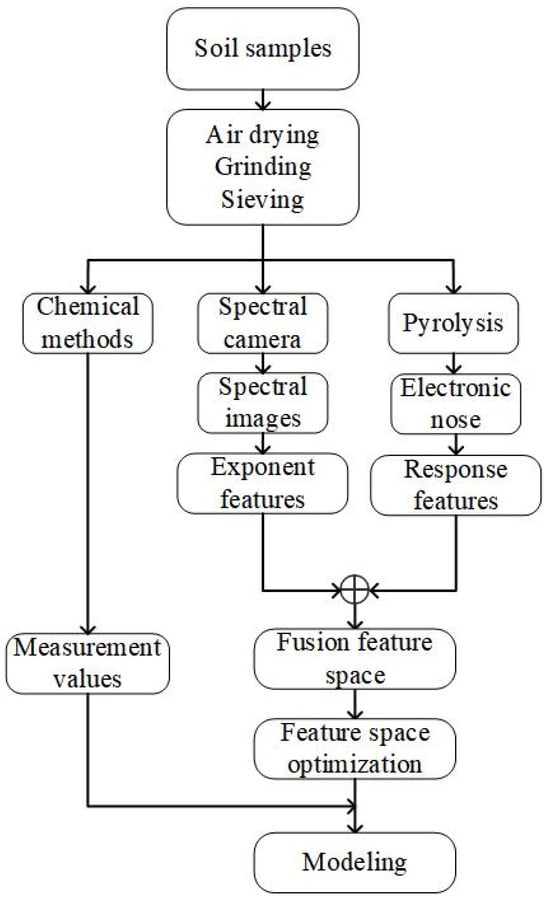
Figure 1.
Flow of soil nutrient content prediction study.
2. Materials and Methods
2.1. Soil Sample Collection
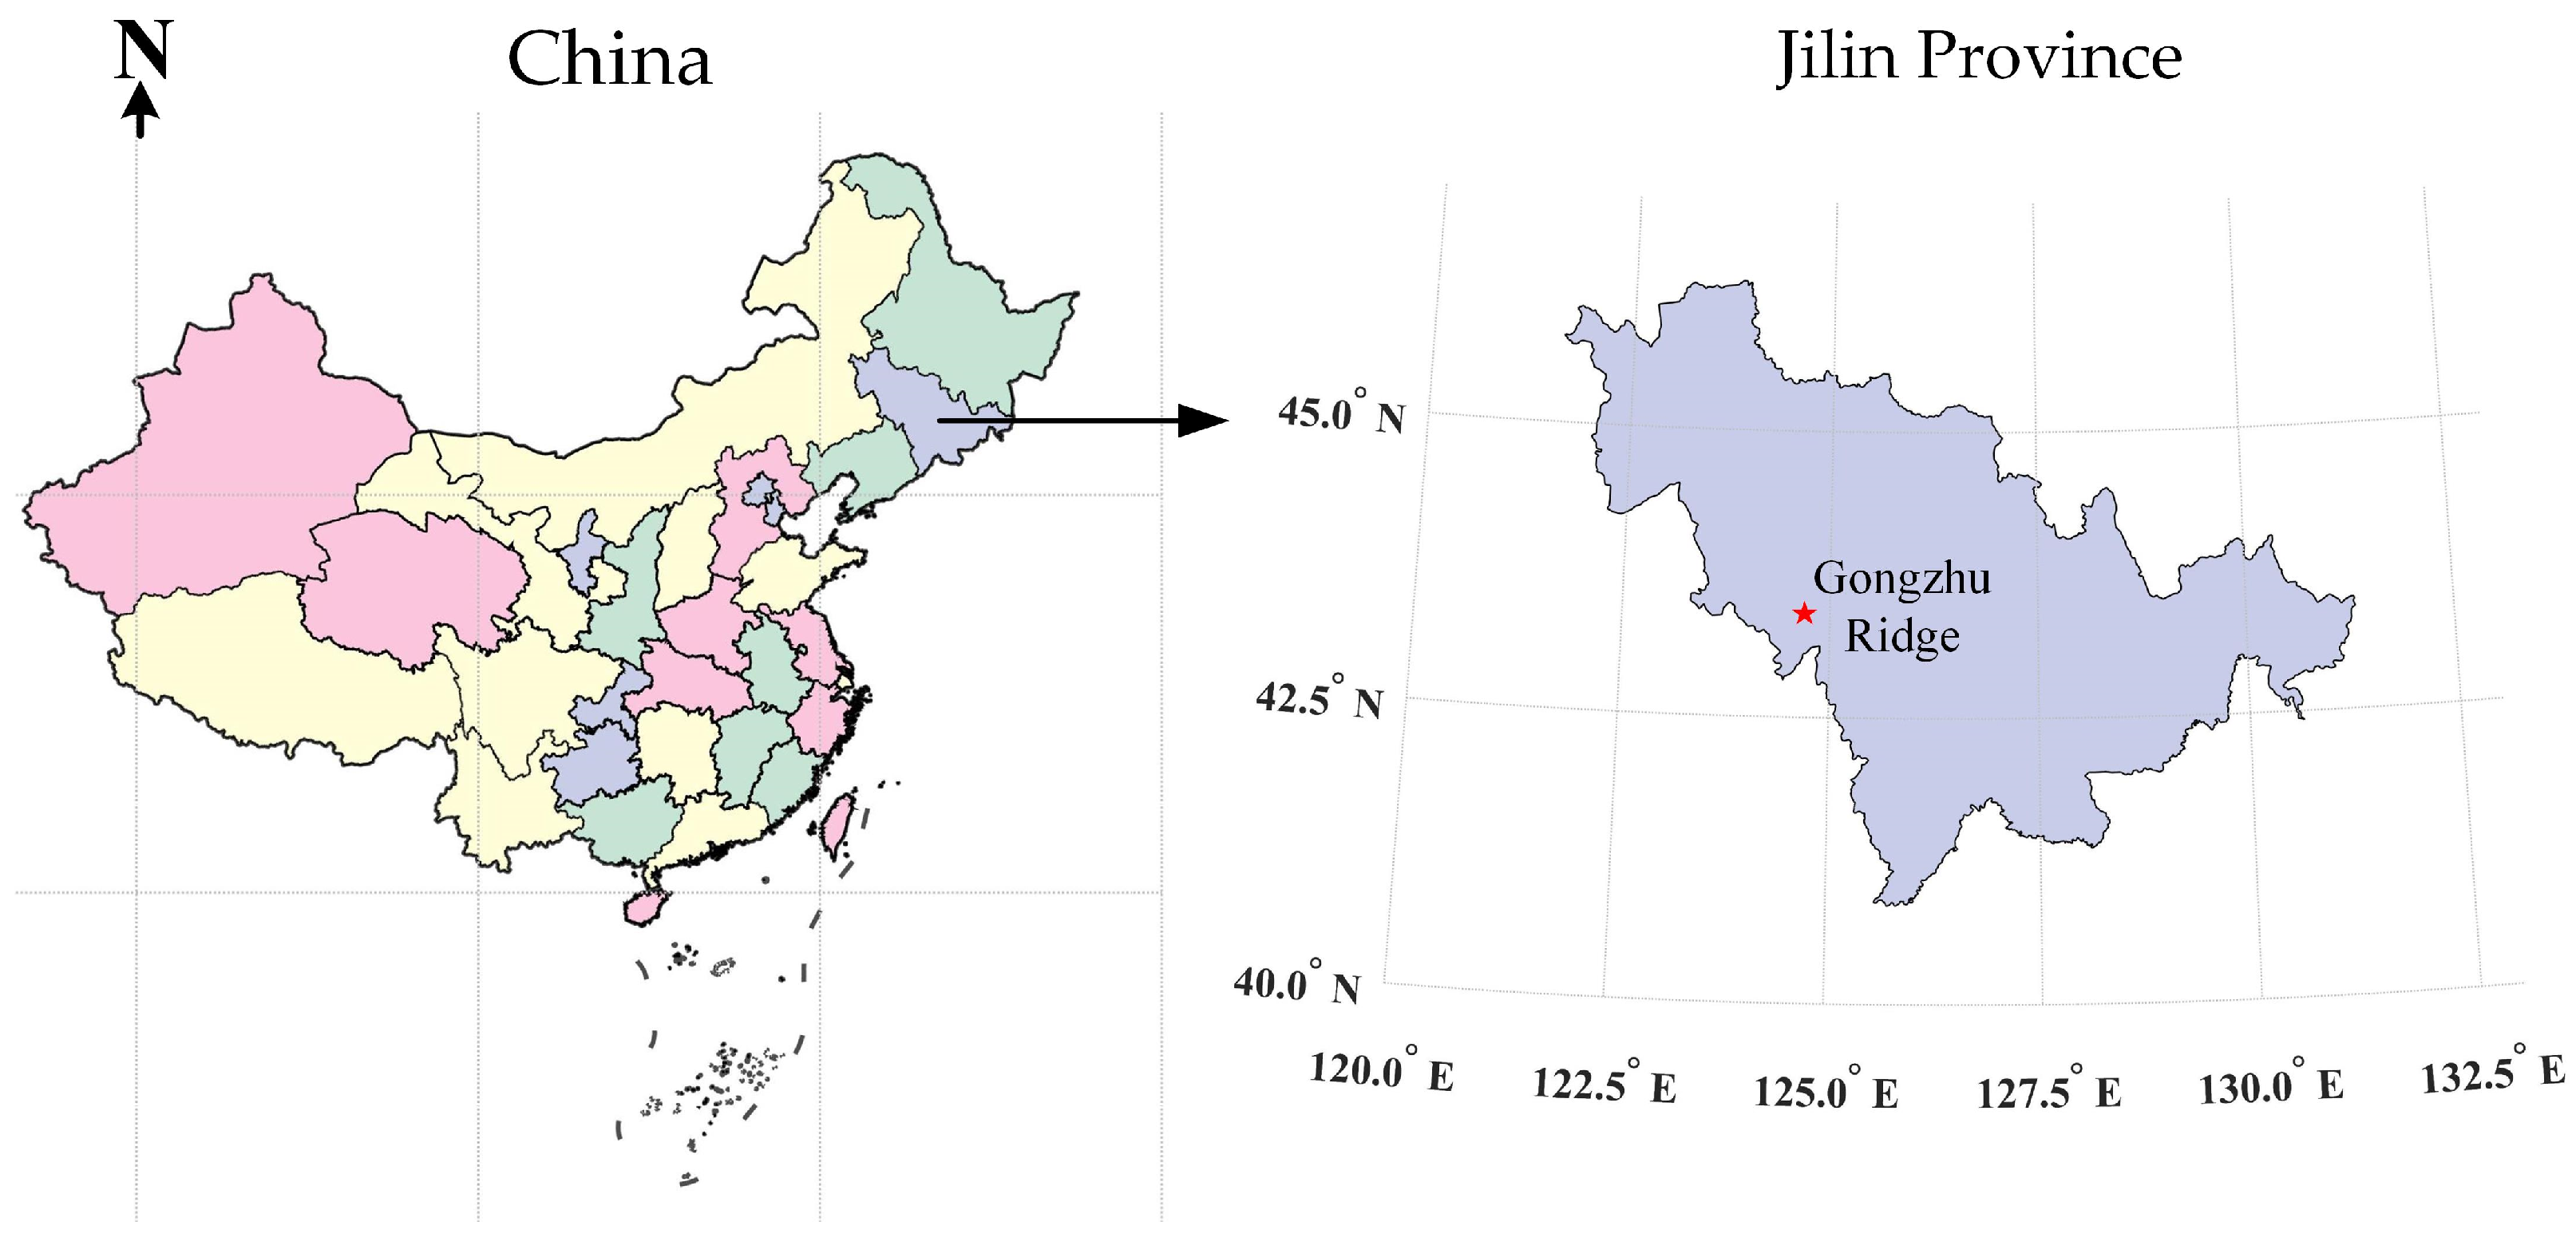
Soil samples were collected in the spring of 2021 from an experimental field at the Institute of Agricultural Science in Gongzhuling City, Jilin Province. The collection area is shown in Figure 2. The soil samples in this batch were classified as black soil according to the FAO-United Nations soil classification system. Black soil is a common type of cultivated soil in Jilin Province, known for its strong uplifting and disturbance qualities. Special areas such as roadsides, fields, ditches, and fertilizer piles were avoided during collection in order to ensure the randomness and homogeneity of the sample. Instead, the plum-shaped sampling method was used, taking five portions of soil within the 4–20 cm tillage layer at each sampling point for homogeneous mixing. Approximately 1 kg of soil samples were collected, resulting in a total of 106 soil samples being collected. After natural drying in the laboratory, the soil was ground and passed through a 70-mesh sieve to produce 106 soil samples with particles smaller than 2 mm. Of these samples, 30 g each will be used for detection using the electronic nose and multispectral imaging methods employed in this study. The remaining soil samples will undergo chemical analysis to determine the content of the main nutrients in the soil and obtain accurate values.
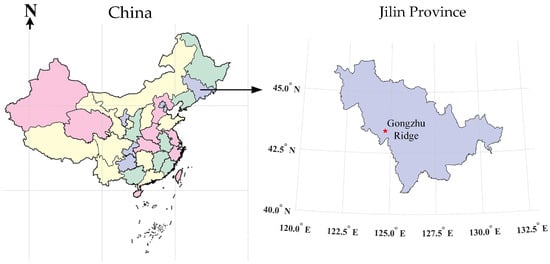
Figure 2.
Study area and soil sample collection sites.
2.2. Electronic Nose Response
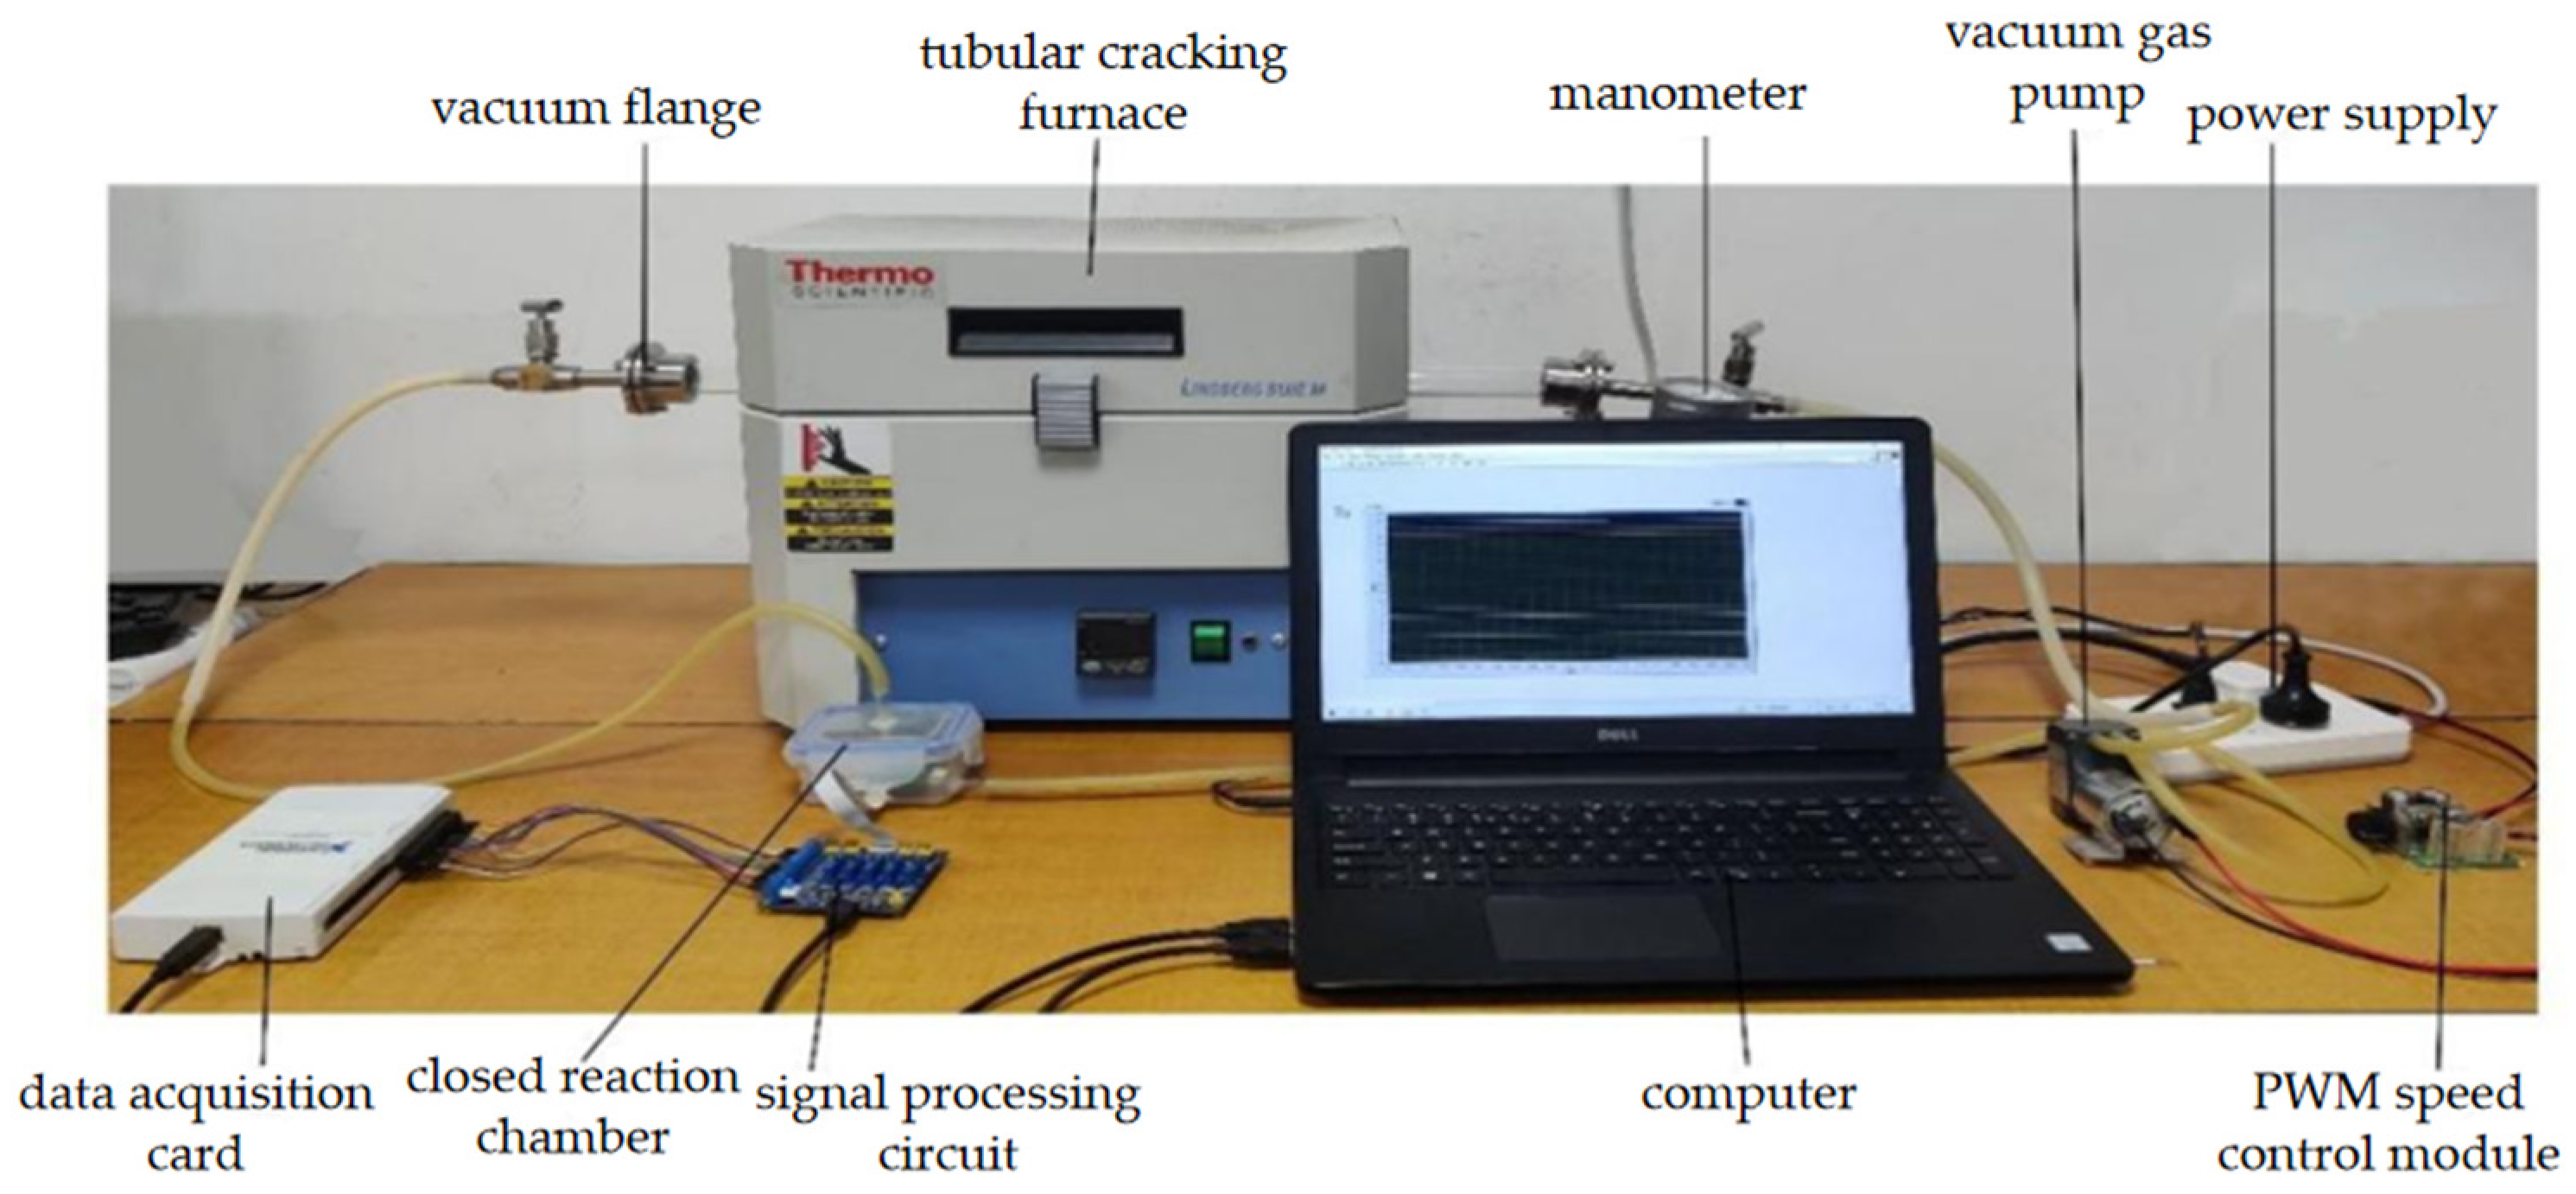
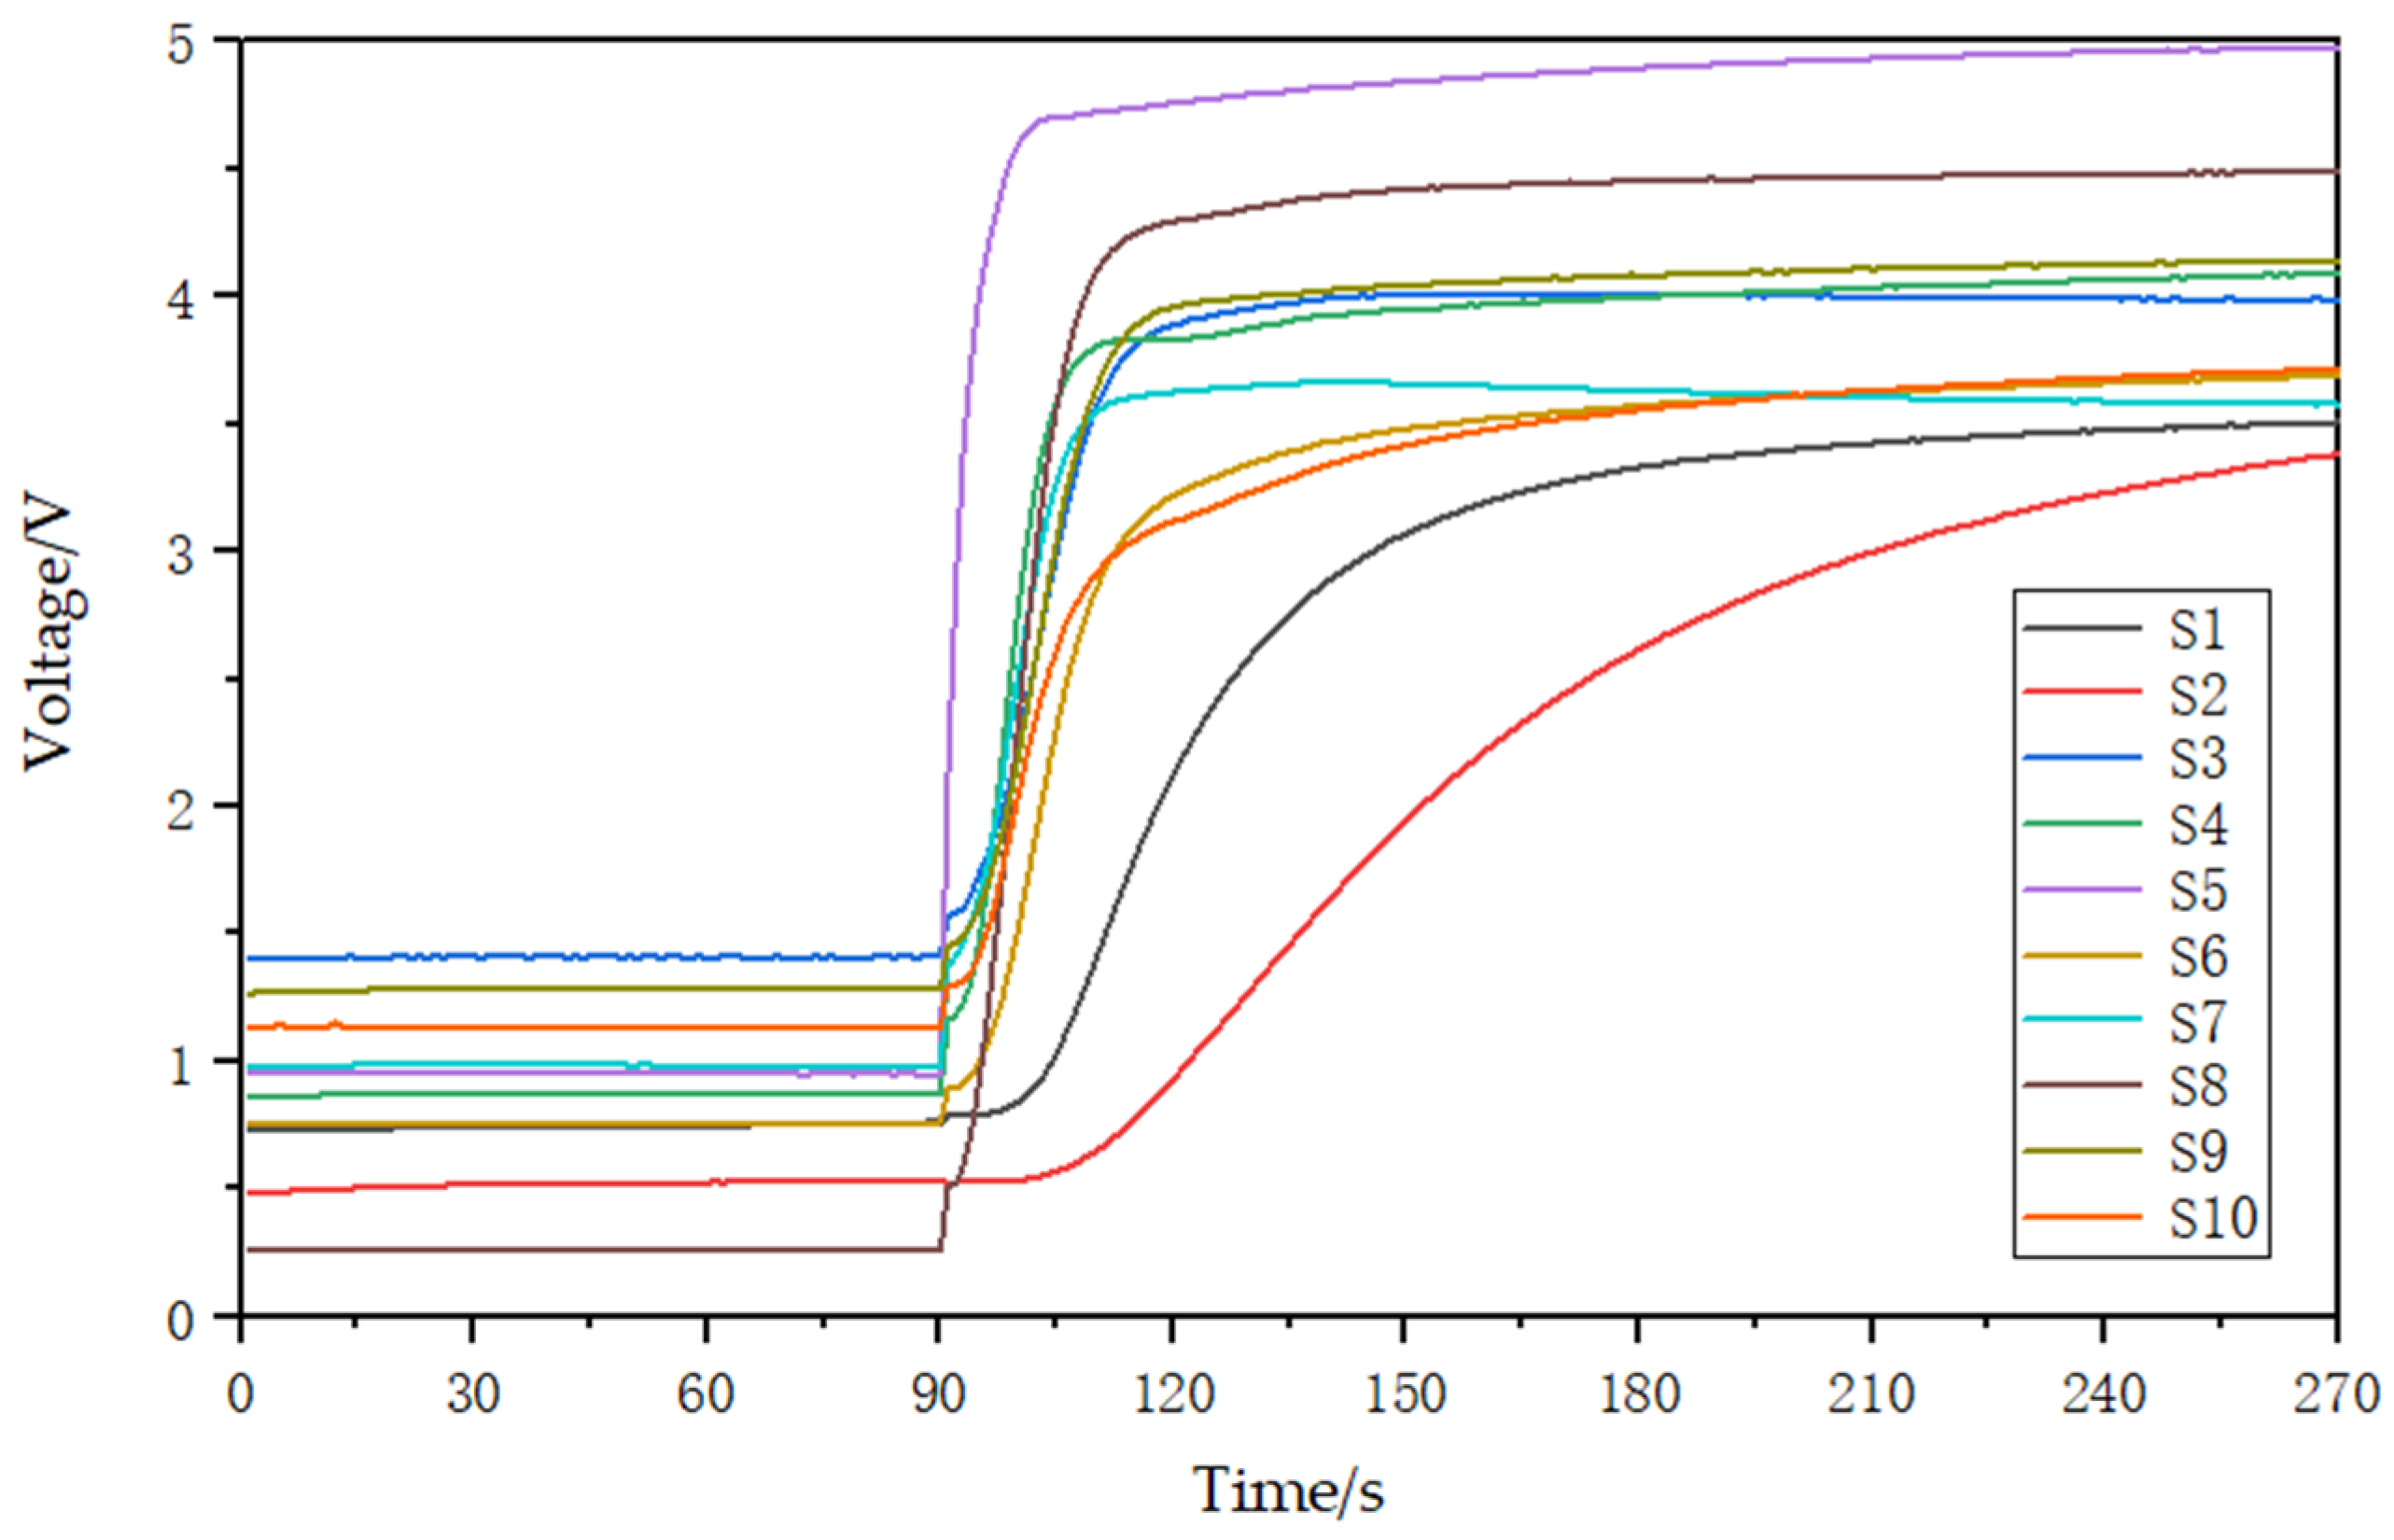
Odor can directly reflect the characteristic information of a substance. Thermal cracking technology can make the soil volatilized from macromolecular compounds by cracking and volatilization into gaseous small molecular compounds [25,26,27]. These include water vapor, carbon monoxide (CO), carbon dioxide (CO2), methane (CH4), ammonia (NH3), nitric oxide (NO), ethylene (C2H4), and propane (C3H8) [28,29]. In this study, an electronic nose array was designed using 10 MEMS gas sensors (electrochemical gas sensors produced by Zhengzhou Weisheng Electronic Technology Co., Ltd. Zhengzhou, China) to detect the gases produced during pyrolysis and obtain features that can characterize the content of main nutrients in soil. The electronic nose gas response device based on thermal pyrolysis is shown in Figure 3 and consists of a closed reaction chamber containing the 10 MEMS gas sensors. The experimental conditions for soil nutrient detection by electronic nose are shown in Table 1. The detection process involves placing a soil sample in the quartz tube, which is then cracked for 3 min in the tubular cracking furnace to produce the gas. The vacuum gas pump then pushes the gas into the closed reaction chamber, where the sensor array detects it and generates responsive electrical signals. These signals are then filtered, amplified, and converted into digital signals by the signal processing circuit. Finally, the data is uploaded to a computer via a data acquisition card. After each response, the entire gas path is washed for 3 min before the next soil sample is detected. The gas response curve is shown in Figure 4. Prior to the reaction of the sensor array, the voltage of the 10 sensors remained stable for the first 90 s. Once the closed reaction chamber is filled with cracking gas and the reaction begins, the voltage increases in response and gradually stabilizes.
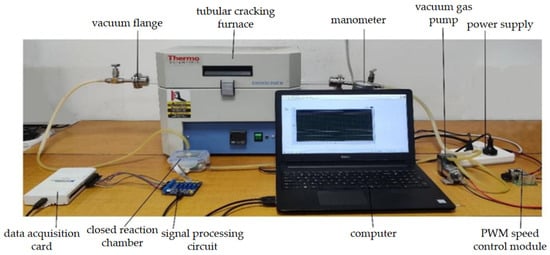
Figure 3.
Thermal cracking-electronic nose gas response device.

Table 1.
The experimental conditions for soil nutrient detection by an electronic nose device.
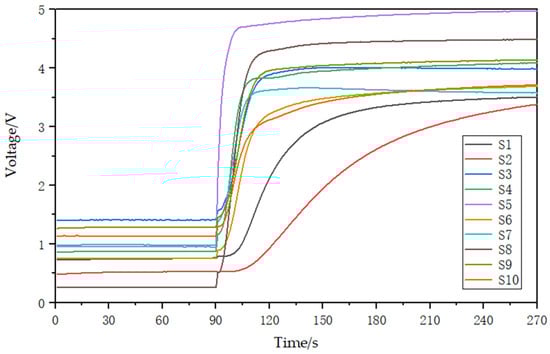
Figure 4.
Sensor array gas response curves. S1–S10 represent the 10 sensor numbers.
After the detection of all soil samples, the gas response curves of the sensor array will be analyzed to extract relevant features. In this study, seven features were extracted, including the seventh-second transient value (TV7S), mean differential coefficient (MDCV), maximum value (MAX), mean value (MEAN), response maximum area (RAV), relative steady state mean value (RSMV), and relative change value (RCV). This resulted in a feature space of 106 × 10 × 7, which includes information such as transient value, stable value, dispersion, overall intensity, and rate of change of the sensor array response data. These features effectively characterize the response curve of the gas sensor. The 7 response features and their corresponding feature numbers are shown in Table 2, where S1–S10 represent the numbering of Sensor 1 to Sensor 10. The feature numbers correspond to the 10 features of the respective 10 sensors.
Table 2.
Gas response features and their corresponding sensor feature numbers.
2.3. Multi-Spectral Image Acquisition
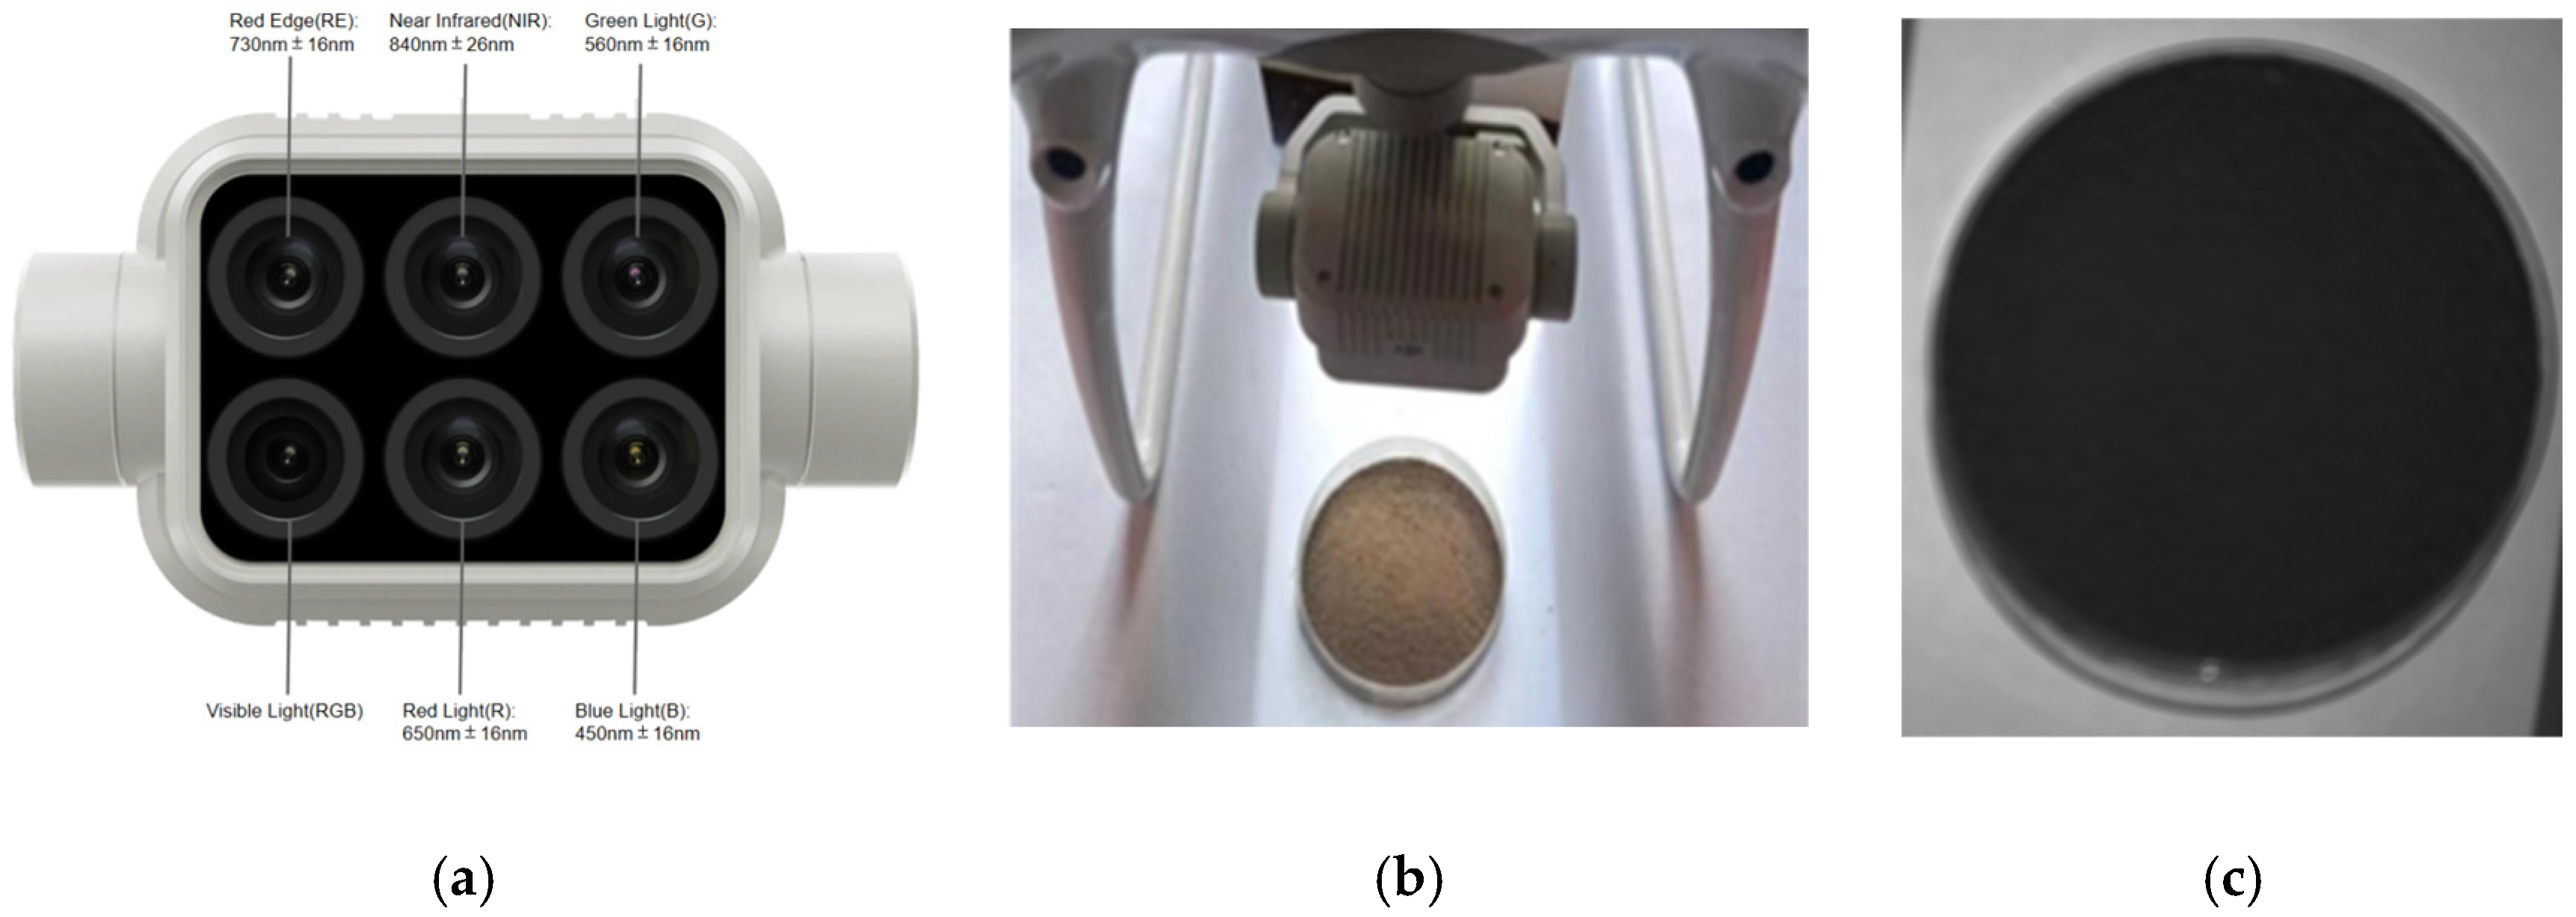
There are a limited number of gas compounds present in the soil pyrolysis components that characterize potassium and phosphorus. As a result, the electronic nose method may not be very effective in detecting AK and AP. Previous studies have shown that the 600–800 nm spectral range is a common spectral response range for organic matter in various types of soils within the study area [30]. The 250–750 nm range is particularly sensitive to soil phosphorus [31], while the 400–600 nm range is where the spectral sensitivity for available potassium is concentrated [32]. The strongest correlation between spectral reflectance and total soil nitrogen is found within the 400–600 nm range [33]. Therefore, a multispectral camera was used in this study, which was the one carried by the DJI Elf 4 Multispectral Edition UAV, produced by SZ DJL Technology Co., Ltd. Shenzhen, China. The camera is equipped with one visible light lens and five multispectral lenses (blue (B): 450 ± 16 nm, green (G): 560 ± 16 nm, red (R): 650 ± 16 nm, red edge (RE): 730 ± 16 nm, and near-infrared (NIR): 840 ± 26 nm). As shown in Figure 5a, the camera lens essentially covers the sensitive spectral bands of the main soil nutrients, enabling clear acquisition of multispectral data from the soil. The process of acquiring a multispectral image of the soil is shown in Figure 5b. The multispectral camera was fixed on a shooting platform with a petri dish of 9.5 cm in diameter placed beneath the lens. A 30 g soil sample, spread evenly to a thickness of 0.25 cm, was placed in the dish. The multispectral image acquisition conditions of the soil as shown in Table 3, the camera was positioned 18 cm above the soil surface, capturing the entire sample. Soil spectral images were collected at Jilin Agricultural University in 2023. The weather was clear and sunny on that day, and the soil was photographed with sunlight as a supplementary light source. Each soil sample yielded 5 single-band spectral images, as shown in Figure 5c, which could be obtained for each soil sample. The resolution of all the images was 1600 × 1300. A total of 106 soil samples were collected and used for spectral index feature extraction.
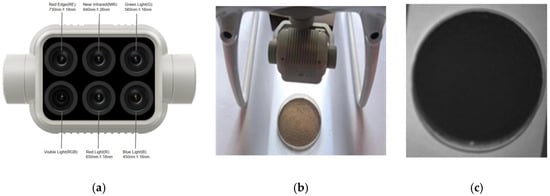
Figure 5.
(a) is a schematic diagram of the lens of the multispectral camera; (b) is a schematic diagram of soil sample collection by the multispectral camera; and (c) is a single-band spectral image of soil samples.
Table 3.
Soil spectral image acquisition conditions.
Some studies have suggested that it is possible to use spectral indices to predict soil nutrients. For example, Biney and their team [34] used a drone equipped with a multispectral camera (with 6 bands: blue (475 nm), green (560 nm), red (668 nm), red edge (717 nm), near-infrared (840 nm), and thermal 11 µm) to capture multispectral images of soil. They then extracted spectral indices and used them to model and predict soil organic carbon, comparing their approach with remote sensing methods and proximal spectroscopy. Heil [35] also used a drone equipped with a multispectral camera (with 5 bands: blue (465–485 nm), green (550–570 nm), red (663–673 nm), red edge (713–723 nm), and NIR band (820–840 nm)) to capture multispectral images of soil. They used a threshold method to remove vegetation from the soil, extracted indices from the resulting bare soil images (including brightness index, red–green difference index, deep green index, etc.), and established a model for predicting soil organic matter content. The results of their research suggest that it is feasible to use indices extracted from bare soil multispectral images for predicting soil nutrient levels. Xu [36] conducted a study on the extraction of spectral indices from remote sensing images of bare soil and developed a model for predicting soil organic matter. The results of this study were promising. These studies highlight the significance of vegetation indices for soil studies. After reference, in this study, ENVI 5.3 software was used to process the spectral images of bare soil and calculate and extract seven spectral indices from 106 soil samples. These indices included the Normalized Differences Vegetation Index (NDVI) [37], Enhanced Vegetation Index (EVI) [38], Normalized Difference Red Edge (NDRE) [39], Ratio Vegetation Index (RVI) [40], Modified Soil Adjusted Vegetation Index (MSAVI) [41], Transformed Vegetation Index (TVI) [42], and the Second Brightness Index (BI2) [43]. The calculation formulas for each index are shown in Equations (1)–(7). The maximum (max), minimum (min), mean, and standard deviation (StdDev) of each index were extracted to form a 106 × 7 × 4 spectral index feature space. The feature numbers are listed in Table 4.
Table 4.
Spectral indices and their corresponding feature numbers.
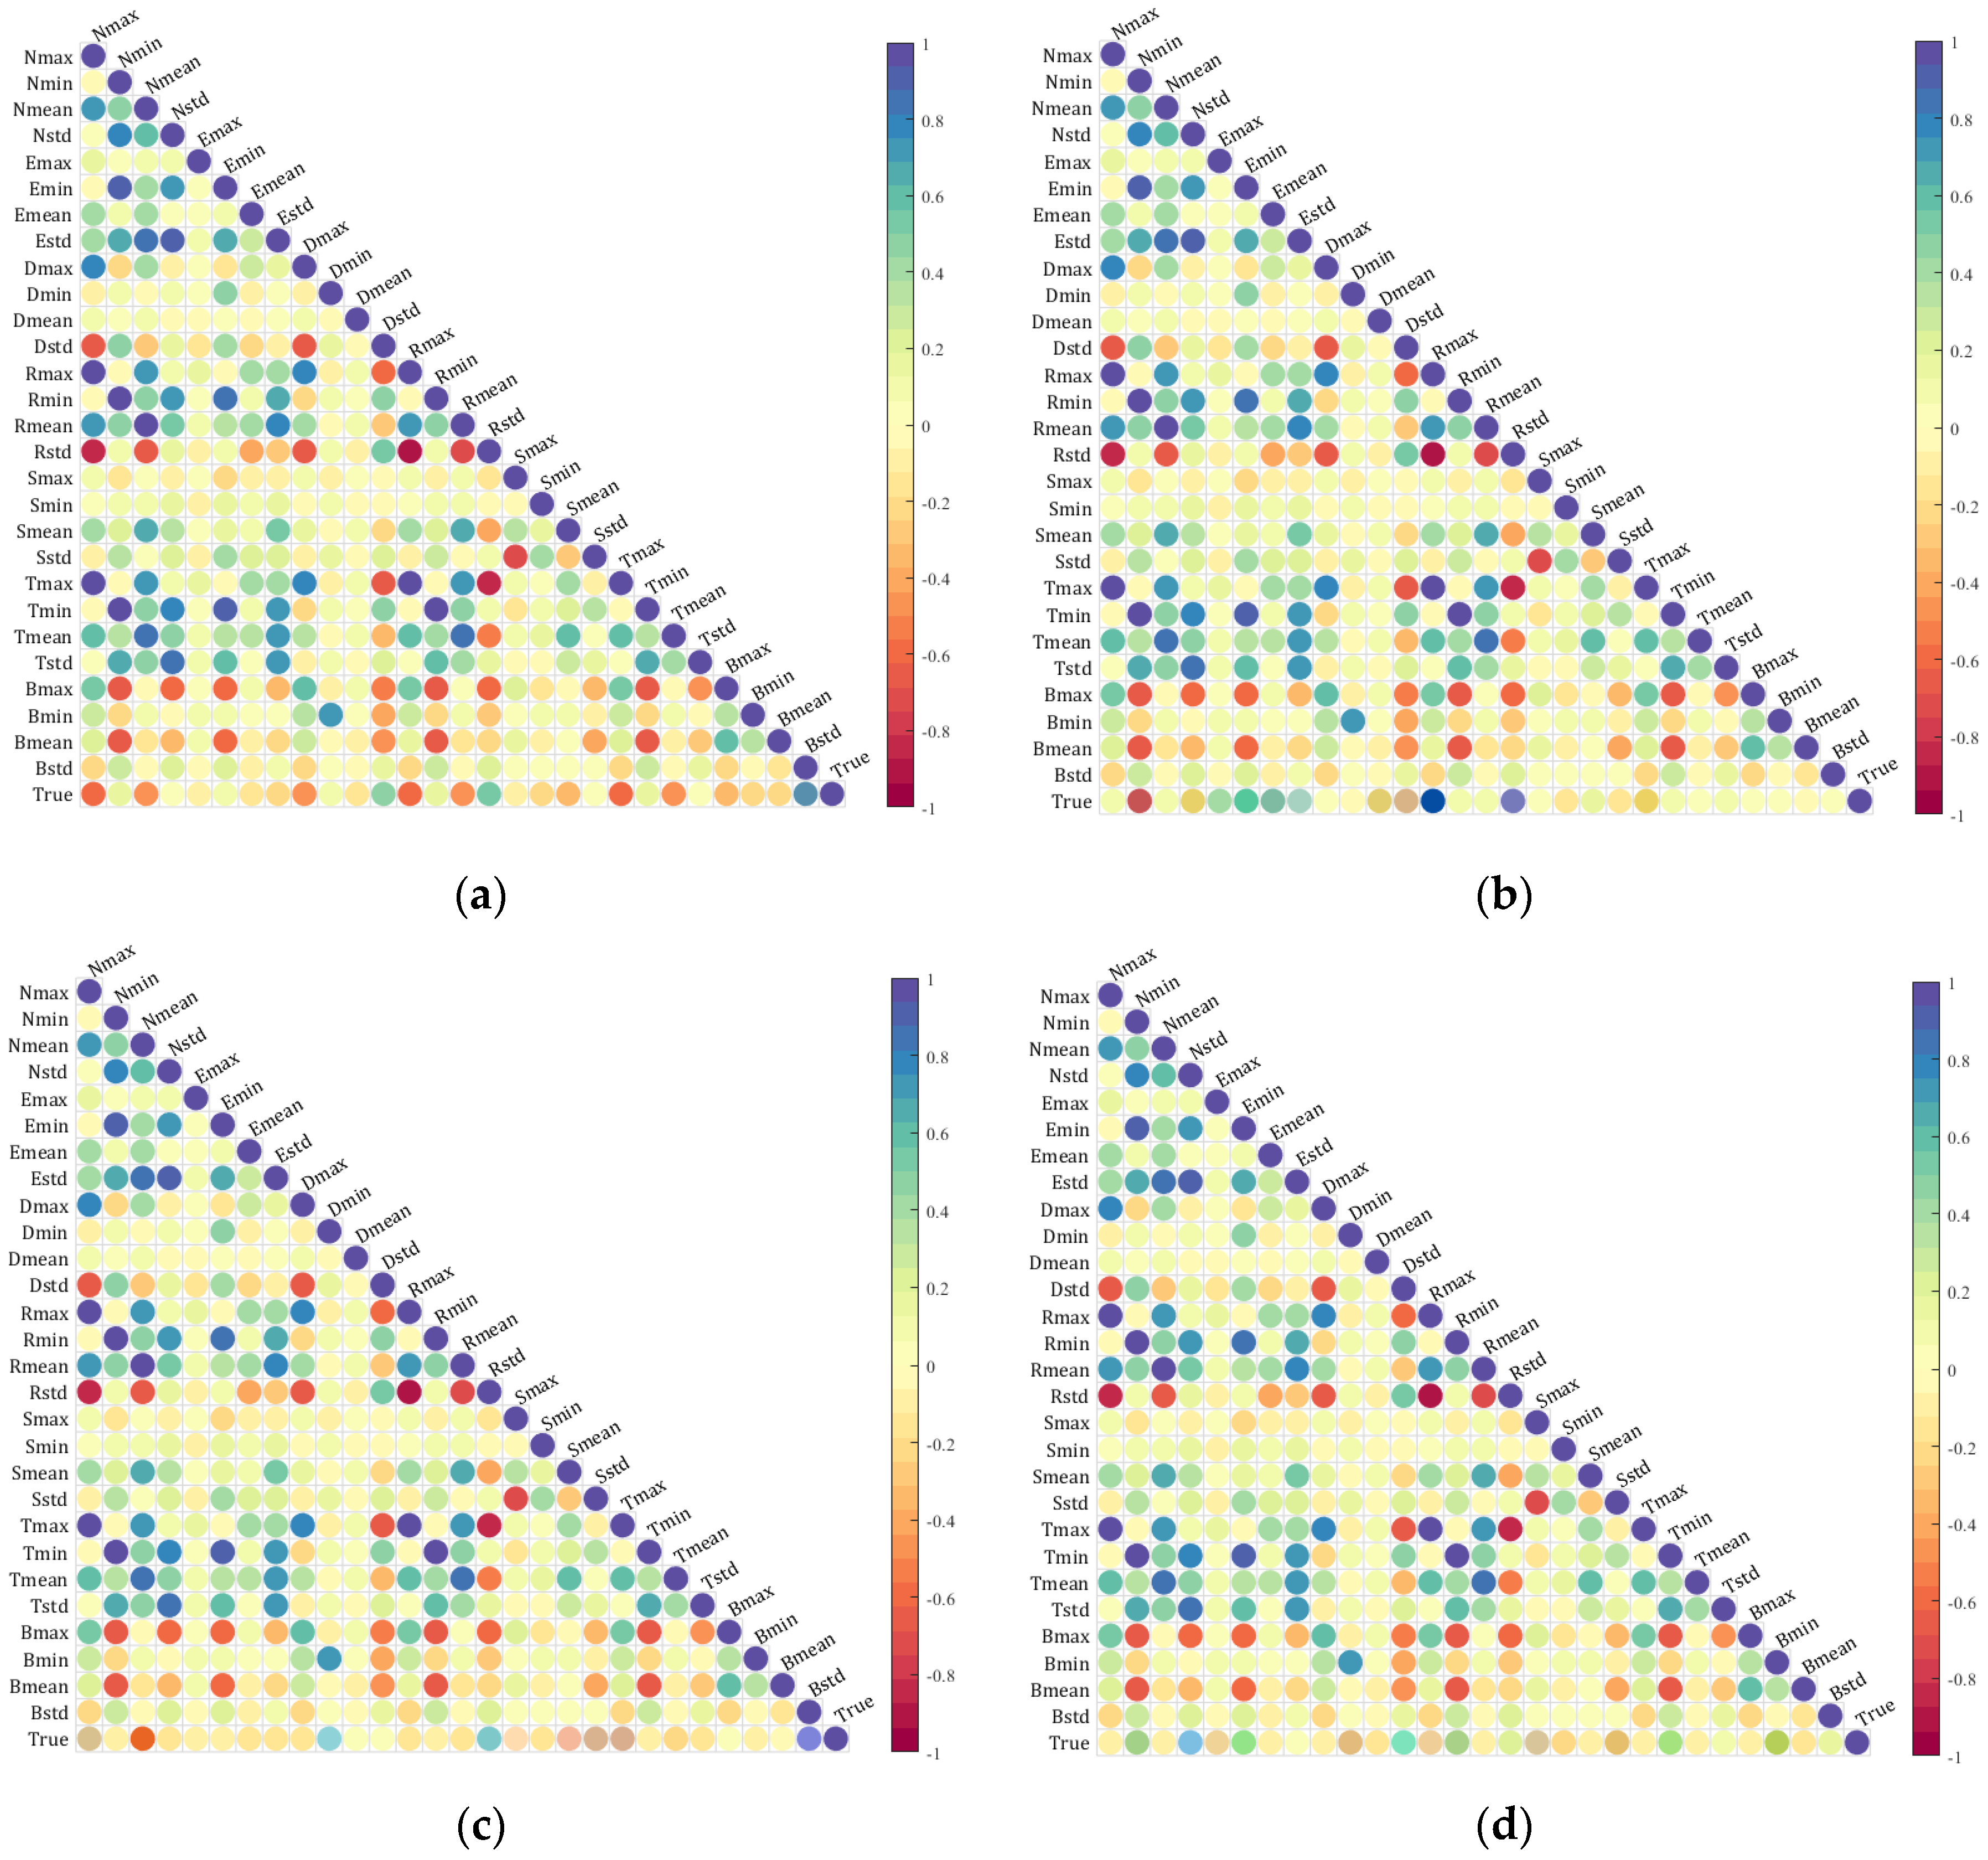
The seven extracted index features were individually analyzed for correlation with the true values of SOM, TN, AK, and AP. The resulting heatmap is shown in Figure 6. These figures display the correlations between features as well as the correlations between the features and the true values. The bottom row of (a), (b), (c), and (d) in the figure indicates varying levels of correlation between the features and the true values of SOM, TN, AK, and AP. This heatmap confirms the feasibility of using a multispectral camera to capture bare soil images in this study, as it demonstrates a significant correlation between the extracted spectral features and the actual values of soil nutrients.
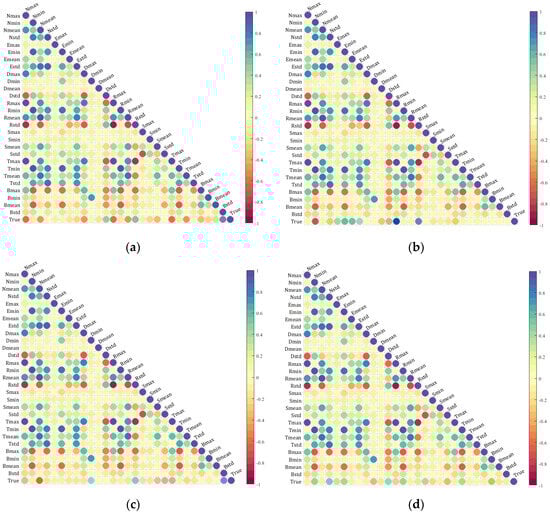
Figure 6.
Spectral index features correlation heatmaps with soil nutrients: (a) is the heatmap of the correlation between features and SOM; (b) is the heatmap of the correlation between features and TN; (c) is the heatmap of the correlation between features and AK; and (d) is the heatmap of the correlation between features and AP.
2.4. Feature Optimization Algorithms
The spectral index features of 106 × 28 were randomly fused with the electronic nose response features of 106 × 70, resulting in a fused feature space of 106 × 98. However, high-dimensional data often suffer from information redundancy issues. Feature extraction and optimization play a crucial role in the quality of subsequent modeling. By selecting the most effective features from the original features to reduce the dimensionality of the dataset, the accuracy of regression can be improved.
The feature optimization currently applied in soil nutrient detection can be divided into feature dimensionality reduction and feature selection. The former widely utilizes PCA for dimensionality reduction, where the method maps the N-dimensional features of the original data to K dimensions. The new K dimensions are orthogonal features, known as principal components, obtained by the coefficient matrix composed of feature vectors in the new coordinate system. After PCA dimensionality reduction, the principal components are orthogonal to each other, which can eliminate the factors of mutual influence among the original data while retaining most of the essential information, achieving the dimensionality reduction effect.
Feature selection is mostly achieved through PCC. By calculating the covariance between the feature and the true value, divided by the product of their respective standard deviations, the correlation coefficient between the two can be evaluated. The value ranges from −1 to 1, with a coefficient closer to 0 indicating less correlation between the features. This method utilizes importance feature ranking to intuitively select significant features. However, features with low correlation also contain important information about sample variations. Discarding them during dimensionality reduction may impact the effectiveness of subsequent modeling.
2.5. The Regression Prediction Model
Currently, machine learning methods used for predicting soil nutrient content mostly include RF and PLSR [44,45]. RF uses a simple averaging method to construct multiple decision trees and combine their prediction results for regression prediction. However, it may not be suitable for small samples of data. The PLSR model combines the strengths of multiple linear regression, principal component analysis, and canonical correlation analysis, making it suitable for high-dimensional datasets and situations with multicollinearity.
In this study, the coefficient of determination (R2), root mean square error (RMSE), and residual prediction deviation (RPD) were selected as the evaluation criteria for the model. The R2 (Equation (8)) is used to measure the proportion of the variability in the dependent variable that can be explained by the independent variables. It ranges from 0 to 1, where a higher R2 value indicates a larger proportion of the total variance explained by the regression, and a closer fit between the regression line and the observed data points suggests that a greater portion of the variation in the y-values can be explained by changes in the x-values, indicating a better fit of the regression. The RMSE (Equation (9)) is a typical metric for regression models, indicating the magnitude of errors in the model predictions. A smaller RMSE is preferred, as it reflects smaller errors and a better fit of the model. RPD (Equation (10)) is similar to R2, but is more suitable for non-linear models. It reflects the variation in the response variable explained by the model and is used to further evaluate the predictive performance of the model.
3. Results and Discussion
3.1. Data Downscaling and Selection
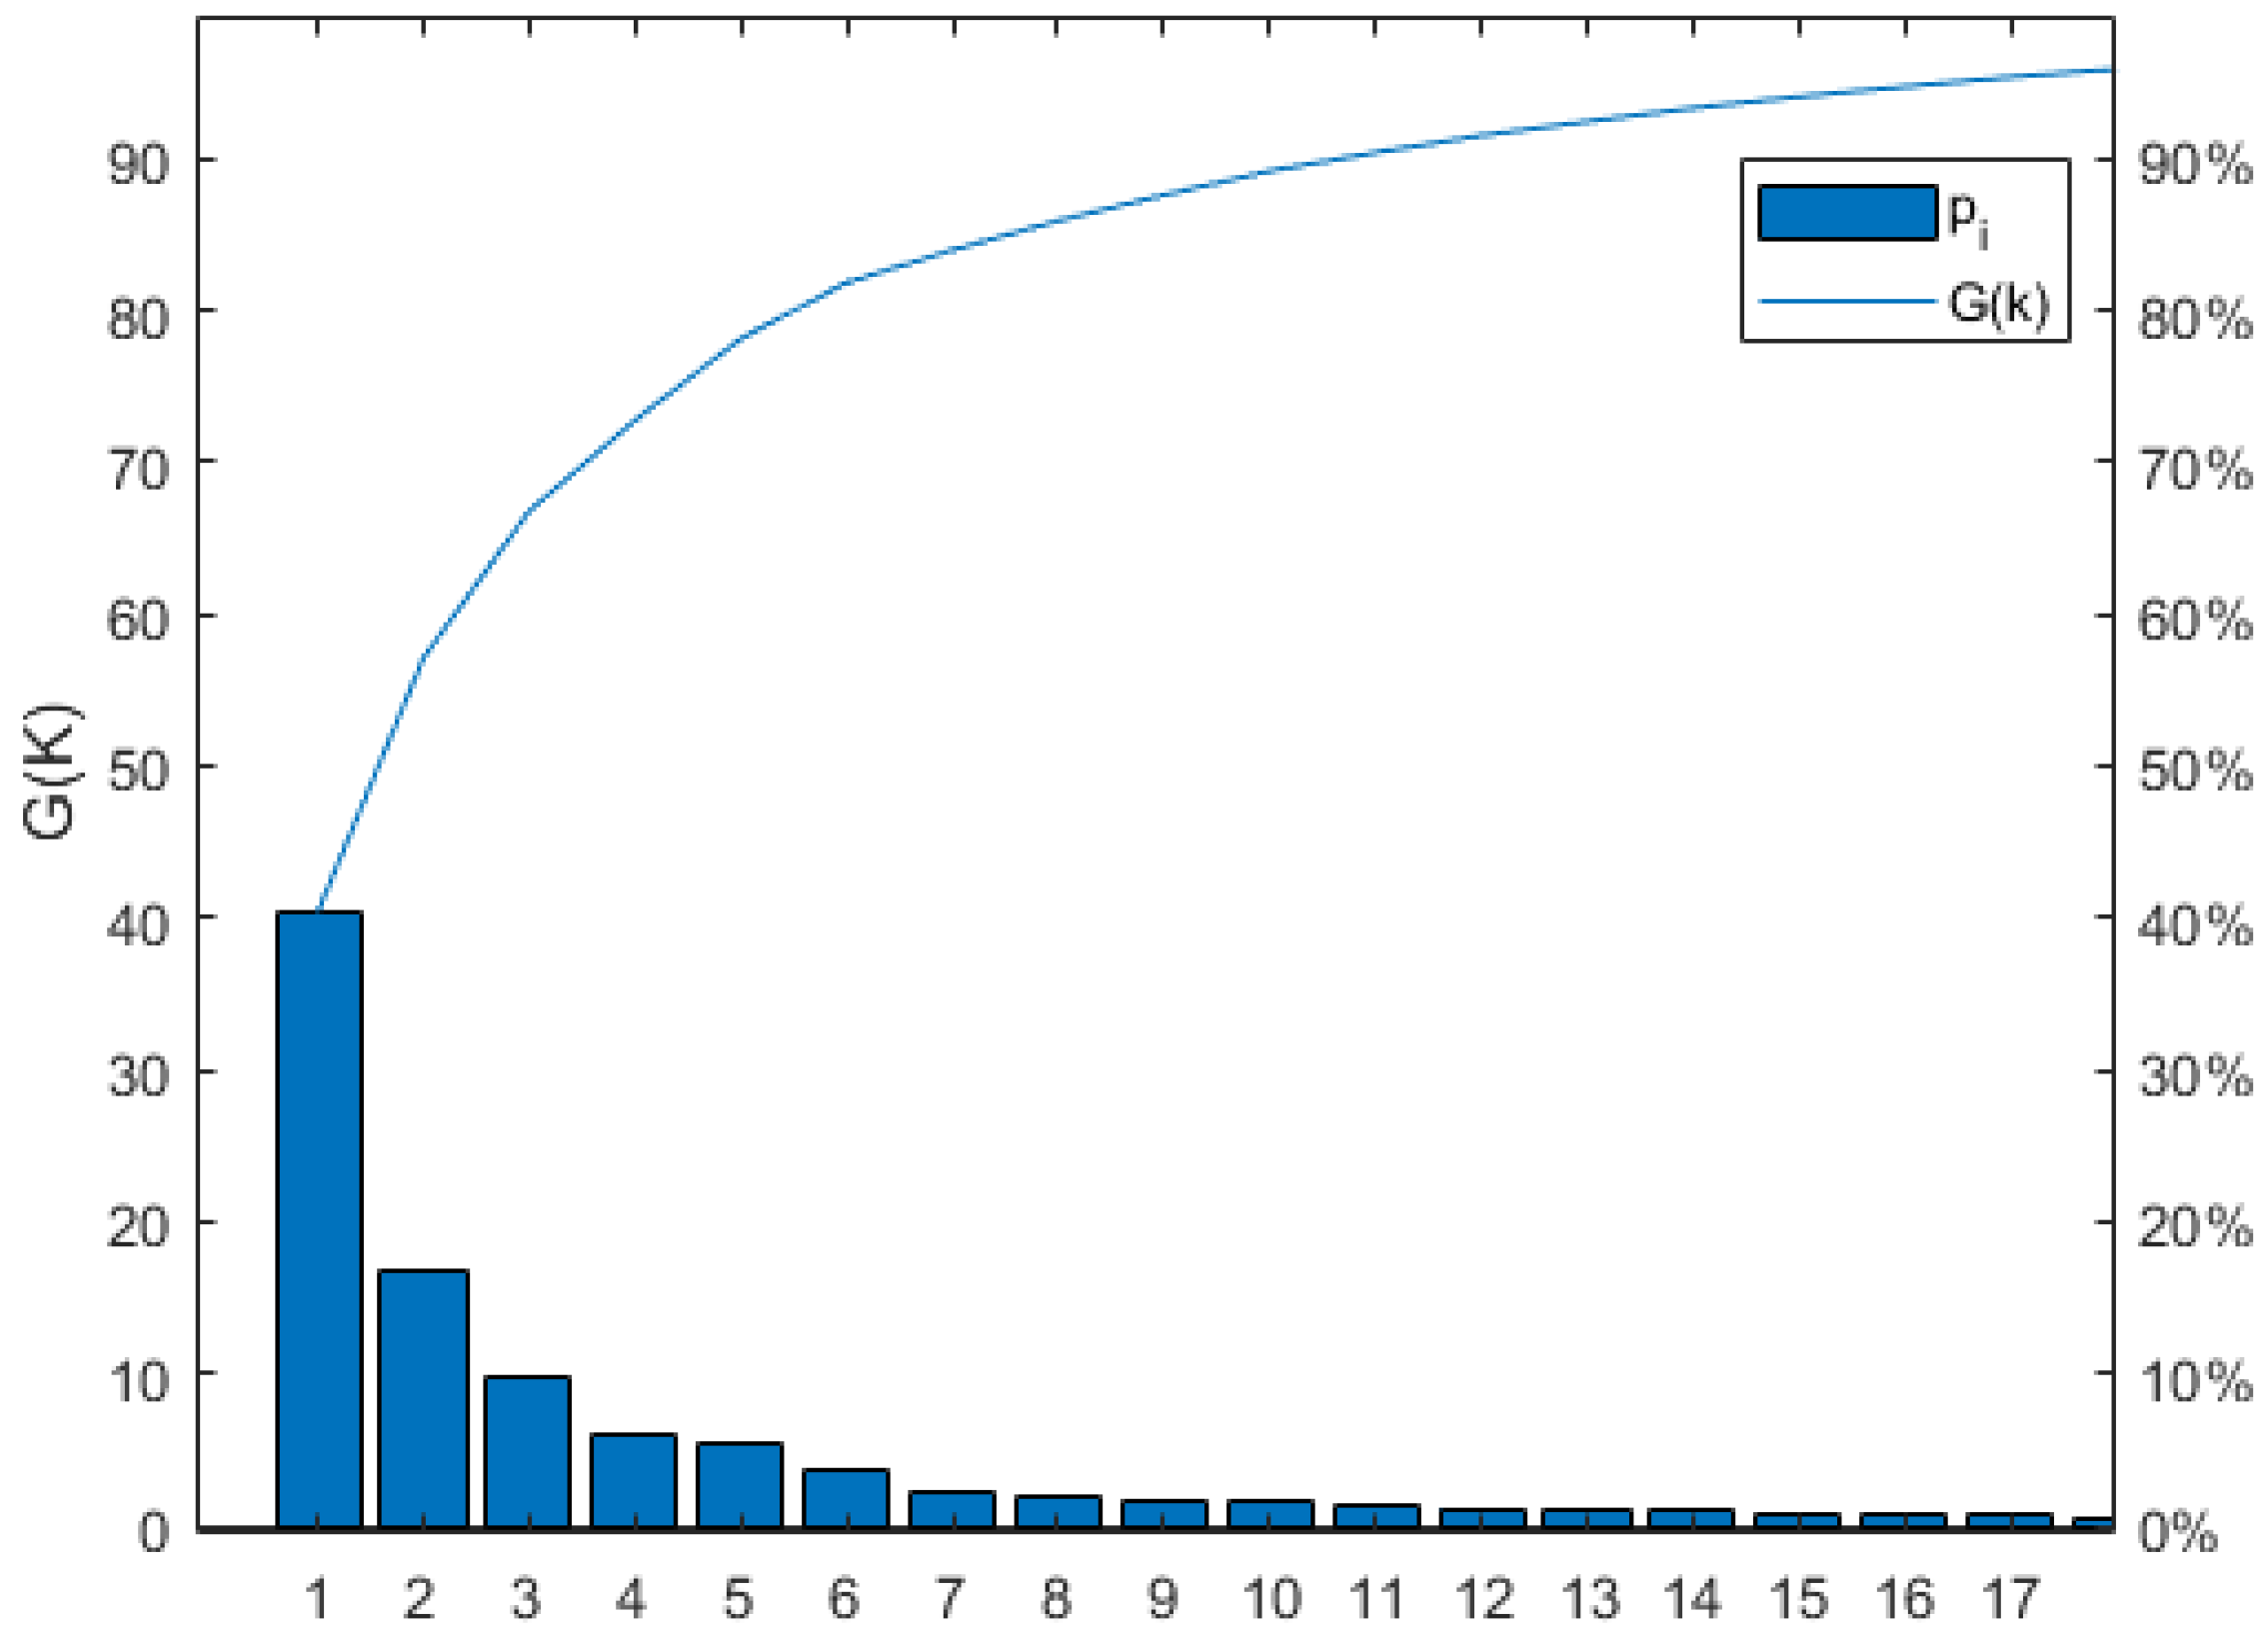
The dimension of the fusion feature space, which is 106 × 98, was optimized using the PCA and PCC methods. The PCA method was utilized to reduce the dimension of the fused feature space, with a target cumulative contribution rate of 95% for the variance information. This resulted in the first principal components for SOM, TN, AK, and AP having contribution rates of 40.41%, 40.49%, 40.36%, and 40.36%, respectively. The cumulative contribution rates for the first 17 principal components were 95.46%, 95.30%, 95.32%, and 95.37%, indicating that only 17 principal components are necessary to capture the essential information of the feature space for all four soil nutrients. In other words, the fused feature space can be reduced to 17 dimensions. As an example, Figure 7 shows the number of principal components after PCA dimensionality reduction for SOM, where G(k) represents the contribution rate, Pi represents the i-th principal component, and the curve represents the cumulative contribution rate. The contribution rates for the 1st to 17th principal components in SOM are 40.41%, 16.94%, 9.68%, 5.97%, 5.34%, 3.69%, 2.14%, 1.92%, 1.68%, 1.58%, 1.23%, 1.12%, 0.90%, 0.87%, 0.77%, 0.67%, and 0.53%, respectively. The cumulative contribution rate for the 17 principal components can reach 95.46%.
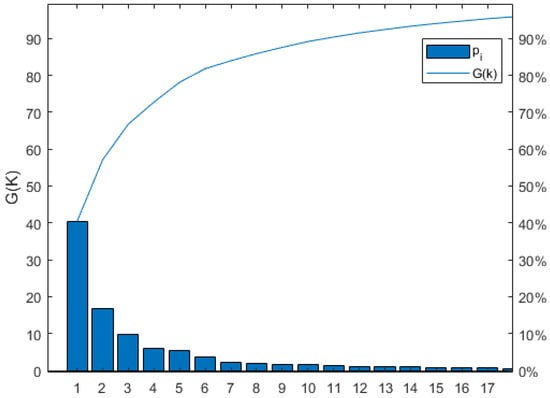
Figure 7.
Number of SOM principal components after PCA downscaling.
The PCC method was used to select features in the fused feature space. The condition set was set at r > 0.1, meaning that only features with a correlation coefficient of r > 0.1 were considered important. The results are shown in Table 5, with 71 features having a correlation greater than 0.1 with SOM. One-third of these features are spectral index features. There are 79 features with a correlation greater than 0.1 with TN, and sensor 5 shows a stronger correlation with TN. For AK, there are 57 features with a correlation greater than 0.1, with the spectral index feature (Bstd) being the most highly correlated. There are 68 features with a correlation greater than 0.1 with AP. To further refine the features, modeling was conducted using the most important features, resulting in 31, 37, 17, and 15 features being optimal for SOM, TN, AK, and AP, respectively.
Table 5.
Importance ranking of features after PCC dimensionality reduction.
To validate the effectiveness of the feature optimization method, a genetic algorithm-backpropagation neural network (GA-BP) was used to establish regression models for SOM, TN, AK, and AP. The evaluation criterion used was R2, and a comparison was made to determine the best feature space optimization method. The results for the test set are shown in Table 6. The optimized feature space generated by the PCA algorithm enhances the performance of the prediction model. For the SOM, TN, AK, and AP prediction models constructed with PCA, the prediction accuracy R2 values are 0.8380, 0.7944, 0.6812, and 0.5904, respectively, with all feature spaces having 17 dimensions. While PCC may intuitively select important features, it directly eliminates features with low correlation from the original set, resulting in suboptimal performance due to the loss of features. In contrast, PCA maps important information from high-dimensional features to low-dimensional features, retaining a broader range of feature information with the fewest feature dimensions and ultimately achieving the best predictive performance.
Table 6.
Validation results of the feature optimization method.
3.2. Modeling Results of Different Regression Models
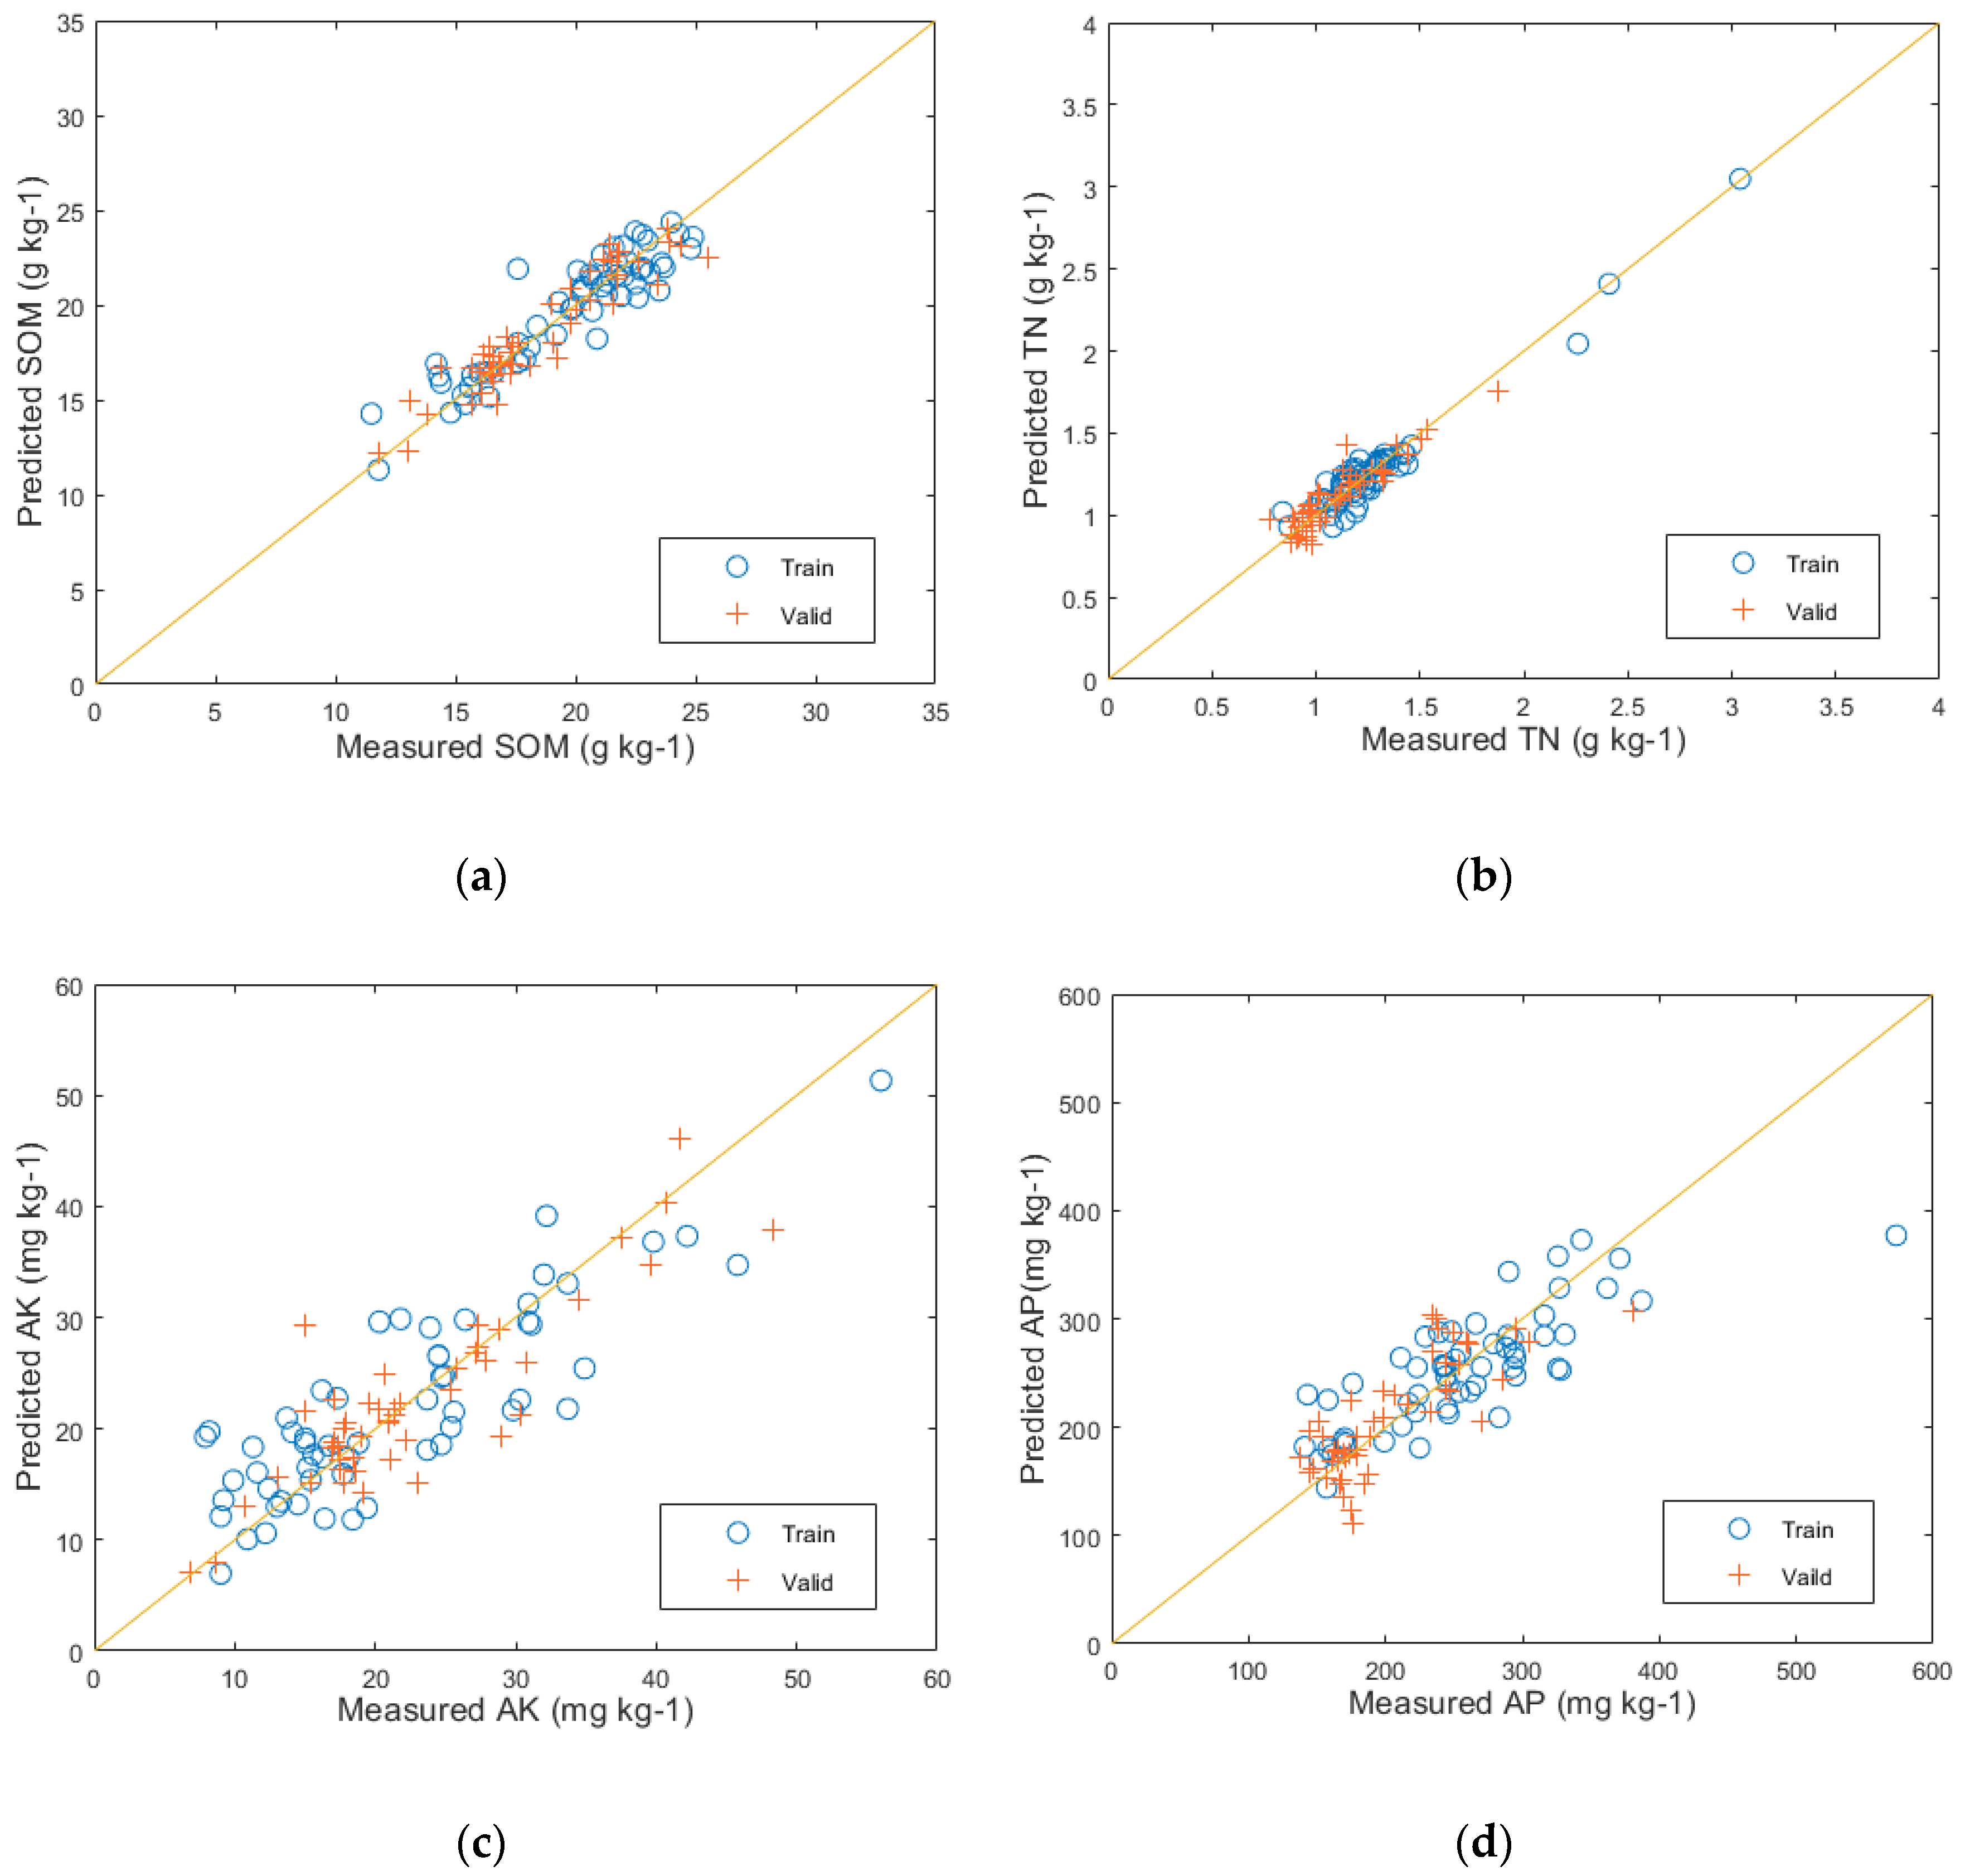
The feature space was optimized using PCA and combined with machine learning algorithms to establish RF and PLSR regression models for predicting the main nutrient content of the soil. The results of the RF modeling can be seen in Figure 8, with (a), (b), (c), and (d) displaying the predictive performance of the RF model on the validation set for SOM, TN, AK, and AP, respectively. The predictions for SOM resulted in an R2 value of 0.88, an RMSE of 1.12, and an RPD of 2.84. For TN, the values were R2 = 0.85, RMSE = 0.08, and RPD = 2.54. For AK, the values were R2 = 0.77, RMSE = 4.16, and RPD = 2.06. And for AP, the values were R2 = 0.63, RMSE = 5.25, and RPD = 1.52.
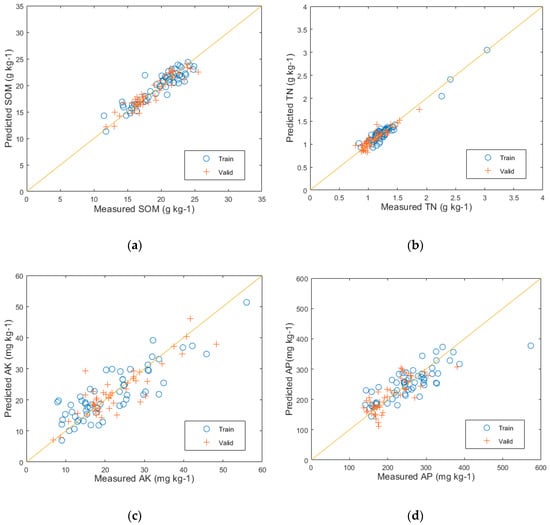
Figure 8.
The predictive results of the RF model: (a) SOM prediction results; (b) TN prediction results; (c) AK prediction results; and (d) AP prediction results.
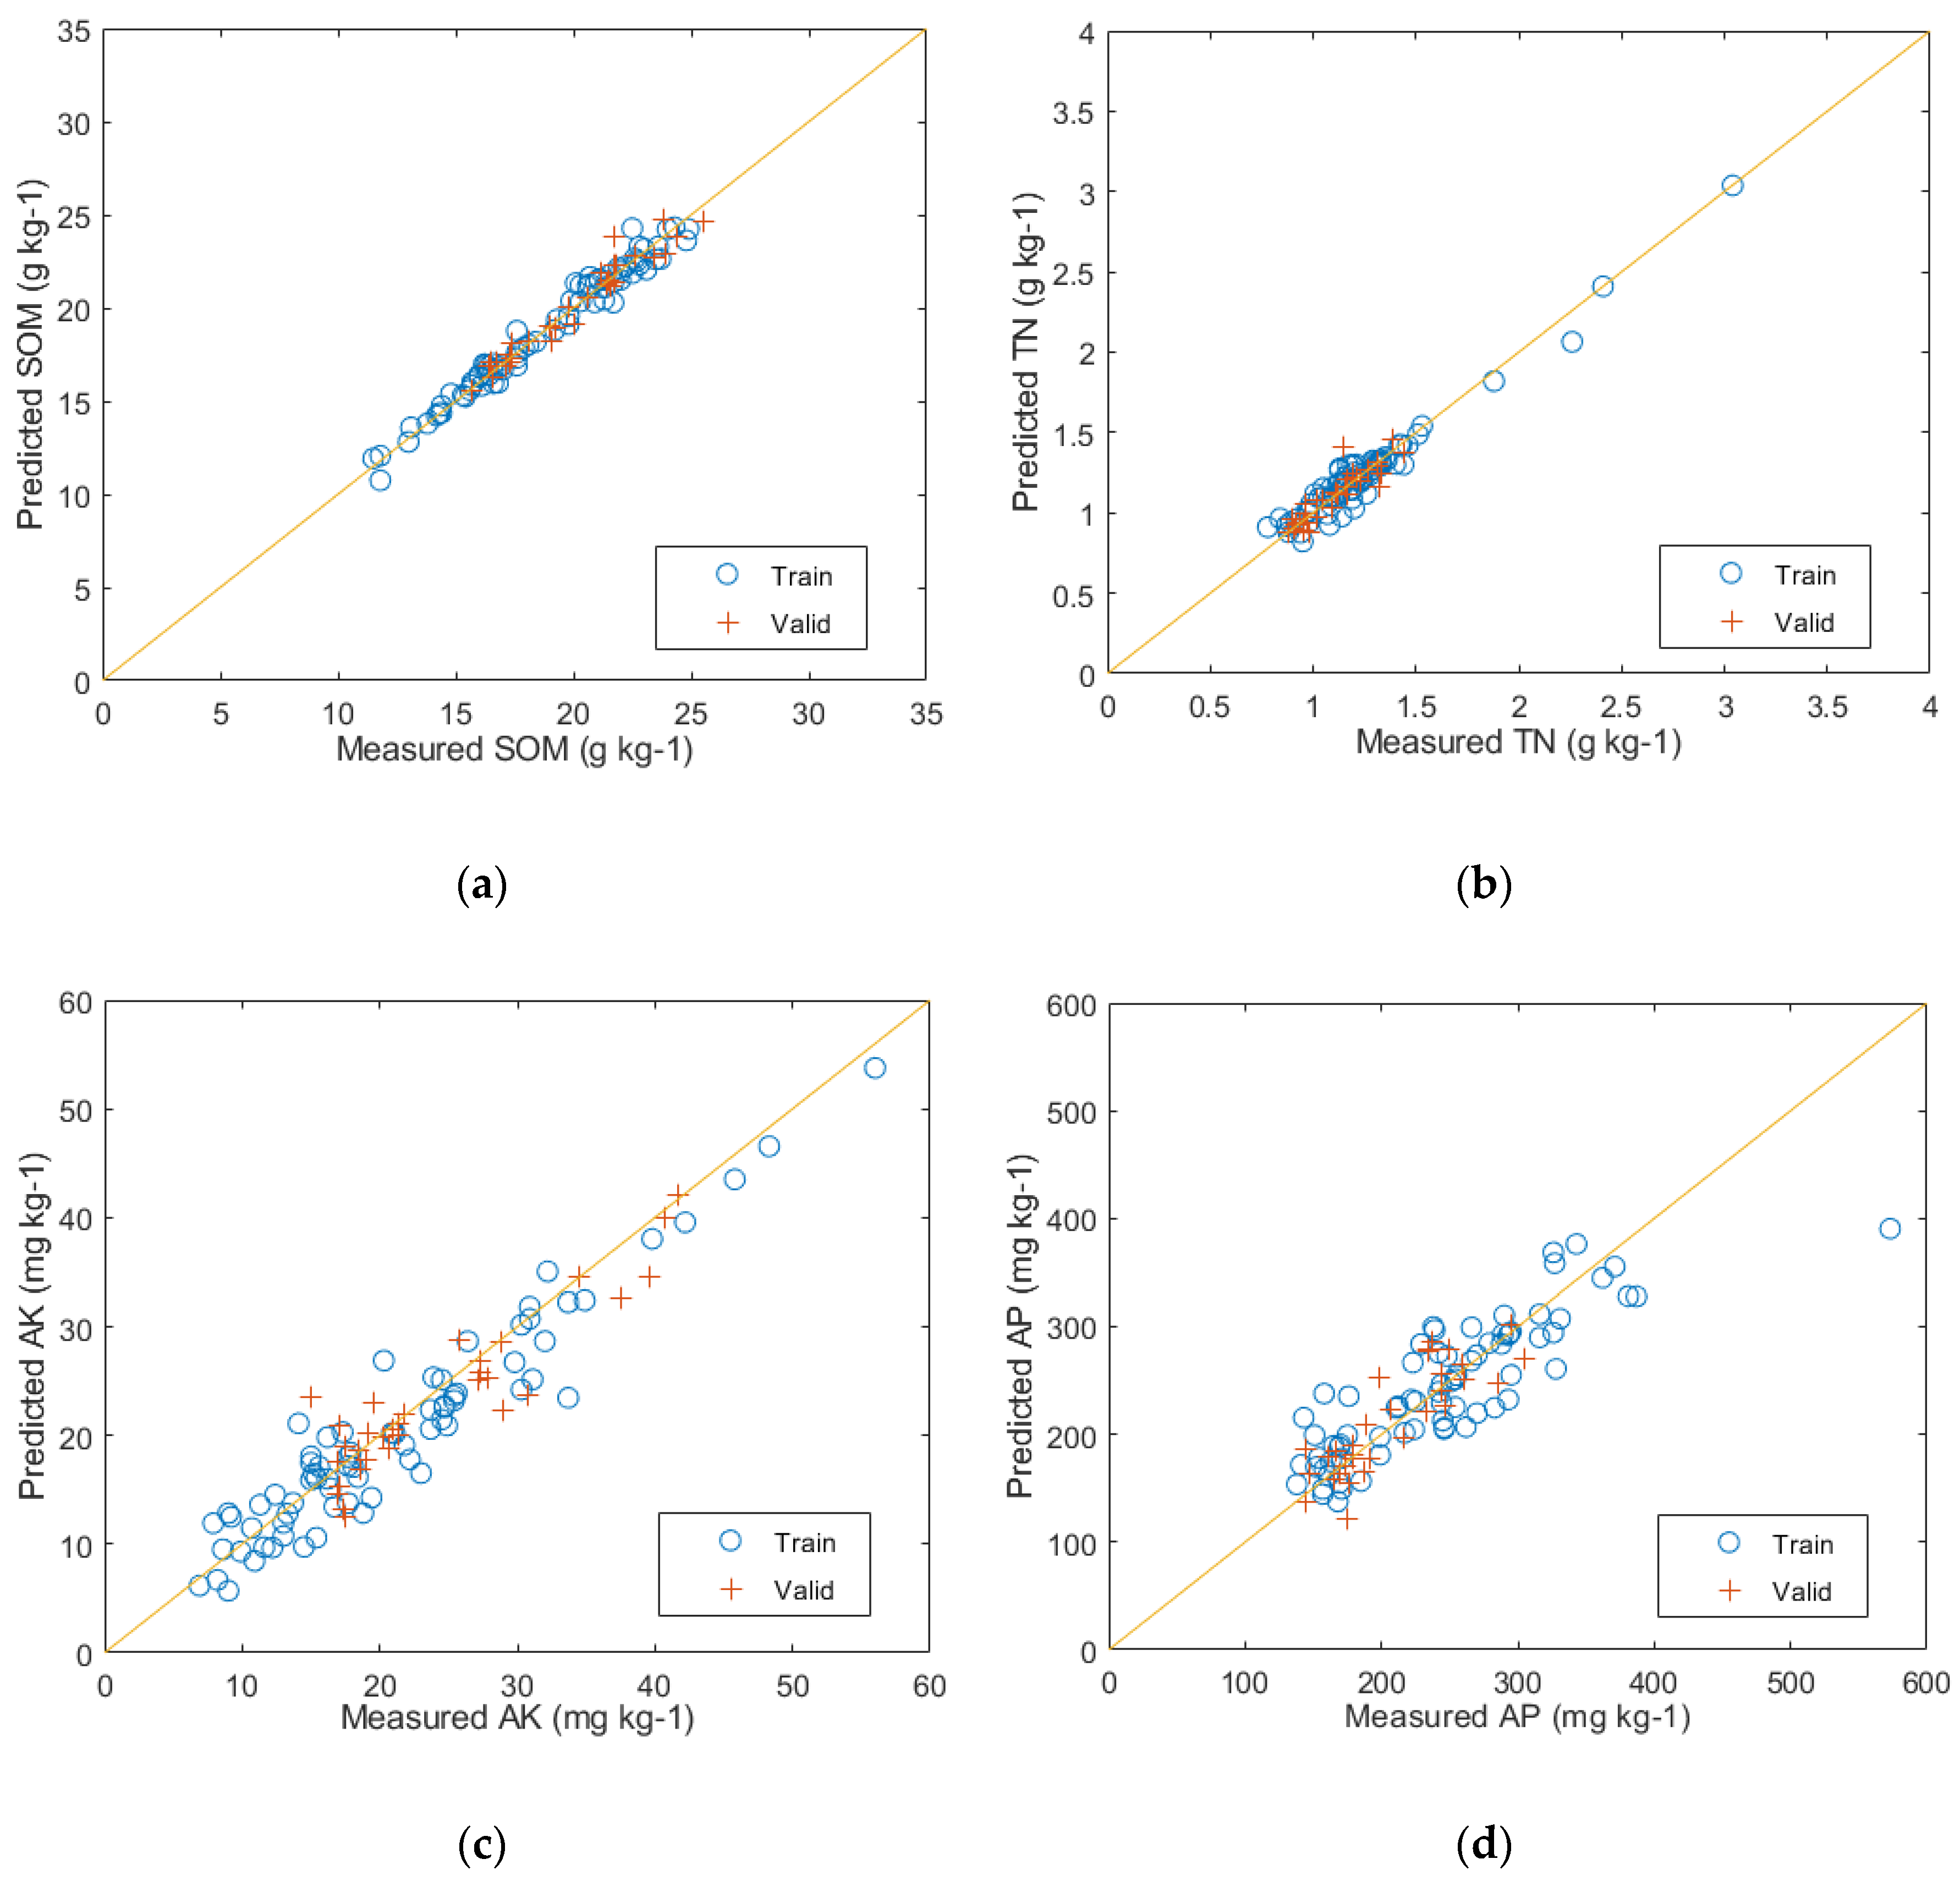
The prediction results of the PLSR modeling with the reduced feature space of PCA can be seen in Figure 9. The predictive performance for SOM on the test set is represented by (a), with evaluation metrics of R2 = 0.96, RMSE = 0.56, and RPD = 5.66. Similarly, (b) represents the predictive performance for TN on the test set, with evaluation metrics of R2 = 0.95, RMSE = 0.07, and RPD = 4.48. The predictive performance for AK on the test set is shown by (c), with evaluation metrics of R2 = 0.84, RMSE = 3.21, and RPD = 0.37. Lastly, (d) represents the predictive performance for AP on the test set, with evaluation metrics of R2 = 0.73, RMSE = 3.70, and RPD = 1.73.
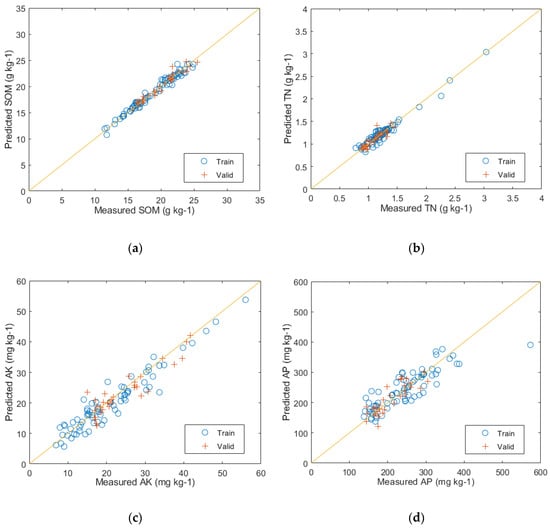
Figure 9.
The predictive results of the PLSR model: (a) SOM prediction results; (b) TN prediction results; (c) AK prediction results; and (d) AP prediction results.
After comparing the results of the two models, it can be seen that the PLSR model achieved higher R2 values for predicting SOM, TN, AK, and AP, with an increase of 8, 10, 7, and 10 percentage points, respectively, in contrast to the RF model. Additionally, the PLSR model had lower RMSE values and demonstrated better RPD performance. Furthermore, from the result figures, it can be visually observed that the positions of the training and validation set samples in Figure 9a–d corresponding to the PLSR-predicted SOM, TN, AK, and AP, respectively, exhibit significantly better fitting than those in Figure 8a–d corresponding to the RF-predicted results. This indicates that the PLSR model outperforms the RF model in predicting the major nutrient content of soil.
3.3. Comparison of Soil Nutrient Detection Methods
To validate the effectiveness of our multi-spectral technology combined with the thermal decomposition–electronic nose method for detecting soil nutrient content, we conducted a comparison with a method that uses a single electronic nose for detecting soil nutrient content, as shown in Table 7. The results demonstrate that our proposed fused feature space modeling approach outperforms feature space modeling based on the response of a single electronic nose. Specifically, for predicting SOM, our R2 value improved by 5 percentage points, and the RMSE was reduced by 5.37 compared to the results reported in reference [46]. Similarly, for TN prediction, our R2 value improved by 2 percentage points and the error decreased by 0.15 compared to the results reported in reference [47]. Furthermore, our prediction accuracy for AK and AP was 0.84 and 0.73, respectively, representing improvements of 5 and 15 percentage points, respectively, compared to the results reported in reference [48]. These findings demonstrate that the fused features obtained from the integration of multiple sources of data in this study effectively compensate for the limited accuracy of the single electronic nose detection method for AK and AP. It verifies the feasibility of the proposed approach in this study.
Table 7.
Comparison with single e-nose detection methods from other studies.
To further validate the effectiveness of the soil nutrient content detection method proposed in this study, its performance was compared with two commonly used methods (spectroscopy and remote sensing) for soil nutrient content detection. The results of this comparison are presented in Table 8. Proximal spectral detection technology exhibits higher accuracy compared to remote sensing methods. This is attributed to the fact that remote sensing methods acquire images of large land areas from a macroscopic perspective and predict soil nutrient content by extracting indices related to soil nutrients. However, the detection process is influenced by factors such as cloud cover and spatial resolution, resulting in lower detection accuracy [49,50]. Spectral methods characterize soil nutrient content by acquiring microscopic soil spectral reflection information. The prediction accuracy for SOM content can reach above 0.90 [51]. However, spectral methods are influenced by factors such as soil sample particle size and detection environment. Wang utilized spectral methods to detect available potassium in soil, with a prediction accuracy R2 of only 0.49 for AK content [52], which is much lower than the prediction accuracy of this study. In the study of soil nutrient content, spectroscopy and remote sensing methods are mostly based on soil organic matter, with limited research on nitrogen, phosphorus, and potassium in soil. This paper investigates the content of soil nutrients, including SOM, TN, AK, and AP, laying the theoretical foundation for further soil nutrient content detection.
Table 8.
Comparison with commonly used methods for detecting soil nutrient content.
4. Conclusions
In this study, a data fusion method based on a multispectral combined electronic nose is proposed. Soil spectral index features were data fused with electronic nose response features. By utilizing algorithm optimization to construct the optimal feature space, a soil nutrient content prediction model is built, enabling high-precision prediction of SOM, TN, AK, and AP content in soil nutrients. The main conclusions were as follows:
- (1)
- The correlation heatmap between spectral index features and SOM, TN, AK, and AP showed a certain degree of correlation between spectral indices and soil nutrients, with each feature exhibiting varying degrees of correlation with different nutrients. This indicates that spectral indices can effectively utilize multispectral images of soil.
- (2)
- The modeling results indicate that the utilization of multispectral technology can assist electronic nose techniques in achieving higher precision prediction of soil nutrient content. Compared with other studies, whether employing single electronic nose methods or conventional detection techniques, the performance of the multi-source feature fusion method proposed in this study demonstrates superiority. Additionally, it significantly reduces the prediction cost of soil nutrient content, paving the way for new avenues in subsequent research on soil nutrient detection.
- (3)
- Compared to existing methods that primarily focus on predicting SOM content, this study also achieved the prediction of two nutrients (AK and AP) that, although they represent a small proportion of soil nutrients, are nevertheless important. This lays the theoretical foundation for multi-nutrient detection methods in soil. Although the prediction accuracy of AK and AP in this study meets the requirements of general agriculture, further research is needed to develop higher-precision detection methods to enhance the prediction accuracy of AK and AP content, aiming for precision and intelligent agricultural practices.
Author Contributions
Conceptualization, Methodology, Writing-original draft, L.F.; Software, Conceptualization, S.L.; Methodology, Funding acquisition, D.H.; Resources, Formal analysis, J.W.; Supervision, Formal analysis, X.J.; Writing—review and editing, G.W. All authors have read and agreed to the published version of the manuscript.
Funding
This research was financially supported by the National Key Research and Development Program (grant number 2023YFD1500404) and the Jilin Scientific and Technological Development Program (grant number 20230202045NC).
Institutional Review Board Statement
Not applicable.
Data Availability Statement
Data are contained within the article.
Conflicts of Interest
The authors declare no conflicts of interest.
References
- Beltrame, K.K.; Souza, A.M.; Coelho, M.R.; Winkler, T.C.B.; Souza, W.E.; Valderrama, P. Soil Organic Carbon Determination Using NIRS: Evaluation of Dichromate Oxidation and Dry Combustion Analysis as Reference Methods in Multivariate Calibration. J. Braz. Chem. Soc. 2016, 27, 1527–1532. [Google Scholar] [CrossRef]
- Zhao, L.; Liu, X.; Wang, Y.; Ren, T. Thermal analysis determining soil organic matter content and thermal stability. Trans. Chin. Soc. Agric. Eng. 2016, 32, 105–114. [Google Scholar]
- Traoré, S.; Thiombiano, L.; Millogo, J.R.; Guinko, S. Carbon and nitrogen enhancement in Cambisols and Vertisols by Acacia spp. in eastern Burkina Faso: Relation to soil respiration and microbial biomass. Appl. Soil Ecol. 2007, 35, 660–669. [Google Scholar] [CrossRef]
- Abril, A.; Noe, L.; Casado-Murillo, N.; Kopp, S. Non-Symbiotic N2 Fixation in Soil, Litter and Phyllosphere in the Arid-Semiarid Region of Central Argentina; Nova Science Publishers, Inc.: Hauppauge, NY, USA, 2008. [Google Scholar]
- Xin, J.; Zheng, L.; Zhong, H.; Huang, Y.; Lv, Y.; Wang, X. Soil Testing Part 7: Determination of Available Phosphorus in Soil: NY/T 1121.7-2014; Ministry of Agriculture of the People’s Republic of China: Beijing, China, 2014. [Google Scholar]
- Ren, Y. Comparison of two detection methods for determining available phosphorus in weakly acidic soil. Shanxi Chem. Ind. 2023, 43, 79–80+93. [Google Scholar]
- Gong, N.; Deng, F.; Li, G.; Pan, S. Analysis of Soil Fertilizer Testing Technology. China Pet. Chem. Stand. Qual. 2017, 37, 29–30. [Google Scholar]
- He, X.; Yang, L.; Li, A.; Zang, L.; Shen, F.; Cai, Y.; Zhou, C. Soil organic carbon prediction using phenological parameters and remote sensing variables generated from Sentinel-2 images. Catena 2021, 205, 105442. [Google Scholar] [CrossRef]
- Sorenson, P.T.; Kiss, J.; Bedard-Haughn, A.K.; Shirtliffe, S. Multi-Horizon Predictive Soil Mapping of Historical Soil Properties Using Remote Sensing Imagery. Remote Sens. 2022, 14, 5803. [Google Scholar] [CrossRef]
- Gholizadeh, A.; Žižala, D.; Saberioon, M.; Borůvka, L. Soil organic carbon and texture retrieving and mapping using proximal, airborne and Sentinel-2 spectral imaging. Remote Sens. Environ. 2018, 218, 89–103. [Google Scholar] [CrossRef]
- Boyan, K.; Yucel, T.; Abdul, M.M. Comparison between artificial neural network and partial least squares for on-line visible and near infrared spectroscopy measurement of soil organic carbon, pH and clay content. Soil Tillage Res. 2015, 146, 243–252. [Google Scholar]
- Sithole, N.J.; Khayelihle, N.; Magwaza, L.S. Robust Vis-NIRS models for rapid assessment of soil organic carbon and nitrogen in Feralsols Haplic soils from different tillage management practices. Comput. Electron. Agric. 2018, 153, 295–301. [Google Scholar] [CrossRef]
- Tümsavaş, Z.; Tekin, Y.; Ulusoy, Y.; Mouazen, A.M. Prediction and mapping of soil clay and sand contents using visible and near-infrared spectroscopy. Biosyst. Eng. 2019, 177, 90–100. [Google Scholar] [CrossRef]
- Levi, N.; Karnieli, A.; Paz-Kagan, T. Using reflectance spectroscopy for detecting land-use effects on soil quality in drylands. Soil Tillage Res. 2020, 199, 104571. [Google Scholar] [CrossRef]
- Tang, H.; Meng, X.; Su, X.; Ma, T.; Liu, H.; Bao, Y. Hyperspectral prediction of organic matter in different types of soil based on CARS algorithm. J. Agric. Eng. 2021, 37, 105–113. [Google Scholar]
- Zhang, X.; Meng, X.; Tang, H.; Liu, H.; Zhang, X.; Liu, Q. A stochastic forest prediction model for soil organic matter with optimized spectral input. J. Agric. Eng. 2023, 39, 90–99. [Google Scholar]
- Vijayarangan, S.; Wettergreen, D. Assisting Spectral Mapping Using Cameras. In Proceedings of the 2023 IEEE/RSJ International Conference on Intelligent Robots and Systems (IROS), Detroit, MI, USA, 1–5 October 2023; pp. 10723–10728. [Google Scholar]
- Logie, G.S.J.; Coburn, C.A. An investigation of the spectral and radiometric characteristics of low-cost digital cameras for use in UAV remote sensing. Int. J. Remote Sens. 2018, 39, 4891–4909. [Google Scholar] [CrossRef]
- Bousefsaf, F.; Tamaazousti, M.; Said, S.H.; Michel, R. Image completion using multispectral imaging. IET Image Process. 2018, 12, 1164–1174. [Google Scholar] [CrossRef]
- Tan, L.; Feng, Z.; Zheng, H.; Yao, Z.; Weng, X.; Wang, F.; Chang, Z. Development Trend of Electronic Nose Technology in Closed Cabins Gas Detection: A Review. Appl. Sci. 2022, 12, 9326. [Google Scholar] [CrossRef]
- Zhu, L.; Jia, H.; Chen, Y.; Wang, Q.; Li, M.; Huang, D.; Bai, Y. A Novel Method for Soil Organic Matter Determination by Using an Artificial Olfactory System. Sensors 2019, 19, 3417. [Google Scholar] [CrossRef]
- Zhu, L.; Li, M.; Xia, X.; Huang, D.; Jia, H. Research on soil organic matter detection method based on artificial olfactory system. J. Agric. Mach. 2020, 51, 171–179. [Google Scholar]
- Zhu, L. Research on Soil Organic Matter Content Determination Method Based on Artificial Olfactory Technology. Ph.D. Thesis, Jilin University, Changchun, China, 2020. [Google Scholar]
- Li, M.; Zhu, Q.; Xia, X.; Liu, H.; Huang, D. Soil organic matter content detection method based on multi-sensor artificial olfactory system. J. Agric. Mach. 2021, 52, 109–119. [Google Scholar]
- Li, M. Research on Soil Organic Matter and Total Nitrogen Detection Methods Based on Thermal Decomposition and Artificial Olfaction. Ph.D. Thesis, Jilin University, Changchun, China, 2023. [Google Scholar]
- Vancampenhout, K.; De Vos, B.; Wouters, K.; Van Calster, H.; Swennen, R.; Buurman, P.; Deckers, J. Determinants of soil organic matter chemistry in maritime temperate forest ecosystems. Soil Biol. Biochem. 2010, 42, 220–233. [Google Scholar] [CrossRef]
- Ma, S.; Deji, Y.; Qin, X.; Chen, Y.; Hu, Y.; Wang, Z.; Lu, X. Chemical study of soil organic matter based on pyrolysis gas chromatography-mass spectrometry (Py-GC/MS) technology. J. Zhejiang AF Univ. 2021, 38, 985–999. [Google Scholar]
- Wang, X.; Deng, S.; Tan, H.; Adeosun, A.; Vujanović, M.; Yang, F.; Duić, N. Synergetic effect of sewage sludge and biomass co-pyrolysis: A combined study in thermogravimetric analyzer and a fixed bed reactor. Energy Convers. Manag. 2016, 118, 399–405. [Google Scholar] [CrossRef]
- Schulten, H.R.; Sorge, C.; Schnitzer, M. Structural studies on soil nitrogen by Curie-point pyrolysis—Gas chromatography/mass spectrometry with nitrogen-selective detection. Biol. Fertil. Soils 1995, 20, 174–184. [Google Scholar] [CrossRef]
- Ji, W.; Shi, Z.; Zhou, Q.; Zhou, L. Visible and Near-Infrared (VIS-NIR) Spectral Characteristics of Different Types of Soils and Organic Matter Response Bands. J. Infrared Millim. Waves 2012, 31, 277–282. [Google Scholar] [CrossRef]
- Fan, P.; Chu, D.; Wang, H.; Li, Y.; Liu, Y. Visible-Near Infrared Reflectance Spectral Characteristics of Soil Phosphorus Fractions and Their Spectral Analysis. Spectrosc. Spectr. Anal. 2023, 43, 73–74. [Google Scholar]
- Zhao, J.; Shi, Y.; Tan, Z.; Pan, B.; Huang, X.; Tang, J. Study on Hyperspectral Inversion Model of Available Potassium Content in Red Soil of Eucalyptus Plantation in Northern Guangxi. Anhui Agric. Sci. 2021, 49, 154–156+192. [Google Scholar]
- Lu, Y.; Bai, Y.; Wang, L.; Wang, H.; Yang, L. Hyperspectral Prediction Analysis of Total Nitrogen Content in Black Soil. Trans. Chin. Soc. Agric. Eng. 2010, 26, 256–261. [Google Scholar]
- Biney, J.K.M.; Saberioon, M.; Borůvka, L.; Houška, J.; Vašát, R.; Agyeman, P.C.; Coblinski, J.A.; Klement, A. Exploring the suitability of USA-based multispectral images for estimating soil organic carbon: Comparison with proximal soil sensing and spaceborne imagery. Remote Sens. 2021, 13, 308. [Google Scholar] [CrossRef]
- Heil, J.; Jörges, C.; Stumpe, B. Fine-scale mapping of soil organic matter in agricultural soils using UAVs and machine learning. Remote Sens. 2022, 14, 3349. [Google Scholar] [CrossRef]
- Xu, D. Research on Rapid Acquisition and Management Zoning of Farmland Soil Information Based on Multi-Source Information Fusion of Satellite and Ground. Ph.D. Thesis, Zhejiang University, Hangzhou, China, 2021. [Google Scholar]
- Rouse, J.W.; Haas, J.R.H.; Schell, J.A.; Deering, D.W. Monitoring vegetation systems in the Great Plains witherts. In Proceedings of the 3rd ERTS Symposium, Washington, DC, USA, 10–14 December 1974. [Google Scholar]
- Huete, A.; Didan, K.; Miura, T.; Rodriguez, E.P.; Gao, X.; Ferreira, L.G. Overview of the radiometric and biophysical performance of the MODIS. Remote Sens. Environ. 2002, 83, 195–213. [Google Scholar] [CrossRef]
- Gitelson, A.; Merzlyak, M.N. Spectral reflectance changes associated with autumn senescence of Aesculus hippocastanum L. and Acer platanoides L. leaves Spectral features and relation to chlorophyll estimation. J. Plant Physiol. 1994, 143, 286–292. [Google Scholar] [CrossRef]
- Jordan, C.F. Derivation of leaf-area index from quality of light on forest floor. Ecology 1969, 50, 663–666. [Google Scholar] [CrossRef]
- Qi, J.; Chehbouni, A.; Huete, A.R.; Kerr, Y.H.; Sorooshian, S. A modified soil adjusted vegetation index. Remote Sens. Environ. 1994, 48, 119–126. [Google Scholar] [CrossRef]
- Nellis, M.D.; Briggs, J.M. Transformed vegetation index for measuring spatial variation in drought impactedbiomass on Konza Prairie, Kansas. Trans. Kans. Acad. Sci. 1992, 95, 93–99. [Google Scholar] [CrossRef]
- Escadafal, R. Remote sensing of arid soil surface color with Landsat Thematic Mapper. Adv. Space Res. 1989, 9, 159–163. [Google Scholar] [CrossRef]
- Wang, S.; Guan, K.; Zhang, C.; Zhang, C.; Lee, D.; Margenot, A.J.; Ge, Y.; Peng, J.; Zhou, W.; Zhou, Q.; et al. Using soil library hyperspectral reflectance and machine learning to predict soil organic carbon: Assessing potential of airborne and spaceborne optical soil sensing. Remote Sens. Environ. 2022, 271, 112914. [Google Scholar] [CrossRef]
- Mruthyunjaya, P.; Shetty, A.; Umesh, P.; Gomez, C. Impact of atmospheric correction methods parametrization on soil organic carbon estimation based on hyperion hyperspectral data. Remote Sens. 2022, 14, 5117. [Google Scholar] [CrossRef]
- Xia, X.; Li, M.; Liu, H.; Zhu, Q.; Huang, D. Soil Organic Matter Detection Based on Pyrolysis and Electronic Nose Combined with Multi-Feature Data Fusion Optimization. Agriculture 2022, 12, 1540. [Google Scholar] [CrossRef]
- Li, M.; Xia, X.; Zhu, Q.; Liu, H.; Huang, D.; Wang, G. Soil total nitrogen detection method and feature optimization based on thermal decomposition and electronic nose. J. Agric. Eng. 2021, 37, 73–84. [Google Scholar]
- Liu, H. Design and Optimization of a Soil Major Nutrient Detection System BASED on Thermal Decomposition and Olfactory Information. Ph.D. Thesis, Jilin University, Changchun, China, 2023. [Google Scholar]
- He, S.; Tan, S.; Shen, L.; Zhou, Q. Soil Organic Matter Estimation Model Integrating Spectral and Profile Features. Sensors 2023, 23, 9868. [Google Scholar] [CrossRef] [PubMed]
- Wang, W.; Zhang, Y.; Li, Z.; Liu, Q.; Feng, W.; Chen, Y.; Jiang, H.; Liang, H.; Chang, N. Fourier-Transform Infrared Spectral Inversion of Soil Available Potassium Content Based on Different Dimensionality Reduction Algorithms. Agronomy 2023, 13, 617. [Google Scholar] [CrossRef]
- Zhou, T.; Geng, Y.; Chen, J.; Sun, C.; Haase, D.; Lausch, A. Mapping of Soil Total Nitrogen Content in the Middle Reaches of the Heihe River Basin in China Using Multi-Source Remote Sensing-Derived Variables. Remote Sens. 2019, 11, 2934. [Google Scholar] [CrossRef]
- Gasmi, A.; Gomez, C.; Chehbouni, A.; Dhiba, D.; Gharous, M.E. Using PRISMA hyperspectral satellite imagery and GIS approaches for soil fertility mapping (FertiMap) in northern Morocco. Remote Sens. 2022, 14, 4080. [Google Scholar] [CrossRef]
Disclaimer/Publisher’s Note: The statements, opinions and data contained in all publications are solely those of the individual author(s) and contributor(s) and not of MDPI and/or the editor(s). MDPI and/or the editor(s) disclaim responsibility for any injury to people or property resulting from any ideas, methods, instructions or products referred to in the content. |
© 2024 by the authors. Licensee MDPI, Basel, Switzerland. This article is an open access article distributed under the terms and conditions of the Creative Commons Attribution (CC BY) license (https://creativecommons.org/licenses/by/4.0/).