Abstract
The aim of this study was to determine the impact of different crop production systems (organic, integrated, and conventional) on the yields of several spring wheat (Triticum aestivum L.) cultivars. A field experiment was carried out at the Agricultural Experimental Station of the Institute of Soil Science and Plant Cultivation in Osiny (Poland) in three consecutive growing seasons (2014, 2015, and 2016). Two factors were included in the experiment: the crop production system (organic, integrated, and conventional) and spring wheat cultivars (Kandela, Izera, Ostka Smolicka, and Waluta). The crop production system significantly differentiated the yield, health, and weed infestation of the spring wheat. Wheat yield in the conventional system (6.12 t·ha−1) was higher than in the organic system (3.68 t·ha−1) by 67%, whereas, in the integrated system (7.61 t·ha−1), it was greater than in the organic system by 109%. The lower yields in the organic system were mainly due to fewer ears per m2 and a smaller 1000-grain weight. In the organic system, we also observed a higher infestation of wheat by foliar fungal pathogens and weeds compared with the conventional and integrated systems. The spring wheat cultivars differed in yield structure and resistance to infestation by fungal pathogens. The Waluta and Izera cultivars performed well in all systems but yielded the best in the integrated and conventional ones. The Kandela cultivar was the most suitable for the organic system, as it achieved the highest yield (4.16 t·ha−1). This was mainly due to its ability to form a compact canopy with relatively high ear density, a large 1000-grain weight, and the highest resistance to fungal pathogens. The results for cultivars’ performance in the organic system may be useful for farmers in decreasing yield gaps in relation to integrated and conventional systems.
1. Introduction
Wheat is one of the most widespread crops in most parts of the world, from near-arctic to near-equatorial latitudes [1]. It is the most important species among the cereals by area planted and is followed in importance by maize, barley, and sorghum. The amount of wheat on the global market exceeds that of all other cereals [1]. In 2023, the world wheat grain harvest was 0.8 billion tonnes. The top producers of wheat are China (18% of world production) and India (15%) [2]. About 95% of the wheat produced worldwide is common wheat (Triticum aestivum L.). The importance of wheat in crop production is due to its ability to be grown in different climatic zones, its high yield potential, the chemical composition of the grain, and its technological properties, which allow for a wide range of consumer, feed, and industrial uses [3,4].
In addition to soil and climatic conditions, wheat yields are influenced by genetic factors and the applied crop management system (high-input conventional, low-input conventional (integrated), or organic) [5,6,7]. Conventional wheat cultivation based on the high consumption of synthetic mineral fertilisers and chemical plant protection products is widely used in many, mainly developed, countries. Such a system ensures high yields but is also associated with many environmental and consumer health safety risks [8,9]. High-input conventional agriculture is largely responsible for the degradation of the natural environment, the overproduction of food, and a decline in consumer confidence in food quality [8]. Consequently, recent years have seen the development of more environmentally friendly systems, such as conventional low-input (integrated) and organic systems [10,11,12]. In the integrated system, the application of nitrogen fertilisation is usually reduced by 30–40% compared with the high-input conventional system, and the doses are adjusted to the needs of crops. Crop protection treatments are applied depending on the action threshold for particular pathogens [7].
Organic farming is a system aimed at producing food with minimal harm to ecosystems, animals, and humans [13]. It uses only natural production methods and inputs in order to produce high-quality food while maintaining biological balance in the environment [14]. The European Union Field to Fork strategy has set the goal of increasing the area of organic farming to 25% by 2030 [15]. However, critics argue that organic agriculture may have lower yields, and therefore, we would need more land to produce the same amount of food as conventional farms, resulting in more widespread deforestation and biodiversity loss, thus undermining the environmental benefits of organic practices [13]. A key issue in the debate on the contribution of organic agriculture to the future of world agriculture is whether organic agriculture can produce sufficient food to feed the world. Comparisons of organic and conventional production systems in the context of crop yielding play a central role in this debate [16].
Another important factor influencing grain yield is the selection of the proper cultivar, which is particularly important in the organic system. Cereal cultivars differ in terms of their genetic yield potential and other traits, such as resistance to pathogens and pests, competitiveness against weeds, and nutrient uptake efficiency [6,7,17,18]. This enables farmers to select a wheat cultivar adapted to the climatic and soil conditions, the intensity of crop management, the expected yield, and its functional type [3,4,7,19,20]. For the last 50 years, as conventional agriculture has developed, cereal breeding has focused on the selection of cultivars with a high yielding potential in conditions involving the high use of pesticides and synthetic fertilizers. Cereal cultivars that are useful for organic systems where pesticides are forbidden should have, however, other traits, i.e., the significant ability to compete with weeds, resistance to fungal pathogens, and a good ability to uptake nutrients [18,19,20]. According to Ponti et al. [16], the factors limiting organic yields need to be more fully understood while also taking into account the social, environmental, and economic benefits of organic farming.
The aim of this study was to determine the impact of different crop production systems on the performance of selected cultivars of spring common wheat (Triticum aestivum L.).
2. Materials and Methods
2.1. Characteristics of the Field Experiment
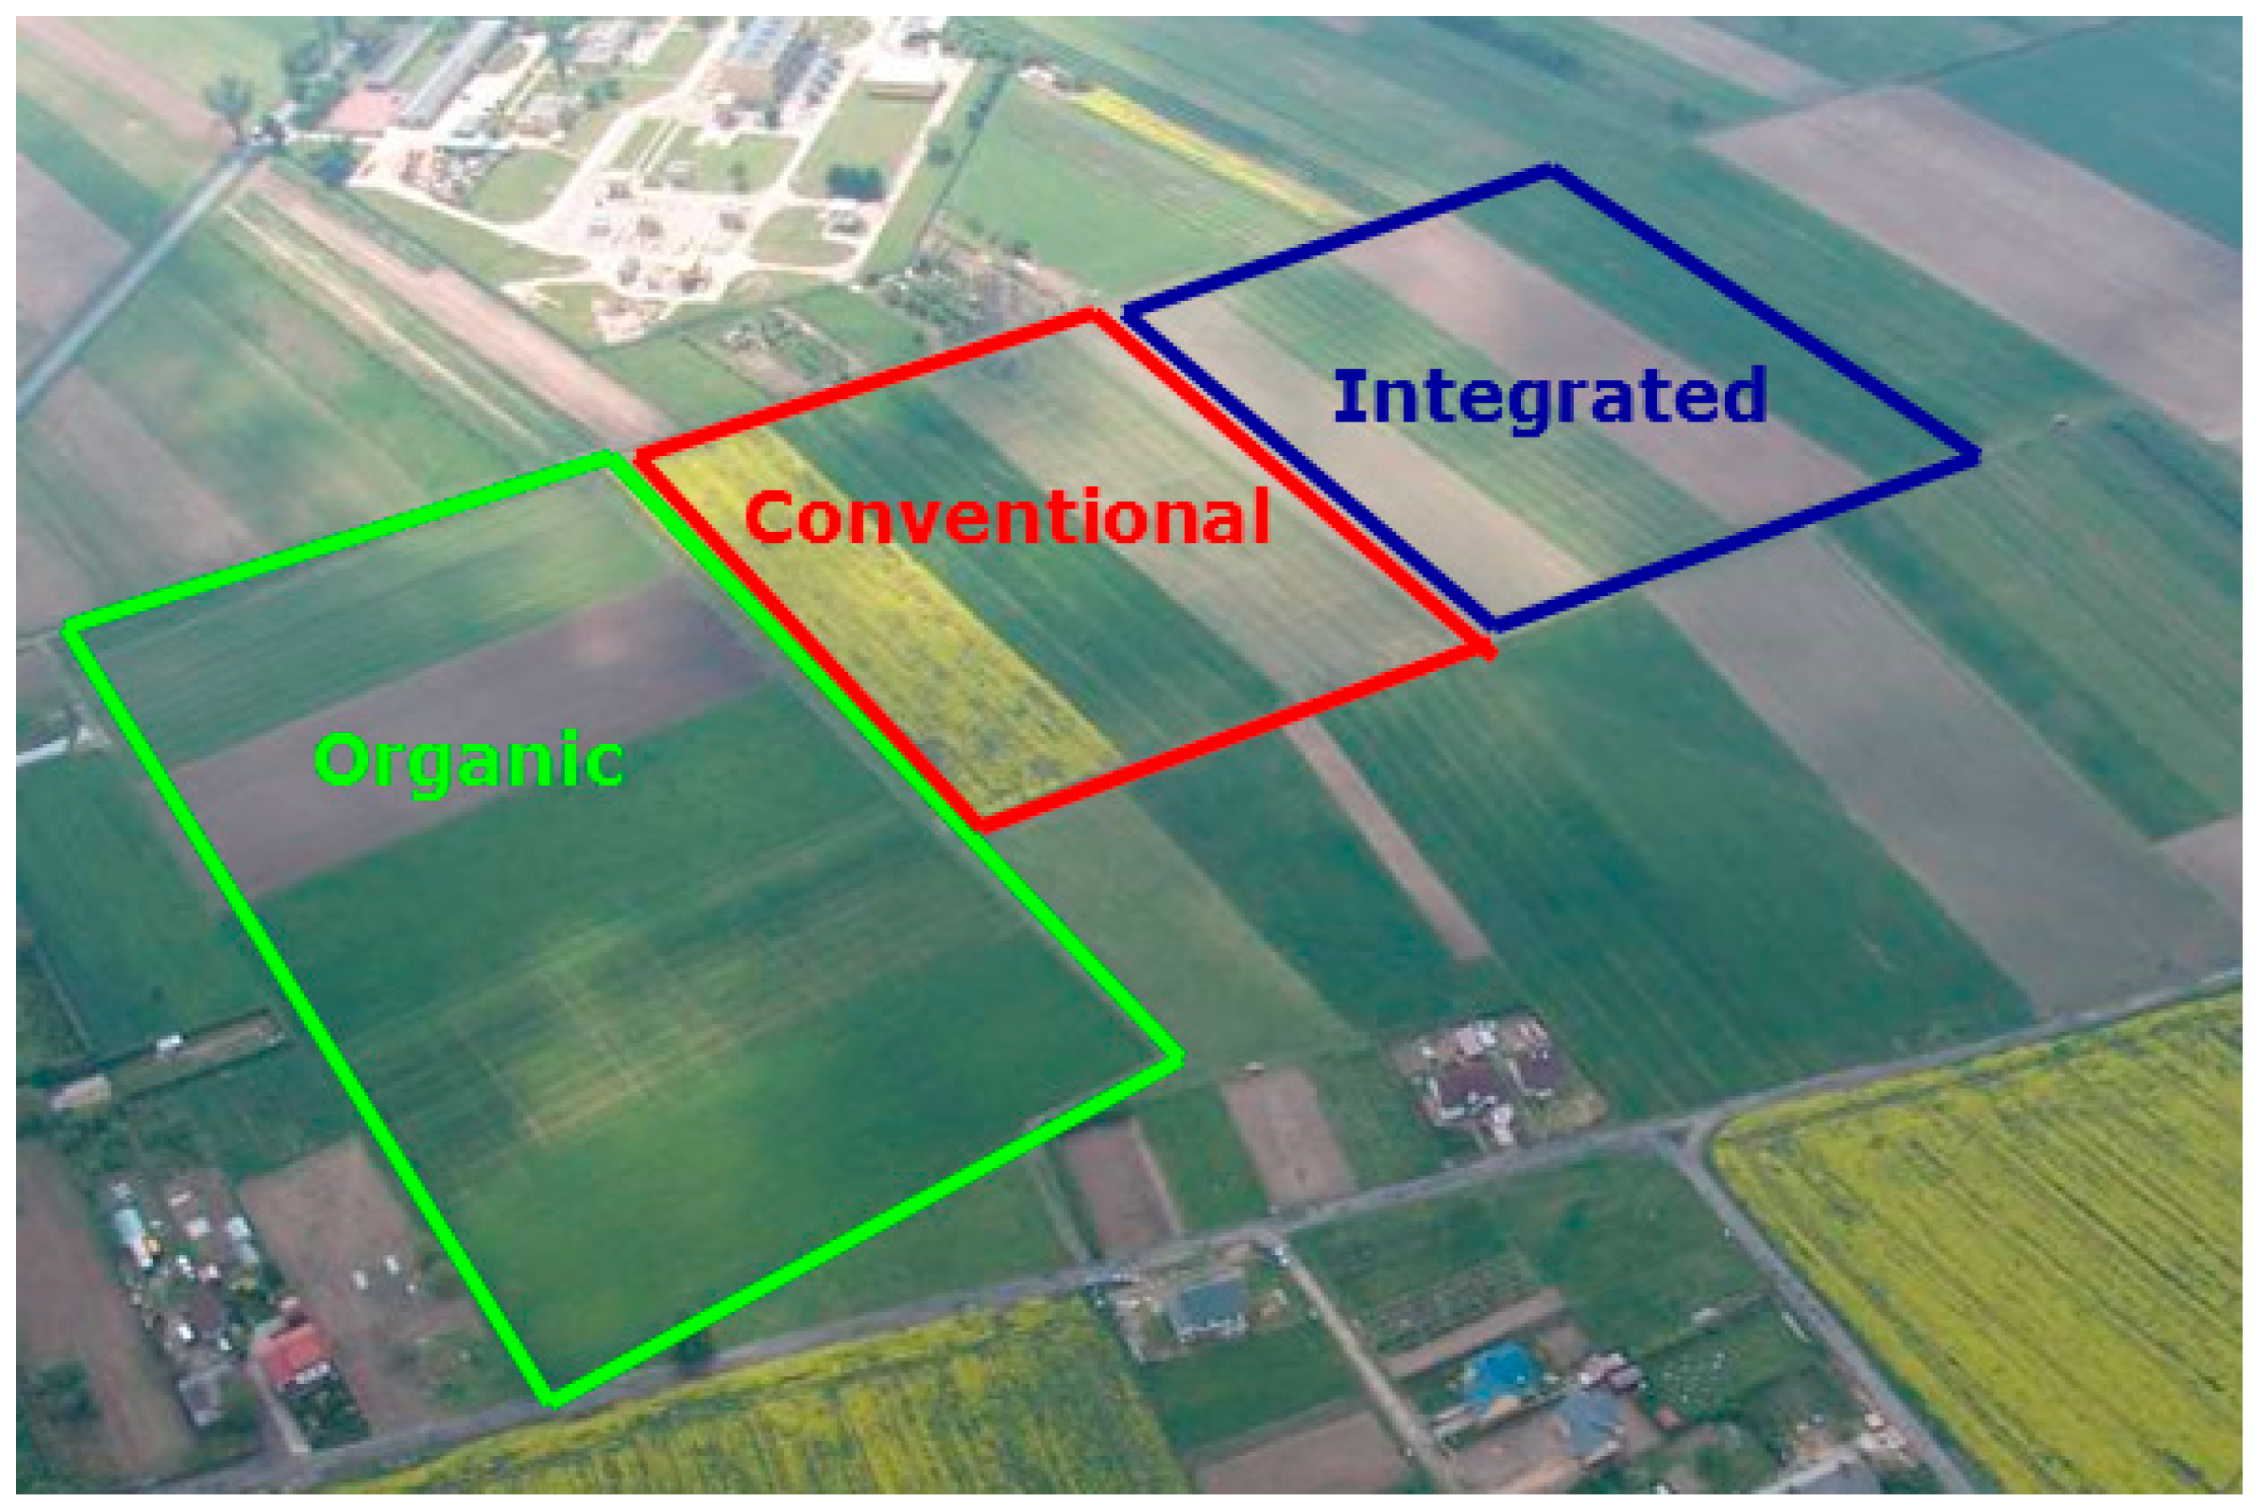
This study was conducted in 2014–2016 at the Agricultural Research Station of the Institute of Soil Science and Plant Cultivation—State Research Institute (IUNG-PIB) in Osiny (Poland, Lublin Voivodeship; N: 51°28′, E: 22°30′) in a long-term experiment (since 1994) comparing different crop production systems: organic, integrated, and conventional (Scheme 1). The soil was Haplic Luvisol with a loamy sand texture. It was characterised by a slightly acidic reaction (pHKCl = 5.6) and an average phosphorus and potassium content. The humus content in the soil was 1.5%.
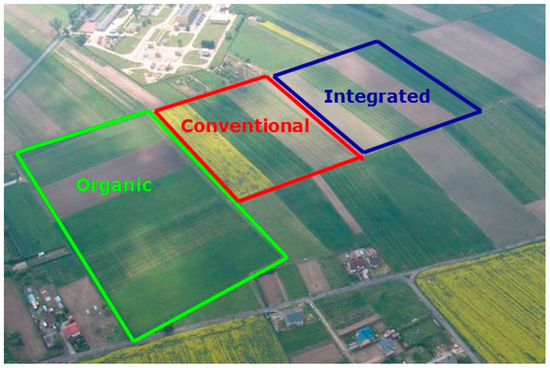
Scheme 1.
Scheme of the experiment with different crop production systems. Source: own figure.
The concept of this experiment follows the methodology proposed in other research centres and has been described in earlier publications [21,22]. The experiment was divided into separate fields representing particular crop production systems. The size of each crop field in the rotation was 1 ha, which reflects the real crop production conditions. The experiment was carried out with all crops cultivated at the same time, which made it possible to obtain full information from all fields in each year.
The compared systems differed in crop rotation; organic and mineral fertilisation; and crop protection against weeds, diseases, and pests (Table 1 and Table 2). In each crop production system (organic, conventional, and integrated), spring wheat was cultivated every year (Table 1). Within each field of spring wheat, a split-plot experiment with four cultivars was established in four blocks with treatments randomized. The following four spring wheat cultivars were selected from the Common Catalogue of Cultivars of Agricultural Plant Species [23]: Izera, Kandela, Ostka Smolicka, and Waluta were cultivated in each system in four replications. The area of each plot of replication was 30 m2 at sowing and 25 m2 during harvest. Sowing was performed in accordance with good agricultural practice at the optimum time for the region. Traditional soil tillage based on ploughing was applied in all systems. The sowing period was the first decade of April, and the sowing rates were the same for each cultivar—450 grains per m−2. The row spacing was 12 cm, and the planting depth was 3.5 cm. Harvests took place in the first decade of August using a plot harvester.

Table 1.
Management of spring wheat in different crop production systems in 2014–2016.
Table 2.
Plant protection products used in different crop production systems in 2014–2016.
2.2. Weather Conditions
The weather conditions during the growing seasons of 2014–2016 are presented in Table 3. In 2014, high precipitation occurred in May, more than 3 times higher than the multi-annual average. In 2015, from June to August, a severe drought occurred, with temperatures higher than the long-term average. The 2016 growing season was warm and dry. The temperature from March to August exceeded the long-term average, and the amount of precipitation was below the mean (Table 3).
Table 3.
Total precipitation and average monthly temperatures during the growing seasons of 2014–2016.
2.3. Assessment of Leaf Infestation by Fungal Pathogens
The three uppermost leaves were scored for infestation rate with the following fungal pathogens: Puccinia recondita Dietel and Holw. (brown rust), Puccinia striiformis Schwein. (yellow rust), Drechslera tritici-repentis (Died.) Shoem. (wheat tan spot), Septoria sp. (septoriosis), and Blumeria graminis (DC.) Speer (powdery mildew). The observations were performed at the milk–dough stage (BBCH 77–83). For the phytopathological analysis, three upper leaves were taken from 10 plants in four repetitions. The percentage of leaf-blade surface damaged by fungal pathogens was then determined. The sum of infections by particular pathogens was used as the variable characterizing infection. The method of assessment of leaf infestation was in line with EPPO recommendations [24].
2.4. Assessment of Weed Infestation
The number of weeds and their dry matter were analysed at the dough stage of spring wheat (BBCH 85–87) using the weight-counting method in an area of 0.5 × 1 m at each plot of replication. Dry matter of weeds was determined after drying at 40 °C for 7 days.
2.5. Determination of the Grain Yield
Grain yield was determined after harvest using a special small harvester for the plot area of 25 m2 and then converted per t ha−1 at 15% moisture content. Ear density was determined from an area of 0.5 m2 and then converted per 1 m2.
2.6. Statistical Analysis
The results were statistically analysed using STATISTICA ver. 13.1 (StatSoft, Inc., Tulsa, OK, USA). In order to compare the influence of crop production systems (n = 3), cultivars (n = 4), and their interaction effects on wheat performance, a two-way analysis of variance ANOVA was used. The significance of the mean differences of the study factors was evaluated using a post hoc Tukey’s test at a significance level of α = 0.05. The assumption of normality of the layouts was checked, and the homogeneity of variances was checked using Levene’s test. All study traits met the above assumptions for the ANOVA and Tukey’s test.
3. Results
The grain yield was significantly influenced by the year, genotype (cultivar), and crop production system (Table 4). The lowest spring wheat yields were obtained in 2016 (5.50 t·ha−1), and the highest yields were obtained in 2015 (6.11 t·ha−1). The limiting factor for wheat growth in 2016 was the rainfall deficit from April to July (Table 3), which had an impact leading to lower ear density and poorer grain maturity (Table 4).
Table 4.
The impact of year, production system, and cultivar on grain yield, yield structure, and coefficient of variations (in brackets).
The highest grain yield was obtained in the integrated system (7.61 t·ha−1). and the lowest was obtained under organic production conditions (3.68 t·ha−1) (Table 4). Wheat yield in the conventional system was higher than in the organic system by 67%, whereas, in the integrated system, it was higher by 109% (Figure 1).
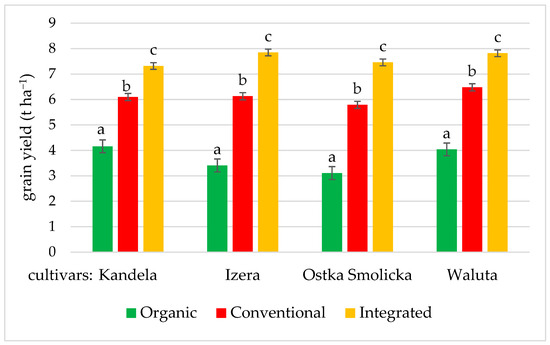
Figure 1.
Impact of crop production system on the grain yield of 4 spring wheat cultivars (bars represent standard errors). Different letters correspond to significant differences between systems according to Tukey’s test at p ≤ 0.05.
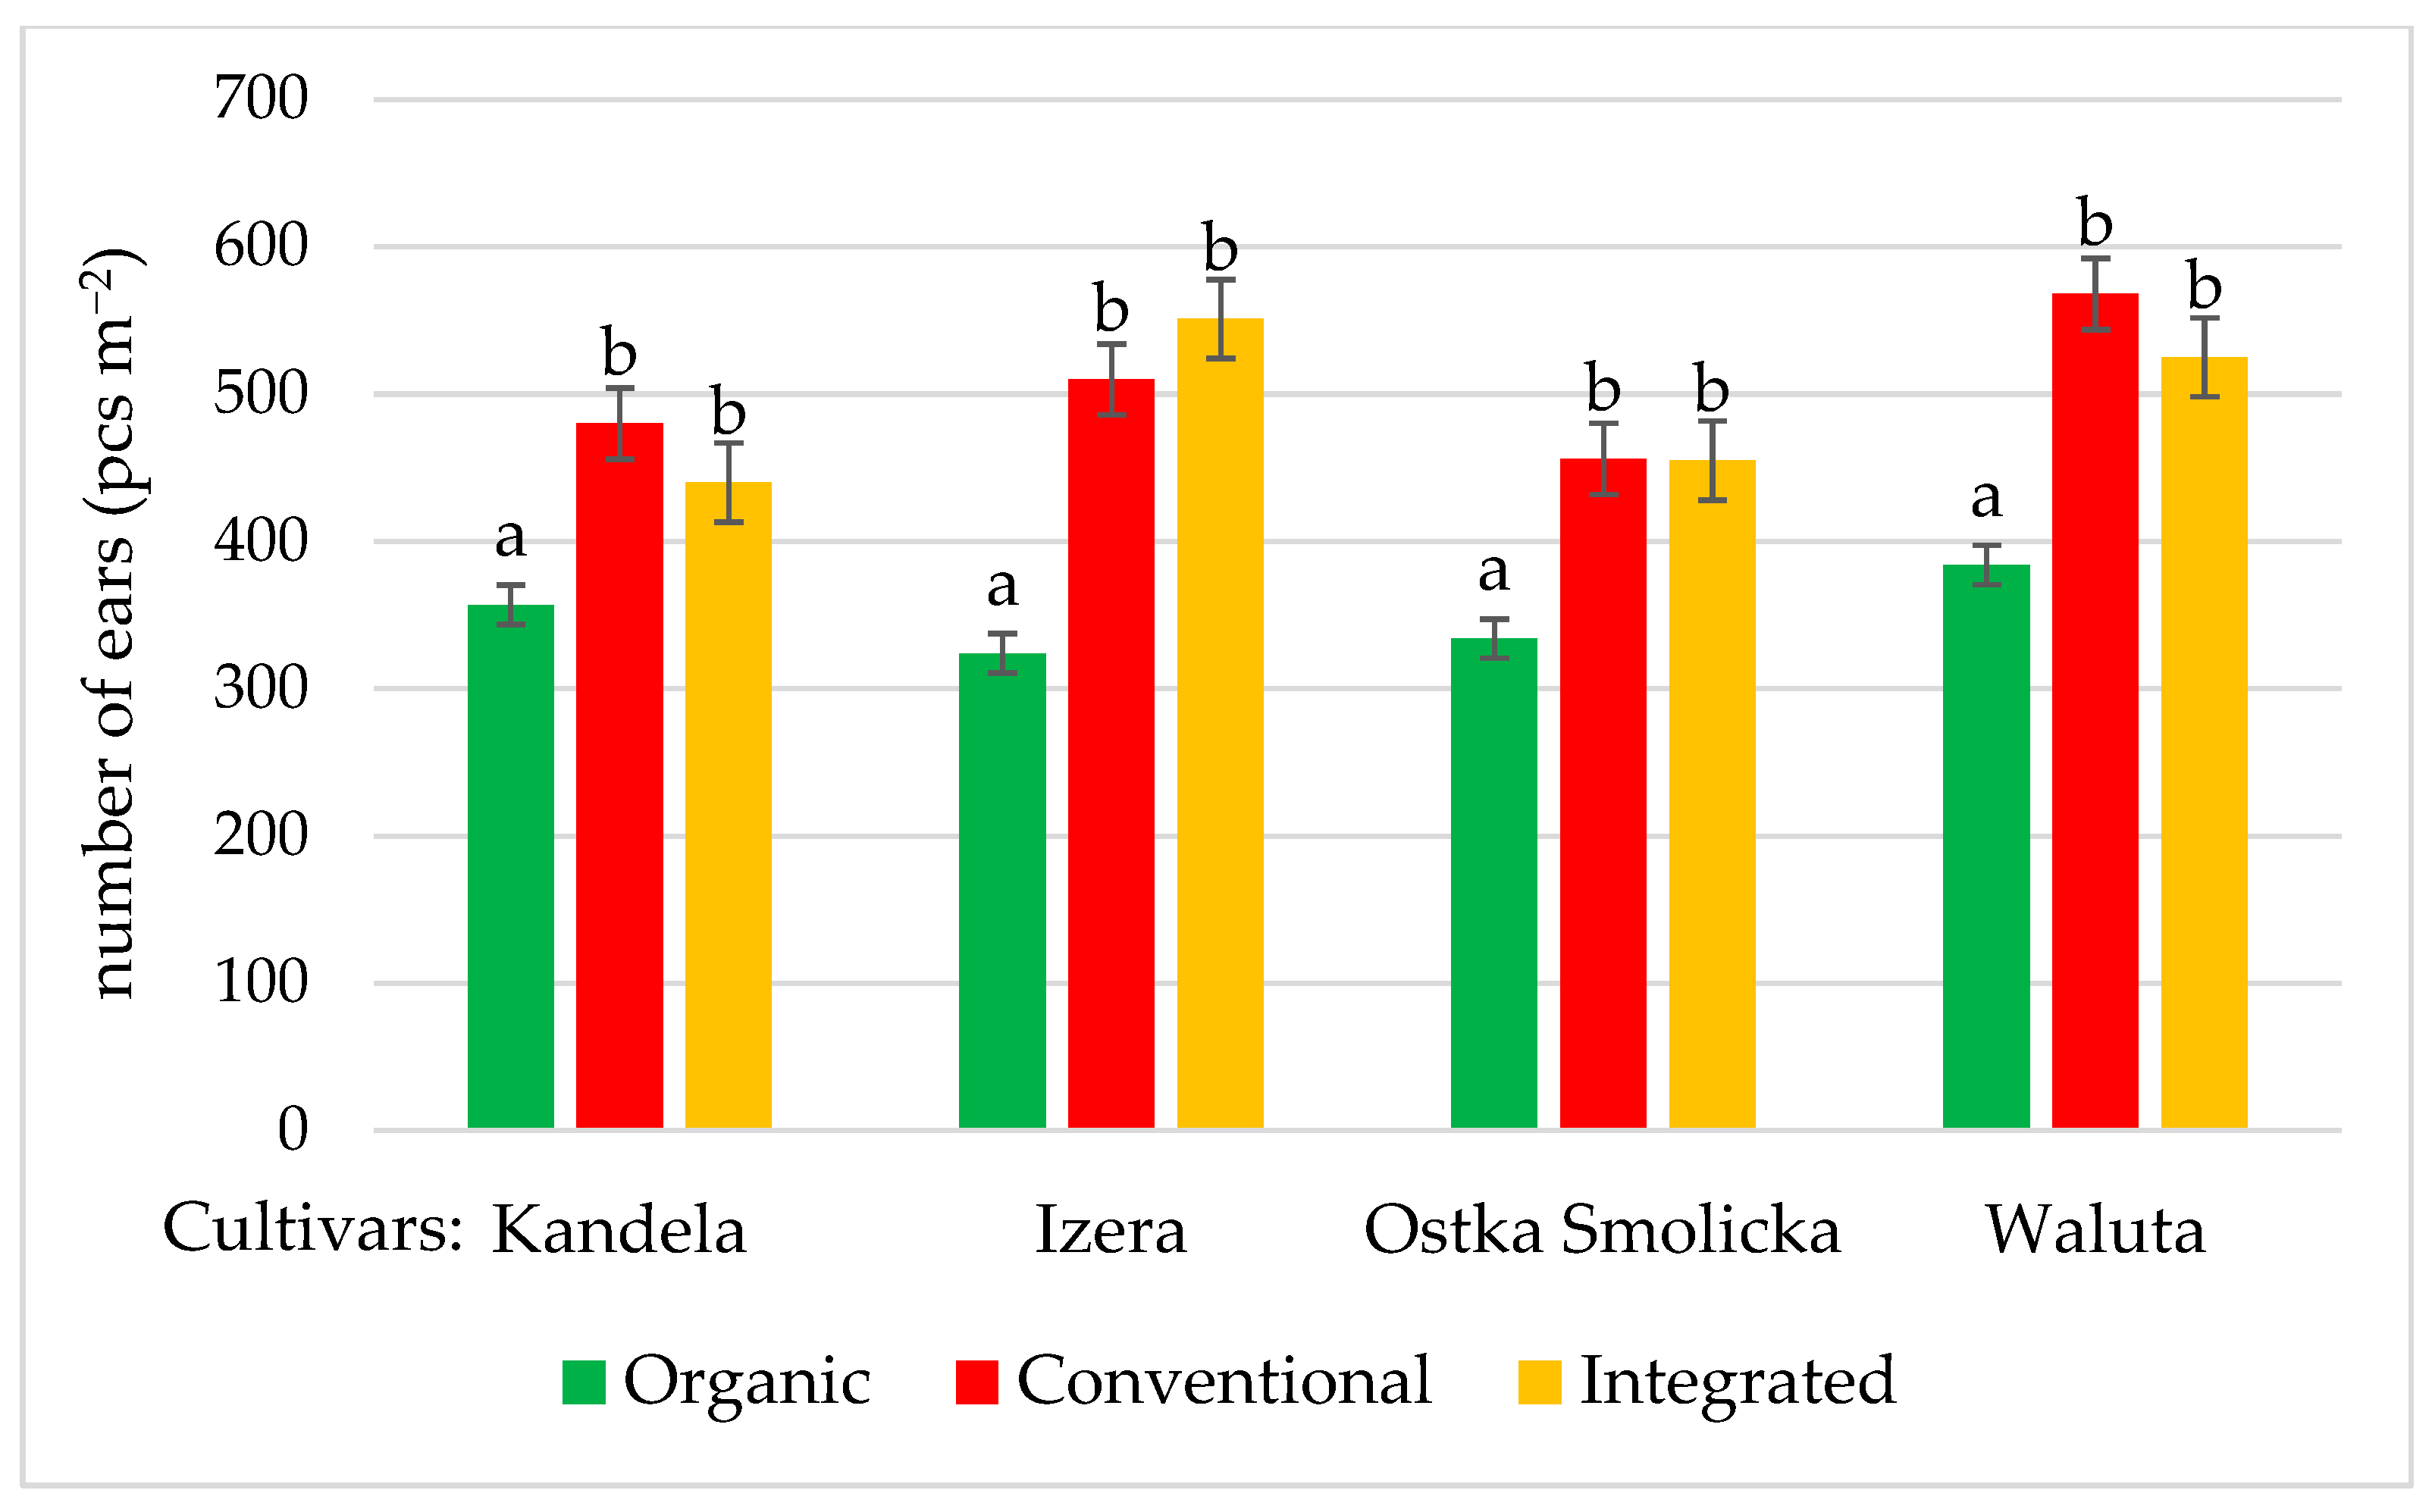
The wheat canopy in the organic system was characterised by lower ear density and grain weight compared with the other systems and the highest coefficient of variations of these traits (Table 4). Ear density was 42–44% higher in the integrated and conventional systems (Figure 2), while 1000-grain weights were, respectively, 13% and 23% higher compared with the organic system (Figure 3). The highest 1000-grain weight was recorded in the integrated system (Table 4). A poor nitrogen pool in the soil (Table 1), leaf fungal diseases, and weed infestation (Table 5) had limiting effects on wheat tillering; growth and development; photosynthesis; and, consequently, grain yield (Table 4).
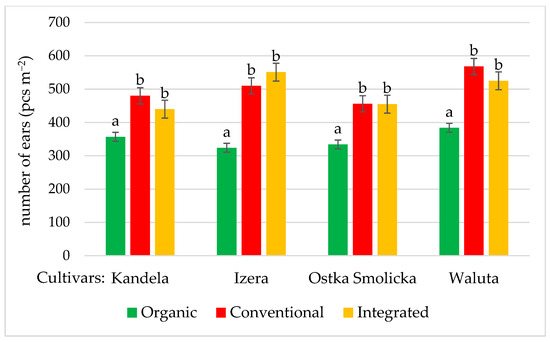
Figure 2.
Impact of crop production system on the ear density of 4 spring wheat cultivars (bars represent standard errors). Different letters correspond to significant differences between systems according to Tukey’s test at p ≤ 0.05.
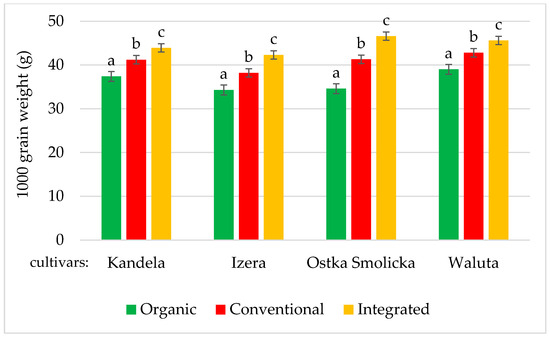
Figure 3.
Impact of crop production system on the 1000-grain weight of 4 spring wheat cultivars (bars represent standard errors). Different letters correspond to significant differences between systems according to Tukey’s test at p ≤ 0.05.
Table 5.
The impact of year, production system, and cultivar on wheat infestation by fungal pathogens and weeds (coefficient of variations in brackets).
Analysis of the data on grain yield and grain structure elements showed no significant interaction between the production systems and cultivars (Table 4), meaning that the response of all wheat cultivars to cultivation under the compared production systems was similar (Figure 1, Figure 2 and Figure 3). The cultivars yielded the best under the integrated production system. Of all the cultivars, Waluta and Izera yielded the best both in the integrated and conventional systems, respectively, 7.82 and 7.85 t·ha−1 (integrated) and 6.48 and 6.13 t·ha−1 (conventional). Under the organic system, Kandela (4.16 t·ha−1) and Waluta (4.04 t·ha−1) yielded the best. Waluta and Izera had a higher tolerance to cultivation in different production systems, while Kandela performed the best in the organic system. The higher productivity of the Waluta and Izera cultivars in the integrated and conventional systems was probably associated with a high ear density of 510–568 pcs·m−2 and, additionally, in the case of Waluta, a high 1000-grain weight (42.8–45.6 g) (Figure 2 and Figure 3).
The cultivar Kandela, which obtained the highest yields in the organic system (4.16 t·ha−1), was able to form a compact canopy with a relatively high ear density—357 pcs·m−2—and a high 1000-grain weight (37.3 g). In addition, Kandela turned out to have the highest resistance to fungal pathogens (Table 5), which is a very important trait in the conditions of an organic system. Kandela proved to be adapted to extensive farming systems, as it reacted with the smallest yield increase to more intensive cultivation conditions (the smallest yield difference between the organic and conventional and integrated systems—46% and 76%, respectively) (Figure 1). Ostka Smolicka and Izera reacted with the highest yield increase in the conventional and integrated systems compared with the organic system, which means that the yield potential of these cultivars is better revealed under more intensive crop production systems (Figure 1).
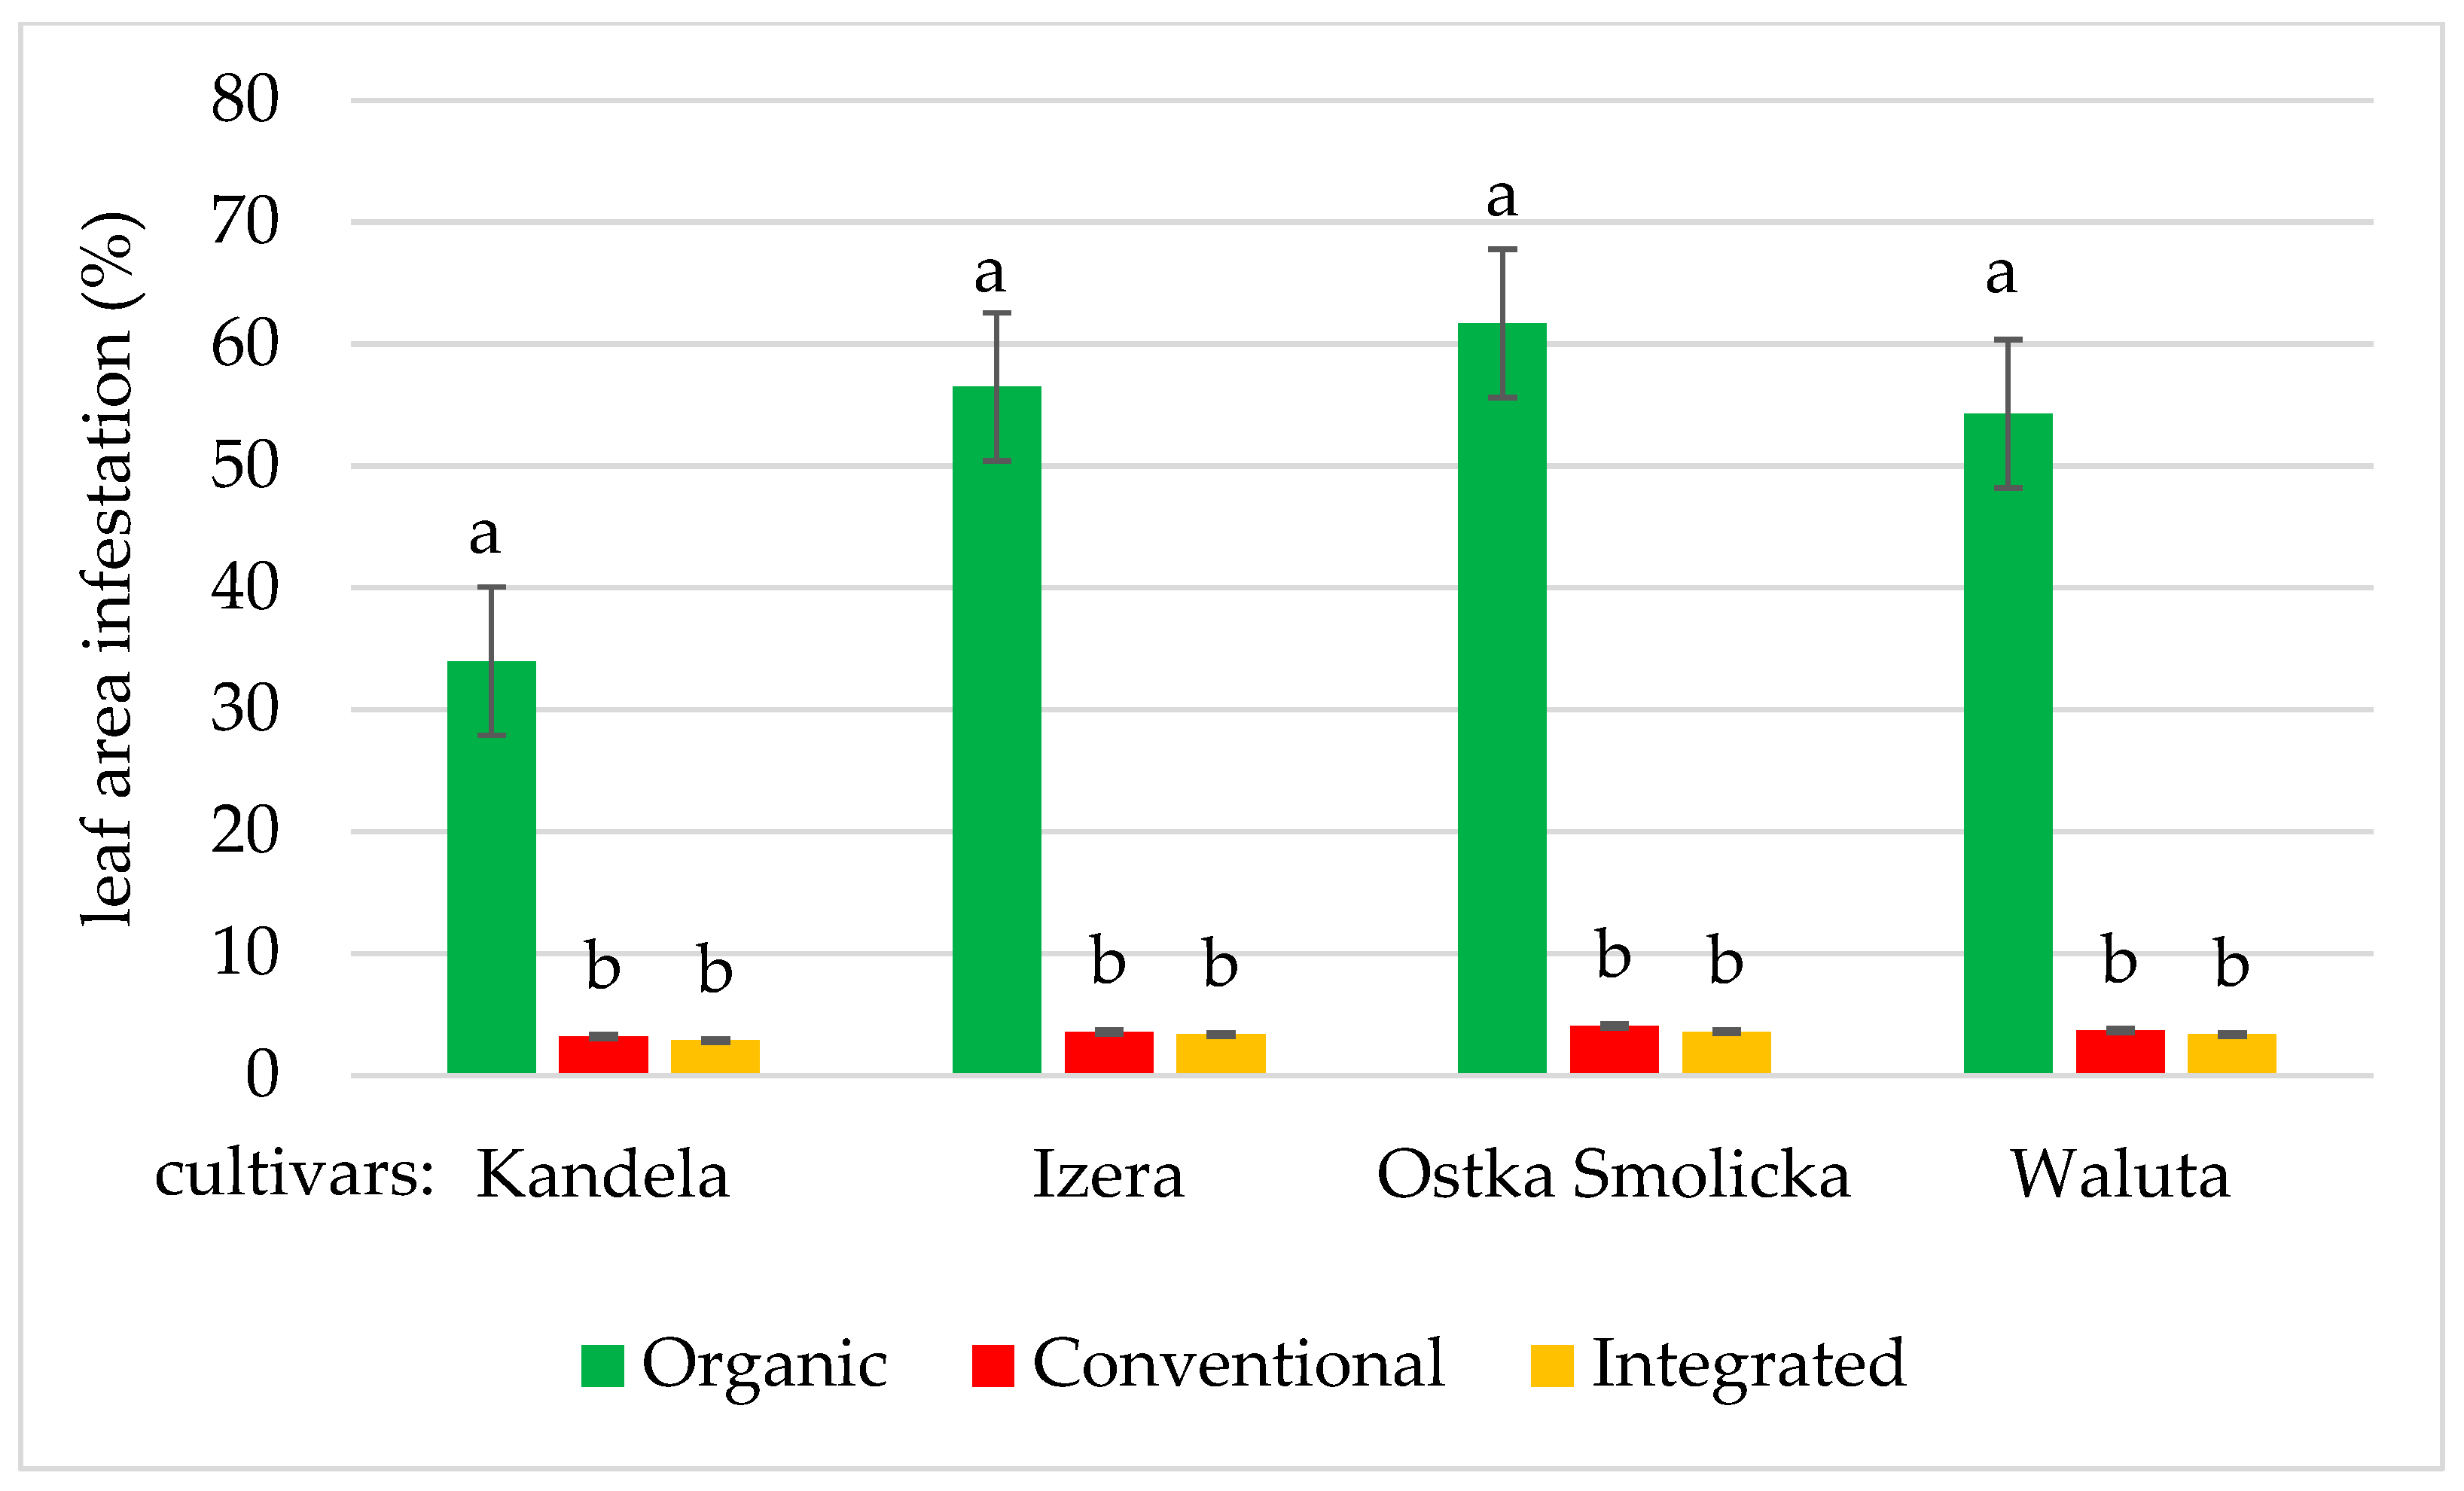
The highest severity of yield-limiting agrophages in spring wheat was observed in the organic system, both for leaf fungal pathogens (Table 5; Figure 4) and for weed infestation (Table 5; Figure 5).
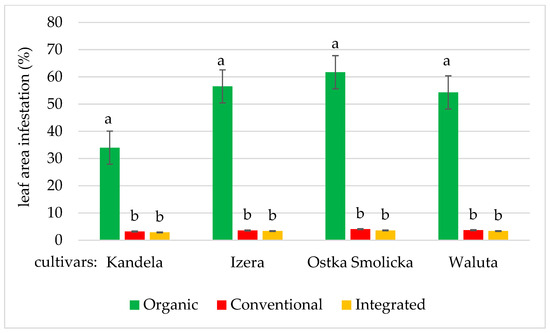
Figure 4.
Impact of crop production system on infestation by fungal pathogens in 4 spring wheat cultivars (bars represent standard errors). Different letters correspond to significant differences between systems according to Tukey’s test at p ≤ 0.05.

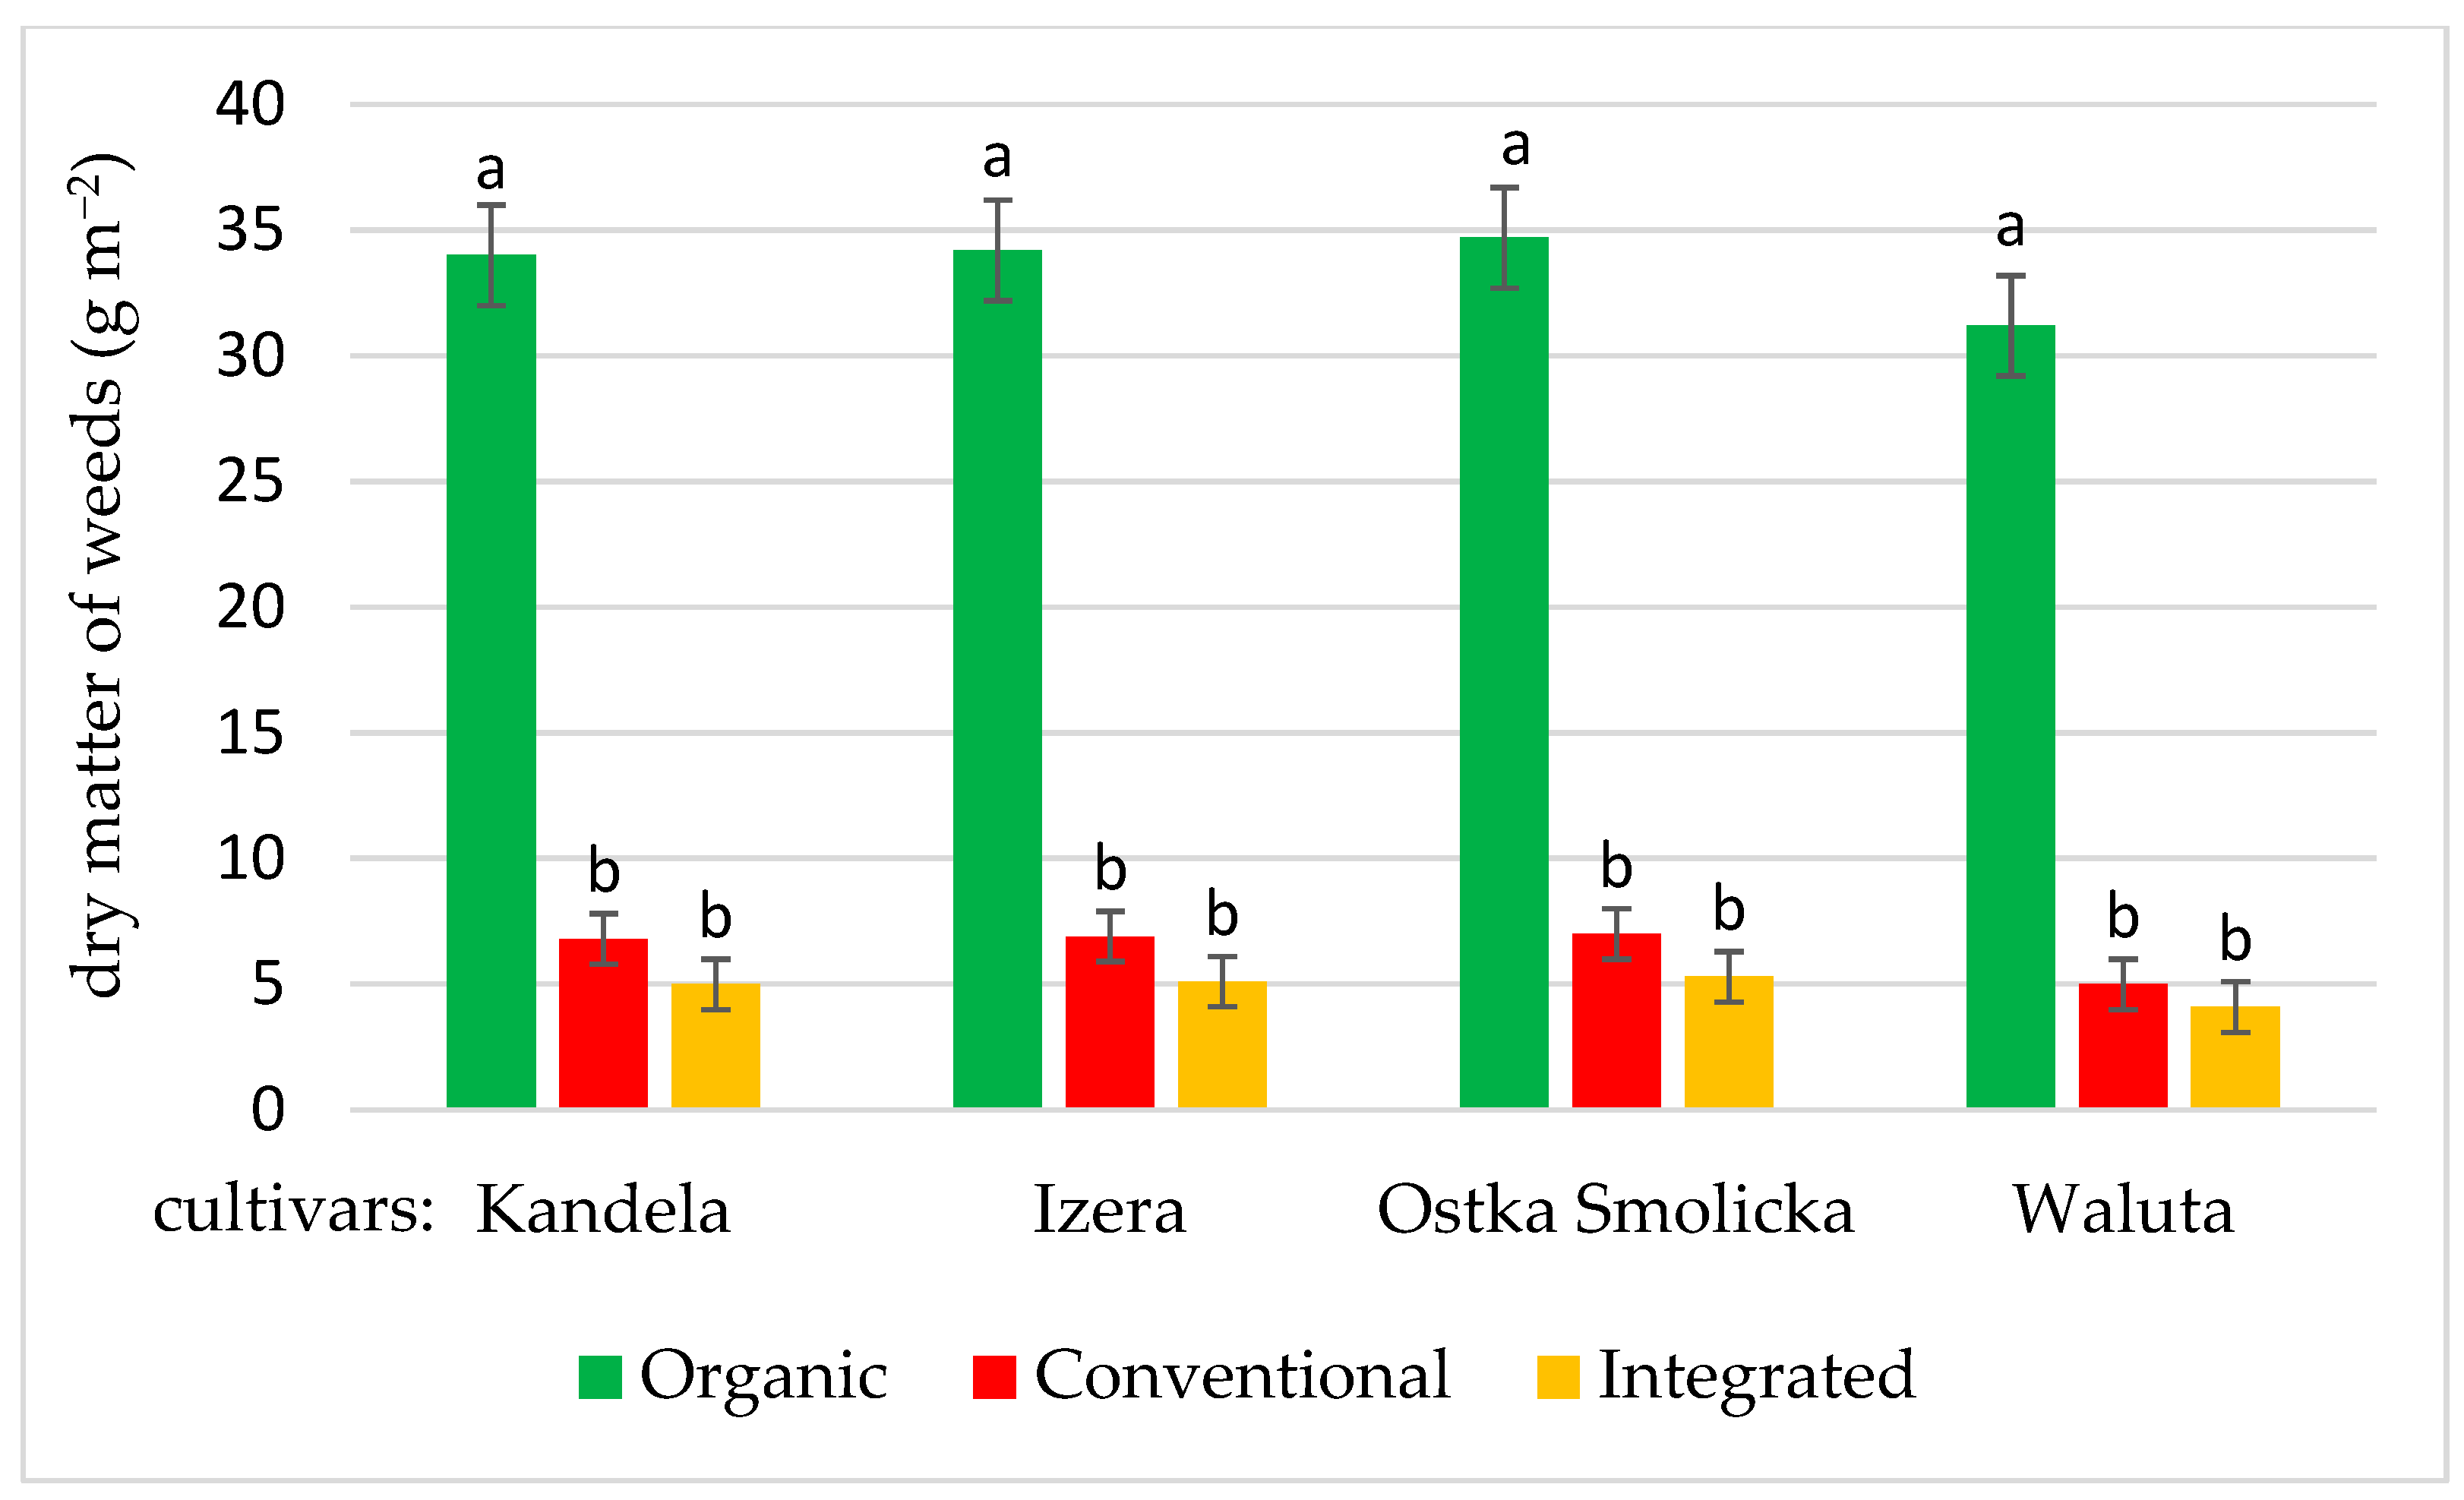
Figure 5.
Impact of crop production system on weed dry matter in 4 spring wheat cultivars (bars represent standard errors). Different letters correspond to significant differences between systems according to Tukey’s test at p ≤ 0.05.
The occurrence of fungal pathogens in the wheat was influenced by the crop production system and the cultivar. Indeed, the highest leaf area infestation (51.5% of the leaf blade) was found in the organic system compared with the other systems, in which leaf infestation was negligible and did not exceed 4% of leaf area (Table 5). The low level of leaf infestation by fungal pathogens in these systems was determined by the use of chemical fungicide treatments (2–3 times per season) (Table 2). Of the cultivars tested, Kandela stood out as having the highest resistance to fungal pathogens, which was particularly evident in the organic system with the higher pathogen pressure (Table 5). Next in the resistance ranking was the cultivar Waluta. The latter and Kandela were, at the same time, characterised by the highest yields in the organic system, which makes them useful for this system (Figure 1).
Similarly, the intensity of weed infestation was the highest in the organic system, as evidenced by the several times higher dry matter of weeds (33.5 g·m−2) compared with the conventional (6.4 g·m−2) and integrated systems (4.8 g·m−2). The low level of weed infestation in these systems was due to the effectiveness of the herbicides applied (Table 2). Waluta was the most competitive cultivar against weeds, but the differences between cultivars were not statistically significant (Table 5).
There were no significant differences in weed severity and pathogen infestation between the integrated and conventional systems (Table 5).
The predominant spring wheat pathogens in the organic system were Puccinia striiformis, Drechslera tritici-repentis, Septoria sp., Puccinia recondita, and Blumeria graminis (Table 6). Only traces of Puccinia striiformis and Blumeria graminis occurred in wheat leaves in the conventional and integrated systems. The weed communities in the organic system were dominated by common species, such as Chenopodium album, Vicia sp., Stellaria media, and Fallopia convolvulus. In addition to weeds with low competitiveness against wheat, nuisance species—such as Cirsium arvense and Equisetum arvense, with high competition against the crop for nutrients, water, and space, whose presence even at low intensity causes a significant yield reduction [25]—were observed in the organic system. At the same time, weed communities in the organic system were characterised by the highest species biodiversity among the compared systems (Table 6).
Table 6.
Occurrence of fungal pathogens and weed species in spring wheat in different crop production systems.
4. Discussion
Organic yields are usually lower than conventional ones, with the yield gap ranging from 5 to 80% [16,18,19,26,27,28] (Table 7).
Table 7.
Yield gap in organic vs. conventional and integrated systems on the basis of a review of the literature.
In several studies, wheat grain yields in the conventional intensive system have been reported to be three times higher compared with the organic system (3.05 t·ha−1 in the organic system vs. 9.50 t·ha−1 in the conventional system). Such high yields in the conventional system are mainly due to intensive mineral fertilisation and chemical plant protection in addition to a genetic factor [36]. Our results showed that spring wheat yields in the conventional system were higher by 67%, whereas, in the integrated system, they were 109% higher than in the organic one. A study conducted in the same experiment in other years found 10–62% higher wheat yields in the conventional system and 34–75% higher yields in the integrated system than in the organic one (Table 7). The larger yield gap between the organic and conventional/integrated systems revealed in our own studies may be due to the higher disease pressure and specific weather patterns in 2014–2016.
The yield difference between the organic and conventional systems depends on the organisation of crop production; the intensity of fertilization and crop protection in the conventional system, cultivar selection; and soil quality. According to some authors [35,37,38], under certain conditions (good management practices, appropriate crop selection, and growing conditions), organic systems can match conventional yields. Ponti et al. [16] showed that the organic yield gap significantly differed between crop groups and regions, and this gap increases as conventional yields increase. The authors hypothesized that “due to challenges in the maintenance of nutrient availability in organic systems at crop rotation, farm and regional level, the average yield gap between conventional and organic systems may be larger than 20%. This relates, in particular, to the role of legumes in the rotation and farming systems and to the availability of manure at the farm and regional levels”. The importance of rotations involving legumes was also demonstrated in our research. Higher yields in the integrated system (7.61 t·ha−1) than in the conventional one (6.12 t·ha−1) were due to a better rotation in this system (four-field rotation with grain legumes) compared with the conventional one (three-field simplified rotation dominated by cereals).
According to Mayer et al. [27], a reduction in the number of ears per m2 and lower 1000-grain weights are the main driving factors of lower yields in organic systems. This is consistent with our results, in which the ear density in the integrated and conventional systems was 42–44% higher compared with the organic system. Moreover, the 1000-grain weight was 13% higher in the conventional system and 23% higher in the integrated system compared with the organic one. Also, in our previous study, smaller yields in the organic farming system were caused by a lower ear density and 1000-grain weight (both showing a reduction of approximately 16%) [19].
The following yield-limiting factors in the organic system can be distinguished: worse nitrogen nutrition status in crops, lower soil nitrogen availability, weed infestation, and fungal diseases [16]. Some authors indicate that, of the factors mentioned, nitrogen deficiency limiting tillering and grain development is essential [16,27,39]. Ponti et al. [16] suggested that “future research should pay particular attention to nutrient availability in both organic and conventional agriculture”. According to Watson et al. [4], nutrient supply to crops depends on the use of legumes that add nitrogen to the system and limited inputs from supplementary nutrients, added in acceptable forms. The authors noted that “fertility management in organic farming relies on a long-term integrated approach rather than the short-term very targeted solutions common in conventional agriculture”. Interesting results were provided in the study by Schrama et al. [34], who, by comparing organic and conventional systems over a 13-year period in the Netherlands, found that the yield gap between these systems diminished over time. This coincided with higher nutrient use efficiency and spatial stability in the organic system, as well as an improved soil structure with higher organic matter concentrations and fewer plant-parasitic nematodes [34].
Yield differences between organic and conventional crops may be due to weeds, pathogens, and pest pressure [19]. According to Posner et al. [38], a wet spring reduced the effectiveness of mechanical weed control techniques such that the relative yields of corn and soybeans in the organic system were only 74% of conventional systems. However, in the other 66% of the cases, where mechanical weed control was effective, the relative yield of the low-input crops was 99% of conventional systems. In our study, the effectiveness of weed management in spring wheat in the organic system was lower, as the dry matter of weeds in this case was 33.5 g·m−2 and 6.4 and 4.8 g·m−2 in the conventional and integrated systems, respectively. Despite the dry matter of weeds being several times higher in the organic system compared with the other systems, it did not significantly affect wheat yield. In the organic system, the high biodiversity of segetal flora, with its low mass in the canopy, is noteworthy and was confirmed in our previous study [19]. In the conventional and integrated systems, the domination of some weed species was observed (Viola arvensis, Fallopia convolvulus, Equisetum arvense, Echinochloa crus-galli, and Elymus repens). This could be a result of species compensation due to the inappropriate selection of herbicides or the low effectiveness or resistance of certain weed biotypes to herbicide-active substances.
The cultivars tested did not differ significantly in terms of competition with weeds, but they differed in terms of resistance to fungal pathogens. The most resistant cultivar to infestation by fungal pathogens was Kandela, whose leaf blade in the organic system was infested by up to 34%, and it was almost twice as low as the leaf infestation in Ostka Smolicka (62%); for this reason, the Kandela cultivar can be recommended for organic farming. In a study conducted by Radzikowski et al. [40] on 41 winter wheat cultivars in the organic system, brown rust (Puccinia recondita) was found to be the disease that caused the highest infestation, often exceeding 80% of the flag leaf area. However, yield reduction was mainly related to the severe occurrence of leaf Septoria. Other leaf diseases such as tan spot (Drechslera tritici-repentis), yellow rust (Puccinia striiformis), powdery mildew (Erisyphe graminis), and fusariosis were of little importance and only occurred at low infestation with Septoria and brown rust. According to Watson et al. [41], carefully planned diverse rotations can help reduce the incidence of pests and diseases and allow for cultural methods of weed control.
Despite the fact that no significant interaction between production systems and cultivars was found, the results obtained indicate that the selection of cultivars, especially in the organic production system, impacts crop yields and quality traits, which has also been shown in other studies [17,19,39,42]. The lack of significant interaction between crop production systems and cultivars may have been due to the relatively low pressure from foliar fungal pathogens during the analysed period and the low weed infestation in both systems where chemical crop protection was applied (conventional; integrated) and in the organic system. Studies on the responses of cultivars to cultivation in different production systems reveal that spring cereals show less variation in yields than winter cereals [19]. In previous research conducted on a wider range of cereal cultivars, groups of cultivars more and less suitable for organic farming were distinguished. They were characterised by greater competitiveness against weeds and higher resistance to infection by fungal pathogens [20].
Smith et al. [28] pointed out that organic farms had greater yield variability in comparison with conventional farms, whereas, despite lower yields, organic farms successfully support reliable environmental benefits, but greater reliance on ecological processes may reduce the predictability of crop production. According to Doreen et al. [31], biodiversity conservation and food production need to be balanced: production needs to be sustainable, while conservation cannot be totally at the expense of crop yield. Of the eight species groups examined, five (farmland plants, bumblebees, butterflies, solitary bees, and epigeal arthropods) were negatively associated with crop yield. Although organic farms produce lower yields than comparable conventional farms [35], they are more profitable, more friendly to pollinators and the environment, and deliver equally or more nutritious foods with fewer pesticide residues [28,31,43,44,45].
5. Conclusions
The compared crop production systems significantly differentiated the yield, health status, and weed infestation of selected spring wheat cultivars. On average, grain yield in the conventional system was 67%, and in the integrated system, it was 109% higher than in the organic system. The main factor of lower yields in the organic system was a reduction in the number of ears per m2 and the 1000-grain weight. Of the cultivars tested, Kandela proved to be the most suitable for the organic system due to its high yielding potential and resistance to fungal pathogens. The cultivars Waluta and Izera performed well in all the production systems but yielded the best in the conventional and integrated systems. The information on cultivar performance and yielding under the organic system may be useful for farmers and advisors in decreasing the yield gap and increasing agricultural incomes. The organic system produces lower yields than the comparable conventional and integrated systems (although, in some cases, organic yields can match conventional yields), but it is more friendly to the environment and delivers equally or more nutritious foods with fewer pesticide residues.
Author Contributions
Conceptualization, K.J. and J.S.; methodology, K.J., J.S. and B.F.-S.; formal analysis, K.J. and B.F.-S.; investigation, K.J. and B.F.-S.; data curation, K.J. and B.F.-S.; writing—original draft preparation, B.F.-S. and K.J.; writing—review and editing, J.S.; visualization, B.F.-S.; supervision, J.S.; project administration, K.J.; funding acquisition, B.F.-S. and K.J. All authors have read and agreed to the published version of the manuscript.
Funding
This research was funded by a grant from the Polish Ministry of Agriculture and Rural Development, No. HORre-msz-078-23/16(243)/2, Research on the Selection of Spring Cereal Varieties and Their Suitability for the Baking and Pasta Industry. This paper was funded by the purposeful subsidy of the Polish Ministry of Agriculture and Rural Development for IUNG-PIB, Task 4.2., Assessment of the Suitability of Spring and Winter Cereal Varieties and Legumes for Cultivation in an Organic System.
Institutional Review Board Statement
Not applicable.
Data Availability Statement
The data presented in this study are available upon request.
Acknowledgments
The authors thank the technical staff at the Department of Systems and Economics of Crop Production IUNG-PIB in Puławy: Paweł Wolszczak, Marek Woźniak, Andrzej Górnik, and Ewa Strzemska for their support during field analysis.
Conflicts of Interest
The authors declare no conflicts of interest.
References
- FAO. Wheat Flour–Agribusiness Handbook; FAO: Rome, Italy, 2009; Available online: https://www.fao.org/3/al376e/al376e.pdf (accessed on 4 January 2024).
- FAO. World Food and Agriculture–Statistical Yearbook 2023; FAO: Rome, Italy, 2023. [Google Scholar] [CrossRef]
- Morris, C.F.; Rose, S.P. Wheat. In Cereal Grain Quality; Henry, R.J., Kettlewell, P.S., Eds.; Springer: Dordrecht, The Netherlands, 1996; pp. 3–54. [Google Scholar] [CrossRef]
- Erenstein, O.; Jaleta, M.; Mottaleb, K.A.; Sonder, K.; Donovan, J.; Braun, H.J. Global Trends in Wheat Production, Consumption and Trade. In Wheat Improvement; Reynolds, M.P., Braun, H.J., Eds.; Springer: Cham, Switzerland, 2022; pp. 44–66. [Google Scholar] [CrossRef]
- Mäder, P.; Hahn, D.; Dubois, D.; Gunst, L.; Alföldi, T.; Bergmann, H.; Oehme, M.; Amadò, R.; Schneider, H.; Graf, U. Wheat quality in organic and conventional farming: Results of 21-year field experiment. J. Sci. Food Agric. 2007, 87, 1826–1835. [Google Scholar] [CrossRef]
- Rozbicki, J.; Ceglińska, A.; Gozdowski, D.; Jakubczyk, M.; Cacak-Pietrzak, G.; Mądry, W.; Golba, J.; Piechociński, M.; Sobczyński, G.; Studnicki, M.; et al. Influence of the cultivar, environment and management on the grain yield and bread-making quality in winter wheat. J. Cer. Sci. 2015, 61, 126–132. [Google Scholar] [CrossRef]
- Mitura, K.; Cacak-Pietrzak, G.; Feledyn-Szewczyk, B.; Szablewski, T.; Studnicki, M. Yield and Grain Quality of Common Wheat (Triticum aestivum L.) Depending on the Different Farming Systems (Organic vs. Integrated vs. Conventional). Plants 2023, 12, 1022. [Google Scholar] [CrossRef] [PubMed]
- Hallmann, E. The influence of organic and conventional cultivation systems on the nutritional value and content of bioactive compounds in selected tomato types. J. Sci. Food Agric. 2012, 92, 2840–2848. [Google Scholar] [CrossRef] [PubMed]
- Barański, M.; Średnicka-Tober, D.; Volakakis, N.; Seal, C.; Sanderson, R.; Stewart, G.B.; Benbrook, C.; Biavati, B.; Markellou, E.; Giotis, C.; et al. Higher antioxidant and lower cadmium concentrations and lower incidence of pesticide residues in organically grown crops: A systematic literature review and meta-analyses. Br. J. Nutr. 2014, 112, 794–811. [Google Scholar] [CrossRef]
- Zieliński, M.; Wrzaszcz, W.; Sobierajewska, J.; Adamski, M. Development and Effects of Organic Farms in Poland, Taking into Account Their Location in Areas Facing Natural or Other Specific Constraints. Agriculture 2024, 14, 297. [Google Scholar] [CrossRef]
- Zegar, J.S. Alternative forms of agriculture in the development strategy of the agri-food sector and rural areas. Synthesis. In From Research on Socially Sustainable Agriculture; IERiGŻ-PIB: Warsaw, Poland, 2014; p. 60. [Google Scholar]
- Cristache, S.-E.; Vuță, M.; Marin, E.; Cioacă, S.-I.; Vuţă, M. Organic versus Conventional Farming—A Paradigm for the Sustainable Development of the European Countries. Sustainability 2018, 10, 4279. [Google Scholar] [CrossRef]
- Trewavas, A. Urban myths of organic farming. Nature 2001, 410, 409–410. [Google Scholar] [CrossRef] [PubMed]
- Regulation (EU) 2018/848 of The European Parliament and of the Council of 30 May 2018 on Organic Production and Labelling of Organic Products and Repealing Council Regulation (EC) No 834/2007; (OJ L 150 14.6.2018, p. 1). Available online: https://eur-lex.europa.eu/legal-content/EN/TXT/?uri=CELEX%3A02018R0848-20220101 (accessed on 4 January 2024).
- Prandecki, K.; Wrzaszcz, W.; Zieliński, M. Environmental and Climate Challenges to Agriculture in Poland in the Context of Objectives Adopted in the European Green Deal Strategy. Sustainability 2021, 13, 10318. [Google Scholar] [CrossRef]
- Ponti, T.; Rijk, B.; van Ittersum, M.K. The crop yield gap between organic and conventional agriculture. Agric. Syst. 2012, 108, 1–9. [Google Scholar] [CrossRef]
- Eisele, J.-A.; Köpke, U. Choice of cultivars in organic farming: New criteria for winter wheat ideotypes. Pflanzenbauwissenschaften 1997, 1, 19–24. [Google Scholar]
- Kuś, J.; Jończyk, K.; Stalenga, J.; Feledyn-Szewczyk, B.; Mróz, A. Yielding of selected spring wheat varieties in organic and integrated cultivation. J. Res. Appl. Agric. Eng. 2011, 56, 18–23. [Google Scholar]
- Feledyn-Szewczyk, B.; Kuś, J.; Jończyk, K.; Stalenga, J. The suitability of different winter and spring wheat varieties for cultivation in organic farming. In Organic Agriculture towards Sustainability; Pilipavicius, V., Ed.; InTech: Rijeka, Croatia, 2014; Volume 9, pp. 197–225. [Google Scholar] [CrossRef]
- Feledyn-Szewczyk, B.; Cacak-Pietrzak, G.; Lenc, L.; Stalenga, J. Rating of Spring Wheat Varieties (Triticum aestivum L.) According to Their Suitability for Organic Agriculture. Agronomy 2020, 10, 1900. [Google Scholar] [CrossRef]
- Vereijken, P. A methodic way to more sustainable farming systems. Netherlands. J. Agric. Sci. 1992, 40, 209–223. [Google Scholar]
- Mäder, P.; Mayer, J. Was Langzeitversuche für die Biolandbauforschung bedeuten. Okol. LANDBAU 2014, 170, 45–47. [Google Scholar]
- EU Common Catalogue of Varieties of Agricultural Plant Species. 2019, Consolidated Version, 20.09.2019. Available online: https://ec.europa.eu/food/sites/food/files/plant/docs/plant_variety_catalogues_agricultural-plant-species.pdf (accessed on 28 January 2024).
- EPPO Standards. Guidelines for the Efficacy Evaluation of Plant Protection Products: PP 1/26, PP 1/28; EPPO: Paris, France, 1999; Volume 1, pp. 187–195.
- Marshall, E.J.P.; Brown, V.K.; Boatman, N.D.; Lutman, P.J.W.; Squire, G.R.; Ward, L.K. The role of weeds in supporting biological diversity within crop fields. Weed Res. 2003, 43, 77–89. [Google Scholar] [CrossRef]
- Batte, M.T.; Forster, D.L.; Hitzhusen, F.J. Organic Agriculture in Ohio: An Economic Perspective. J. Prod. Agric. 1993, 100, 2. [Google Scholar] [CrossRef]
- Mayer, J.; Gunst, L.; Mäder, P.; Samson, M.; Carcea, M.; Narducci, V.; Thomsen, I.; Dubois, D. Productivity, quality and sustainability of winter wheat under long-term conventional and organic management in Switzerland. Eur. J. Agron. 2015, 65, 27–39. [Google Scholar] [CrossRef]
- Smith, O.M.; Cohen, A.L.; Rieser, C.J.; Davis, A.G.; Taylor, J.M.; Adesanya, A.W.; Jones, M.S.; Meier, A.R.; Reganold, J.P.; Orpet, R.J.; et al. Organic Farming Provides Reliable Environmental Benefits but Increases Variability in Crop Yields: A Global Meta-Analysis. Front. Sustain. Food Syst. 2019, 3, 82. [Google Scholar] [CrossRef]
- Tyburski, J.; Rychcik, B. Weed infestation of winter wheat in conventional and organic farm on Elk Lake District. Pam. Puł. 2007, 145, 233–241. (In Polish) [Google Scholar]
- Klima, K.; Łabza, T. Yielding and economic efficiency of oat cultivation in pure and mixed sowing in the organic and conventional systems. Food. Science. Technol. Qual. 2010, 3, 141–147. (In Polish) [Google Scholar]
- Doreen, G.; Sait, S.M.; Kunin, W.E.; Benton, T.G. Food Production vs. Biodiversity: Comparing organic and conventional Agriculture. J. Appl. Ecol. 2013, 50, 355–364. [Google Scholar]
- Alvares, R. Comparing Productivity of Organic and Conventional Farming Systems: A Quantitative Review. Arch. Agron. Soil Sci. 2021, 68, 1947–1958. [Google Scholar] [CrossRef]
- Brückler, M.; Resl, T.; Reindl, A. Comparison of organic and conventional crop yields in Austria. J. Land Manag. Food Environ. 2017, 68, 223–236. [Google Scholar] [CrossRef]
- Schrama, M.; de Haan, J.J.; Kroonen, M.; Verstegend, H.; Van der Putten, W.H. Crop yield gap and stability in organic and conventional farming systems. Agric. Ecosyst. Environ. 2018, 256, 123–130. [Google Scholar] [CrossRef]
- Seufert, V.; Ramankutty, N.; Foley, J.A. Comparing the yields of organic and conventional agriculture. Nature 2012, 485, 229–232. [Google Scholar] [CrossRef] [PubMed]
- Murawska, B.; Piekut, A.; Jachymska, J.; Mitura, K.; Lipińska, K.J. Organic and conventional agriculture and the size and quality of crops of chosen cultivated plants. Infrastruct. Ecol. Rural Areas 2015, III/1, 663–675. [Google Scholar]
- Lockeretz, W.; Shearer, G.; Kohl, D.H. Organic farming in the Corn Belt. Science 1981, 211, 540–546. [Google Scholar] [CrossRef]
- Posner, J.L.; Baldock, J.O.; Hedtcke, J.L. Organic and Conventional Production Systems in the Wisconsin Integrated Cropping Systems Trials: I. Productivity 1990–2002. Agron. J. 2008, 100, 253–260. [Google Scholar] [CrossRef]
- Poutala, R.T.; Korva, J.; Varis, E. Spring wheat cultivar performance in ecological and conventional cropping systems. J. Sustain. Agric. 1993, 3, 63–83. [Google Scholar] [CrossRef]
- Radzikowski, P.; Jończyk, K.; Feledyn-Szewczyk, B.; Jóźwicki, T. Assessment of Resistance of Different Varieties of Winter Wheat to Leaf Fungal Diseases in Organic Farming. Agriculture 2023, 13, 875. [Google Scholar] [CrossRef]
- Watson, C.; Atkinson, D.; Gosling, P.; Jackson, L.; Rayns, F. Managing soil fertility in organic farming systems. Soil Use Manag. 2006, 18, 239–247. [Google Scholar] [CrossRef]
- Lemerle, D.; Verbeek, B.; Cousens, R.D.; Coombers, N.E. The potential for selecting wheat varieties strongly competitive against weeds. Weed Res. 1996, 36, 505–513. [Google Scholar] [CrossRef]
- Kovács-Hostyánszki, A.; Espíndola, A.; Vanbergen, A.J.; Settele, J.; Kremen, C.; Dicks, L.V. Ecological intensification to mitigate impacts of conventional intensive land use on pollinators and pollination. Ecol Lett. 2017, 20, 673–689. [Google Scholar] [CrossRef] [PubMed]
- Clarc, S.; Klonsky, K.; Livingston, P.; Temple, S. Crop-Yield and Economic Comparisons of Organic, Low-Input, and Conventional Farming Systems in California’s Sacramento Valley. Am. J. Altern. Agric. 1999, 14, 3. [Google Scholar] [CrossRef]
- Crowder, D.; Northfield, T.; Strand, M. Organic Agriculture Promotes Evenness and Natural Pest Control. Nature 2010, 466, 109–112. [Google Scholar] [CrossRef]


Disclaimer/Publisher’s Note: The statements, opinions and data contained in all publications are solely those of the individual author(s) and contributor(s) and not of MDPI and/or the editor(s). MDPI and/or the editor(s) disclaim responsibility for any injury to people or property resulting from any ideas, methods, instructions or products referred to in the content. |
© 2024 by the authors. Licensee MDPI, Basel, Switzerland. This article is an open access article distributed under the terms and conditions of the Creative Commons Attribution (CC BY) license (https://creativecommons.org/licenses/by/4.0/).