Article

Recognition and Positioning of Strawberries Based on Improved YOLOv7 and RGB-D Sensing

Beijing Key Laboratory of Optimization Design for Modern Agricultural Equipment, College of Engineering, China Agricultural University, Beijing 100083, China
*
Author to whom correspondence should be addressed.
Agriculture 2024, 14(4), 624; https://doi.org/10.3390/agriculture14040624
Submission received: 18 March 2024 / Revised: 11 April 2024 / Accepted: 15 April 2024 / Published: 17 April 2024
(This article belongs to the Special Issue Sensing and Imaging for Quality and Safety of Agricultural Products)

Abstract

:
To improve the speed and accuracy of the methods used for the recognition and positioning of strawberry plants, this paper is concerned with the detection of elevated-substrate strawberries and their picking points, using a strawberry picking robot, based on the You Only Look Once version 7 (YOLOv7) object detection algorithm and Red Green Blue-Depth (RGB-D) sensing. Modifications to the YOLOv7 model include the integration of more efficient modules, incorporation of attention mechanisms, elimination of superfluous feature layers, and the addition of layers dedicated to the detection of smaller targets. These modifications have culminated in a lightweight and improved YOLOv7 network model. The number of parameters is only 40.3% of that of the original model. The calculation amount is reduced by 41.8% and the model size by 59.2%. The recognition speed and accuracy are also both improved. The frame rate of model recognition is increased by 19.3%, the accuracy of model recognition reaches 98.8%, and [email protected] reaches 96.8%. In addition, we have developed a method for locating strawberry picking points based on strawberry geometry. The test results demonstrated that the average positioning success rate and average positioning time were 90.8% and 76 ms, respectively. The picking robot in the laboratory utilized the recognition and positioning method proposed in this paper. The error of hand–eye calibration is less than 5.5 mm on the X-axis, less than 1.6 mm on the Y-axis, and less than 2.7 mm on the Z-axis, which meets the requirements of picking accuracy. The success rate of the picking experiment was about 90.8%, and the average execution time for picking each strawberry was 7.5 s. In summary, the recognition and positioning method proposed in this paper provides a more effective method for automatically picking elevated-substrate strawberries.

1. Introduction

A fruit with high nutritional value, strawberries have a sweet and sour taste, which is very popular with consumers [1,2]. Their economic value is also very high but, due to variations in quality, the price of strawberries per kilogram ranges from tens to hundreds of yuan. Strawberry quality is not only related to the variety in question but, also, to planting methods [3]. Currently, the two main domestic cultivation methods are overhead facility cultivation and ridging planting on the ground. Because of the advantages of ridge planting in terms of cost, domestic farmers primarily employ this method on the ground. However, because the fruit is close to the ground, it is easy to incur problems such as rotten fruit and uneven coloring, which affect quality. Strawberries planted in elevated facilities are suspended in the air and, during the ripening process, no other objects are in contact with them. The light is relatively uniform, making the strawberries less susceptible to decay, and the color is relatively uniform. Due to the advantages of elevated facilities in terms of quality, standardization, and planting, domestic strawberry planting methods are trending positively in China. In the process of strawberry cultivation, the cost of picking has always plagued growers. Strawberries must be picked at 80–90% maturity and have a short storage time after harvest. The strawberry picking cycle is long because individual fruit are ripe at different times; therefore, fruit farmers must pick strawberries in multiple batches at the fruit stage. Despite a gradual increase in strawberry-planting areas in China in recent years [4], strawberry picking depends on manual work, which is associated with low efficiency and high labor costs [5,6]. According to research, the labor cost of picking accounts for more than a quarter of the total cost of planting, hence the need to develop strawberry picking machines [7,8,9,10,11]. The most important part of the strawberry picking machine is its recognition and positioning method. Developing a recognition and positioning method suitable for elevated-substrate strawberry picking would be a significant contribution to the industry.
The picking of fruit and vegetables has always been a research hotspot in the field of agriculture [12,13]. At present, there are numerous studies on the picking of apples [14], tomatoes [15], sweet peppers [16], citrus [17], cucumbers [18], melon [19], and kiwifruit [20]. As a high-value fruit, strawberries are also a focus among researchers [21].
With regards to developing a recognition and picking point location algorithm for strawberry plants, compared to traditional image processing technology, deep learning has significantly improved detection efficiency in strawberry recognition and positioning. It also has other agricultural applications and is currently one of the most widely used methods in the industry. Cui et al. used image processing to identify ripe strawberries and their stems: the fruit recognition accuracy in their study reached 93.6% and stem detection accuracy reached 70.8% [22]. Habaragamuwa et al. used a deep convolutional neural network to detect ripe and immature strawberries: the detection accuracy in their study was 88.03% for ripe fruit and 77.21% for immature fruit [23]. Yu et al. introduced the Mask-RCNN algorithm in the detection of ripe strawberries. The detection accuracy rate was 95.78%, but the real-time performance could be improved by reducing the amount of calculation [24]. After that study, Yu et al. devised an innovative vision algorithm called R-YOLO, which increased the speed of detection but had a lower success rate [25]. Lemsalu et al. used You Only Look Once version 5 (YOLOv5) to detect strawberries and stems directly, but the detection accuracy of the stem was only 43.6% [26]. Perez-Borrero et al. proposed a fast strawberry instance segmentation method, which reduced the inference time, but the average precision (AP) value was only 43.85% [27]. Kim et al. used a dual-path model based on semantic segmentation to identify the maturity and stem of strawberries, and the stem recognition accuracy was 71.15% [28]. Perez-Borrero et al. proposed a strawberry instance segmentation method based on a whole convolutional neural network. Compared to Mask-RCNN, real-time performance and accuracy are improved, but the accuracy rate is only 52.61% [29]. Lamb et al. modified the convolutional neural network to improve accuracy and speed, with an average accuracy of 84.2% and a detection speed of 1.63 frames per second [30].
A review of the literature illustrates that the recognition accuracy of ripe strawberries ranges between 84.20 and 95.78%, and the recognition accuracy of fruit stems falls between 43.6 and 71.15%. However, these algorithms cannot consider detection accuracy and speed simultaneously. This paper proposes a deep learning object detection algorithm that can consider both speed and precision at the same time. It also proposes a strawberry positioning method that further improves the recognition accuracy of ripe strawberries and fruit stems. The recognition speed reaches more than 15 frames per second, enabling the real-time recognition of ripe strawberries. A strawberry picking robot designed and built in a laboratory applied this method to improve picking success rates and to reduce picking times.

2. Materials and Methods

2.1. Image Acquisition and Dataset Construction

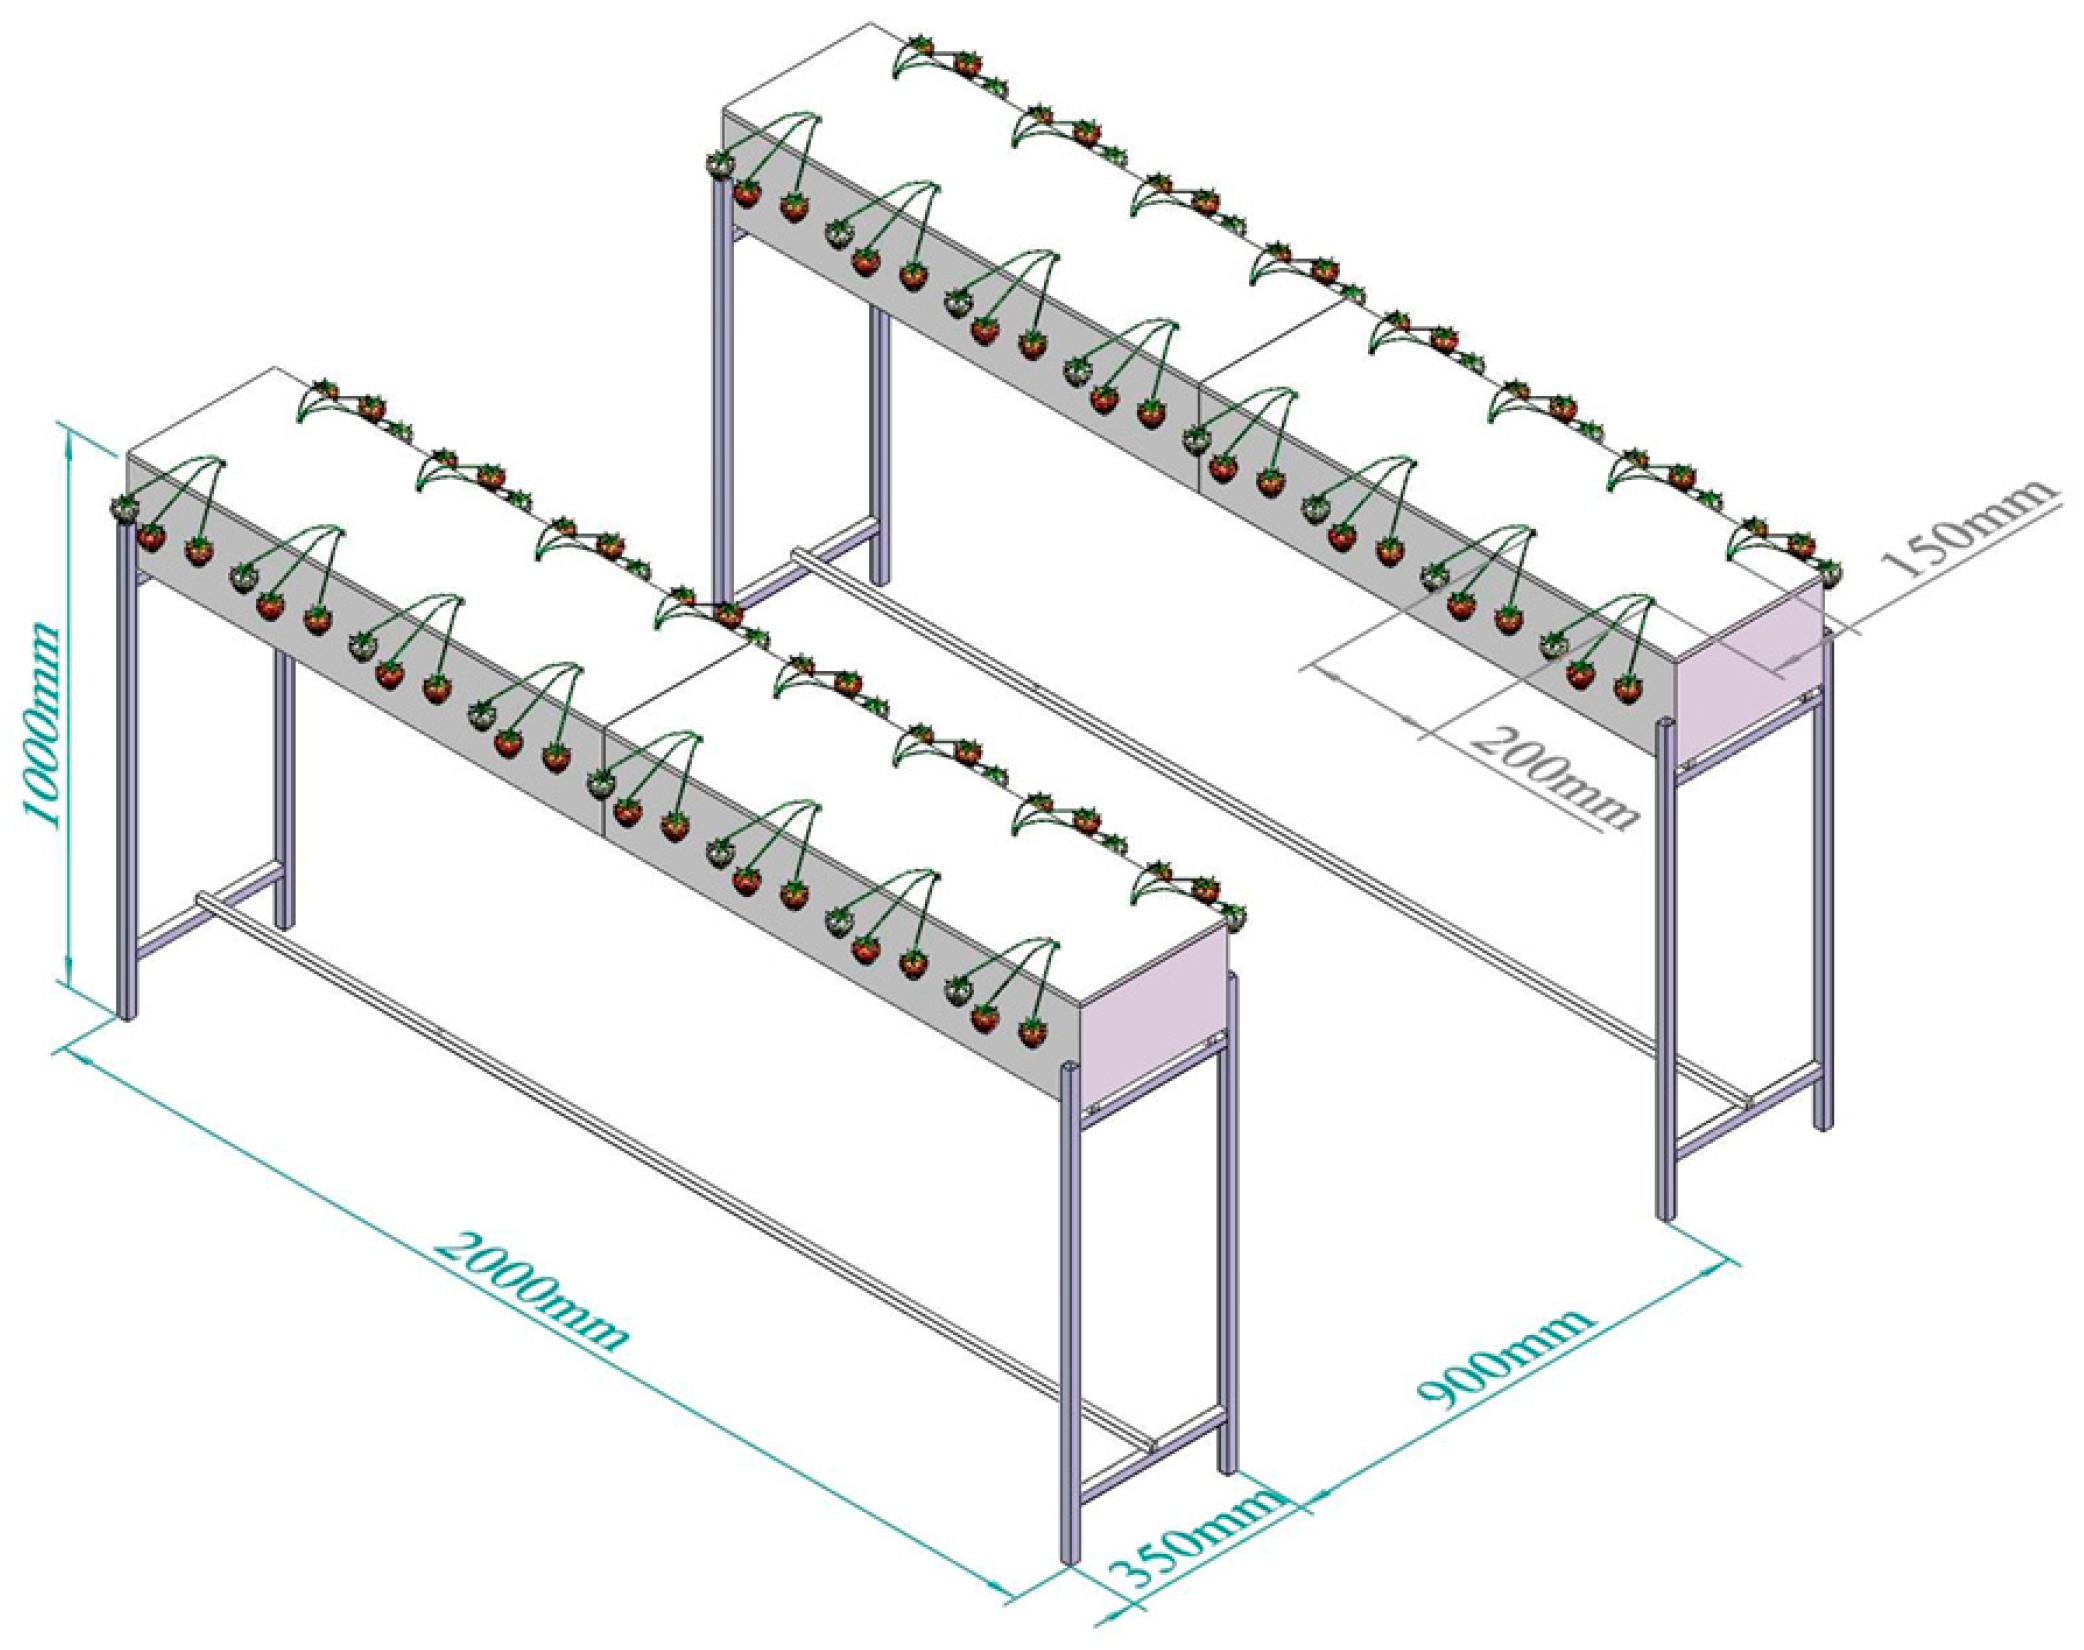
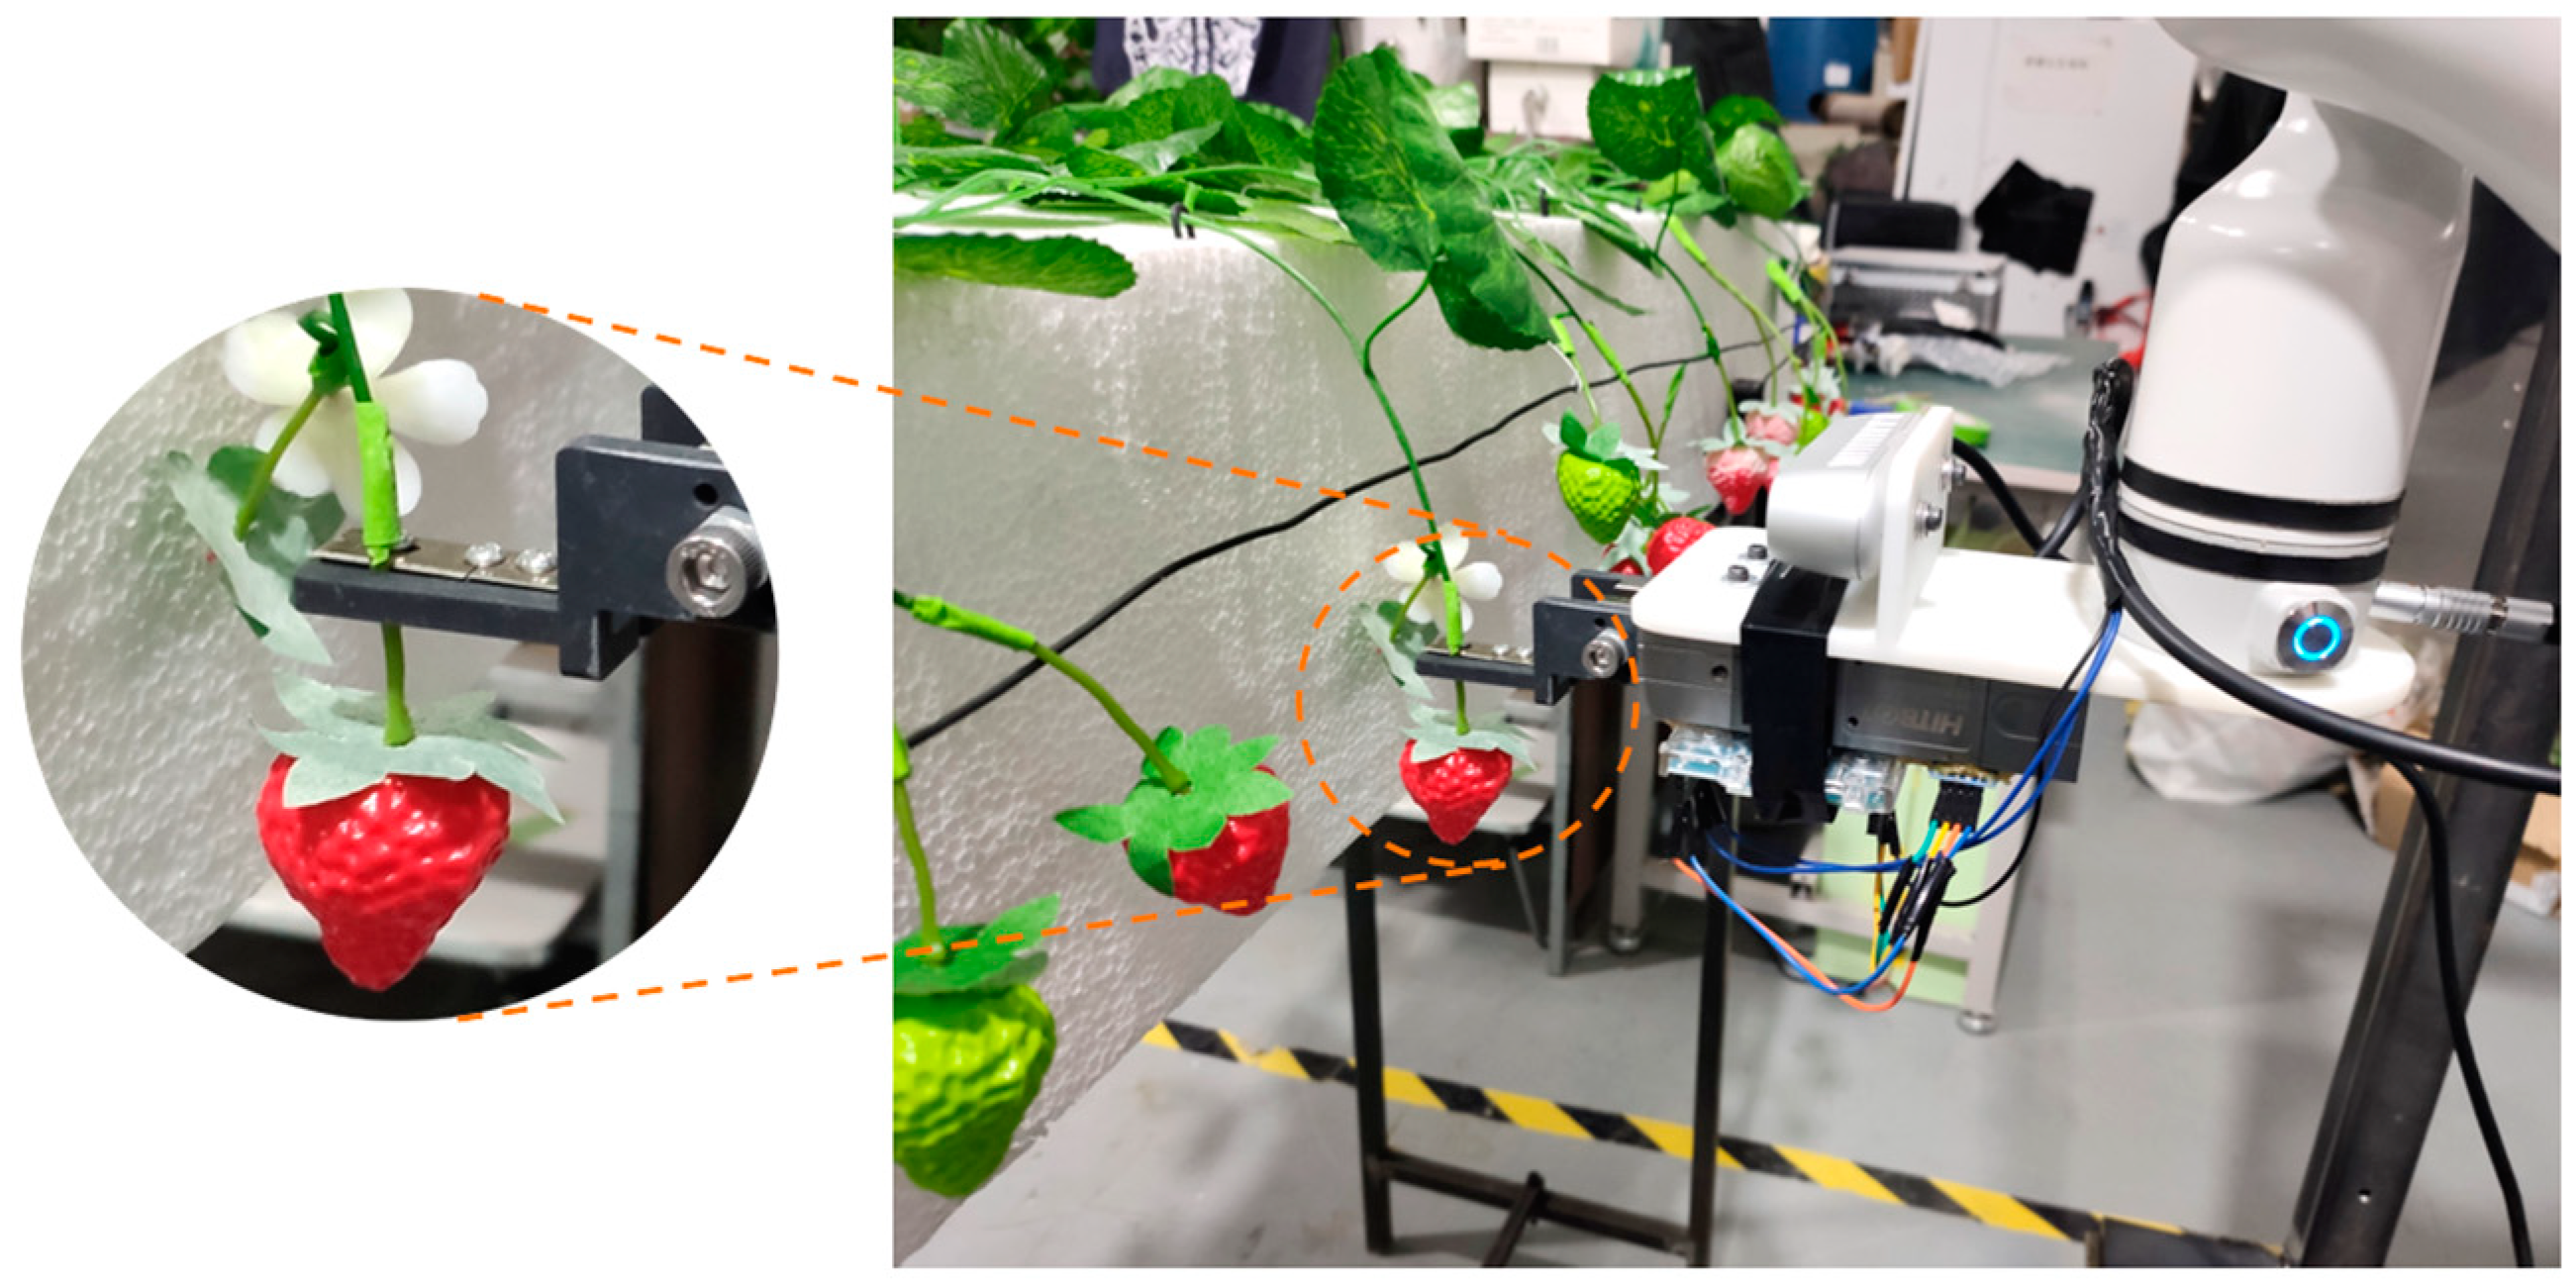
2.1.1. Strawberry Scene

In order to replicate the actual conditions that elevated-substrate strawberries grow in, we built an elevated-substrate simulation strawberry scene in a laboratory, according to the actual size of the elevated-substrate strawberry (Figure 1). A single strawberry stand is 2000 mm long, 350 mm wide, and 1000 mm high. The distance between the two strawberry racks is 900 mm. Plastic strawberry plants were used to simulate the elevated strawberry planting arrangement on the viaduct. Each strawberry stand has two rows of strawberries, approximately with rows 150 mm apart and plants 200 mm apart. Within this arrangement, we hung strawberries at random on both sides of the ripe and unripe elevated shelves, with shielding and overlapping to simulate the randomness of real strawberry growth.

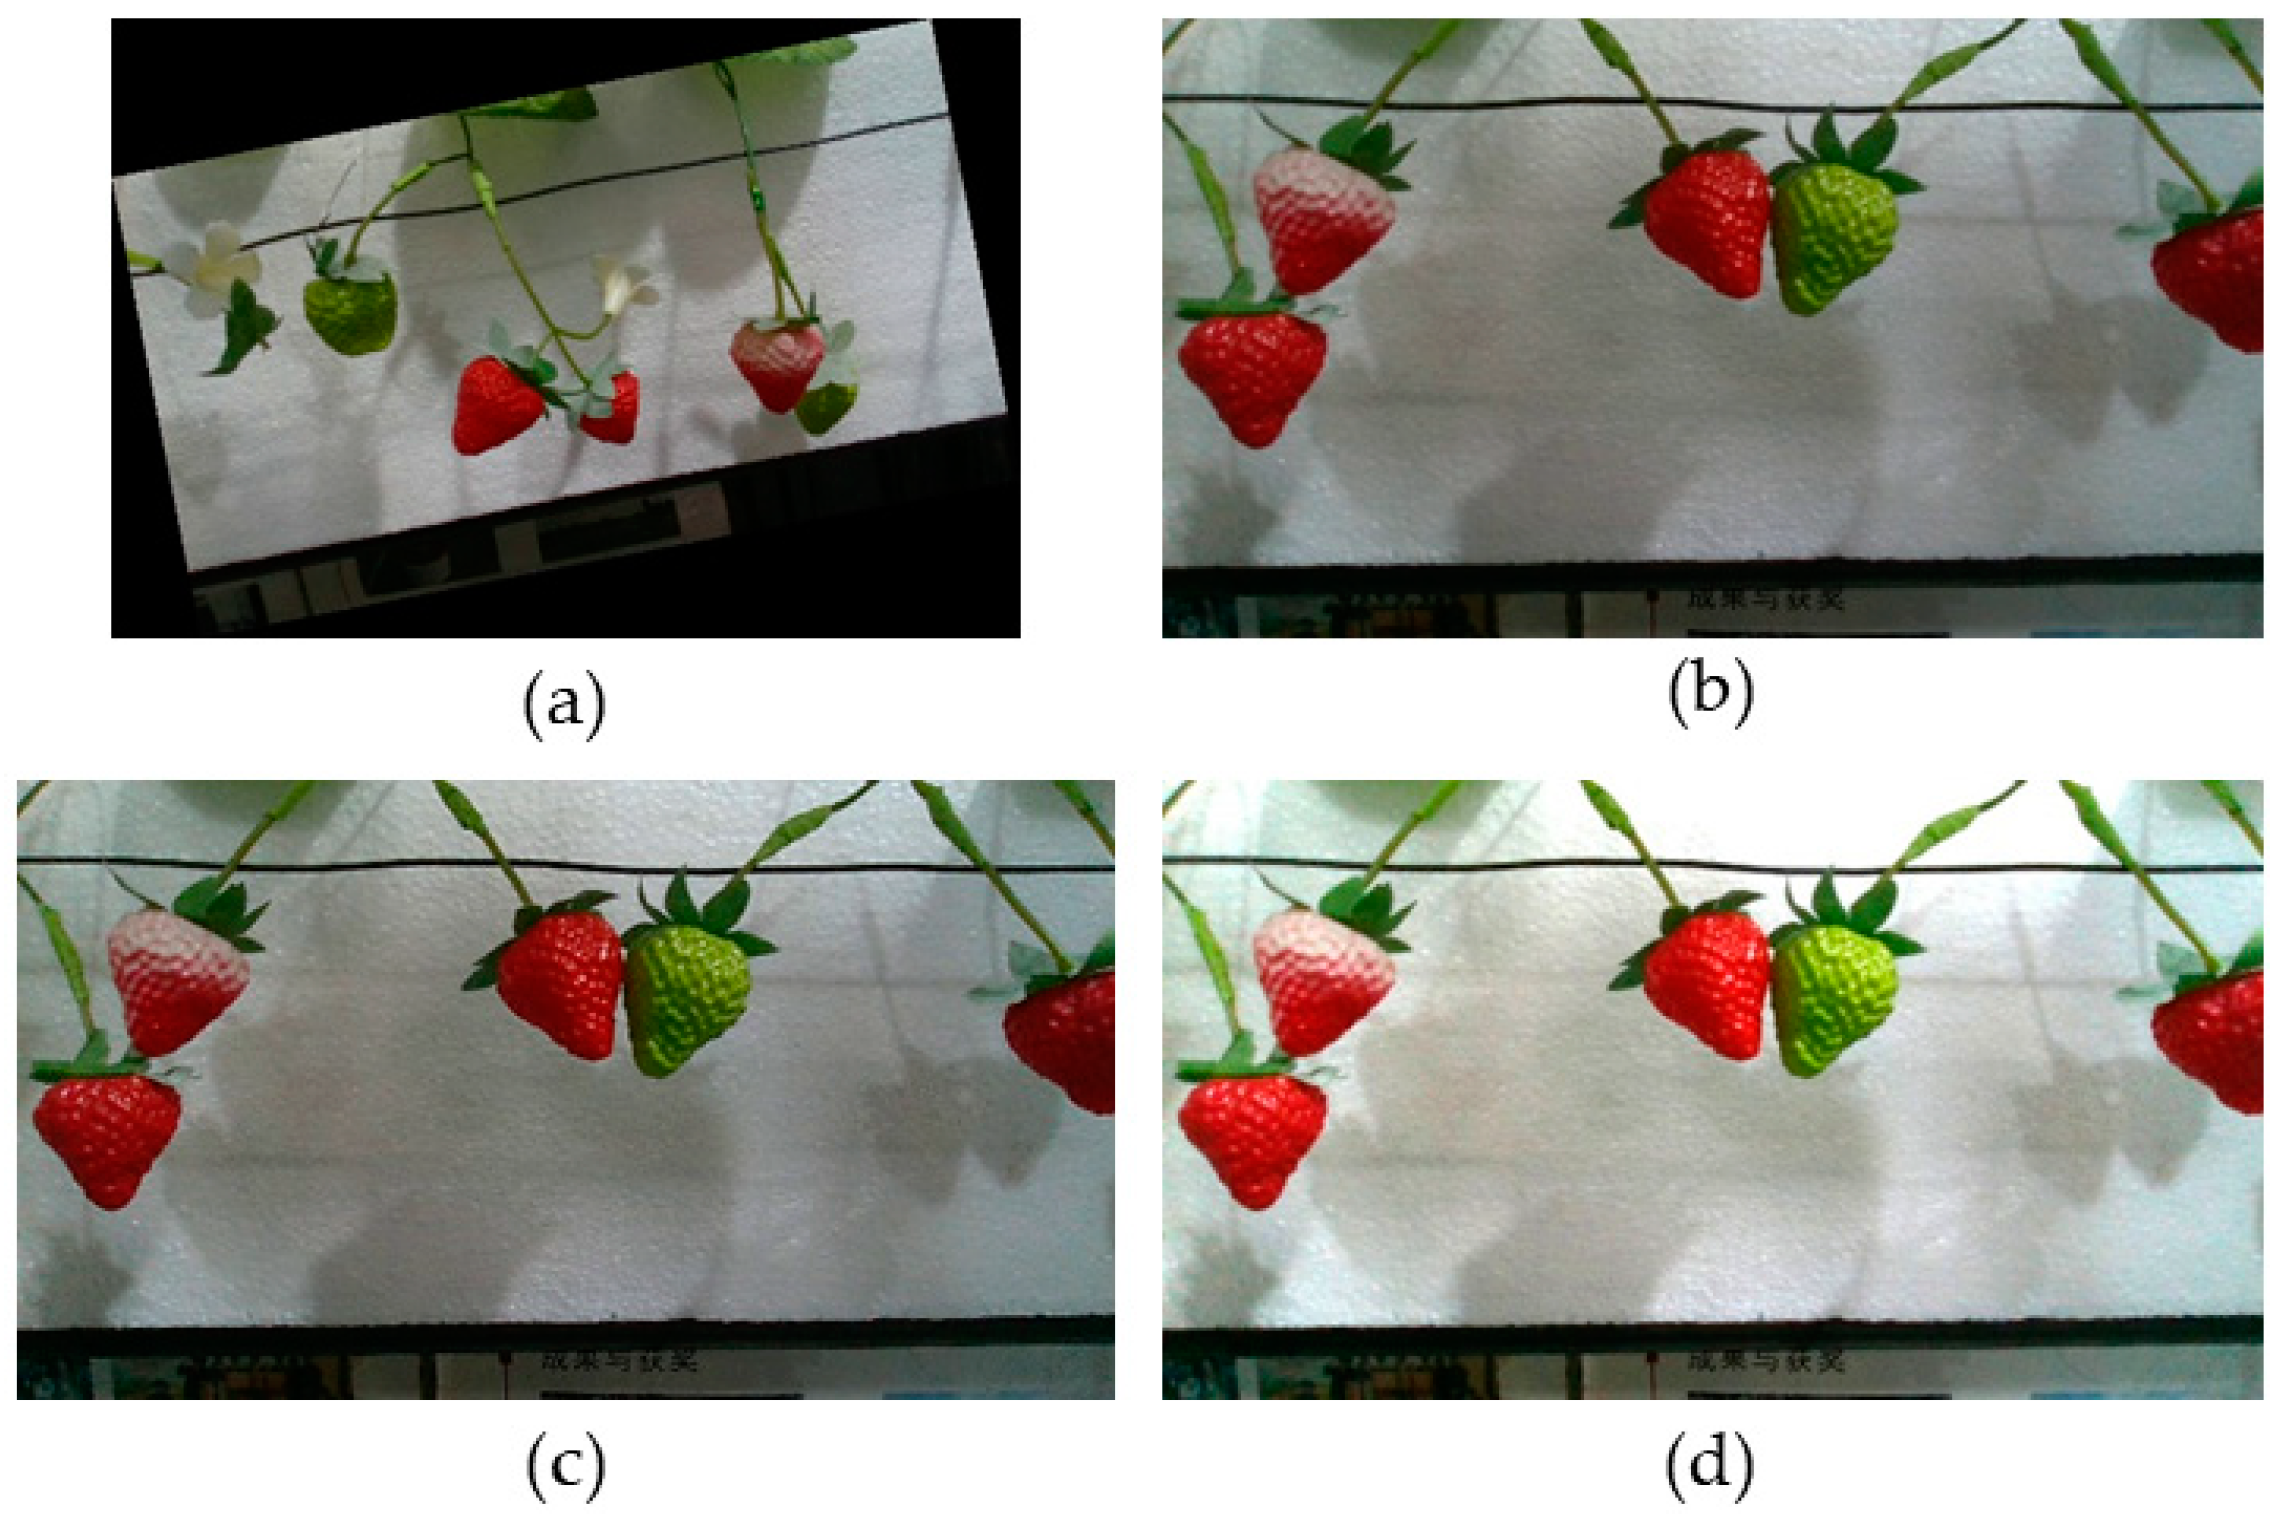
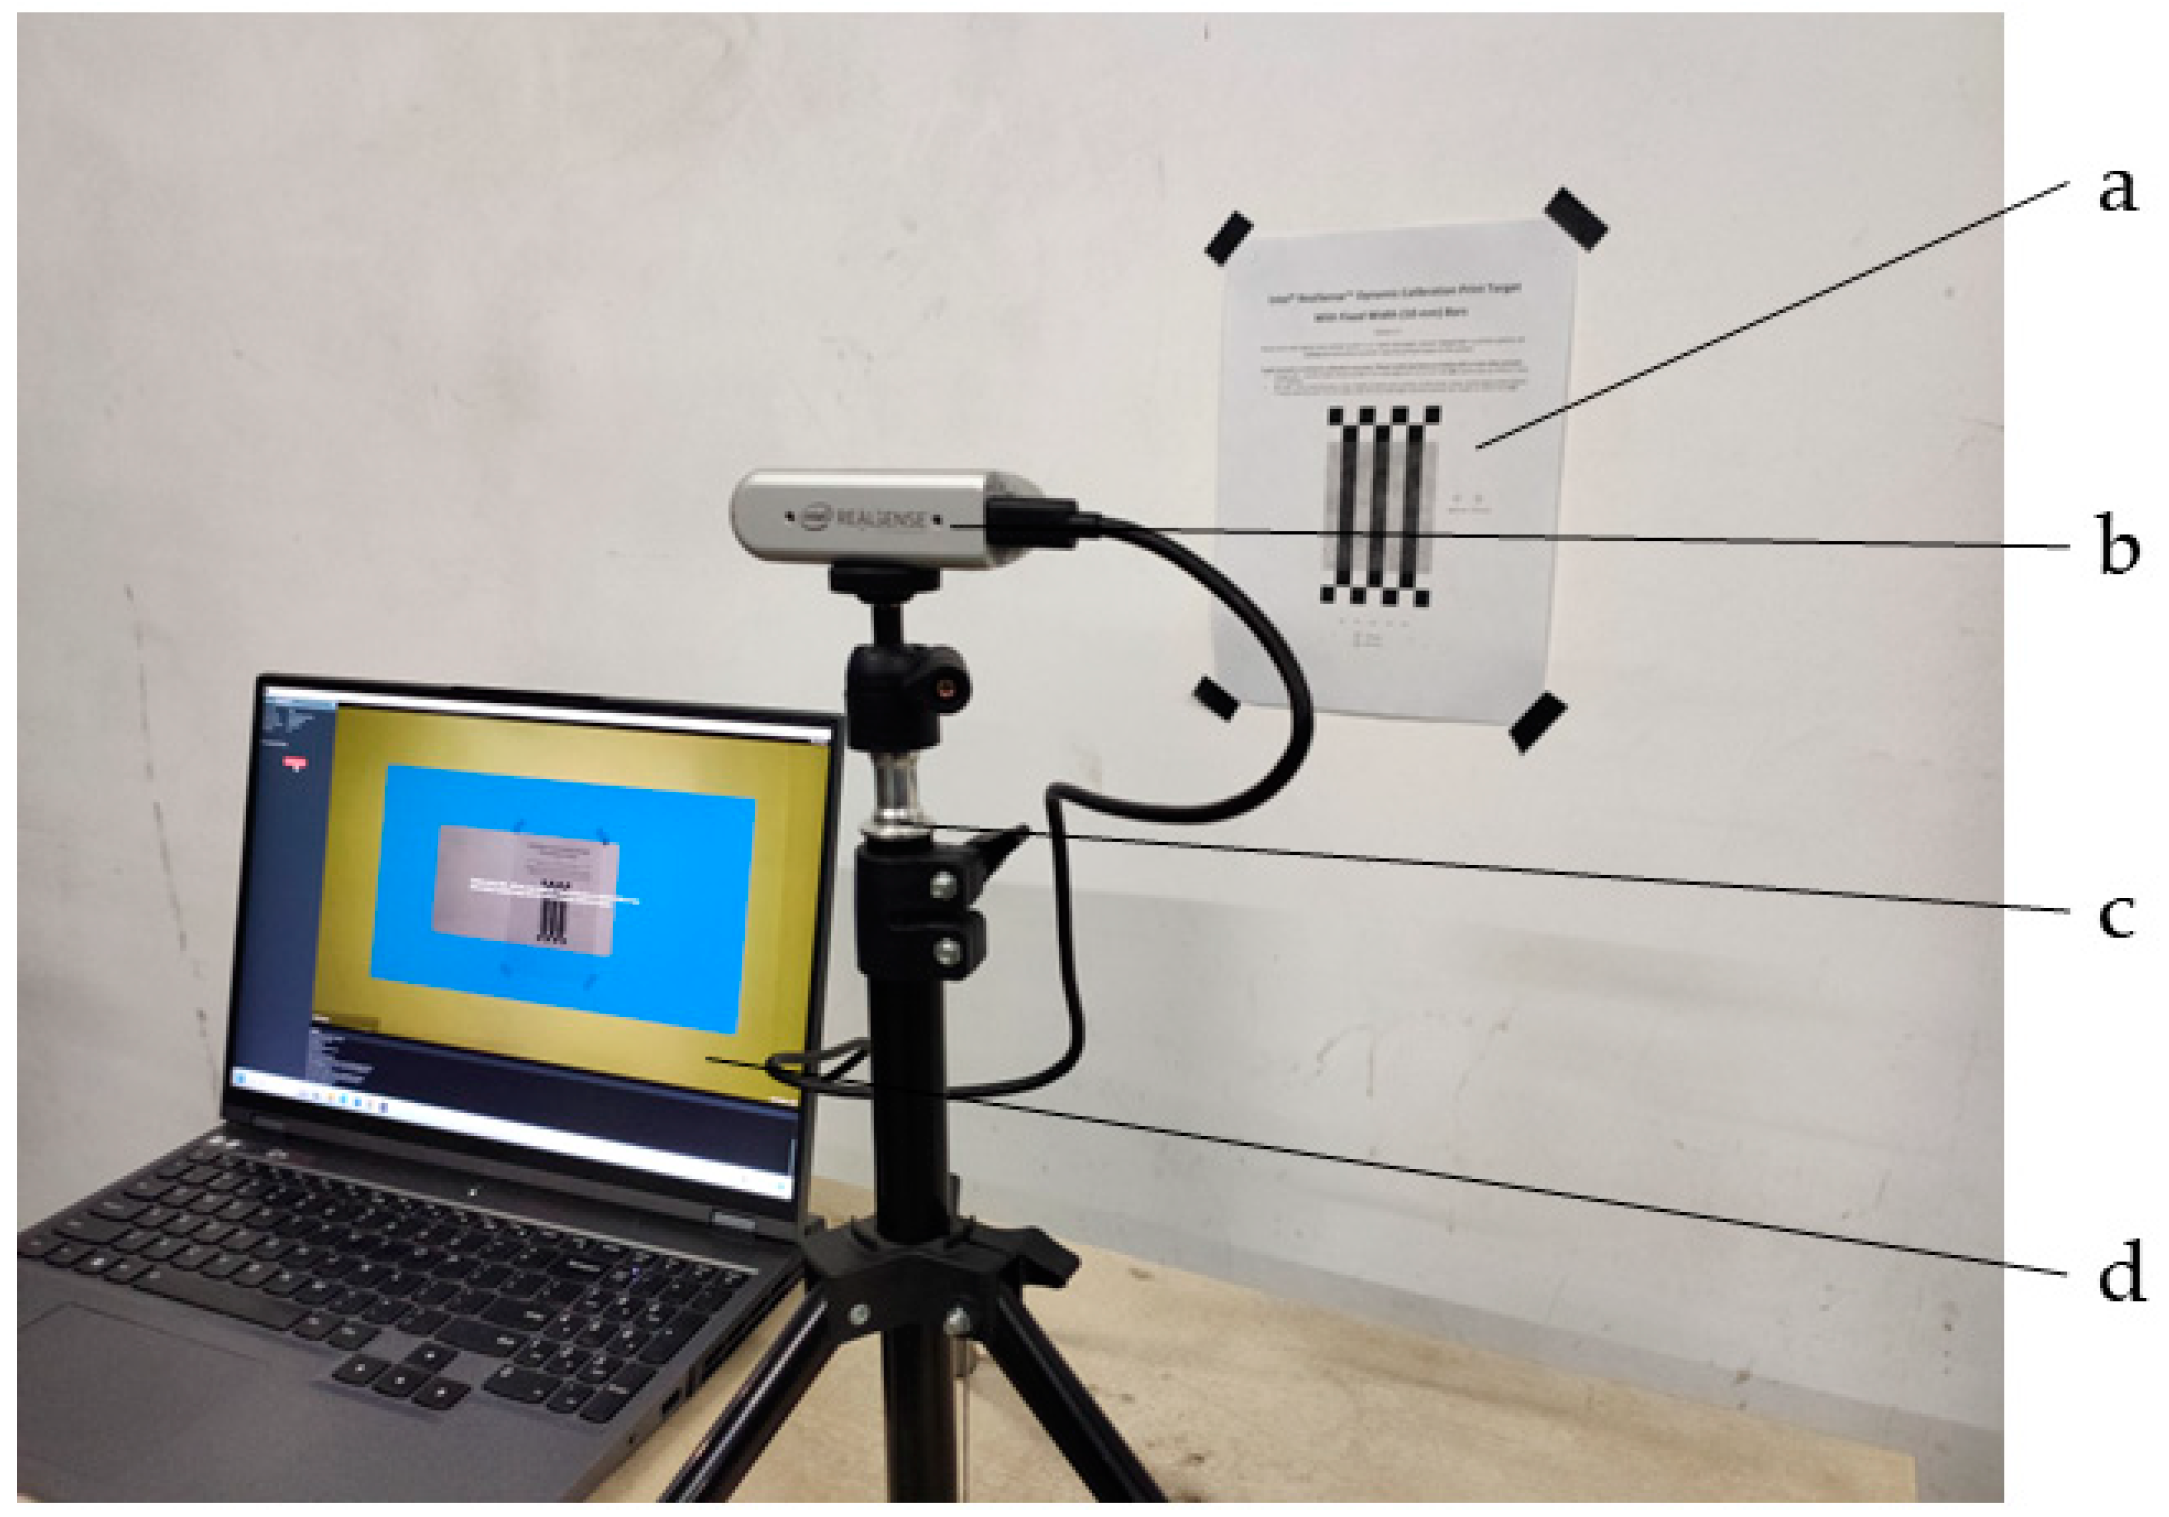
2.1.2. Image Acquisition

This study used an RGB-D camera (RealSense D435i, Intel, Santa Clara, CA, USA) to collect the dataset on the elevated-substrates strawberry scene. This camera has two infrared stereo sensors and an infrared emitter, which are primarily used to detect depth. It also has an RGB image sensor that can obtain RGB images. In addition, the D435i has an inertial measurement unit (IMU) sensor that measures its current acceleration and angular velocity to calculate its attitude. Several studies on fruit picking [5,9,11] have chosen to use RealSense depth cameras because they can identify the depths of objects more accurately than other models, which is necessary for picking. The D435i is exceptional in that it can use a suitable range of approximately 0.1–10 m within its scope. Table 1 illustrates this camera’s parameters.
Before using the D435i, it was necessary to dynamically calibrate it to prevent depth measurement inaccuracies that might result from wear and daily usage. After installing the RealSense camera Dynamic Calibration Tool on the computer, the calibration paper was printed, calibration program was initiated, and rectification and scale calibration were completed (Figure 2). Post-calibration, the Depth Quality Tool was employed to verify the calibration results. The calibration was deemed successful if the depth value error was within the acceptable range of 2 mm.
We recorded a 10 min video with a resolution of 1280 × 720 pixels at 30 frames per second. From this video, we extracted an image every five frames. We selected one in every six of these images based on clarity, forming a dataset of 600 images. These dataset images underwent rotation (Figure 3a), salt-and-pepper noise addition (Figure 3b), sharpening (Figure 3c), and brightness adjustment (Figure 3d), all of which resulted in a total of 3000 experimental dataset images.

2.1.3. Training Environment

Strawberries have a fragile surface and directly picking them will shorten their storage time; therefore, the best way to pick them is to cut the stem. Detecting the stem of a strawberry, using a deep learning network, is a complex challenge.
A series of image processing and geometric algorithms determined the positioning of the fruit stem. When marking, LabelImg software (version 1.8.6) uses rectangles to frame the area of the ripe strawberry (Figure 4).
Experiments in model development were conducted on a Windows 11 laptop using Python-based PyTorch and PyCharm for Python 3.8, with an NVIDIA GPU card (GeForce RTX 3070). Table 2 summarizes the hardware and software configurations for model development.

2.2. Strawberry Recognition

2.2.1. Baseline YOLOv7 Network

The object detection algorithm encompasses both single-stage and double-stage algorithms. Yu et al. used Mask-RCNN and other two-stage algorithms to detect strawberry and fruit stems, but the detection speed could not meet the real-time requirement [23]. As a single-stage algorithm, YOLO has become a popular choice for real-time object detection. It not only detects velocity blocks but, also, has a high detection accuracy rate. YOLOv7 performs well in real time, demonstrates high precision, and has improved on small target detection compared to the previous version; therefore, the YOLOv7 model was selected for this study, and further improved, to better adapt to strawberry detection.
YOLOv7 is a single-stage object detection algorithm capable of achieving real-time performance and high accuracy. The YOLOv7 network model structure has three main parts: the input layer, backbone network, and head network [31].
The input layer mainly pre-processes incoming images through data augmentation and adaptive scaling. The backbone network includes Convolution, Batch normalization, the SILU (CBS) module, Efficient Layer Aggregation Network (ELAN), and the Max Pooling (MP) module, facilitating feature extraction. The head network comprises Spatial Pyramid Pooling, the Cross-Stage Partial Channel (SPPCSPC) module, UPSample module, ELAN-H module, and the RepVGG block (REP) module, enabling object detection on feature maps. YOLOv7 offers the following advantages: enhanced training and prediction efficiency, using ELAN architecture, and better control of the gradient path. It combines the advantages of the YOLOv5 cross-grid search and the matching strategy of YOLOX. Additionally, YOLOv7 employs a training method that utilizes auxiliary heads, enabling enhanced detection accuracy without extending prediction times.

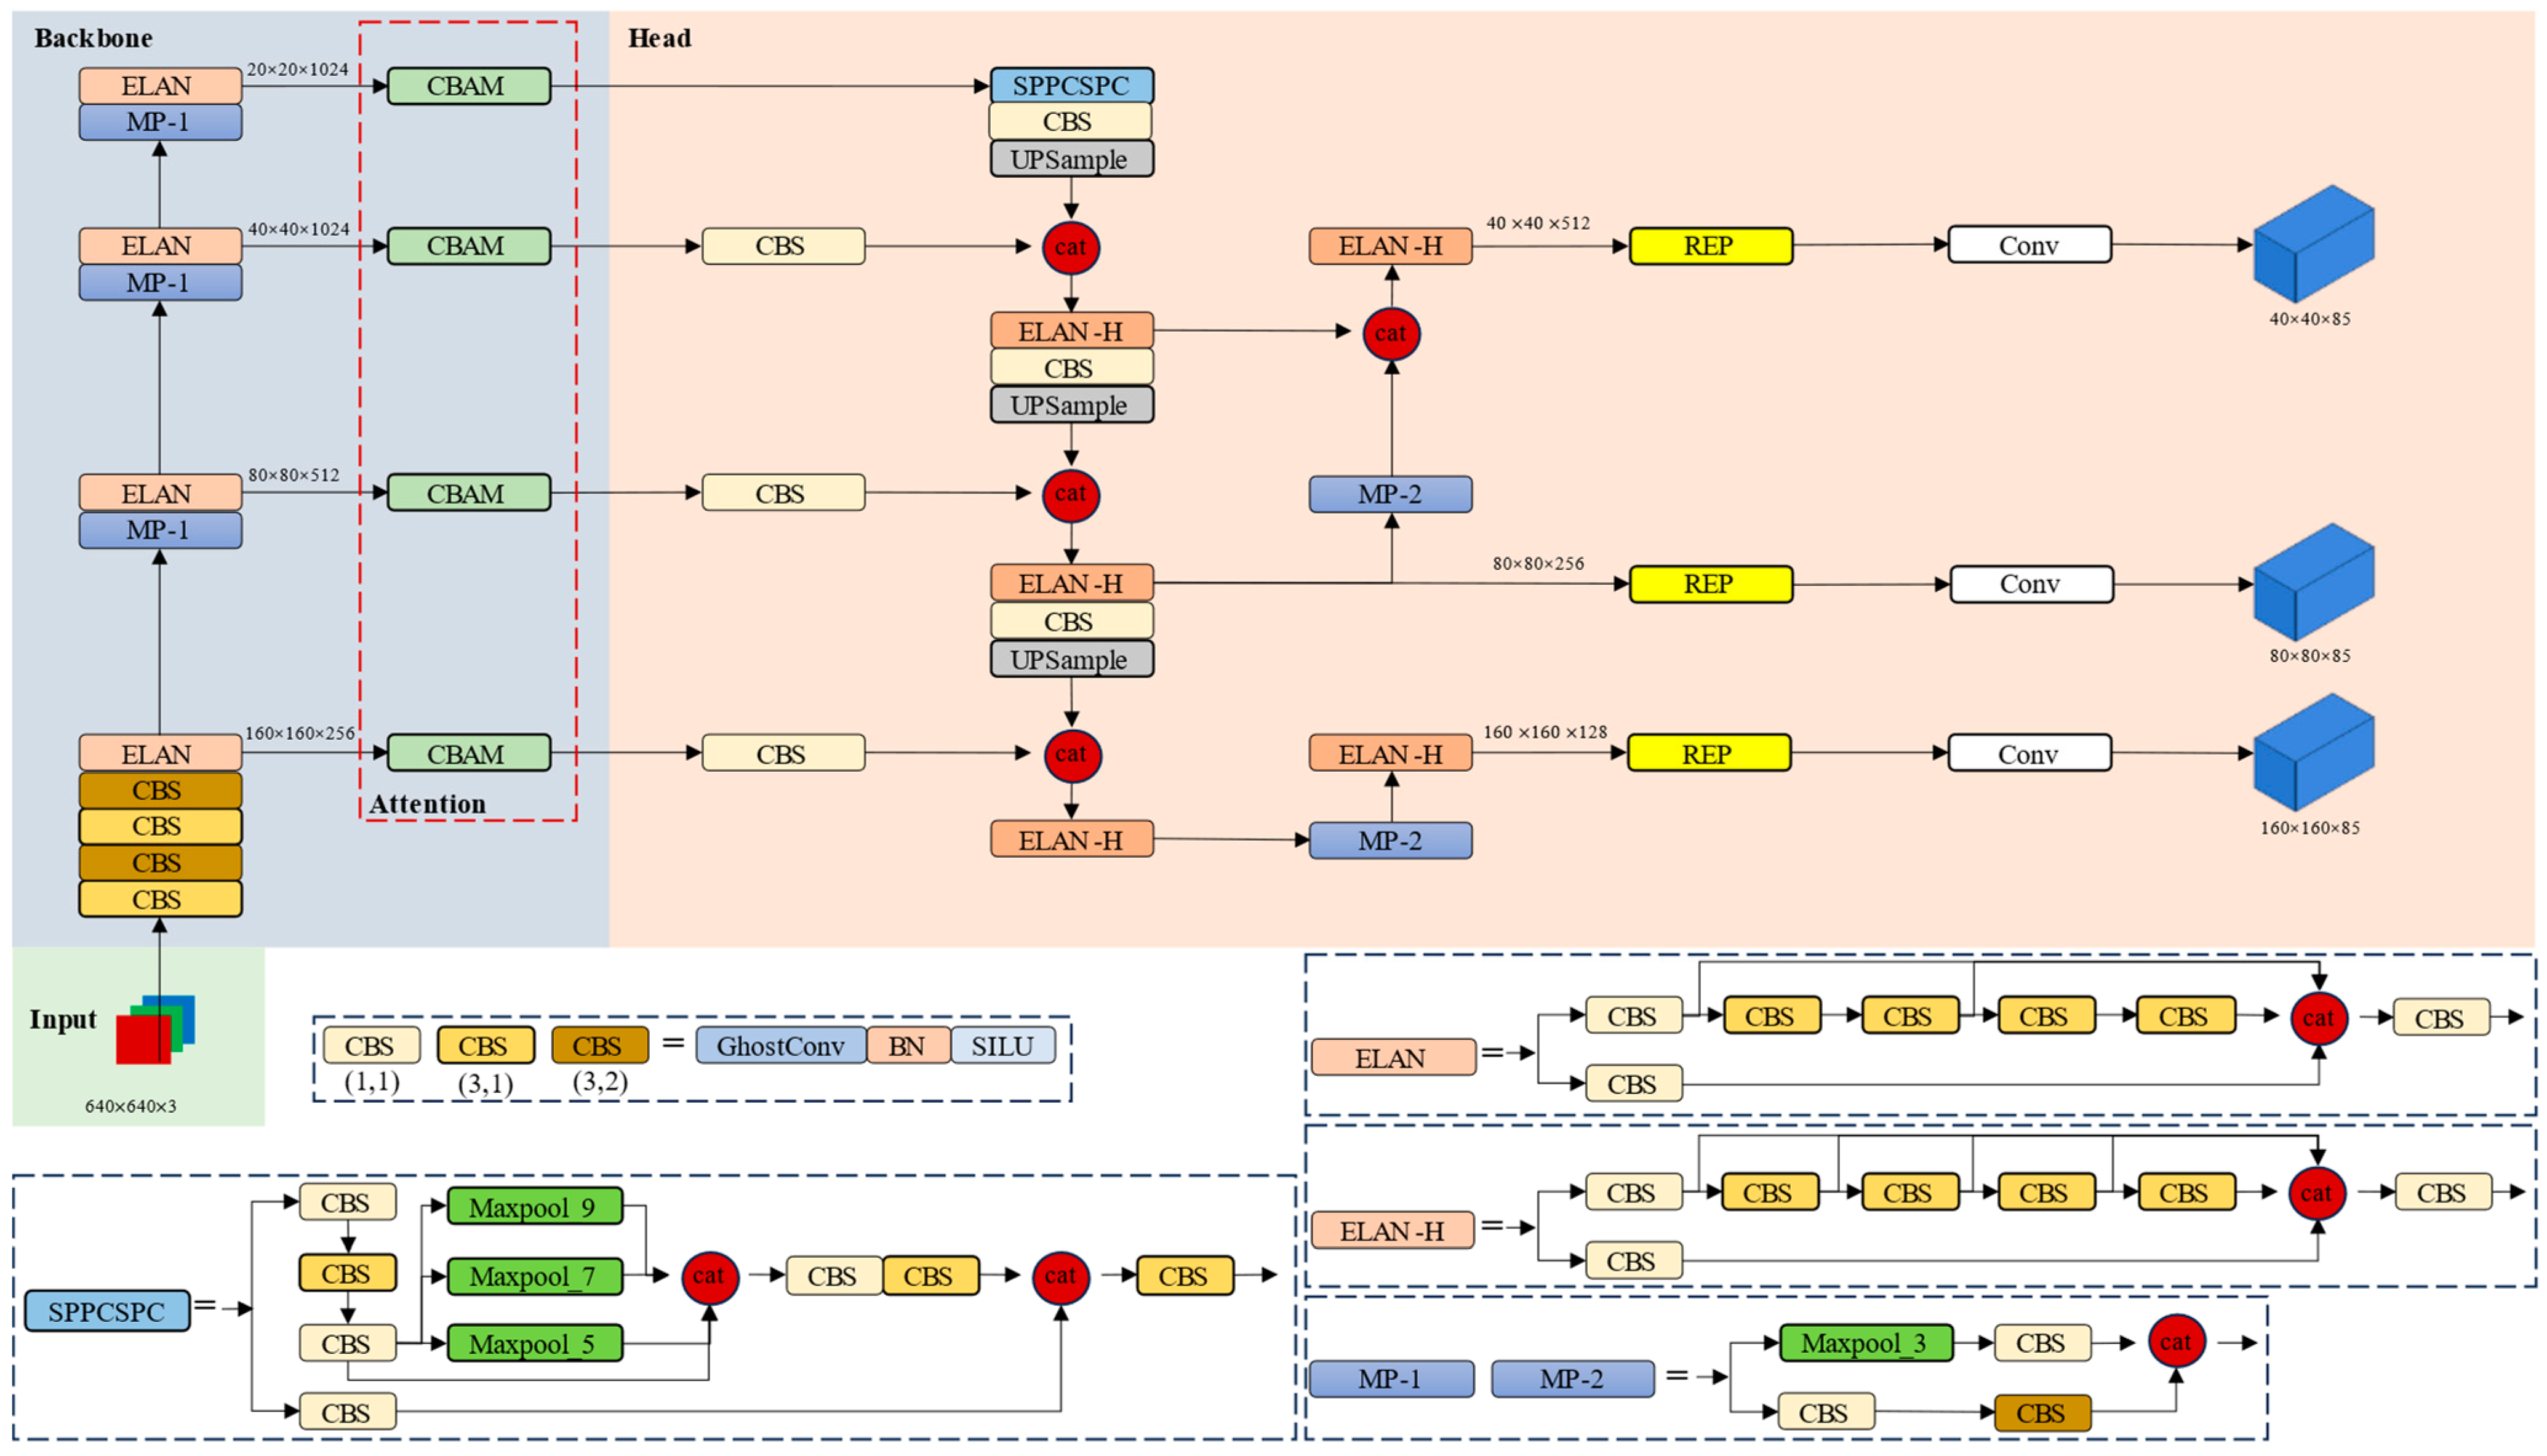
2.2.2. Improved YOLOv7 Network

To further improve the detection speed and accuracy of the model, this study improved the baseline YOLOv7 network. Figure 5 illustrates the improved YOLOv7 model structure. Firstly, the GhostConv module replaced the Conv module in the original CBS module, in order to improve detection speed. The conventional feature extraction method uses multiple convolutions to check all channels in the input feature map [32,33,34]. Stacking convolutional layers in deep networks requires many parameters and significant computation resources, producing many rich and even redundant feature graphs. GhostConv uses a smaller number of convolution checks for the feature extraction of the input feature map and, then, performs cheaper linear change operations on this part of the feature map. This reduces the cost of learning non-critical features, effectively reducing the need for computing resources, and the model’s performance is unaffected.
For the next stage, a Convolutional Block Attention Module (CBAM) was added after the last CBS module in the backbone network. This multiplied the output features of the channel attention module and the spatial attention module, element by element, obtaining the final attention-enhancing features [35,36]. These enhanced features could then be used to input subsequent network layers to suppress noise and irrelevant information while preserving critical information.
Finally, the last MP-2 and ELAN modules from the head network were removed; that is, the network removed the unnecessary 20 × 20 × 1024 feature layer and introduced the 160 × 160 × 256 feature layer to pay more attention to the detection of small targets [37].

2.2.3. Performance Evaluation Index

In order to accurately evaluate the performance of the improved YOLOv7 model, we compared three commonly used performance indicators in the baseline YOLOv7 model and the improved YOLOv7 model: precision, recall, and mean average precision (mAP), which evaluate the degree of performance improvement in the improved model compared to the original model. The model operates in four prediction states: true positive (TP), which predicts a ripe strawberry sample among samples of ripe strawberries, and the prediction is correct; False positive (FP), which predicts an immature strawberry sample among samples of ripe strawberries, and the prediction is incorrect; True negative (TN), which predicts an immature strawberry sample among samples of ripe strawberries, and the prediction is correct; False negative (FN), which predicts a ripe strawberry sample among a sample of ripe strawberries, and the prediction is wrong. Precision and recall are defined as follows:
P r e c i s i o n = T P T P + F P
R e c a l l = T P T P + F N
The AP value is the area under the precision and recall (PR) curve, which can simultaneously measure the two precision and recall performance indicators. The mAP value is the mean of average accuracy; that is, the average accuracy of all detection categories is totaled and then averaged. The mAP value is defined as follows, where A P n is the average accuracy when detecting category n:
A P = 0 1 ( P r e c i s i o n ) d ( R e c a l l )
m A P = 1 n A P n n

2.3. Position of Picking Points

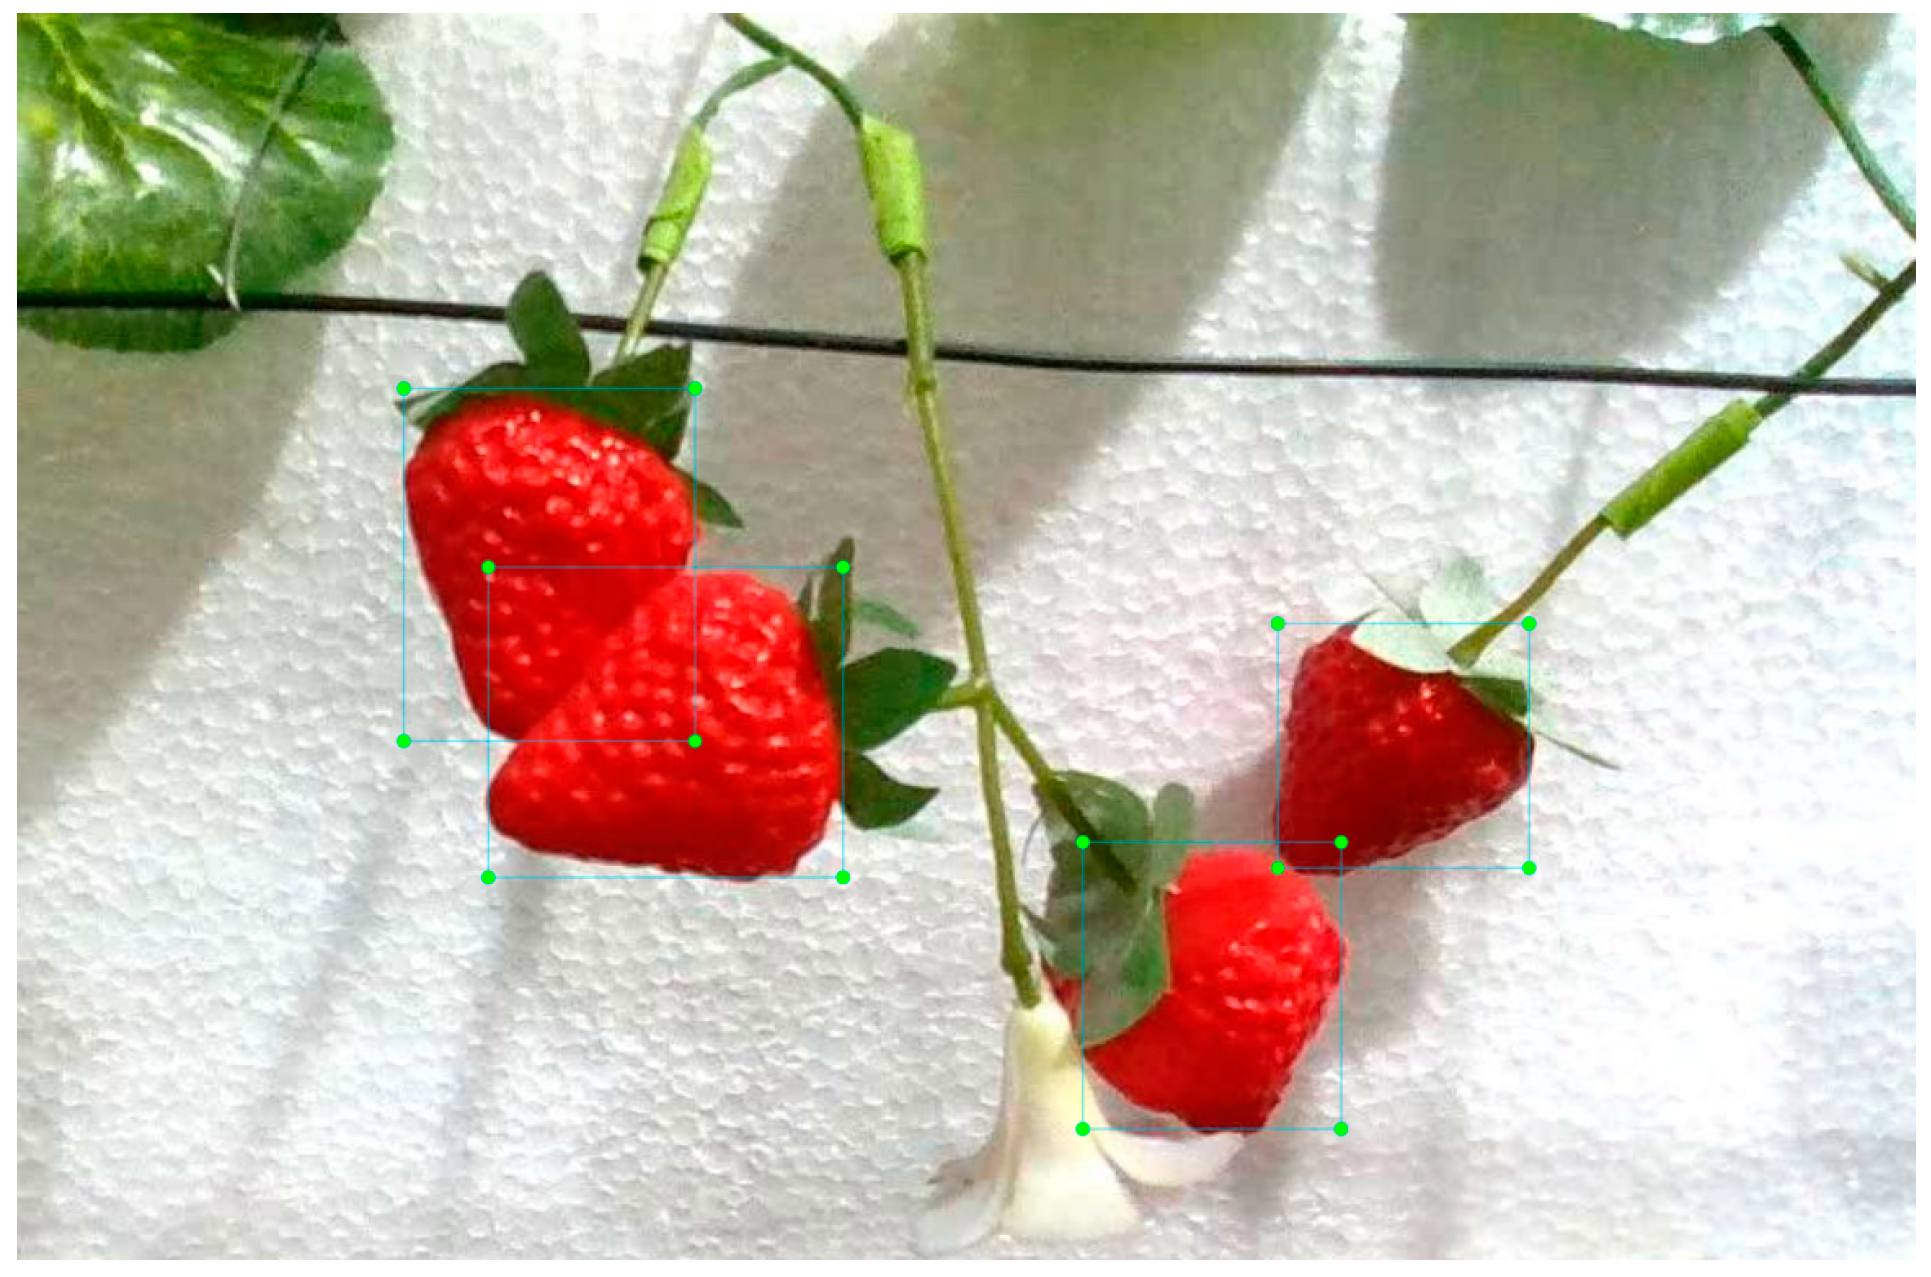
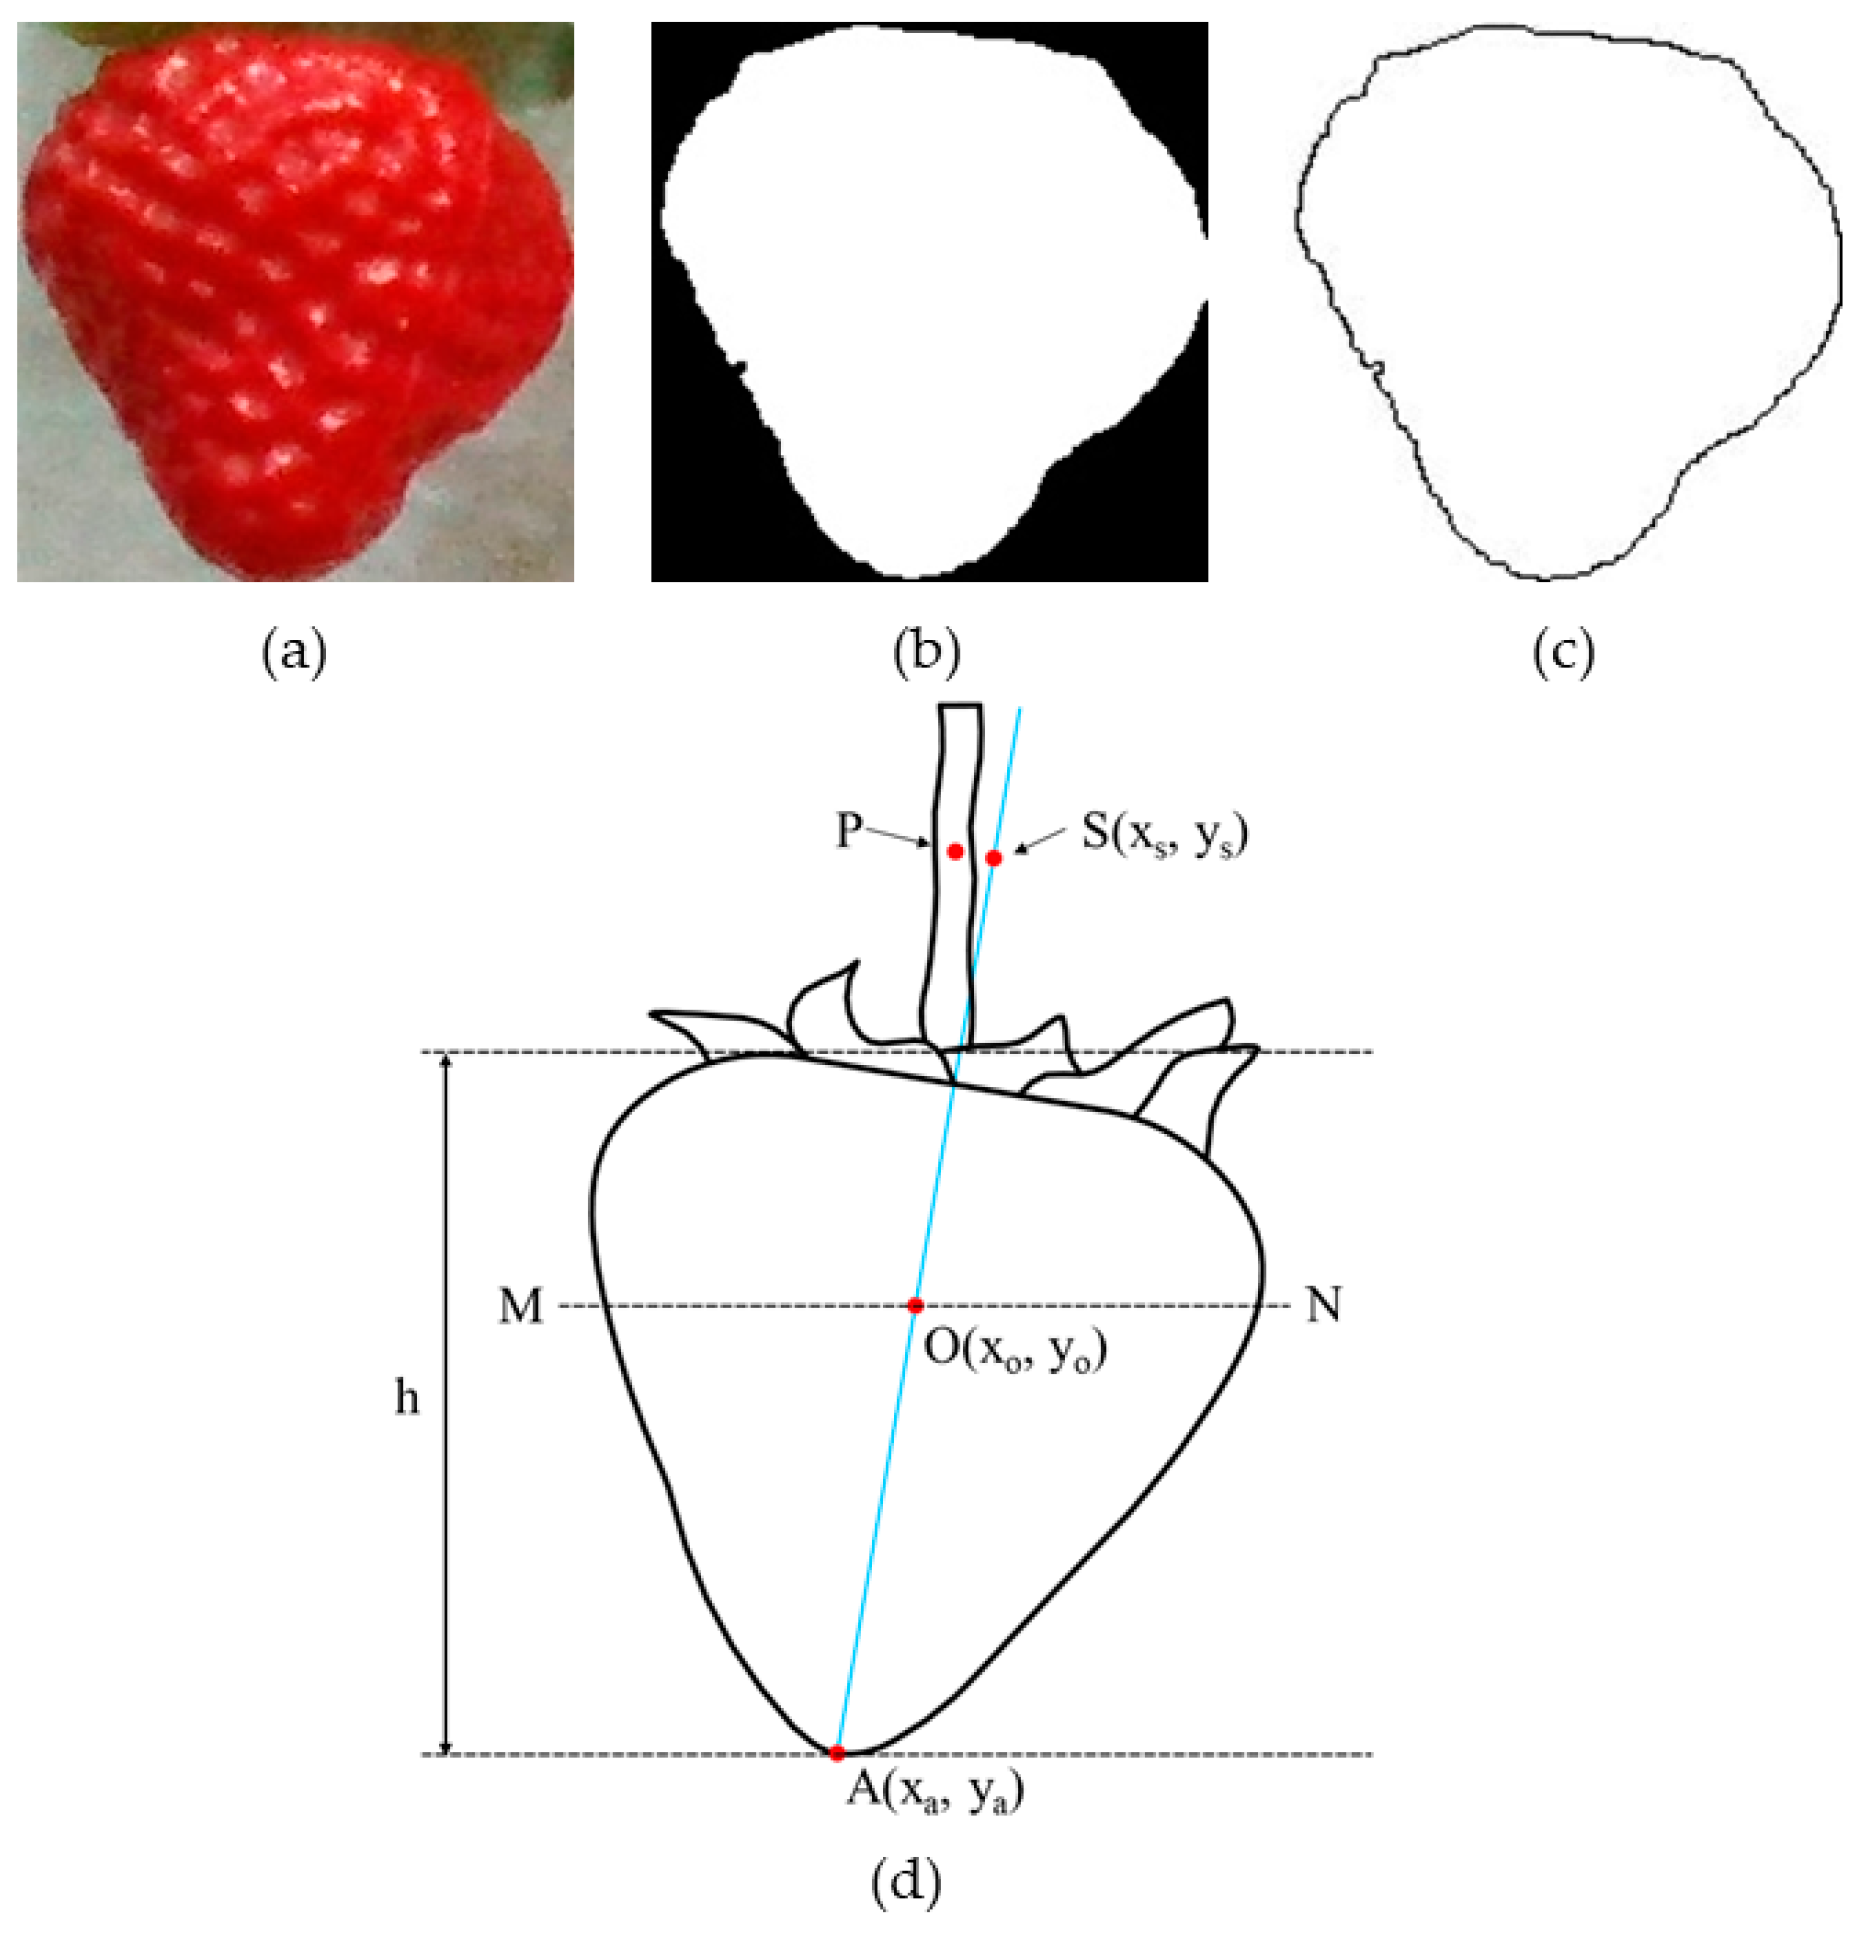
2.3.1. Positioning Method

After identifying the mature strawberries in the images using the deep learning model, any strawberries within each detection frame were cropped into smaller images (Figure 6a). To obtain the binary images and to edge the contours of the strawberry fruits, as depicted in Figure 6b and Figure 6c, respectively, we undertook threshold segmentation and edge extraction.
Because the surface of a strawberry is prone to rotting after squeezing, which affects the quality of that strawberry, it is advisable to avoid touching the fruit during strawberry picking. Strawberry stems are located near the fruit axis. The picking point can be precisely positioned above the fruit axis for subsequent harvesting with the aid of geometric calculations, which find the fruit axis. Point P on the stem represents the ideal picking point (Figure 6d). The process began by securing the strawberry’s binary image and edge contour, in order to identify an optimal picking point close to P. Then, the connected region centroid algorithm was used to calculate the strawberry’s centroid O, yielding its pixel coordinates as (xo, yo). Then, the distance from each point (xb, yb) on the strawberry contour below the MN line to the centroid was calculated using the distance formula:
d = ( x o x b ) 2 + ( y o y b ) 2
The decision not to calculate the distance from the centroid to each point on the whole contour of the strawberry was made because the tips of the elevated-substrate strawberry’s fruit point downward; therefore, calculating only the distance from the points below the MN line to the centroid reduces computational load and improves the practical results. Point A (xa, ya), usually near the fruit tip, and having a maximum distance d from centroid O, was then identified. Connecting OA and extending it defines the fruit axis. If xoxa, the slope k is given by
k = y o y a x o x a
The distance between the highest and lowest points of the strawberry contour is h. Picking point S (xs, ys) was then chosen on the extended axis of the fruit at a vertical distance from point O, typically located near the strawberry stem, where the remaining stem would be approximately 1–2 cm. The point S coordinate calculation is as follows:
x s = 2 h / 3 k + x 0       x o x a x o                                           x o = x a y s = y o + 2 / 3 h                                            

2.3.2. Picking Point Positioning Evaluation

In the previous section, we introduced the positioning method for the strawberry picking point used in this study: the positioning of the picking point is near the stem. We aimed to determine whether the picking point can successfully identify ripe strawberries, so we designed the following method: Due to the influence of its own gravity, the strawberry’s direction is downward, and the general direction of the fruit stem is also vertical in a downward direction. When cutting strawberries, we found it best to ensure the scissors plane of the end effector was perpendicular to the stem; therefore, when the robot picked the strawberry, the end effector scissor plane was horizontally close to the stem. This proved to be simple and effective in keeping the stem between the shear hands. The range of the cutting hand was optimum at 20 mm. In this study, the picking point was deemed valid if the calculated anchor point was less than 10 mm from the strawberry stem.
The horizontal camera field of view was set to α. The horizontal pixel of the captured image is given as u. When the picking robot performed successfully, the distance between the camera and strawberry is given as L. The 10 mm physical distance was then converted to the pixel distance in the image, given as u0. The actual distance between the camera and the object is U. The following relationships were established:
U = 2 L tan α 2
u 0 u = 10 U
These two expressions were converted to
u 0 = 10 u 2 L tan α 2
A horizontal line segment was made, with u 0 pixels on the left and right of the picking point for image positioning. If the line segment intersected the stem of the strawberry, the picking point was deemed effective.

2.4. Hand–Eye Calibration

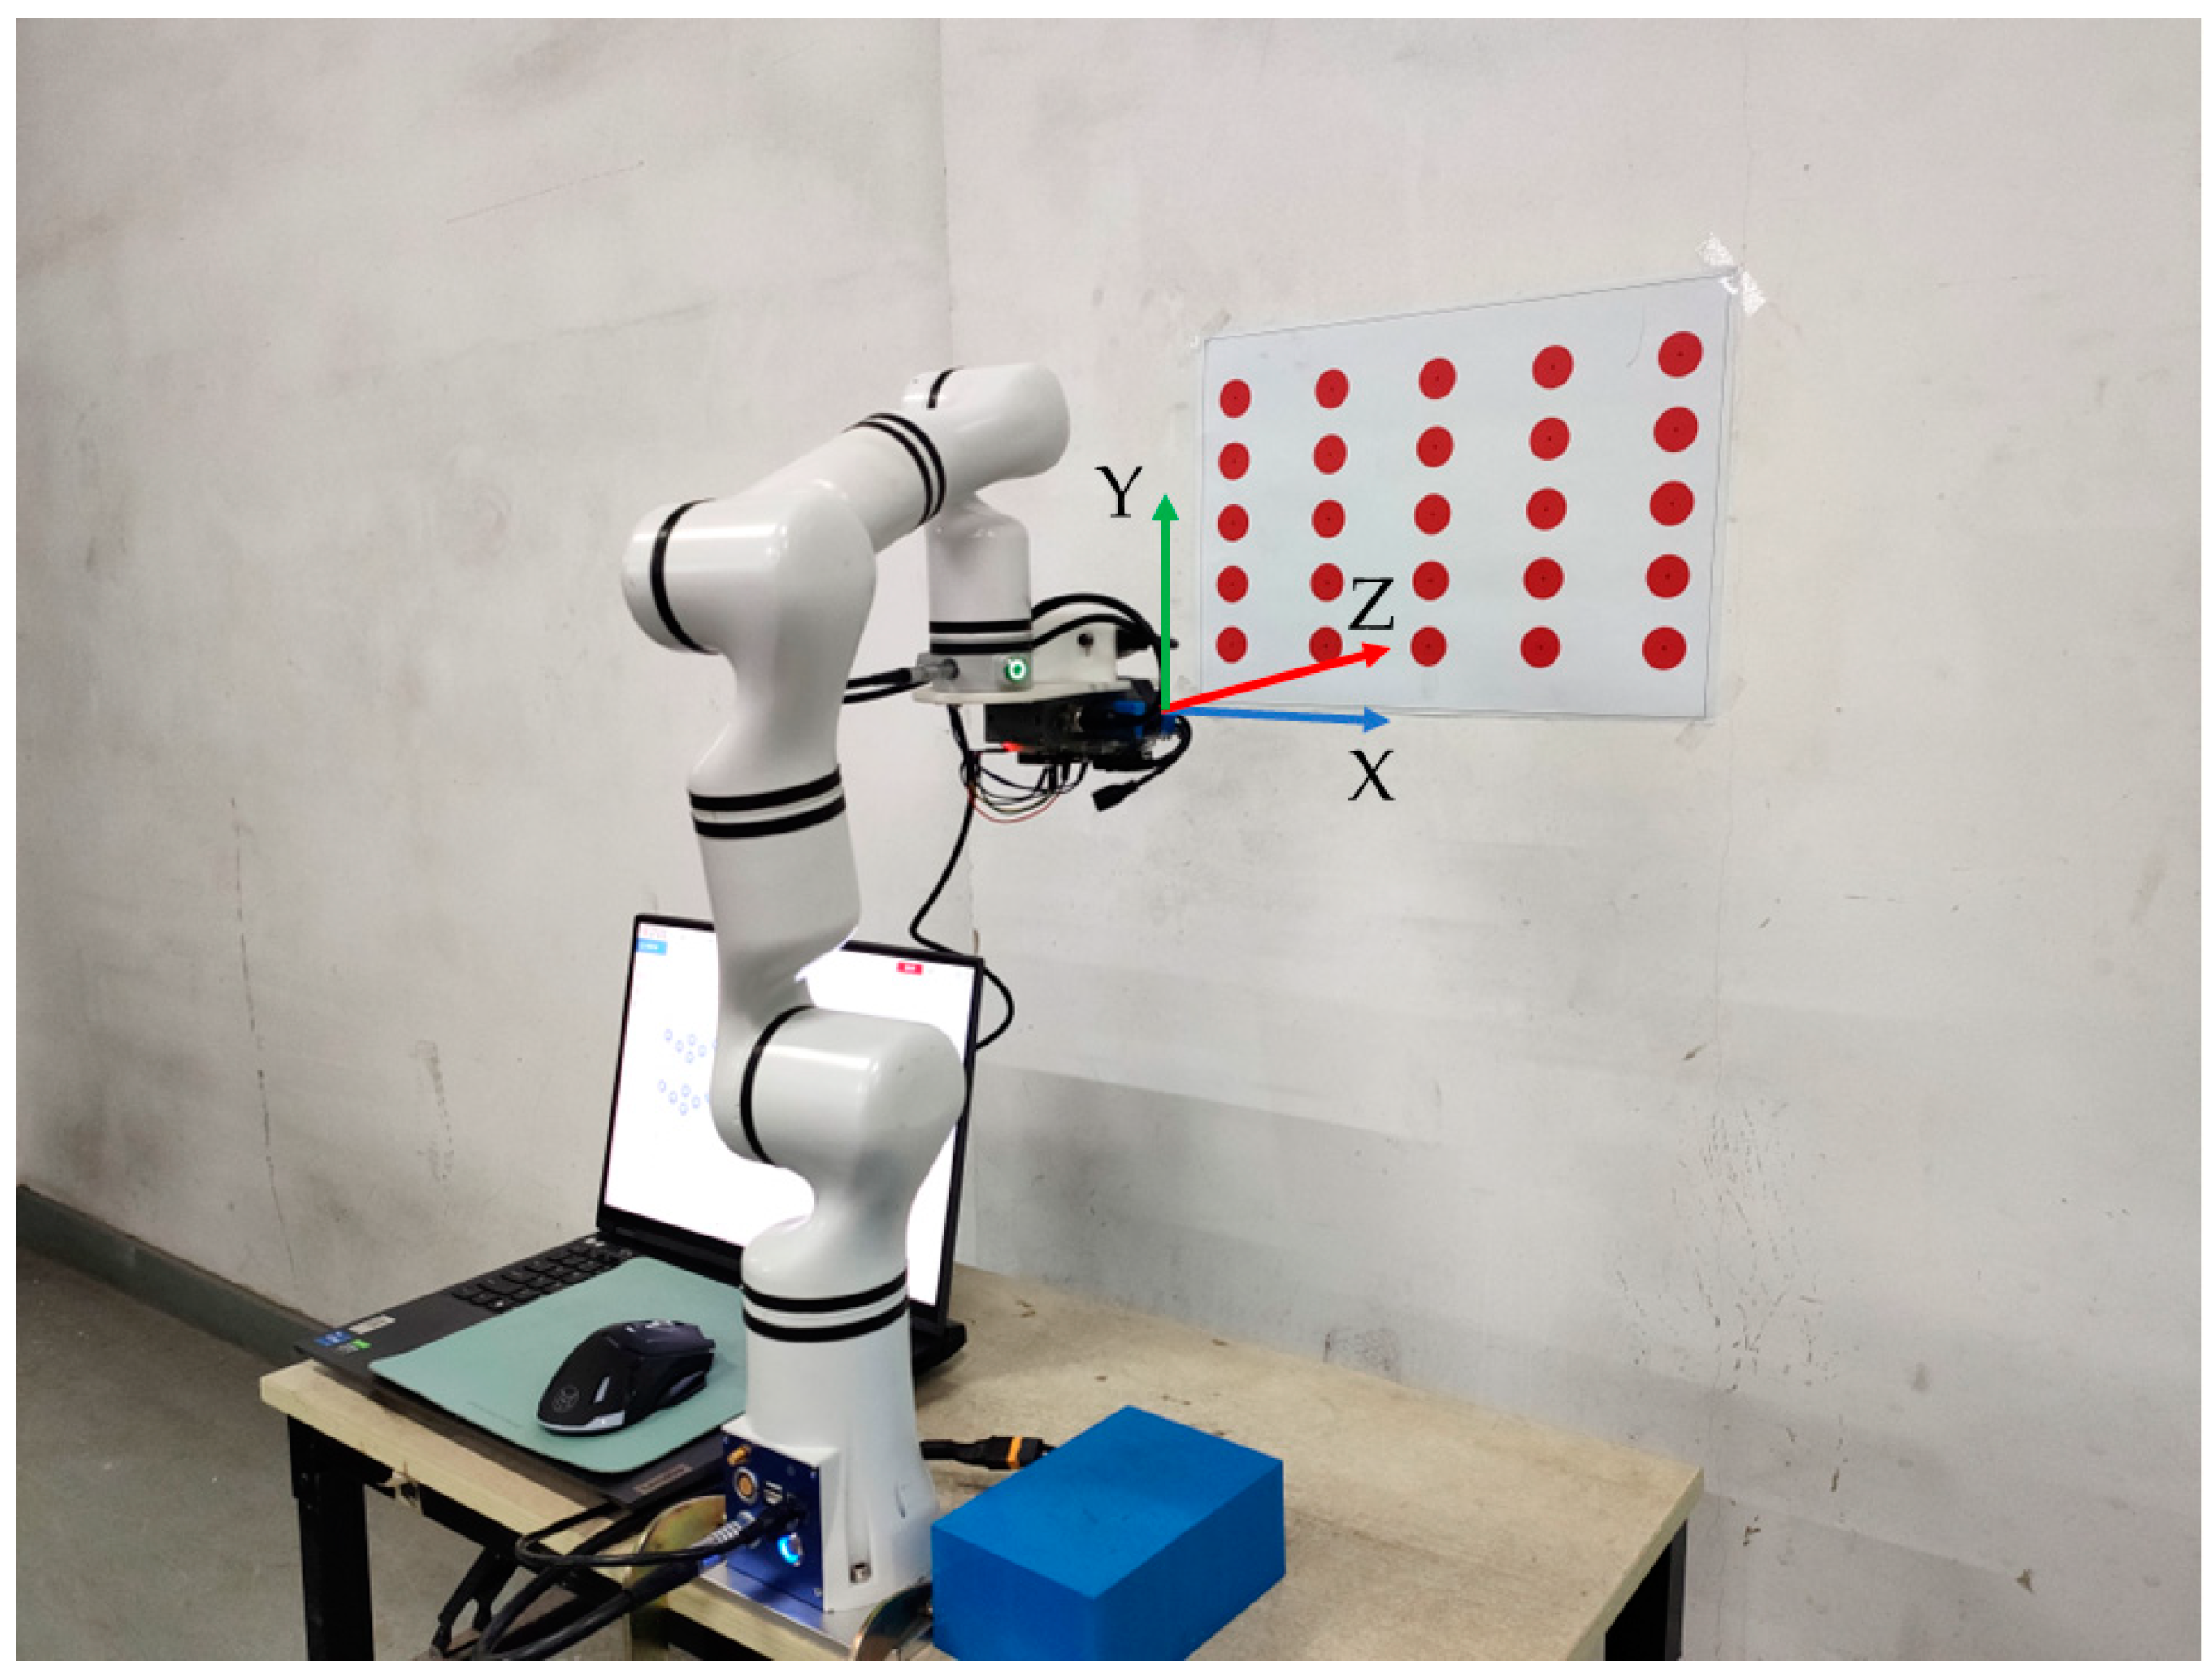
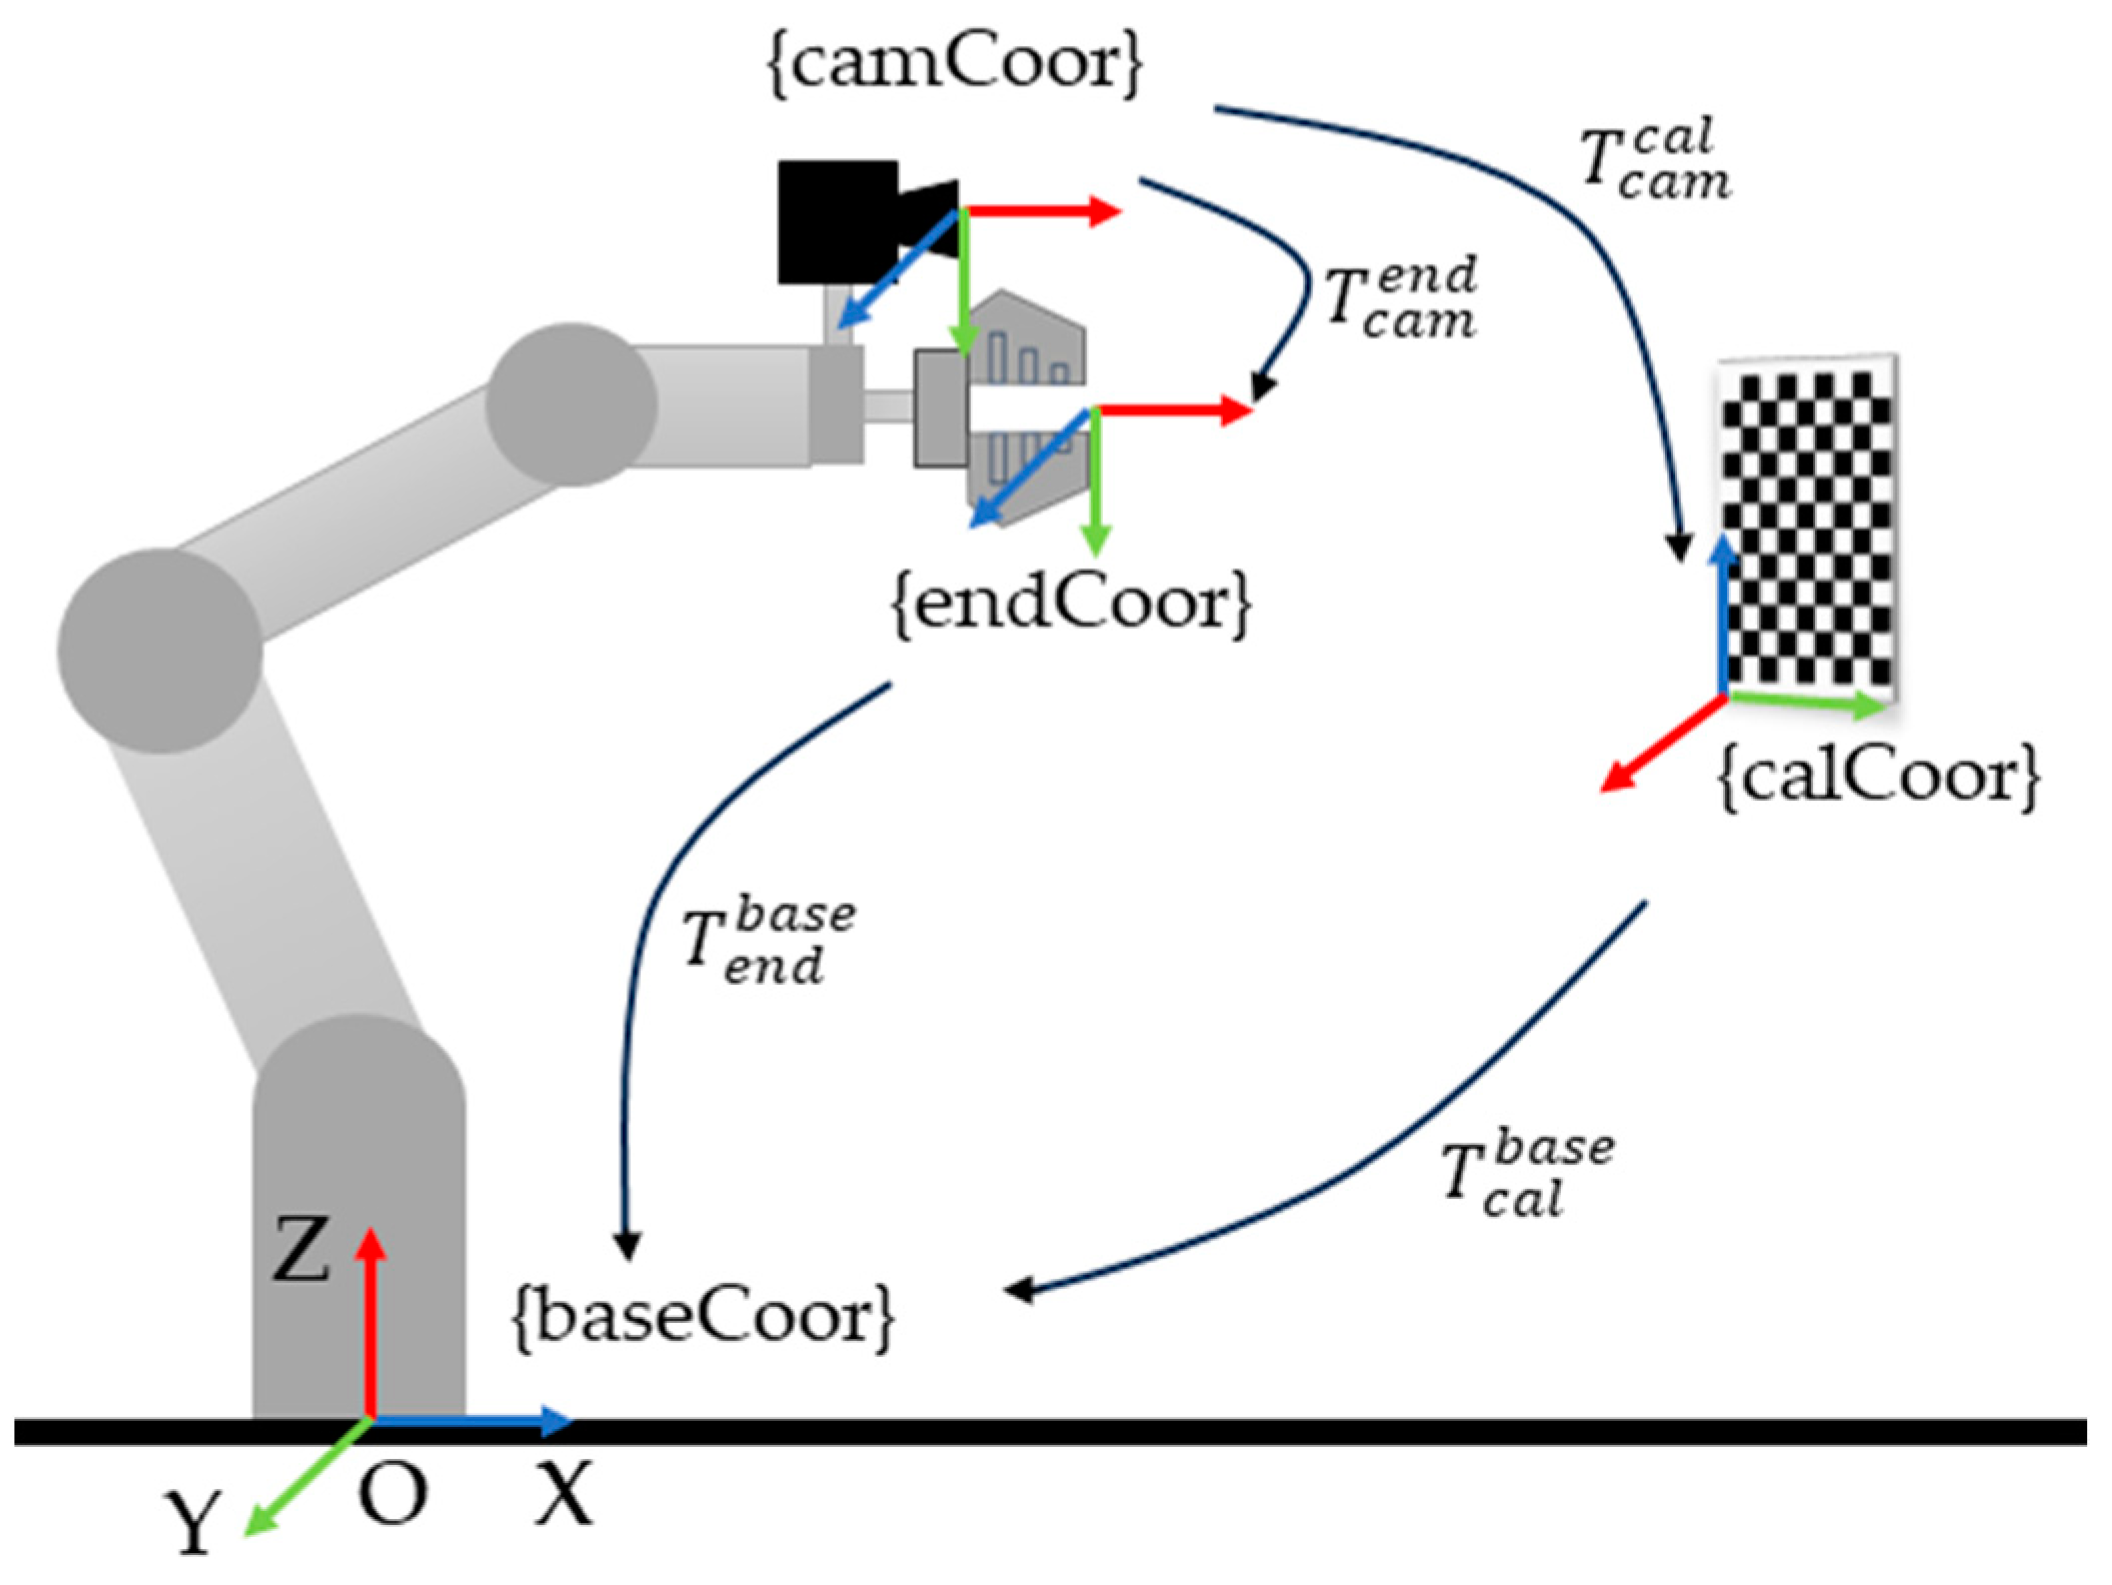
2.4.1. Calibration Method

The strawberry recognition and positioning methods introduced earlier are related to the RGB-D sensor. The strawberry picking robot needs to establish a connection between the robotic arm and the RGB-D sensor in order to form a complete visual picking robot system. Currently, there are two main ways to install a camera and robotic arm: the eye-in-hand and eye-to-hand. This strawberry picking robot in this study utilized the eye-in-hand mode, and the camera was fixed at the end of the robot arm and followed the movement of the robotic arm. When the camera was on the robotic arm, it was necessary to establish a connection between it and the robot arm; this is called hand–eye calibration.
The robotic arm used in this paper was an RM65-B, a 6-DOF robot from REALMAN ROBOT Co., Ltd., Beijing, China. The RM65-B is a lightweight series robot arm powered by a 24 V lithium battery. Its controller, for controlling the manipulator and external communication, is in the base of the manipulator. The total mass of the robot arm is only 7.2 kg, and the load it can bear is up to 5 kg. The robotic arm length is 850.5 mm, the working space is a sphere with a radius of 610 mm, and the cylindrical space directly above and below the base is the singularity region. The repeated positioning accuracy is ±0.05 mm, and the maximum joint speed is 225° per second.
As can be seen in the eye-in-hand calibration diagram (Figure 7), this system includes the manipulator’s base coordinate system, manipulator end coordinate system, camera coordinate system, and the calibration board coordinate system. Hand–eye calibration obtains the transformation matrix between the camera coordinate system and the robotic arm end coordinate system by calculating the transformation of coordinates among these coordinate systems. The conversion relationship between the manipulator’s end coordinate system and the manipulator’s base coordinate system is T e n d b a s e , denoted as A. A is known as it is obtained from the robot system during hand–eye calibration. The conversion relationship between the camera coordinate system and the end coordinate system of the manipulator’s arm is T c a m e n d , denoted as X. X is unknown and needs to be solved. The conversion relationship between the camera coordinate system and the calibration plate coordinate system is T c a m c a l , denoted as B. B is known as it is obtained by camera calibration. The transformation relationship between the calibration board’s coordinate system and the manipulator base’s coordinate system is T c a l b a s e . The relative position of the manipulator’s base and the calibration board does not change during the calibration process, so this transformation matrix does not change.
Eye-in-hand calibration involves mounting the camera and end effector to the robotic arm, fixing the checkerboard calibration plate, and moving the robotic arm so that the camera takes checkerboard photographs from different directions. Because the relationship between the robot arm base and the calibration plate is immobile, a relationship is established when the robot arm reaches position 1, 2:
T c a l b a s e = T e n d ( 1 ) b a s e T c a m e n d T c a m ( 1 ) c a l 1 T e n d ( 2 ) b a s e T c a m e n d T c a m ( 2 ) c a l 1
T e n d ( 1 ) b a s e T c a m e n d T c a m ( 1 ) c a l 1 = T e n d ( 2 ) b a s e T c a m e n d T c a m ( 2 ) c a l 1
This can be formulated as
A 1 X B 1 1 = A 2 X B 2 1 ,
which can be converted to
( A 2 1 A 1 ) X = X ( B 2 1 B 1 )
This is the solution to the X problem of the form A X = X B , which can be computed as
X = R T 0 1
R is a 3 × 3 matrix associated with rotations, and T is a 1 × 3 matrix associated with translations.

2.4.2. Calibration Error

This study conducted an error analysis experiment to apply a deep learning model and RGB-D sensor to the picking robot (Figure 8). A 16:9 error experiment target was self-designed to match the pixel size ratio of the depth camera’s RGB module. The target consisted of equidistant 5 × 5 red circles with black center points, printed in color on A3 paper and mounted on a well-lit wall. A depth camera was mounted at the end of the robotic arm. The arm was adjusted so that the optical center of the depth camera’s RGB module aligned with the center point of the error experiment target. Concurrently, the distance between the camera and the target was adjusted to ensure that the target was entirely within the camera’s field of view. This distance was recorded, and the camera’s IMU module was checked to adjust the camera plane so that it was parallel with the target plane. The coordinate system was, at that stage, at the end of the mechanical arm, as shown in Figure 8: the XY axis is parallel to the error experiment target, and the Z axis is perpendicular to the error experiment target. We enabled the camera to recognize each red circle and to calculate its centroid. The centroid coordinates were then translated to the coordinates at the end of the robot arm and recorded; these coordinates represent the actual picking point. Then, we used the robot arm’s teaching device to control the end of the arm so that it touched the black center point of each red circle in the same posture, and we recorded the coordinates. These coordinates represent the theoretical picking point.

3. Results and Discussion

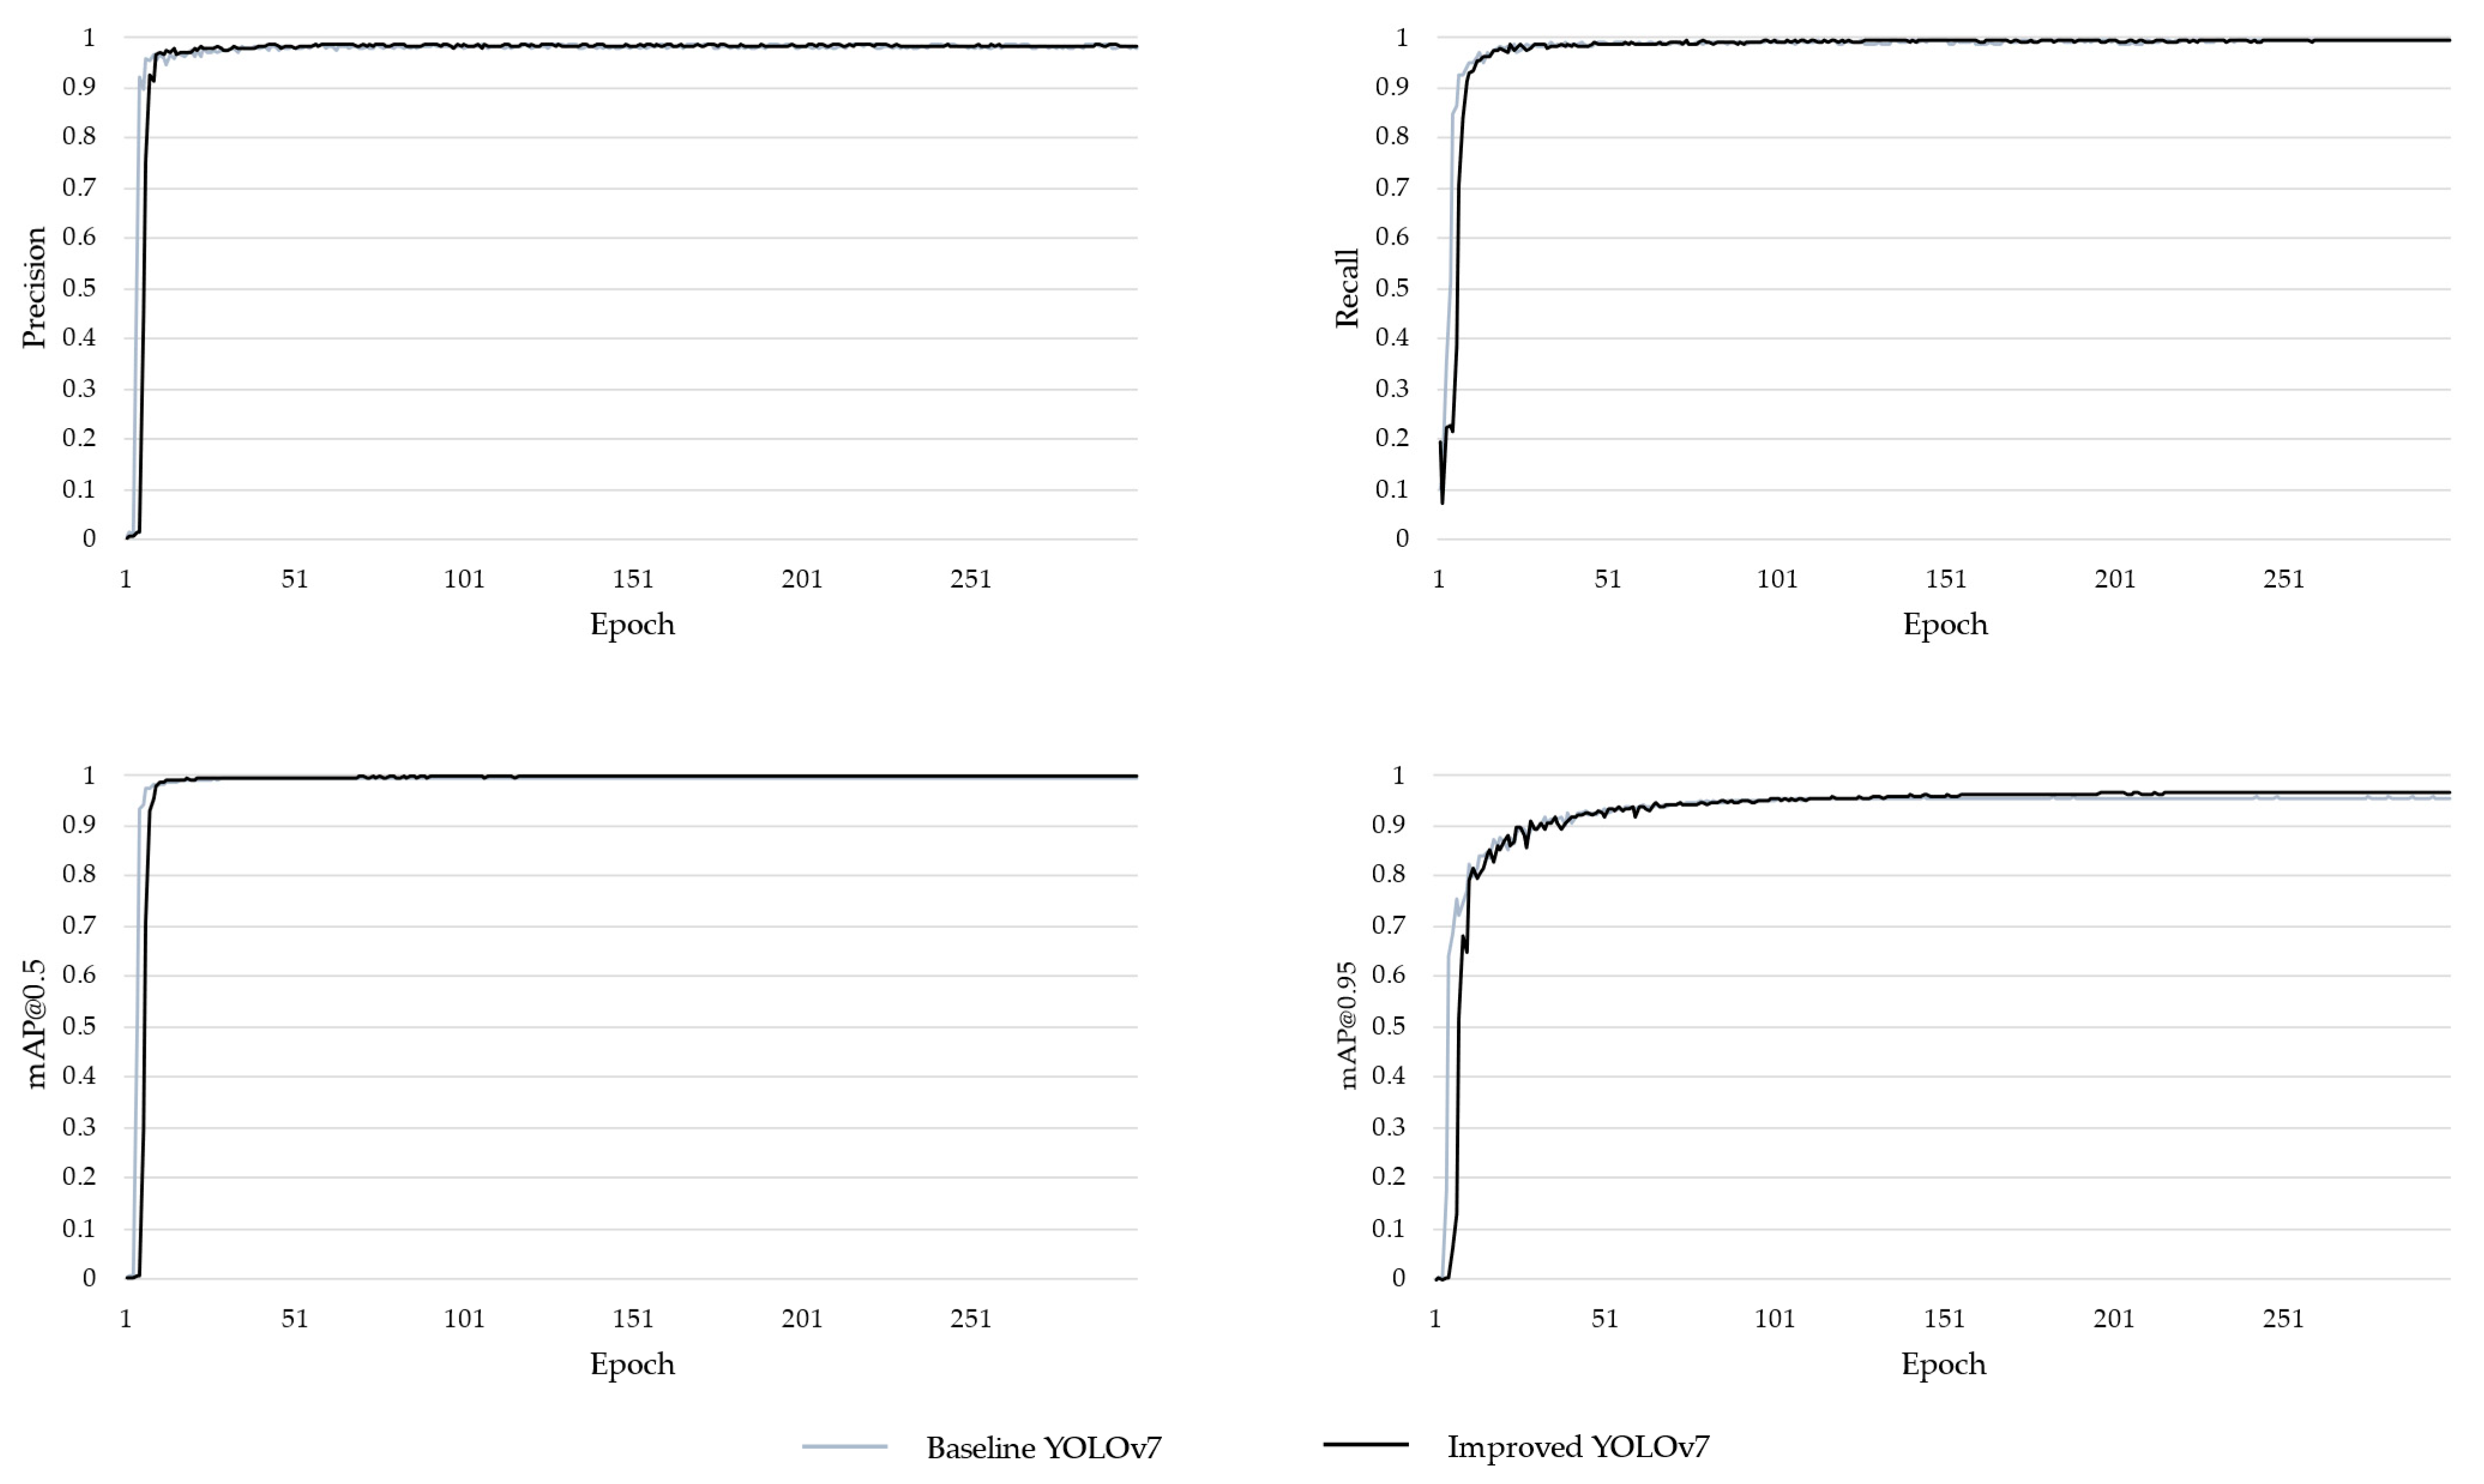
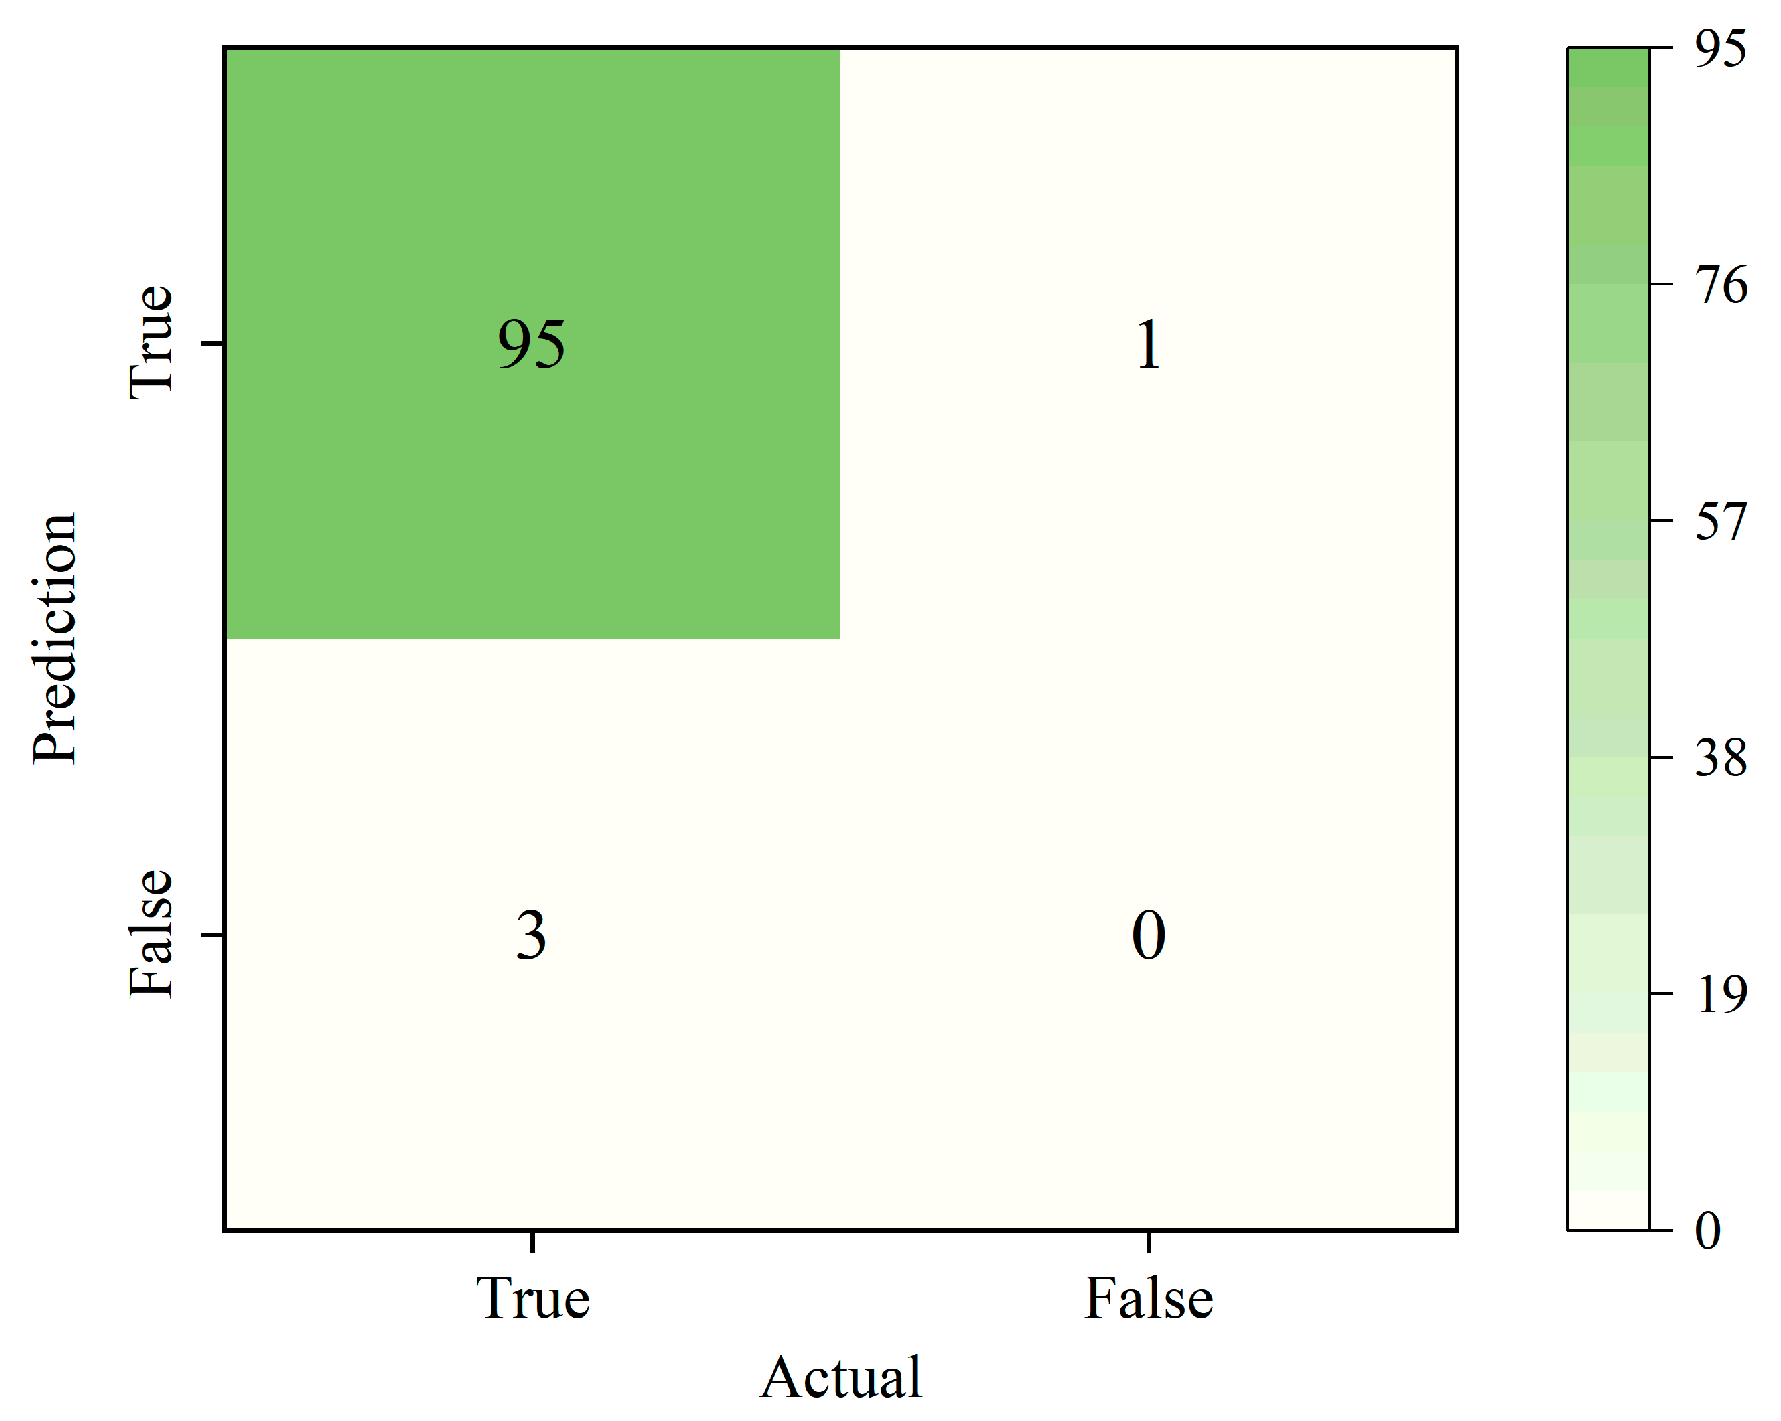
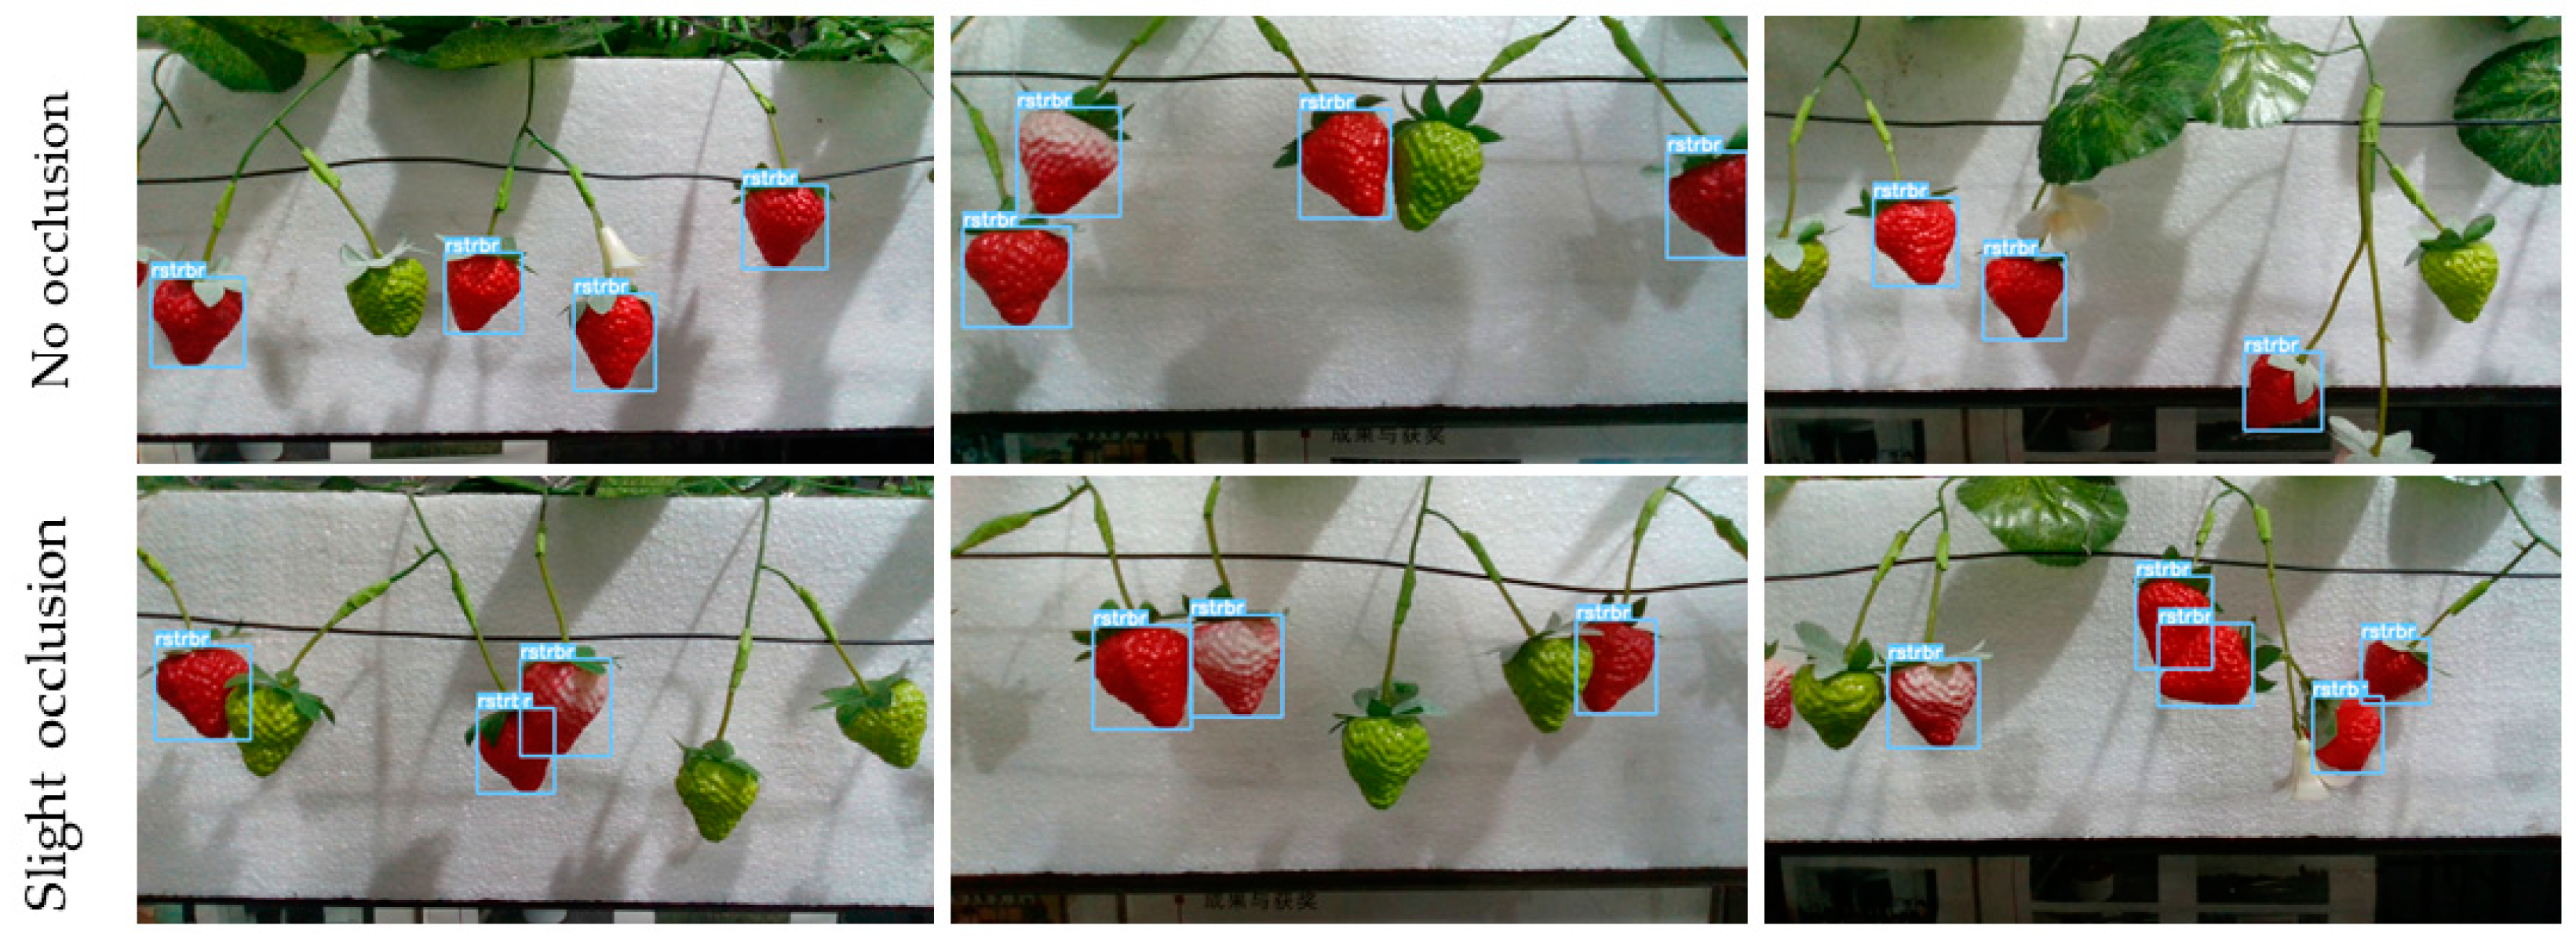
3.1. Strawberry Detection

The dataset was randomly divided into a training set (2100 images) and a validation set (900 images) in a 7:3 ratio. The input image was resized to 640 × 640 (pixels). The model training process found that the learning rate was too small, and the convergence too slow. If the learning rate is too large, the loss will fluctuate significantly. So, finally, we chose an initial learning rate of 0.001. The training epochs were 300. The batch size was eight, and Adam was selected as the training optimizer. We trained the YOLOv7 model and the improved YOLOv7 model to develop an elevated-substrate strawberry recognition model. The YOLOv7 model and the improved YOLOv7 were trained for 518 min and 373 min, respectively.
We compared the performance of the baseline YOLOv7 model to that of the improved YOLOv7. As illustrated by the trend in Figure 9, the prediction accuracy of the baseline YOLOv7 model was 98.0%, and its recall rate was 99.4%. The value of [email protected] was 99.6%, and the value of [email protected] was 95.4%. The prediction accuracy of the improved YOLOv7 model was 98.8%, and its recall rate was 99.2%. The [email protected] was 99.8%, and the [email protected] was 96.8%. We also compared the parameters of the two models (Table 3). The baseline model had 37.2 million parameters, 105.1 G Floating Point Operations (GFLOPs), and a model size of 74.8 MB. The improved YOLOv7 model had 15.0 million parameters, 61.2 GFLOPs, and a model size of 30.5 MB. The improved YOLOv7 model is significantly streamlined in terms of model size and complexity: the number of parameters was only 40.3% of that of the original model, the calculation amount was reduced by 41.8%, and the model size was reduced by 59.2%. Reducing the model size could also result in lower memory usage during inference. The processing times of the two models were compared according to the frame rate (frames per second, FPS) at the inference time to ensure that the reduced model size also reduced inference time. The original model operated at 18.7 FPS; the improved model operated at 3.6 FPS higher than that, reaching 22.3 FPS. According to the models’ performances and their various parameters, the improved YOLOv7 model proved to be superior to the baseline YOLOv7 model in detecting elevated-substrate strawberries.
In this study, research was conducted in a laboratory that simulated an elevated-substrate strawberry environment. It utilized the improved YOLOv7 model in its method. As can be seen in the confusion matrix in Figure 10, a total of 98 ripe strawberries grew in this environment: 95 were successfully detected, three were not successfully detected, and one false detection was registered. The TP was 95, FP was 1, TN was 0, and the FN was 3. The results demonstrate a detection precision of 99.0%, and a recall of 96.9%. Figure 11 shows the detection results of the model, accurately identifying ripe strawberries, either without shelter or with shelter and hay. The results provide information for improving conditions for the subsequent localization of strawberry picking points and robotic picking. Compared to the convolutional neural network method used by Habaragamuwa et al. [23], and the improved convolutional neural network method used by Lamb et al. [30], the improved YOLOv7 model increased accuracy rates by 11% and 14.8%, respectively. We conclude that the improved YOLOv7 method for identifying ripe strawberries proposed in this paper is highly accurate and is suitable for identifying and detecting strawberries.

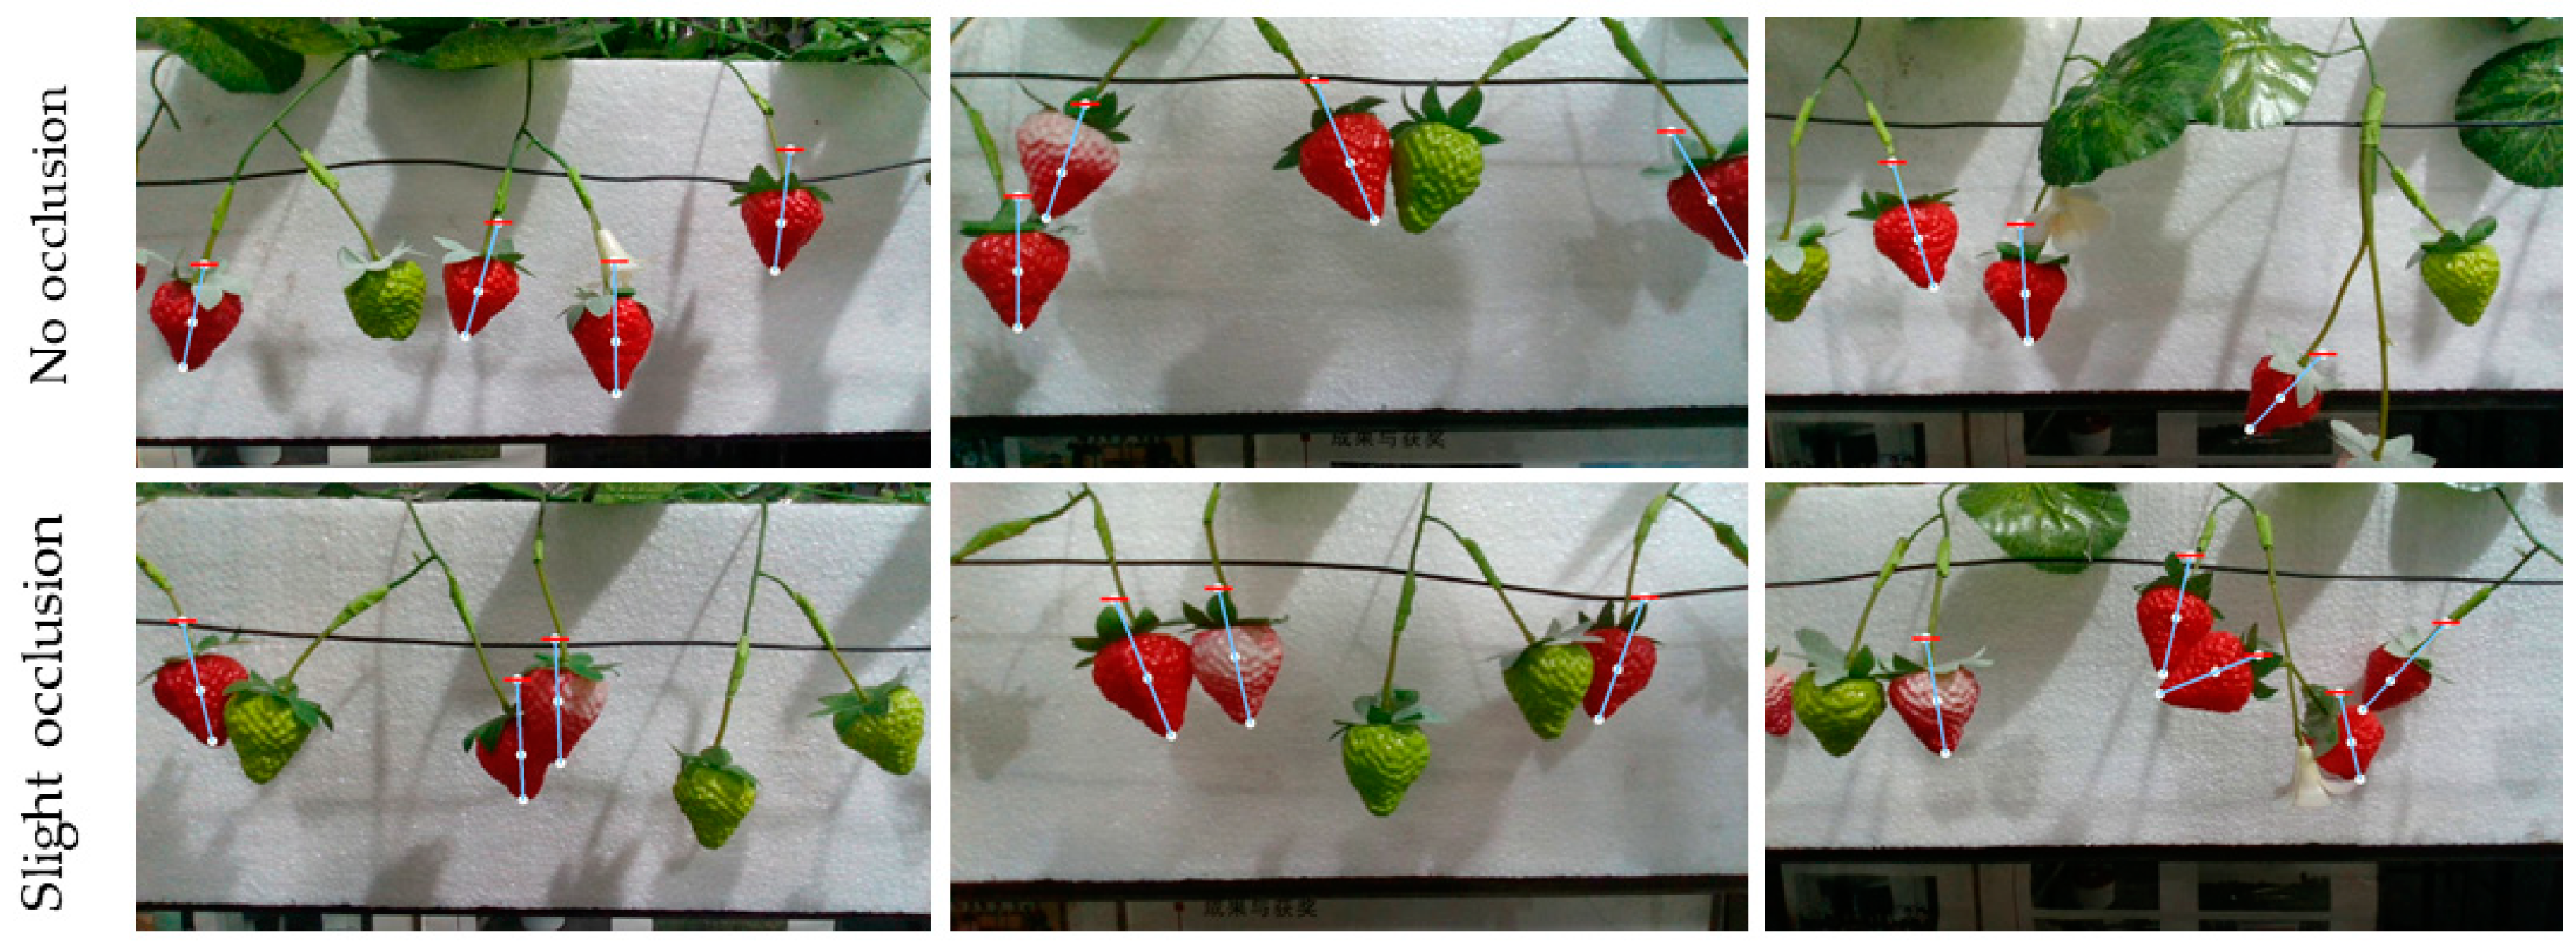
3.2. Position of Picking Points

After detecting ripe strawberries with the improved YOLOv7 model, the detected strawberries were clipped to a small map using the boundary coordinates of each boundary box; each small map represents a ripe strawberry. After the threshold was reached, the segmentation and edge extraction of each small graph, the binary graph, and the edge contour of the strawberry fruit were all obtained. Then, the fruit axis and picking point of each strawberry was obtained by the strawberry picking point positioning method.
According to the camera parameters, α = 69° and horizontal pixel u = 1280. When the picking robot performed successfully, the distance between the camera and the strawberry was 30–40 cm. It could then be calculated that the actual 10 mm converted to the pixel distance u0 in the image, ranging from 23 to 31 pixels. A line segment with a value of 23 pixels was made around the positioned picking point. If the line segment intersected with the fruit stem of the strawberry, the picking point was considered to be successfully positioned.
Figure 12 shows the fruit axes and picking points of strawberries obtained by the positioning method and the line segments for judging the effectiveness of picking points. Under the conditions of no occlusion and slight occlusion, the picking point positioning method demonstrates its effectiveness. The successful positioning rate was 90.8%, and the average positioning time was 76 ms.
Compared to the case segmentation method proposed by Yu et al. [24] and Perez-Borrero et al. [27], this model has advantages in terms of its speed in identifying and locating picking points. Compared to the YOLOv5 method of direct fruit stem detection adopted by Lemsalu et al. [26], and the semantic segmentation model adopted by Kim et al. [28], the positioning accuracy of the picking points has been improved by this model. The examples of location failure in this study were all strawberries with severe occlusion. When the fruit was severely occluded, the picking point positioning method, as well as other methods, could not locate the picking point accurately. The picking point positioning method for fruit under severe occlusion requires further research.

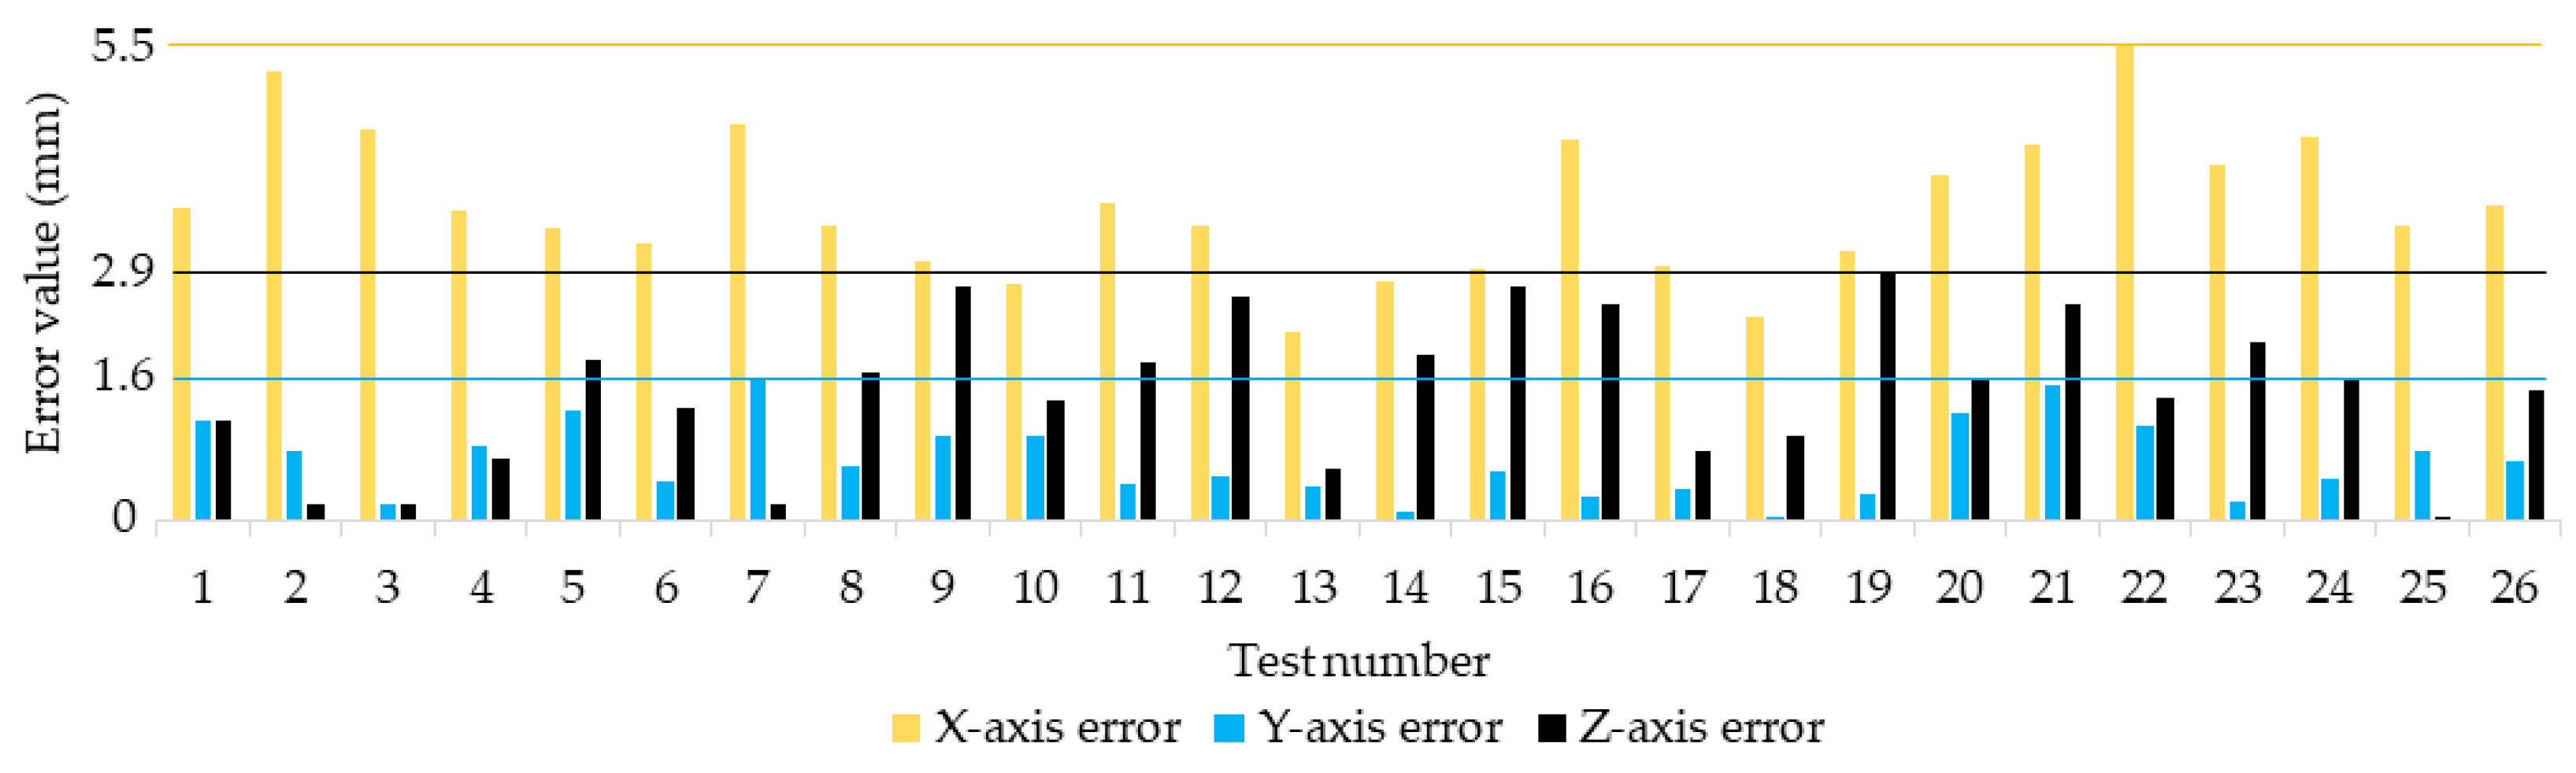
3.3. Calibration Error

In each hand–eye calibration error test, the camera and the robot arm were adjusted according to this method, the center of each red circle was identified, the end of the robot arm was controlled so that it touched the center of the red circle, and the coordinates of 25 actual and theoretical picking points, within the camera’s field of view, were obtained. Table 4 shows the coordinates of the actual picking points and the coordinate values of the theoretical picking points in each area within the camera’s field of view. By comparing the two coordinate values of each group, it was found that there is little difference between the two coordinates in terms of value, indicating that the actual and theoretical coordinates are relatively close.
By calculating the difference of each group of coordinates and then taking the absolute value, the errors for each group of experiments were obtained, on the X-axis, Y-axis, and Z-axis, and the error values were then visualized in the error result graph shown in Figure 13. In the field of view of the camera, the maximum error between the actual pick point coordinates and the theoretical pick point coordinates in the X-axis direction is 5.5 mm, and the average error is 3.6 mm; the maximum error in the Y-axis direction is 1.6 mm, and the average error is 0.7 mm; the maximum error in the Z-axis is 2.9 mm, and the average error is 1.5 mm. The assembly error in the X-axis direction is significant when installing the end actuator. In contrast, the Y-axis direction is close to the flange, and the assembly error is small, resulting in a more significant X-axis error than that on the Y-axis. In addition, during the process of hand–eye calibration, because the calibration plate is not flat, differences in errors on different axes can occur; however, considering the maximum travel distance of the end effector, of 20 mm, the error range is much smaller than the opening distance of the end effector; therefore, it can meet the picking needs of the robot and achieve effective strawberry picking.

3.4. Robot Picking

To test the strawberry recognition and positioning method proposed in this study, based on the improved YOLOv7 and RGB-D sensors, picking experiments were carried out in a simulated elevated-substrate strawberry scene built in a laboratory. In this experiment, we fixed the posture of the end effector of the robotic arm and, each time, the end effector approached the strawberry stem with the same posture and grasped it. Because the simulated strawberry was plastic, the end effector could not directly cut the stem of the strawberry; therefore, in this experiment, when the two fingers of the end effector gripped the stem of the strawberry, the strawberry was considered to be successfully picked by the robot (Figure 14).
We carried out four picking experiments, and the experimental results are shown in Table 5. According to the tallied statistics, there were 124 strawberries in the three experiments, of which 98 were ripe, 25 were immature, and 14 were blocked. In the experiment, 89 strawberries were successfully picked, and the picking success rate was 90.82%. The average execution time for picking each strawberry was 7.5 s. Failure to pick was due to the blocking and stacking of strawberries. Subsequent recognition and positioning algorithms need to be further studied to address the challenges associated with blocking and stacking strawberries.
The picking success rate of Feng et al.’s picking robot was 84%, and its average picking time was 10.7 s [8]. The success rate of the strawberry picking robot developed by Parsa et al. was 83% [11]. Cui et al.’s picking robot took 16.6 s to pick a single strawberry, with an accuracy rate of 70.8% [22]. Compared to the strawberry picking robots in these previous studies, the strawberry recognition and positioning method proposed in this study, based on the improved YOLOv7 model and RGB-D sensing, can effectively improve the success rate of picking and reduce the picking time of strawberries when applied to actual picking. Initially, the picking robot in this study was designed to install two robotic arms and to pick strawberries on both sides simultaneously. The picking speed will be further improved in subsequent research.

4. Conclusions

We have proposed an innovative deep learning technique for detecting and identifying elevated-substrate strawberries. In a laboratory, we built a strawberry scene with simulated strawberry plants, based on the actual planting of elevated strawberries, and took pictures of the scene with RGB-D cameras. In order to improve the YOLOv7 model, GhostConv was used to replace the Conv module, the CBAM attention mechanism module was added, the unnecessary feature layer was removed, and the feature layer for small object detection was introduced. Compared to the original YOLOv7 model, the improved YOLOv7 model was significantly reduced in its size and complexity. The number of parameters was only 40.3% of that of the original model, the computational load was reduced by 41.8%, and the model size was reduced by 59.2%. At the same time, both recognition speed and accuracy have been improved. The frame rate of model recognition increased by 19.3%, the accuracy of model recognition reached 98.8%, and [email protected] reached 96.8%. A method based on the geometric shape of strawberries was proposed to locate picking points. The success rate of picking points was 90.8%, and the average positioning time was 76 milliseconds. The strawberry recognition and positioning method proposed in this paper, based on the improved YOLOv7 model and RGB-D sensing, was applied to the strawberry picking experiment. The picking success rate reached 90.8%, and the average execution time for picking each strawberry was 7.5 s, which met the speed and accuracy requirements of the strawberry picking robot. This method has only been tested in a laboratory for simulated strawberries; an adaptability test of natural strawberry scenes needs to be carried out in order to realize effective picking methods for multiple varieties of strawberries. The recognition and positioning method proposed in this study can nonetheless be used as a reference in other fruit recognition and positioning processes.

Author Contributions

Conceptualization and Methodology, Y.L. (Yuwen Li); Software, Y.L. (Yuwen Li) and Y.L. (Yizhe Liu); Validation, Y.L. (Yuwen Li), Y.L. (Yizhe Liu) and D.W.; Formal analysis, W.W., X.W. and X.G.; Investigation, Y.L. (Yuwen Li), X.W., Y.L. (Yizhe Liu) and D.W.; Resources, W.W.; Data curation, Y.L. (Yuwen Li); Writing—raw draft, Y.L. (Yuwen Li); Writing—review & editing, W.W., Y.L. (Yuwen Li) and X.G.; Visualization, Y.L. (Yuwen Li) and W.W.; Supervision, W.W.; Funding acquisition, W.W. All authors have read and agreed to the published version of the manuscript.

Funding

This research was funded by the National Natural Science Foundation of China (No. 32272410), the National Key Research and Development Program of China (No. 2022YFF0607900).

Institutional Review Board Statement

Not applicable.

Data Availability Statement

Data are contained within the article.

Acknowledgments

The authors would like to thank REALMAN ROBOT Co., Ltd. (Beijing, China) for their invaluable assistance in providing a technical platform for the research methods in this paper. We would also like to acknowledge Bin Lei, Technical Director of REALMAN ROBOT Co., Ltd. (Beijing, China) for his technical guidance in applying these methods to subsequent real-world picking experiments.

Conflicts of Interest

The authors declare no conflicts of interest.

References

  1. Hossain, A.; Begum, P.; Zannat, M.S.; Rahman, M.H.; Ahsan, M.; Islam, S.N. Nutrient Composition of Strawberry Genotypes Cultivated in a Horticulture Farm. Food Chem. 2016, 199, 648–652. [Google Scholar] [CrossRef]
  2. Giampieri, F.; Tulipani, S.; Alvarez-Suarez, J.M.; Quiles, J.L.; Mezzetti, B.; Battino, M. The Strawberry: Composition, Nutritional Quality, and Impact on Human Health. Nutrition 2012, 28, 9–19. [Google Scholar] [CrossRef]
  3. Hakala, M.; Lapveteläinen, A.; Huopalahti, R.; Kallio, H.; Tahvonen, R. Effects of Varieties and Cultivation Conditions on the Composition of Strawberries. J. Food Compos. Anal. 2003, 16, 67–80. [Google Scholar] [CrossRef]
  4. Liu, Q.; Cao, C.; Zhang, X.; Li, K.; Xu, W. Design of Strawberry Picking Hybrid Robot Based on Kinect Sensor. In Proceedings of the 2018 International Conference on Sensing, Diagnostics, Prognostics, and Control (SDPC), Xi’an, China, 15–17 August 2018. [Google Scholar] [CrossRef]
  5. Tafuro, A.; Adewumi, A.; Parsa, S.; Amir, G.E.; Debnath, B. Strawberry Picking Point Localization Ripeness and Weight Estimation. In Proceedings of the 2022 IEEE International Conference on Robotics and Automation (ICRA 2022), Philadelphia, PA, USA, 23–27 May 2022; pp. 2295–2302. [Google Scholar] [CrossRef]
  6. Yamamoto, S.; Hayashi, S.; Yoshida, H.; Kobayashi, K. Development of a Stationary Robotic Strawberry Harvester with a Picking Mechanism That Approaches the Target Fruit from Below. JARQ-Jpn. Agric. Res. Q. 2014, 48, 261–269. [Google Scholar] [CrossRef]
  7. Huang, Z.; Sklar, E.; Parsons, S. Design of Automatic Strawberry Harvest Robot Suitable in Complex Environments. In Proceedings of the HRI’20: Companion of the 2020 ACM/IEEE International Conference on Human-Robot Interaction, Cambridge, UK, 23–26 March 2020; Association for Computing Machinery: New York, NY, USA, 2020; pp. 567–569. [Google Scholar] [CrossRef]
  8. Feng, Q.; Chen, J.; Zhang, M.; Wang, X. Design and Test of Harvesting Robot for Table-Top Cultivated Strawberry. In Proceedings of the 2019 World Robot Conference Symposium on Advanced Robotics and Automation (WRC SARA 2019), Beijing, China, 21–22 August 2019; pp. 80–85. [Google Scholar] [CrossRef]
  9. Xiong, Y.; Peng, C.; Grimstad, L.; From, P.J.; Isler, V. Development and Field Evaluation of a Strawberry Harvesting Robot with a Cable-Driven Gripper. Comput. Electron. Agric. 2019, 157, 392–402. [Google Scholar] [CrossRef]
  10. Ge, Y.; Xiong, Y.; Tenorio, G.L.; From, P.J. Fruit Localization and Environment Perception for Strawberry Harvesting Robots. IEEE Access 2019, 7, 147642–147652. [Google Scholar] [CrossRef]
  11. He, Z.; Karkee, M.; Zhang, Q. Detecting and Localizing Strawberry Centers for Robotic Harvesting in Field Envi-ronment. IFAC Pap. 2022, 55, 30–35. [Google Scholar] [CrossRef]
  12. Bac, C.W.; van Henten, E.J.; Hemming, J.; Edan, Y. Harvesting Robots for High-Value Crops: State-of-the-Art Review and Challenges Ahead. J. Field Robot. 2014, 31, 888–911. [Google Scholar] [CrossRef]
  13. Wang, Z.; Xun, Y.; Wang, Y.; Yang, Q. Review of Smart Robots for Fruit and Vegetable Picking in Agriculture. Int. J. Agric. Biol. Eng. 2022, 15, 33–54. [Google Scholar] [CrossRef]
  14. Bulanon, D.M.; Kataoka, T. Fruit Detection System and an End Effector for Robotic Harvesting of Fuji Apples. Agric. Eng. Int. CIGR E-J. 2010, 12, 203–210. [Google Scholar]
  15. Ji, C.; Zhang, J.; Yuan, T.; Li, W. Research on Key Technology of Truss Tomato Harvesting Robot in Greenhouse. Appl. Mech. Mater. 2014, 442, 480–486. [Google Scholar] [CrossRef]
  16. Lehnert, C.; English, A.; McCool, C.; Tow, A.W.; Perez, T. Autonomous Sweet Pepper Harvesting for Protected Cropping Systems. IEEE Robot. Autom. Lett. 2017, 2, 872–879. [Google Scholar] [CrossRef]
  17. Mehta, S.S.; MacKunis, W.; Burks, T.F. Robust Visual Servo Control in the Presence of Fruit Motion for Robotic Citrus Harvesting. Comput. Electron. Agric. 2016, 123, 362–375. [Google Scholar] [CrossRef]
  18. Van Henten, E.; Hemming, J.; Van Tuijl, B.; Kornet, J.; Bontsema, J. Collision-Free Motion Planning for a Cucumber Picking Robot. Biosyst. Eng. 2003, 86, 135–144. [Google Scholar] [CrossRef]
  19. Edan, Y.; Rogozin, D.; Flash, T.; Miles, G. Robotic Melon Harvesting. IEEE Trans. Robot. Autom. 2000, 16, 831–835. [Google Scholar] [CrossRef]
  20. Scarfe, A.J.; Flemmer, R.C.; Bakker, H.H.; Flemmer, C.L. Development of An Autonomous Kiwifruit Picking Robot. In Proceedings of the Fourth International Conference on Autonomous Robots and Agents, Wellington, New Zealand, 10–12 February 2009; Gupta, G., Mukhopadhyay, S., Eds.; pp. 639–643. [Google Scholar] [CrossRef]
  21. Defterli, S.G.; Shi, Y.; Xu, Y.; Ehsani, R. Review of Robotic Technology for Strawberry Production. Appl. Eng. Agric. 2016, 32, 301–318. [Google Scholar] [CrossRef]
  22. Cui, Y.; Gejima, Y.; Kobayashi, T.; Hiyoshi, K.; Nagata, M. Study on Cartesian-Type Strawberry-Harvesting Robot. Sens. Lett. J. Dedic. All Asp. Sens. Sci. Eng. Med. 2013, 11, 1223–1228. [Google Scholar] [CrossRef]
  23. Habaragamuwa, H.; Ogawa, Y.; Suzuki, T.; Shiigi, T.; Ono, M.; Kondo, N. Detecting Greenhouse Strawberries (Mature and Immature), Using Deep Convolutional Neural Network. Eng. Agric. Environ. Food 2018, 11, 127–138. [Google Scholar] [CrossRef]
  24. Yu, Y.; Zhang, K.; Yang, L.; Zhang, D. Fruit Detection for Strawberry Harvesting Robot in Non-Structural Environment Based on Mask-RCNN. Comput. Electron. Agric. 2019, 163, 104846. [Google Scholar] [CrossRef]
  25. Yu, Y.; Zhang, K.; Liu, H.; Yang, L.; Zhang, D. Real-Time Visual Localization of the Picking Points for a Ridge-Planting Strawberry Harvesting Robot. IEEE Access 2020, 8, 116556–116568. [Google Scholar] [CrossRef]
  26. Lemsalu, M.; Bloch, V.; Backman, J.; Pastell, M. Real-Time CNN-Based Computer Vision System for Open-Field Strawberry Harvesting Robot. IFAC Pap. 2022, 55, 24–29. [Google Scholar] [CrossRef]
  27. Perez-Borrero, I.; Marin-Santos, D.; Gegundez-Arias, M.E.; Cortes-Ancos, E. A Fast and Accurate Deep Learning Method for Strawberry Instance Segmentation. Comput. Electron. Agric. 2020, 178, 105736. [Google Scholar] [CrossRef]
  28. Kim, S.-J.; Jeong, S.; Kim, H.; Jeong, S.; Yun, G.-Y.; Park, K. Detecting Ripeness of Strawberry and Coordinates of Strawberry Stalk Using Deep Learning. In Proceedings of the 2022 Thirteenth International Conference on Ubiquitous and Future Networks (ICUFN), Barcelona, Spain, 5–8 July 2022; pp. 454–458. [Google Scholar] [CrossRef]
  29. Perez-Borrero, I.; Marin-Santos, D.; Vasallo-Vazquez, M.J.; Gegundez-Arias, M.E. A New Deep-Learning Strawberry Instance Segmentation Methodology Based on a Fully Convolutional Neural Network. Neural Comput. Appl. 2021, 33, 15059–15071. [Google Scholar] [CrossRef]
  30. Lamb, N.; Chuah, M.C. A Strawberry Detection System Using Convolutional Neural Networks. In Proceedings of the 2018 IEEE International Conference on Big Data (Big Data), Seattle, DC, USA, 10–13 December 2018; Abe, N., Liu, H., Pu, C., Hu, X., Ahmed, N., Qiao, M., Song, Y., Kossmann, D., Liu, B., Lee, K., et al., Eds.; Springer: Berlin/Heidelberg, Germany, 2018; pp. 2515–2520. [Google Scholar] [CrossRef]
  31. Wang, C.; Bochkovskiy, A.; Liao, H. YOLOv7: Trainable Bag-of-Freebies Sets New State-of-the-Art for Real-Time Object Detectors. In Proceedings of the 2023 IEEE/CVF Conference on Computer Vision and Pattern Recognition (CVPR), Vancouver, BC, Canada, 17–24 June 2023; pp. 7464–7475. [Google Scholar] [CrossRef]
  32. Zhang, F.; Cao, W.; Wang, S.; Cui, X.; Yang, N.; Wang, X.; Zhang, X.; Fu, S. Improved YOLOv4 Recognition Algorithm for Pitaya Based on Coordinate Attention and Combinational Convolution. Front. Plant Sci. 2022, 13, 1030021. [Google Scholar] [CrossRef] [PubMed]
  33. Han, K.; Wang, Y.; Tian, Q.; Guo, J.; Xu, C.; Xu, C. GhostNet: More Features from Cheap Operations. In Proceedings of the 2020 IEEE/CVF Conference on Computer Vision and Pattern Recognition (CVPR), Seattle, WA, USA, 14–19 June 2020; pp. 1577–1586. [Google Scholar] [CrossRef]
  34. Tsai, F.-T.; Nguyen, V.-T.; Duong, T.-P.; Phan, Q.-H.; Lien, C.-H. Tomato Fruit Detection Using Modified Yolov5m Model with Convolutional Neural Networks. Plants 2023, 12, 3067. [Google Scholar] [CrossRef] [PubMed]
  35. Dou, S.; Wang, L.; Fan, D.; Miao, L.; Yan, J.; He, H. Classification of Citrus Huanglongbing Degree Based on CBAM-MobileNetV2 and Transfer Learning. Sensors 2023, 23, 5587. [Google Scholar] [CrossRef]
  36. Woo, S.; Park, J.; Lee, J.-Y.; Kweon, I.S. CBAM: Convolutional Block Attention Module. In Proceedings of the 2018 European Conference on Computer Vision (ECCV), Munich, Germany, 8–14 September 2018; Ferrari, V., Hebert, M., Sminchisescu, C., Weiss, Y., Eds.; Volume 11211, pp. 3–19. [Google Scholar] [CrossRef]
  37. Guo, S.; Yoon, S.-C.; Li, L.; Wang, W.; Zhuang, H.; Wei, C.; Liu, Y.; Li, Y. Recognition and Positioning of Fresh Tea Buds Using YOLOv4-Lighted + ICBAM Model and RGB-D Sensing. Agriculture 2023, 13, 518. [Google Scholar] [CrossRef]
Figure 1. The model of the strawberry scene.
Agriculture 14 00624 g001
Figure 2. RGB-D sensor depth calibration. (a) Camera calibration board; (b) RealSense D435i; (c) Camera mount; (d) Dynamic Calibration Tool interface.
Agriculture 14 00624 g002
Figure 3. Data augmentation methods: (a) Underwent rotation; (b) Salt-and-pepper noise addition; (c) Sharpening; (d) Brightness adjustment.
Agriculture 14 00624 g003
Figure 4. Front view of LabelImg.
Agriculture 14 00624 g004
Figure 5. Improved YOLOv7 model structure.
Agriculture 14 00624 g005
Figure 6. Positioning process of strawberry picking point. (a) Small image; (b) Binary image; (c) Edge contour; (d) Schematic diagram of picking point location.
Agriculture 14 00624 g006
Figure 7. Schematic diagram of hand–eye calibration.
Agriculture 14 00624 g007
Figure 8. Hand–eye calibration error test.
Agriculture 14 00624 g008
Figure 9. Model performance.
Agriculture 14 00624 g009
Figure 10. Improved YOLOv7 recognition model identifies confusion matrix.
Agriculture 14 00624 g010
Figure 11. Detection results with no and slight occlusion.
Agriculture 14 00624 g011
Figure 12. Positioning result with no and slight occlusion.
Agriculture 14 00624 g012
Figure 13. Hand–eye calibration error results.
Agriculture 14 00624 g013
Figure 14. Robot picks successful cases.
Agriculture 14 00624 g014
Table 1. Parameters of the Intel RealSense D435i camera.
ParametersStats
Dimension (mm)90 × 25 × 25
Depth image resolution (pixels)848 × 480
Depth field of view (°)87 × 58
RGB image resolution (pixels)1280 × 720
RGB field of view (°)69 × 42
Frame rate (FPS)30
Service distance (m)0.1–10
Table 2. Hardware and software configurations for model development.
ComponentDescription
CPUIntel Core i7-11800H (2.30 GHz)
GPU hardwareNVIDIA GeForce RTX 3070 Laptop
GPU programming libraryCUDA 11.6 and CUDNN 8.9
Integrated development environmentPyCharm 2022.2.2
Operating systemWindows 11
Table 3. Performance of two detection models.
ModelParametersModel Size (MB)Frame Rate (FPS)
Baseline YOLOv7 model37.2 million74.818.7
Improved YOLOv7 model15.0 million30.522.3
Table 4. Theoretical and actual coordinate data of hand–eye calibration.
Test NumberTheoretical
Coordinate (mm)
Actual Coordinate (mm)Test NumberTheoretical
Coordinate (mm)
Actual Coordinate (mm)
1(−270.1, −523.2, −444.0)(−266.5, −524.4, −442.9)14(−94.5, −664.6, −439.6)(−91.8, −664.5, −441.5)
2(−270.2, −571.0, −443.0)(−265.0, −571.8, −443.1)15(−92.8, −713.6, −439.1)(−89.9, −713.1, −441.8)
3(−269.1, −620.1, −442.3)(−264.6, −619.9, −442.4)16(−10.3, −517.2, −441.5)(−5.9, −516.9, −439.0)
4(−267.7, −668.3, −442.4)(−264.1, −667.4, −441.7)17(−8.7, −566.1, −441.1)(−5.7, −565.8, −440.3)
5(−266.3, −717.1, −443.9)(−262.9, −715.9, −442.0)18(−7.9, −615.4, −440.6)(−5.6, −615.4, −441.6)
6(−183.5, −520.6, −442.0)(−180.3, −521.0, −443.3)19(−6.9, −662.9, −440.0)(−3.8, −663.2, −442.9)
7(−183.2, −569.1, −441.0)(−178.6, −567.5, −441.1)20(−6.5, −711.2, −439.5)(−2.6, −712.4, −441.2)
8(−181.6, −618.0, −439.1)(−178.2, −618.6, −440.8)21(77.3, −517.0, −441.8)(81.6, −515.4, −439.3)
9(−180.6, −666.5, −439.4)(−177.6, −665.5, −442.1)22(78.4, −565.2, −441.2)(83.9, −564.2, −442.6)
10(−179.6, −715.4, −440.0)(−176.8, −714.5, −441.4)23(79.6, −613.3, −440.8)(83.7, −613.5, −442.9)
11(−98.0, −519.4, −441.5)(−94.3, −519.8, −439.7)24(80.2, −661.5, −440.6)(84.6, −662.0, −442.2)
12(−95.9, −568.0, −442.5)(−92.5, −568.5, −439.9)25(81.5, −710.1, −440.5)(84.9, −710.9, −440.5)
13(−94.8, −616.2, −440.7)(−92.6, −616.6, −411.2)
Table 5. Results of the picking experiment.
Experiment NumberRipe Strawberry NumberPicking Success NumberPicking Success Rate
1282796.4%
2242187.5%
3262388.4%
4201890.0%
Total988990.8%
Disclaimer/Publisher’s Note: The statements, opinions and data contained in all publications are solely those of the individual author(s) and contributor(s) and not of MDPI and/or the editor(s). MDPI and/or the editor(s) disclaim responsibility for any injury to people or property resulting from any ideas, methods, instructions or products referred to in the content.

