Abstract
The accurate assessment of peanut seed plumpness is crucial for optimizing peanut production and quality. The current method is mainly manual and visual inspection, which is very time-consuming and causes seed deterioration. A novel imaging technique is used to enhance the detection of peanut seed fullness using a non-destructive soft X-ray, which is suitable for the analysis of the surface or a thin layer of a material. The overall grayscale of the peanut is similar to the background, and the edge of the peanut seed is blurred. The inaccuracy of peanut overall and peanut seed segmentation leads to low accuracy of seed plumpness detection. To improve accuracy in detecting the fullness of peanut seeds, a seed plumpness detection method based on level set and multi-threshold segmentation was proposed for peanut images. Firstly, the level set algorithm is used to extract the overall contour of peanuts. Secondly, the obtained binary image is processed by morphology to obtain the peanut pods (the peanut overall). Then, the multi-threshold OTSU algorithm is used for threshold segmentation. The threshold is selected to extract the peanut seed part. Finally, morphology is used to complete the cavity to achieve the segmentation of the peanut seed. Compared with optimization algorithms, in the segmentation of the peanut pods, average random index (RI), global consistency error (GCE) and variation of information (VI) were increased by 10.12% and decreased by 0.53% and 24.11%, respectively. Compared with existing algorithms, in the segmentation of the peanut seed, the average RI, VI and GCE were increased by 18.32% and decreased by 9.14% and 6.11%, respectively. The proposed method is stable, accurate and can meet the requirements of peanut image plumpness detection. It provides a feasible technical means and reference for scientific experimental breeding and testing grading service pricing.
1. Introduction
Plant seeds are important to agricultural production. It is essential to ensure the integrity and fullness of peanut seeds, as these qualities directly affect the germination percentage of the seeds and the quality of the harvest. Plumpness is an important index reflecting the vigor and potential productivity of the peanut seed [1]. However, the detection of peanut fullness mainly relies on manual shell cracking and visually inspecting the seeds. This method is simple but time-consuming and can cause peanut seed deterioration due to exposure to air. Hence, a fast, accurate and automated method for detecting the fullness of seeds occupying the peanut overall is desirable.
To address these challenges, our research employs a soft X-ray imaging technique. This non-destructive method allows for the internal inspection of seeds without causing damage, thereby preserving the vigor and potential productivity of the peanut seed [2,3,4]. It is also recommended by the International Association for Seed Testing (ISTA) for seed quality testing [5]. Pearson et al. successfully used X-ray imaging to detect insect-damaged sunflower seeds in the internal tissues [6]. Bianchini et al. used X-ray imaging technology to process the image with ROI and mean gray value to investigate internal tissues [7]. Medeiros et al. evaluated the potential of deep learning models based on convolutional neural networks (CNNs) in monitoring the quality of sea cabbage seeds using X-ray images [8]. The germination of healthy seeds was not affected by X-ray irradiation [9]. Therefore, internal research can be carried out without damage to the peanut image by X-ray. When processing the collected X-ray images, the main method is needed to segment peanut seed(s) from their shell and the background of the image. In many cases, the overall grayscale of the peanut is similar to the background, and the edge of the peanut shell and seed(s) is blurred. These can affect the results of the segmentation and lead to a low detection accuracy of the contour of peanut seeds. Luo et al. proposed a method that extracted the target region by threshold value and level set after manually extracting the region of interest [10]. When the target boundary is not obvious, the result is misclassified. Rehman et al. reported that the segmentation of CT image data is based on regional level set technology [11]. The target in the image has a clear edge, so the method is not applicable to the peanut image by X-ray. Feng et al. performed a method combining CNN and level set to segment the target part of the magnetic resonance image [12]. Neural network training requires a large amount of data, and too much time is required to prepare data, set experimental parameters and adjust model structure. Multi-threshold OTSU and Improved GWO can be used to extract target parts from images with similar pixel colors [13]. Multi-threshold OTSU and Improved ACO were used in X-ray image segmentation by Qin et al. [14]. Multi-threshold Otsu and Improved PSO are combined for segmentation by Wang et al. [15]. Therefore, multi-threshold OTSU is suitable for gray image segmentation.
A new method for detecting the kernel plumpness of peanut X-ray images based on level set [12] and multi-threshold segmentation was proposed (LSA-MOTSU). The level set algorithm is used to extract the overall contour of peanuts. The multi-threshold OTSU algorithm [13] is used for threshold segmentation. The threshold is selected to extract peanut seeds. Morphology is used to fill holes in the image. The aims of this research were as follows: (1) to achieve the segmentation of peanut seeds and peanut pods, (2) to propose a stable, accurate method for detecting kernel plumpness of peanut, (3) to provide a feasible technical means and reference for grading, scientific experimental breeding and estimating kernel weight.
2. Materials and Methods
2.1. The Principle of Image Segmentation
Capture of peanut lossless imaging is shown in Figure 1. Figure 1a shows the soft X-ray imaging system used for this study, which consists of an X-ray tube (XTFTM-5011, Oxford Instruments, X-ray Technologies, Inc., Scotts Valley, CA, USA), a solid-state digital X-ray camera (Shad-o-BoxTM 2048, Rad-Icon, Inc., Milpitas, CA, USA), a digital frame grabber (Imagenation® PXD 1000, Imagenation Corp., Minneapolis, MN, USA), a data acquisition and control card (Omega® DAQ 801 OM, Omega Engineering, Inc., Norwalk, CT, USA) and a personal computer with ShadoCam software Version 3.0.2 (Rad-icon Imaging, Corp., Milpitas, CA, USA). Figure 1b shows the capture of a peanut image.
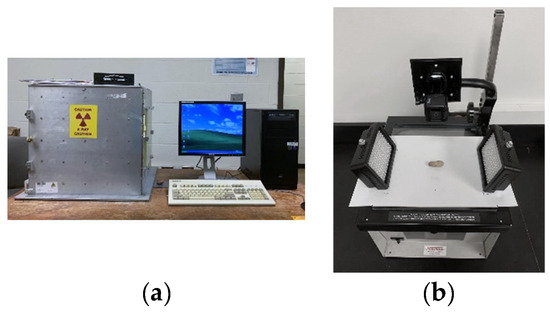
Figure 1.
Capture of peanut lossless imaging: (a) soft X-ray imaging system and (b) the capture of a peanut image.
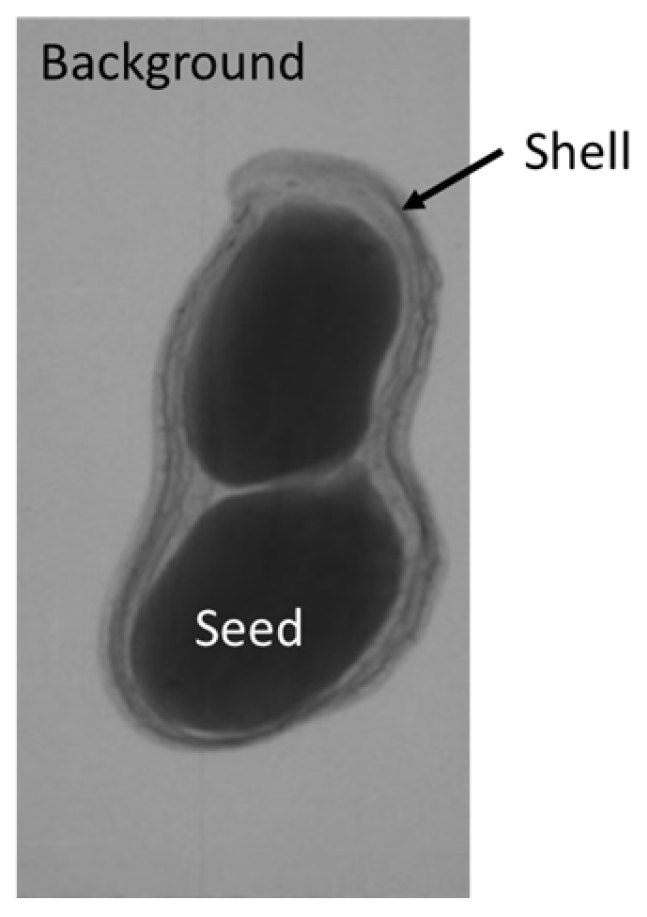
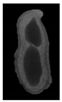
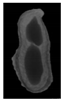
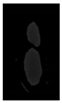
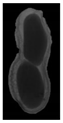
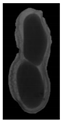
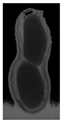
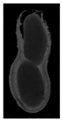
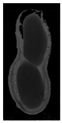
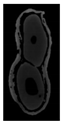
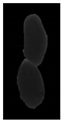
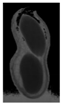
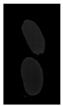
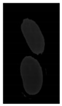
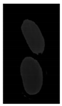
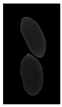
The plumpness of the peanut was calculated from the collected X-ray images (Figure 2). Each image’s acquisition time is 2 s. However, the grayscale of the peanut shell in the images was light gray with low contrast to the background. The boundary of the peanut pod was often fuzzy, which led to errors in image segmentation for the peanut pod against the background.

Figure 2.
X-ray image of a peanut pod.
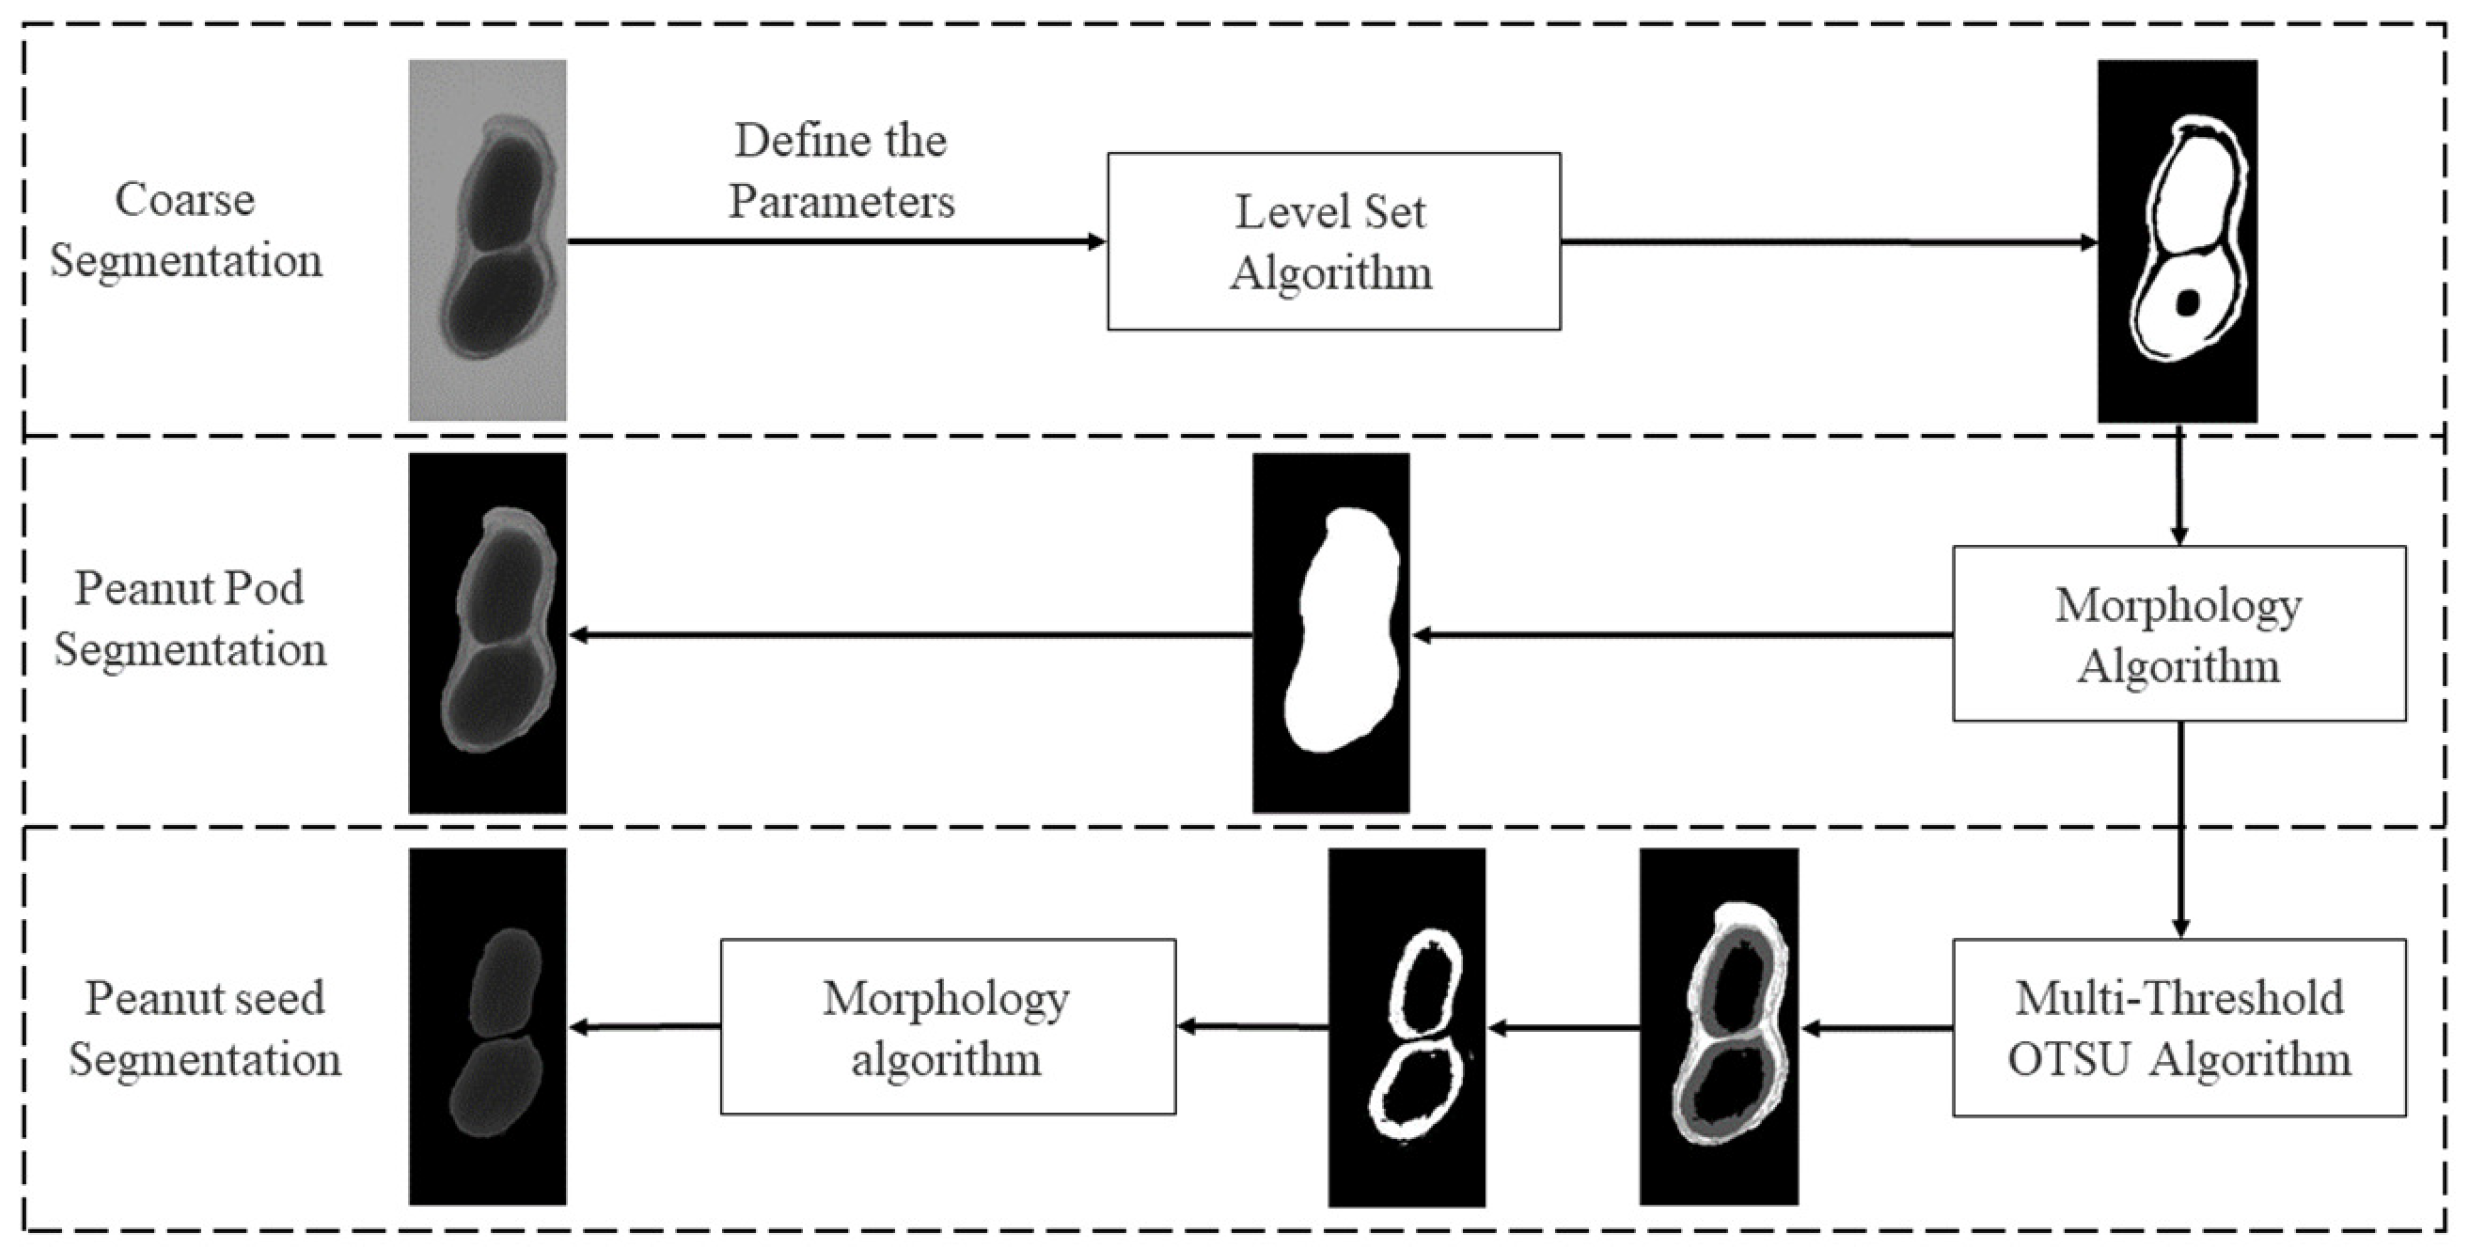
In this study, a level set algorithm [16] was used to extract the overall contour of the peanut in an image. Then, a binary image was obtained and used to segment the peanut pod against the background using a morphology algorithm. After that, the multi-threshold OTSU algorithm [17] is used to find thresholds to extract peanut seed(s). The multi-threshold segmentation algorithm performs segmentation based on multiple thresholds generated by pixel value classification. As the edge and inner grayscale of the peanut seed(s) in X-ray images are not uniform, the extracted peanut pod image might have holes. A morphology algorithm was used to fill the holes and receive the images for seeds and the shell. The proposed method is stable and accurate. It satisfies the requirements of peanut image plumpness detection.
It provides a feasible technical means and reference for grading, scientific experimental breeding and estimating seed weight. Figure 3 shows the proposed framework for image segmentation.
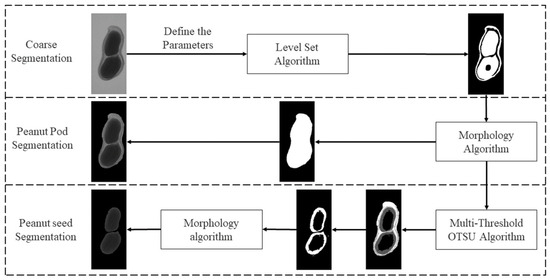
Figure 3.
The framework of the proposed segmentation method.
2.2. Level Set Algorithm
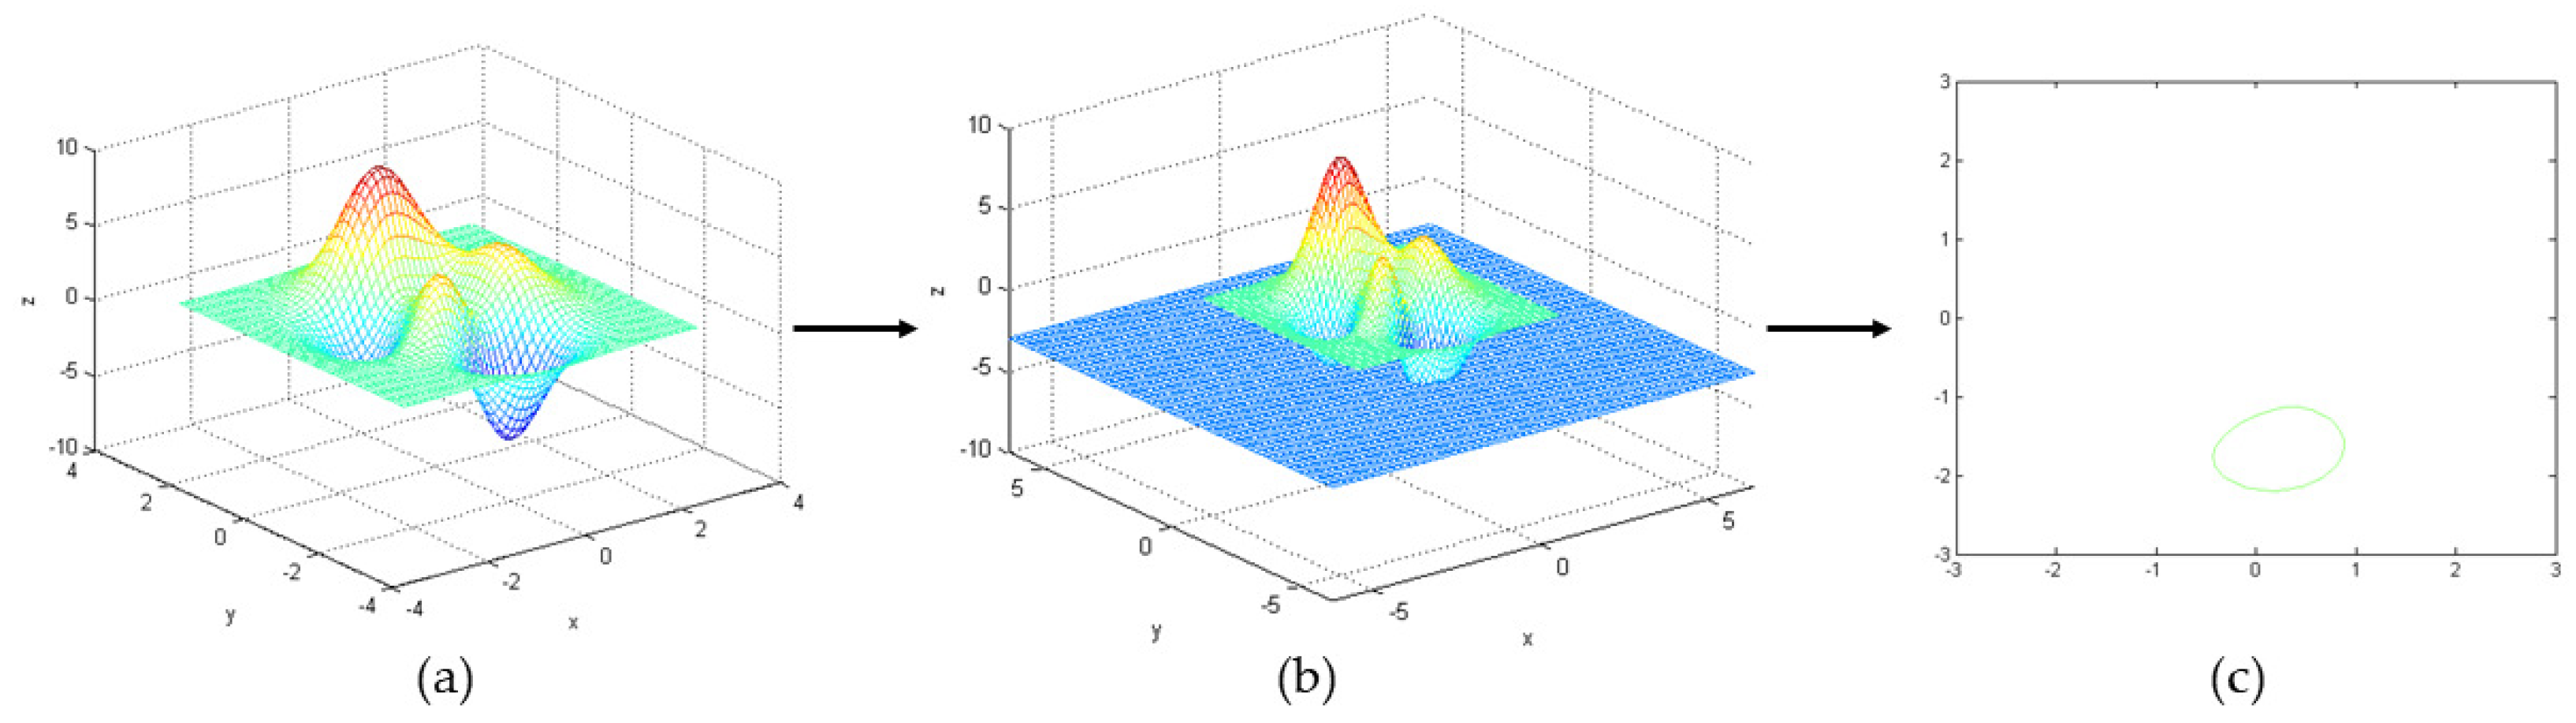
It is difficult to find a precise surface to calculate the surrounding object. The level set algorithm (LSA) was proposed by Osher and Sethian in 1988 to model the changing shape of a flame based on thermodynamic equations [16]. Topological complexity and variations in moving frontiers can be handled naturally by treating the surface as a level set. LSA represents a closed plane curve as a continuous functional surface implicitly [1]. The advantage of LSA is the evolution of curves and surfaces can be calculated in a fixed coordinate system without knowing the exact parameters of the curves and surfaces [18]. It is advantageous for processing images with weak edge features. It describes the evolution curve of curvature correlation rate effectively based on gradient invariance [19,20]. Figure 4 shows the evolution of the LSA. Different colors represent different depths in the 3D surface image A in Figure 4a. When the surface a intersects the plane z = −3, the outline of the intersecting surface is obtained by level set in Figure 4c.
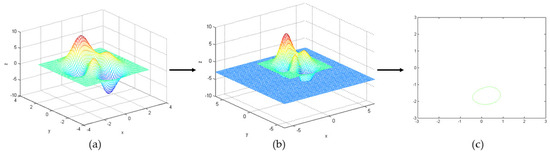
Figure 4.
Level set method evolution process: (a) random 3D curved surface image A, (b) image of the surface A intersecting the plane z =−3 and (c) the outline of an intersection surface.
The closed curve is defined as a two-dimensional level set function, .
After introducing the time variable , the curve changing with time , is obtained.
The derivative of the time-varying level set function with respect to is shown in Equation (3).
Briefly describe , as in Equation (4).
The evolution formula of the curve is Equation (5).
where represents movement speed of normal direction, is taken as a negative sign, represents moving velocity component of normal direction.
When is less than 0, is inside the curve . When is greater than 0, is outside the curve . And when is equal to 0, is on the curve .
In an X-ray image, the contour of the peanut pod is continuously closed. And there is a slight grayscale difference between the contour and the background. The gray-level distribution inside the peanut pod is uneven, so it is difficult to use the threshold segmentation method to separate the peanut pods from the background. Hence, the level set algorithm is selected to extract the peanut contour.
2.3. OTSU Multi-Threshold Algorithm
The OTSU algorithm is an excellent, and the most frequently used, image threshold segmentation method. It is simple and not affected by the brightness and contrast of the image. But the original OTSU method uses a single threshold for segmentation. With one threshold, an image is divided into two classes. Any other details will no longer be distinguished. However, in many practical cases, this cannot satisfy the actual requirements. The results need to be further divided. The multi-threshold OTSU method is used to segment multiple classes at one time. Assuming there are classes to be classified in an image X and the gray level is L, then, there are thresholds, , which are used to divide the image X into m classes. These classes are represented as . The interclass variance is as follows:
Among them,
where is the total number of pixels in the grayscale image, is the number of pixels in the same grayscale pixel , is the probability of the same grayscale pixel and is the pixel mean [21,22].
The thresholds obtained by Equations (7)–(11) are the expected thresholds when reaches the maximum value. In the peanut X-ray images, the multi-threshold OTSU algorithm can divide the peanut pods into classes according to the pixel gray value. Thus, the peanut seed(s) can be extracted.
2.4. Morphology Algorithm
Due to the similarity in pixel values of the peanut images, the segmented peanut images undergo the same detailed processing. In mathematics, when an image A is expanded or corroded by structural element B, they can be represented mathematically in Equations (12) and (13) [23].
where is an image, is a structural element, is expansion operation and is corrosion operation.
The contour of the peanut pod extracted by LSA has holes, which need to be filled to obtain the peanut pod. There are small pixels in the multi-threshold OTSU algorithm for threshold segmentation, so small areas need to be deleted to obtain the peanut seed(s).
Open and closed operations are combined operations of expansion and corrosion. Image A is corroded by a structural element B and, then, expanded by B. The open operation is used to smooth the outline of the object, breaking narrow connections and removing small protrusions.
A closed operation is the result of the image A being expanded by a structural element B and, then, corroded by B. Closing operations connect narrow gaps to form slender bends and fill holes smaller than the structural elements.
2.5. Plumpness Calculation Method
The cross-section of the peanut is shown in Figure 5a. It is not feasible to calculate the peanut plumpness, layer by layer. On the basis of the peanut central axis, the peanut plumpness was calculated by taking the peanut section of 360 degrees as a circle, as shown in Figure 5b. The structure of the peanut is relatively symmetric; therefore, peanut plumpness is the plumpness of the cross-section in the central axis, as shown in Figure 5c.
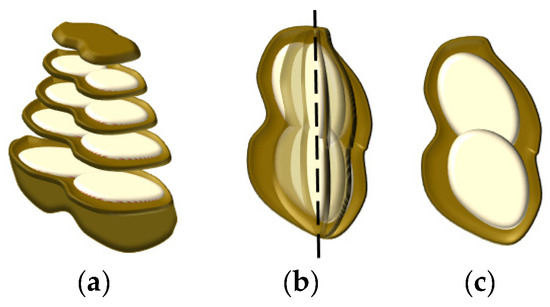
Figure 5.
Peanut fullness structure: (a) cross-section structure of peanut, (b) structure of peanut in central axis (the dashed line indicates the center position), and (c) the plumpness of a cross-section.
Peanut plumpness is defined as the area ratio of the peanut seed(s) to pod. The areas can be replaced by the total number of pixels of the seed(s) and pod, respectively, as shown in Equation (16).
where is the actual area of peanut seed(s), is the actual area of peanut pod, is the total number of pixels of peanut seed(s) and is the total number of pixels of the peanut pod. η is the peanut plumpness.
2.6. Experiment Design for Image Collection and Method Validation
2.6.1. Experimental Preparation
An X-ray radiograph of the peanut pod was taken using a soft X-ray imaging system. The peanut seed and peanut pod were segmented by the image processing method. All the data analysis was performed with the software MATLAB R2010a. The MATLAB software was run on a laptop with CPU Intel (R) Core (TM) i5-8250 CPU @1.60 GHz 1.80 GHz, 7.89 GB available memory, Windows10 64-bit operating system.
2.6.2. Experimental Comparison Method
There are four mainstream methods used for segmentation at present, such as level set, level set and OTSU method [24], GWO (grey wolf optimizer) [25], DEGWO (Differential evolution grey wolf optimizer) [13] and PSO (Particle swarm optimization) [26]. To test the effectiveness of the method proposed, level set, GWO, DEGWO and PSO were compared with the improved level set algorithm based on OTSU and morphology.
To intuitively reflect the segmentation effects of LSA-MOTSU proposed in this paper, the six algorithms were used to segment 300 peanut images, and the result images were compared with the manual segmentation.
2.6.3. Artificial Segmentation Method
The peanut images were manually segmented by histogram detection in Adobe Photoshop CC software. The artificial segmentation method steps are as follows: Firstly, adjust the gray histogram of the color image, and set target (peanut pod or peanut seeds) to black. Secondly, open the histogram window, and adjust all channel views. Then, use the quick selection tool to select the peanut pod. Finally, obtain the pixel value directly from the software. The same procedure was applied to peanut seeds.
2.6.4. Experimental Assessment Method
The global consistency error (GCE), random index (RI) [27] and variation of information (VI) [28] are employed to assess the segmentation results. GCE assesses the consistency of segmentation relative to a ground truth. A lower GCE indicates fewer inconsistencies and higher segmentation fidelity. RI measures the similarity between the automated segmentation and the ground truth, accounting for chance agreement. Higher RI values suggest better accuracy. VI quantifies the amount of information lost or gained in the segmentation process relative to the true segmentation. Lower VI values indicate less information loss [29].
GCE is shown below.
where and represent segmentation result 1 and segmentation result 2, represents the pixel which is a specific query point, represents the subset associated with the query point in segmentation .
RI is shown below.
where represents the number of pixels, and represent labels, represents the number of points with in the , represents the number of points with in the , represents the total number of points.
VI is shown below.
where represents clustering, represents entropy of , represents the mutual information between and .
3. Results
3.1. Image Segmentation
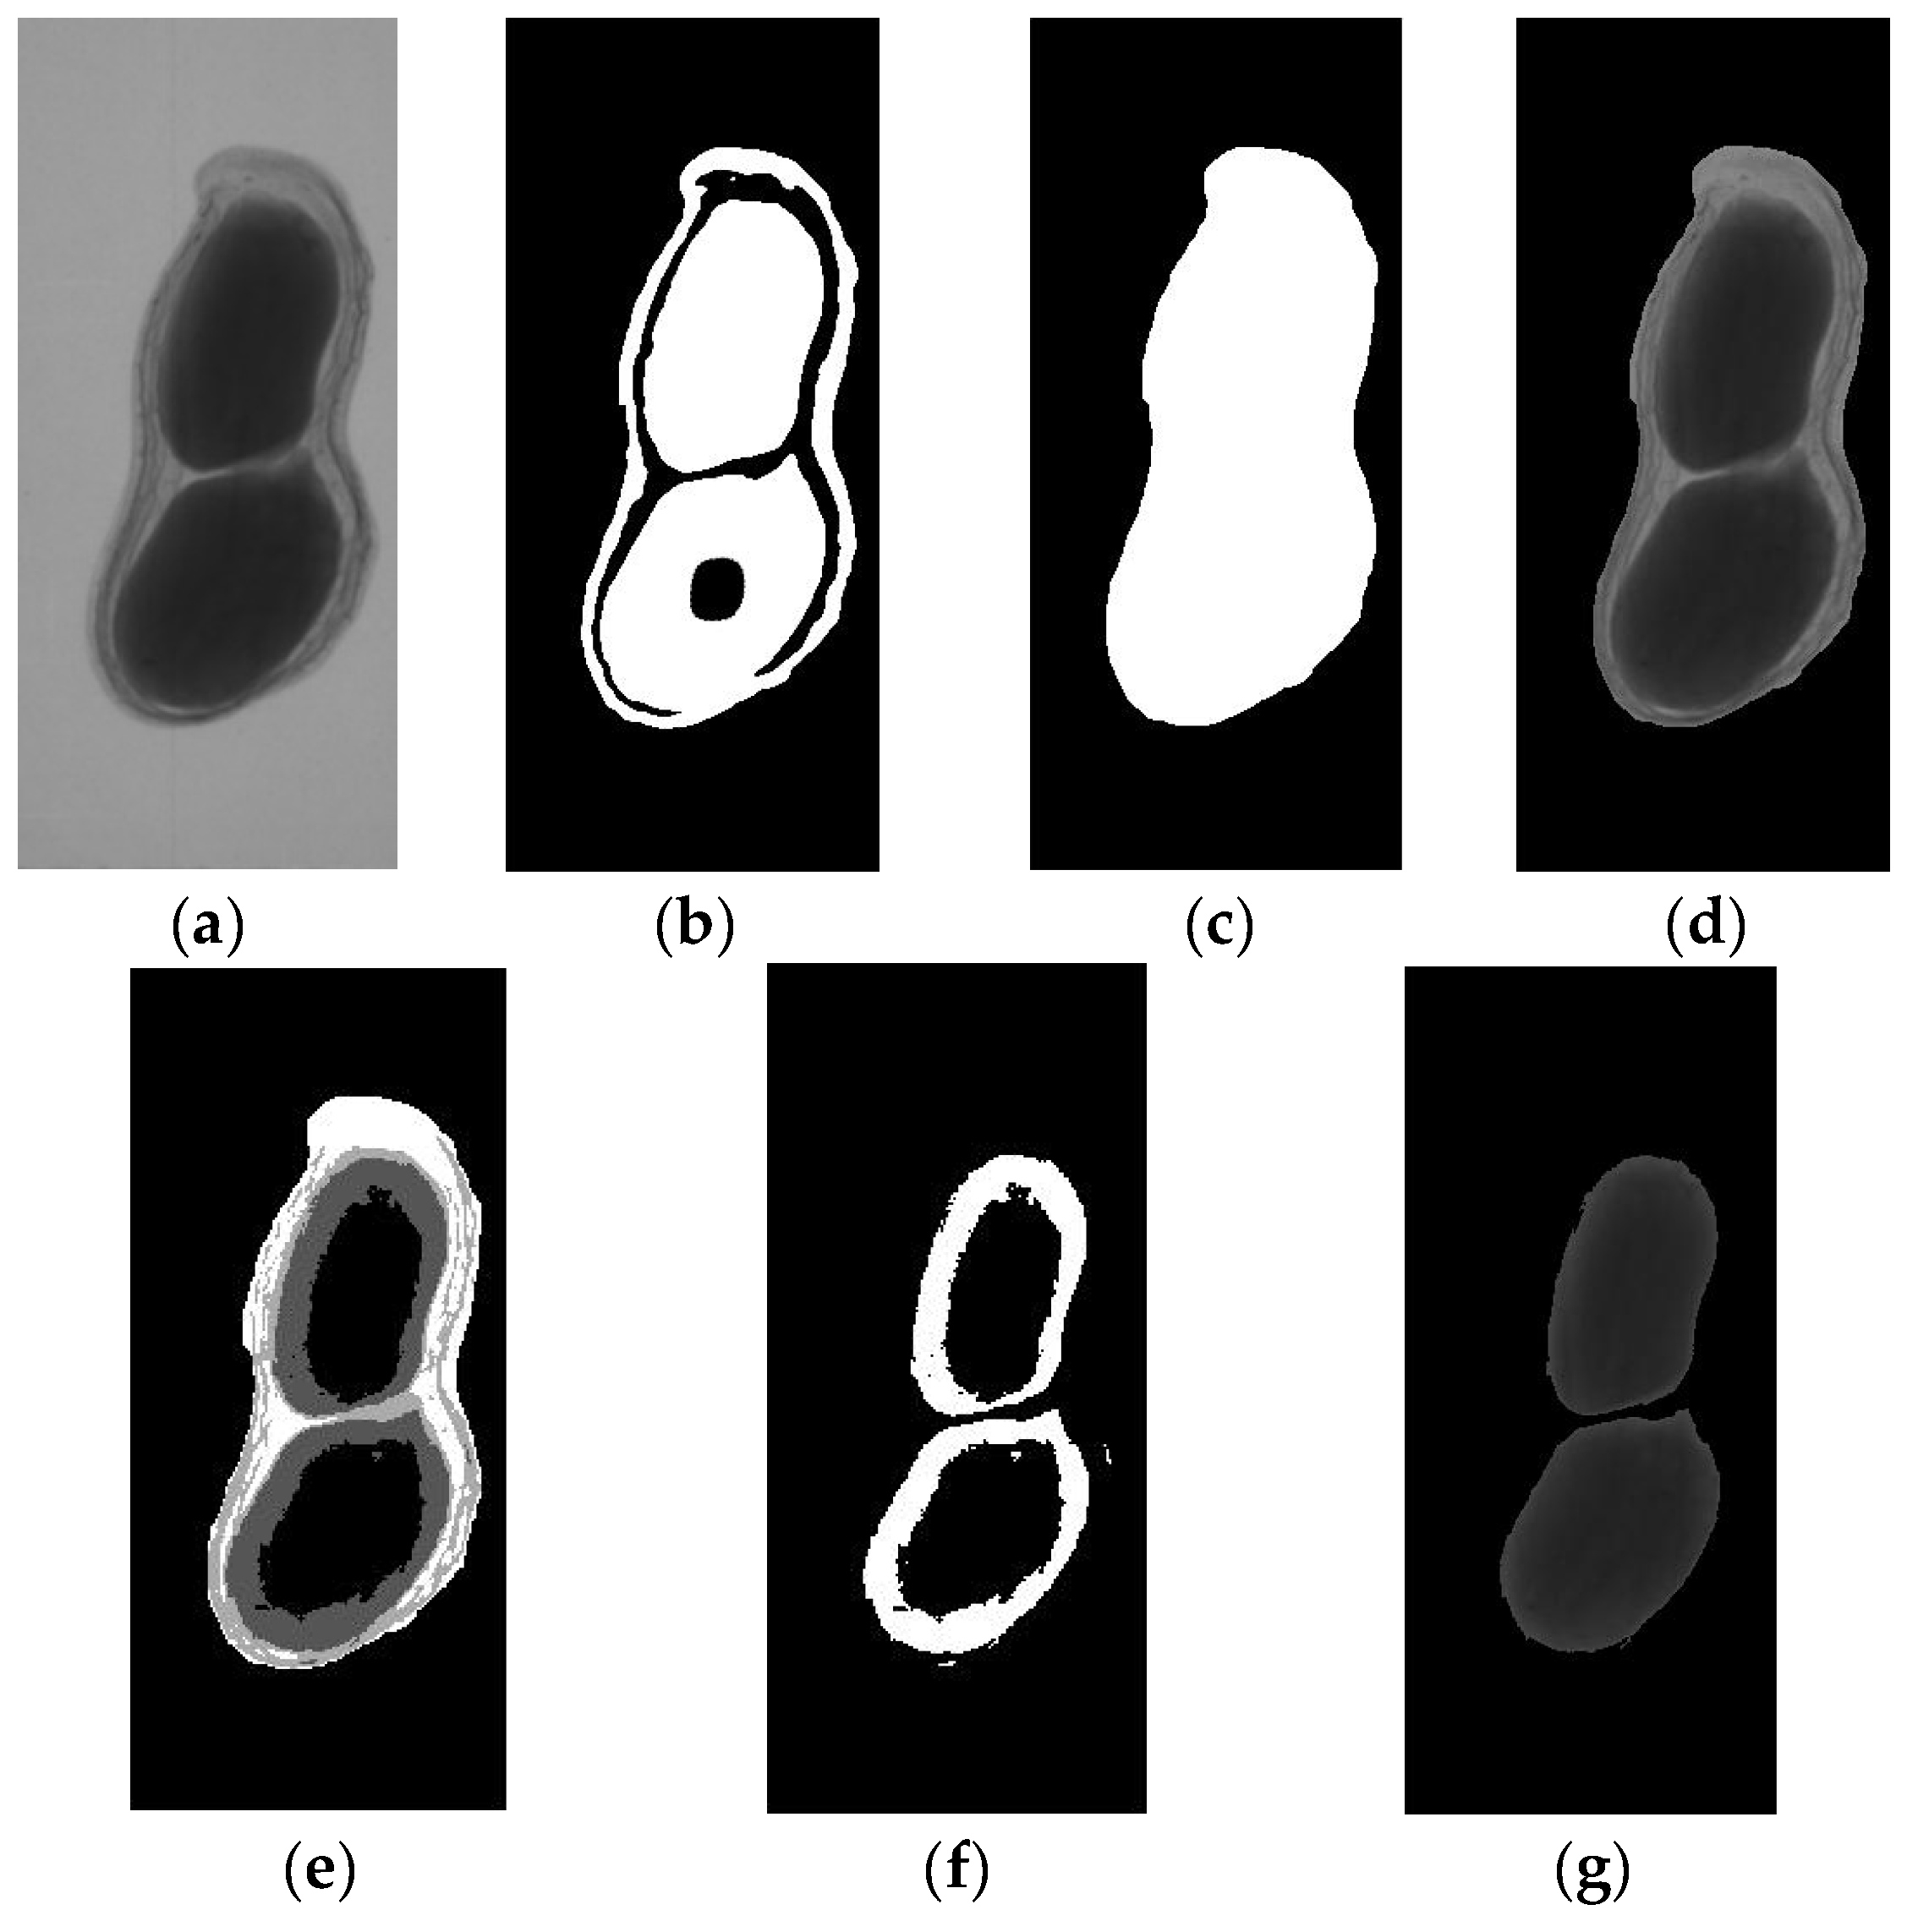
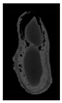
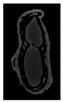
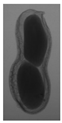
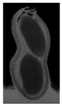
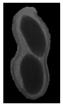
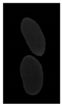
The image segmentation results with LSA-MOTSU are shown in Figure 6.

Figure 6.
The LSA-MOTSU result of the image segmentation process: (a) original X-ray image; (b) image after LSA; (c) image after morphology operations; (d) the segmented image of a peanut pod; (e) image after multi-threshold OTSU segmentation; (f) image of thresholds for peanut seeds; (g) image of peanut seeds after morphology operations.
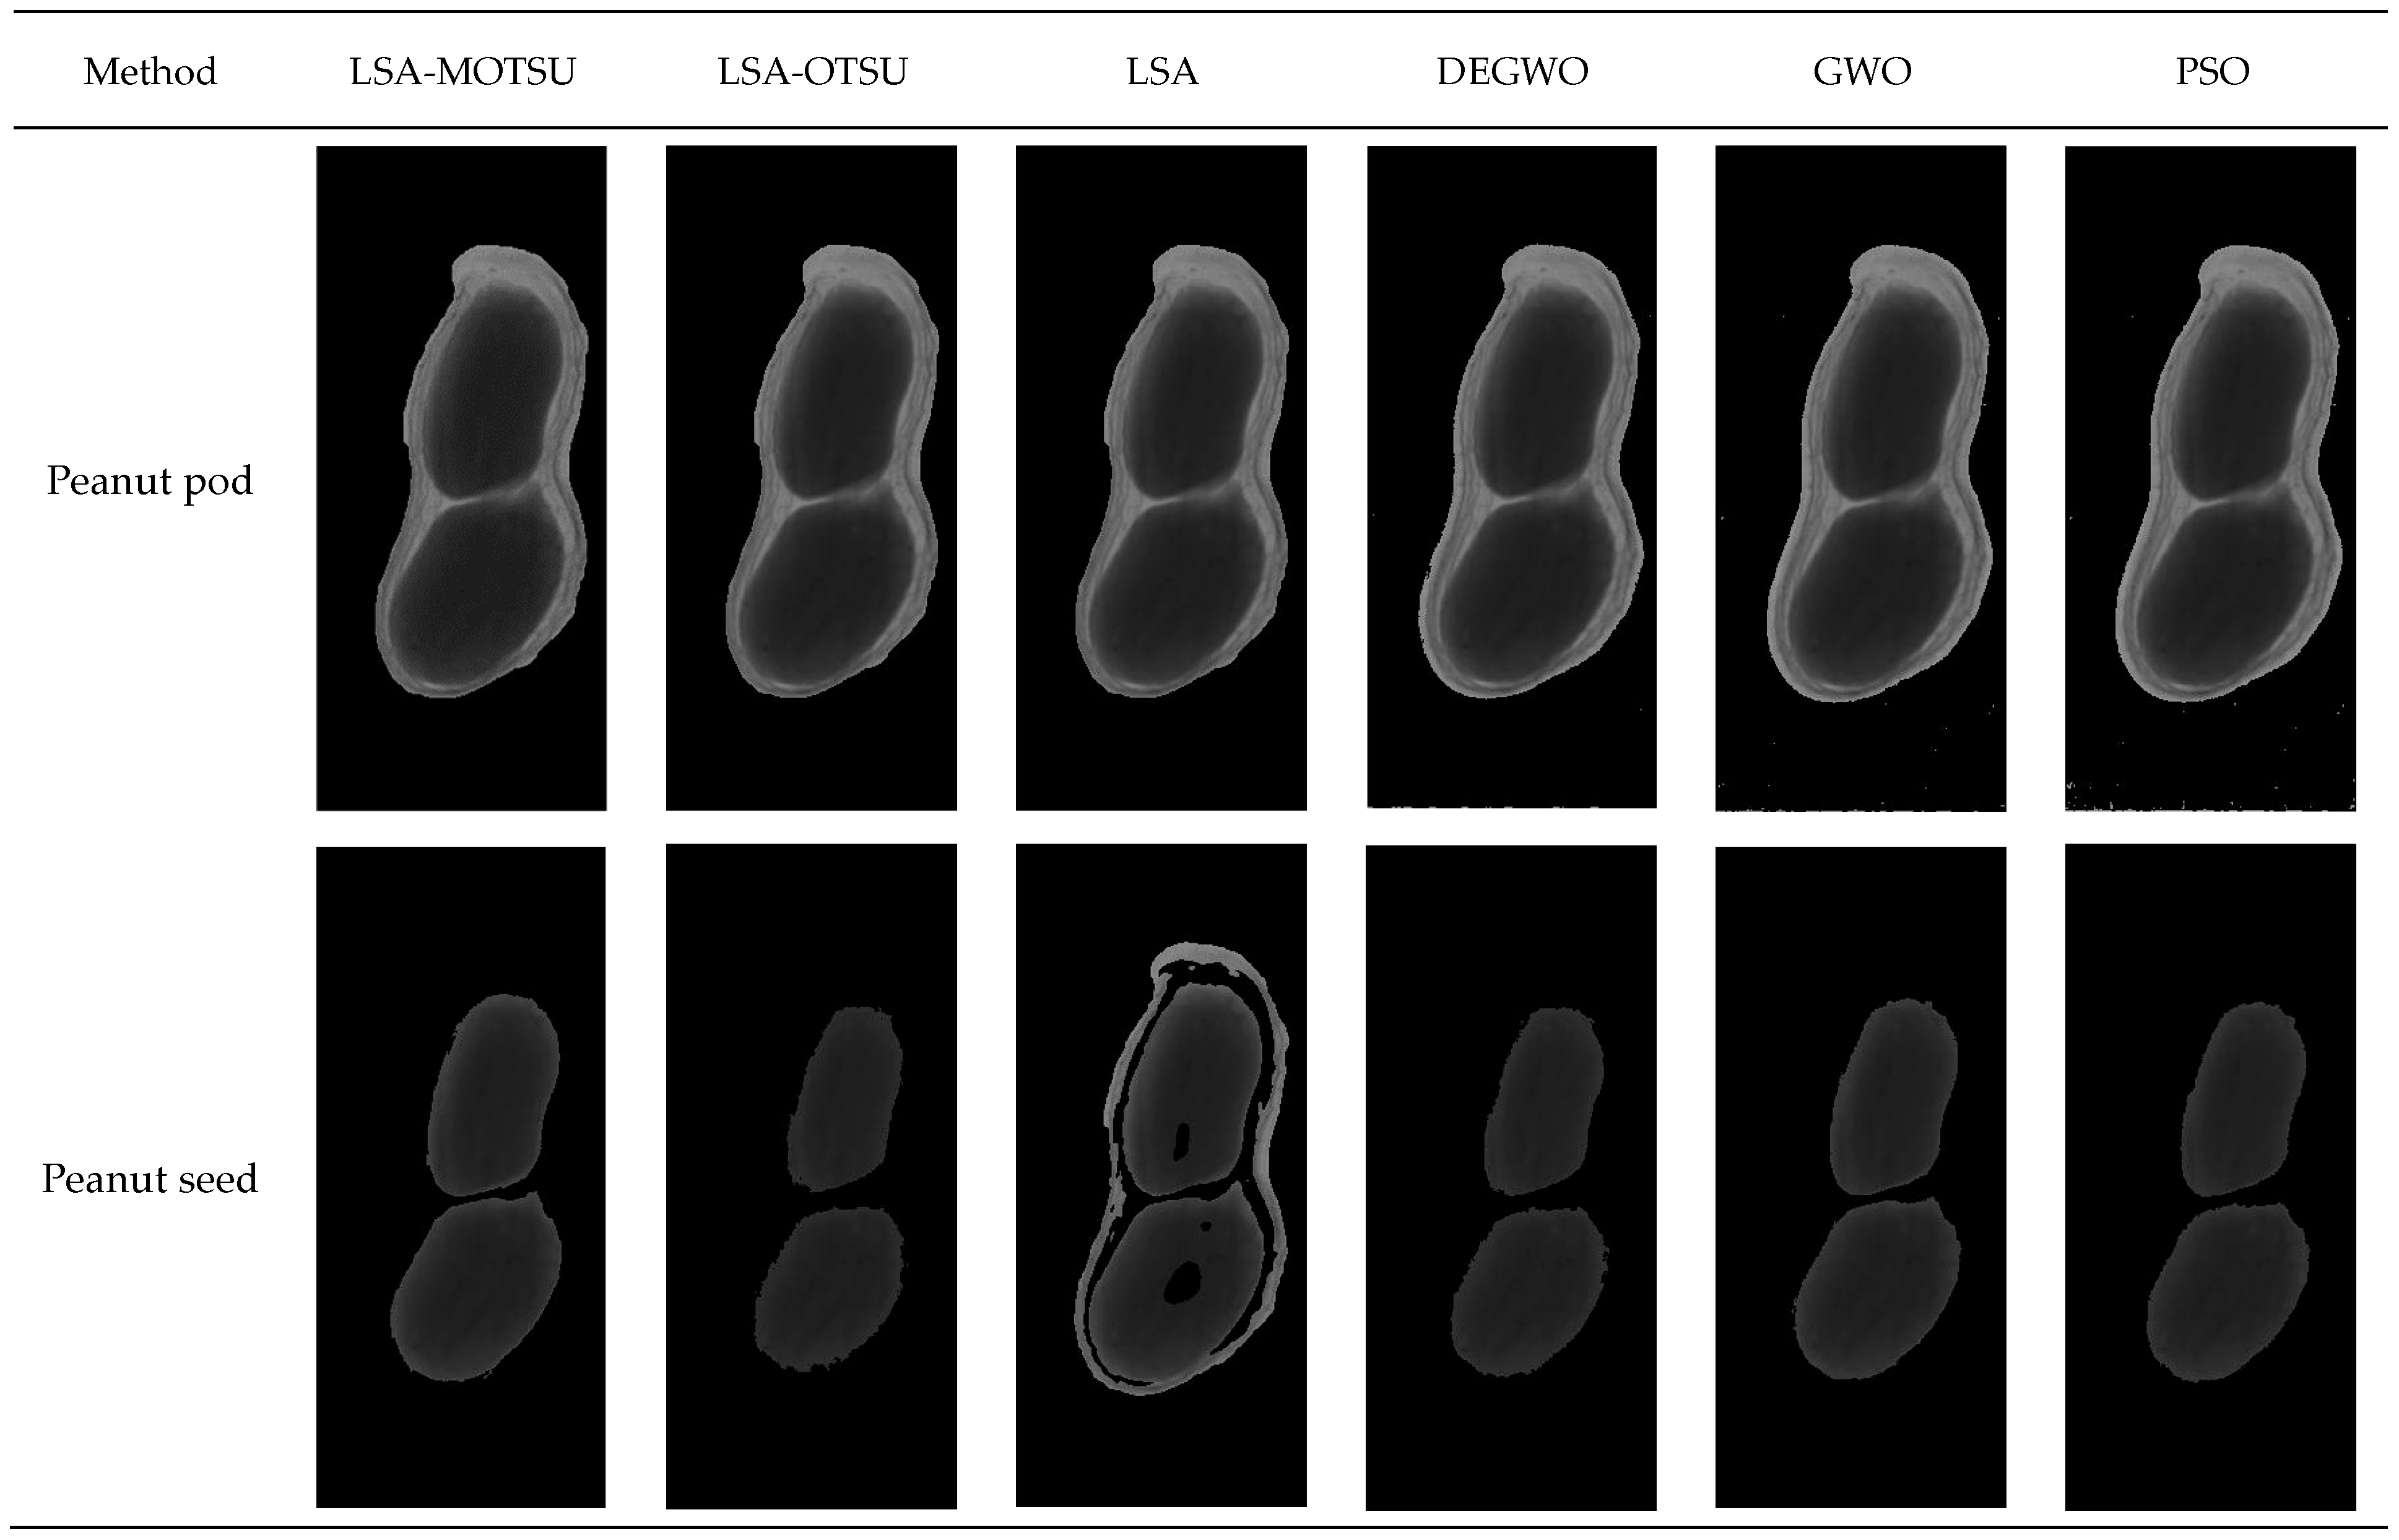
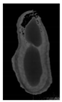
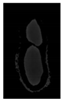
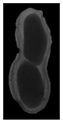
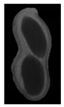
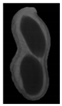
The peanut segmentation effect images of different methods are shown in Figure 7.

Figure 7.
Peanut segmentation effect images of different methods.
In the peanut pod part, there was a small difference between the six algorithms, but there were misjudgment pixels in GWO, DEGWO and PSO. As for the peanut seeds, LSA-MOTSU was able to completely segment peanut seeds. There were too many misjudgment pixels in the segmentation of peanut seeds by the LSA. There were partial misjudgment pixels in the peanut seed image by LSA-OTSU, GWO and DEGWO methods. The results of the segmentation of peanut seeds by PSO were more complete, but the accuracy of LSA-MOTSU was superior to that of PSO.
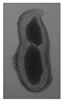
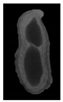
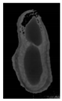
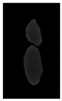
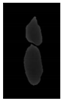
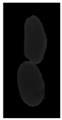
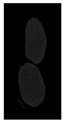
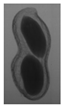
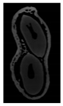
The result images of artificial segmentation are shown in Figure 8.
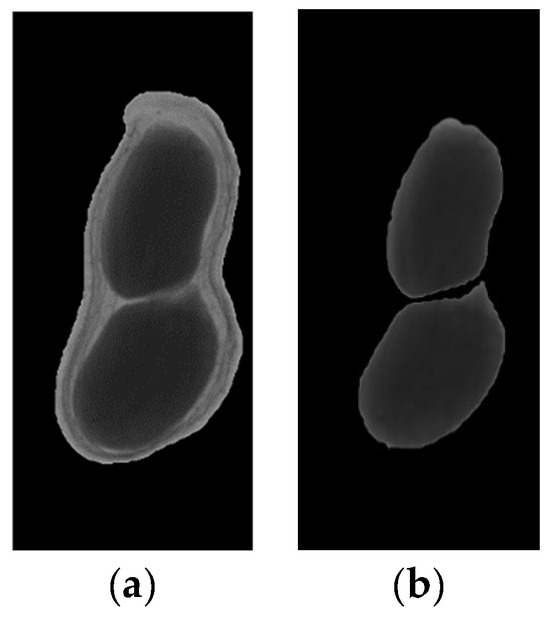
Figure 8.
The result images of artificial segmentation: (a) Image of peanut pod (b) Image of peanut seeds.
3.2. Experiment of the Peanut Plumpness
The peanut plumpness data results compared with the other five algorithms and artificial segmentation are shown in Table 1. The peanut pod and seed images are measured in pixels.

Table 1.
Comparison of peanut plumpness obtained with different methods.
For LSA-MOTSU, although the pixel value of the peanut pod is less than that of GWO, DEGWO and PSO algorithms, the value of seeds is the closest to that of the artificial segmentation method.
The pixel value of the peanut pod of GWO, DEGWO and PSO algorithms are close to the artificial segmentation result. However, the results of peanut seed segmentation based on these algorithms are quite different from those of artificial segmentation.
Table 2 lists the assessment results of segmentation. The manual segmentation image is regarded as the gold standard image.
Table 2.
Assessment results of segmentation.
The peanut pod of the level set is over-extracted, resulting in no advantage compared with GWO, DEGWO and PSO.
As for the peanut pod, compared with LSA, LSA-OTSU, GWO, DEGWO and PSO, the LSA-MOTSU has the best detection effects in RI and VI.
For the 5 samples of 25 samples selected, the result image comparison diagram is shown in Table 3. Results of the peanut pod segmentation of 25 samples are shown in Table 4. The data with gray background indicates that LSA-MOTSU is more effective than other algorithms. -- indicates that the data result is equal. Table 4 presents the results of peanut overall segmentation based on 25 samples using various algorithms. Each column represents the evaluation metric results for the different algorithms used for segmentation. Compared to DEGWO, GWO and PSO algorithms, LSA-MOTSU, LSA-OTSU and LSA consistently demonstrate superior performance along with the highest RI values, signifying better agreement with the ground truth. Results of the peanut seed segmentation of 25 samples are shown in Table 5. The data with gray background indicates that LSA-MOTSU is more effective than other algorithms. -- indicates that the data result is equal. For the color deepening part in these tables, LSA-MOTSU has the best effects compared with others. LSA-MOTSU generally demonstrates competitive performance across all evaluation metrics, with relatively higher RI and lower VI values compared to other algorithms, indicating better segmentation accuracy and consistency. However, it shows mixed performance in GCE compared to other algorithms.
Table 3.
Comparison of images of 5 samples from 25 sample results.
Table 4.
Results of peanut overall segmentation of 25 samples.
Table 5.
Results of peanut kernel segmentation of 25 samples.
In conclusion, compared with other algorithms, the LSA-MOTSU algorithm had better effects and higher accuracy in the segmentation of peanut pods and seeds. Compared with DEGWO, GWO and PSO algorithms, in segmentation of the peanut pod, the average RI increased by 10.12%, 1.13% and 0.78%, respectively. Average GCE decreased by 0.53%, 0.11% and 0.09%, and average VI decreased by 24.11%, 5.15% and 2.85%. Compared with LSA-OTSU, LSA, DEGWO, GWO and PSO algorithms, in segmentation of the peanut seeds, the average RI increased by 4.18%, 18.32%, 5.11%, 2.32% and 3.93%, and the average VI decreased by 9.14%, respectively. Compared with LSA-OTSU, LSA and DEGWO, the average GCE decreased by 0.47%, 6.11% and 0.33%, respectively.
4. Discussion
4.1. LSA-MOTSU in Seed Plumpness Detection
The LSA-MOTSU method, designed for peanut seed plumpness detection using soft X-ray imaging, significantly improves the accuracy and efficiency of segmenting peanut seeds from pods. This is evident from the comparative results, where LSA-MOTSU outperforms other algorithms like LSA-OTSU, LSA, DEGWO, GWO and PSO in terms of the random index (RI), global consistency error (GCE) and variation of information (VI). These metrics collectively indicate a more precise segmentation, crucial for accurate plumpness detection, which, in turn, influences the assessment of seed quality and viability.
4.2. Advantages of the Method in This Paper
For the segmentation-based method in seed saturation detection, the detection is mainly based on the segmentation accuracy of seeds and pods, so it is more suitable for image acquisition with little difference in gray levels of the target area.
Pearson et al. [6] successfully used X-ray imaging to detect insect-damaged seeds in sunflowers, indicating the potential of this technology for internal damage assessment. In comparison, the LSA-MOTSU method focuses on the plumpness of peanut seeds, a slightly different application but similarly leveraging the non-destructive nature of X-ray imaging. Bianchini et al. [7] utilized ROI and mean gray value calculations for studying internal tissues, which primarily rely on simple statistical measures of image intensity. The LSA-MOTSU method, by incorporating advanced segmentation techniques like the level set and multi-threshold OTSU, provides a more nuanced analysis by accurately segmenting the peanut seeds from their pods, which could potentially be adapted for the more detailed internal analysis. Medeiros et al. [8] evaluated the use of convolutional neural networks (CNNs) with X-ray images for quality monitoring. While CNNs offer robust performance in image classification tasks, they require extensive data for training.
The automated approach of LSA-MOTSU not only reduces the time taken but also minimizes physical handling, thus preserving seed integrity and potentially enhancing the accuracy of seed viability assessments.
4.3. Deficiency and Prospect
The method proposed in this study achieved high accuracy in plumpness detection, but it still has certain limitations. The algorithm’s dependency on the quality of X-ray imaging and its calibration could pose limitations, especially in varied agricultural settings. Additionally, the segmentation performance might still be susceptible to errors when dealing with highly overlapping seeds or seeds with very subtle differences in grayscale values. Further research could focus on refining the LSA-MOTSU algorithm to enhance its robustness against varying seed morphologies and overlapping structures.
Future research could explore the integration of LSA-MOTSU with deep learning techniques, potentially enhancing its adaptability and accuracy. Such integration could address the data-intensive requirements of neural networks while benefiting from the precision of level set and OTSU methods.
5. Conclusions
For the purpose of scientific experimental breeding and testing grading service pricing, the peanut images obtained by soft X-rays were used to detect plumpness. The overall grayscale of the peanut was similar to the background, and the edge of the peanut seed was blurred, which would lead to inaccurate segmentation targets and low detection accuracy. In this paper, a new method for detecting the plumpness of the peanut seed based on level set and multi-threshold segmentation was proposed. The level set algorithm is used to extract the overall contour of peanuts. The multi-threshold OTSU algorithm is used for threshold segmentation. Morphology was used to complete the cavity. Therefore, the division of the peanut seed and peanut pod is realized.
In conclusion, compared with other algorithms, the LSA-MOTSU algorithm had a better effect and higher accuracy in the segmentation of peanut pods and seeds. Compared with DEGWO, GWO and PSO algorithms, in the segmentation of the peanut pod, the average RI increased by 10.12%, 1.13% and 0.78%, respectively. Average GCE decreased by 0.53%, 0.11% and 0.09%, and the average VI decreased by 24.11%, 5.15% and 2.85%. Compared with LSA-OTSU, LSA, DEGWO, GWO and PSO algorithms, in the segmentation of the peanut seeds, the average RI increased by 4.18%, 18.32%, 5.11%, 2.32% and 3.93%, and the average VI decreased by 9.14%, respectively. Compared with LSA-OTSU, LSA and DEGWO, the average GCE decreased by 0.47%, 6.11% and 0.33%, respectively.
The proposed method is stable and accurate. It satisfies the requirements of peanut image plumpness detection. It provides a feasible technical means and reference for grading, scientific experimental breeding and estimating seed weight.
Author Contributions
Conceptualization, N.W., Y.L. and G.Q.; methodology, N.W., Y.L. and G.Q.; software, Y.L.; validation, Y.L.; formal analysis, Y.L.; investigation, G.Q.; resources, Y.L.; data curation, Y.L.; writing—original draft preparation, Y.L.; writing—review and editing, N.W., Y.L. and G.Q.; visualization, G.Q.; supervision, Y.L.; project administration, N.W. All authors have read and agreed to the published version of the manuscript.
Funding
This article was supported by the National Natural Science Foundation of China (No. 42001256), Jilin Science and Technology Development Program Project (No. 20220402023GH) and also the Natural Science Foundation of Guangdong Province ((No. 2022A1515010391); the Scientific and Technological Innovation Strategic Program of Guangdong Academy of Agricultural Sciences (No. ZX202402); the Guangzhou Science and Technology Planning Project (202201010659); the Innovation Fund of Guangdong Academy of Agricultural Sciences (No. 202104); the Youth Training Program of Guangdong Academy of Agricultural Sciences (No. R2020QD-061); and the USDA-NIFA Hatch Projects OKL03169 and OKL03178.
Institutional Review Board Statement
Not applicable.
Data Availability Statement
The datasets in this study are available from the corresponding author on reasonable request.
Conflicts of Interest
The authors declare no conflicts of interest.
References
- Pramanik, S.; Banik, D.; Bhattacharjee, D.; Nasipuri, M.; Bhowmik, M.K.; Majumdar, G. Suspicious-Region Segmentation from Breast Thermogram Using DLPE-Based Level Set Method. IEEE Trans. Med. Imaging 2019, 38, 572–584. [Google Scholar] [CrossRef] [PubMed]
- Lee, D.; Kim, H.; Choi, B.; Kim, H.J. Development of a Deep Neural Network for Generating Synthetic Dual-Energy Chest X-ray Images with Single X-ray Exposure. Phys. Med. Biol. 2019, 64, 115017. [Google Scholar] [CrossRef] [PubMed]
- Gros, M.A.L.; Clowney, E.J.; Magklara, A.; Yen, A.; Markenscoff-Papadimitriou, E.; Colquitt, B.; Myllys, M.; Kellis, M.; Lomvardas, S.; Larabell, C.A. Soft X-ray Tomography Reveals Gradual Chromatin Compaction and Reorganization during Neurogenesis In Vivo. Cell Rep. 2016, 17, 2125–2136. [Google Scholar] [PubMed]
- Willner, M.; Viermetz, M.; Marschner, M.; Scherer, K.; Braun, C.; Fingerle, A.; Noël, P.; Rummeny, E.; Pfeiffer, F.; Herzen, J. Quantitative Three-Dimensional Imaging of Lipid, Protein, and Water Contents via X-ray Phase-Contrast Tomography. PLoS ONE 2016, 11, e0151889. [Google Scholar] [CrossRef] [PubMed]
- ISTA. International Rules for Seed Testing; The International Seed Testing Association: Wallisellen, Switzerland, 2019. [Google Scholar]
- Pearson, T.C.; Prasifka, J.; Brabec, D.; Haff, R.; Hulke, B. Automated Detection of Insect-Damaged Sunflower Seeds by X-ray Imaging. Appl. Eng. Agric. 2014, 30, 125–131. [Google Scholar]
- Bianchini, V.D.M.; Mascarin, G.M.; Silva, L.C.A.S.S.; Arthur, V.; Carstensen, J.M.; Boelt, B.; da Silva, C.B. Multispectral and X-ray images for characterization of Jatropha curcas L. seed quality. Plant Methods 2021, 17, 9. [Google Scholar] [CrossRef] [PubMed]
- Medeiros, A.D.D.; Bernardes, R.C.; Silva, L.J.D.; Freitas, B.A.L.D.; Dias, D.C.F.D.S.; Sliva, C.B.D. Deep Learning-based Approach using X-ray Images for Classifying Crambe abyssinica Seed Quality. Ind. Crops Prod. 2021, 164, 113378. [Google Scholar] [CrossRef]
- Nagaraju, A.; Babu, T.R.; Babu, B.S. Effects of X-ray Radiography on the Germination of Groundnut Seeds. Environ. Ecol. 2017, 35, 3660–3663. [Google Scholar]
- Luo, L.; Liu, S.; Tong, X.; Jiang, P.; Yuan, C.; Zhao, X.; Shang, F. Carotid Artery Segmentation Using Level Set Method with Double Adaptive Threshold (DATLS) on TOF-MRA Images. Magn. Reson. Imaging 2019, 63, 123–130. [Google Scholar] [CrossRef]
- Rehman, F.; Shah, S.I.A.; Riaz, M.N.; Gilani, S.O.; Faiza, R. A Region-Based Deep Level Set Formulation for Vertebral Bone Segmentation of Osteoporotic Fractures. J. Digit. Imaging 2020, 33, 191–203. [Google Scholar] [CrossRef]
- Feng, F.; Ashton-Miller, J.A.; Delancey, J.O.L.; Luo, J. Convolutional Neural Network-Based Pelvic Floor Structure Segmentation Using Magnetic Resonance Imaging in Pelvic Organ Prolapse. Med. Phys. 2020, 47, 4281–4293. [Google Scholar] [CrossRef]
- Liu, Y.; Sun, J.; Yu, H.; Wang, Y.; Zhou, X. An Improved Grey Wolf Optimizer Based on Differential Evolution and OTSU Algorithm. Appl. Sci. 2020, 10, 6343. [Google Scholar] [CrossRef]
- Qin, J.; Shen, X.; Mei, F.; Fang, Z. An Otsu multi-thresholds segmentation algorithm based on improved ACO. J. Supercomput. 2019, 75, 955–967. [Google Scholar] [CrossRef]
- Wang, C.; Yang, J.; Lv, H. Otsu Multi-Threshold Image Segmentation Algorithm Based on Improved Particle Swarm Optimization. In Proceedings of the 2019 IEEE 2nd International Conference on Information Communication and Signal Processing (ICICSP), Weihai, China, 28–30 September 2019; IEEE: Piscataway, NJ, USA, 2019. [Google Scholar]
- Osher, S.; Sethian, J.A. Fronts Propagating with Curvature-Dependent Speed: Algorithms Based on Hamilton-Jacobi Formulations. J. Comput. Phys. 1988, 79, 12–49. [Google Scholar] [CrossRef]
- Otsu, N. A Threshold Selection Method from Gray-Level Histograms. IEEE Trans. Syst. Man Cybern. 1979, 9, 62–66. [Google Scholar] [CrossRef]
- Huang, G.; Ji, H.; Zhang, W.; Zhu, Z. Adaptive Multilayer Level Set Method for Segmenting Images with Intensity Inhomogeneity. IET Image Process. 2019, 13, 1714–1724. [Google Scholar] [CrossRef]
- Mirzaaghaian, A.; Ramiar, A.; Ranjbar, A.A.; Warkiani, M.E. Application of Level-Set Method in Simulation of Normal and Cancer Cells Deformability within a Microfluidic Device. J. Biomech. 2020, 112, 110066. [Google Scholar] [CrossRef]
- Zhang, Y.; Wu, J.; Liu, Y.; Chen, Y.; Chen, W.; Wu, E.X.; Li, C.; Tang, X. A Deep Learning Framework for Pancreas Segmentation with Multi-Atlas Registration and 3D Level-Set. Med. Image Anal. 2021, 68, 101884. [Google Scholar] [CrossRef]
- Tan, Z.G.; Ou, J.P.; Zhang, J.; Shen, X.G. Depth Image Segmentation Algorithm Based on Multi-Feature Combination. Comput. Eng. Sci. 2018, 40, 97–102. [Google Scholar]
- Kayal, E.B.; Kandasamy, D.; Sharma, R.; Sharma, M.C.; Bakhshi, S.; Mehndiratta, A. SLIC-Supervoxels-Based Response Evaluation of Osteosarcoma Treated with Neoadjuvant Chemotherapy Using Multi-Parametric MR imaging. Eur. Radiol. 2020, 30, 3125–3136. [Google Scholar] [CrossRef]
- Gonzalez, R.C.; Woods, R.E.; Eddins, S.L. Digital Image Processing Using MATLAB; Prentice Hall: Upper Saddle River, NJ, USA, 2003. [Google Scholar]
- Zhao, Y.; Liu, S.; Hu, Z.; Bai, Y.; Shen, C.; Shi, X. Separate Degree Based Otsu and Signed Similarity Driven Level Set for Segmenting and Counting Anthrax Spores. Comput. Electron. Agric. 2020, 169, 105230. [Google Scholar] [CrossRef]
- Mirjalili, S.; Mirjalili, S.M.; Lewis, A. Grey Wolf Optimizer. Adv. Eng. Softw. 2014, 69, 46–61. [Google Scholar] [CrossRef]
- Eberhart, R.C.; Kennedy, J. A New Optimizer Using Particle Swarm Theory. In Proceedings of the Sixth International Symposium on Micro Machine and Human Science (MHS’95), Nagoya, Japan, 4–6 October 1995. [Google Scholar]
- Martin, D.; Fowlkes, C.; Tal, D.; Malik, J. A Database of Human Segmented Natural Images and Its Application to Evaluating Segmentation Algorithms and Measuring Ecological Statistics. In Proceedings of the IEEE International Conference on Computer Vision 2001, Vancouver, BC, Canada, 7–14 July 2001. [Google Scholar]
- Rand, W.M. Objective Criteria for the Evaluation of Clustering Methods. J. Am. Stat. Assoc. 1971, 66, 846–850. [Google Scholar] [CrossRef]
- Meila, M. Comparing clusterings by the variation of information. In Learning Theory and Kernel Machines, Proceedings of the 16th Annual Conference on Computational Learning Theory and 7th Kernel Workshop, COLT/Kernel 2003, Washington, DC, USA, 24–27 August 2003; Lecture Notes in Computer Science; Springer: Berlin/Heidelberg, Germany, 2003; Volume 2777, pp. 173–187. [Google Scholar]


Disclaimer/Publisher’s Note: The statements, opinions and data contained in all publications are solely those of the individual author(s) and contributor(s) and not of MDPI and/or the editor(s). MDPI and/or the editor(s) disclaim responsibility for any injury to people or property resulting from any ideas, methods, instructions or products referred to in the content. |
© 2024 by the authors. Licensee MDPI, Basel, Switzerland. This article is an open access article distributed under the terms and conditions of the Creative Commons Attribution (CC BY) license (https://creativecommons.org/licenses/by/4.0/).