Abstract
Grain from improved varieties of the perennial grass Thinopyrum intermedium (Host) Barkworth & D.R. Dewey is marketed under the trade name Kernza (common name intermediate wheatgrass, IWG). While a growing body of evidence is available on the nutritional quality of Kernza, gaps exist for components such vitamins and minerals and protein quality. Therefore, we performed two studies on early-generation breeding program material, characterizing nutritional quality by quantifying macronutrients, sugars, dietary fiber, amino acid profiles, fat composition, vitamins, minerals, carotenoids, antioxidants, and antioxidant activity. The IWG studied frequently had concentrations significantly different from the reference values for whole wheat flour. For example, IWG had 50% higher protein, 129% higher dietary fiber, and 65% higher ash content than reference whole wheat flour. Calcium and selenium were 267% and 492% higher, respectively, in IWG than whole wheat flour. Riboflavin and folate were 43% and 447% higher, respectively, and niacin 74% lower in IWG versus whole wheat flour. We identified lysine as the limiting amino acid, although its concentration was 33% greater in IWG than in whole wheat flour. These results support potential benefits of Kernza for human nutrition. This work supports ongoing studies to further characterize and evaluate nutritional quality during the domestication and breeding process.
1. Introduction
Perennial grain crops which can be established once and harvested for numerous years without replanting have been proposed to address a wide array of challenges to agricultural production, including soil degradation, water contamination, and habitat loss [1]. Through reduced soil disturbance and large root systems, perennial grain crops are expected to accumulate soil carbon, which could make a significant contribution to carbon sequestration and greenhouse gas mitigation [2,3]. Additionally, perennial grain crops have been shown to improve soil quality [4,5,6,7], and water quality via reduced nitrate leaching [4,8,9,10]. Producers benefit from reduced tillage requirements, equipment use, and input costs [1,11]. Perenniality and diversity can contribute to greater stability in production systems [12]. The feasibility of perennial grain crops was recently demonstrated with the development of a perennial rice variety that has yields equivalent to annual rice while improving farmers’ incomes and increasing soil carbon content [13]. Because perennial grasses with high yields of edible grains are not found in nature, an effort has been underway to domesticate wild perennials such as intermediate wheatgrass since the 1980s [14].
The identification of Thinopyrum intermedium (Host) Barkworth & D.R. Dewey (common name intermediate wheatgrass, IWG) as a promising perennial grain candidate emerged from an evaluation of nearly 100 perennial grass species led by the Rodale Institute (Kutztown, PA, USA) [15,16]. For context, two cycles (generations) of selection were conducted by The Rodale Institute before The Land Institute (TLI; Salina, KS, USA) initiated an IWG breeding program, followed by three cycles of selection and the start of a University of Minnesota (UMN; St. Paul, MN, USA) breeding program. Additional breeding cycles have been performed in Kansas and Minnesota, with new breeding programs initiated in Utah, Canada, and Sweden [14]. The work presented herein will focus on diverse source materials that were developed by The Land Institute prior to distribution to other programs and subsequent genetic differentiation. Therefore, the core objective is to provide baseline values for the new crop, based on evaluations of genetically diverse materials as a reference point prior to subsequent changes that are expected due to breeding in diverse environments.
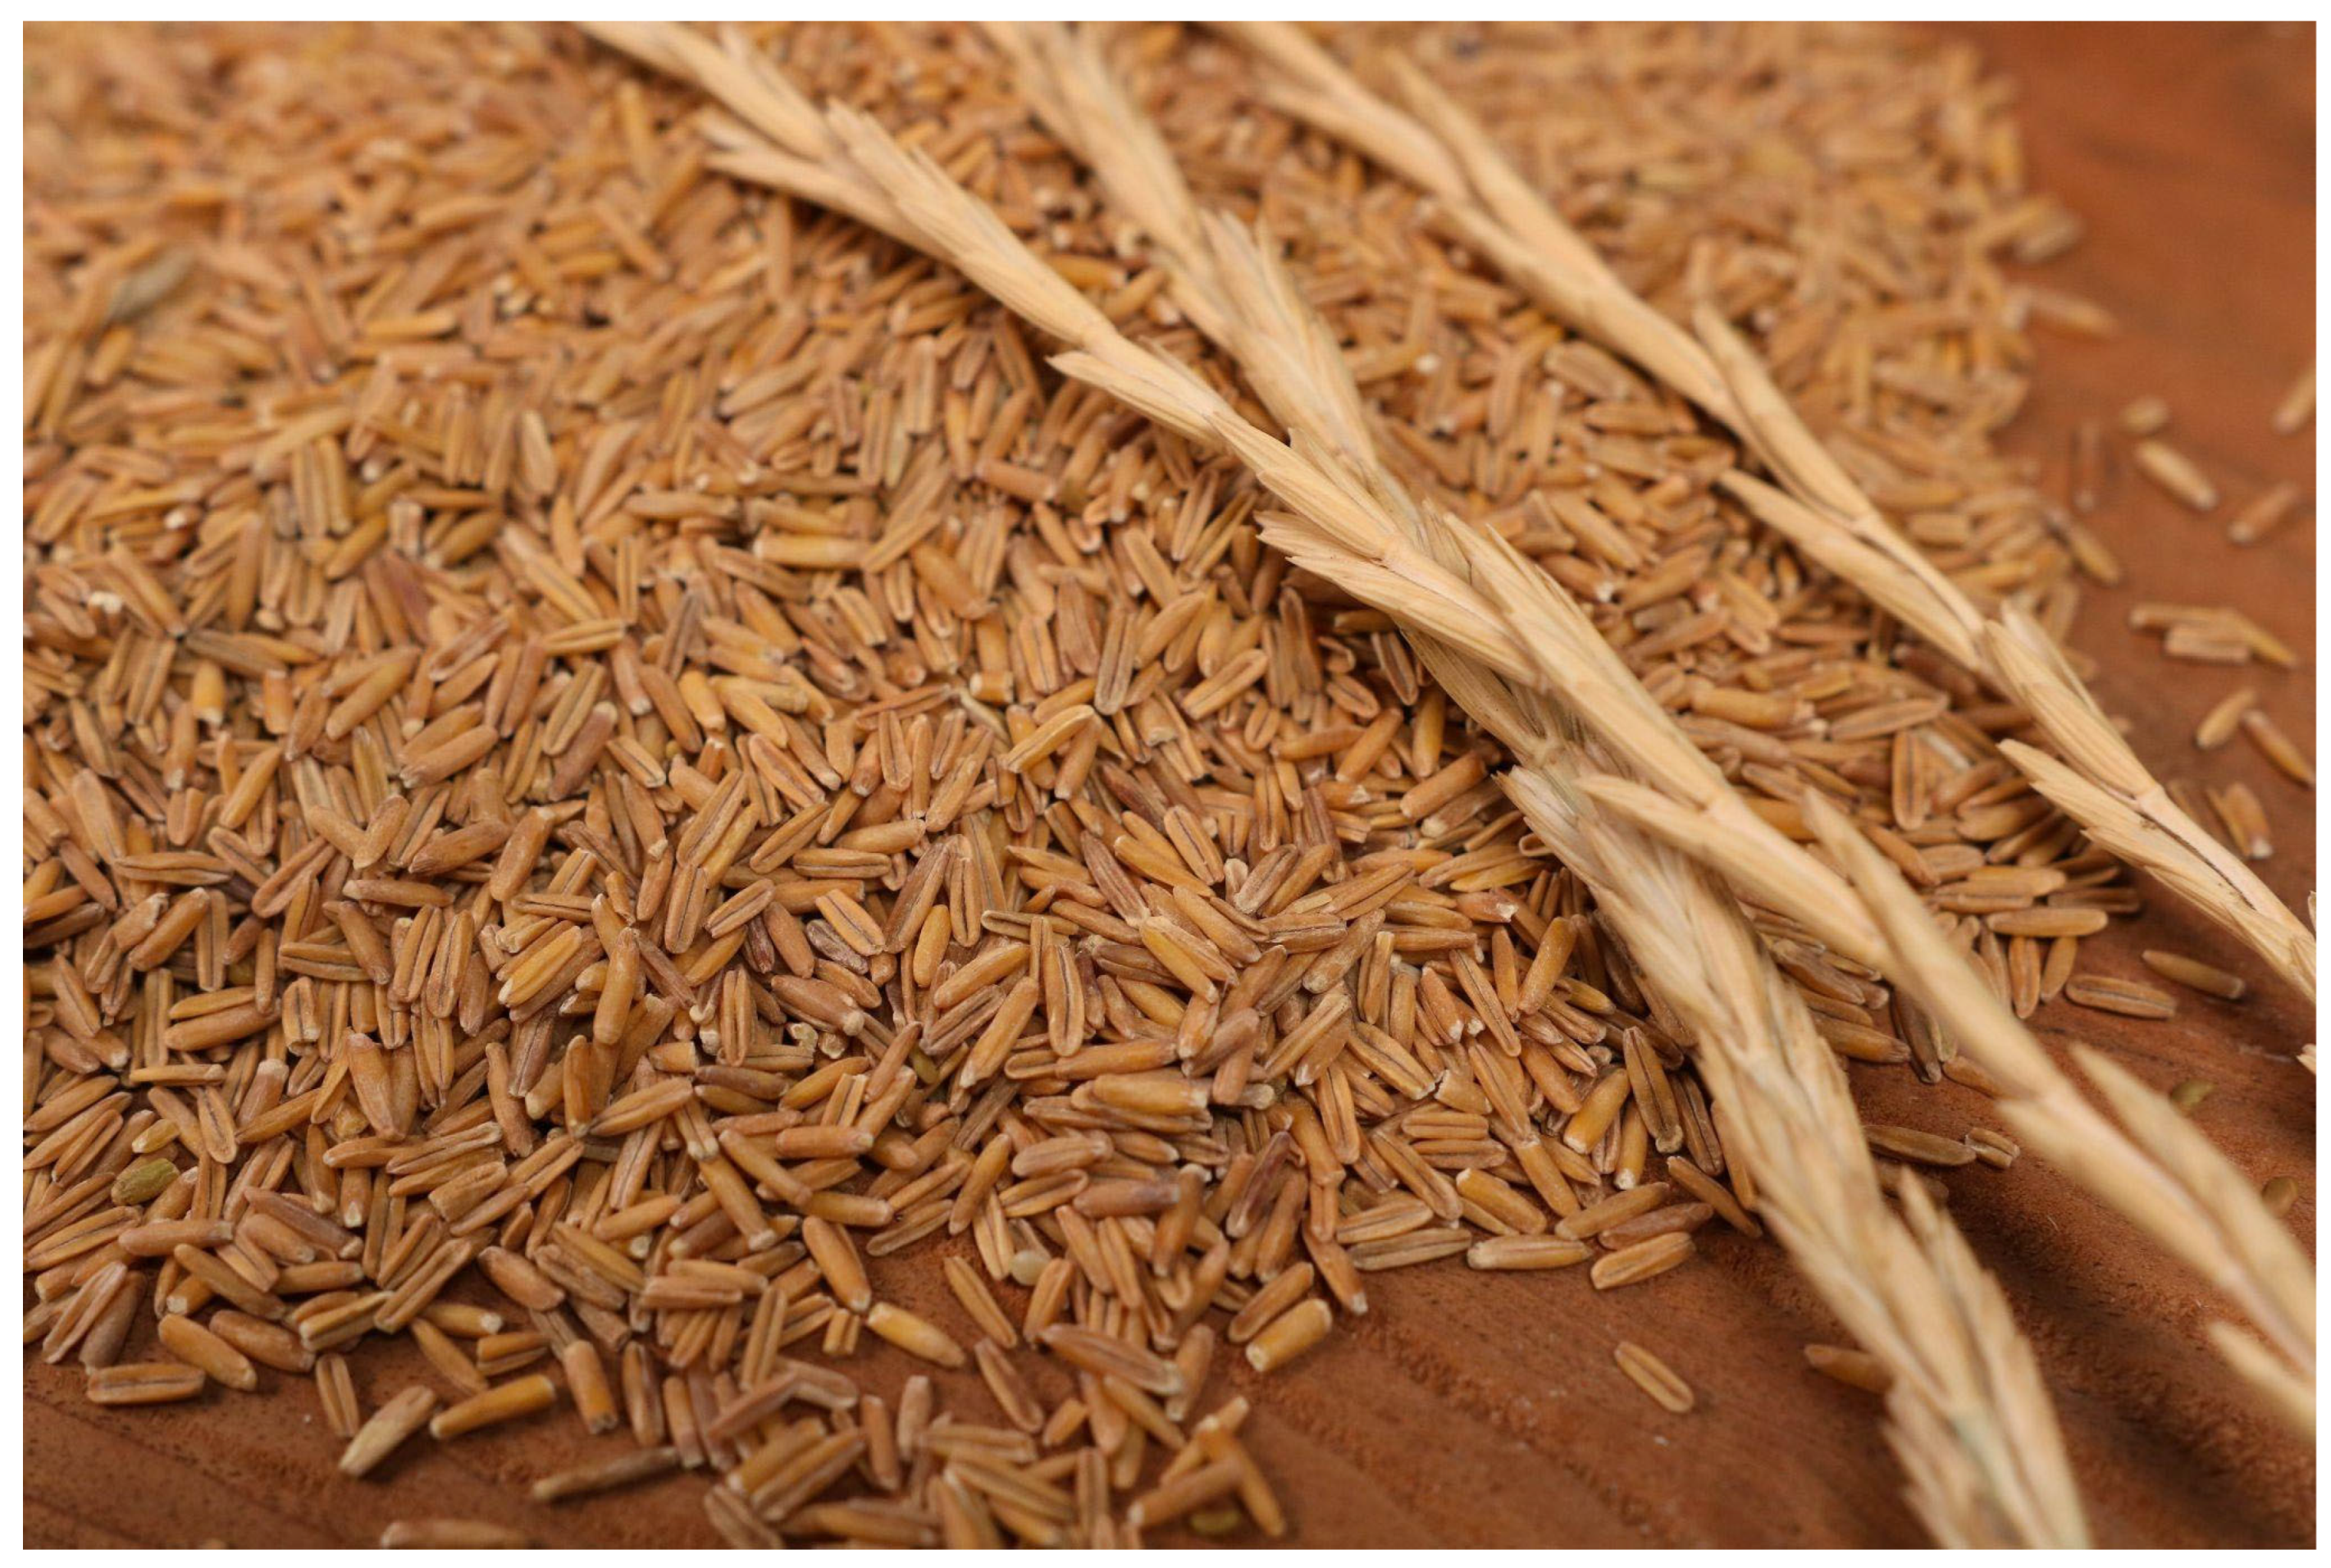
IWG is the first widely available commercial perennial grain crop, sold under the trade name Kernza (Figure 1) [17,18]. Consequently, IWG grain has been most extensively researched with regards to nutritional quality, food functionality, and performance in food products. This information informs end use, guiding the placement of Kernza in the marketplace.
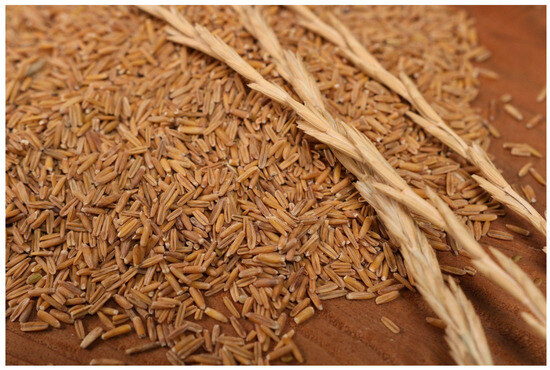
Figure 1.
Kernza with hull removed (i.e., dehulled) and grain-bearing spikes prior to threshing (photo credit: Alicia DeHaan).
Becker et al. (1991) provided the earliest insights into the compositional, nutritional, and functional properties of IWG [19]. They also evaluated its performance in food products, sensory attributes, and consumer acceptance. IWG generally performed well in the different products, with muffins receiving higher scores relative to the other products. The study included stone milled wheat and commercial whole wheat flour for comparisons. Numerous studies in food science have since evaluated IWG. Fewer studies have investigated consumer acceptance and preferences, with preliminary insights indicating that extensive trialing of varying inclusion rates is necessary to produce a product that meets functional and sensory expectations. Consumer demand remains low compared to annual grains, and consumer education is a major barrier to acceptance. Bharathi et al. (2022) provide a comprehensive summary of progress in IWG breeding from a food science perspective [20]. A particular focus has been on the protein composition of IWG in the context of breadmaking (Figure 2). Overall, the body of literature provides broad, fundamental knowledge following progressive cycles of domestication and breeding to develop improved varieties of IWG for human consumption.
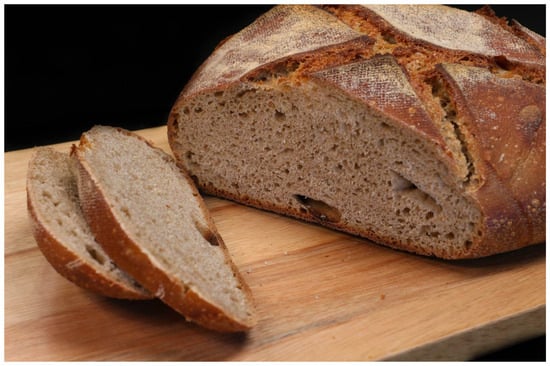
Figure 2.
Bread loaf utilizing an 80%:20% blend of refined bread wheat and whole Kernza flour (photo credit: Alicia DeHaan).
With breeding ongoing to further domesticate IWG, the chemical composition is expected to change. This is primarily due to breeding and selection for greater yields and seed size, which is likely to alter the storage of macronutrients in seed structures such as the starchy endosperm, germ, and bran. For example, protein is unevenly distributed in wheat kernels. The highest amount of protein is concentrated in the endosperm, while protein content decreases toward the outer layers of the kernel [21]. Furthermore, phytochemicals that confer human health benefits, such as dietary fiber, minerals, and vitamins, are concentrated in the bran [22]. Continuous evaluation of IWG varieties developed for human food use is critical to understanding nutritional quality, functionality, and potential impacts on human health. We present the results from two studies investigating the chemical composition of IWG from early cycles of selection, to strengthen the limited body of evidence currently available for macronutrients, dietary fiber, carotenoids, antioxidants, and antioxidant activity. We also provide novel insights into vitamin and mineral contents and amino acid profiles, which are currently lacking in the literature. Additionally, these studies evaluated samples produced in Kansas, a notably hotter and drier production environment compared to the upper Midwest, which has been the focus of most previous studies. Our aim is to report these findings so they may be useful to future studies investigating IWG nutritional quality, and to compare the chemical composition of IWG to annual wheat to determine where significant differences exist. An array of analytes is compared between IWG and whole wheat flour as reported in the United States Department of Agriculture (USDA) FoodData Central database, and the amino acid content of IWG is compared to annual wheat as reported in the literature.
2. Materials and Methods
2.1. Germplasm
Six IWG samples were tested in two separate studies. In the first study, the IWG samples were identified as Rodale1 and TLIC1. This study also included an annual wheat check (cv. Jagger) [23]. The IWG samples in the second study were identified as TLIC3, TLIC4, TLIC5, and EllsworthC5.
The IWG samples represent different cycles of selection during early-stage perennial grain crop domestication and breeding. Rodale1 has its genetic origin in the population created by a joint breeding program between the United States Department of Agriculture (USDA) Big Flats Plants Materials Center (Corning, NY, USA) and the Rodale Institute (Kutztown, PA, USA). Rodale1 represents seeds from their first set of selected plants. The Land Institute obtained and planted this seed in 2001. After one cycle of selection primarily for yield and seed size, an IWG breeding nursery was planted at The Land Institute in 2005. TLIC1 was harvested from this breeding nursery. TLIC3, TLIC4, and TLIC5 were derived from the third, fourth, and fifth cycles of breeding at TLI, respectively. These three populations represent a broad base of genetic diversity out of which other breeding programs have begun to make selections. Programs to develop IWG varieties for diverse environments were mostly initiated using these materials [14]. For instance, MN-Clearwater, the first and currently most widely grown IWG variety for grain, is a synthetic variety whose seven parents are all TLIC3 individuals [24]. TLIC5 was the first widely distributed seed source used to produce Kernza perennial grain, with some of its harvested grain still being used in products. EllsworthC5 represents TLIC5 material grown by a producer on-farm. Detailed breeding methods applied in each cycle of selection are described by DeHaan et al. [18].
2.2. Grain Production
For the first study, all seed was harvested in 2007. Wheat was harvested in June and IWG was harvested in August. TLIC1 was produced at 38.771° N/97.592° W on a Hord silt loam soil. Rodale1 and Jagger wheat were produced in the same field, separate from TLIC1, at approximately 38.766° N/97.572° W on a McCook silt loam soil. Both the IWG plots and the wheat were fertilized with urea at a rate of 100 kg ha−1 N. Additionally, the IWG stands were of different ages. Rodale1 was planted in fall 2001 and TLIC1 was planted in fall 2005. The plot sizes were larger than 0.2 Ha. Rodale1 was drilled in rows with 19 cm spacing and maintained as a solid stand. TLIC1 was planted in rows at 91.4 cm apart with weeds controlled through regular interrow tillage. Seed weights were determined based on the mass of 100 dehulled seeds, calculated as mg per seed.
For the second study, TLIC3, TLIC4, and TLIC5 were harvested from fields located at 38.774° N/97.592° W, 38.774° N/97.591° W, and 38.7697° N/97.596° W, respectively. All fields were larger than 0.5 Ha in size. Planting was in spring 2009, fall 2011, and fall 2013 with seed harvests in 2011, 2013, and 2015 for TLIC3, TLIC4, and TLIC5, respectively. Fields were managed without any application of pesticides or herbicides. Plants were established at an interrow spacing of 91.4 cm with regular cultivation for weed control. These fields received an application of nitrogen in the form of urea at a rate of 78.5 kg N ha−1 in either November or December. EllsworthC5 was produced on-farm in a field larger than 5 Ha using organic practices, and harvest occurred during the transitional period prior to complete certification. Establishment was via drilling in rows spaced 19 cm apart, and the field was subsequently managed as a solid stand. No chemical fertilizers were applied. The EllsworthC5 field was grazed with cattle in early spring of the production year and again following grain harvest in late summer. The EllsworthC5 field was harvested in 2018 in Ellsworth County, Kansas, but exact coordinates and soil composition information were not available. Seed weights were determined based on the mass of 20 hulless seeds, calculated as mg per seed. The sample name, growing location, year of production, and seed weight are provided for each sample in Table 1.

Table 1.
Sample ID, growing location, harvest year, and seed weight for each sample tested.
2.3. Chemical Analyses
Across the two studies, analytical testing was performed by separate fee-for-service laboratories using official methods of analysis. Medallion Laboratories (Minneapolis, MN, USA) provided testing services to analyze TLIC3, TLIC4, TLIC5, and EllsworthC5. Anresco Laboratories (San Francisco, CA, USA) provided testing services to analyze Rodale1, TLIC1, and Jagger wheat. Briefly, official methods of analysis were used, such as those of the Association of Official Agricultural Chemists (AOAC). Metals (i.e., heavy metals and minerals) were quantified by either dynamic mechanical analysis, inductively coupled plasma mass spectrometry (ICP-MS), or inductively coupled plasma optical emission spectrometry (ICP-OES). Analytical Laboratories, Inc. (Anaheim, CA, USA) performed betaine analysis (ALC518A) for Rodale1, TLIC1, and Jagger wheat. Brunswick Laboratories (Norton, MA, USA) conducted an oxygen radical absorbance capacity (ORAC) assay and ferric reducing antioxidant power (FRAP) assay [25] and determined the phenolics and ferulic acid (liquid chromatography mass spectroscopy) for Rodale1, TLIC1, and Jagger wheat. Supplementary Table S1 includes method references for the analytes, as provided by the laboratories.
To compare the essential amino acid content of IWG to adult daily requirements on a mg of amino acid per gram of protein basis, each essential amino acid (milligrams) was divided by the sum of all amino acids (grams). Therefore, the total amino acid content was used to represent the total protein content, rather than using crude protein values. The amino acids included histidine, isoleucine, leucine, lysine, methionine, phenylalanine, threonine, tryptophan, valine, arginine, aspartic acid, cystine, glutamic acid, glycine, proline, serine, and tyrosine. The contents of sulfur amino acids (SAAs) and aromatic amino acids (AAAs) were represented by the sums of methionine and cystine and of phenylalanine and tyrosine, respectively.
Protein and amino acids values for TLIC1 were excluded, as the protein content and total amino acid content disagreed and the exact reason for this discrepancy could not be discerned. Energy was calculated using the following equation:
Energy (kilocalories per 100g) = ((Carbohydrates (g) − Total Dietary Fiber (g)) ×
4 calories per g) + (Protein (g) ×4 calories per g) + (Fat (g) × 9 calories per g)
2.4. Statistical Analysis
Google Sheets (Google, Mountain View, CA, USA) was used to compile data into tables and perform basic statistical analyses.
Common analytes between the IWG samples and samples of whole wheat flour from the USDA FoodData Central were compared using a two-sample t-test in the R statistical software (v4.1.2; R Core Team 2021), to test the null hypothesis that no difference exists between IWG and whole wheat flour sample means. Specifically, Welch’s two-sample t-test was performed assuming unequal variances. Common analytes included energy, carbohydrate, fat, protein, ash, total dietary fiber, calcium, iron, magnesium, phosphorous, potassium, sodium, copper, manganese, selenium, thiamine, riboflavin, niacin, and folate. Statistical significance (p < 0.05) was determined according to p-values adjusted by the false discovery rate to control for Type I errors.
The amino acid content of IWG samples was compared to the amino acid content of annual wheat as reported in the literature. Studies were selected if units were expressed as grams per 100 g of sample or could be adjusted to such units as needed. Additionally, studies were selected to represent diverse environments and wheat varieties. These studies included those conducted by Tanács et al. (1995), Jiang et al. (2014), Tarkowski and Wojcik (1974), Hospodarenko et al. (2018), Shoup et al. (1966), Siddiqi et al. (2020), and Tomičić et al. (2022) [26,27,28,29,30,31,32]. The amino acid content, expressed on an as-is basis, was compared using a two-sample t-test in the R statistical software, to test the null hypothesis that no difference existed between the IWG and wheat sample means. Specifically, Welch’s two sample t-test was performed assuming unequal variances. Seventeen amino acids were compared in total. Tryptophan was excluded from the analysis due to a lack of sufficient data. Statistical significance (p < 0.05) was determined according to p-values adjusted by the false discovery rate to control for Type I errors.
3. Results
3.1. Proximates
Like most cereal grains, the chemical composition of IWG is dominated by carbohydrates, followed by protein, moisture, fat, and ash (Table 2). Compared to the carbohydrate content of whole wheat flour (mean = 78.6%), the IWG carbohydrate content was lower, ranging from 68.9% to 75.6% (Table 2 and Table 3). As a result, IWG had a greater content of ash and protein (Table 3), with values ranging from 2.4 to 3.0% and 20.1 to 26.4%, respectively (Table 2). The fat contents were comparable between the IWG samples (Table 3), which ranged from 1.6 to 3.1%, and whole wheat flour (Table 2).
Table 2.
Energy (kcal 100 g−1 sample) and proximate composition (g 100 g−1 sample) of IWG samples and annual wheat (cultivar Jagger) reported on a dry matter basis.
Table 3.
Results from the comparison of energy (kcal 100 g−1 sample) and proximate composition (g 100 g−1 sample) between IWG samples and samples of whole wheat flour (WWF), as reported online, using Welch’s t-test, including mean values reported on a dry matter basis, test statistics, degrees of freedom (DF), and p-values.
3.2. Carbohydrate Profile
IWG samples had a lower carbohydrate content than whole wheat flour (Table 3). We found IWG to have 17.1–37.46 g total dietary fiber per 100 g sample, which was greater than Jagger wheat (13.08 g total dietary fiber per 100 g sample) and whole wheat flour (10.6 g total dietary fiber per 100 g sample) (Table 2). When considering the content of dietary fiber as a percentage of total carbohydrates, the IWG samples had a range of 27–55%, compared to 18% for Jagger wheat and 15% for whole wheat flour. The higher total dietary fiber carbohydrate content of IWG compared to whole wheat flour resulted in lower energy values (Table 2 and Table 3). The total dietary fiber content of the IWG samples was primarily composed of insoluble dietary fiber, with a range of 0–20 g soluble dietary fiber per 100 g of total dietary fiber (Table 4). The IWG samples contained less than 1 g of sugar on average, or about 1% of the carbohydrate profile.
Table 4.
Total carbohydrate, sugar profile, and insoluble and soluble dietary fiber reported as g 100 g−1 sample on a dry matter basis for IWG and when available for annual wheat (cultivar Jagger).
3.3. Amino Acid Profile
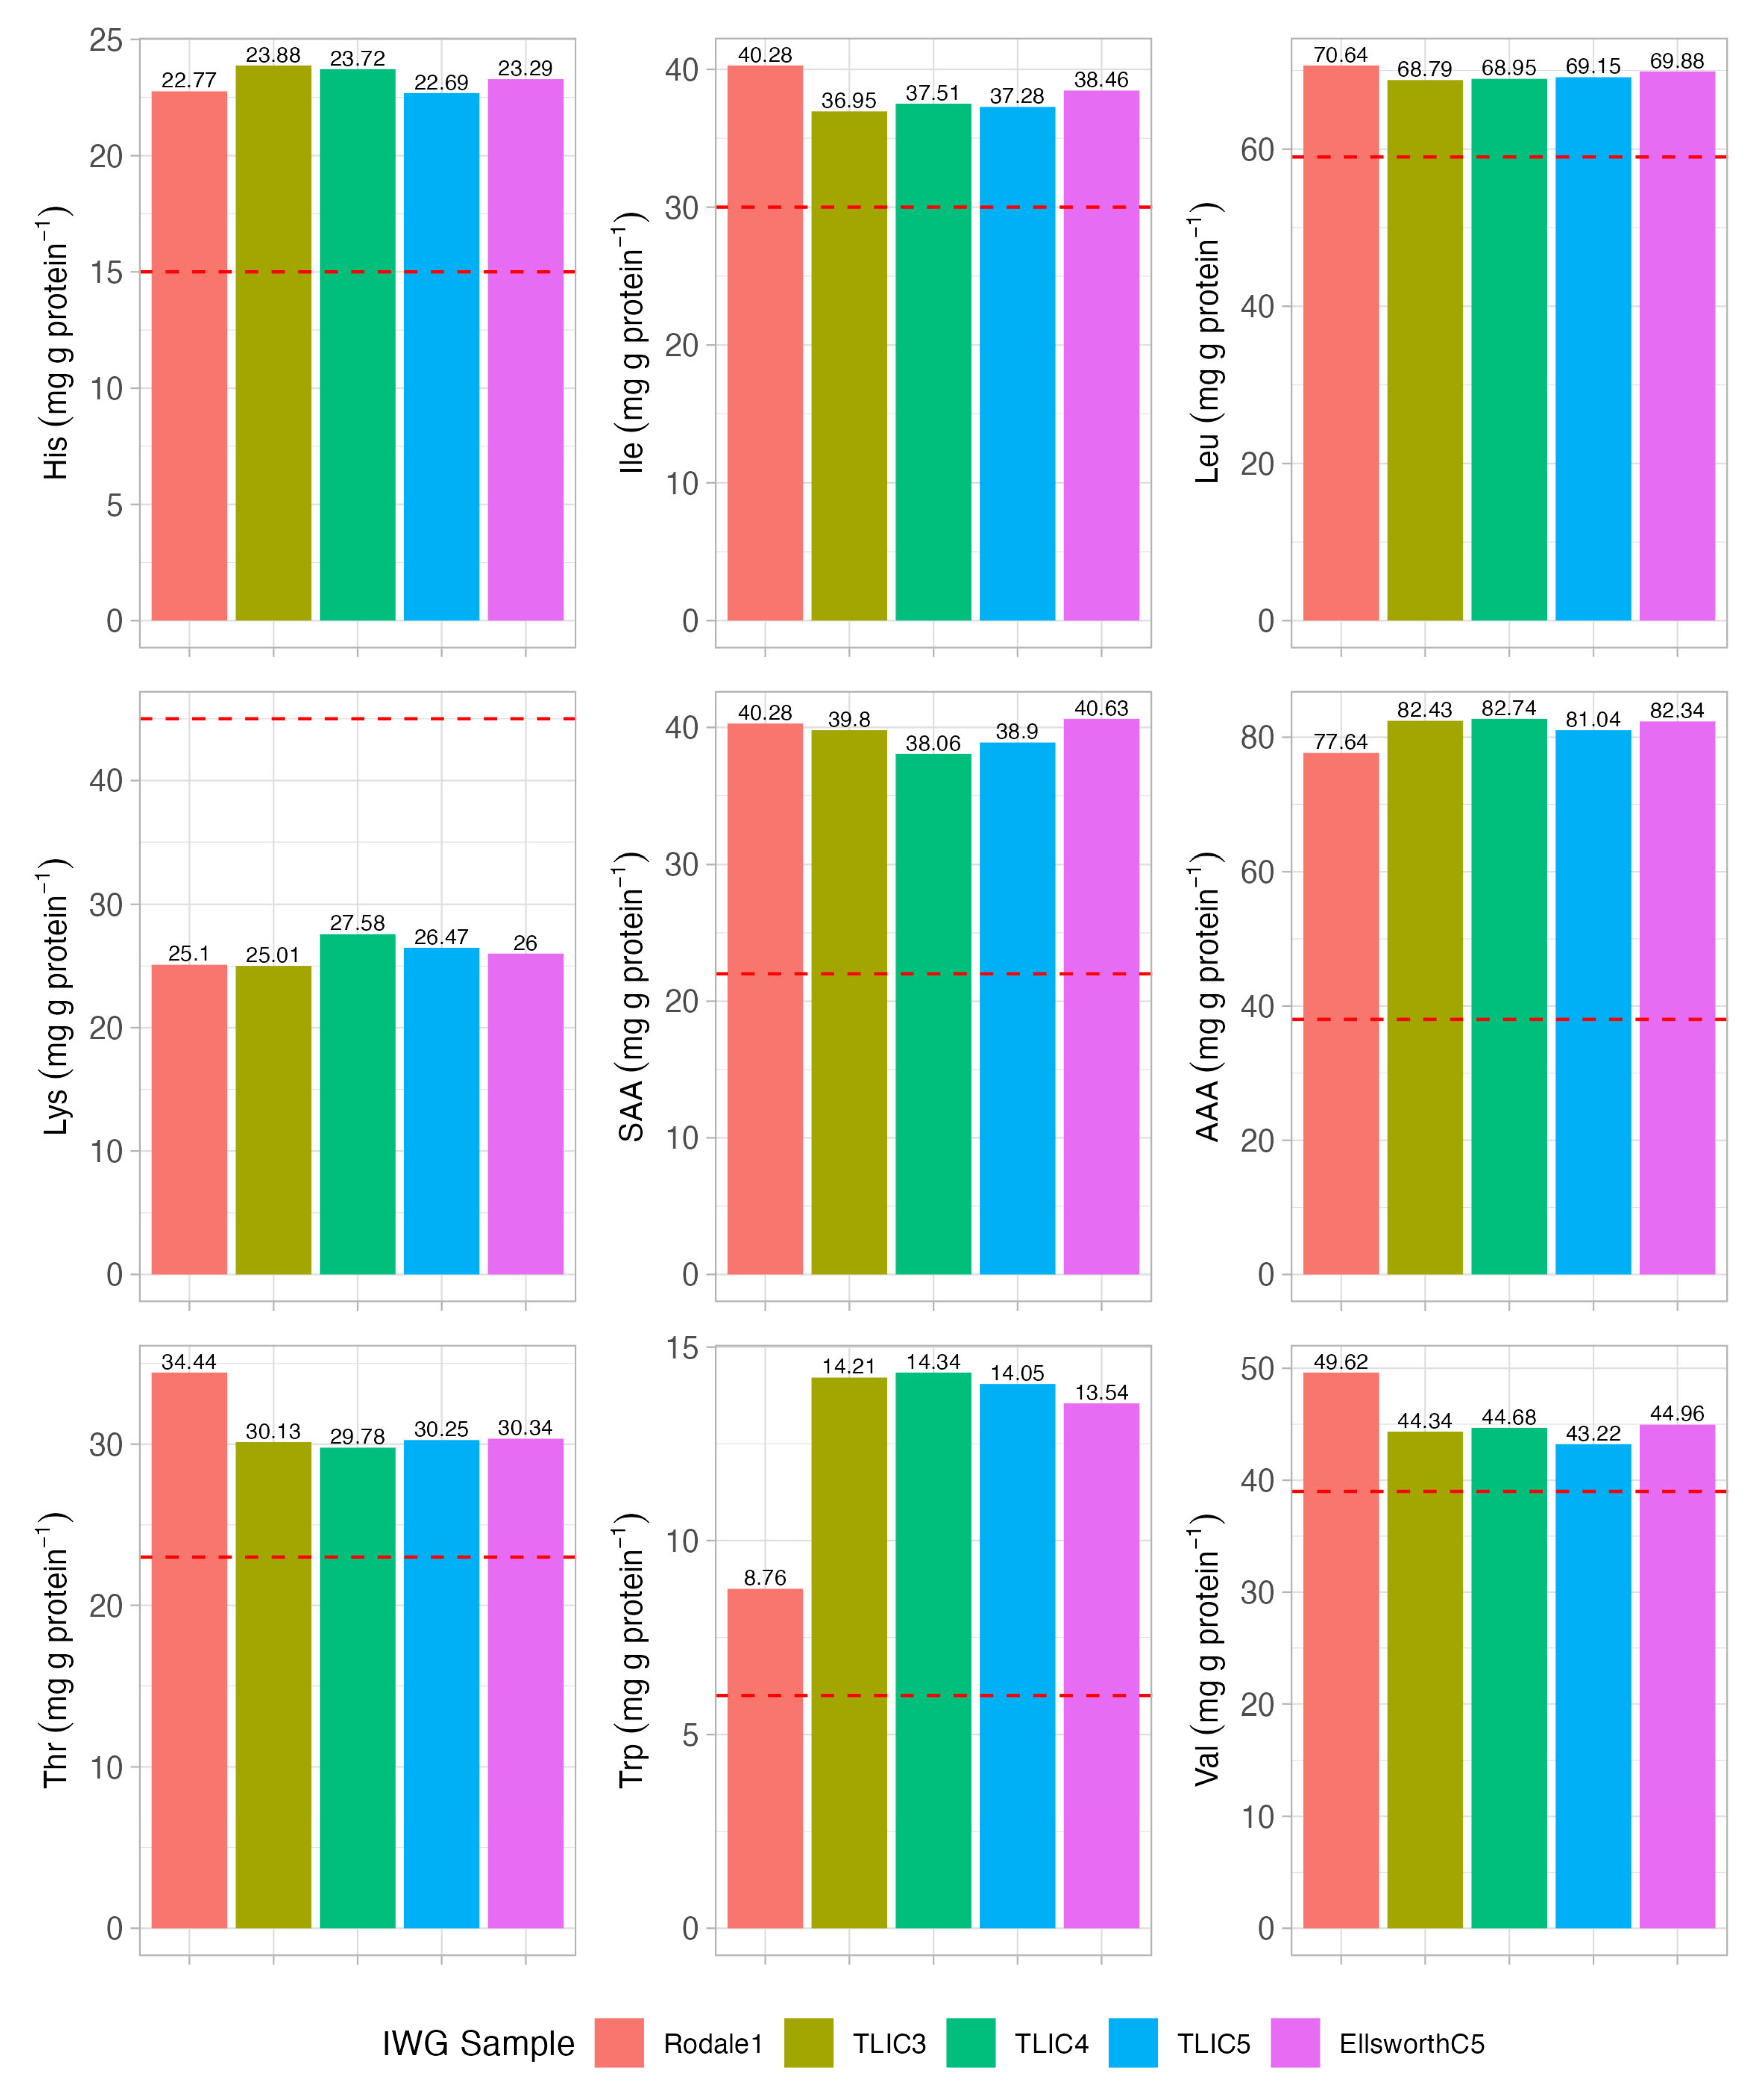
We report the amino acid profiles of IWG samples as grams of each amino per 100 g of sample (Table 5). We found glutamic acid and proline to be the most abundant amino acids, followed by leucine. Tryptophan was the least abundant amino acid, followed by methionine and histidine. The content of each essential amino acid for each IWG sample, compared to the respective adult daily requirement [11], is presented (Figure 3).
Table 5.
Amino acid profiles of IWG samples, including essential, nonessential, and total amino acids, reported as g 100 g−1 sample on a dry matter basis.
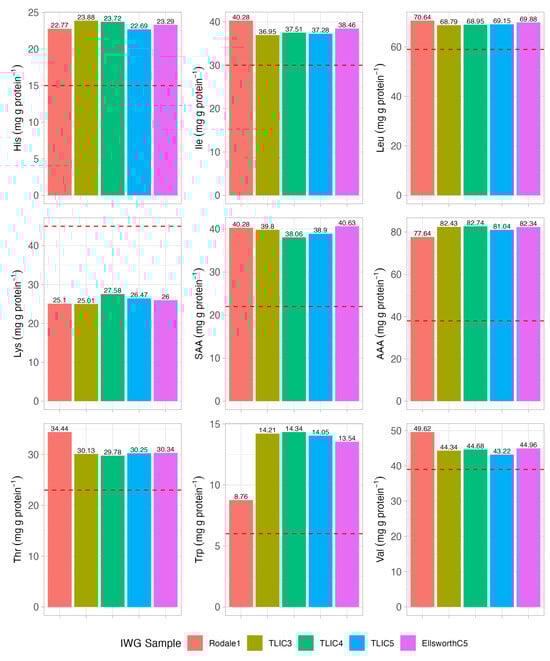
Figure 3.
Content of each essential amino acid (mg g total amino acids−1, as-is basis), represented by standard three letter codes, for each IWG sample, compared to the adult daily requirement (red dashed line) [33]. SAA, sulfur amino acids (methionine + cysteine); AAA, aromatic amino acids (phenylalanine + tyrosine); standard errors bars are not provided as each bar represents a single data point.
In all the IWG samples, lysine was the limiting amino acid for human diets. For the other essential amino acids, the IWG samples met the respective adult daily requirements.
The IWG samples had higher contents of 13 of the 17 amino acids included in a comparative analysis to annual wheat amino acid contents, as reported in the literature (Table 6). For the essential amino acids, IWG had higher contents of histidine, isoleucine, leucine, lysine, phenylalanine, threonine, and valine. For the nonessential amino acids, IWG had higher contents of arginine, aspartic acid, glutamic acid, proline, serine, and tyrosine. The IWG samples did not differ with respect to alanine, cystine, glycine, and methionine.
Table 6.
Results from the comparison of amino acid contents between IWG samples and annual wheat values, as reported in the literature, using Welch’s t-test, including mean values reported as g 100 g−1 sample on an as-is basis, test statistics, degrees of freedom (DF), and p-values.
3.4. Fatty Acid Profile
Total fat and the fat composition in terms of total saturated, monounsaturated, and polyunsaturated fats are reported in Table 7. Although certain IWG samples had higher values for fat contents, the average IWG fat content and fat composition were generally similar to wheat in the samples tested.
Table 7.
Total fat and fat composition of IWG samples, with average values for unenriched whole wheat flour and annual wheat (cultivar Jagger), reported as g 100 g−1 sample on a dry matter basis.
3.5. Vitamins and Minerals
Vitamin and mineral contents were determined for IWG samples and Jagger wheat, compared to average values for whole wheat flour (Table 8). While the IWG samples mostly had comparable levels of vitamins to wheat, there were notable exceptions. For instance, the vitamin B3 (i.e., niacin) content seen for the IWG samples was lower than that of whole wheat flour, while vitamin B2 (i.e., riboflavin) was higher (Table 9). Notably, Rodale1 and TLIC1 appeared to have a higher betaine content than Jagger wheat. The mean values for IWG and whole wheat flour did not differ for vitamin B1 (i.e., thiamine). The vitamin B6 content varied between the Rodale1 and TLC1 samples and the TLIC3, 4, and 5 and EllsworthC5 samples (Table 8). The folate content had a wide range among IWG samples. However, folate’s mean values did not differ between IWG and whole wheat flour. IWG samples fell at the higher end of the ranges seen for mineral contents, with mean values higher than those for whole wheat flour with respect to calcium, iron, phosphorous, potassium, and selenium. Mean values did not differ with respect to magnesium, sodium, zinc, copper, and manganese (Table 9). IWG had a low heavy metal content, especially with respect to the maximum regulatory values for lead (0.2 ppm or 200 µg kg−1) and cadmium (0.1 ppm or 100 µg kg−1) in the Codex Alimentarius International Food Standards for cereal grains [34].
Table 8.
Vitamin and mineral contents of IWG samples, with average values for unenriched whole wheat flour and annual wheat (cultivar Jagger), reported where available with corresponding units on a dry matter basis.
Table 9.
Results from the comparison of common analytes between IWG samples and samples of whole wheat flour (WWF), as reported online, using Welch’s t-test, including mean values, test statistics, degrees of freedom (DF), and p-values.
3.6. Carotenoids, Phenolics, and Antioxidant Activity
Lutein, zeaxanthin, FRAP, ORAC, ferulic acid, and phenolics were tested for Rodale1 and TLC1 IWG and Jagger wheat samples (Table 10). The IWG samples appeared to have higher contents of lutein, zeaxanthin, ferulic acid, and phenolics and greater ORAC. FRAP was comparable between TLIC1 and Jagger wheat, with Rodale1 having slightly higher values.
Table 10.
Carotenoids, antioxidant activity, and phenolics reported for two IWG samples and annual wheat (cultivar Jagger).
4. Discussion
4.1. Proximates
In general, IWG is a greater source of protein than wheat. These results agree with other studies that made this comparison. Bharathi et al. (2022) reviewed such studies and reported a comparable carbohydrate content (70.8–75.2%), a wider range of protein contents (17.6–23.5%) with values slightly lower than we found, a higher fat content (2.9–4.8%), and a comparable ash content to the values reported in Table 2 [11]. Bharathi et al. (2022) reviewed the data available from a collection of studies, with C5 being the most studied germplasm, followed by C2. Such studies have necessarily focused on pre-commercial germplasms (e.g., C2) and varieties released at the onset of commercialization (e.g., C5). As improved varieties from subsequent cycles of breeding are tested and grown on larger scales, sufficient seed is becoming available and additional studies are becoming possible to advance our understanding of the differences between IWG and wheat and the differences among intermediate wheatgrass varieties. Just as diverse varieties of wheat will produce grains with diverse nutritional profiles, future IWG varieties will likely vary. The current study with diverse genetic materials that provide the foundation for current IWG breeding programs nonetheless provides a good baseline for understanding the key differences from and similarities with other grains in the human diet.
The difference in macronutrient composition between IWG and wheat is likely due to substantial differences in seed size. For example, Rodale1 and TLIC1 had an average seed size of 3.26 mg per seed and 5.06 mg per seed, respectively, compared to 32.24 mg per seed for Jagger wheat (Table 1). Differences in seed size relate to the ratio of endosperm to bran (i.e., volume to surface area ratio), impacting chemical constituents concentrated in these seed structures. This tradeoff between seed volume and seed surface area results in an increase in carbohydrates as starch in the endosperm with a greater seed size (increased seed volume) and a reduction in the bran layer of the kernels (decreased seed area). Consequently, the protein content and mineral content (i.e., ash content), which are more concentrated in bran layers than starch, are reduced [21,22]. These differences are evidenced by the higher contents of protein and ash, and lower contents of carbohydrates and energy, shown for IWG compared to whole wheat flour (Table 3). The higher protein and mineral contents of IWG compared to wheat contribute to the potential for positive human health impacts from incorporating the nutrient-dense whole grain or flour into diets and food products, in addition to environmental benefits from the perennial nature of IWG.
4.2. Carbohydrate Profile
The composition of carbohydrates in IWG is drastically different from that in than wheat. Our results agree with the summary of published values reported by Bharathi et al. (2022). We did not quantify the starch content in this study. However, as an important component of the carbohydrate profiles of cereals, it is worth mentioning that IWG can contain 46.7–50.3 g of starch per 100 g of sample [20].
As tradeoffs exist between the carbohydrate content and protein content with increasing seed size due to a decrease in the bran to endosperm ratio, a decrease in the dietary fiber content is expected with a proportional reduction in the bran layer. For example, Bharathi et al. (2022) reported a 20% decrease in the dietary fiber content as the seed size increased from approximately 4 g per 1000 seeds to approximately 7 g per 1000 seeds during progressive cycles of breeding [20]. Our results demonstrate a reduction in dietary fiber content of 49%, from the average of Rodale1 and TLIC1 to the average of TLIC5 and EllsworthC5. Nevertheless, all IWG samples had higher total dietary fiber contents than whole wheat flour (Table 3).
This highlights another facet of the potential impact that IWG could have on human health. Dietary fiber has been a dietary component of human health concern in the United States since 2005 [35,36]. In the United States, more than 90% of women and 97% of men do not meet the recommended intakes for dietary fiber, where consumption is only approximately 50% of the recommended intake [37]. This represents the “fiber gap” in the United States, which has been well documented [36,38,39]. Consumers are largely unaware of the many health benefits of dietary fiber [40]. Based on the results of this study, consuming IWG in equal amounts to wheat would provide 129% more dietary fiber. Moreover, based on the range in total dietary fiber content of 17% to 37%, at a 10% moisture content on average, as seen in the study, a 44 g serving of IWG contains 7.5 to 16.3 g of dietary fiber. This serving size of IWG would satisfy 27% to 59% of the recommended daily intake (RDI) of fiber, assuming an RDI value of 27.58 g [41]. This example illustrates the potential impact of IWG in closing the “fiber gap” as a routine part of diets. Future research should investigate the fiber composition of IWG in greater depth. In combination with clinical trials, these studies will determine if the fiber present in IWG has any novel functionality or specific positive outcomes in the context of cardiovascular health or metabolic disorders. However, additional testing is needed to determine the impact of higher IWG fiber contents on the desirability of food products.
Seed weights have been shown to increase at a rate of 0.47 mg per seed per cycle of breeding [14], and this trend is generally supported by the seed weights reported in our study (Table 1). However, the TLC1 sample is an exception, which highlights how production conditions may dramatically influence seed weight. Notably, our study, and the studies summarized in Bharathi et al. (2022), did not control for the effect of production conditions in the analysis of seed weights and the relationship with seed components. Further research is necessary to elucidate how breeding, production conditions, and their interaction can influence the seed weight and seed composition, especially in the context of later cycles of breeding.
4.3. Amino Acid Profile
There is a lack of research into IWG protein quality, determined by essential amino acid content and protein digestibility. We have identified three published studies on the amino acid contents in IWG [19,42,43]. In a comparison of IWG (cv. Oahe) and hard red wheat, Becker et al. (1991) report both the essential and nonessential amino acid contents as grams per 16 g of nitrogen [19]. They found hard red wheat to have a lower content of essential amino acids than IWG. This is likely due to the higher protein content of IWG compared to annual wheat. Furthermore, they found that IWG had a limiting lysine content (i.e., insufficient to meet daily requirements). Boakye et al. (2023) reported amino acids as a percent of total amino acids, but the exact values for the IWG flour, and two extrudates, were not provided. Kurmanbayeva et al. (2024) compared two IWG varieties with three annual wheat varieties, reporting amino acids on a mg per g basis, with the grams of analyte not explicitly stated. Our results generally agree with the results of Becker et al. (1991); however, tryptophan was not measured in their study. In both studies, lysine was identified as a limiting amino acid and methionine and histidine were identified as the least abundant amino acids. These results appear to be supported by the amino acid profiles of IWG and hard red wheat reported by Boakye et al. (2023) and Mathiowetz (2018) [42,44]. Compared to the values reported by Shewry and Hey (2016), wheat can also have limiting lysine, in addition to limiting leucine, isoleucine, and valine contents [21]. Further testing of IWG will reveal if the amino acid profile is more balanced (i.e., fewer limiting amino acids) than wheat, or if any additional limiting amino acids are present. Lysine is generally the first limiting amino acid in cereals such as wheat [31], although oats, rice, and barley can contain higher lysine contents than other cereals [45]. This is believed to be due to the relatively high proportion of starchy endosperm in kernels, where 80% of the proteins are lysine-poor prolamin storage proteins, compared to the other grain tissues that are more lysine-rich [21].
When reviewing the literature, we found that the previously mentioned article by Becker et al. (1991) is repeatedly cited as the singular reference for the IWG amino acid content. Thus, our results represent a substantial contribution to the body of evidence available. However, much is yet to be discovered to fill this research gap. Further research is required to characterize IWG amino acid profiles in response to breeding progress and production across differing agroecological conditions. Additionally, we are not aware of any study that has determined IWG protein digestibility. The relatively high protein content of IWG demonstrates the potential to serve as an important source of plant protein from a perennial grain crop. This potential is further supported by the fact that the IWG samples in this study had higher amino acid contents than annual wheat as reported in the literature, for most of the amino acids analyzed (13 of 17) (Table 6). However, to properly assess the importance of IWG in this role, a robust understanding of IWG protein quality, determined by both the amino acid content and protein digestibility, is necessary. Additional research is required to assess the amino acid profiles of IWG germplasms available to breeding programs, to develop breeding strategies to improve the amino acid content, especially with regards to the lysine content. Based on the results of this study, the lysine content of IWG would need to be increased by approximately 73%, from an average of 26 mg g protein−1, to meet the adult daily requirement of 45 mg g protein−1. It is possible that natural genetic diversity exists within IWG accessions to support selective breeding efforts to accomplish this task. A-genome wheats have been shown to be a source of high lysine contents for wheat improvement, and candidate genes have been identified as part of marker-assisted breeding strategies [46]. In addition to marker-assisted selection, transgenic and gene editing technologies have been demonstrated to be effective in increasing the lysine content [47]. Further monitoring of the amino acid content will be essential to determining how future cycles of breeding and subsequently released varieties compare to the early-generation material analyzed in this study.
4.4. Fatty Acid Profile
We are aware of one other study that investigated the fatty acid profile of IWG, finding a profile similar to hard red wheat with linoleic acid, oleic acid, and palmitic acid as the most abundant fatty acids [44]. In general, approximately half of the wheat total lipid content is concentrated in the endosperm, followed by one-third in the germ and the remainder in bran [22]. Notable polyunsaturated fatty acids include the essential fatty acids linolenic and linoleic acid, with the latter notably found in a higher proportion in wheat germ.
Health benefits associated with unsaturated fatty acids, especially the ratio of omega-6 to omega-3 fatty acids, support the inclusion of foods with favorable fatty acid profiles in diets [48,49]. However, unsaturated fatty acids are more susceptible to oxidation than saturated fatty acids and are thus less stable during storage. Minerals such as copper, iron, and manganese can also promote oxidation. Because unsaturated fatty acids are less stable, milled grains with higher contents of these fatty acids, such as whole meal flour, have lower stability and a greater risk of rancidity when stored for extended periods of time. They should, therefore, be consumed sooner after milling than refined flour [50]. Given that certain IWG samples can have higher fat and unsaturated fatty acid contents and higher lipase and lipoxygenase activity, this combination presents a potential risk of oxidative and hydrolytic rancidity during storage [51], which can lead to undesirable flavors or aromas. However, as will be discussed in a subsequent section, IWG can have a greater antioxidant content and activity than wheat, which can naturally reduce the risk of oxidation. Research investigating genetic diversity for the antioxidant content and activity and processing techniques, such as steam treatments, as factors to maintain stability during storage, is currently limited to graduate student theses and one publication [44,51,52]. Mathiowetz (2018) found minimal development of oxidative and hydrolytic rancidity in IWG groats throughout storage [44]. While Bharathi et al. (2022) reported no clear trend in the fat content related to breeding cycles, breeding progress to increase the seed size may impact the lipid content and lipid composition [20]. Further research is necessary to elucidate this trend and determine if the breeding process could also mitigate the risk of rancidity by reducing the fat content.
4.5. Vitamins and Minerals
The analytes measured (Table 6) represent essential nutrients for human diets. They play important roles in physiological processes and are important for maintaining optimal health overall [48]. While the exact reason for the relatively higher mineral content of IWG samples is not clear, there are certain factors that may have contributed to the differences seen. Environmental conditions can influence the vitamin content in wheat, as evidenced by low heritability values (<40%) for B vitamins, betaine, and choline [22,53]. Mineral content variation in wheat has been shown to be influenced by both the genotype and environmental conditions, especially soil properties such as pH [54,55,56,57,58]. In general, differences may also be attributed to differences in bran and aleurone layers between IWG and wheat, where vitamins and minerals are typically concentrated in cereals [13]. Furthermore, a dilution effect has been seen in high-yielding cereal grain varieties, which are characterized by a lower mineral concentration as the starchy endosperm fraction has increased [59]. Genetic differences between IWG samples and wheat samples may also have contributed to these differences [60,61,62,63]. Finally, the relationships between soil properties, rooting depths, and IWG grain mineral concentrations have yet to be explored. It may be possible for IWG to accumulate minerals in response to a greater rooting depth as a perennial grain crop. Particularly in the case of calcium, soils in the test region are known for accumulating a layer of minerals that will mostly lie below the rooting depth of wheat but well within the root system of the deeper-rooted IWG. Certain compounds (e.g., fibers, tannins, phytic acid) can reduce the bioavailability of minerals from plant sources [64,65,66]. Therefore, additional research is required to determine the bioavailability of minerals in IWG and assess the potential impacts on human health.
4.6. Carotenoids, Phenolics, and Antioxidant Activity
Two graduate student theses and one published study have quantified the antioxidant content and assessed antioxidant activity in IWG. Their results are summarized by [14]. Our results fall within the range reported for lutein (3.7–25.0 μg g−1 flour, dry basis) and zeaxanthin (0.74–4.0 μg g−1 flour, dry basis), and we found a substantially lower ferulic acid content than was reported (850–1325 μg g−1 flour, dry basis). The reason for this difference is not clear but is perhaps a result of different analytical methods (e.g., LC-MS versus high-performance liquid chromatography). Mathiowetz (2018) identified IWG samples that had a significantly higher antioxidant content and activity than hard red wheat by comparing diverse breeding populations of IWG to hard red wheat and measuring antioxidants, including carotenoids (e.g., lutein and zeaxanthin) and hydroxycinnamic acids (e.g., ferulic acid), paired with two different antioxidant assays (2,2-diphenyl-1-picrylhydrazyl and Folin–Ciocalteu) [44].
As previously discussed, exploring the impact of processing and storage conditions on the stability and quality of IWG is essential for successful integration into the marketplace. Mathiowetz (2018) and Hayek (2020) provide insights into this topic [44,52]. Both found a positive correlation between the antioxidant content (i.e., carotenoid and hydroxycinnamic acid concentrations) and in vitro antioxidant activity. Mathiowetz (2018) reported several relevant findings. Throughout storage, IWG had a significantly higher antioxidant content and antioxidant activity and lower hydroperoxide content than hard red wheat; however, IWG had a higher lipase activity and free fatty acid concentration than hard red wheat, an indication of hydrolytic rancidity. Steam treatment (100 °C and 95% relative humidity for 60 min in a proofing oven) did not inactivate lipase or lipoxygenase, significantly reduced the carotenoid content, and had a minimal but positive impact on the hydroxycinnamic acid content. Moreover, the carotenoid content decreased during storage, while the hydroxycinnamic acid content increased. Mathiowetz (2018) suggests that the carotenoids were reduced over storage by lipoxygenase activity and sacrificially via prooxidants’ reduction and free radicals’ scavenging, while an increase in phenolics like hydroxycinnamic acids can be explained by several different mechanisms related to post-harvest stress responses. Compared to the findings of Mathiowetz (2018), the steam treatment utilized by Hayek (2020) (suspended over a 100 °C water bath for 120 s) successfully reduced enzymatic activities, resulting in lower contents of rancidity products over storage, while preserving the antioxidant content and activity over storage. Additionally, flours stored at a 43% RH had a slower progression of rancidity compared to those stored at a 65% RH; dry storage conditions may preserve the antioxidant content in IWG [20]. Ultimately, these studies provide storage and processing strategies to maintain the nutritional quality from carotenoids and antioxidants during storage, to prolong the shelf life and mitigate the risk of associated rancidity.
Further research is needed to determine the factors and the extent of variation that contribute to the wide range in IWG carotenoid and antioxidant contents. With regards to domestication and breeding, genetic diversity for these traits may support selection strategies to increase the content of phytochemicals that confer human health benefits [67,68,69,70,71].
5. Conclusions
Two studies were performed to characterize the nutritional quality of early-generation Kernza (Thinopyrum intermedium, IWG) breeding program material. The results were compared to previously published values for whole wheat flour and wheat samples of diverse origins. The IWG chemical composition significantly differed from whole wheat flour in its key properties. IWG had 50% higher protein, 129% higher dietary fiber, and 65% higher ash contents than the reference whole wheat flour. Calcium and selenium were 267% and 492% higher, respectively, in IWG than whole wheat flour. Riboflavin and folate were 43% and 447% higher, respectively, and niacin was 74% lower in IWG versus whole wheat flour. Like wheat and other cereals, the IWG samples had a limiting lysine content. However, due to the higher total protein, IWG had 33% more lysine than whole wheat flour. The antioxidant capacity of IWG appeared to be higher than that of wheat and was associated with greater carotenoid and antioxidant contents. These studies evaluated IWG samples produced in Kansas, a notably hotter and drier environment compared to the upper Midwest, which has been the focus of most previous studies. The evaluated material represents the basis from which other Kernza breeding programs have been initiated, providing a baseline for comparisons of nutritional quality while providing novel insights into vitamin and amino acid contents.
Supplementary Materials
The following supporting information can be downloaded at: https://www.mdpi.com/article/10.3390/agriculture14060919/s1, Table S1: Method name and method reference for each compound analyzed in Kernza samples.
Author Contributions
Conceptualization, L.R.D.; methodology, L.R.D.; software, L.R.D. and E.B.C.; validation, L.R.D. and E.B.C.; formal analysis, L.R.D. and E.B.C.; investigation, L.R.D. and E.B.C.; resources, L.R.D.; data curation, L.R.D. and E.B.C.; writing—original draft preparation, L.R.D. and E.B.C.; writing—review and editing, L.R.D. and E.B.C.; visualization, L.R.D. and E.B.C.; supervision, L.R.D.; project administration, L.R.D.; funding acquisition, L.R.D. All authors have read and agreed to the published version of the manuscript.
Funding
This research was funded by Sustainable Agriculture Research and Education Project LNC06-274 and Patagonia Provisions, Inc.
Institutional Review Board Statement
Not applicable.
Data Availability Statement
Data are available upon request.
Conflicts of Interest
The Kernza trademark is owned by The Land Institute, a 501(c)(3) non-profit organization, and managed through the Trademark Usage Guideline and the Identity Preservation Program. The primary purpose of these programs is to provide requirements for the production and handling of intermediate wheatgrass (Thinopyrum intermedium) grain that can be sold under the registered Kernza trademark.
References
- Glover, J.D.; Reganold, J.P.; Bell, L.W.; Borevitz, J.; Brummer, E.C.; Buckler, E.S.; Cox, C.M.; Cox, T.S.; Crews, T.E.; Culman, S.W.; et al. Increased Food and Ecosystem Security via Perennial Grains. Science 2010, 328, 1638–1639. [Google Scholar] [CrossRef] [PubMed]
- De Oliveira, G.; Brunsell, N.A.; Crews, T.E.; DeHaan, L.R.; Vico, G. Carbon and Water Relations in Perennial Kernza (Thinopyrum intermedium): An Overview. Plant Sci. 2020, 295, 110279. [Google Scholar] [CrossRef] [PubMed]
- Eckardt, N.A.; Ainsworth, E.A.; Bahuguna, R.N.; Broadley, M.R.; Busch, W.; Carpita, N.C.; Castrillo, G.; Chory, J.; DeHaan, L.R.; Duarte, C.M.; et al. Climate Change Challenges, Plant Science Solutions. Plant Cell 2023, 35, 24–66. [Google Scholar] [CrossRef] [PubMed]
- Culman, S.W.; Snapp, S.S.; Ollenburger, M.; Basso, B.; DeHaan, L.R. Soil and Water Quality Rapidly Responds to the Perennial Grain Kernza Wheatgrass. Agron. J. 2013, 105, 735–744. [Google Scholar] [CrossRef]
- van der Pol, L.K.; Nester, B.; Schlautman, B.; Crews, T.E.; Cotrufo, M.F. Perennial Grain Kernza® Fields Have Higher Particulate Organic Carbon at Depth than Annual Grain Fields. Can. J. Soil Sci. 2022, 102, 1005–1009. [Google Scholar] [CrossRef]
- Rakkar, M.; Jungers, J.M.; Sheaffer, C.; Bergquist, G.; Grossman, J.; Li, F.; Gutknecht, J.L. Soil Health Improvements from Using a Novel Perennial Grain during the Transition to Organic Production. Agric. Ecosyst. Environ. 2023, 341, 108164. [Google Scholar] [CrossRef]
- Means, M.; Crews, T.; Souza, L. Annual and Perennial Crop Composition Impacts on Soil Carbon and Nitrogen Dynamics at Two Different Depths. Renew. Agric. Food Syst. 2022, 37, 437–444. [Google Scholar] [CrossRef]
- Reilly, E.C.; Gutknecht, J.L.; Sheaffer, C.C.; Jungers, J.M. Reductions in Soil Water Nitrate beneath a Perennial Grain Crop Compared to an Annual Crop Rotation on Sandy Soil. Front. Sustain. Food Syst. 2022, 6, 996586. [Google Scholar] [CrossRef]
- Jungers, J.M.; DeHaan, L.R.; Mulla, D.J.; Sheaffer, C.C.; Wyse, D.L. Reduced Nitrate Leaching in a Perennial Grain Crop Compared to Maize in the Upper Midwest, USA. Agric. Ecosyst. Environ. 2019, 272, 63–73. [Google Scholar] [CrossRef]
- Huddell, A.; Ernfors, M.; Crews, T.; Vico, G.; Menge, D.N.L. Nitrate Leaching Losses and the Fate of 15N Fertilizer in Perennial Intermediate Wheatgrass and Annual Wheat—A Field Study. Sci. Total Environ. 2023, 857, 159255. [Google Scholar] [CrossRef] [PubMed]
- Shim, J. Perennial Rice: Improving Rice Productivity for a Sustainable Upland Ecosystem. SABRAO J. Breed. Genet. 2012, 44, 191–201. [Google Scholar]
- Sanford, G.R.; Jackson, R.D.; Booth, E.G.; Hedtcke, J.L.; Picasso, V. Perenniality and Diversity Drive Output Stability and Resilience in a 26-Year Cropping Systems Experiment. Field Crops Res. 2021, 263, 108071. [Google Scholar] [CrossRef]
- Zhang, S.; Huang, G.; Zhang, Y.; Lv, X.; Wan, K.; Liang, J.; Feng, Y.; Dao, J.; Wu, S.; Zhang, L.; et al. Sustained Productivity and Agronomic Potential of Perennial Rice. Nat. Sustain. 2023, 6, 28–38. [Google Scholar] [CrossRef]
- Bajgain, P.; Crain, J.L.; Cattani, D.J.; Larson, S.R.; Altendorf, K.R.; Anderson, J.A.; Crews, T.E.; Hu, Y.; Poland, J.A.; Turner, M.K.; et al. Breeding Intermediate Wheatgrass for Grain Production. In Plant Breeding Reviews; Goldman, I., Ed.; Wiley: Hoboken, NJ, USA, 2022; pp. 119–217. ISBN 978-1-119-87412-6. [Google Scholar]
- Crain, J.; Wagoner, P.; Larson, S.; DeHaan, L. Origin of Current Intermediate Wheatgrass Germplasm Being Developed for Kernza Grain Production. Genet. Resour. Crop Evol. 2024. [Google Scholar] [CrossRef]
- Wagoner, P. Perennial Grain New Use for Intermediate Wheatgrass. J. Soil Water Conserv. 1990, 45, 81–82. [Google Scholar]
- Tyl, C.; DeHaan, L.; Frels, K.; Bajgain, P.; Marks, M.D.; Anderson, J.A. Emerging Crops with Enhanced Ecosystem Services: Progress in Breeding and Processing for Food Use. Cereal Foods World 2020, 65, 1–8. [Google Scholar] [CrossRef]
- DeHaan, L.; Christians, M.; Crain, J.; Poland, J. Development and Evolution of an Intermediate Wheatgrass Domestication Program. Sustainability 2018, 10, 1499. [Google Scholar] [CrossRef]
- Becker, R.; Wagoner, P.; Hanners, G.D.; Saunders, R.M. Compositional, Nutritional, and Functional Evaluation of Intermediate Wheatgrass (Thinopyrum intermedium). J. Food Process. Preserv. 1991, 15, 63–77. [Google Scholar] [CrossRef]
- Bharathi, R.; Muljadi, T.; Tyl, C.; Annor, G.A. Progress on Breeding and Food Processing Efforts to Improve Chemical Composition and Functionality of Intermediate Wheatgrass (Thinopyrum intermedium) for the Food Industry. Cereal Chem. 2022, 99, 235–252. [Google Scholar] [CrossRef]
- Shewry, P.R.; Hey, S.J. The Contribution of Wheat to Human Diet and Health. Food Energy Secur. 2015, 4, 178–202. [Google Scholar] [CrossRef] [PubMed]
- Shewry, P.R.; Hawkesford, M.J.; Piironen, V.; Lampi, A.-M.; Gebruers, K.; Boros, D.; Andersson, A.A.M.; Åman, P.; Rakszegi, M.; Bedo, Z.; et al. Natural Variation in Grain Composition of Wheat and Related Cereals. J. Agric. Food Chem. 2013, 61, 8295–8303. [Google Scholar] [CrossRef] [PubMed]
- Sears, R.G.; Moffatt, J.M.; Martin, T.J.; Cox, T.S.; Bequette, R.K.; Curran, S.P.; Chung, O.K.; Heer, W.F.; Long, J.H.; Witt, M.D. Registration of ‘Jagger’ Wheat. Crop Sci. 1997, 37, 1010. [Google Scholar] [CrossRef]
- Bajgain, P.; Zhang, X.; Jungers, J.M.; DeHaan, L.R.; Heim, B.; Sheaffer, C.C.; Wyse, D.L.; Anderson, J.A. ‘MN-Clearwater’, the First Food-grade Intermediate Wheatgrass (Kernza Perennial Grain) Cultivar. J. Plant Regist. 2020, 14, 288–297. [Google Scholar] [CrossRef]
- Ou, B.; Huang, D.; Woodill, M.H. Brunswick Laboratories LLC, Assignee. Method for Assaying the Antioxidant Capacity of a Sample. U.S. Patent 7,132,296 B2, 7 November 2006. [Google Scholar]
- Tanács, L.; Matuz, J.; Bartók, T.; Gerö, L. Effect of NPK Fertilization on the Individual Amino Acid Content ofheat Grain. Cereal Res. Commun. 1995, 23, 403–409. [Google Scholar]
- Jiang, X.; Wu, P.; Tian, J. Genetic Analysis of Amino Acid Content in Wheat Grain. J. Genet. 2014, 93, 451–458. [Google Scholar] [CrossRef] [PubMed]
- Tarkowski, C.; Wojcik, S. Amino Acid Composition of Protein in Triticale, Wheat and Rye. Genet. Pol. 1974, 15, 393–403. [Google Scholar]
- Hospodarenko, H.; Karpenko, V.; Liubych, V.; Novikov, V. Characterization of Amino Acid Content of Grain of New Wheat Varieties and Lines. Agric. Sci. Pract. 2018, 5, 12–18. [Google Scholar] [CrossRef]
- Shoup, F.K.; Pomeranz, Y.; Deyoe, C.W. Amino Acid Composition of Wheat Varieties and Flours Varying Widely in Bread-making Potentialities. J. Food Sci. 1966, 31, 94–101. [Google Scholar] [CrossRef]
- Siddiqi, R.A.; Singh, T.P.; Rani, M.; Sogi, D.S.; Bhat, M.A. Diversity in Grain, Flour, Amino Acid Composition, Protein Profiling, and Proportion of Total Flour Proteins of Different Wheat Cultivars of North India. Front. Nutr. 2020, 7, 141. [Google Scholar] [CrossRef] [PubMed]
- Tomičić, Z.; Spasevski, N.; Lazarević, J.; Čabarkapa, I.; Tomičić, R. Diversity of Amino Acids Composition in Cereals. Food Feed. Res. 2022, 49, 11–22. [Google Scholar] [CrossRef]
- FAO. Dietary Protein Quality Evaluation in Human Nutrition: Report of an FAO Expert Consultation, 31 March–2 April, 2011, Auckland, New Zealand; FAO food and nutrition paper; Food and Agriculture Organization of the United Nations: Rome, Italy, 2013; ISBN 978-92-5-107417-6. [Google Scholar]
- Joint FAO/WHO. Codex Alimentarius Commission. 2023. Codex General Standard for Contaminants and Toxins in Food and Feed; Food and Agriculture Organization of the United Nations (FAO): Rome, Italy; World Health Organization (WHO): Geneva, Switzerland, 2023; Available online: https://www.fao.org/fao-who-codexalimentarius/sh-proxy/en/?lnk=1&url=https%253A%252F%252Fworkspace.fao.org%252Fsites%252Fcodex%252FStandards%252FCXS%2B193-1995%252FCXS_193e.pdf (accessed on 4 April 2024).
- McGuire, S.U.S. Department of Agriculture and U.S. Department of Health and Human Services, Dietary Guidelines for Americans, 2010. 7th Edition, Washington, DC: U.S. Government Printing Office, January 2011. Adv. Nutr. 2011, 2, 293–294. [Google Scholar] [CrossRef] [PubMed]
- Quagliani, D.; Felt-Gunderson, P. Closing America’s Fiber Intake Gap. Am. J. Lifestyle Med. 2016, 11, 80–85. [Google Scholar] [CrossRef] [PubMed]
- Thompson, H.J. The Dietary Guidelines for Americans (2020–2025): Pulses, Dietary Fiber, and Chronic Disease Risk—A Call for Clarity and Action. Nutrients 2021, 13, 4034. [Google Scholar] [CrossRef] [PubMed]
- Jones, J.M. CODEX-Aligned Dietary Fiber Definitions Help to Bridge the “Fiber Gap”. Nutr. J. 2014, 13, 34. [Google Scholar] [CrossRef] [PubMed]
- Mobley, A.R.; Jones, J.M.; Rodriguez, J.; Slavin, J.; Zelman, K.M. Identifying Practical Solutions to Meet America’s Fiber Needs: Proceedings from the Food & Fiber Summit. Nutrients 2014, 6, 2540–2551. [Google Scholar] [CrossRef]
- Gustafson, C.R.; Rose, D.J. US Consumer Identification of the Health Benefits of Dietary Fiber and Consideration of Fiber When Making Food Choices. Nutrients 2022, 14, 2341. [Google Scholar] [CrossRef] [PubMed]
- McKeown, N.M.; Fahey, G.C.; Slavin, J.; Van Der Kamp, J.-W. Fibre Intake for Optimal Health: How Can Healthcare Professionals Support People to Reach Dietary Recommendations? BMJ 2022, 378, e054370. [Google Scholar] [CrossRef] [PubMed]
- Boakye, P.G.; Okyere, A.Y.; Annor, G.A. Impact of Extrusion Processing on the Nutritional and Physicochemical Properties of Intermediate Wheatgrass (Thinopyrum intermedium). Cereal Chem. 2023, 100, 628–642. [Google Scholar] [CrossRef]
- Kurmanbayeva, M.; Rašeta, M.; Sarsenbek, B.; Kusmangazinov, A.; Zhumagul, M.; Karabalayeva, D.; Altybayeva, N.; Gafforov, Y.; Toishimanov, M. Comparison of Fatty Acids and Amino Acids Profiles of the Selected Perennial and Annual Wheat Varieties from Kazakhstan. Nat. Prod. Res. 2024, 1–6. [Google Scholar] [CrossRef] [PubMed]
- Mathiowetz, A. Evaluation of the Chemical and Functional Stability of Intermediate Wheatgrass (Thinopyrum intermedium) over Storage and in Response to Steam Treatment; University of Minnesota Digital Conservancy: Minneapolis, MN, USA, 2018; Available online: https://hdl.handle.net/11299/202079 (accessed on 4 April 2024).
- Knezevic, D.S.; Djukic, N.; Paunovic, A.; Madic, M. Amino Acid Contents in Grains of Different Winter Wheat (Triticum aestivum L.) Varieties. Cereal Res. Commun. 2009, 37, 647–650. [Google Scholar]
- Singh, J.; Sharp, P.J.; Skerritt, J.H. A New Candidate Protein for High Lysine Content in Wheat Grain. J. Sci. Food Agric. 2001, 81, 216–226. [Google Scholar] [CrossRef]
- Yang, Q.; Zhao, D.; Zhang, C.; Sreenivasulu, N.; Sun, S.S.-M.; Liu, Q. Lysine Biofortification of Crops to Promote Sustained Human Health in the 21st Century. J. Exp. Bot. 2022, 73, 1258–1267. [Google Scholar] [CrossRef] [PubMed]
- Patterson, E.; Wall, R.; Fitzgerald, G.F.; Ross, R.P.; Stanton, C. Health Implications of High Dietary Omega-6 Polyunsaturated Fatty Acids. J. Nutr. Metab. 2012, 2012, e539426. [Google Scholar] [CrossRef] [PubMed]
- Simopoulos, A.P. The Importance of the Ratio of Omega-6/Omega-3 Essential Fatty Acids. Biomed. Pharmacother. 2002, 56, 365–379. [Google Scholar] [CrossRef] [PubMed]
- Chow, C.K. Fatty Acids in Foods and Their Health Implications; CRC Press: Boca Raton, FL, USA, 2007; ISBN 978-1-4200-0690-2. [Google Scholar]
- Tyl, C.; Ismail, B.P. Compositional Evaluation of Perennial Wheatgrass (Thinopyrum intermedium) Breeding Populations. Int. J. Food Sci. Technol. 2019, 54, 660–669. [Google Scholar] [CrossRef]
- Hayek, J. Effect of Steam Treatment on Chemical Changes Over Storage of Intermediate Wheatgrass (Thinopyrum intermedium) Refined, Partially Refined, And Whole Flour; University of Minnesota Digital Conservancy: Minneapolis, MN, USA, 2020. Available online: https://hdl.handle.net/11299/214999 (accessed on 4 April 2024).
- Shewry, P.R.; Van Schaik, F.; Ravel, C.; Charmet, G.; Rakszegi, M.; Bedo, Z.; Ward, J.L. Genotype and Environment Effects on the Contents of Vitamins B1, B2, B3, and B6 in Wheat Grain. J. Agric. Food Chem. 2011, 59, 10564–10571. [Google Scholar] [CrossRef] [PubMed]
- Jordan-Meille, L.; Holland, J.E.; McGrath, S.P.; Glendining, M.J.; Thomas, C.L.; Haefele, S.M. The Grain Mineral Composition of Barley, Oat and Wheat on Soils with pH and Soil Phosphorus Gradients. Eur. J. Agron. 2021, 126, 126281. [Google Scholar] [CrossRef]
- Joy, E.J.M.; Broadley, M.R.; Young, S.D.; Black, C.R.; Chilimba, A.D.C.; Ander, E.L.; Barlow, T.S.; Watts, M.J. Soil Type Influences Crop Mineral Composition in Malawi. Sci. Total Environ. 2015, 505, 587–595. [Google Scholar] [CrossRef] [PubMed]
- Murphy, K.; Reeves, P.; Jones, S. Relationship between Yield and Mineral Nutrient Concentration in Historical and Modern Spring Wheat Cultivars. Euphytica 2008, 163, 381–390. [Google Scholar] [CrossRef]
- Rodehutscord, M.; Rückert, C.; Maurer, H.P.; Schenkel, H.; Schipprack, W.; Bach Knudsen, K.E.; Schollenberger, M.; Laux, M.; Eklund, M.; Siegert, W.; et al. Variation in Chemical Composition and Physical Characteristics of Cereal Grains from Different Genotypes. Arch. Anim. Nutr. 2016, 70, 87–107. [Google Scholar] [CrossRef]
- Zhao, F.J.; Su, Y.H.; Dunham, S.J.; Rakszegi, M.; Bedo, Z.; McGrath, S.P.; Shewry, P.R. Variation in Mineral Micronutrient Concentrations in Grain of Wheat Lines of Diverse Origin. J. Cereal Sci. 2009, 49, 290–295. [Google Scholar] [CrossRef]
- Marles, R.J. Mineral Nutrient Composition of Vegetables, Fruits and Grains: The Context of Reports of Apparent Historical Declines. J. Food Compos. Anal. 2017, 56, 93–103. [Google Scholar] [CrossRef]
- Brinch-Pedersen, H.; Borg, S.; Tauris, B.; Holm, P.B. Molecular Genetic Approaches to Increasing Mineral Availability and Vitamin Content of Cereals. J. Cereal Sci. 2007, 46, 308–326. [Google Scholar] [CrossRef]
- Garg, M.; Sharma, A.; Vats, S.; Tiwari, V.; Kumari, A.; Mishra, V.; Krishania, M. Vitamins in Cereals: A Critical Review of Content, Health Effects, Processing Losses, Bioaccessibility, Fortification, and Biofortification Strategies for Their Improvement. Front. Nutr. 2021, 8, 586815. [Google Scholar] [CrossRef] [PubMed]
- Ortiz-Monasterio, J.I.; Palacios-Rojas, N.; Meng, E.; Pixley, K.; Trethowan, R.; Peña, R.J. Enhancing the Mineral and Vitamin Content of Wheat and Maize through Plant Breeding. J. Cereal Sci. 2007, 46, 293–307. [Google Scholar] [CrossRef]
- Sarwar, H. The Importance of Cereals (Poaceae: Gramineae) Nutrition in Human Health: A Review. J. Cereals Oilseeds 2013, 4, 32–35. [Google Scholar] [CrossRef]
- Hurrell, R.F. Influence of Vegetable Protein Sources on Trace Element and Mineral Bioavailability. J. Nutr. 2003, 133, 2973S–2977S. [Google Scholar] [CrossRef] [PubMed]
- Erdman, J.W. Bioavailability of Trace Minerals from Cereals and Legumes. Cereal Chem. 1981, 58, 21–26. [Google Scholar]
- Gibson, R.S.; Raboy, V.; King, J.C. Implications of Phytate in Plant-Based Foods for Iron and Zinc Bioavailability, Setting Dietary Requirements, and Formulating Programs and Policies. Nutr. Rev. 2018, 76, 793–804. [Google Scholar] [CrossRef] [PubMed]
- Colasuonno, P.; Marcotuli, I.; Blanco, A.; Maccaferri, M.; Condorelli, G.E.; Tuberosa, R.; Parada, R.; de Camargo, A.C.; Schwember, A.R.; Gadaleta, A. Carotenoid Pigment Content in Durum Wheat (Triticum turgidum L. Var Durum): An Overview of Quantitative Trait Loci and Candidate Genes. Front. Plant Sci. 2019, 10, 1347. [Google Scholar] [CrossRef] [PubMed]
- Kunnam, J.; Pinta, W.; Ruttanaprasert, R.; Bunphan, D.; Thabthimtho, T.; Aninbon, C. Stability of Phenols, Antioxidant Capacity and Grain Yield of Six Rice Genotypes. Plants 2023, 12, 2787. [Google Scholar] [CrossRef] [PubMed]
- Muntana, N.; Prasong, S. Study on Total Phenolic Contents and Their Antioxidant Activities of Thai White, Red and Black Rice Bran Extracts. Pak. J. Biol. Sci. 2010, 13, 170–174. [Google Scholar] [CrossRef] [PubMed]
- Shen, Y.; Jin, L.; Xiao, P.; Lu, Y.; Bao, J. Total Phenolics, Flavonoids, Antioxidant Capacity in Rice Grain and Their Relations to Grain Color, Size and Weight. J. Cereal Sci. 2009, 49, 106–111. [Google Scholar] [CrossRef]
- Trono, D. Carotenoids in Cereal Food Crops: Composition and Retention throughout Grain Storage and Food Processing. Plants 2019, 8, 551. [Google Scholar] [CrossRef] [PubMed]

Disclaimer/Publisher’s Note: The statements, opinions and data contained in all publications are solely those of the individual author(s) and contributor(s) and not of MDPI and/or the editor(s). MDPI and/or the editor(s) disclaim responsibility for any injury to people or property resulting from any ideas, methods, instructions or products referred to in the content. |
© 2024 by the authors. Licensee MDPI, Basel, Switzerland. This article is an open access article distributed under the terms and conditions of the Creative Commons Attribution (CC BY) license (https://creativecommons.org/licenses/by/4.0/).