Abstract
The massive import of uncontrolled technical grain from the East into the European Community poses a risk to public health when it ends up in the mills to be used as flour for food purposes instead of being burnt (biofuel). In fungal infections of wheat, the most dangerous species belong to the genus Fusarium. F. poae is a pathogen that is most commonly isolated from cereals worldwide and causes various types of diseases in animals and humans due to the numerous toxins it produces. The manuscript reports an attempt to distinguish between four species of Fusarium, F. avanceum, F. langsethiae, F. poae, and F. sporotrichioides, in wheat grains by measuring the volatiles emitted. The patterns obtained from the signals captured by the electronic nose PEN3 were used to build the Random Forests classification model. The recall and precision of the classification performance for F. poae reached 91 and 87%, respectively. The overall classification accuracy reached 70%. Gas chromatography coupled with mass spectrometry (GC–MS) was used to analyze the chemical composition of the emitted volatiles. The patterns found in the GC–MS results allowed an explanation of the main patterns observed when analyzing the electronic nose data. The mycotoxins produced by the Fusarium species analyzed were detected. The results of the reported experiment confirm the potential of the electronic nose as a technology that can be useful for screening the condition of the grain and distinguishing between different pathogenic infestations.
1. Introduction
1.1. New Problem with Cereal Imports across the EU’s Eastern Border
Farmers across Europe are currently on strike to express their dissatisfaction with EU policies, including the liberalization of trade in food from countries bordering the EU. The dissatisfaction stems from the fact that farmers in these countries do not have to adhere to the strict standards that apply in the European Union, for example in terms of restricting the use of pesticides. As a result, they have lower production costs and flood the European market with less expensive products such as grain or fruit. The current exceptional circumstances in the wheat trade favor fungal infections, the most dangerous of which belong to the genus Fusarium. One of these organisms is the fungus F. poae—a pathogen that requires more attention because it causes various types of diseases in animals and humans through the numerous toxins it produces [1]. It is, therefore, necessary to develop tools to help distinguish between Fusarium species, and this article is a contribution to the use of the electronic nose for this purpose.
Several authors have attempted to detect Fusarium infestations in cereals by analyzing the volatiles emitted. Presiecce et al. [2] reported using solid-phase microextraction and gas chromatography coupled with mass spectrometry (SPME–GC–MS) analysis of wheat infected by F. poae. Laddomada et al. [3] presented a GC–MS analysis of the volatile profile of durum wheat contaminated with F. poae. Eifler et al. [4] investigated the infection of wheat grains with F. cerealis, F. graminearum, F. culmorum, and F. redolens. Ji et al. [5] reported the profiling of volatile metabolites in wheat kernels contaminated with F. graminearum. Dong et al. [6] reported the profiling of volatile metabolites from malt contaminated with F. poae during malting.
Recognizing closely related species, such as the species of the section Sporotrichiella distinguished by Wollenweber and Reinking [7], is always a challenge. All the more remarkable are the attempts to distinguish Fusarium poae from F. langsethiae, F. chlamydosporum, F. sporotrichioides, or F. tricinctum on the basis of the odor emitted. This aspect is practical as the species F. avenaceum and F. poae are most frequently isolated from cereals worldwide [8], although Fusarium graminearum is the predominant pathogen of Fusarium Head Blight of cereals (FHB). Some studies suggest that the variability in the occurrence of individual Fusarium species as FHB pathogens is due to the influence of environmental factors such as temperature or moisture, as well as the production methods such as extensive tillage, no-tillage, and permanent cultivation of cereals [9,10]. In our study, we did not address this question, but were rather pleased that we were able to distinguish a species of F. poae isolated from infected tissue of winter cereals. Its presence has been reported in crops throughout South America [11], North America [12], Europe [13,14], including Poland [9], Asia [15] and Australia [16], so the device we developed could have wide application.
Although the species F. poae is considered a rather weak pathogen [17], it can cause severe infections in cereals under favorable climatic conditions [9]. During the growing season, the microbiomes that infect the cereal grains change depending on the stage of vegetation. Studies by Tini et al. [18] show that the key moment of infection of wheat by F. poae for the development of FHB and the accumulation of mycoblasts is the phase from the beginning of flowering to full flowering. A study by Tan et al. [17] showed that co-infection of wheat plants with the dominant species F. graminearum and F. poae resulted in greater growth of F. poae and less infection of plants with F. graminearum without affecting the extent of mycotoxin accumulation. This indicates that the weaker pathogen utilizes coexistence with F. graminearum to infect wheat. Therefore, the detection of the pathogen F. poae alone should disqualify the grain from the food market. To sum up, FHB is one of the most important diseases of wheat and other cereals. The disease causes significant yield losses as infected grain is fine, has a lower thousand grain weight (MTZ), is of poorer quality, and also contains mycotoxins [19]. This poses a real risk to public health, which is why cereals with elevated mycotoxin levels are subject to price reductions and possible rejection at the point of sale [20].
1.2. Disadvantage of Classical Diagnosis of Fusarium poae and Possible Solution
The microscopic diagnosis of Fusarium from the section Sporotrichiella is difficult because all species belonging to this section, especially F. langsethiae and F. poae, produce a powdery conidial mass [16]. Both chlamydospores and sickle-shaped macroconidia, which are usually divided by three sepals and are characteristic of this species, are very rarely produced [21]. On PDA medium, F. poae forms abundant hairy or felt-like mycelium, which transforms into a powdery mycelium during the formation of the microconidia. The mycelium is initially light in color and darkens over time until it takes on a reddish-brown color [22]. Fusarium poae cultures are characterized by a fruity, vinous odor reminiscent of ‘fresh green apple’. Morphologically, F. poae can be confused with F. langsethiae, a species distinguished by Torp and Nirenberg 2004 [23], which is sometimes referred to as ‘powdery’ F. poae [22] and has a similar toxic profile to F. sporotrichioides [24]. In addition, cultures of F. poae may morphologically resemble F. sporotrichioides and F. tricinctum as they have very similar spherical or napiform lemon fruit-shaped microconidia with a distinct papilla [22]. Therefore, the identification of species in this section based on morphological characteristics is a major challenge even for taxonomists specialized in the identification of Fusarium fungi [25]. Therefore, the development and improvement of a method to identify fungi by their odor deserves our attention. An alternative is tedious and costly analyses based on the DNA sequence of several marker loci [26] or phylogenetic relationship analyses and subsequent molecular diagnoses based on qPCR techniques: genus [27] or species [28,29,30]. In the future, electronic noses using machine learning (AI) techniques could make it easier for border authorities, quarantine services, and even farmers to check the quality of manufactured food, especially different types of grain in storage.
2. Materials and Methods
2.1. Preparation of Infected Wheat Samples
The fungal isolates selected for the study came from the collection of the Faculty of Agriculture and Forestry of the University of Warmia and Mazury in Olsztyn (Poland). Four fungal species of the genus Fusarium, which are responsible for damage to wheat crops, were selected for the study: F. avanceum, F. langsethiae, F. poae, and F. sporotrichioides. Mycelial fragments were excised from fresh, seven-day-old fungal cultures grown on Potato Dextrose Agar (PDA) media (20 g dextrose, 15 g agar, 4 g potato starch, and 1 L distilled water) using a 5 mm diameter cork borer, which were then placed in sterile jars (250 mL capacity) containing 15 g wheat seeds. Five discs of mycelium were placed in each jar. Then, 5 mL of distilled water was added to each jar to moisten the seeds and facilitate the spread of infection. The jars were then incubated for 7 days at 22 °C. For each experimental variant, 5 jars of infected wheat seeds were prepared.
All prepared samples were used for electronic nose measurements. The measurements by GC–MS were performed a few days after the electronic nose experiment. In these measurements for the F. avenaceum and F. langsethiae treatments, only four samples of each were used as one of each was found to be spoiled.
2.2. GC–MS Measurement of Volatiles
Volatile organic compounds (VOCs) emitted by the studied samples were investigated by headspace solid-phase microextraction and gas chromatography coupled with mass spectrometry (HS–SPME/GC–MS). Jars containing wheat grain infected by the studied species of Fusarium were sealed using parafilm and heated for 30 min at 25 °C. The gas samples contained inside the jars were obtained using a needle and the SPME fiber (Supelco, Bellefonte, PA, USA) with stationary phase divinylbenzene/carboxen/polydimethylsiloxane (DVB/CAR/PDMS), which was exposed to the headspace, by piercing the parafilm by the needle. The fiber was exposed to the volatiles in the headspace for 30 min. Then, the fiber was placed in an injector of the GC–MS device for 10 min.
An Agilent 7890A gas chromatograph coupled with an Agilent 5975C mass spectrometer (Agilent Technologies Inc., Santa Clara, CA, USA) was used in the experiment. The injection port worked in splitless mode at 250 °C. A capillary column HP-5MS (30 m, 0.25 mm, 0.25 μm) was used for the separation of compounds, with helium as a carrier gas, with a flow rate of 1 mL/min. The profile of the temperature change of the column started at 40 °C and then raised at a rate of 5 °C/min up to 250 °C. The ion source worked at 230 and and quadrupole at 150 °C. The mass spectrometer applied an ionization energy of 70 eV. A range of 29–600 units in full scan mode was used for detection.
The percentage content of the VOC in the total ion current (% TIC) was calculated using the integrated area under the peaks from the chromatogram. The identification of volatiles was obtained by analysis of the retention indices and the mass spectra.
The NIST (2020) and Wiley (2020) mass spectral libraries, as well as the atlas by Adams (2007) and Tkachev (2008) were used for the mass spectrometric analysis. The retention times of the alkanes were used for the calculation of the retention indices of the compounds.
2.3. Electronic Nose Measurements
PEN3 Electronic Nose Device
The e-nose measurements in the reported experiments were performed with a commercially available PEN3 device (Airsense Analytics GmbH, Schwerin, Germany). The setup of the electronic nose with the sample is shown in Figure 1. The PEN3 e-nose consists of a gas extraction and sampling system, a detection unit with a sensor array consisting of 10 metal oxide semiconductor (MOS) sensors, and software for data acquisition and pattern recognition. The device’s sensors operate at high temperatures (150 to 500 °C) and react with various chemicals. The list of gas sensor types and the characteristic gases with which they react is shown in Table A1 in Appendix A.
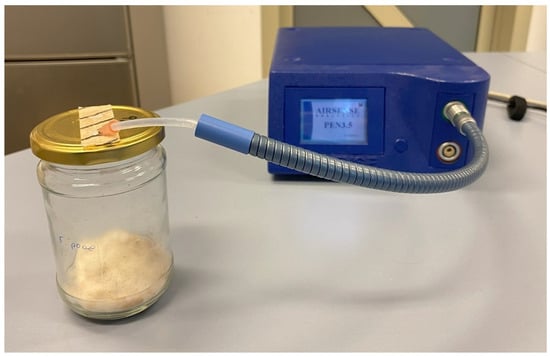
Figure 1.
Measurement setup of the used PEN3 electronic nose applied to infested wheat grain sample.
2.4. Measurements with the Electronic Nose
The measurements of the infected grain samples were carried out on five consecutive days. On each day, a set of 5 independent samples was used for each variant of the experiment. The samples were measured in random order according to the random number generator of the Excel spreadsheet. The samples were kept sealed during the experiment so that the emitted volatiles were collected in the jars.
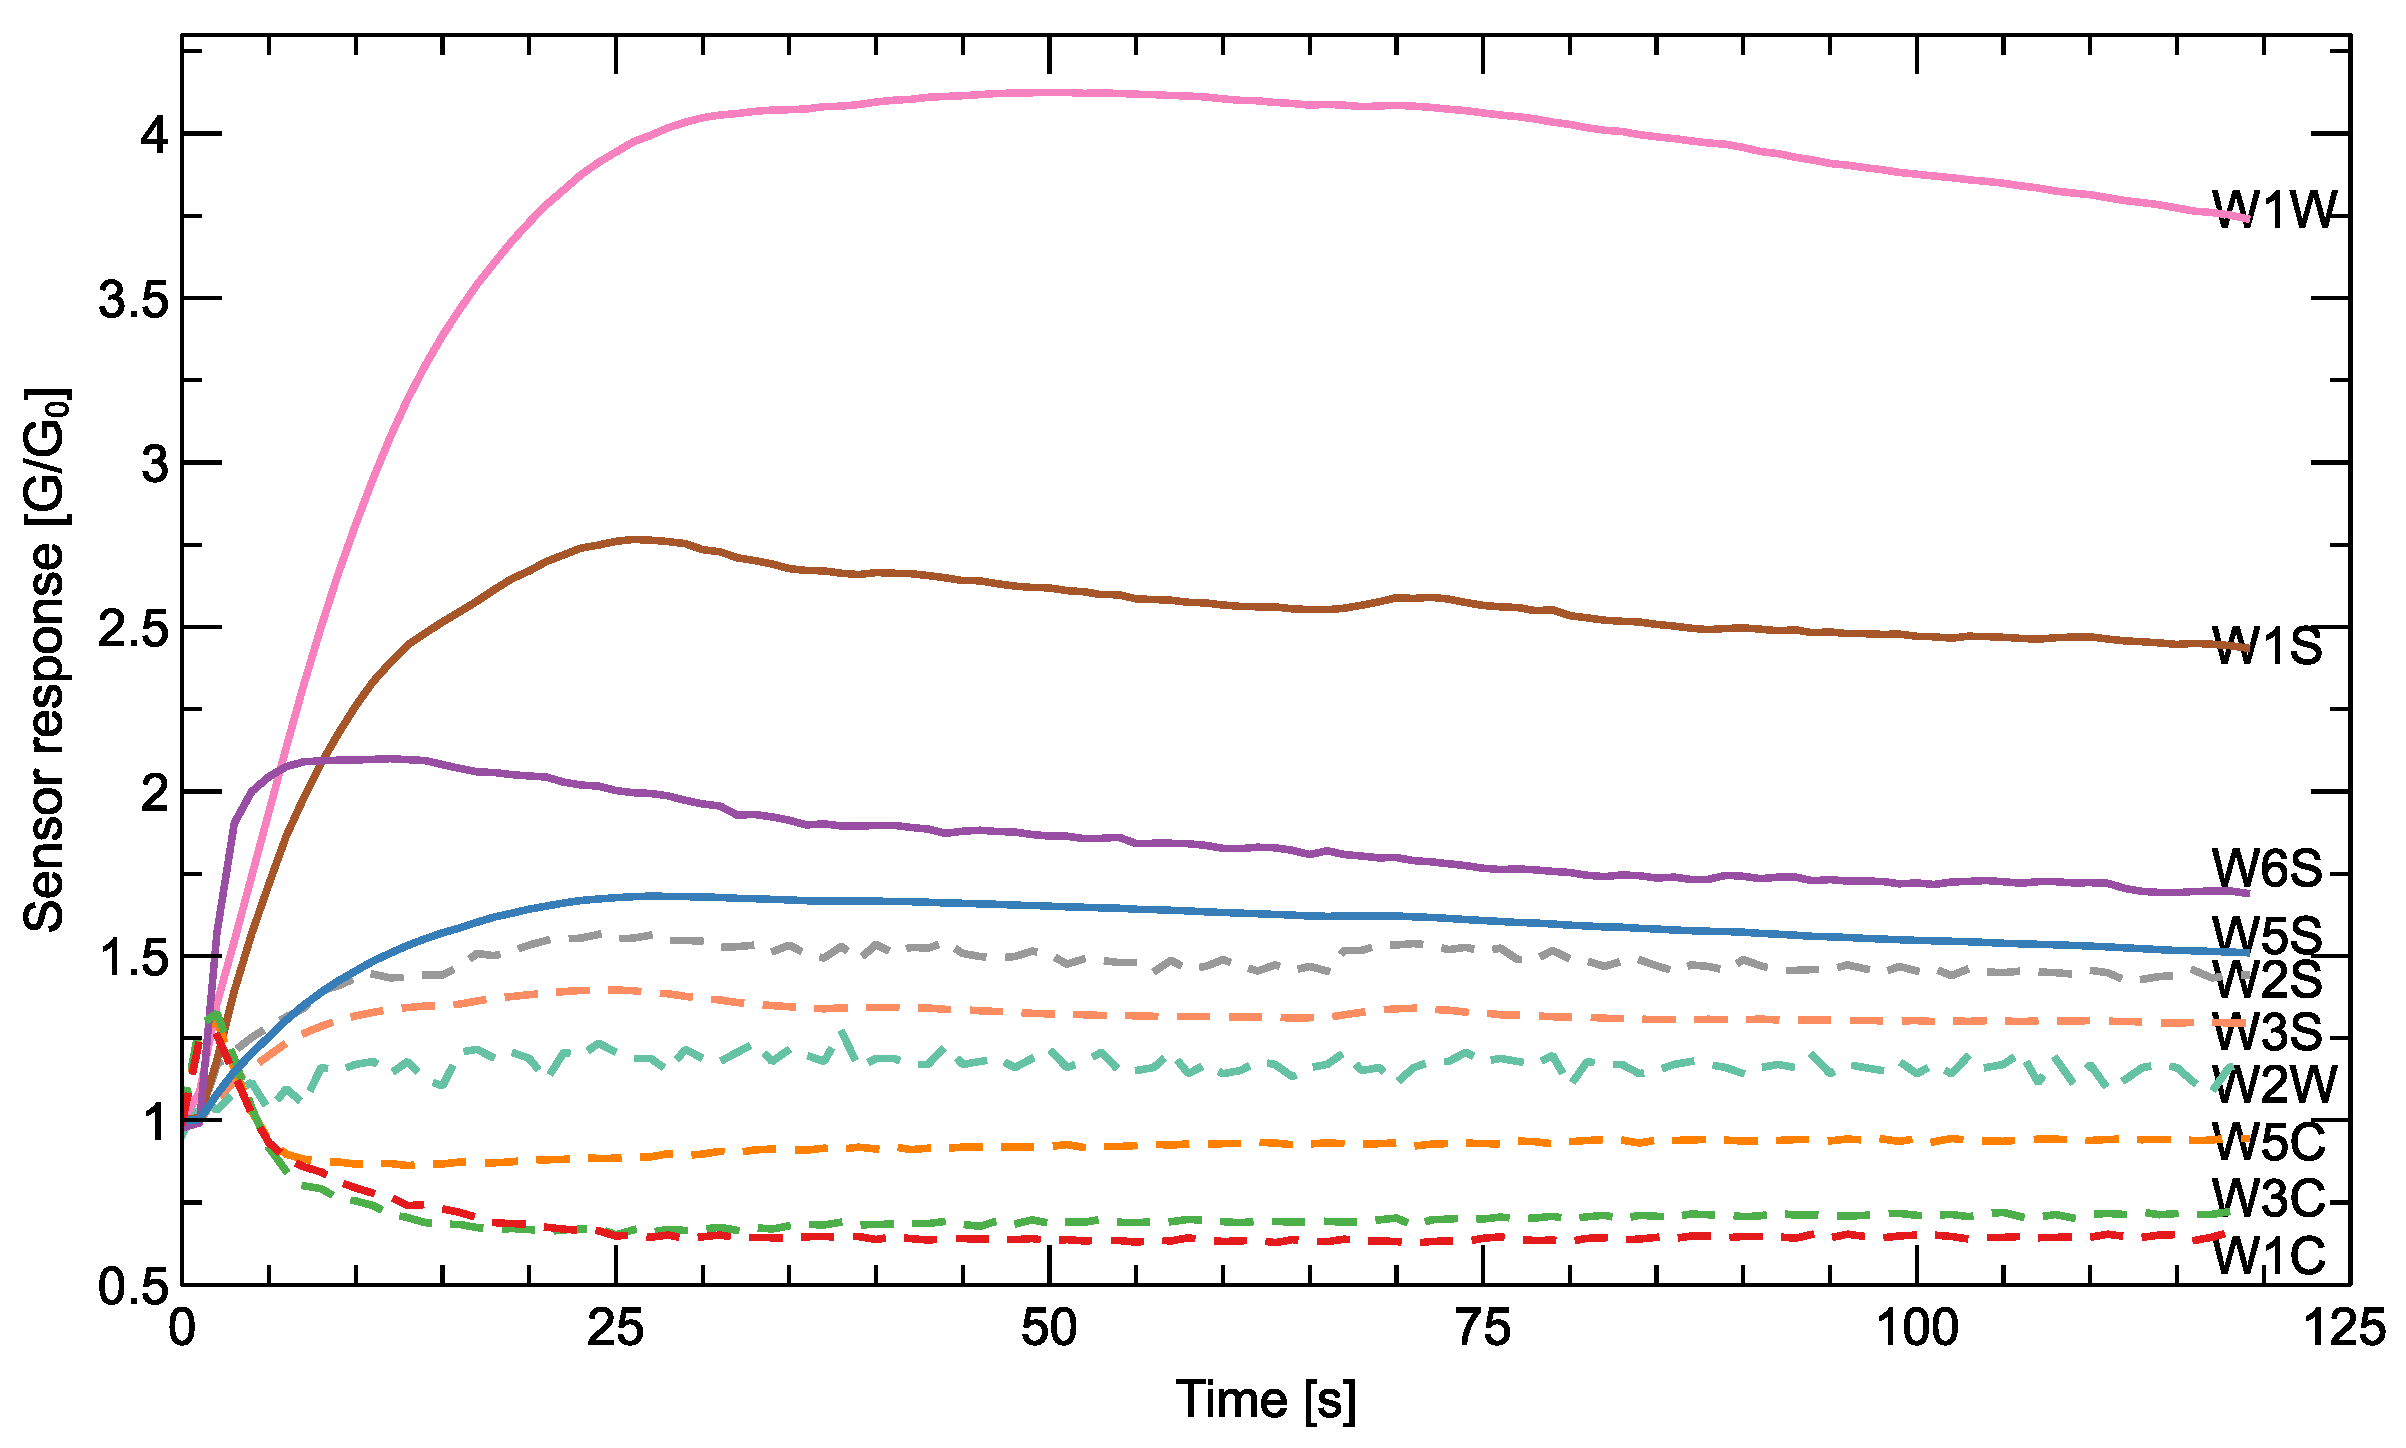
We followed the manufacturer’s recommendation that the PEN3 device should be warmed up for at least 10 min before performing a series of measurements. Before measuring each sample, clean, activated carbon-filtered air was blown through an electronic nose to clean the sensor system and the gas transfer tubes. During the measurement phase, gas was aspirated at a constant flow rate from the space above the sample through a tube connected to a needle and fed into the sensor chamber. The measurement time was set to 2 min, and the sensor response values were recorded every second. Examples of recorded e-nose response curves are shown in Figure 2. The output recorded by the PEN3 electronic nose sensor is the conductivity normalized to the baseline value (G/G0), where the reference baseline is the sensor response to the clean air conditions measured at the beginning of each measurement cycle. Table A2 in Appendix A describes the operating conditions of the electronic nose in detail.
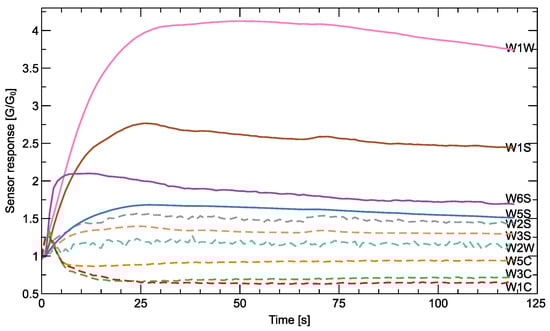
Figure 2.
An example of the shape of the response of the sensors recorded during the measurement of a single sample. The output response is shown as the resistance of the sensor relative to its reference quantity in air G/G0. Since the range of response varies and may not be recognizable in the usual Y-axis scale, for some of the sensors, this quantity is shown multiplied by five (), and the corresponding lines are dashed. The sensor types (Table A1) are indicated in the figure.
Sensor Response
To illustrate the nature of the output of the measurements of an electronic nose, we show in Figure 2 an example of the shape of the signals detected during a measurement cycle of a sample. The sensor response has different magnitudes for different sensors, and some of them would not be recognizable using the same scale in the Y-axis, so we decided to show some of them after multiplication. This way, you can see that some sensors react in a ‘positive’ direction, while others react in a ‘negative’ direction. Different sensor types are made of different materials, and a direct comparison of the response between different sensors is not meaningful. A meaningful distinction between different sample types can be made by comparing the differences in the response of a sensor to the presence of different sample odors.
The response of sensors to the presence of odors is complex, and different features extracted from the response can be used to distinguish between different odors. The most basic characteristic, which is also recommended by the manufacturer of the PEN3 e-nose, is the final steady-state value of the response curve . However, various authors have proposed much more sophisticated extraction methods that take into account the dynamic characteristics of the sensor response [31]. In our studies, we extracted three characteristic features from each sensor response: (1) the final response, (2) the slope of the response at the beginning of the measurement, and (3) the maximum value reached by the sensor curve (or the minimum value for the sensors with the ‘negative’ direction of the response).
2.5. Machine Learning Classification Models
Discrimination between studied variants of samples can be performed by building classification models that use as predictors features extracted from signals collected with an electronic nose. In our studies, we applied the Random Forest (RF) [32] method for such a task.
The RF concept consists of creating a set of weak classifiers from decision tree models. In our modeling, the default RF hyper-parameters of the model, proposed by the scikit-learn package [33], were used. The RF model built 100 trees. The trees were expanded until all leaves were pure or until all leaves contained less than a certain number of observations. In our case, this parameter was set as default = 2. Each decision tree was built on a bootstrap sample, i.e., for training the tree, the training observations were randomly selected from the dataset. This means that some observations were omitted from the bootstrap sample. These observations are commonly referred to as out-of-bag (OOB) samples. The prediction for these OOB samples can be used to evaluate the performance of the model. Each of the trees was trained independently on a subset of the training dataset, and the final model was determined from the average of the results of these models. The final ensemble model is well suited for learning nonlinear patterns in the data and achieves better performance than the individual models. It is also less prone to overfitting than many other classification models.
This approach has several advantages that we would like to mention here, as we have benefited from them in our research. First, it allows us to extract the OOB score during model training, i.e., the score of the model performance computed on the subsamples of the whole training dataset that were not used for fitting the parameters of individual trees in the RF. This allows us to estimate various statistics of model performance, including those reported in our research. The OOB score is [34] equivalent to the leave-one-out cross-validation technique. OOB error estimation is a convenient and efficient method for evaluating the performance of the RF classification model as it does not require additional validation datasets or cross-validation techniques. Another advantage of the RF technique is the ability to output from the modeling task a list of features used by the model by assigning them their relative importance for classification.
We also performed classification modeling using various other techniques available in the scikit-learn package [33]. The performance of the model obtained with the RF technique was one of the best. Considering the advantages presented above, we decided to limit our studies to the application of the RF technique and not to go into the comparison of the performance of different models, which in our opinion does not fit the intended scope of the present investigation.
As a measure of the performance of classification models, we used in our studies the indicators accuracy, precision, and recall, which are defined by the components of the confusion matrix.
in which (true positive), (true negative), (false positive), and (false negative) reflect the number of observations that were correctly or incorrectly classified by the model.
These measures of model performance can be interpreted intuitively because of the following:
- (i)
- The accuracy is the proportion of correctly classified observations compared to the total number of observations;
- (ii)
- Precision is the ratio between the number of correctly classified observations and the number of observations classified as belonging to this category. This means that precision focuses on the confidence that the classified case really belongs to that category;
- (iii)
- Recall is the ratio between the number of correctly classified observations and the total number of observations in the category in question. Recall focuses on the ability to recognize observations that belong to the category of interest and is not penalized if the cases from the other category are misclassified.
Two classification models were created in our studies. First, we trained the model for classifying samples between the four studied Fusarium species. Second, we trained binary classification models in which we classified the measured samples into two categories, the first group of fungi producing T-2 and HT-2 toxins, F. langsethiae and F. sporotrichioides, and the second group of F. poae and F. avenaceum, which do not produce these toxins.
2.6. Data Visualization by LDA and PCA Analysis
The response of the sensors, even when reduced to the main features extracted from the sensor-extraction curves, is very multidimensional data. The same is true for the results of GC–MS analysis, as each detected chemical component should be treated as an independent dimension of the data. This makes it difficult to visualize such data if we want to gain an intuitive insight into the patterns in the data that might be useful for discriminating between treatments.
A common approach that helps with such a task is to transform the data into lower dimensions. There are several methods that can be used. We have opted for linear transformation techniques, which can be seen as the rotation and scaling of the dimensions.
Principal component analysis is an unsupervised method for linear transformation of the data space. It can be intuitively interpreted as a rotation of the coordinate axes. The new coordinates are constructed in such a way that the first coordinate vector is the axis (principal component) for which the variance of the data set reaches the maximum value. The next coordinate axis is perpendicular to the first and indicates a direction that also contains the maximum of the remaining variance of the transformed data set. The following principal components are constructed in the same iterative process. Before this transformation, the data set is scaled to normalize the variance of all the original variables to the same value.
Linear discriminant analysis (LDA) is a supervised method of data transformation that is often used to reduce the dimensionality of the input data set by projecting it in the most discriminant directions. The goal of the LDA transformation is to find the linear combination of the original dimensions that best separates the classes in a dataset. The idea is to reduce the dimensionality of the data while preserving the information that is most important for class discrimination.
It should be noted that both methods were used in our research solely for visualization purposes and not as dimensionality reduction methods. The implemented machine learning models were based on the full set of untransformed and unreduced dimensions.
2.7. Software Packages
In the present study, data processing and analysis were performed using programs developed in the Python 3.10 language with the scikit-learn package [33]. The statistical tests were calculated with the scipy package [35].
3. Results of GC–MS Measurements
3.1. Detected Chemical Components
In Table 1, we present a list of chemical compounds identified by the GC–MS methods in four types of samples used in our experiment. The chemical compounds are grouped, and the percentage of their presence in the total ion current is also aggregated to the chemical component group level. What we would like to remind the reader is that the presented percentage of the total ion current does not indicate the absolute magnitude of the abundance of a chemical component found in the sample. The percentage is calculated as the relation of the number of chemical molecules, which is measured by the ion current in the corresponding chromatography peak, in proportion to the number of molecules of all chemical compounds detected in the sample, which is measured as the TIC collected during the measurement of the sample.

Table 1.
Volatile compounds identified in the samples of wheat grain infested by the four studied species of Fusarium fungi. The numbers present the percentage of the compound in proportion to the total ion current collected during a sample measurement. The average ± standard deviation of all measured samples is presented. In a few cases where a chemical component was not detected in all samples of this category, the range of the measurement results is given instead of the mean and standard value.
We can mention some patterns found when one examines the groups of chemical compounds detected by the GC–MS analysis of the studied samples:
- The most common group of chemical compounds found in the samples is alcohols. The exception is for the case of samples containing F. poae, for which the alcohol proportion reached about 24% of the TIC. In the case of other studied samples with other Fusarium species, the proportion of detected alcohols reached even as much as 51% and 66% of TIC for F. avenaceum and F. langsethiae, respectively. In all studied variants, the same alcohol (1-octen-3-ol) was dominant. It is worth mentioning that this chemical component has been demonstrated [36] as present in ‘wheat aroma’. This is an alkenyl alcohol known as ‘mushroom alcohol’ that is produced by plants and fungi [37].
- The proportion of emitted ketones is similar in each of the studied variants, ranging from 22% form F. sporotrichioides up to 37% of TIC for F. avenaceum. 3-Octanone was detected in the four studied Fusarium species, whereas 1-octen-3-one only in F. avenaceum.
- Sesquiterpenes are the most abundant group of chemical components found in samples containing F. poae, reaching 34% of TIC. About half of that (16%) was found in the case of F. sporotrichioides, and they were not detected in F. avenaceum and F. langsethiae samples. However, the presence of this group of chemical components in the case of F. sporotrichioides was limited to -Bazzanene, while in the case of F. poae, ten chemical components from this group were detected. We would like to mention here the work of Becker et al. [38], which reported that Fusarium spp. induced the emission of volatile sesquiterpenes in corn samples.
- Monoterpenes’ presence in F. sporotrichioides was found to be quite high (24%), while in other studied species, they were found in much smaller proportions (4–9%).
- Other components had a much lower proportion of TIC.
When we examine these data from the perspective of the studied species of Fusarium, we can conclude that the richest profile of emitted volatile compounds was detected for F. poae, with 22 distinct chemical compounds. The second in this kind of ranking was F. avenaceum with 11 compounds. In the case of other two studied species, in total, we detected only five chemical compounds.
There were three chemical compounds detected in all the variants of the studied samples:
- First of all is the already mentioned alcohol—1-octen-3-ol with the proportion of TIC in the range of 23–66%.
- Ketone-3-octanone had a significant presence in all treatments (23–37%). In all treatments, except F. avenaceum, it was the only chemical compound from this group. 3-Octanone, together with 1-octen-3-ol are considered as natural biopesticides [37].
- Limonene (monoterpene) was present in a proportion of 24% of TIC in the case of F. sporotrichioides and in a much smaller proportion in the range of 3–8% in three other studied variants.
We would like to mention here the report of Laddomada et al. [3], in which the authors presented results of GC–MS measurements of the volatile profile of durum wheat kernels infected by F. poae. The authors identified 29 chemical components and concluded that the whole profile of emitted volatiles should be used for the detection of fungal spoilage, rather than a single biomarker. That finding is in agreement with our results, also indicating a complex composition of volatiles present in the samples of wheat infested by F. poae.
3.2. Patterns in Volatile Profiles by Principal Component Analysis
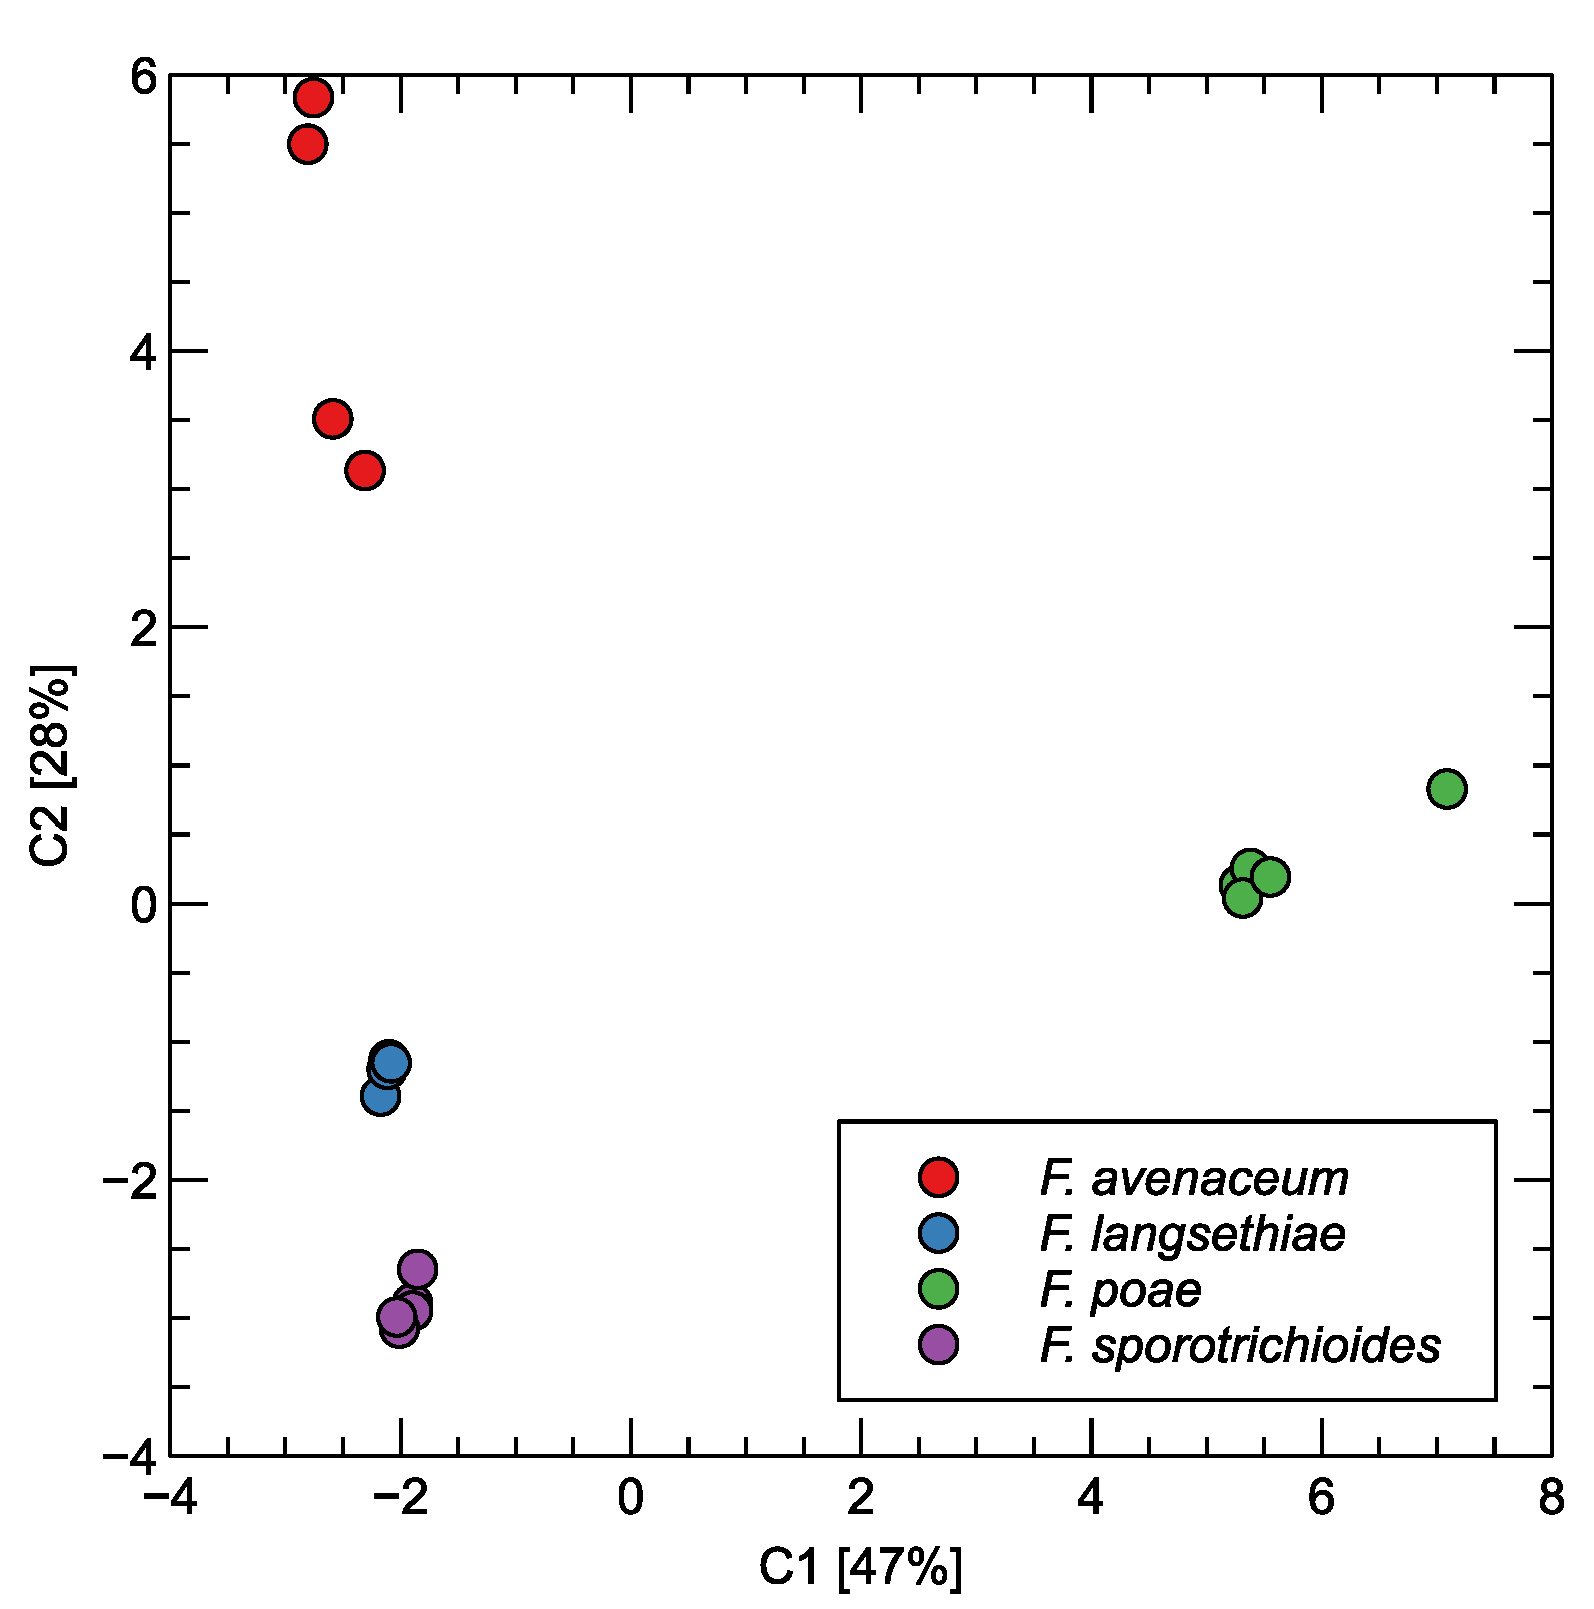
The patterns allowing for the differentiation of the measured samples by the volatile compounds identified by the GC–MS methods can be visualized using the transformation of the data by principal component analysis. We present the results of such a transformation in Figure 3. The dots in the figure represent individual samples (prepared jars). As one can observe in this figure, F. poae has a distinct profile from the three other Fusarium species. The difference between this species and the other is along the first, the most important principal component, which contains about 47% of the variability of the data. This suggests that F. poae should be the species that can be most easily differentiated from the other studied species. The three other species can be differentiated along the second principal component axis, containing about 28% of the variability of the data.

Figure 3.
Principal component analysis transformation of proportion of chemical compounds identified in the GC–MS analysis of measured samples. Two of the most significant components are shown. The variability explained by the components is indicated in the axis labels.
4. Results of Electronic Nose Measurements
4.1. Signals Collected by the Electronic Nose
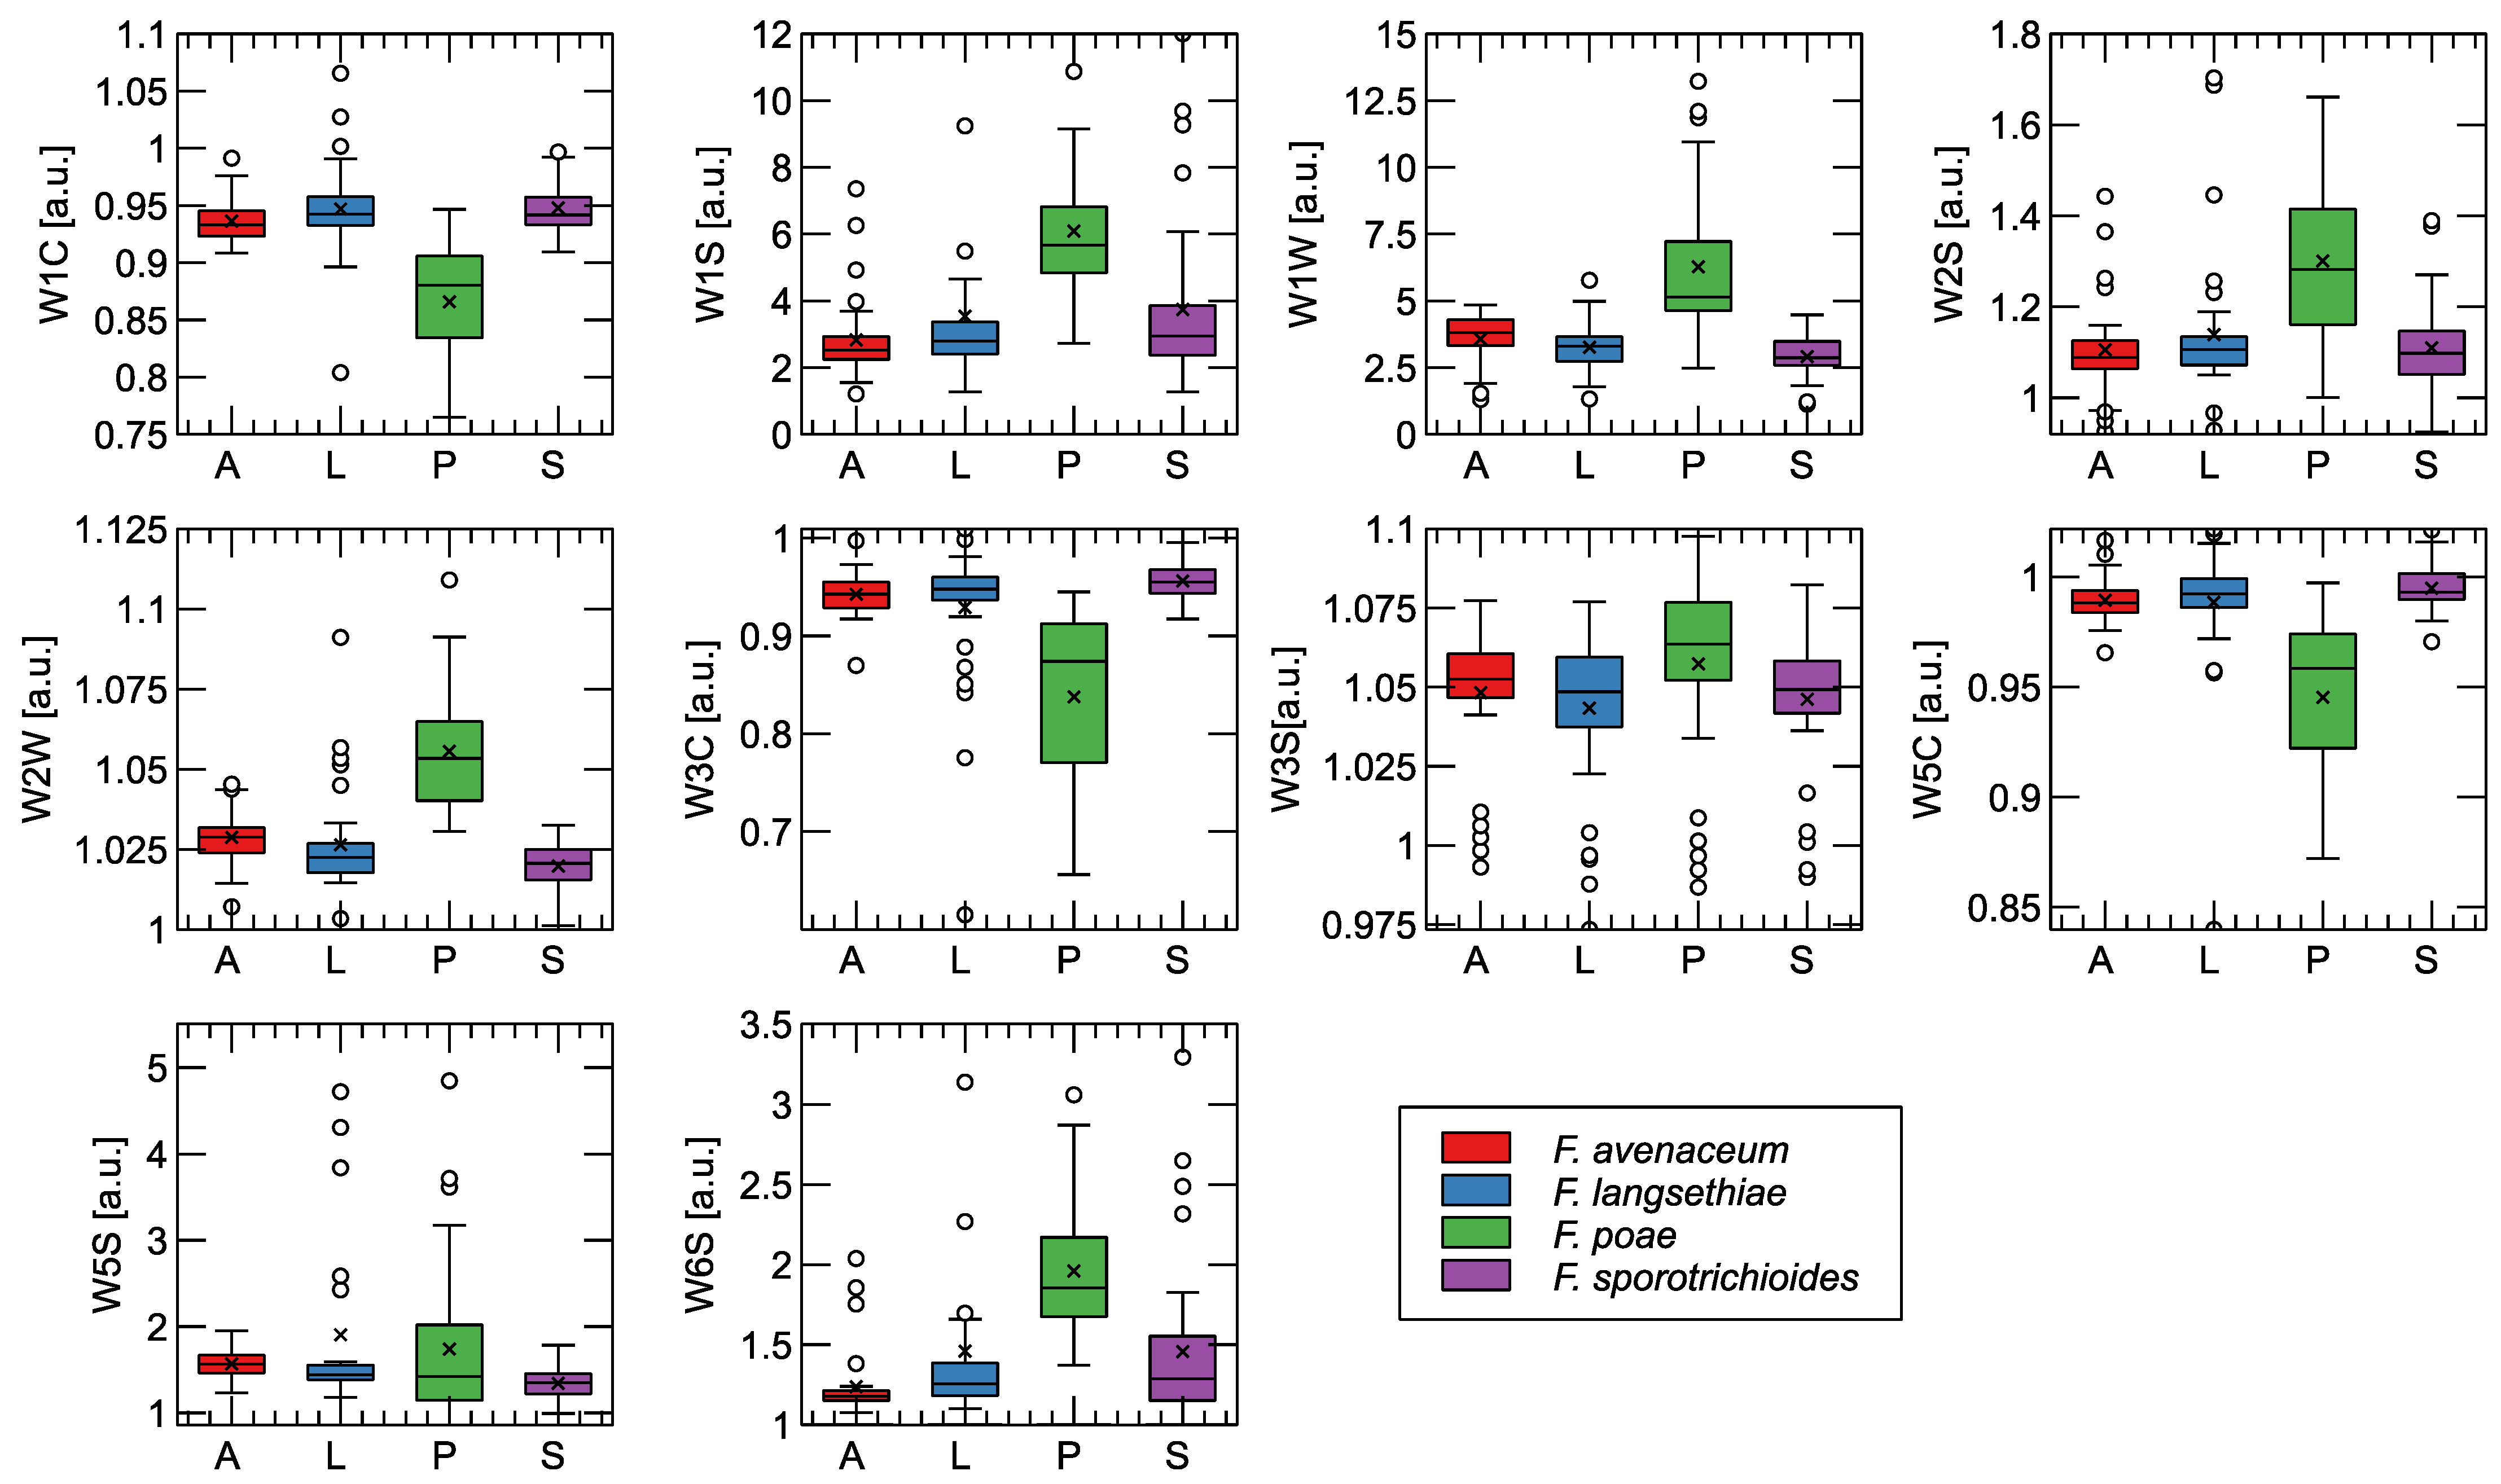
Figure 4 compares the response of the sensors in the final steady state after exposure to the odors emitted by the four sample categories studied. To visualize the comparison of the distribution of responses, we used a box-plot diagram that allowed us to visualize some of the main features of the data distribution. We grouped next to each species the categories that produce or do not produce T-2 and HT-2 toxins.
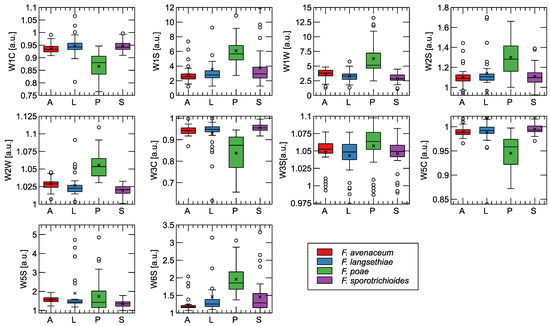
Figure 4.
Comparison of features extracted as the final steady-state value of the sensor response for categories of samples analyzed. In the graphs, the boxes extend from the 1st to the 3rd quantile, with the median indicated by a line, the whiskers indicating the 1.5-fold interquartile range, the symbol × indicating the mean, and the empty circles next to the whiskers indicating the outlier observations. The sensor model (Table A1) is indicated as the label of the Y-axis. In the X-axis caption, the fungi species are indicated: A—F. avenaceum, L—F. langsethiae, P—F. poae, S—F. sporotrichioides.
As can be seen, the strongest sensory response was observed in response to the odors of the F. poae fungus. In addition, these samples exhibited the greatest variability in the data, as evidenced by the size of the interquartile range of the distribution of the measurement points.
To confirm the difference between the response of the sensors to the different treatments studied, we performed Tukey’s HSD test. We do not reproduce the test results in Figure 4 in order not to overload them. The tests showed the difference between F. poae and the three other species studied for all sensors, except W3W and W5S, with a corresponding p value < 0.001. No significant difference was found when comparing between other pairs of categories, except for the difference between F. langsethiae and F. sporotrichioides at W5S at p = 0.018.
The distinction between the other three species is more difficult. However, a small difference can be observed between F. avenaceum and the two toxin-producing species (F. langsethiae, F. sporotrichioides), especially when we consider sensor W1W, W2W, or W1C. It is also important to note that the difference in the responses of these sensors is in the same direction when we compare the groups of species that do and do not produce the toxins under consideration.
Also, when looking at the final steady state of the sensor’s response shown in Figure 4, we cannot distinguish between the two types of Fusarium that do not produce T-2 and HT-2 toxins.
The above comparison of the individual responses of each electronic sensor can give an insight into the possibilities of differentiation between samples using data collected by this method. Another useful method is to transform the data obtained by projecting them into a lower-dimensional space while preserving the main patterns in the data.
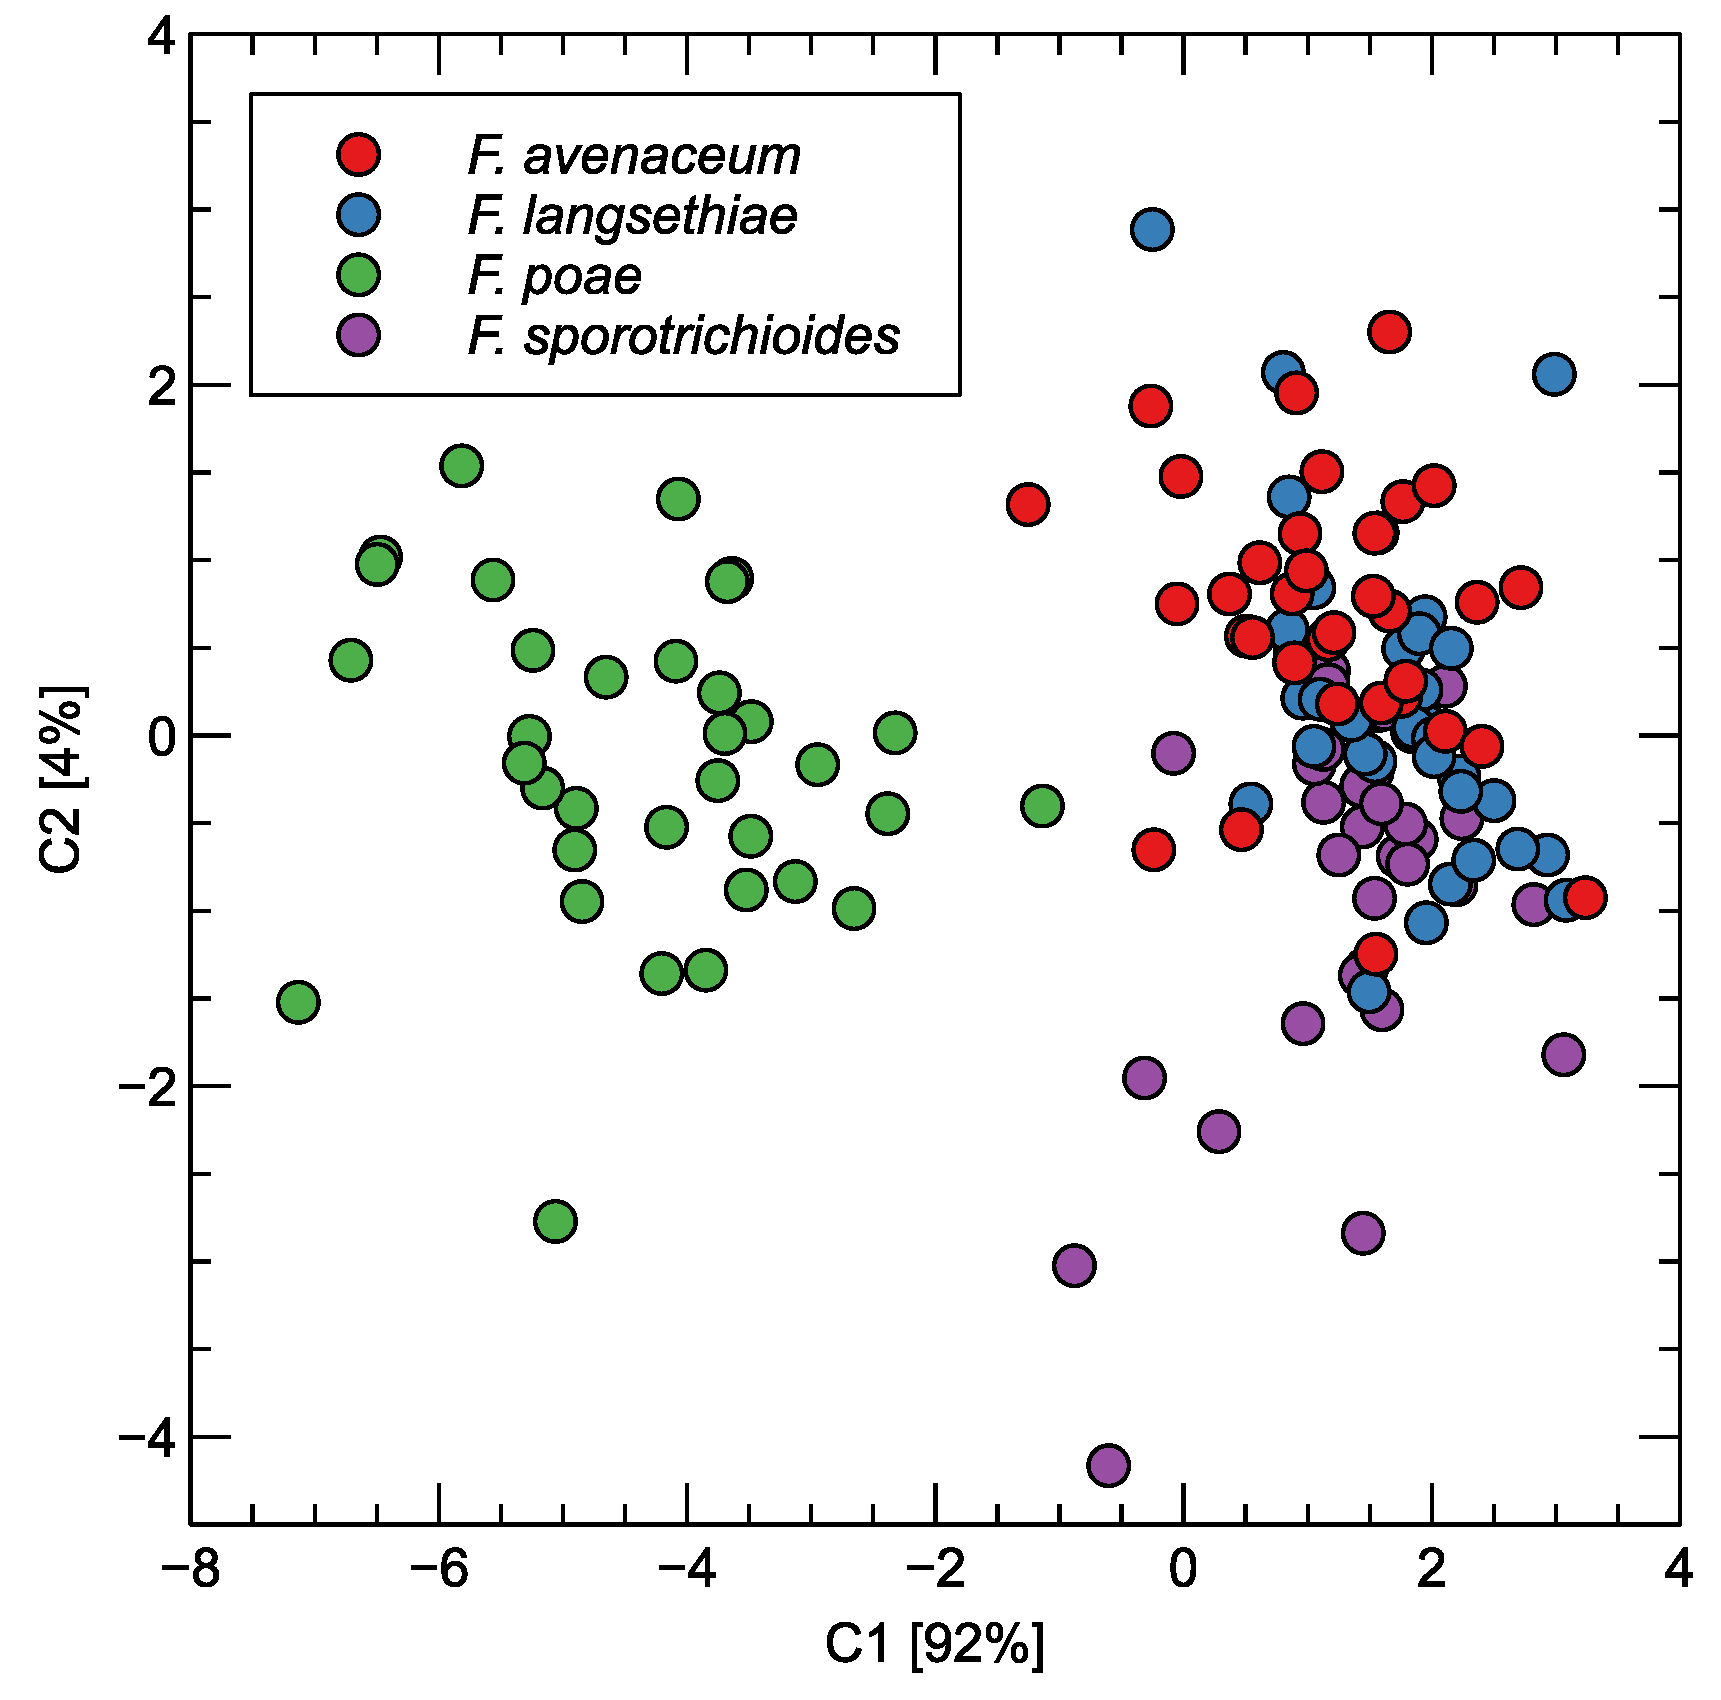
In Figure 5, we have visualized the scattering of the points representing the measured samples. A two-dimensional projection by the linear discriminant analysis method was used for the transformation of the features extracted from the response curves of the sensors.
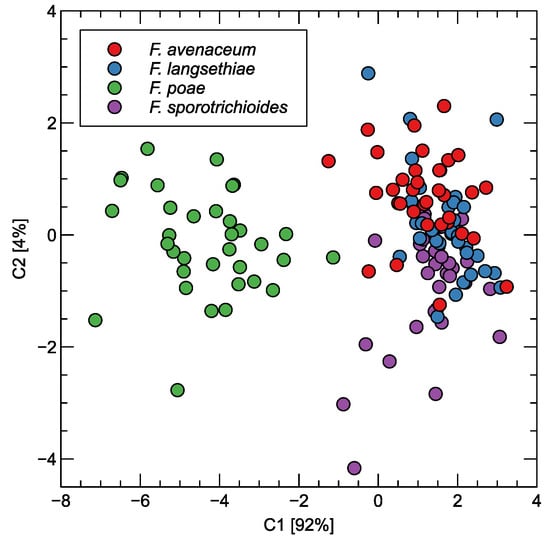
Figure 5.
Distribution of observations obtained by electronic nose measurements as LDA projection of features extracted from sensor response curves. Two projection axes are shown. The variability explained is indicated in the axis labels.
As can be seen, the projection into two-dimensional space preserves the main pattern of the data that could be observed when examining the sensor characteristics. A clear separation of F. poae from the other species studied can be observed. The observations representing the three other species form a single cluster of points, at least if we consider the first two of the principal components extracted using the LDA method.
4.2. Classification Modeling
We should keep in mind that the patterns in the data distribution presented and given above were obtained by transforming the entire collected dataset by fitting the LDA projection to all data. Therefore, these patterns were not validated on an independent data set. More objective and qualitatively sound results for finding patterns in the data that allow differentiation between the categories of the study sample are from the application of the machine learning classification model with integrated testing of its performance on an independent subset of data that were not used for fitting the model parameters.
4.2.1. Distinction between Investigated Types of Fusarium
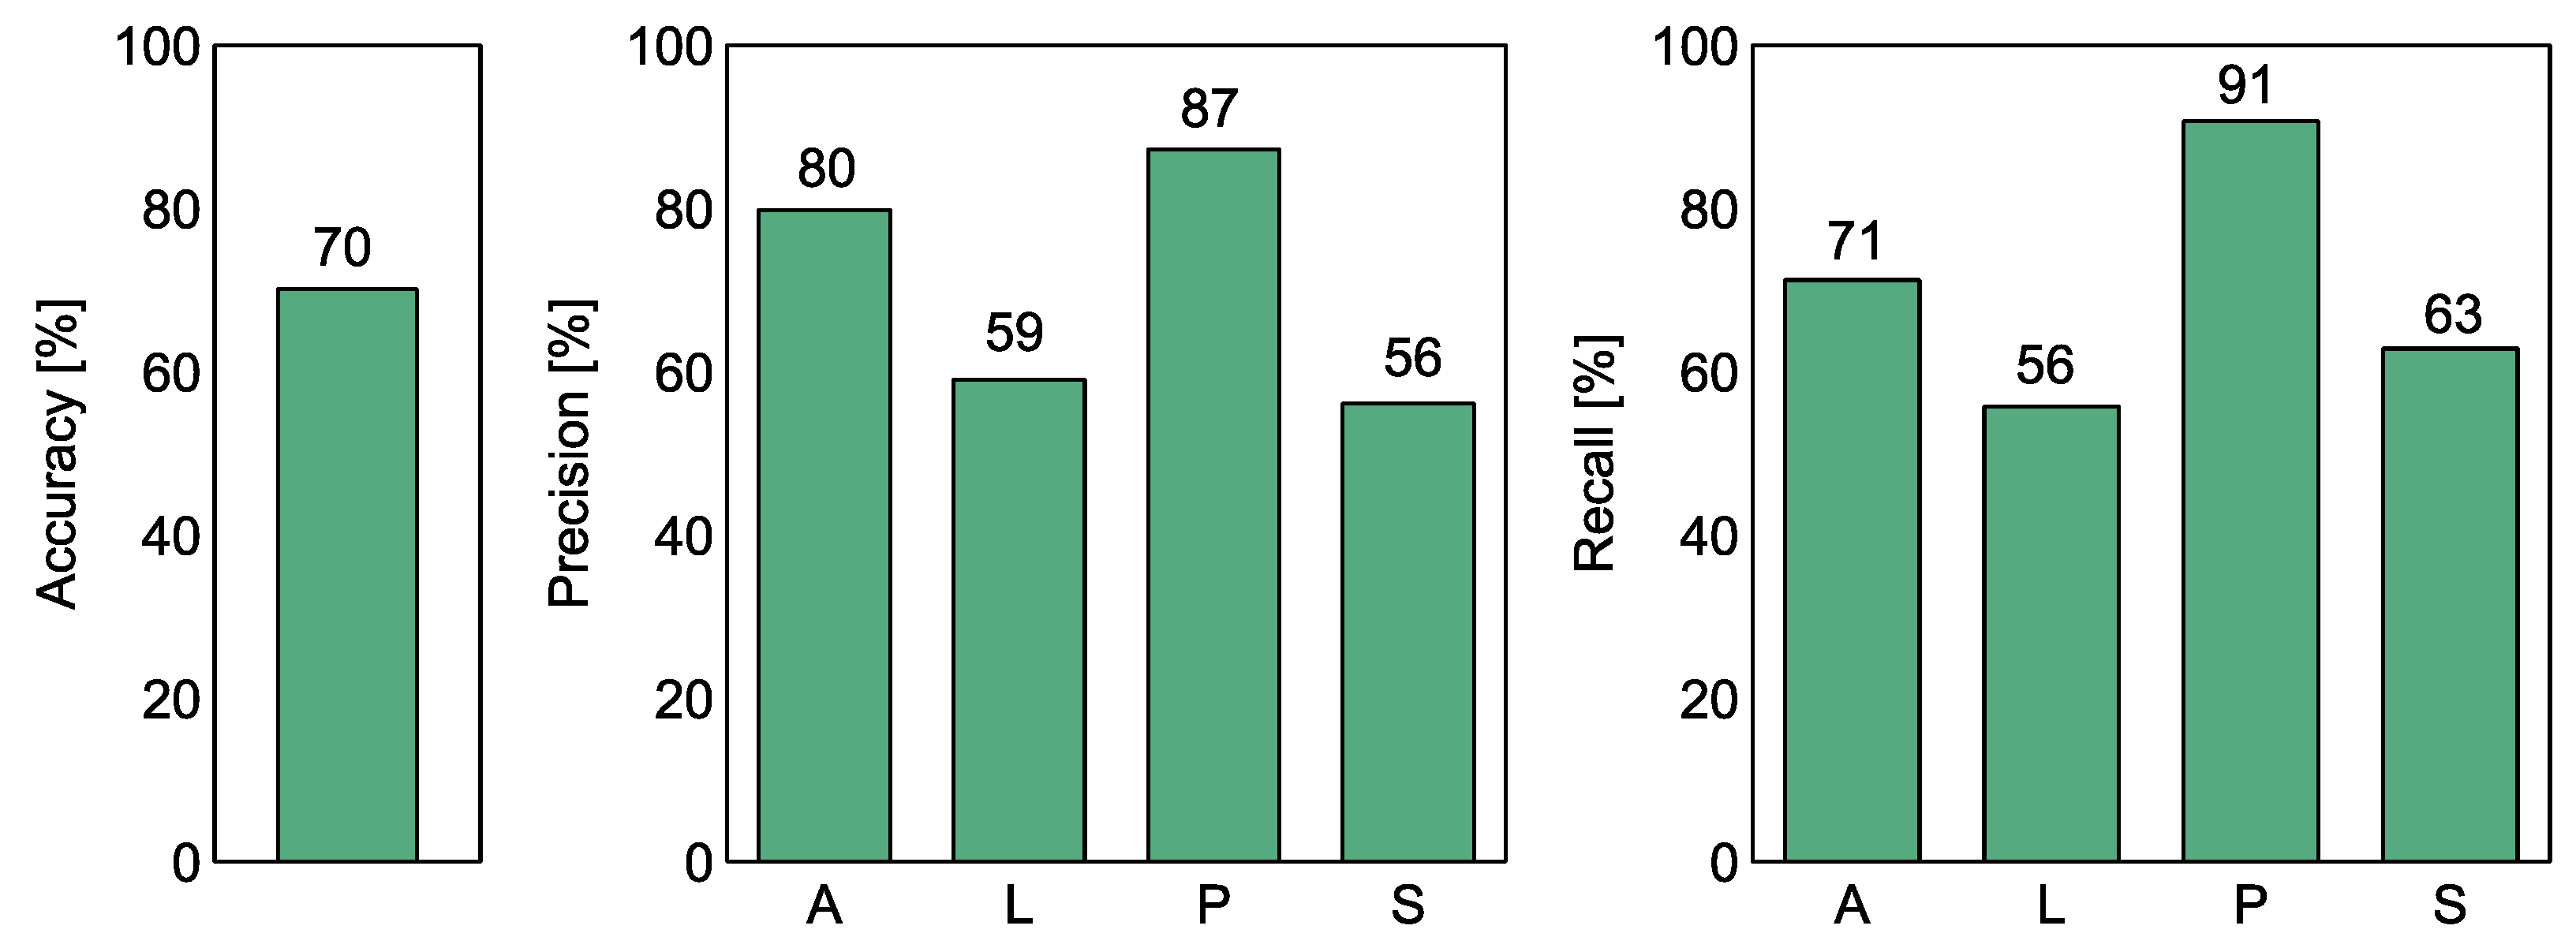
Figure 6 and Table 2 show the calculated classification performance metrics of the Random Forest model. The overall accuracy reached 70%, but this result is largely dominated by the performance of distinguishing F. poae from the other studied species.
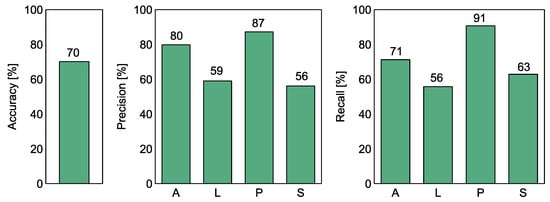
Figure 6.
The performance of the Random Forest classification model to discriminate between the four species of Fusarium. The performance measures accuracy, precision, and recall are shown in separate subfigures as indicated in the Y-axis labels. A—F. avanceum, L—F. langsethiae, P—F. poae, S—F. sporotrichioides. The presented metrics were calculated using the out-of-bag (OOB) score of the RF model technique.
Table 2.
The performance of the Random Forest classification model to discriminate between the four species of Fusarium. The presented metrics were calculated using the out-of-bag (OOB) score of the RF model technique.
If we examine the other two measures of classification performance, we can see that the recall rate of F. poae reaches 91%, which means that such a proportion of samples of this species was, correctly recognized. The precision performance measure reaches 87%, which also means that only 13% of the samples of other species were incorrectly classified as F. poae.
The recall and precision values of F. avenaceum reach 71% and 80% respectively, indicating that this species can be distinguished to a lesser extent from the other three species of Fusarium. As the discrimination of F. poae appears to be relatively efficient, these figures imply that there is a pattern that allows to some extent distinguishing F. avanceum from F. langsethiae and F. sporotrichioides.
The recall and precision values obtained for F. langsethiae and F. sporotrichioides are in the range of 55–63%, which means that they are more likely to be confused with the other species. When we examine the visual patterns shown in Figure 5, it is confirmed that the dots of these samples are concentrated in the same space, indicating difficulties in distinguishing between them.
As we have shown, the results of RF modeling can be interpreted intuitively by examining the patterns in Figure 5. Importantly, the visible patterns were confirmed by testing on independent subsets of data during machine learning modeling and by using different classes of algorithms.
As mentioned in the Section 2.5, we also trained a binary classification model to discriminate between the two pairs of Fusarium species, the T-2 and HT-2 toxin-producing and non-producing species. For such a model, we obtained the performance measures accuracy = 84%, precision = 83%, and recall = 87%. These figures may seem encouraging. However, they should be compared with the results presented previously, which indicate that the discrimination of F. poae from the three other Fusarium species is possible with very good performance. In addition, a pattern was found in the sensor’s signals that allowed us to distinguish F. avenaceum, but with significantly lower performance. Overall, the classification performance after dividing the samples into two groups is close to the arithmetic mean of the species-level constituents, so we do not believe that we have found any new significant patterns that allow us to distinguish between pairs of fungi that produce T-2 and HT-2 toxins and those that do not, using the electronic nose measurements of the emitted volatiles. Although this is a rather negative result, we think it is still worth mentioning.
4.2.2. Meaning of Sensors for the Detection of Classification Features
One of the results that can be obtained from the Random Forest classification model is the ranking of the predictors used for training the model with their relative importance. In our research, we used several features extracted from the response of a single sensor as predictors.
Figure 7 shows the graph of the importance of the predictors at the sensor level when the features extracted from a sensor are aggregated. The overall importance is expressed as a percentage and total of 100%. The description of the main target gases to which the sensors react the readers can find in Table A1 in Appendix A.
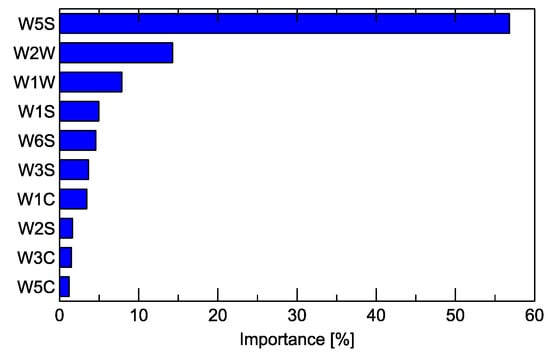
Figure 7.
Importance of the sensors (Table A1) for the detection of signals useful for distinguishing between the studied Fusarium species by the Random Forest classification model.
4.3. Comparison of GC–MS and Electronic Nose Results
Above, we presented the results of two types of measurements allowing us to differentiate between Fusarium samples by volatile compounds emitted by the pathogenic fungi infesting wheat grain.
The measurement by GC–MS is more objective and allows the identification of the individual chemical compounds consisting of the volatile profile of the sample. However, that method requires costly equipment and experienced staff to perform the measurements. In practice, it is limited to laboratory usage.
The electronic nose is much less expensive and easier to use. The measurement procedure by the e-nose is much faster, and also, the analysis of the results takes less time. However, the commonly known limitation is the lack of the possibility to identify the individual chemical compounds and rely on the pattern recognition methods, which makes the application less objective.
As one can notice, the number of measurement samples that we collected in our experiment is much higher for the case of electronic nose measurements, which reflects the above-mentioned differences.
There are some interesting observations, which may seem obvious since, for both types of measurements, we used the same types of samples. However, the results and visual demonstrations are worth mentioning.
First of all, when we examine Figure 3 and Figure 5, we notice in both cases that F. poae has the volatile components profile allowing the easiest differentiation from the three other studied species. Also, as we mentioned above, the difference, in both cases, is along the axis of the first, the most important component. The three other types of samples with other species are less distinct, and the difference between them is along the axis of the second component. Even if the results presented in Figure 3 show important differences between these samples, that may be less evident if more observations were collected [39]. However, that is a costly and laborious process.
Looking at Figure 3, we can notice that F. avenaceum is slightly more separated from the other two species. However, it should also be admitted that the distribution of the data of this species exhibits high variability. Such a visible separation in the plot of the PCs may suggest that the differentiation of this species may be easier than differentiation between F. langsethiae and F. sporotrichioides. Also, this observation is in agreement with the results of the analysis of the data collected by the electronic nose, presented in Figure 6. The performance of classification results for F. avenaceum is superior to the other two species.
One more observation noticed in the results of the electronic nose measurements may be explained by the results of the GC–MS. In Figure 7, we can notice that the most important sensor for differentiation between the studied sample variants is W5S. In Table A1 in Appendix A, we present the main characteristics of the sensors, and one can notice that this sensor has broad range sensitivity and reacts to various chemical compounds. In Table 1, we can read that F. poae has a much richer profile of emitted chemical compounds when compared to other species. Thus, the sensor detecting multiple compounds can be applied for differentiation.
Figure 4 shows that the samples infected with F. poae responded much more strongly to the sensors, and this behavior was the same for most sensors. We can attribute this to the richer composition of the chemical components emitted by this fungus, as shown by the GC–MS measurements in Table 1. Only the W3S and W5S sensors responded similarly to all treatment samples. The W3S sensor is very sensitive to methane, and the W5S sensor is sensitive to nitrogen oxides (Table A1); these gases were not present as metabolites emitted from Fusarium-infested wheat grain.
5. Discussion
Mycotoxins Produced by F. poae
Due to mycotoxins such as trichothecenes, zearalenone, fumonisins, and the lesser known beauvericin, enniatins, and moniliformin [40], the detection of Fusarium species in cereals is very important. An e-nose-identifiable isolate of F. poae can produce a wide range of mycotoxins that distinguish this species from other Fusarium fungi (Table 3), although not all strains produce all toxins and the toxins may not be produced in large quantities [41]. Food safety will, therefore, depend on new tools such as the e-nose, which makes it possible to detect at least Fusarium species from the Sporotrichiella section that synthesize trichothecene mycotoxins with a similar toxic profile. According to a recent study, F. poae is not able to synthesize the toxins HT-2 and T-2. Instead, it produces the mycotoxins DAS (diacetoxyscirpenol), MAS (15-monoacetoxyscirpenol), SCR (scirpentriol), and NEO (neosolaniol), which belong to the group of trichothecenes A [42]. Unfortunately, they are considered more common in colder regions such as Eastern Europe [43]. Besides the HT-2 and T-2 compounds, which are the most toxic of this group, DAS and NEO should be mentioned, which are synthesized only by the studied F. poae species [43]. Literature data on the natural occurrence of trichothecenes in food are mostly limited to T-2 toxin, deoxynivalenol (DON), DAS, and nivalenol (NIV) due to their high toxicity and widespread occurrence [44]. Trichothecenes cause a wide range of toxic effects in livestock and humans, including clinical symptoms such as haemorrhage, diarrhea, vomiting, leukopenia, immunosuppression, reduced reproductive capacity, bone marrow damage, or tissue damage in the gastrointestinal tract [45]. Since trichothecenes can enter the human food chain via the consumption of plant and animal products, e.g., breakfast cereals, baked goods, snacks, and beer, but also via meat, milk, and eggs, which are the main source of poisoning in humans [46], it is necessary to test them, e.g., with the e-nose. The toxigenic profile of F. poae with respect to the formation of enniatins (ENNs) also partially overlaps with the species F. avenaceum (Table 3). Beauvericin (BEA), enniatins (ENNs), and aurofusarin (AUR) are referred to as ‘emerging’ Fusarium mycotoxins produced by F. poae [13]. These groups of mycotoxins have been found in cereal grains and their processed products both in Europe [47], including Poland [48], and in North America [49] or Nigeria [50]. AURO, BEA, and ENs have been shown to have cytotoxic effects in various cell lines [51,52]. The cytotoxicity of BEA depends on the dose, duration, and type of exposure. Although it can penetrate the body through the skin, its penetration is relatively low [53]. In a study presented by Sotnichenko et al. [54], it was shown that ENNs have genotoxic properties and can also penetrate the skin with greater efficacy than BEA [53].
Table 3.
Mycotoxins produced by F. poae, compared to other species analyzed in this research.
As a result of our analyses, we found that the different Fusarium species studied have different abilities to synthesize volatile sesquiterpenes. Sesquiterpenes are infochemical compounds that are involved in the biosynthesis of mycotoxins (trichodia) [59]. Most scientific work deals with the variability of the toxigenic capacity of individual isolates of certain species, and only a few studies deal with volatile compounds such as sesquiterpenes. In a study by Jiang et al. [60], a strain of F. avenaceum (SF-1502) was shown to produce five compounds classified as sesquiterpenes. In our study, we could not detect such capabilities of the F. avenaceum species. The results show that the spectrum of VOC metabolites synthesized by fungi, including sesquiterpenes, depends on the type of medium/substrate used in the study and the metabolic capacity of specific isolates, which may vary [61].
6. Summary and Conclusions
- The analysis of the chemical compounds detected by GC–MS revealed that F. poae has the richest profile of emitted volatiles (in terms of the diversity of emitted compounds) compared to the other species studied (F. avanceum, F. langsethiae, and F. sporotrichioides).
- The measurements of the PEN3 (Airsense Analytics GmbH, Schwerin, Germany) electronic nose showed the strongest reaction of the sensors to F. poae.
- The accuracy of Random Forest classification between the four analyzed variants reached 70%. The precision for the detection of F. poae (the confidence that an observation recognized as belonging to the category F. poae was correctly classified) reached 87%. The recognition accuracy (the proportion of F. poae observations recognized) reached 91%.
- Electronic nose measurement proved to be very weak in distinguishing between the other three species (F. avanceum, F. langsethiae, and F. sporotrichioides).
- The mycotoxins produced by F. poae were reviewed and compared with the other species studied. It was found that this species has the greatest diversity of toxins produced, which also corresponds to the greatest diversity of volatiles detected.
- Fusarium poae mainly synthesizes alcohols, ketones, sesquiterpenes, and monoterpenes, which were identified by GC–MS and were absorbed by the electronic nose.
- The experiments presented showed that the new methods for differentiating between pathogenic fungal species, such as electronic nose measurements, can provide an alternative to more costly and time-consuming techniques.
Author Contributions
Conceptualization, P.B. and A.O.; methodology, P.B., M.T. and A.O.; software, P.B.; validation, P.B., M.T. and M.S.; formal analysis, P.B., T.O. and A.O.; investigation, M.S., P.P. and M.T.; resources, M.T., M.S., R.T. and A.O.; data curation, P.B., A.O. and M.S.; writing—original draft preparation, P.B., T.O., A.O. and M.T.; writing—review and editing, P.B. and T.O.; visualization, P.B. and R.T.; supervision, P.B. and T.O.; project administration, P.B. and T.O.; funding acquisition, A.O. and T.O. All authors have read and agreed to the published version of the manuscript.
Funding
This work was supported by the National Centre for Research and Development by the grant agreement BIOSTRATEG3/347105/9/NCBR/2017. The results presented in this paper were obtained as part of a comprehensive study financed by the University of Warmia and Mazury in Olsztyn (grant No. 30.610.009.110).
Institutional Review Board Statement
Not applicable.
Data Availability Statement
The original contributions presented in the study are included in the article, further inquiries can be directed to the authors. The raw data supporting the conclusions of this article will be made available by the authors upon request.
Conflicts of Interest
The authors declare no conflicts of interest.
Appendix A. PEN3 Electronic Nose Sensors and Measurement Conditions
Table A1.
The list of PEN3 electronic nose sensors.
Table A1.
The list of PEN3 electronic nose sensors.
| Sensor | Main Gas Targets |
|---|---|
| W1C | Aromatic organic compounds. |
| W5S | Very sensitive; broad-range sensitivity; reacts to nitrogen oxides; very sensitive with negative signals. |
| W3C | Ammonia; often used as a sensor for aromatic compounds. |
| W6S | Detects mainly hydrogen gas; selective; breath gases. |
| W5C | Alkanes, aromatic compounds, and less polar organic compounds. |
| W1S | Sensitive to methane (environmental); a broad range of organic compounds detected. |
| W1W | Detects inorganic sulfur compounds, e.g., H2S; also sensitive to many terpenes and sulfur-containing organic compounds. |
| W2S | Detects alcohol; partially sensitive to aromatic compounds; broad-range. |
| W2W | Aromatic compounds; sulfur organic compounds. |
| W3S | Reacts to high concentrations of methane (very selective). |
Table A2.
Parameters of PEN3 electronic nose operations.
Table A2.
Parameters of PEN3 electronic nose operations.
| Sampling interval | 1 s |
| Pre sampling time | 5 s |
| Measurement time | 120 s |
| Flush time | 300 s |
| Chamber flow | 7.7 mL/min |
| Temperature | 25 °C |
| Humidity | 60% |
References
- Stenglein, S. Fusarium poae: A pathogen that needs more attention. J. Plant Pathol. 2009, 91, 25–36. [Google Scholar]
- Presicce, D.S.; Forleo, A.; Taurino, A.M.; Zuppa, M.; Siciliano, P.; Laddomada, B.; Logrieco, A.; Visconti, A. Response evaluation of an E-nose towards contaminated wheat by Fusarium poae fungi. Sens. Actuators B Chem. 2006, 118, 433–438. [Google Scholar] [CrossRef]
- Laddomada, B.; Del Coco, L.; Durante, M.; Presicce, D.; Siciliano, P.; Fanizzi, F.; Logrieco, A. Volatile Metabolite Profiling of Durum Wheat Kernels Contaminated by Fusarium poae. Metabolites 2014, 4, 932–945. [Google Scholar] [CrossRef] [PubMed]
- Eifler, J.; Martinelli, E.; Santonico, M.; Capuano, R.; Schild, D.; Natale, C.D. Differential Detection of Potentially Hazardous Fusarium Species in Wheat Grains by an Electronic Nose. PLoS ONE 2011, 6, e21026. [Google Scholar] [CrossRef] [PubMed]
- Ji, J.; Huang, H.; Li, L.; Ye, J.; Sun, J.; Sheng, L.; Ye, Y.; Zheng, Y.; Zhang, Z.; Sun, X. Volatile Metabolite Profiling of Wheat Kernels Contaminated by Fusarium graminearum. J. Agric. Food Chem. 2023, 71, 3508–3517. [Google Scholar] [CrossRef] [PubMed]
- Dong, L.; Liu, R.; Dong, H.; Piao, Y.; Hu, X.; Li, C.; Cong, L.; Zhao, C. Volatile metabolite profiling of malt contaminated by Fusarium poae during malting. J. Cereal Sci. 2015, 66, 37–45. [Google Scholar] [CrossRef]
- Nelson, P.; Toussoun, T.; Marasas, W. Fusarium Species: An Illustrated Manual for Identification; Pennsylvania State University Press: University Park, PA, USA, 1983. [Google Scholar]
- Stenglein, S.A.; Dinolfo, M.I.; Barros, G.; Bongiorno, F.; Chulze, S.N.; Moreno, M.V. Fusarium poae Pathogenicity and Mycotoxin Accumulation on Selected Wheat and Barley Genotypes at a Single Location in Argentina. Plant Dis. 2014, 98, 1733–1738. [Google Scholar] [CrossRef] [PubMed]
- Okorski, A.; Milewska, A.; Pszczółkowska, A.; Karpiesiuk, K.; Kozera, W.; Dąbrowska, J.A.; Radwińska, J. Prevalence of Fusarium fungi and Deoxynivalenol Levels in Winter Wheat Grain in Different Climatic Regions of Poland. Toxins 2022, 14, 102. [Google Scholar] [CrossRef]
- Supronienė, S.; Kadžienė, G.; Shamshitov, A.; Veršulienė, A.; Šneideris, D.; Ivanauskas, A.; Žvirdauskienė, R. Soil Fungistasis against Fusarium graminearum under Different tillage Systems. Plants 2023, 12, 966. [Google Scholar] [CrossRef]
- Pereira, C.B.; Ward, T.J.; Del Ponte, E.M.; Mara Moreira, G.; Busman, M.; McCormick, S.P.; Feksa, H.R.; De Almeida, J.L.; Tessmann, D.J. Five-year survey uncovers extensive diversity and temporal fluctuations among fusarium head blight pathogens of wheat and barley in Brazil. Plant Pathol. 2020, 70, 426–435. [Google Scholar] [CrossRef]
- Ghimire, B.; Martinez-Espinoza, A.D.; Ghimire, B.; Harrelson, B.C.; Youmans, J.; Mergoum, M.; Buck, J.W. First Report of Fusarium poae Causing Fusarium Head Blight of Wheat in Georgia, USA. Plant Dis. 2021, 105, 491. [Google Scholar] [CrossRef] [PubMed]
- Covarelli, L.; Beccari, G.; Prodi, A.; Generotti, S.; Etruschi, F.; Meca, G.; Juan, C.; Mañes, J. Biosynthesis of beauvericin and enniatins in-vitro by wheat Fusarium species and natural grain contamination in an area of central Italy. Food Microbiol. 2015, 46, 618–626. [Google Scholar] [CrossRef] [PubMed]
- Drakopoulos, D.; Sulyok, M.; Jenny, E.; Kägi, A.; Bänziger, I.; Logrieco, A.F.; Krska, R.; Vogelgsang, S. Fusarium Head Blight and Associated Mycotoxins in Grains and Straw of Barley: Influence of Agricultural Practices. Agronomy 2021, 11, 801. [Google Scholar] [CrossRef]
- Hegde, G.M.; Devaiah, M.; Uday, G.; Patil, P.V. First Report of Fusarium poae Causing Head Blight of Wheat in India. Plant Disease 2023, 107, 3302. [Google Scholar] [CrossRef] [PubMed]
- Summerell, B.A.; Leslie, J.F.; Liew, E.C.Y.; Laurence, M.H.; Bullock, S.; Petrovic, T.; Bentley, A.R.; Howard, C.G.; Peterson, S.A.; Walsh, J.L.; et al. Fusarium species associated with plants in Australia. Fungal Divers. 2010, 46, 1–27. [Google Scholar] [CrossRef]
- Tan, J.; De Zutter, N.; De Saeger, S.; De Boevre, M.; Tran, T.M.; van der Lee, T.; Waalwijk, C.; Willems, A.; Vandamme, P.; Ameye, M.; et al. Presence of the Weakly Pathogenic Fusarium poae in the Fusarium Head Blight Disease Complex Hampers Biocontrol and Chemical Control of the Virulent Fusarium graminearum Pathogen. Front. Plant Sci. 2021, 12, 641890. [Google Scholar] [CrossRef]
- Tini, F.; Covarelli, L.; Cowger, C.; Sulyok, M.; Benincasa, P.; Beccari, G. Infection timing affects Fusarium poae colonization of bread wheat spikes and mycotoxin accumulation in the grain. J. Sci. Food Agric. 2022, 102, 6358–6372. [Google Scholar] [CrossRef] [PubMed]
- McMullen, M.; Bergstrom, G.; De Wolf, E.; Dill-Macky, R.; Hershman, D.; Shaner, G.; Van Sanford, D. A Unified Effort to Fight an Enemy of Wheat and Barley: Fusarium Head Blight. Plant Dis. 2012, 96, 1712–1728. [Google Scholar] [CrossRef] [PubMed]
- Wegulo, S.N.; Baenziger, P.S.; Hernandez Nopsa, J.; Bockus, W.W.; Hallen-Adams, H. Management of Fusarium head blight of wheat and barley. Crop Prot. 2015, 73, 100–107. [Google Scholar] [CrossRef]
- Joffe, A.Z.; Palti, J. Taxonomic Study of Fusaria of the Sporotrichiella Used in Recent Toxicological Work. Appl. Microbiol. 1975, 29, 575–579. [Google Scholar] [CrossRef]
- Leslie, J.F.; Summerell, B.A. The Fusarium Laboratory Manual; Blackewell Publishing: Oxford, UK, 2006. [Google Scholar]
- Torp, M.; Nirenberg, H.I. Fusarium langsethiae sp. nov. on cereals in Europe. Int. J. Food Microbiol. 2004, 95, 247–256. [Google Scholar] [CrossRef] [PubMed]
- Aamot, H.U.; Mousavi, H.; Razzaghian, J.; Brodal, G.; Sulyok, M.; Krska, R.; Edwards, S.G.; Hofgaard, I.S. Fusarium langsethiae and mycotoxin contamination in oat grain differed with growth stage at inoculation. Eur. J. Plant Pathol. 2022, 164, 59–78. [Google Scholar] [CrossRef]
- Stakheev, A.A.; Khairulina, D.R.; Zavriev, S.K. Four-locus phylogeny of Fusarium avenaceum and related species and their species-specific identification based on partial phosphate permease gene sequences. Int. J. Food Microbiol. 2016, 225, 27–37. [Google Scholar] [CrossRef] [PubMed]
- Niessen, L.; Schmidt, H.; Vogel, R.F. The use of tri5 gene sequences for PCR detection and taxonomy of trichothecene-producing species in the Fusarium section Sporotrichiella. Int. J. Food Microbiol. 2004, 95, 305–319. [Google Scholar] [CrossRef] [PubMed]
- Sohlberg, E.; Virkajärvi, V.; Parikka, P.; Rämö, S.; Laitila, A.; Sarlin, T. Taqman qPCR Quantification and Fusarium Community Analysis to Evaluate Toxigenic Fungi in Cereals. Toxins 2022, 14, 45. [Google Scholar] [CrossRef] [PubMed]
- Kulik, T.; Jestoi, M.; Okorski, A. Development of TaqMan assays for the quantitative detection of Fusarium avenaceum/Fusarium tricinctum and Fusarium poae esyn1 genotypes from cereal grain. FEMS Microbiol. Lett. 2011, 314, 49–56. [Google Scholar] [CrossRef] [PubMed]
- Nicolaisen, M.; Supronienė, S.; Nielsen, L.K.; Lazzaro, I.; Spliid, N.H.; Justesen, A.F. Real-time PCR for quantification of eleven individual Fusarium species in cereals. J. Microbiol. Methods 2009, 76, 234–240. [Google Scholar] [CrossRef] [PubMed]
- Zitnick-Anderson, K.; Simons, K.; Pasche, J.S. Detection and qPCR quantification of seven Fusarium species associated with the root rot complex in field pea. Can. J. Plant Pathol. 2018, 40, 261–271. [Google Scholar] [CrossRef]
- Yan, J.; Guo, X.; Duan, S.; Jia, P.; Wang, L.; Peng, C.; Zhang, S. Electronic Nose Feature Extraction Methods: A Review. Sensors 2015, 15, 27804–27831. [Google Scholar] [CrossRef] [PubMed]
- Breiman, L. Random Forests. Mach. Learn. 2001, 45, 5–32. [Google Scholar] [CrossRef]
- Pedregosa, F.; Varoquaux, G.; Gramfort, A.; Michel, V.; Thirion, B.; Grisel, O.; Blondel, M.; Prettenhofer, P.; Weiss, R.; Dubourg, V.; et al. Scikit-learn: Machine Learning in Python. J. Mach. Learn. Res. 2011, 12, 2825–2830. [Google Scholar]
- Hastie, T.; Tibshirani, R.; Friedman, J. The Elements of Statistical Learning. Data Mining, Inference, and Prediction; Springer Series in Statistics; Springer: New York, NY, USA, 2009. [Google Scholar]
- Virtanen, P.; Gommers, R.; Oliphant, T.E.; Haberland, M.; Reddy, T.; Cournapeau, D.; Burovski, E.; Peterson, P.; Weckesser, W.; Bright, J.; et al. SciPy 1.0: Fundamental Algorithms for Scientific Computing in Python. Nat. Methods 2020, 17, 261–272. [Google Scholar] [CrossRef] [PubMed]
- Sun, Q.; Zhang, R.; Liu, Y.; Niu, L.; Liu, H.; Ren, P.; Xu, B.; Guo, B.; Zhang, B. Insights into “wheat aroma”: Analysis of volatile components in wheat grains cultivated in saline–alkali soil. Food Res. Int. 2024, 183, 114211. [Google Scholar] [CrossRef] [PubMed]
- Tonks, A.J.; Roberts, J.M.; Midthassel, A.; Pope, T. Exploiting volatile organic compounds in crop protection: A systematic review of 1-octen-3-ol and 3-octanone. Ann. Appl. Biol. 2023, 183, 121–134. [Google Scholar] [CrossRef]
- Becker, E.M.; Herrfurth, C.; Irmisch, S.; Köllner, T.G.; Feussner, I.; Karlovsky, P.; Splivallo, R. Infection of Corn Ears by Fusarium spp. Induces the Emission of Volatile Sesquiterpenes. J. Agric. Food Chem. 2014, 62, 5226–5236. [Google Scholar] [CrossRef] [PubMed]
- Boeker, P. On ‘Electronic Nose’ methodology. Sens. Actuators B Chem. 2014, 204, 2–17. [Google Scholar] [CrossRef]
- Ferrigo, D.; Raiola, A.; Causin, R. Fusarium Toxins in Cereals: Occurrence, Legislation, Factors Promoting the Appearance and Their Management. Molecules 2016, 21, 627. [Google Scholar] [CrossRef] [PubMed]
- Desjardins, A.E. Fusarium mycotoxins: Chemistry, Genetics, and Biology; American Phytopathological Society (APS Press): Peoria, IL, USA, 2006. [Google Scholar]
- Witte, T.E.; Hicks, C.; Hermans, A.; Shields, S.; Overy, D.P. Debunking the Myth of Fusarium poae T-2/HT-2 Toxin Production. J. Agric. Food Chem. 2024, 72, 3949–3957. [Google Scholar] [CrossRef] [PubMed]
- Morcia, C.; Tumino, G.; Ghizzoni, R.; Badeck, F.; Lattanzio, V.; Pascale, M.; Terzi, V. Occurrence of Fusarium langsethiae and T-2 and HT-2 Toxins in Italian Malting Barley. Toxins 2016, 8, 247. [Google Scholar] [CrossRef]
- Janik, E.; Niemcewicz, M.; Podogrocki, M.; Ceremuga, M.; Stela, M.; Bijak, M. T-2 Toxin—The Most Toxic Trichothecene Mycotoxin: Metabolism, Toxicity, and Decontamination Strategies. Molecules 2021, 26, 6868. [Google Scholar] [CrossRef]
- Wu, Q.; Dohnal, V.; Huang, L.; Kuča, K.; Yuan, Z. Metabolic pathways of trichothecenes. Drug Metab. Rev. 2010, 42, 250–267. [Google Scholar] [CrossRef] [PubMed]
- Karlovsky, P.; Suman, M.; Berthiller, F.; De Meester, J.; Eisenbrand, G.; Perrin, I.; Oswald, I.P.; Speijers, G.; Chiodini, A.; Recker, T.; et al. Impact of food processing and detoxification treatments on mycotoxin contamination. Mycotoxin Res. 2016, 32, 179–205. [Google Scholar] [CrossRef] [PubMed]
- Lindblad, M.; Gidlund, A.; Sulyok, M.; Börjesson, T.; Krska, R.; Olsen, M.; Fredlund, E. Deoxynivalenol and other selected Fusarium toxins in Swedish wheat—Occurrence and correlation to specific Fusarium species. Int. J. Food Microbiol. 2013, 167, 284–291. [Google Scholar] [CrossRef]
- Stepień, Ł.; Jestoi, M.; Chełkowski, J. Cyclic hexadepsipeptides in wheat field samples and esyn1 gene divergence among enniatin producing Fusarium avenaceum strains. World Mycotoxin J. 2013, 6, 399–410. [Google Scholar] [CrossRef]
- Tittlemier, S.A.; Roscoe, M.; Trelka, R.; Gaba, D.; Chan, J.M.; Patrick, S.K.; Sulyok, M.; Krska, R.; McKendry, T.; Gräfenhan, T. Fusarium Damage in Small Cereal Grains from Western Canada. 2. Occurrence of Fusarium Toxins and Their Source Organisms in Durum Wheat Harvested in 2010. J. Agric. Food Chem. 2013, 61, 5438–5448. [Google Scholar] [CrossRef]
- Ezekiel, C.; Bandyopadhyay, R.; Sulyok, M.; Warth, B.; Krska, R. Fungal and bacterial metabolites in commercial poultry feed from Nigeria. Food Addit. Contam. Part A 2012, 29, 1288–1299. [Google Scholar] [CrossRef] [PubMed]
- Jarolim, K.; Wolters, K.; Woelflingseder, L.; Pahlke, G.; Beisl, J.; Puntscher, H.; Braun, D.; Sulyok, M.; Warth, B.; Marko, D. The secondary Fusarium metabolite aurofusarin induces oxidative stress, cytotoxicity and genotoxicity in human colon cells. Toxicol. Lett. 2018, 284, 170–183. [Google Scholar] [CrossRef] [PubMed]
- Křížová, L.; Dadáková, K.; Dvořáčková, M.; Kašparovský, T. Feedborne Mycotoxins Beauvericin and Enniatins and Livestock Animals. Toxins 2021, 13, 32. [Google Scholar] [CrossRef]
- Taevernier, L.; Veryser, L.; Roche, N.; Peremans, K.; Burvenich, C.; Delesalle, C.; De Spiegeleer, B. Human skin permeation of emerging mycotoxins (beauvericin and enniatins). J. Expo. Sci. Environ. Epidemiol. 2015, 26, 277–287. [Google Scholar] [CrossRef]
- Sotnichenko, A.; Pantsov, E.; Shinkarev, D.; Okhanov, V. Hydrophobized Reversed-Phase Adsorbent for Protection of Dairy Cattle against Lipophilic Toxins from Diet. Efficiensy In Vitro and In Vivo. Toxins 2019, 11, 256. [Google Scholar] [CrossRef]
- Inbaia, S.; Farooqi, A.; Ray, R.V. Aggressiveness and mycotoxin profile of Fusarium avenaceum isolates causing Fusarium seedling blight and Fusarium head blight in UK malting barley. Front. Plant Sci. 2023, 14, 1121553. [Google Scholar] [CrossRef] [PubMed]
- Laraba, I.; Busman, M.; Geiser, D.M.; O’Donnell, K. Phylogenetic Diversity and Mycotoxin Potential of Emergent Phytopathogens within the Fusarium tricinctum Species Complex. Phytopathology® 2022, 112, 1284–1298. [Google Scholar] [CrossRef] [PubMed]
- Dinolfo, M.I.; Stenglein, S.A. Fusarium poae and mycotoxins: Potential risk for consumers. Bol. Soc. Argent. Bot. 2014, 49, 5–20. [Google Scholar] [CrossRef]
- Kahla, A.; Verheecke-Vaessen, C.; Delpino-Deelias, M.; Gutierrez-Pozo, M.; Medina, A.; Magan, N.; Doohan, F. Acclimatisation of Fusarium langsethiae, F. poae and F. sporotrichioides to elevated CO2: Impact on fungal growth and mycotoxin production on oat-based media. Int. J. Food Microbiol. 2023, 394, 110176. [Google Scholar] [CrossRef] [PubMed]
- Girotti, J.; Malbrán, I.; Lori, G.; Juarez, M. Use of solid phase microextraction coupled to capillary gas chromatography-mass spectrometry for screening Fusarium spp. based on their volatile sesquiterpenes. World Mycotoxin J. 2010, 3, 121–128. [Google Scholar] [CrossRef]
- Jiang, C.-X.; Li, J.; Zhang, J.-M.; Jin, X.-J.; Yu, B.; Fang, J.-G.; Wu, Q.-X. Isolation, Identification, and Activity Evaluation of Chemical Constituents from Soil Fungus Fusarium avenaceum SF-1502 and Endophytic Fungus Fusarium proliferatum AF-04. J. Agric. Food Chem. 2009, 67, 1839–1846. [Google Scholar] [CrossRef]
- Erler, A.; Riebe, D.; Beitz, T.; Löhmannsröben, H.G.; Grothusheitkamp, D.; Kunz, T.; Methner, F.J. Detection of volatile organic compounds in the headspace above mold fungi by GC-soft X-radiation–based APCI-MS. J. Mass Spectrom. 2018, 53, 911–920. [Google Scholar] [CrossRef]


Disclaimer/Publisher’s Note: The statements, opinions and data contained in all publications are solely those of the individual author(s) and contributor(s) and not of MDPI and/or the editor(s). MDPI and/or the editor(s) disclaim responsibility for any injury to people or property resulting from any ideas, methods, instructions or products referred to in the content. |
© 2024 by the authors. Licensee MDPI, Basel, Switzerland. This article is an open access article distributed under the terms and conditions of the Creative Commons Attribution (CC BY) license (https://creativecommons.org/licenses/by/4.0/).