Article

Nitrogen Reduction and Organic Fertiliser Application Benefits Growth, Yield, and Economic Return of Cotton

Agriculture Department, Shihezi University, Shihezi 832003, China
*
Author to whom correspondence should be addressed.
Agriculture 2024, 14(7), 1073; https://doi.org/10.3390/agriculture14071073
Submission received: 30 May 2024 / Revised: 1 July 2024 / Accepted: 1 July 2024 / Published: 3 July 2024

Abstract

:
The application of excessive nitrogen fertiliser has been found to have a detrimental impact on the growth and development of cotton in Xinjiang, China. This has resulted in a reduction in cotton yield and economic benefit. The aim of this study was to investigate the potential for reducing the input of inorganic N fertiliser while maintaining the quality and yield formation of cotton. The objective of this study was to examine the growth, photosynthesis, and yield of cotton crops subjected to varying fertiliser treatments. The experiment was conducted in 2021–2022 with eight treatments in the experiment: no fertiliser (CK); conventional application of inorganic nitrogen fertiliser (T0); T1–T3, with 8%, 16%, and 24% reduction in inorganic nitrogen fertiliser application, respectively; and T4–T6, with organic fertilisers replacing the reduced inorganic nitrogen fertiliser application of T1–T3, respectively. In comparison to T0, T5 demonstrated the most notable agronomical performance and yield components across both years. This is attributable to the spatial distribution of cotton bolls, which was more conducive to the net photosynthetic rate and yield formation. This, in turn, led to an augmented photosynthetic capacity, enhanced biomass accumulation, and an elevated harvesting index. The results of the economic benefit analysis demonstrated that in comparison to the control treatment (T0), the net profit of all treatments except T3 increased. In conclusion, the economic benefit reached its maximum in the range of a 9.90–14.10% reduction in nitrogen and a 16.60–17.60% substitution of organic fertiliser.

1. Introduction

Xinjiang is China’s largest cotton growing region, and accounts for more than 84% of the country’s cultivated area and for more than 90% of its total production [1,2]. Findings have revealed that the application of nitrogen fertiliser can enhance cotton yield by a significant 8.75% to 70.38%, with a mean increase of 31.89% [3]. Consequently, the prevalent perception is that a proportional rise in fertiliser dosage leads to a proportional increase in crop yield, which may not necessarily align with the reality [4].The amount of nitrogen fertiliser used has increased year by year, reaching 360 kg·ha−1 in Xinjiang [5,6]. The application of high-nitrogen fertilisers has not resulted in a significant increase in yield. Instead, it has led to the waste of resources, which in turn has caused a stagnation of cotton growth, prolonged maturity, and reduced productivity [7,8]. This has ultimately affected the yield and quality of the crop. Studies have demonstrated that insufficient nitrogen levels may result in a reduction in nitrogen fertiliser utilisation efficiency and boll yield [9]. Conversely, high nitrogen levels have been shown to reduce the photosynthetic rate and nitrogen fertiliser utilisation efficiency [10]. The application of excessive quantities of nitrogen fertiliser does not only result in a reduced crop yield but also leads to a deterioration in the quality of the soil [11]. Therefore, optimizing the application amount of nitrogen fertiliser can not only ensure the yield of crops but also reduce the application of nitrogen fertiliser, protect the environment, and save resources.
Organic fertiliser application has become a common method of increasing the productivity of a range of crops. A considerable body of research has demonstrated that organic fertilisers can positively impact the physicochemical properties of agricultural soils, enhancing soil microbial activity and promoting soil fertility, which in turn enhances yield potential in crops [12,13,14]. Nevertheless, the low nutrient content and slow release of nitrogen from organic fertilisers have some disadvantages compared to chemical fertilisers. Consequently, the utilisation of organic fertilisers in isolation may not be adequate for the fulfilment of the nutritional requirements of plants and the satisfaction of daily agricultural production needs [15]. The application of organic fertiliser with chemical fertiliser is an important measure to reduce the application of nitrogen fertiliser and improve its utilization rate. Many studies have demonstrated that the combination of chemical and organic fertilisers has the potential to optimise nutrient utilisation, promote crop productivity, and contribute to sustainable agricultural development [16,17].
In current research, there are more studies on cotton yield and formation factors in Xinjiang, but fewer analyses on the comprehensive impact of reducing inorganic nitrogen fertiliser (Nmin reduction) by replacing it with organic fertiliser on cotton growth and yield in Xinjiang. In order to protect the cotton yield, reduce the use of chemical fertilisers, and further enhance the development of the cotton industry, it is necessary to implement measures to protect the cotton yield. In pursuit of this objective, we examined the impact of the Nmin reduction and the application of organic fertilisers on cotton photosynthetic characteristics, yield components, and nitrogen economic efficiency. The aim was to elucidate the response of cotton growth and development to the Nmin reduction and organic fertilisation. The findings of this study provide theoretical support and practical guidance for the rational regulation of nitrogen to take advantage of the sustainable development of cotton fields in Xinjiang.
The hypotheses of this study were as follows: (1) the substitution of a moderate amount of inorganic nitrogen fertiliser for organic fertiliser can improve cotton growth, (2) the substitution of inorganic nitrogen fertiliser for organic fertiliser can significantly improve cotton photosynthesis, (3) the substitution of inorganic nitrogen fertiliser for organic fertiliser can improve cotton yield and economic efficiency.

2. Materials and Methods

2.1. Biological Material and Field Experiment

The experiment was conducted between April 2021 and October 2022 at the cotton continuous cropping experimental field in Erlian, College of Agriculture, Shihezi University (43°26′–45°20′ N, 84°58′–86°24′ E, 412 m above sea level). The basic physical and chemical properties of 0–30 cm of soil before sowing in 2021 and 2022 are shown in Table 1.
The experiment was a randomised block design with eight treatments: no fertiliser (CK); conventional application of inorganic nitrogen fertiliser (T0); T1–T3, with 8%, 16%, and 24% reduction in inorganic nitrogen fertiliser application, respectively; and T4–T6, with organic fertilisers replacing the reduced inorganic nitrogen fertiliser application of T1–T3, respectively. The specific fertiliser application amounts are shown in Table 2. Each treatment was repeated 3 times, with a total of 24 cells, each with an area of 46 m2 (4.6 × 10 m). Under-film drip irrigation was used; a film of 3 tubes and 6 wide and narrow rows were planted with row spacing of 66 cm + 10 cm and plant spacing of 10 cm. All organic fertilisers were applied simultaneously, then ploughed after uniform application to a depth of 20–25 cm. All nitrogen, phosphorus. and potash fertilisers were applied exclusively at the bud and boll stage of cotton, with the same amount of fertiliser applied annually. The tested cotton variety was “Huiyuan 720”. Urea (containing N 46%), mono-ammonium phosphate (containing N 12%, containing P2O5 60%), potassium sulphate (containing K2O 51%), and a sheep manure-based commercial organic fertiliser (containing N 4%) were selected for the test. During the growth period, the total irrigation amount was 4500 m3·hm−2, and the irrigation period was 7 to 10 days. The experiment was sown on 25 April 2021 and 13 April 2022, with a theoretical sowing density of 260,000 plants·hm−2. Manual topping was performed on 7 July 2021 and 2 July 2022. Other field management measures were consistent with field production.

2.2. Sampling and Measurement

2.2.1. Agronomic Trait

The agronomic traits included plant height, stem thickness, the number of fruiting branch stands, and the leaf area. In 2021 and 2022, five consecutive cotton plants with representative and uniform growth were randomly selected from each treatment plot at the following stages: full bud (23 June, 18 June), full squaring (18 July, 2 July), peak boll (27 July, 15 July), and boll opening (18 September, 3 September). The plant height was then measured from the cotyledonary node to the top of the main stem. The height of the main stem was measured with a tape measure, and the stem thickness was determined using Vernier callipers, with readings taken at the top, middle, and bottom of the stem. The number of fruiting branches was counted, and the leaf area of a single cotton plant was determined using an LI-3100C (LI-COR: Lincoln, NE, USA) digital leaf area meter. The leaf area index (LAI) was calculated. The procedure was repeated three times, and the mean value was determined.
The leaf area index (LAI) was calculated as the product of the leaf area per plant and the number of plants per unit area, divided by the unit land area.

2.2.2. Photosynthetic Performance

The photosynthetic performance of the cotton plants was evaluated by measuring the leaf net photosynthesis rate (Pn) and chlorophyll content. The chlorophyll SPAD values of the functional leaves were determined manually using a handheld SPAD-502 (Minolta Camera Co., Ltd., Osaka, Japan) chlorophyll meter at the bud, squaring, boll and boll-opening stages. Five plants were selected from each plot, and the chlorophyll content of each leaf was measured 10 times to obtain an average value. The net photosynthetic rate (Pn, μmol·m−2·s−1) of cotton functional leaves (four fully expanded leaves with the main stem inverted before topping, and three fully expanded leaves with the main stem inverted after topping) was determined with a Li-6400 (Licor Biosciences, Lincoln, NE, USA) photosynthesizer at the aforementioned fertility periods. The net photosynthetic rate (Pn, μmol·m−2·s−1) of individual leaves was calculated for different plant parts by averaging three measurement readings from five uniformly growing plants within each plot over the course of a period between 11:00 and 13:00 a.m.

2.2.3. Spatial Distribution of Cotton Bolls

On 18 September 2021 and 3 September 2022, five consecutive cotton plants with uniform growth were selected from each plot at the early boll-opening stage. The objective was to investigate the total number of bolls per plant and the horizontal and vertical distribution of bolls. The horizontal distribution is the number of inner circumference bolls (the bolls of the first fruit node on each fruiting branch) and peripheral bolls (the bolls of the second fruit node and above). The longitudinal distribution refers to the number of lower bolls (bolls on the first to third fruiting branches), middle bolls (bolls on the fourth to sixth fruiting branches) and upper bolls (bolls on the seventh fruiting branch and above).

2.2.4. Measure Yield

Three cotton plants exhibiting uniform and continuous growth were selected in each plot at the full bud, full squaring, peak boll, and boll-opening stages. The cotton was partially decomposed according to the stem, leaf, bud, flower, and boll stages. The cotton was subjected to a 105 °C defoliation process for a period of 30 min, followed by a drying phase at 80 °C until a constant weight was achieved. The dry matter mass was then recorded. During the boll-opening stage, 20 consecutive cotton plants with uniform growth were selected in each plot to count the boll number per plant and obtain the average value. A total of 100 bolls were collected from cotton plants in each plot, dried and weighed, and divided by the total number of bolls to calculate the cotton yield per plot.
In order to ascertain the yield, all seed cotton within a 1 m2 area of each plot was collected, dried, and weighed on three separate occasions.

2.2.5. Economic Analysis

The partial budget method was employed in order to assess the economic efficiency of cotton production. For the sake of simplicity, it was assumed that the primary objective of cotton growers was to minimise nitrogen fertiliser inputs in order to achieve a greater yield. Thus, the cost per treatment was limited to the cost of fertiliser (urea, commercial organic fertiliser based on sheep manure) inputs and fixed costs, which were estimated to cost about RMB 2800 and 800 per tonne of urea and commercial organic fertiliser based on sheep manure, respectively. Fixed costs, which included cotton seed, pesticides, labour and machinery costs, were estimated to be about RMB 27,000 per hectare. Revenue was derived mainly from the sale of mechanically harvested cotton.
The formula for calculating the economic benefit (net profit) was as follows: economic efficiency (net benefit) = total revenue − cost.

2.3. Statistical Analysis

The data were processed using WPS Office (11.1.0.10577) and plotted using Origin 2022 (v.9.9.0.225). A series of comparisons (LSD method) were conducted between the means of different treatments to ascertain whether there was a statistically significant difference between the treatments at the 0.05 probability level across different time periods. The impact of the various treatments on the indexes at different time points was evaluated using one-way and multifactorial ANOVA (p < 0.05) to ascertain whether the quantity of nitrogen fertiliser applied, the year and the interaction between the two influenced the composition of cotton yield. Pearson’s correlation analysis was employed to investigate the relationship between photosynthesis and yield, pure N application under inorganic N fertiliser, and between seed cotton yield and pure N application under inorganic N fertiliser and organic fertiliser replacement.

3. Results

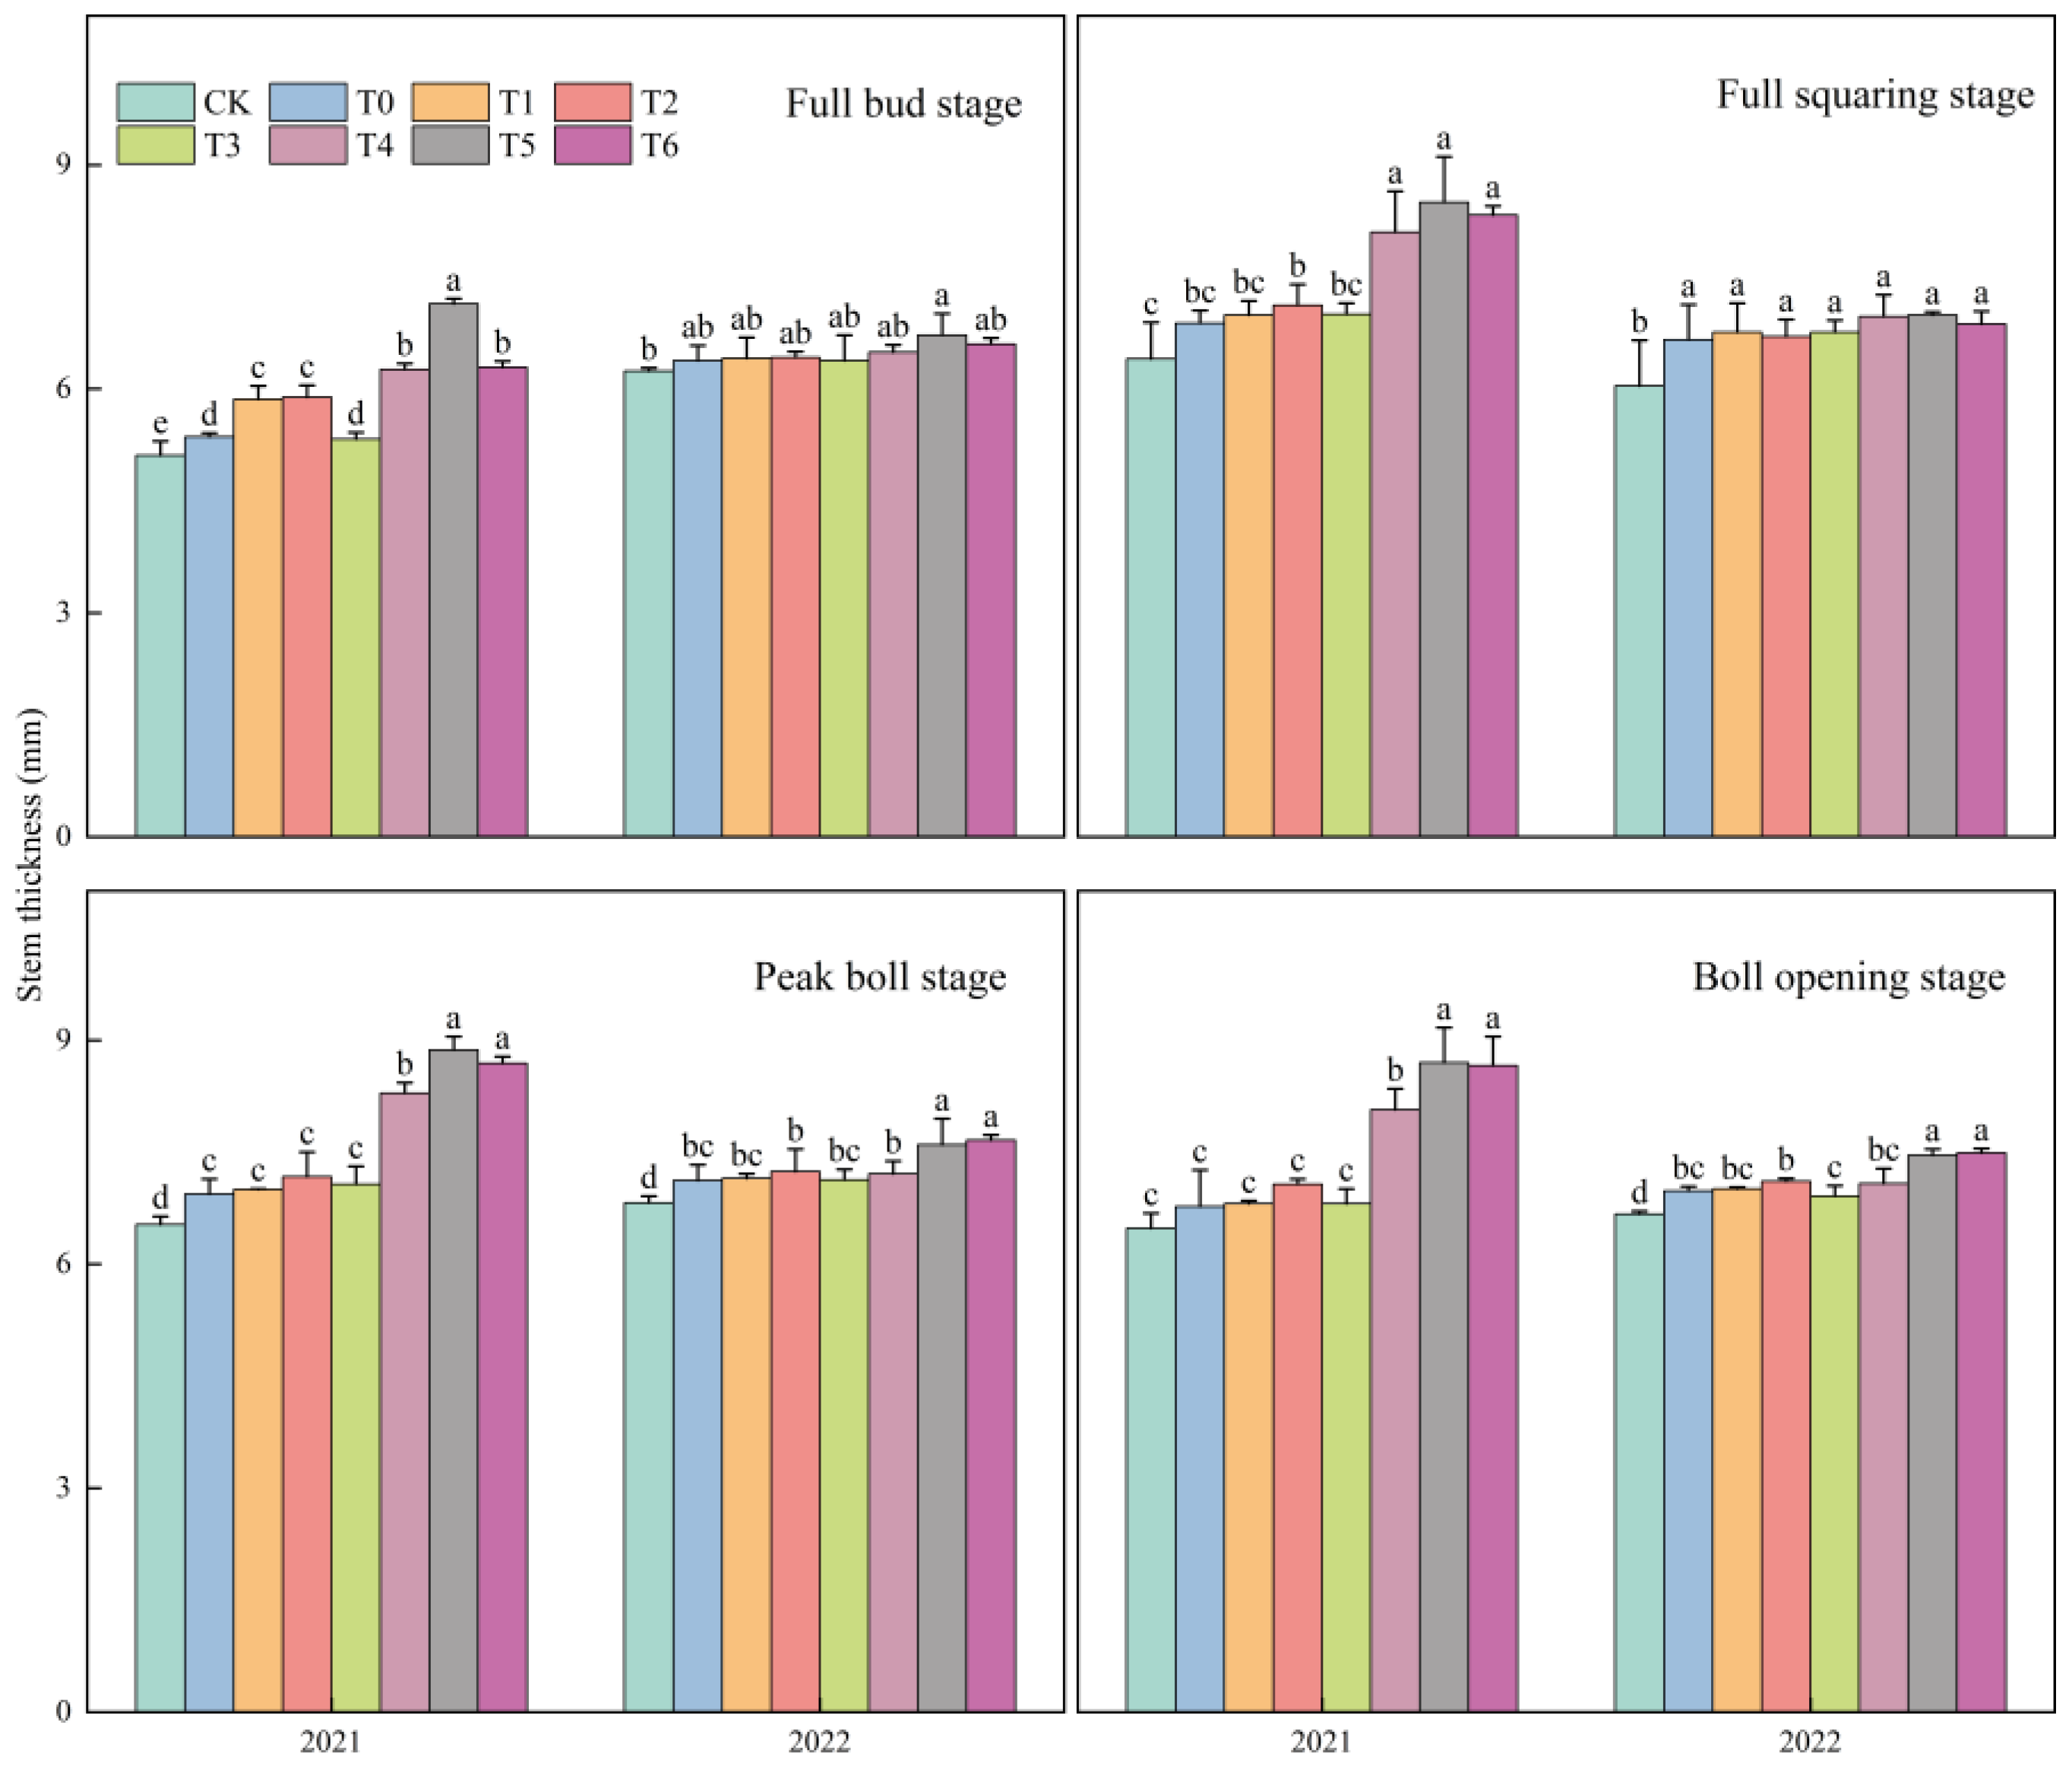
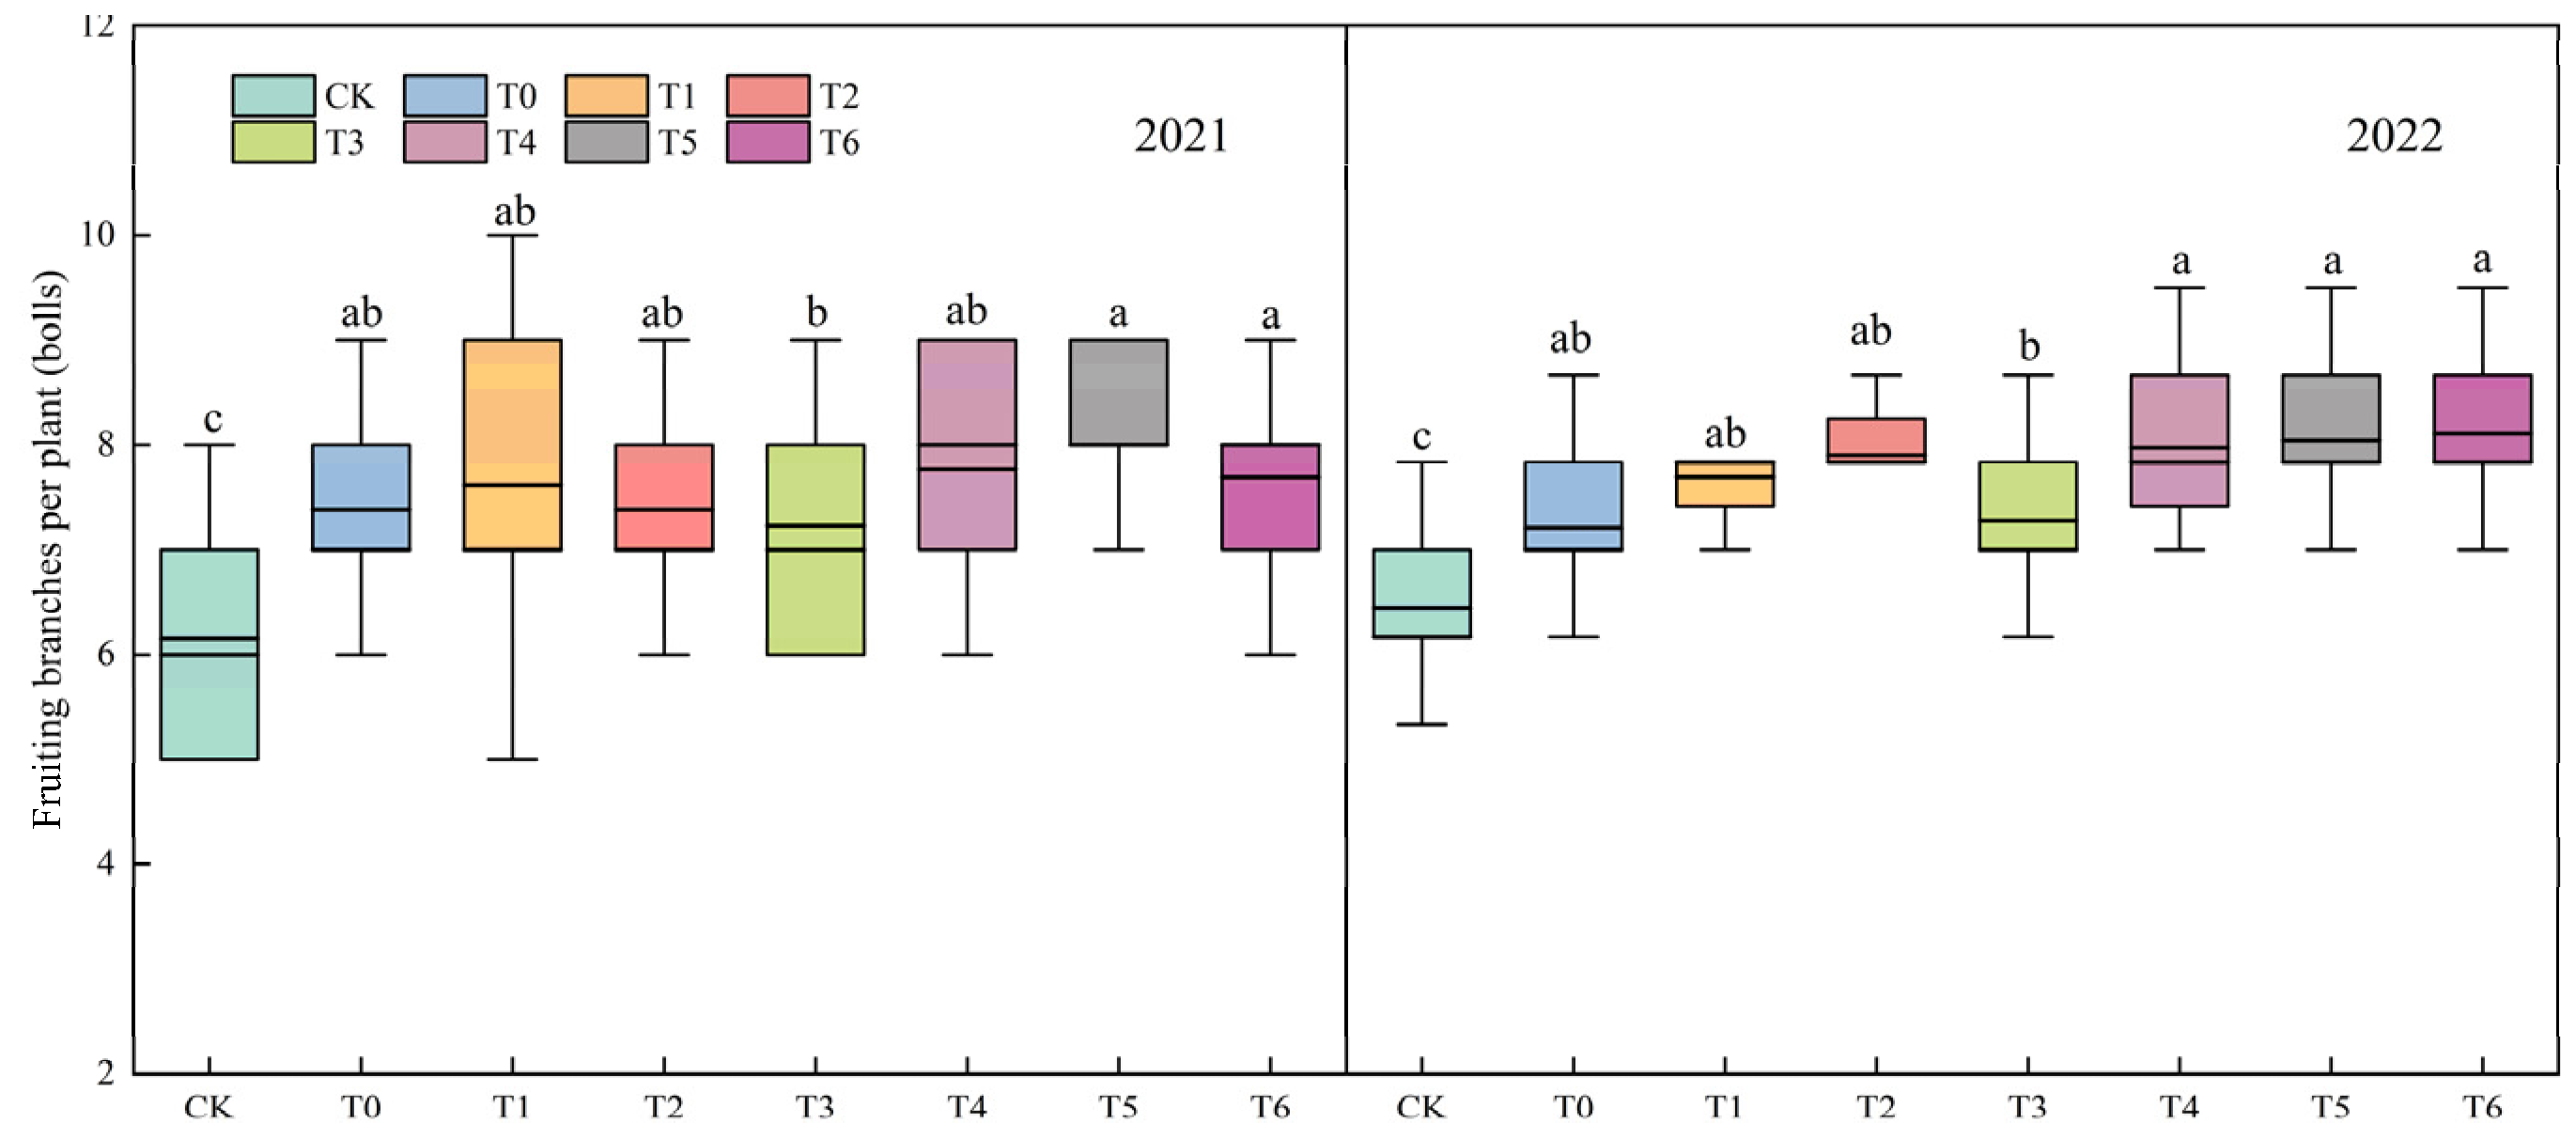
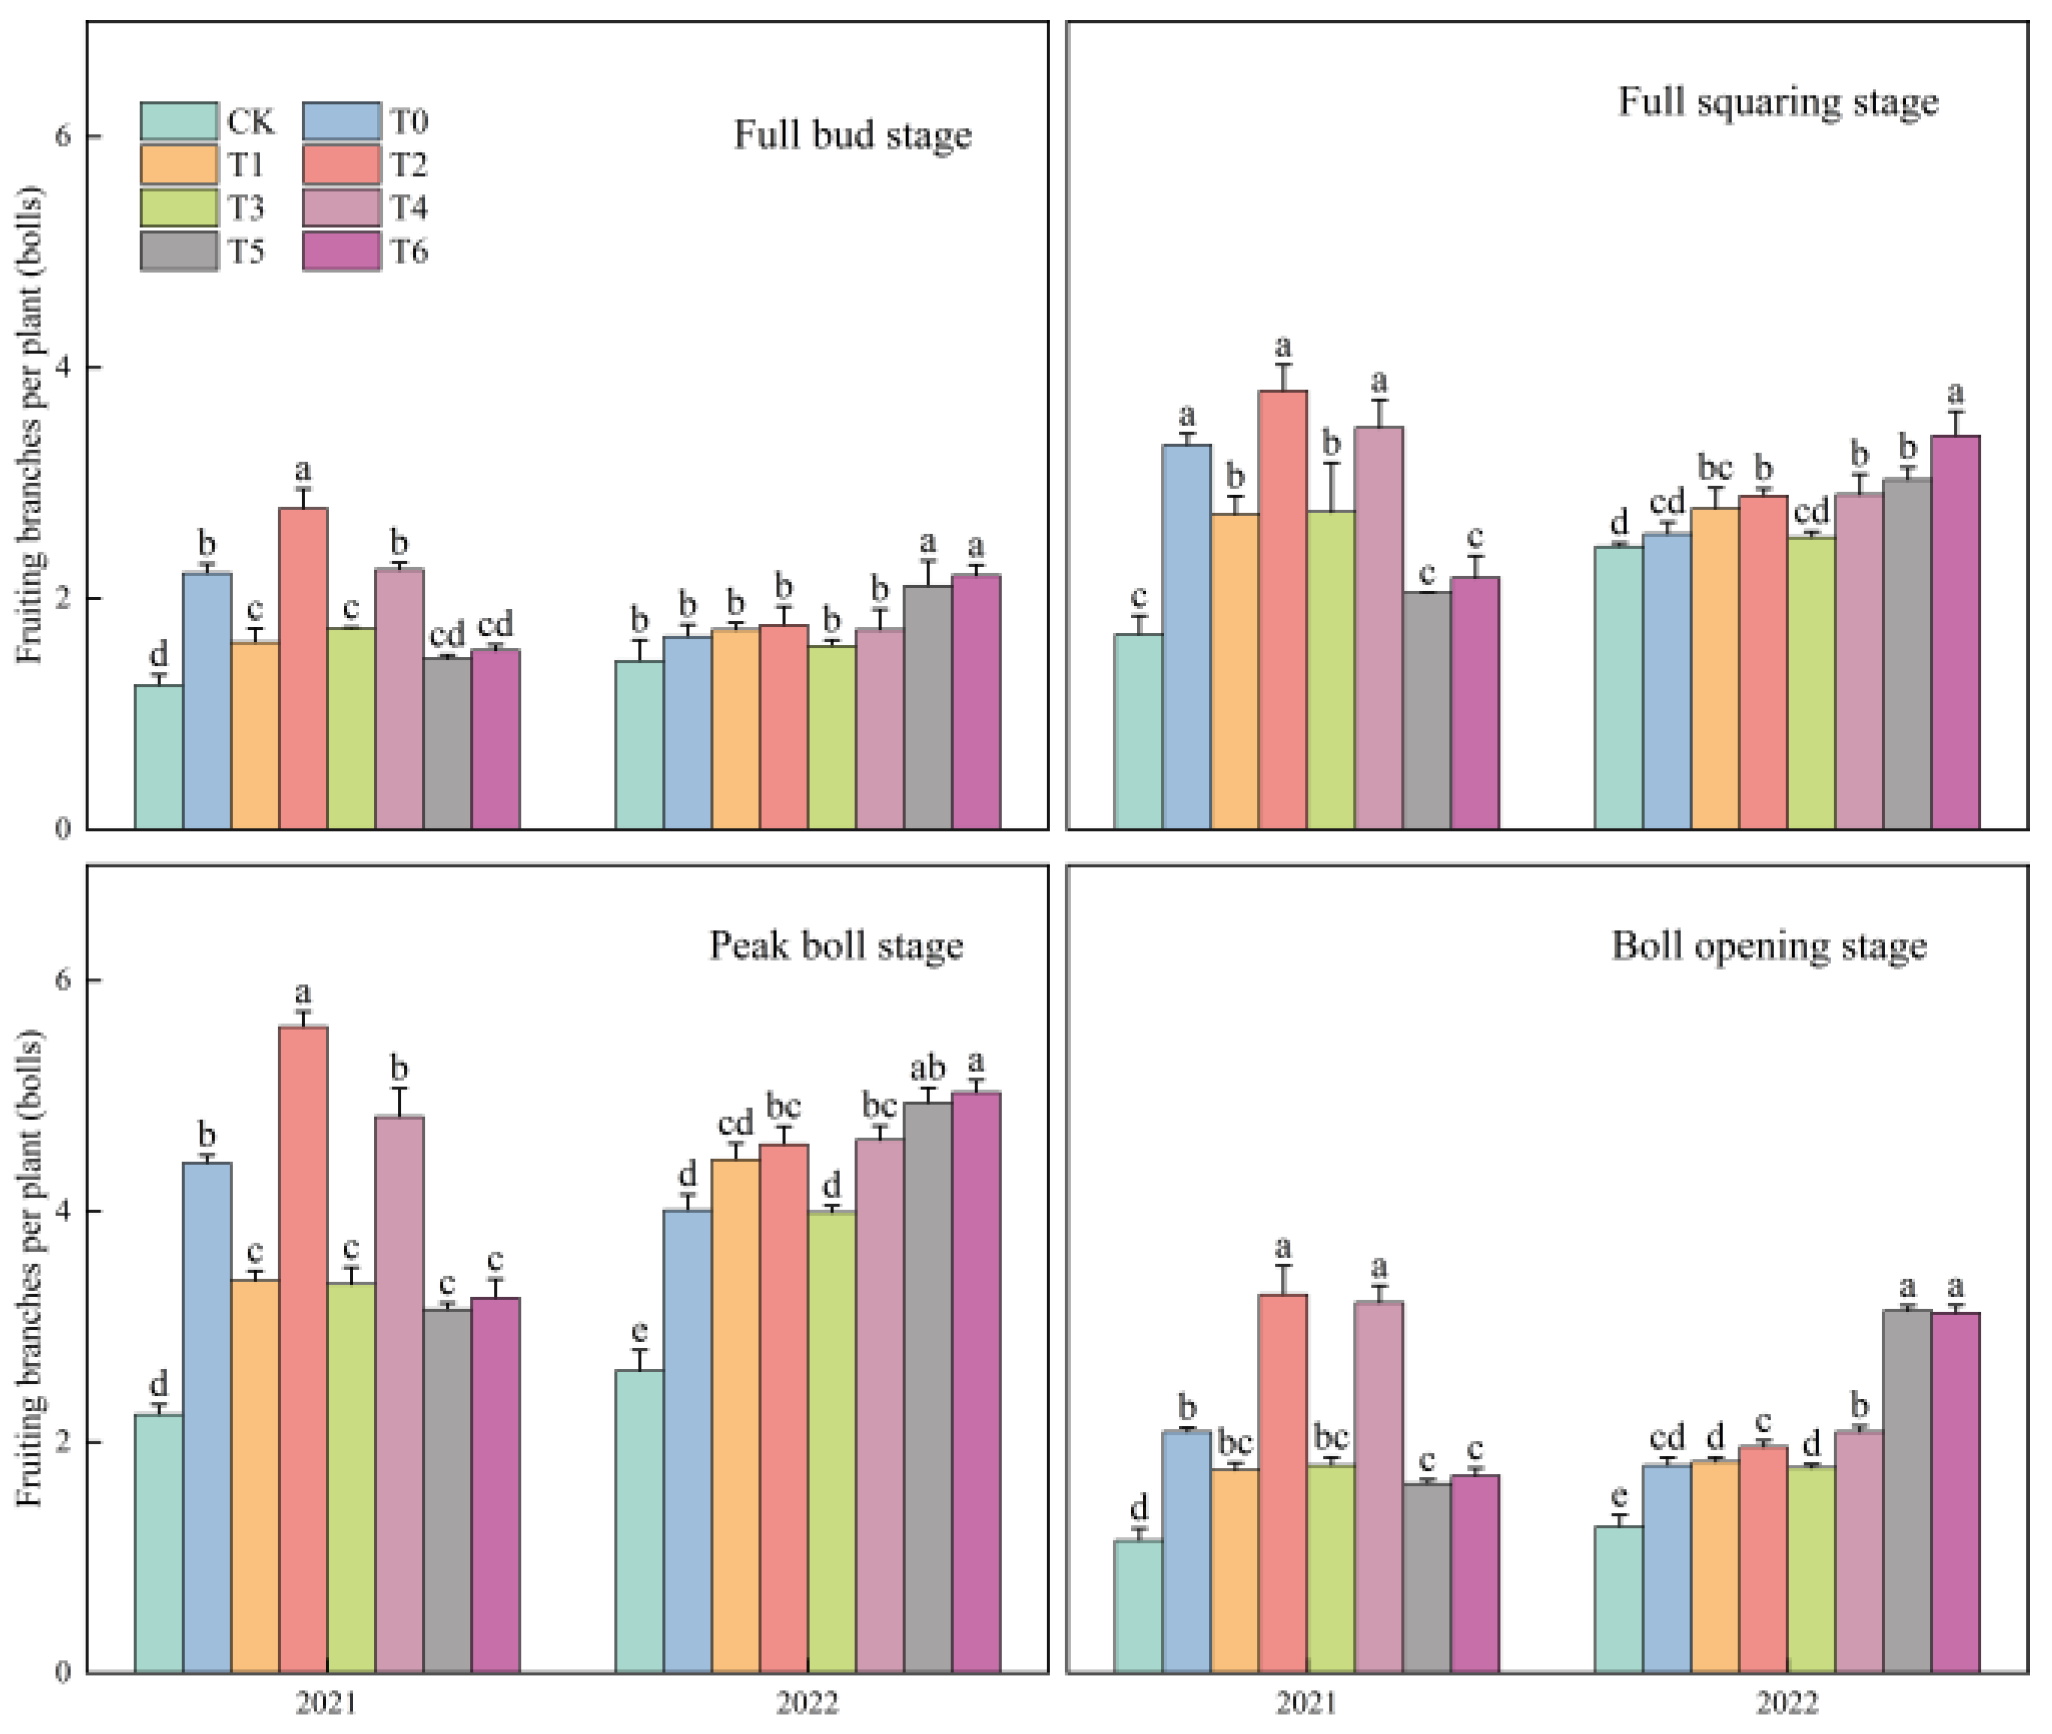
3.1. Changes in Agronomic Traits

The alterations in plant height observed under the influence of different treatments are illustrated in Figure 1. In 2021 and 2022, the height of cotton plants reached its maximum during the boll stage, with a range of 66.47–72.37 cm and 56.37–59.33 cm, respectively. In 2021, the height of cotton plants in each fertility period with the reduction in nitrogen fertiliser application and the proportion of Nmin reduction replaced with organic fertiliser showed a trend of increase and then decline; the inflection point was observed in the T2 and T5 treatments, respectively. The height of cotton plants under the Nmin reduction replacement with organic fertiliser treatment was found to be higher than that under the Nmin reduction treatment and also higher than that under the T0 and CK treatments. There were no significant differences between the T0 and T3 treatments at the full bud, full flower, and full boll stages, and between the T5 and T6 treatments. However, the values for T2, T4, T5, and T6 treatments were significantly higher than that for the T0 treatment. Furthermore, the T5 treatment at the full boll stage exhibited a higher value than the T6, T4, and T0 treatments, with increases of 0.93, 2.22, and 8.88%, respectively. The T2 treatment demonstrated a statistically higher value of 4.86% compared to T0. The nitrogen treatments in 2022 exhibited no insignificant differences. At the full boll stage, T5 exhibited a 2.17%, 3.00%, and 3.49% higher nitrogen content than T6, T4, and T0, respectively.
From the analysis, it can be seen that the cotton stem thickness reached the maximum at the peak boll stage under the fertiliser treatments in 2021 and 2022, with variations ranging from 6.94 to 8.87 mm and 7.12 to 7.66 mm, respectively (Figure 2). In 2021, T2 was 9.89% and 10.51% higher than T0 and T3 in the full bud period under the reduced nitrogen application treatment, with no significant change observed in the other periods. In contrast, the cotton stem thickness in all reproductive periods under the reduced nitrogen with organic fertiliser treatment was T5 > T6 > T4 > T0. T5 exhibited 2.07%, 27.81%, 0.46%, and 28.51% higher values than T6 and T0 in the peak boll stage and the boll-opening stage, respectively. In 2022, the stem thickness of cotton at the full bud period and the full squaring stage remained unchanged. It was observed, however, that the peak boll stage exhibited a 69% increase and the boll-opening stage a 1.86% increase in comparison to the T0 treatment. The proportion of organic fertilisers did not result in a discernible change in the treatment. As the proportion of Nmin reduction and organic fertilisers increased, the stem thickness exhibited a continuous increase, with no discernible differences between T5 and T6. Nevertheless, at the peak boll stage, T6 exhibited a 0.79%, 6.24%, and 7.58% higher stem thickness than T5, T4, and T0, respectively.
In 2021 and 2022, the number of fruiting branches per plant at the boll-opening stage under different fertilizer treatments ranged from 6 to 8 and 7 to 10, respectively (Figure 3). The treatment with organic fertiliser exhibited a higher number of fruiting branches than the treatment with reduced nitrogen application and T0. In both 2021 and 2022, the number of fruiting branches per plant at T5, T6, T4, and T2 was found to be greater than that at T0, by 14.93, 14.93, 8.96, and 8.96%, respectively, in 2021, and by 11.11, 11.11, 11.11, 11.11, and 6.35%, respectively, in 2022.
In the years 2021 and 2022, the maximum leaf area index (LAI) of cotton was recorded at the peak boll stage in response to each fertiliser treatment, coinciding with the advancement of the reproductive period. In 2021, a reduction in the quantity of nitrogen fertiliser and an increase in the proportion of organic fertiliser resulted in an initial increase in the LAI before a subsequent decrease. Conversely, in 2022, the organic fertiliser treatments exhibited a consistent increase, with the exception of the boll-opening stage (Figure 4). The peak boll stage for the T1 and T2 treatments exhibited a higher cotton yield than the control treatment (T0) by 4.62%, 3.69%, 10.97%, and 14.21%, respectively. The LAI of the organic fertiliser treatments was found to be higher than that of T0, with the T6, T5, and T4 treatments exhibiting increases of 48.31%, 72.31%, and 36.00%, respectively, in comparison to T0 during the two-year period of the peak boll stage. Moreover, the leaf area index (LAI) at the boll-opening stage was markedly higher in the organic fertiliser treatments (T6, T5, and T4) than in the chemical fertiliser treatments alone (T0, T1, T2, T3) by more than 5%. In 2021, the LAI of the organic fertiliser treatments was 16.11% to 100.00% greater than that of the chemical fertiliser treatments. In 2022, the LAI of the organic fertiliser treatments was 6.63% to 76.40% greater than that of the chemical fertiliser treatments.

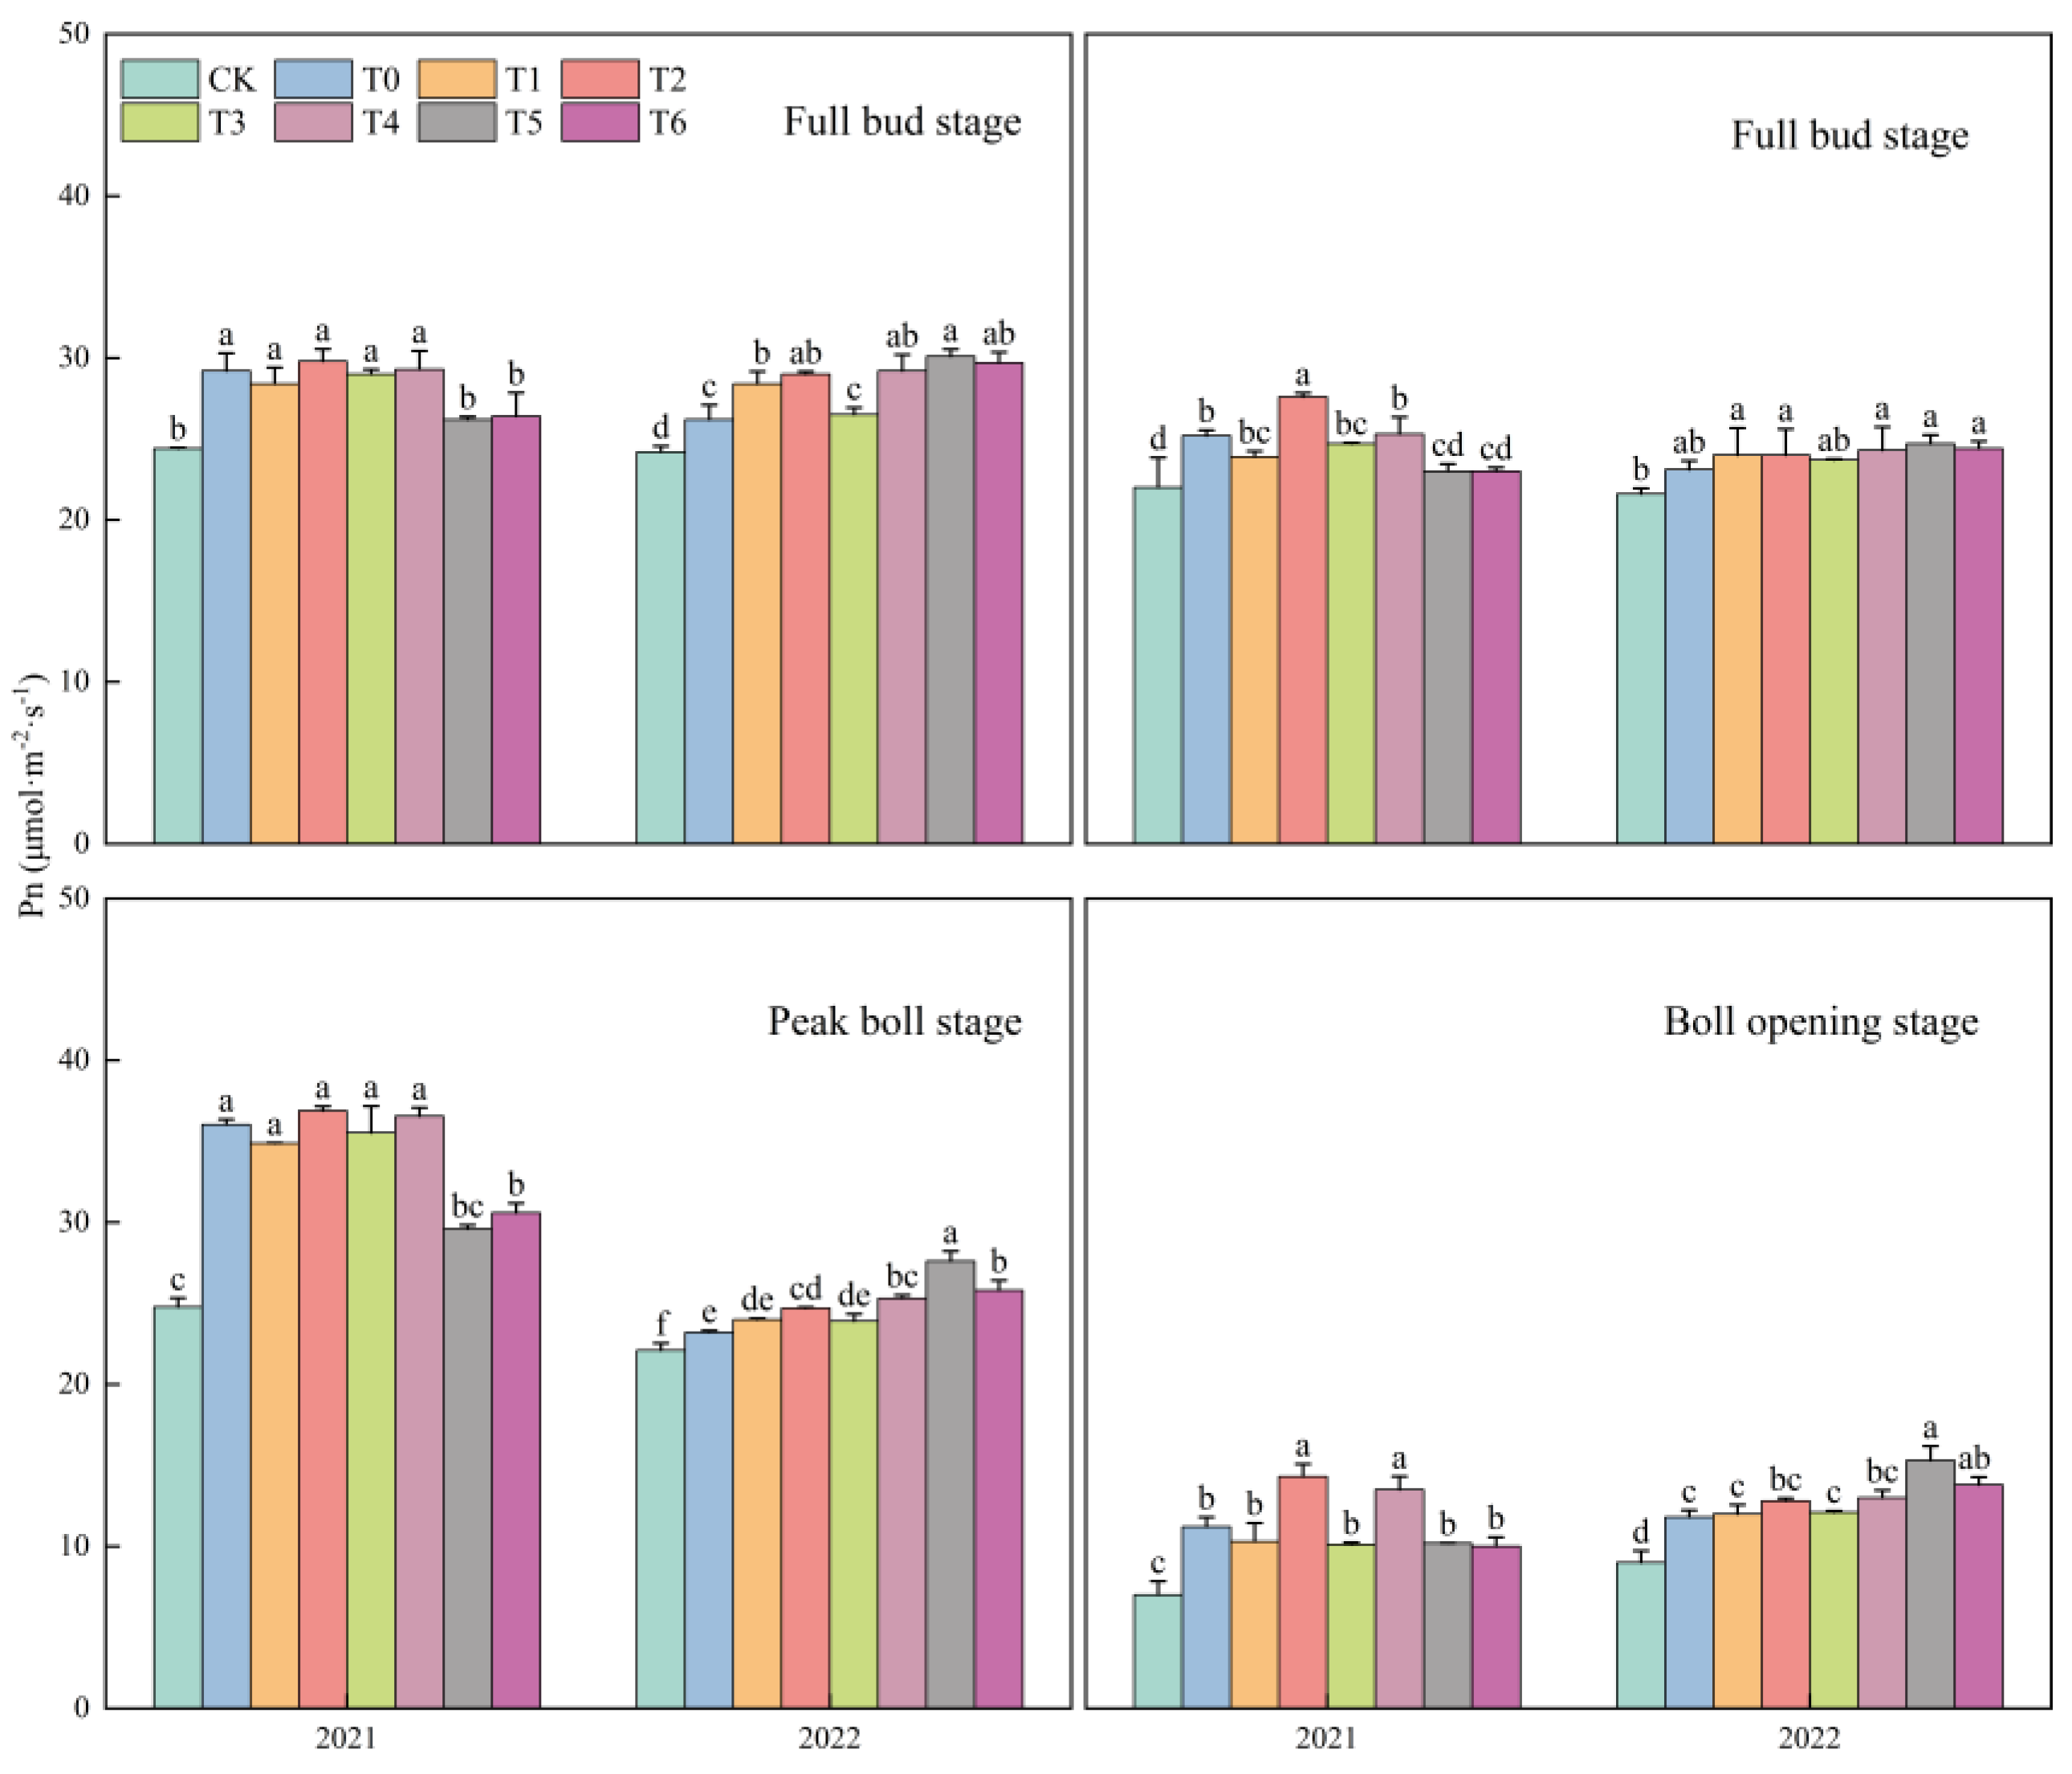
3.2. Changes in Photosynthetic Physiological Characteristics

The highest net photosynthesis rate (Pn) was observed in 2021 and 2022, at the full squaring stage and the peak boll stage, respectively. In 2021, Pn exhibited a decrease and subsequent increase in response to a reduction in inorganic nitrogen fertiliser application and an increase in the proportion of organic fertiliser dosed. In contrast, in 2022, Pn demonstrated a continuous increase (Figure 5). The T2 treatment exhibited a 16.01%, 1.72%, and 19.93% increase relative to the T0, T1, and T3 treatments, respectively, during the full squaring stage of 2021. Additionally, it demonstrated a 10.69%, 2.11%, and 9.43% enhancement compared to the peak boll stage of 2022. The disparities between the full squaring stage of 2021 and the peak boll stage of 2022 were not statistically significant among the T6, T5, and T4 treatments. However, the T2 treatment exhibited a 19% increase relative to the T6, T5, and T4 treatments during the peak boll stage of 2022. The percentage increase in cotton Pn at the boll-opening stage under the Nmin reduction and organic fertilizer treatment was 8.73% to 43.00% higher than that of T0 treatment, while the percentage increase in cotton Pn at the boll-opening stage under the Nmin reduction and organic fertiliser treatment was 1.56% to 29.67% higher than that of T0 treatment.
The fluctuation range of chlorophyll SPAD values under different fertilisation treatments during the entire life span of cotton was minimal. There were no discernible differences between the treatments of reduced nitrogen application and the treatments of reduced nitrogen with organic fertilisers. Furthermore, the changes were not statistically significant between the treatments in 2022. Similarly, there were no notable differences between the treatments in 2021. At the full bud stage, the peak boll stage, and the boll-opening stage, T2 exhibited higher values than T0 by 8.68%, 6.13%, and 6.42%, respectively. The T5 and T6 treatments exhibited increases of 9.28%, 9.63%, 12.45%, and 6.79% in 2021, respectively, and 7.53%, 5.14%, 4.73%, and 4.18% in 2022, in comparison to T0 at the peak boll stage and the boll-opening stage.

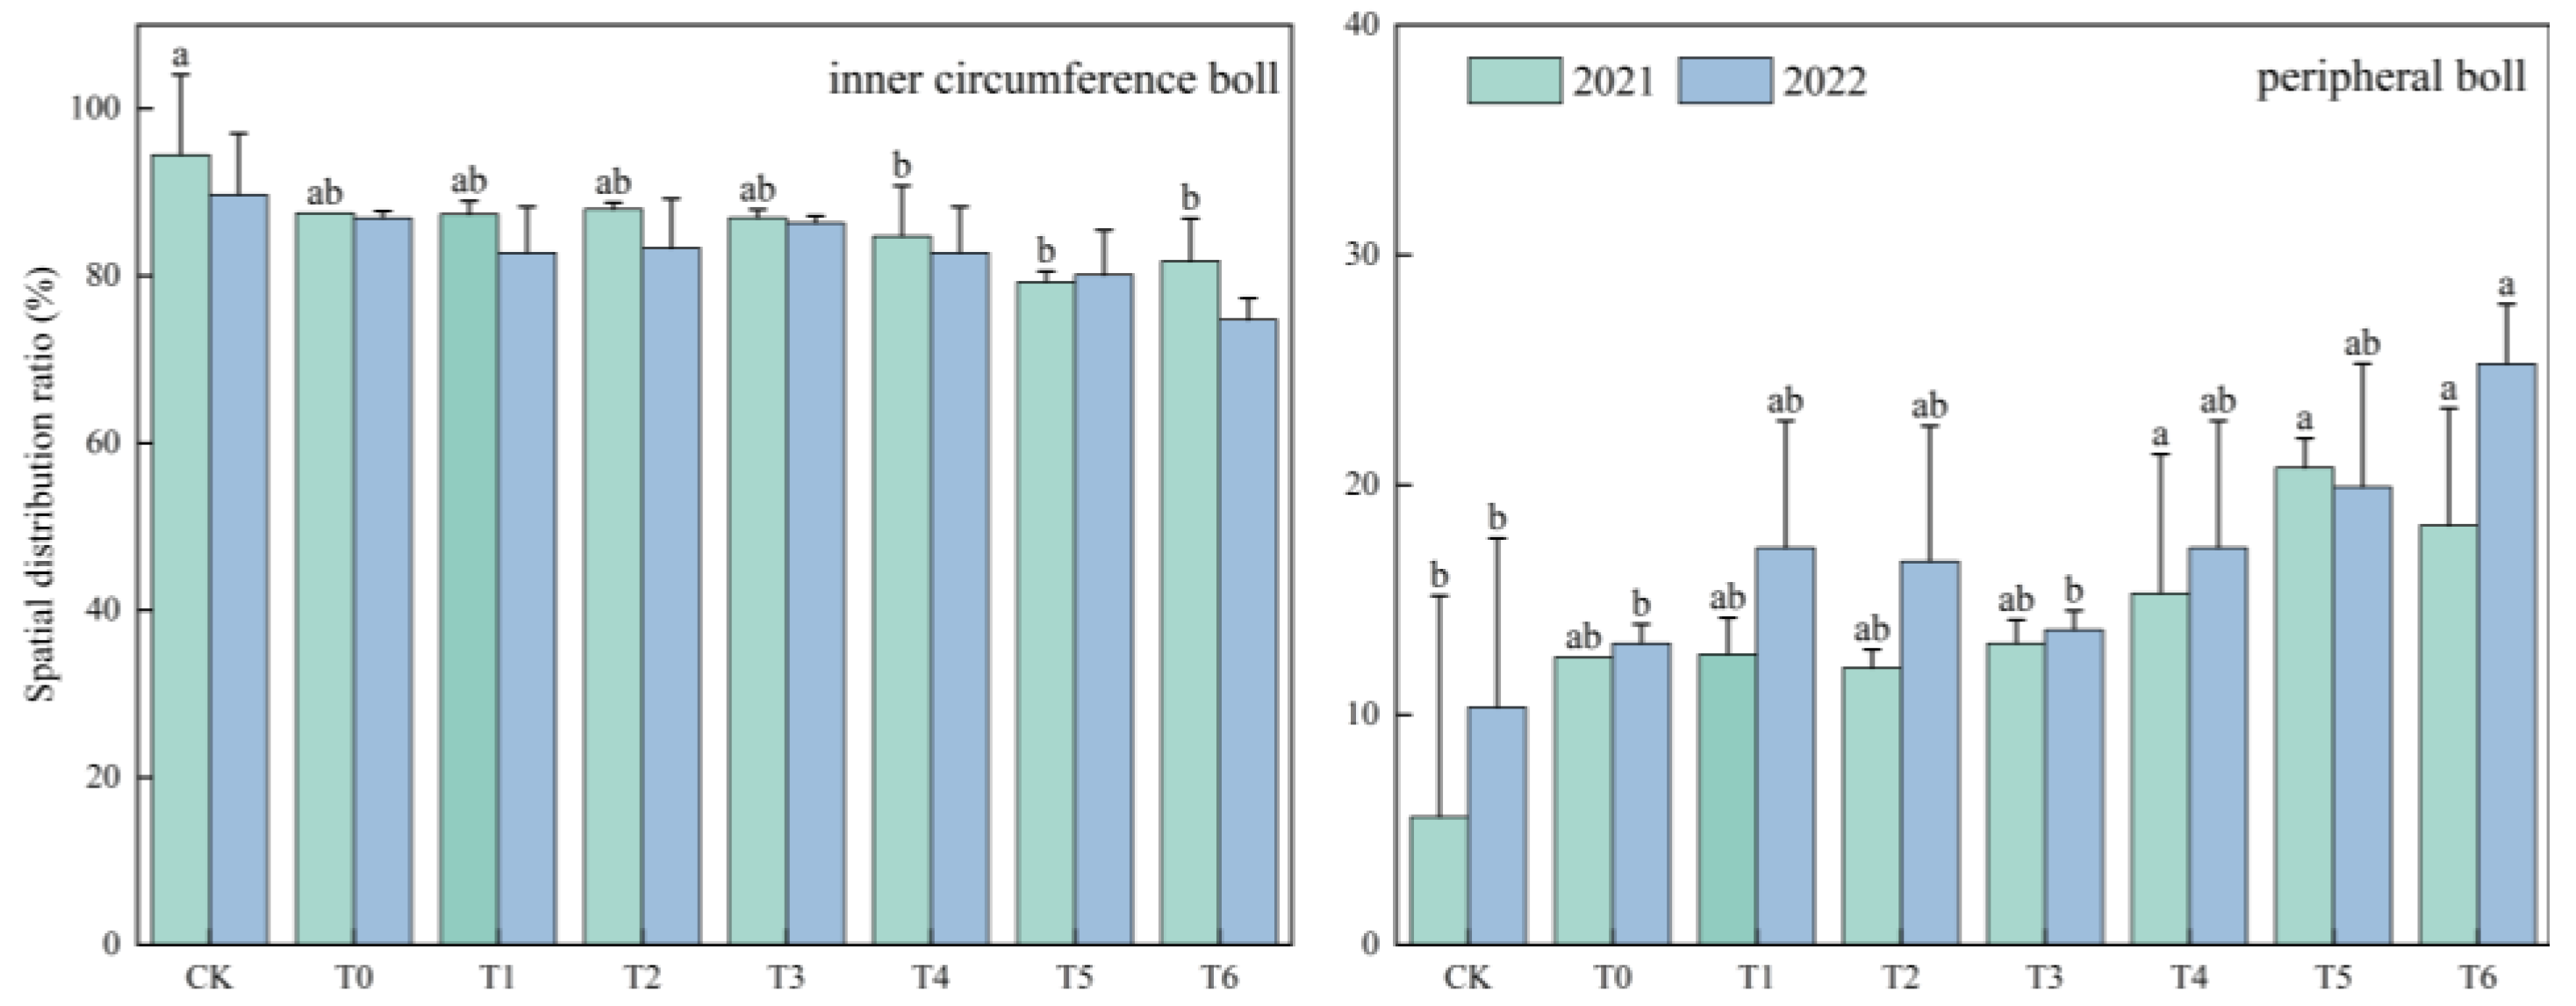
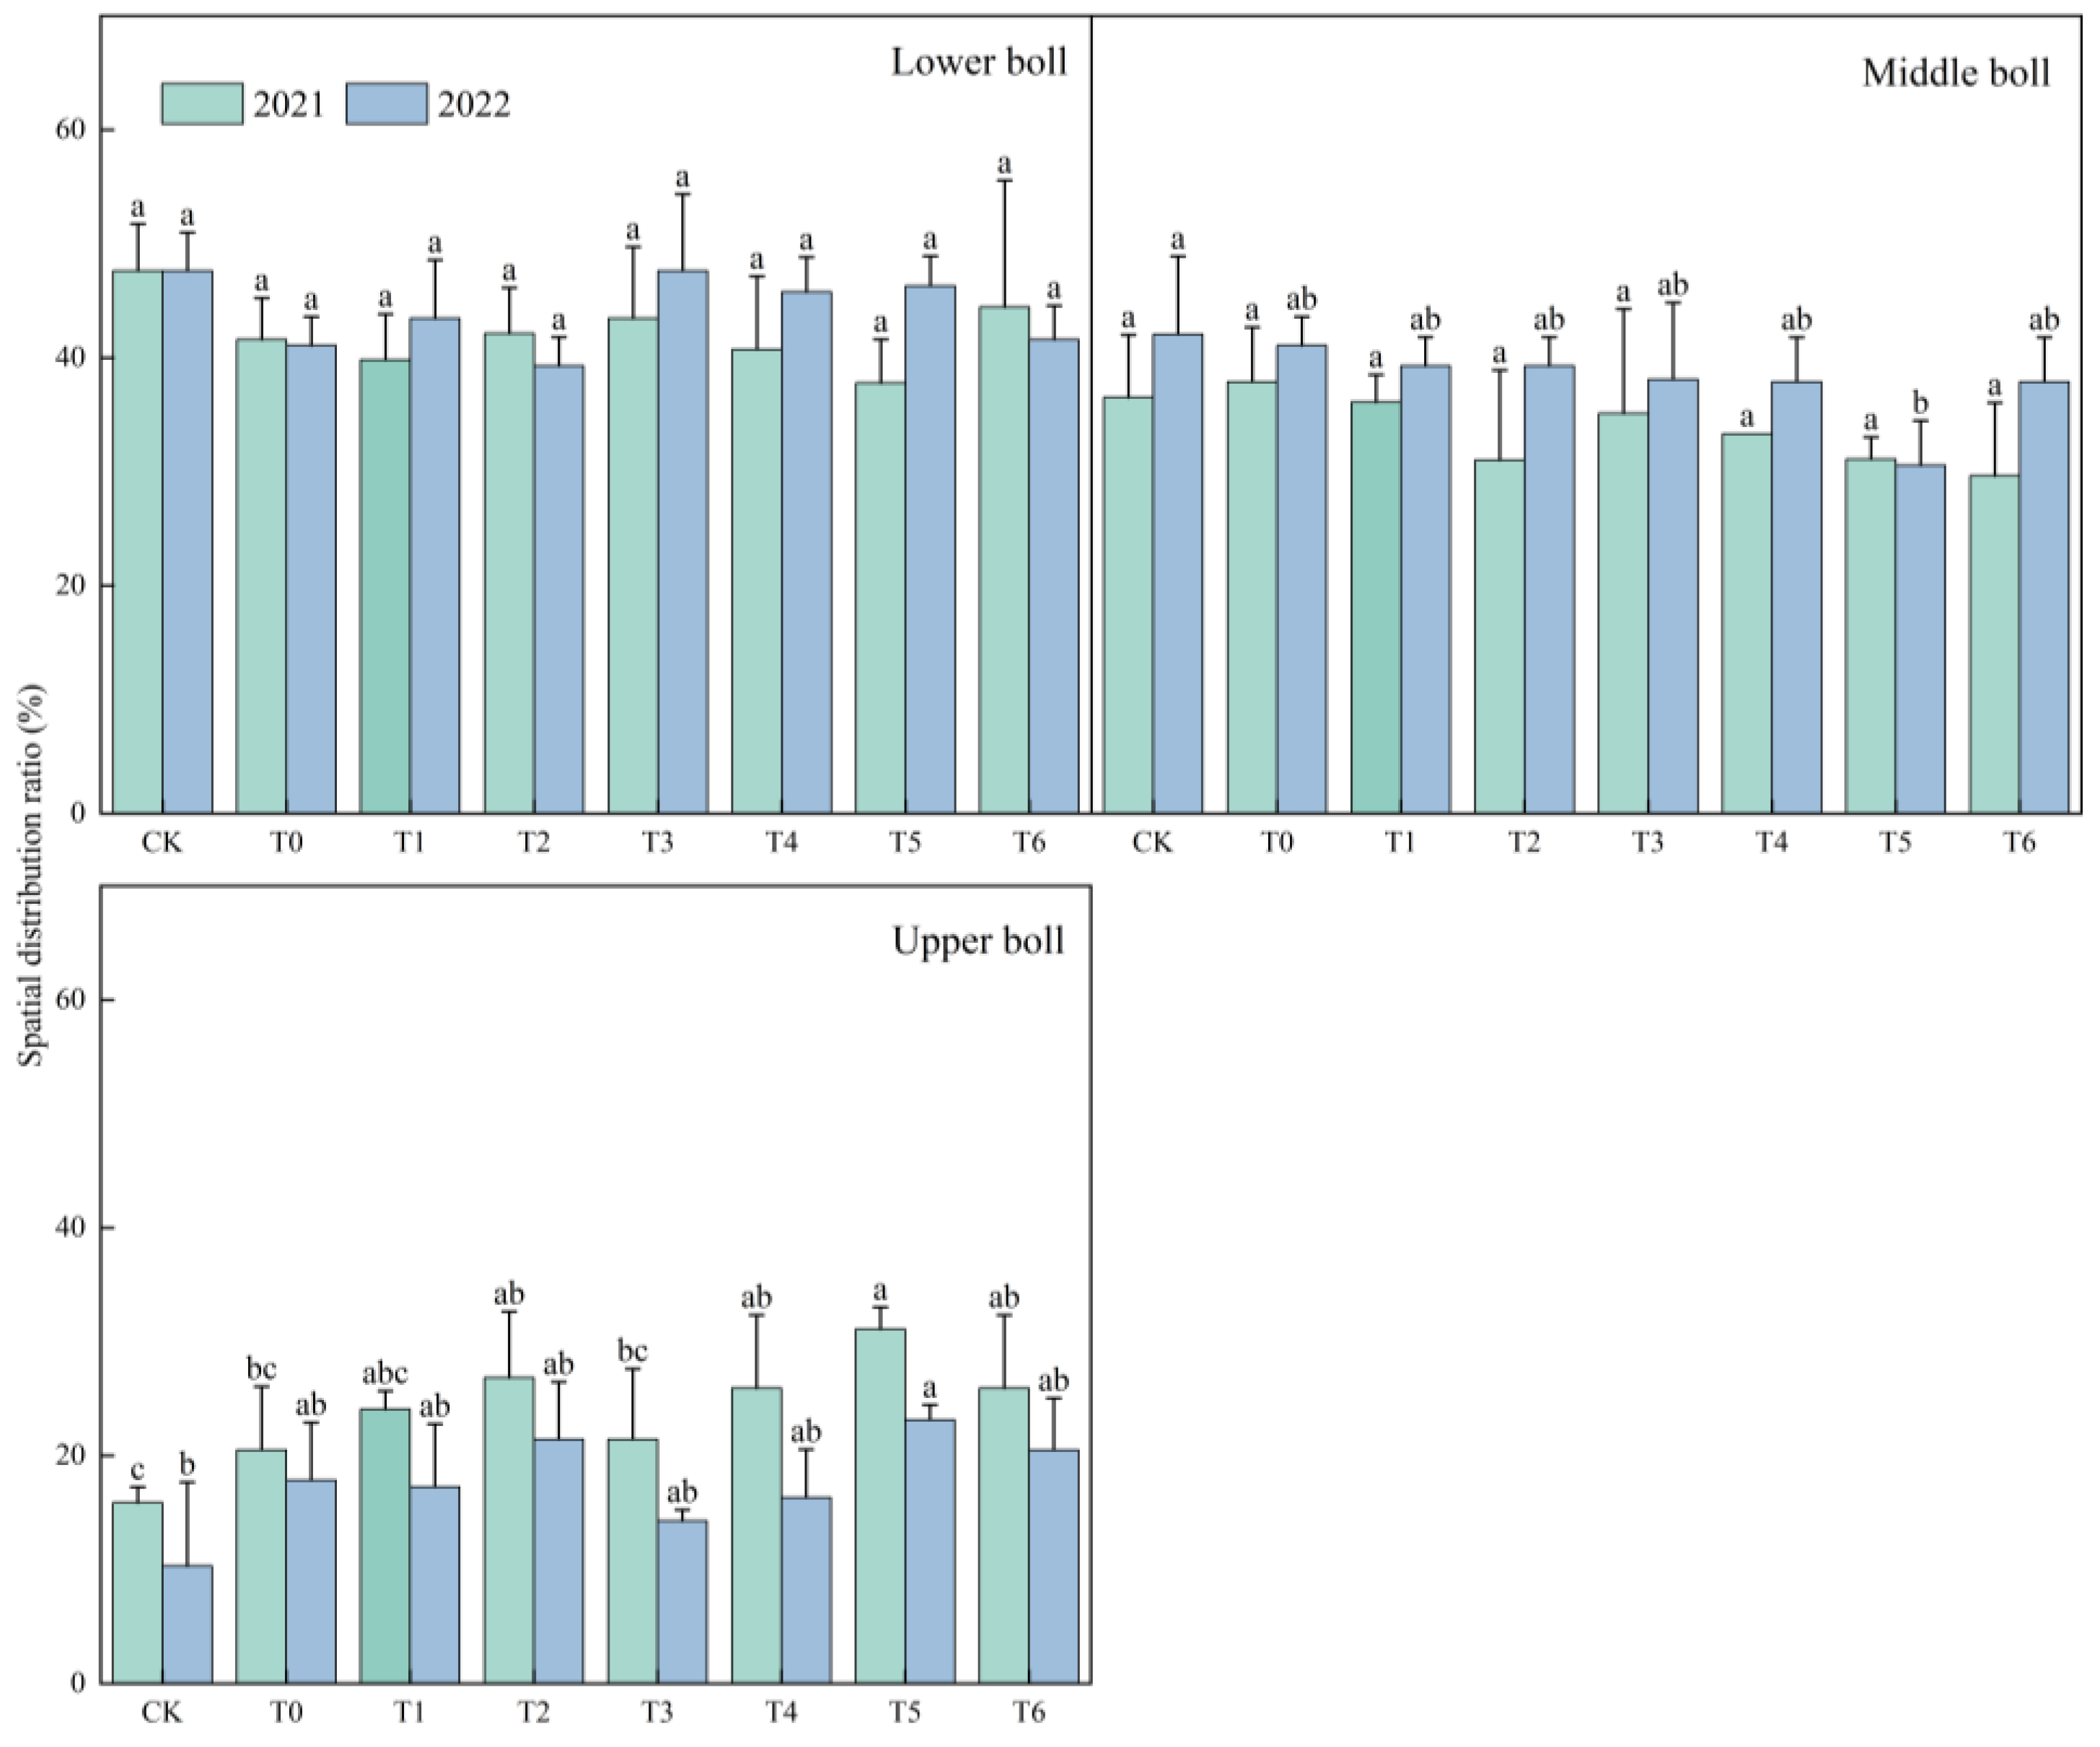
3.3. Spatial Distribution of Cotton Bolls during Flocculation

From the analysis of Figure 6, the Nmin reduction and the application of different alternative ratios of organic fertilisers on the vertical distribution of cotton bolls in the lower and middle bolls had a non-significant impact (p > 0.05), and the effect on the upper bolls was significant (p < 0.05), in which the percentage of upper bolls in the T5 treatment was significantly higher than those in T0 and CK; the ratio of the lower, middle, and upper bolls in T5 was close to 40%:30%:30% and 45%:30%:25%, respectively, in 2021 and 2022. The application of nitrogen had no significant effect on the lateral distribution of cotton bolls. The replacement of chemical fertiliser with organic fertiliser can reduce the proportion of cotton bolls within the inner-circumference bolls and enhance the proportion of peripheral bolls. In 2021 and 2022, the percentage of total bolls in the inner-circumference bolls of T5 was significantly lower than that of T0 and CK, while the opposite was true for peripheral bolls. The ratio of inner-circumference bolls to peripheral bells was found to be approximately 80%:20% for two consecutive years, with the T6 treatment exhibiting a ratio of approximately 80%:20% and 75%:25% for two consecutive years.

3.4. Changes in the Components of Cotton Yield and Overall Yield

The effects of different fertiliser treatments on cotton yield and yield components are presented in Table 3. In 2021 and 2022, the number of bolls per plant, the weight of bolls per plant, and seed cotton yield were the highest among the different fertiliser treatments in the Nmin reduction by replacement with organic fertiliser treatment, followed by the inorganic nitrogen fertiliser treatment, and the lowest in the CK treatment. No discernible pattern of change was observed in the number of bolls per plant across the fertilisation treatments. Only the T5 treatment exhibited a statistically significant increase relative to T0 in 2021. In 2021 and 2022, the variation in single-boll weight for each fertiliser treatment ranged from 5.25 to 5.52 g and 5.10 to 5.40 g, respectively. There was no significant difference in single-boll weight between the T5 and T6 treatments, but both were significantly higher than those of the chemical fertiliser treatment alone. The seed cotton yield of the T2, T4, T5, and T6 treatments was found to be significantly higher than that of the T0 treatment, with yield increases of 6.22%, 9.75%, 17.96%, and 15.24% and 6.96%, 12.07%, 16.35%, and 11.61% observed in 2021 and 2022, respectively. There was no significant difference between the T3 and T0 treatments in 2021, but a decrease was observed in 2022 compared to T0, with a reduction of 2.02% in yield.

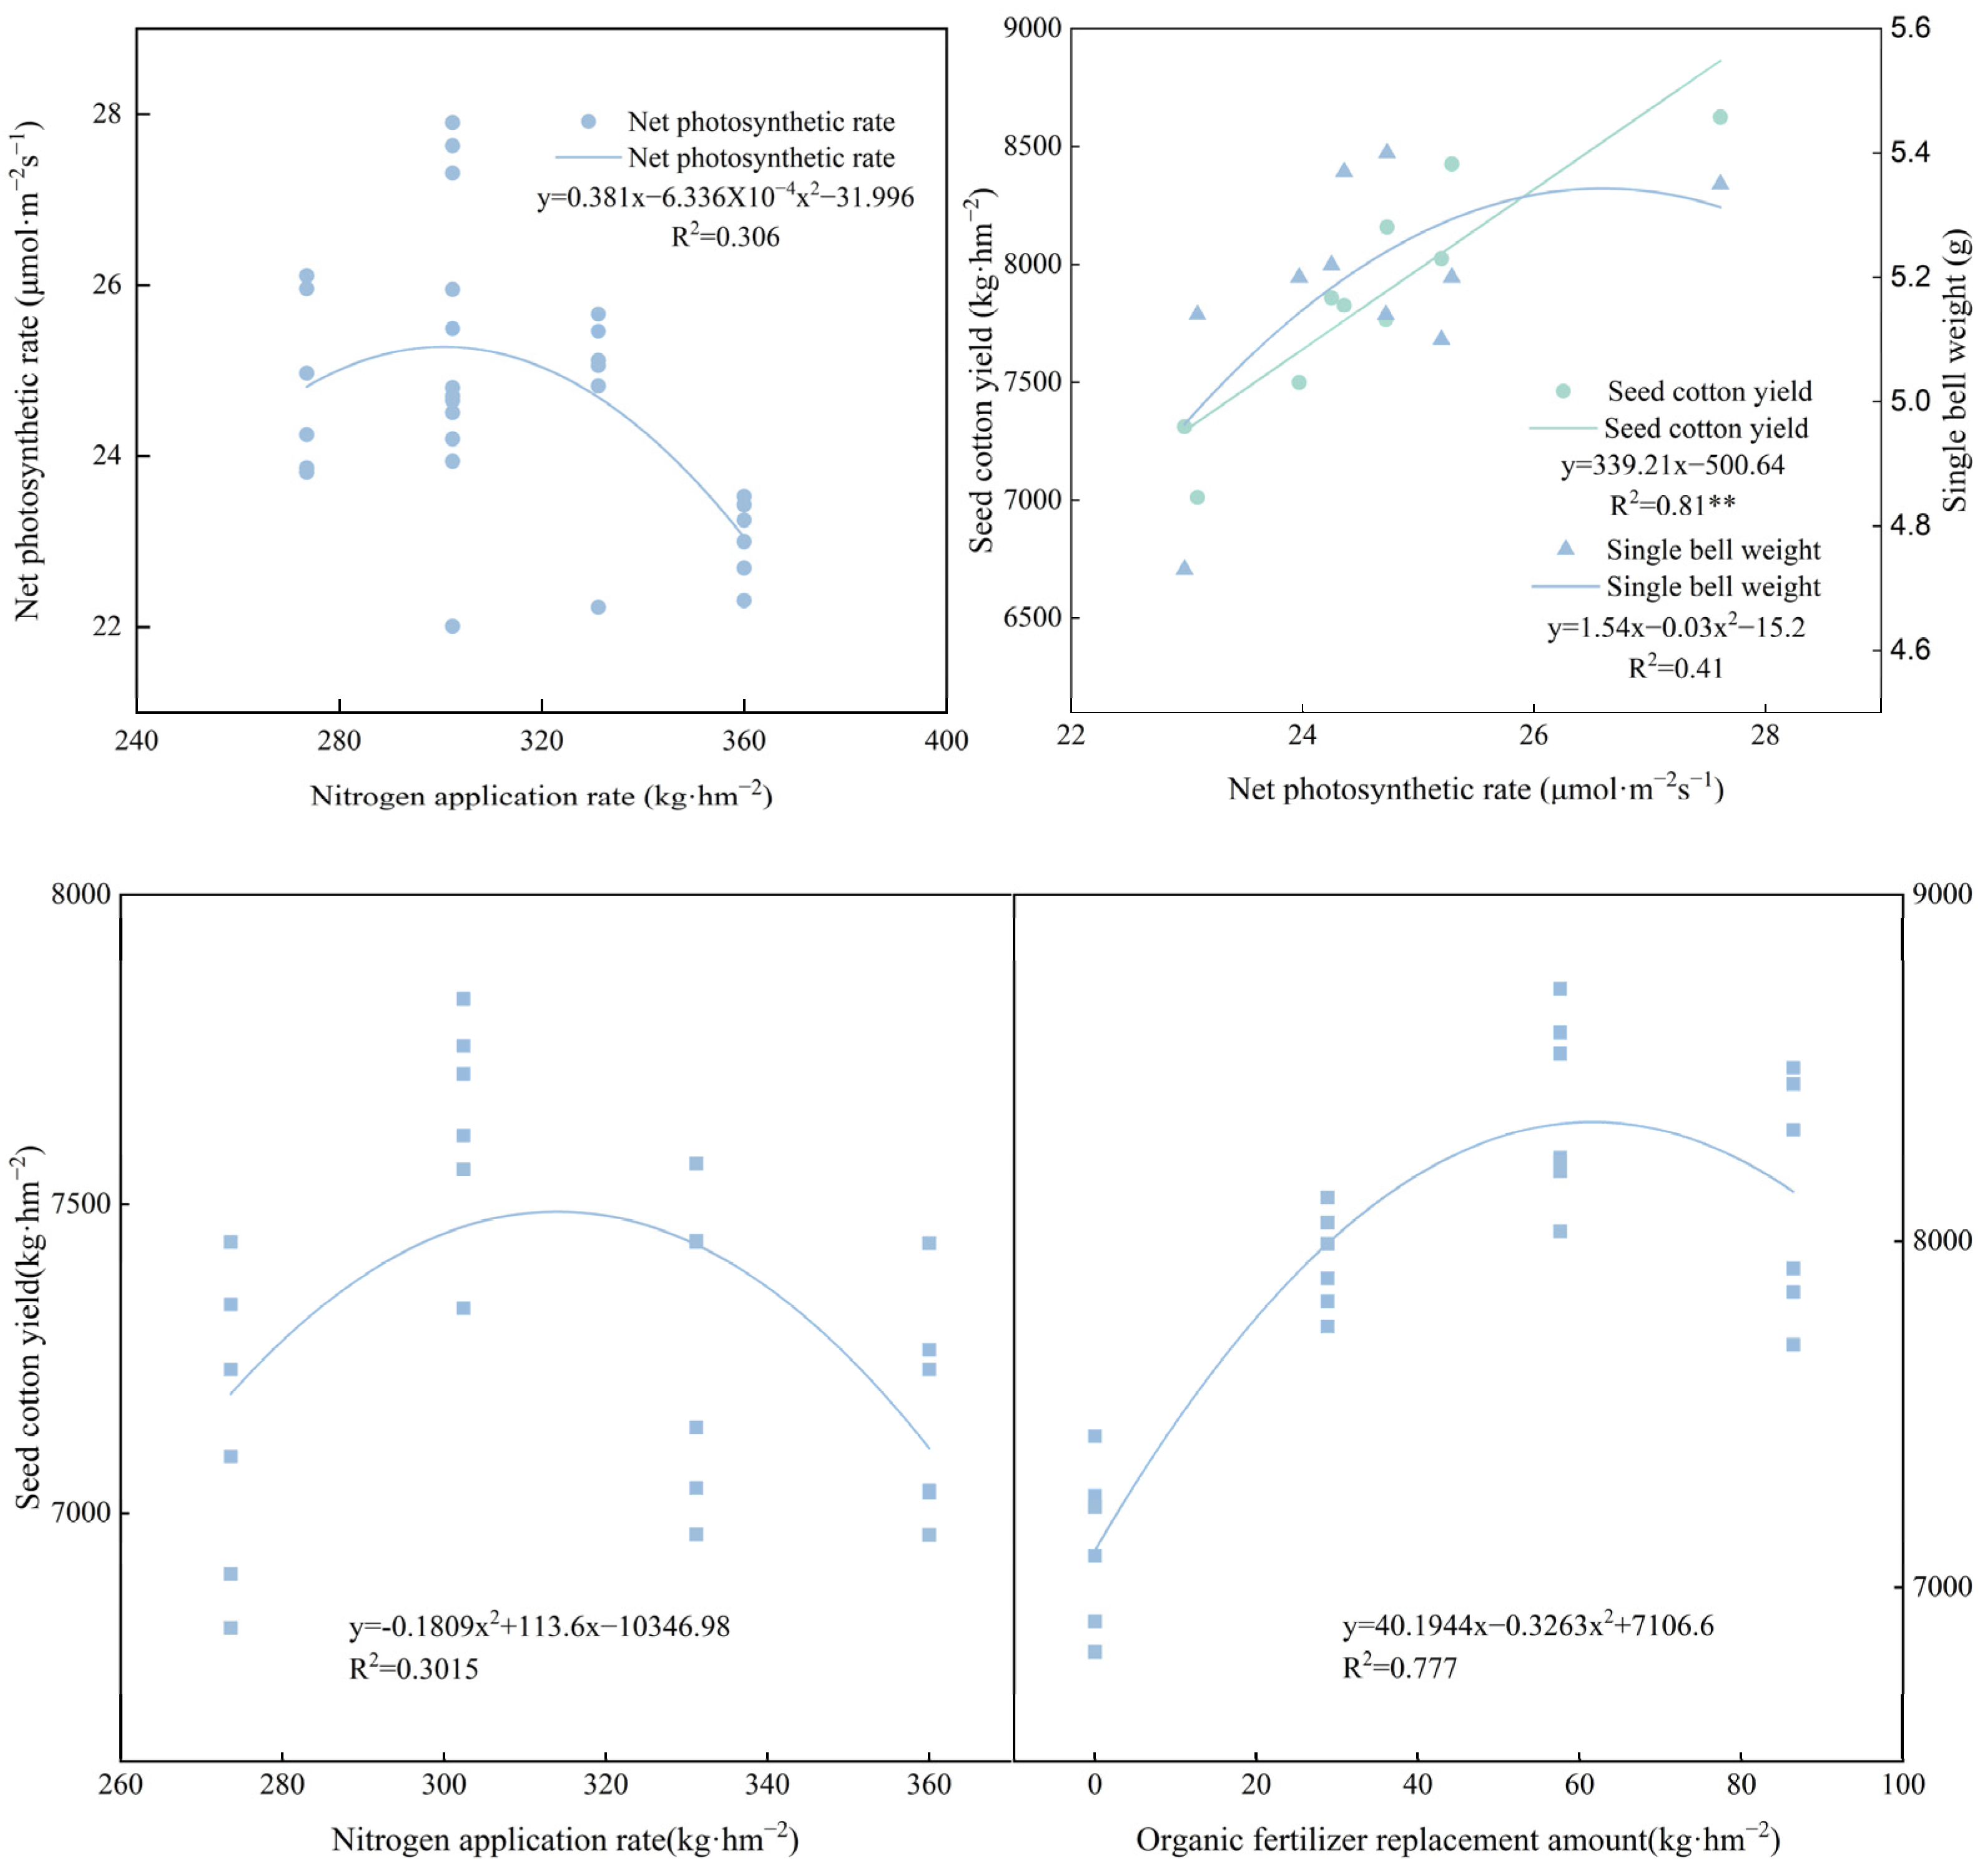
3.5. Regression Equation for the Relationship between Yield, Photosynthesis, and Nitrogen Application

By analysing the relationship between photosynthesis, nitrogen fertiliser application rate, and yield at the boll-opening stage (Figure 7), a quadratic parabola was observed between the nitrogen fertiliser application rate and net photosynthetic rate at the boll-opening stage, as well as between the net photosynthetic rate at the boll-opening stage and the weight of a single boll. The net photosynthetic rate during the boll-opening stage decreased as the nitrogen application rate increased. The optimal nitrogen application rate for achieving the maximum net photosynthetic rate was found to be 300.70 kg·hm−2, resulting in a net photosynthetic rate of 25.30 μmol·m−2s−1. During the boll-opening stage, the weight of a single boll decreased as the net photosynthetic rate increased. The optimal net photosynthetic rate was found to be 25. At the apex of the parabola, the net photosynthetic rate was 7 μmol·m−2s−1. The single-boll weight showed a positive correlation with the net photosynthetic rate (p < 0.01), with a correlation coefficient of 0.81. The relationship between seed cotton yield and chemical nitrogen application, as well as the replacement of chemical fertiliser with an equal amount of organic fertiliser, was quadratic parabolic. This relationship was observed to exhibit a decline in the optimal amount of nitrogen fertiliser and organic fertiliser substitution as the amount of nitrogen fertiliser increased. The parabolic apex, representing the optimal amount of nitrogen fertiliser and organic fertiliser substitution, was observed to be 309.20 kg·hm−2 and 61.60 kg·hm−2, respectively. This indicated that the optimal proportion of nitrogen fertiliser and organic fertiliser substitution was 16.60% and 17.60%, respectively, resulting in a reduction in nitrogen fertiliser by 9.90% to 14.10%. This demonstrates that a strong correlation between the net photosynthetic rate and the seed cotton yield and the application of organic fertiliser and chemical fertiliser can enhance the cotton seed yield, rather than the quantity of fertiliser applied being the determining factor.

3.6. Economic Benefit Analysis

In 2021, cotton’s net profit increased by 4.87%, 12.65%, and 2.19% in nitrogen-reduced treatments T1, T2, and T3, respectively, compared to T0 (Table 4). The organic fertiliser with Nmin reduction treatments, designated T4, T5, and T6, exhibited a considerably greater increase of 17.01, 31.14, and 24.88 percentage points, respectively, in comparison to T0. In the year 2022, the application of treatments T1 and T2 resulted in a net increase of 2.03 and 17.79 per cent, respectively, in profit for the cotton industry in comparison to the control treatment T0. Conversely, the application of treatment T3 resulted in a decrease in profit of 0.11 per cent. Organic fertiliser treatments T4, T5, and T6 resulted in an increase in net profit of 26.27, 34.40, and 21.56 per cent, respectively, over T0. The results showed that reducing nitrogen fertiliser by 8–24% marginally increased cotton’s net returns. Substituting 16–24% of chemical nitrogen with organic fertiliser significantly improved machine-harvested cotton’s net returns. The T5 treatment showed the most significant net return.

4. Discussion

4.1. Effect of Nmin Reduction and Organic Fertiliser on the Growth and Developmental Characteristics of Cotton

Fertilisation is an effective measure to increase crop yield, and crop yield is one of the important indexes to evaluate the effect of fertilisation [18]. Relevant studies have shown that the substitution of inorganic fertiliser for some organic fertilisers can effectively coordinate the supply of organic and inorganic nutrients, meet the nutrient demand of crop growth, and achieve high yield [19]. Previous studies have demonstrated that the combination of organic and chemical fertilisers can significantly enhance the formation of agronomic traits in cotton [20]. The results of this study are consistent with these findings, provided that the total amount of nitrogen application remains unchanged. The reduction in nitrogen and the application of organic fertilisers had a significant effect on the improvement of cotton plant height, stem thickness, and the number of fruiting shoots. The optimal performance was observed with T5, after which the number of plants, stems, and fruiting shoots no longer increased but decreased when the proportion of organic fertilisers applied was further increased. In the context of long-term continuous cropping in cotton fields and the full number of cotton stalks returned to the field, the cotton plant height, stem thickness, and number of fruiting branches exhibited either slight increases or minimal declines following the reduction in nitrogen fertiliser. This finding is consistent with the conclusions of previous studies [21], which demonstrated that the appropriate reduction in nitrogen fertiliser in cotton plants resulted in the maintenance of agronomic traits. Ultimately, these factors affected cotton yield. The spatial distribution of cotton bolls under different fertilisation treatments has a significant impact on the utilisation of light energy resources and the mechanical harvesting rate of cotton fields. It is generally accepted that the lower and middle bolls play a pivotal role in the yield and quality of cotton fields, while the upper bolls are crucial for achieving high yields [22].
The application of nitrogen in excess or in deficiency affects the accumulation and distribution of cotton dry matter under different fertility periods, which ultimately affects the cotton yield. Although organic fertiliser is slow-acting, the application of both organic and inorganic fertilisers can enhance the relationship between nitrogen supply in the soil, ensuring that the nitrogen nutrients in the soil continue to be released to meet the needs of the crop throughout its lifespan [23]. The appropriate reduction in the amount of nitrogen applied with the application of organic fertiliser can therefore promote an increase in the quality of cotton dry matter.

4.2. Effect of Nmin Reduction and Organic Fertiliser Application on the Net Photosynthetic Rate in Cotton

There is a relationship between the roles of nitrogen fertiliser application on the photosynthetic characteristics of crops, nitrogen fertiliser utilisation, and crop yield [24]. Previous studies have demonstrated that the enhancement of photosynthetic characteristics, such as Pn and chlorophyll content, is conducive to an increase in photosynthetic material productivity [25], which in turn can lead to a further increase in the yield potential of cotton fields. The application of nitrogen to cotton plants has been shown to result in a parabolic trend of increasing and then decreasing chlorophyll SPAD value and Pn [26]. Conversely, the incorporation of chemical fertiliser with organic fertiliser has been demonstrated to significantly enhance the chlorophyll content of the cotton population, while maintaining a high net photosynthetic rate [27]. The results of our experiment were comparable to those of previous studies, with a 16% reduction in nitrogen fertiliser application being elevated in comparison to conventional fertilisation. Furthermore, this elevation was observed to reach a level of statistical significance during individual reproductive periods. However, the T3 treatment did not demonstrate a statistically significant reduction in comparison to conventional fertilisation. Upon analysis of the reasons for this, it was found that the full number of cotton stalks returned to the field every year, along with the increased nutrient content of the soil immediately after the return of the straw to the field [28], may have contributed to the lack of significant decrease or increase in the T4 and T5 treatments. Research indicates that an overzealous application of nitrogen fertiliser impairs chlorophyll synthesis and electron transfer processes, ultimately resulting in a decline in photosynthesis [29].

4.3. Effect of Nmin Reduction and Organic Fertiliser on Cotton Yield Composition and Nitrogen Utilisation in Cotton

The application of nitrogen in excess or in deficiency influences the accumulation and distribution of dry matter in cotton crops across different fertility periods and ultimately impacts the yield of cotton fields. Nevertheless, from the perspective of the entire reproductive period, the application of organic fertiliser can effectively promote the cotton single plant boll number, boll weight, and yield increase, and improve cotton productivity [30]. The T2 treatment did not reach a significant level in terms of cotton single boll number and single-boll weight effect changes. However, the cotton yield of the T2 treatment increased compared with the T0 treatment, while the yield of the T4, T5, and T6 treatments increased significantly compared with that of the CK cotton. These results are consistent with those of previous studies [31].
The dosage of nitrogen fertiliser, the method of fertiliser application, and the blending of organic and inorganic fertilisers, as well as the blending ratios, have a significant impact on the uptake of nitrogen by seeds and the utilisation of nitrogen fertiliser [32,33,34]. Fertiliser application in cotton fields tends to exhibit a single-peaked parabolic relationship with yield. Previous research indicates that there is a significant impact of fertiliser application on yield, with differences observed when the same amount of fertiliser is applied over successive years. This is particularly noticeable when the number of years of application increases [35]. Furthermore, the yield inhibitory effect of high-nitrogen treatments increases with the increase in the number of consecutive years of application [36]. Organic fertiliser is a slow-acting nutrient, but the co-application of nitrogen fertiliser and organic fertiliser can improve the nitrogen supply relationship in the soil, ensuring that the nitrogen nutrients in the soil are released in a smooth and timely manner to meet the nutrient supply demands of the crop throughout its life cycle [37,38]. In this experiment, all the Nmin reduction treatments were found to promote an increase in cotton dry matter mass. However, the effect was more pronounced in the T5 treatment.

4.4. Effect of Different Nmin Reduction and Organic Fertiliser Treatments on the Economic Efficiency of Cotton

The current practice of applying high levels of nitrogen fertiliser to cotton fields has a detrimental effect on the environment, resulting in the wastage of resources and no significant increase in cotton yields [39]. Consequently, the reduction in nitrogen inputs in cotton fields is crucial for the advancement of more sustainable agricultural systems [40].
The outcomes of the investigation demonstrated that cotton yields were superior in the treatments involving nitrogen fertiliser (T1 and T2) in comparison to the conventional nitrogen application treatment (T0). Nevertheless, the increasing trend of cotton yield exhibited a decline with a reduction in nitrogen fertiliser application, resulting in a decline in economic efficiency. This may be attributed to the inability of the soil to provide the nitrogen required for cotton growth, which can result in premature senescence and consequently reduced cotton yields [41]. The results of the study demonstrated that the economic benefits of Nmin reduction treatments utilising organic fertilisers were significantly higher than those observed in the T2 treatment. A reduction in the amount of nitrogen fertiliser applied can maintain cotton yields. However, the application of an optimum quantity of organic fertiliser can promote higher yields, reduce costs, and lead to significantly greater financial gains. The observed outcome may be attributed to the fact that the impact of organic fertiliser was analysed solely in terms of nitrogen, with a narrow focus.

5. Conclusions

In the context of nitrogen fertiliser application reduction and organic fertilisers, the reduction in inorganic nitrogen fertiliser by 8% to 24% did not have a significant negative impact on cotton growth and yield. Conversely, the reduction in nitrogen fertiliser application and manure substitution can promote cotton growth, improve cotton yield and economic efficiency, and realise the efficiency of the Nmin reduction and enhancement. The synergistic effect of an alternative application of organic fertilisers is specifically manifested in the following ways: optimising the spatial distribution structure of cotton bolls, promoting the growth of cotton, maintaining the photosynthetic performance of cotton at a high level during the fluffing period, and facilitating the assimilation of products to increase the delivery to the bolls. The results demonstrated that the seed cotton yield of the T5 treatment was elevated by approximately 17.96% and 16.35% compared with the T0 treatment over the course of two years. Furthermore, the economic benefits were enhanced by approximately 31.14% and 34.40%, respectively. The Nmin reduction and replacement of inorganic nitrogen fertiliser by organic fertiliser were found to be within the range of 9.90% to 14.10% and 16.60% to 17.60%, respectively. It was observed that the cotton yield and economic efficiency reached their optimal effect simultaneously.

Author Contributions

Conceptualization, H.H., X.L. and J.L.; methodology, H.H. and X.L.; validation, H.H.; formal analysis, H.H.; resources, J.L.; data curation, H.H.; writing—original draft, H.H.; writing—review and editing, H.H. and J.L.; visualization, H.H. and X.L.; supervision, H.H. and J.L.; project administration, J.L.; funding acquisition, J.L. All authors have read and agreed to the published version of the manuscript.

Funding

The research reported in this manuscript was funded by the Program of the National Natural Science Foundation of China (grant no. 31960396).

Institutional Review Board Statement

Not applicable.

Data Availability Statement

Data presented in this study are available upon reasonable request to the corresponding author.

Conflicts of Interest

The authors declare no conflicts of interest.

References

  1. Han, Z.; Hu, Y.; Tian, Q.; Cao, Y.; Si, A.; Si, Z.; Zang, Y.; Xu, C.; Shen, W.; Dai, F.; et al. Genomic signatures and candidate genes of lint yield and fibre quality improvement in Upland cotton in Xinjiang. Plant Biotechnol. J. 2020, 18, 2002–2014. [Google Scholar] [CrossRef]
  2. Li, N.; Lin, H.; Wang, T.; Li, Y.; Liu, Y.; Chen, X.; Hu, X. Impact of climate change on cotton growth and yields in Xinjiang, China. Field Crop Res. 2020, 247, 107590. [Google Scholar] [CrossRef]
  3. Gu, X.; Cai, H.; Du, Y.; Li, Y. Effects of film mulching and nitrogen fertilization on rhizosphere soil environment, root growth and nutrient uptake of winter oilseed rape in northwest China. Soil Tillage Res. 2019, 187, 194–203. [Google Scholar] [CrossRef]
  4. Cui, Z.; Zhang, F.; Chen, X.; Dou, Z.; Li, J. In-season nitrogen management strategy for winter wheat: Maximizing yields, minimizing environmental impact in an over-fertilization context. Field Crop Res. 2010, 116, 140–146. [Google Scholar] [CrossRef]
  5. Dong, X.; Zhang, Z.; Wang, S.; Shen, Z.; Cheng, X.; Lv, X.; Pu, X. Soil properties, root morphology and physiological responses to cotton stalk biochar addition in two continuous cropping cotton field soils from Xinjiang, China. PeerJ 2022, 10, e12928. [Google Scholar] [CrossRef]
  6. Tian, Y.; Tian, L.; Wang, F.; Shi, X.; Shi, F.; Hao, X.; Li, N.; Chenu, K.; Luo, H.; Yang, G. Optimizing nitrogen application improves its efficiency by higher allocation in bolls of cotton under drip fertigation. Field Crop Res. 2023, 298, 108968. [Google Scholar] [CrossRef]
  7. Abdo, A.I.; Shi, D.; Li, J.; Yang, T.; Wang, X.; Li, H.; Abdel-Hamed, E.M.W.; Merwad, A.M.A.; Wang, L. Ammonia emission from staple crops in China as response to mitigation strategies and agronomic conditions: Meta-analytic study. J. Clean. Prod. 2021, 279, 123835. [Google Scholar] [CrossRef]
  8. Wang, J.; Hussain, S.; Sun, X.; Zhang, P.; Javed, T.; Dessoky, E.S.; Ren, X.; Chen, X. Effects of Nitrogen Application Rate under Straw Incorporation on Photosynthesis, Productivity and Nitrogen Use Efficiency in Winter Wheat. Front. Plant Sci. 2022, 13, 862088. [Google Scholar] [CrossRef] [PubMed]
  9. Chen, J.; Liu, L.; Wang, Z.; Sun, H.; Zhang, Y.; Bai, Z.; Song, S.; Lu, Z.; Li, C. Nitrogen Fertilization Effects on Physiology of the Cotton Boll-Leaf System. Agronomy 2019, 9, 271. [Google Scholar] [CrossRef]
  10. Zhou, C.; Jia, B.; Wang, S.; Huang, Y.; Wang, Y.; Han, K.; Wang, W. Effects of Nitrogen Fertilizer Applications on Photosynthetic Production and Yield of Japonica Rice. Int. J. Plant Prod. 2021, 15, 599–613. [Google Scholar] [CrossRef]
  11. Hou, X.; Xiang, Y.; Fan, J.; Zhang, F.; Hu, W.; Yan, F.; Guo, J.; Xiao, C.; Li, Y.; Cheng, H.; et al. Evaluation of cotton N nutrition status based on critical N dilution curve, N uptake and residual under different drip fertigation regimes in Southern Xinjiang of China. Agric. Water Manag. 2021, 256, 107134. [Google Scholar] [CrossRef]
  12. Wang, H.; Xu, J.; Liu, X.; Zhang, D.; Li, L.; Li, W.; Sheng, L. Effects of long-term application of organic fertilizer on improving organic matter content and retarding acidity in red soil from China. Soil Tillage Res. 2019, 195, 104382. [Google Scholar] [CrossRef]
  13. Adekiya, A.O.; Ejue, W.S.; Olayanju, A.; Dunsin, O.; Aboyeji, C.M.; Aremu, C.; Adegbite, K.; Akinpelu, O. Different organic manure sources and NPK fertilizer on soil chemical properties, growth, yield and quality of okra. Sci. Rep. 2020, 10, 16083. [Google Scholar] [CrossRef]
  14. Du, T.; He, H.; Zhang, Q.; Lu, L.; Mao, W.; Zhai, M. Positive effects of organic fertilizers and biofertilizers on soil microbial community composition and walnut yield. Appl. Soil. Ecol. 2022, 175, 104457. [Google Scholar] [CrossRef]
  15. Ye, L.; Zhao, X.; Bao, E.; Li, J.; Zou, Z.; Cao, K. Bio-organic fertilizer with reduced rates of chemical fertilization improves soil fertility and enhances tomato yield and quality. Sci. Rep. 2020, 10, 177. [Google Scholar] [CrossRef]
  16. Guo, J.; Fan, J.; Zhang, F.; Yan, S.; Zheng, J.; Wu, Y.; Li, J.; Wang, Y.; Sun, X.; Liu, X.; et al. Blending urea and slow-release nitrogen fertilizer increases dryland maize yield and nitrogen use efficiency while mitigating ammonia volatilization. Sci. Total Environ. 2021, 790, 148058. [Google Scholar] [CrossRef]
  17. Liu, J.; Shu, A.; Song, W.; Shi, W.; Li, M.; Zhang, W.; Li, Z.; Liu, G.; Yuan, F.; Zhang, S.; et al. Long-term organic fertilizer substitution increases rice yield by improving soil properties and regulating soil bacteria. Geoderma 2021, 404, 115287. [Google Scholar] [CrossRef]
  18. Duncan, E.G.; O’Sullivan, C.A.; Roper, M.M.; Biggs, J.S.; Peoples, M.B. Influence of co-application of nitrogen with phosphorus, potassium and sulphur on the apparent efficiency of nitrogen fertiliser use, grain yield and protein content of wheat: Review. Field Crop Res. 2018, 226, 56–65. [Google Scholar] [CrossRef]
  19. He, H.; Peng, M.; Lu, W.; Hou, Z.; Li, J. Commercial organic fertilizer substitution increases wheat yield by improving soil quality. Sci. Total Environ. 2022, 851, 158132. [Google Scholar] [CrossRef]
  20. Shi, X.; Hao, X.; Li, N.; Li, J.; Shi, F.; Han, H.; Tian, Y.; Chen, Y.; Wang, J.; Luo, H. Organic Liquid Fertilizer Coupled with Single Application of Chemical Fertilization Improves Growth, Biomass, and Yield Components of Cotton under Mulch Drip Irrigation. Front. Plant Sci. 2022, 12, 763525. [Google Scholar] [CrossRef]
  21. Bai, Z.; Bai, W.; Xie, C.; Yu, J.; Dai, Y.; Pei, S.; Zhang, F.; Li, Y.; Fan, J.; Yin, F. Irrigation depth and nitrogen rate effects on seed cotton yield, fiber quality and water-nitrogen utilization efficiency in southern Xinjiang, China. Agric. Water Manag. 2023, 290, 108583. [Google Scholar] [CrossRef]
  22. Hassanzadehdelouei, M.; Ul-Allah, S.; Madani, A. Cotton fiber quality response to nitrogen depends on source-sink process, boll growth habit, and weather condition. Ind. Crop Prod. 2022, 186, 115279. [Google Scholar] [CrossRef]
  23. Yao, R.; Bai, R.; Yu, Q.; Bao, Y.; Yang, W. The Effect of Nitrogen Reduction and Applying Bio-Organic Fertilisers on Soil Nutrients and Apple Fruit Quality and Yield. Agronomy 2024, 14, 345. [Google Scholar] [CrossRef]
  24. Liu, Z.; Gao, J.; Gao, F.; Liu, P.; Zhao, B.; Zhang, J. Photosynthetic Characteristics and Chloroplast Ultrastructure of Summer Maize Response to Different Nitrogen Supplies. Front. Plant Sci. 2018, 9, 576. [Google Scholar] [CrossRef] [PubMed]
  25. Du, X.; Xi, M.; Wei, Z.; Chen, X.; Wu, W.; Kong, L. Raised bed planting promotes grain number per spike in wheat grown after rice by improving spike differentiation and enhancing photosynthetic capacity. J. Integr. Agric. 2023, 22, 1631–1644. [Google Scholar] [CrossRef]
  26. Muharam, F.M.; Bronson, K.F.; Maas, S.J.; Ritchie, G.L. Inter-relationships of cotton plant height, canopy width, ground cover and plant nitrogen status indicators. Field Crop Res. 2014, 169, 58–69. [Google Scholar] [CrossRef]
  27. Li, H.; Liu, Z.; Zhang, X.; Chen, D.; Chen, Y. A positive correlation between seed cotton yield and high-efficiency leaf area index in directly seeded short-season cotton after wheat. Field Crop Res. 2022, 285, 108594. [Google Scholar] [CrossRef]
  28. Huang, L.; Cheng, S.; Liu, H.; Zhao, Z.; Wei, S.; Sun, S. Effects of nitrogen reduction combined with organic fertilizer on growth and nitrogen fate in banana at seedling stage. Environ. Res. 2022, 214, 113826. [Google Scholar] [CrossRef]
  29. Yang, H.; Yang, B.; Dai, Y.; Xu, M.; Koide, R.T.; Wang, X.; Liu, J.; Bian, X. Soil nitrogen retention is increased by ditch-buried straw return in a rice-wheat rotation system. Eur. J. Agron. 2015, 69, 52–58. [Google Scholar] [CrossRef]
  30. Wang, Z.; Wang, Z.; Ma, L.; Lv, X.; Meng, Y.; Zhou, Z. Straw returning coupled with nitrogen fertilization increases canopy photosynthetic capacity, yield and nitrogen use efficiency in cotton. Eur. J. Agron. 2021, 126, 126267. [Google Scholar] [CrossRef]
  31. Sperling, O.; Karunakaran, R.; Erel, R.; Yasuor, H.; Klipcan, L.; Yermiyahu, U. Excessive nitrogen impairs hydraulics, limits photosynthesis, and alters the metabolic composition of almond trees. Plant Physiol. Biochem. 2019, 143, 265–274. [Google Scholar] [CrossRef] [PubMed]
  32. Salvagiotti, F.; Cassman, K.G.; Specht, J.E.; Walters, D.T.; Weiss, A.; Dobermann, A. Nitrogen uptake, fixation and response to fertilizer N in soybeans: A review. Field Crop Res. 2008, 108, 1–13. [Google Scholar] [CrossRef]
  33. Thind, H.S.; Aujla, M.S.; Buttar, G.S. Response of cotton to various levels of nitrogen and water applied to normal and paired sown cotton under drip irrigation in relation to check-basin. Agric. Water Manag. 2008, 95, 25–34. [Google Scholar] [CrossRef]
  34. Ding, B.; Cao, H.; Zhang, J.; Bai, Y.; He, Z.; Guo, S.; Wang, B.; Jia, Z.; Liu, H. Biofertilizer application improved cotton growth, nitrogen use efficiency, and yield in saline water drip-irrigated cotton fields in Xinjiang, China. Ind. Crop Prod. 2023, 205, 117553. [Google Scholar] [CrossRef]
  35. Li, X.; Li, B.; Chen, L.; Liang, J.; Huang, R.; Tang, X.; Zhang, X.; Wang, C. Partial substitution of chemical fertilizer with organic fertilizer over seven years increases yields and restores soil bacterial community diversity in wheat–rice rotation. Eur. J. Agron. 2022, 133, 126445. [Google Scholar] [CrossRef]
  36. Agegnehu, G.; Nelson, P.N.; Bird, M.I. The effects of biochar, compost and their mixture and nitrogen fertilizer on yield and nitrogen use efficiency of barley grown on a Nitisol in the highlands of Ethiopia. Sci. Total Environ. 2016, 569, 869–879. [Google Scholar] [CrossRef]
  37. Qiao, J.; Yang, L.; Yan, T.; Xue, F.; Zhao, D. Nitrogen fertilizer reduction in rice production for two consecutive years in the Taihu Lake area. Agric. Ecosyst. Environ. 2012, 146, 103–112. [Google Scholar] [CrossRef]
  38. Agegnehu, G.; Nelson, P.N.; Bird, M.I. Crop yield, plant nutrient uptake and soil physicochemical properties under organic soil amendments and nitrogen fertilization on Nitisols. Soil Tillage Res. 2016, 160, 1–13. [Google Scholar] [CrossRef]
  39. Pabuayon, I.L.B.; Lewis, K.L.; Ritchie, G.L. Dry matter and nutrient partitioning changes for the past 30 years of cotton production. Agron. J. 2020, 112, 4373–4385. [Google Scholar] [CrossRef]
  40. Pabuayon, I.L.B.; Mitchell-McCallister, D.; Lewis, K.L.; Ritchie, G.L. Yield and Economic Response of Modern Cotton Cultivars to Nitrogen Fertilizer. Agronomy 2021, 11, 2149. [Google Scholar] [CrossRef]
  41. Snider, J.; Harris, G.; Roberts, P.; Meeks, C.; Chastain, D.; Bange, M.; Virk, G. Cotton physiological and agronomic response to nitrogen application rate. Field Crop Res. 2021, 270, 108194. [Google Scholar] [CrossRef]
Figure 1. Changes in plant height at each fertility period under different fertiliser treatments. CK represents a fertiliser application of zero units. T0 denotes a chemical fertiliser application only. T1–T3 denote an 8%, 16%. and 24% reduction in N fertiliser application. T4–T6 represent a replacement of the reduced N fertiliser application of T1–T3 with organic fertilisers. Different lowercase letters indicate significant differences among treatments at the 0.05 probability level.
Agriculture 14 01073 g001
Figure 2. Changes in stem thickness at various fertility periods under different fertiliser treatments. CK represents a fertiliser application of zero units. T0 denotes a chemical fertiliser application only. T1–T3 denote an 8%, 16%, and 24% reduction in N fertiliser application. T4–T6 represent a replacement of the reduced N fertiliser application of T1–T3 with organic fertilisers. Different lowercase letters indicate significant differences among treatments at the 0.05 probability level.
Agriculture 14 01073 g002
Figure 3. Changes in the number of fruiting branches per plant at the flocculation stage under different fertiliser treatments. CK represents a fertiliser application of zero units. T0 denotes a chemical fertiliser application only. T1–T3 denote an 8%, 16%, and 24% reduction in N fertiliser application. T4–T6 represent a replacement of the reduced N fertiliser application of T1–T3 with organic fertilisers. Different lowercase letters indicate significant differences among treatments at the 0.05 probability level.
Agriculture 14 01073 g003
Figure 4. Changes in leaf area at various fertility periods under different fertiliser treatments. CK represents a fertiliser application of zero units. T0 denotes a chemical fertiliser application only. T1–T3 denote an 8%, 16%, and 24% reduction in N fertiliser application. T4–T6 represent a replacement of the reduced N fertiliser application of T1–T3 with organic fertilisers. Different lowercase letters indicate significant differences among treatments at the 0.05 probability level.
Agriculture 14 01073 g004
Figure 5. The changes in net photosynthetic rate and chlorophyll SPAD value of cotton at different growth stages under fertilisation treatment. CK represents a fertiliser application of zero units. T0 denotes a chemical fertiliser application only. T1–T3 denote an 8%, 16%, and 24% reduction in N fertiliser application. T4–T6 represent a replacement of the reduced N fertiliser application of T1–T3 with organic fertilisers. Different lowercase letters indicate significant differences among treatments at the 0.05 probability level.
Agriculture 14 01073 g005aAgriculture 14 01073 g005b
Figure 6. The spatial distribution ratio of cotton bolls during the boll opening of cotton. CK represents a fertiliser application of zero units. T0 denotes a chemical fertiliser application only. T1–T3 denote an 8%, 16%, and 24% reduction in N fertiliser application. T4–T6 represent a replacement of the reduced N fertiliser application of T1–T3 with organic fertilisers. Inner-circumference boll means bolls close to the inner 1–2 nodes near the main stem, peripheral boll means bolls away from the main stem in the peripheral nodes, lower boll means bolls in the lower branches, middle boll means bolls in the lower branches, and upper boll means bolls in the upper branches. Different lowercase letters indicate significant differences in the spatial proportion of bolls of the same site in the different treatments at the 0.05 probability level.
Agriculture 14 01073 g006aAgriculture 14 01073 g006b
Figure 7. Modelling of regression equations for different nitrogen applications, net photosynthetic rate and cotton yield components. ** Significant at p < 0.01.
Agriculture 14 01073 g007
Table 1. Basic chemical properties.
YearAmmonium Nitrogen (mg·kg−1)Nitrate Nitrogen (mg·kg−1)Organic Carbon (g·kg−1)pHConductivity (μs·cm−1)
202113.0940.0411.207.78248.42
202214.3243.3012.877.75282.50
Table 2. Experimental treatment and fertiliser dosage.
TreatmentN Amount (kg·hm−2)P2O5 Rate
(kg·hm−2)
K2O Rate
(kg·hm−2)
Fertiliser N RateOrganic Fertiliser N RateOverall Rate
CK00000
T03600360144144
T1331.20331.2
T2302.40302.4
T3273.60273.6
T4331.228.8360
T5302.457.6360
T6273.686.4360
Note: CK represents a fertiliser application of zero units. T0 denotes a chemical fertiliser application only. T1–T3 denote an 8%, 16%, and 24% reduction in N fertiliser application. T4–T6 represent a replacement of the reduced N fertiliser application of T1–T3 with organic fertilisers.
Table 3. Cotton yield composition and yield change under fertilisation treatment in different years.
TreatmentYield Composition and Yield
Number of Bolls per Plant/BollsSingle-Boll Weight/gCotton Yield/(kg·hm−2)
202120222021202220212022
CK6.00 ± 0.82 c6.00 ± 0.82 c5.06 ± 0.05 d4.73 ± 0.09 d5886.00 ± 99.84 f5319.33 ± 88.64 e
T08.00 ± 0.82 b7.67 ± 0.47 ab5.25 ± 0.04 c5.14 ± 0.04 c7311.67 ± 89.58 e7011.67 ± 33.04 d
T18.33 ± 0.47 ab7.67 ± 0.47 ab5.27 ± 0.06 bc5.10 ± 0.02 c7482.00 ± 59.40 e7048.67 ± 70.83 d
T28.67 ± 0.47 ab8.00 ± 0.82 ab5.35 ± 0.05 bc5.20 ± 0.04 c7766.33 ± 49.94 d7499.67 ± 120.67 c
T38.00 ± 0.82 b7.00 ± 0.00 bc5.27 ± 0.02 bc5.10 ± 0.18 c7336.33 ± 47.37 e6936.33 ± 115.66 d
T49.33 ± 0.47 ab7.67 ± 0.47 ab5.38 ± 0.07 b5.22 ± 0.02 bc8024.67 ± 97.76 c7858.00 ± 100.00 b
T59.67 ± 0.47 a8.67 ± 0.47 a5.52 ± 0.07 a5.40 ± 0.06 a8624.67 ± 77.86 a8158.00 ± 92.60 a
T69.33 ± 0.47 ab8.00 ± 0.00 ab5.51 ± 0.02 a5.37 ± 0.01 ab8426.00 ± 76.11 b7826.00 ± 91.97 b
Analysis of variance
NNF******
OF******
Y***ns
N × Ynsns*
Note: Values are the mean ± standard deviation. CK represents a fertiliser application of zero units. T0 denotes a chemical fertiliser application only. T1–T3 denote an 8%, 16%, and 24% reduction in N fertiliser application. T4–T6 represent a replacement of the reduced N fertiliser application of T1–T3 with organic fertilisers. Different lowercase letters indicate significant differences among treatments at the 0.05 probability level. * Significant at p < 0.05. ** Significant at p < 0.01. ns, not significant, p ≥ 0.05. The symbols N, NF, and OF are used to indicate the following: N denotes nitrogen fertiliser. NF denotes the pure nitrogen content of the applied inorganic nitrogen fertiliser, that is to say, the amount of nitrogen applied. OF denotes the amount of organic fertiliser replacement.
Table 4. Effect of different fertilisation treatment on economic benefits of cotton production.
YearTreatmentAverage Yield
(kg·ha−1)
Total Income
(CNY·ha−1)
Total Cost
(CNY·ha−1)
Net Benefit
(CNY·ha−1)
Change in Net Benefit
(CNY·ha−1)
2021CK5886.0050,619.6027,000.0023,619.60--
T07311.6762,880.3629,191.3033,689.06--
T17482.0064,345.2029,016.0035,329.201640.14
T27766.3366,790.4428,840.7037,949.744260.68
T37336.3363,092.4428,665.3934,427.05737.99
T48024.6769,012.1629,592.0039,420.165731.10
T58624.6774,172.1629,992.7044,179.4610,490.40
T68426.0072,463.6030,393.3942,070.218381.15
2022CK5319.3338,831.1127,000.0011,831.11--
T07011.6751,185.1929,191.3021,993.89--
T17048.6751,455.2929,016.0022,439.29445.40
T27499.6754,747.5928,840.7025,906.893913.00
T36936.3350,635.2128,665.3921,969.82−24.07
T47858.0057,363.4029,592.0027,771.405777.51
T58158.0059,553.4029,992.7029,560.707566.81
T67826.0057,129.8030,393.3926,736.414742.52
Note: CK represents a fertiliser application of zero units. T0 denotes a chemical fertiliser application only. T1–T3 denote an 8%, 16%, and 24% reduction in N fertiliser application. T4–T6 represent a replacement of the reduced N fertiliser application of T1–T3 with organic fertilisers. The change in net benefit is the difference between the net benefit of each treatment and the net benefit of the T0 treatment. The net benefit of each treatment is deducted from the net benefit of the T0 treatment, and the resulting difference is calculated as the change in net benefit.
Disclaimer/Publisher’s Note: The statements, opinions and data contained in all publications are solely those of the individual author(s) and contributor(s) and not of MDPI and/or the editor(s). MDPI and/or the editor(s) disclaim responsibility for any injury to people or property resulting from any ideas, methods, instructions or products referred to in the content.

