Article

Sowing Date and Seed Rate Influence on Septoria Leaf Blotch Occurrence in Winter Wheat

by
Mohammad Almogdad
1,*,
Agnė Lukošiūtė-Stasiukonienė
1,
Roma Semaškienė
1 and
Viktorija Mačiulytė
2
1
Department of Plant Pathology and Protection, Institute of Agriculture, Lithuanian Research Centre for Agriculture and Forestry, Instituto al. 1, Akademija, LT-58344 Kėdainiai distr., Lithuania
2
Institute of Geosciences, Vilnius University, LT-03225 Vilnius, Lithuania
*
Author to whom correspondence should be addressed.
Agriculture 2024, 14(7), 988; https://doi.org/10.3390/agriculture14070988
Submission received: 30 April 2024 / Revised: 19 June 2024 / Accepted: 24 June 2024 / Published: 25 June 2024
(This article belongs to the Section Crop Protection, Diseases, Pests and Weeds)

Abstract

:
Septoria leaf blotch (SLB), caused by Zymoseptoria tritici, is one of the most important foliar diseases of wheat. The management of this disease is assisted by selecting a sowing time and seeding density that is less favorable to the pathogen. The aim of this research was to evaluate the severity of SLB on winter wheat cv. ‘Etana’ sown at three different sowing times and three seed rates. The severity assessments were performed on the upper two leaves three times during the growth stages using the phenological growth stage key developed by the Biologische Bundesanstalt, Bundessortenamt, and Chemical industry (BBCH), namely stages 37–41, 59–65, and 75. The area under the disease progress curve (AUDPC) was evaluated in each plot. In 2022, seed rates showed significant differences (p = 0.0047), while sowing times did not show significant differences. In contrast, both seed rate and sowing time showed significant effects in 2021 (p = 0.0004 for sowing time and p < 0.0001 for seed rate). During the 2021 growth stage BBCH 75, late sowing times exhibited a significant reduction in SLB on the first leaf. The reduction ranged from 47.0% to 52.6% compared to the optimal sowing time, and from 59.2% to 66.2% compared to the early sowing time. At optimal sowing times (between 11 September and 25 September), seed rates of 400 and 450 seeds/m2 resulted in a low SLB. At late sowing times in 2022, a lower SLB (43.2% compared to the early sowing time) was obtained from seed rates of 400 seeds/m2. No significant interaction was observed between sowing time and seed rate across both study years. In the absence of interaction, the effects of sowing time and seed rate on SLB severity were independent and not additive. In 2022, the highest values of AUDPC were recorded for the early sowing time and the highest seed rate. Increasing the seed rate (450 seeds m−2) gave higher AUDPC at early sowing time with significant differences compared to other seed rates at optimal or late sowing times. In conclusion, our findings highlight the significant influence of sowing time and seed rate on SLB severity in winter wheat. Understanding these factors can inform agricultural practices to better manage SLB. Future research should explore additional agronomic practices and environmental factors to develop comprehensive strategies for SLB management.

1. Introduction

Wheat (Triticum aestivum L.) is one of the most important and widely cultivated food crops not only in Lithuania, but also worldwide [1]. The winter wheat crop, with a total production of 3.8 million tonnes, was the most important cereal in 2021 in Lithuania, accounting for 91% of the total winter cereal production [2]. Numerous biotic and abiotic factors that are common in the wheat production system may be at fault for the reduced productivity. Wheat spot blotch, one of the biotic restrictions, has become a significant issue and a serious danger to wheat production [3].
Despite the diversity of wheat cultivars, winter wheat is susceptible to fungal diseases [4]. Septoria leaf blotch (SLB), caused by Zymoseptoria tritici, is an important fungal disease of wheat and causes severe damage to wheat crops worldwide [5]. Zymoseptoria tritici was rated as one of the top 10 economically important fungal pathogens in the world [6]. SLB poses a serious and persistent challenge to wheat grown in temperate climates throughout the world [7]. SLB can have a significant impact on wheat yields across Europe. Studies have shown year-over-year losses ranging from 5% to 10% in the major wheat-producing countries of France, Germany, and the UK [7]. Furthermore, research in the Mediterranean region of Tunis found that wheat yields decreased by up to 384–325 kg/ha for each incremental increase in disease severity on a 0–9 scale [8]. The most severe impact was seen in Ethiopia, where unsprayed plots experienced relative grain yield losses as high as 36–39% [9]. Environmental concerns and changes in the cost/revenue ratio for winter wheat increase the demand for more accurate identification of spraying needs [4]. Because of the potential yield loss, growers tend to spray fungicides several times each year to protect their crops from this disease; however, actual disease levels do not always justify a fungicide spray [10]. In years with a low disease risk, a lower fungicide dose could be used [11]. If an SLB severity that is not economically damaging could be predicted, fungicide usage could be adjusted accordingly, because this may have economic and environmental benefits [10]. In 2020, the European Commission published a new biodiversity strategy that aims to decrease the use of pesticides by 50% [12].
Lots of fungal diseases occur, at least initially, in discrete foci within a healthy crop, and this is due to three factors, either alone or in combination: uneven survival of founding disease propagules, uneven arrival of propagules from elsewhere, or the patchy distribution of favorable microclimates within the field [13]. Drilling cereals early in warmer conditions can increase the risk of pest, disease, and lodging problems [14]. The risk of SLB infection is increased in early sowing time [15]. Late sowing of winter wheat may also be used as a strategy to moderate the amount of initial infection by avoiding ascospore flights to a newly planted wheat crop [16]. According to Craigie et al. [15], lower plant populations with a less dense canopy may have less disease incidence. Winter wheat growth and its yield are really sensitive to environmental changes [17]. Weather is one of the major components that controls agricultural production, and it is known to be of great importance for fungal plant pathogens. Various weather factors influence the epidemic progress and SLB severity [18,19,20,21]. For SLB, quantitative relationships with the weather have been identified previously [22,23,24,25]. Weather conditions, including critical meteorological variables such as precipitation, air temperature, and solar radiation, may explain up to 80% of the variation in agricultural production, but grain yield also depends on edaphic, hydrological, and agronomic factors [26].
Our research offers valuable insights into the interaction between sowing time, seed rate, and SLB occurrence in winter wheat, addressing a significant challenge for wheat growers worldwide. By systematically analyzing different sowing times and seed rates across study years, we revealed the critical role of these agronomic factors in SLB severity. The findings provide practical guidance for optimizing sowing strategies to mitigate SLB risk, potentially enhancing wheat yield while minimizing disease-related losses. This research aimed to improve crop growth by identifying the optimal sowing time and seed rate to reduce the incidence and severity of SLB in winter wheat. Additionally, the study sought to assess the effect of the interaction between sowing times and seed rates on disease severity.

2. Materials and Methods

2.1. Experimental Design

The research was conducted during the 2020–2021 and 2021–2022 growing seasons in the experimental field located at the Institute of Agriculture, Lithuanian Research Centre for Agriculture and Forestry in the Kėdainiai district of central Lithuania. The research was conducted using the winter wheat cv. ‘Etana’. In the 2020–2021 growing season, the winter wheat was sown after peas, while in the 2021–2022 growing season, it was sown after winter rape. Winter wheat was grown after peas in the 2020–2021 season and fertilized in autumn with NPK 6-18-34 at 400 kg ha−1, and in spring with ammonium nitrate at N60, N90, and N50. Weeds were controlled using the herbicides Legacy 500 SC (diflufenican) at 0.25 L ha−1 and Sekator OD (amidosulfuron 100 g L−1, methyldosulfuron sodium 25 g L−1) at 0.15 L ha−1. The growth regulators used were Cycocel 750 (chlormequat chloride 750 g L−1) at 1 L ha−1 and Moddus 250 EC (trinexapac-ethyl 250 g L−1) at 0.4 L ha−1. For the 2021–2022 season, winter wheat was grown after winter oilseed rape and fertilized in autumn with NPK 6-18-34 at 400 kg ha−1, and in spring with ammonium nitrate at N60 and N90. Weed control was managed using the herbicides Grodyl (amidosulfuron) at 20 g ha−1, Trimmer 50 SG (tribenuron methyl) at 20 g ha−1, and Lignum adhesive at 0.1 L ha−1. The growth regulators used were Cycocel 750 (chlormequat chloride 750 g L−1) at 1 L ha−1 and Moddus 250 EC (trinexapac-ethyl 250 g L−1) at 0.4 L ha−1. The soil of the local site is classified as Cambisol (loam, drained, Endocalcaric, Endogleyic) [27]. The study involved testing three sowing times. Early sowing refers to dates before 10 September, optimal sowing occurred between 11 September and 25 September, and late sowing encompassed dates from 26 September to 15 October. For the year 2020, early sowing took place on 4 September, optimal sowing on 16 September, and late sowing on 8 October. In 2021, early sowing was on 3 September, optimal sowing on 23 September, and late sowing on 12 October. Three seeding rates (350, 400, and 450 seeds/m2) using a randomized complete block design with four replications were used. Each treatment was randomly allocated within the block and replicated four times. The field trial was conducted using a Wintersteiger plot drill machine, with the plots measuring 15 m2 (10 × 1.5 m) and a 2 m distance between replicates. Additionally, there was a 0.25 m distance between plots.

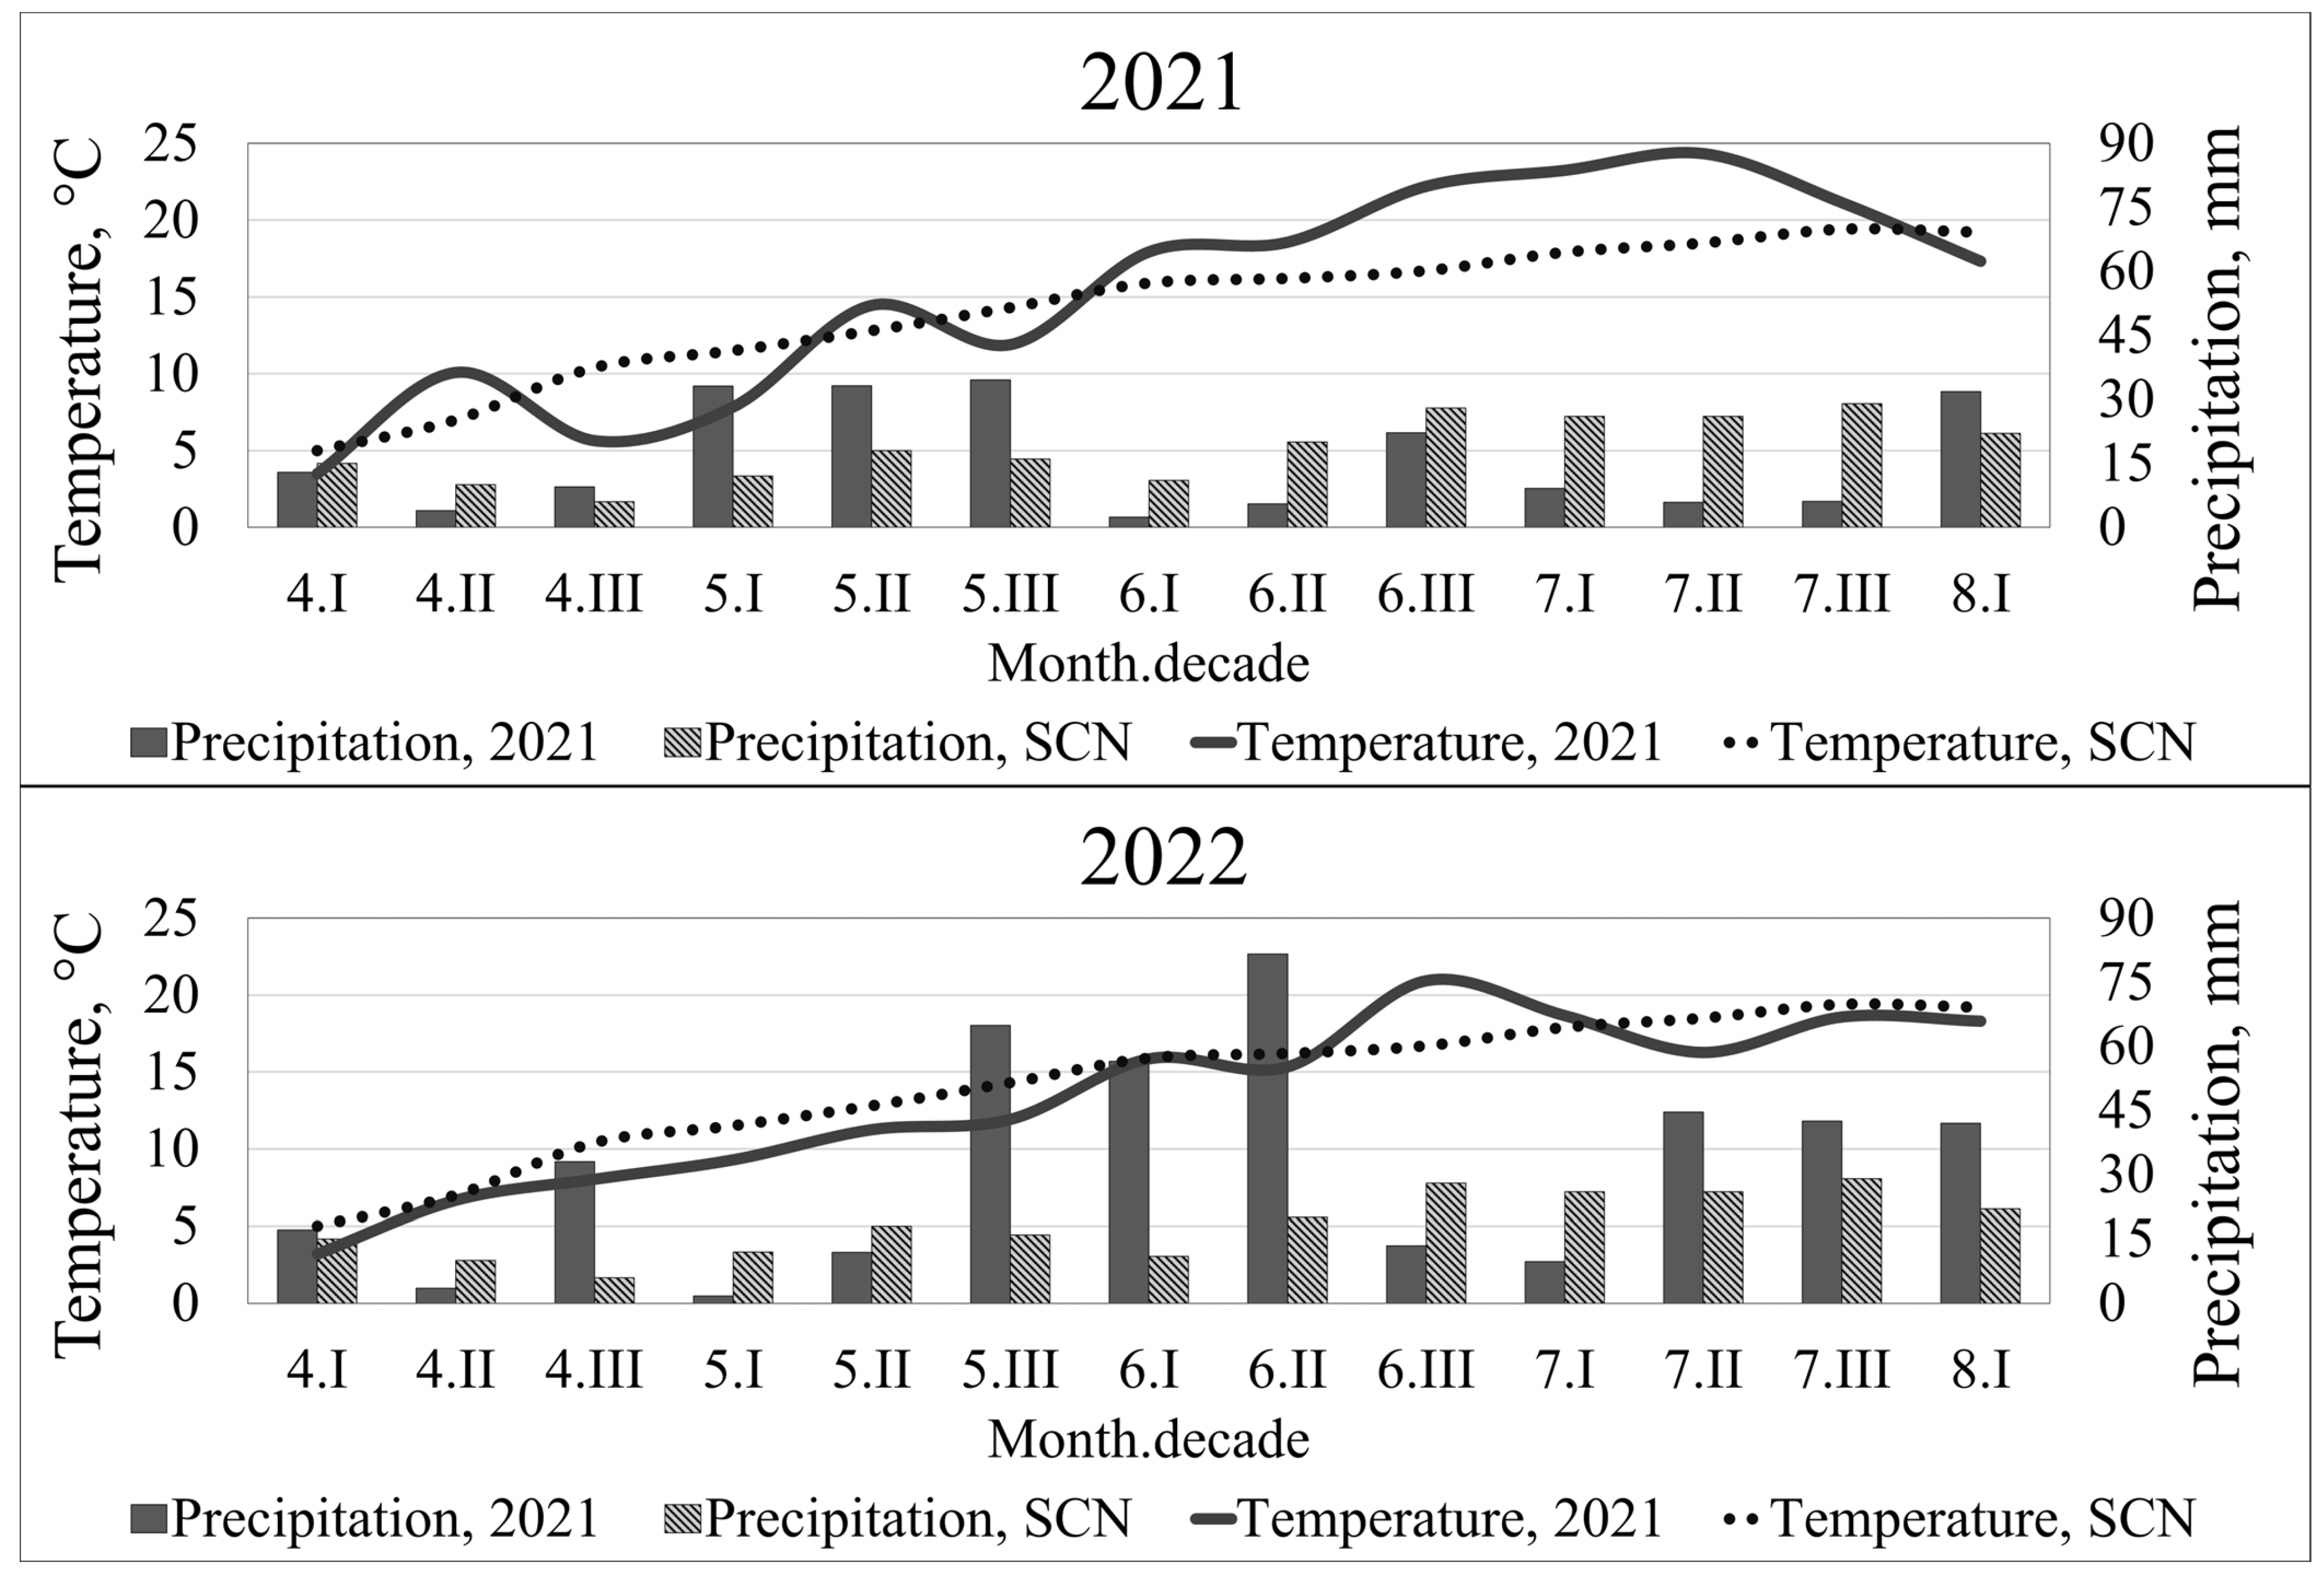
2.2. Weather Conditions

Meteorological conditions were obtained from the official meteorological station located 2 km from the experimental field. The study utilized data on air temperature measured at a 1.5 m height and the amount of precipitation during the 2020–2022 growing seasons. The standard climate normal (SCN) was determined using the average of the years 1991–2020. All meteorological data were provided by the Lithuanian Hydrometeorological Service under the Ministry of Environment, ensuring the accuracy and reliability of the data used in the study.

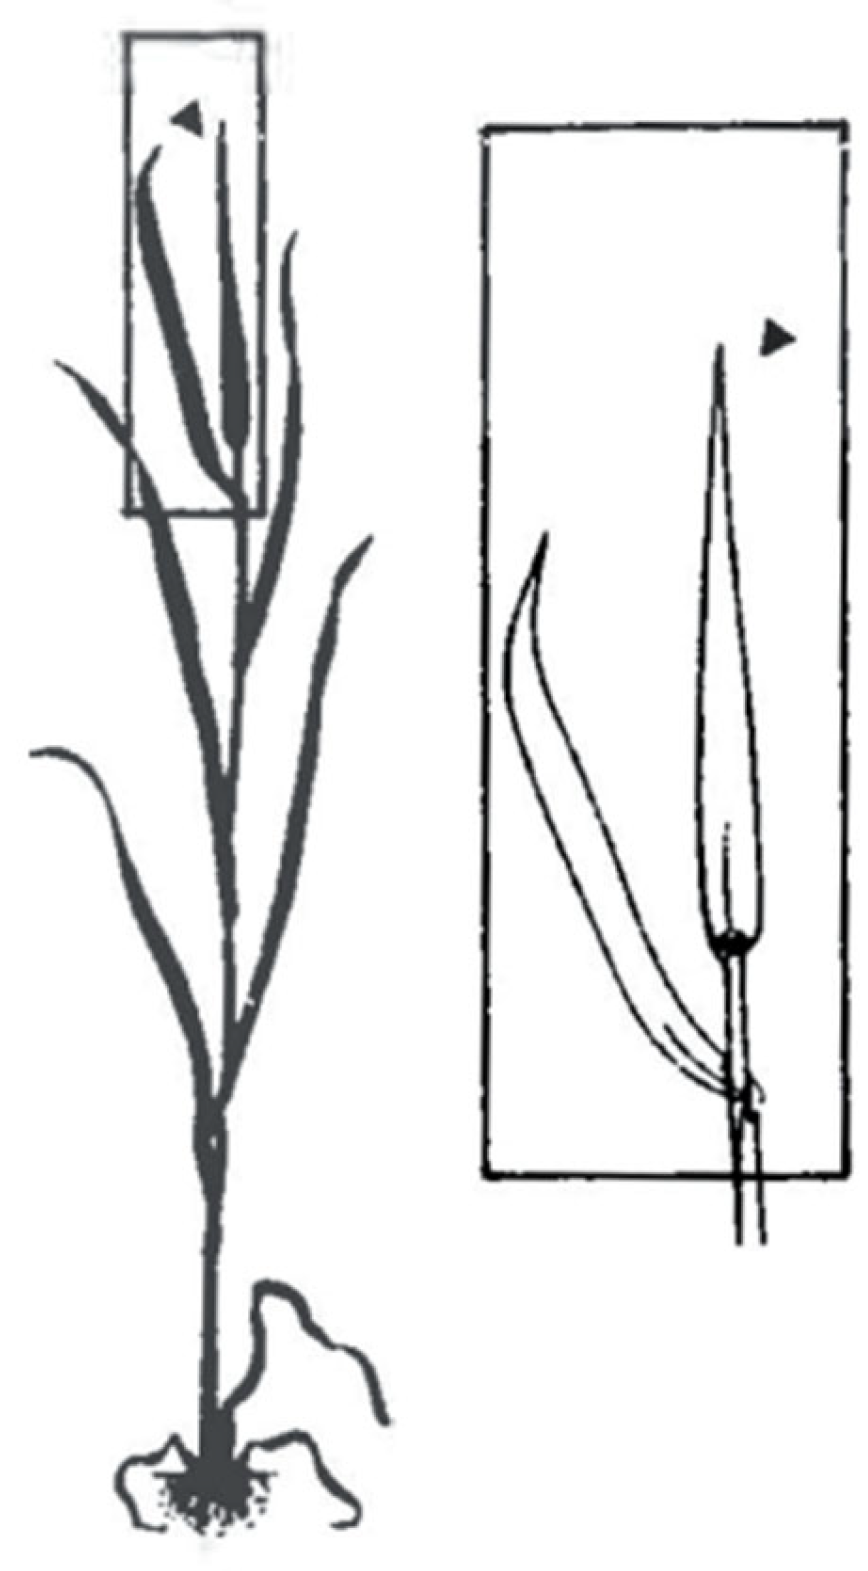
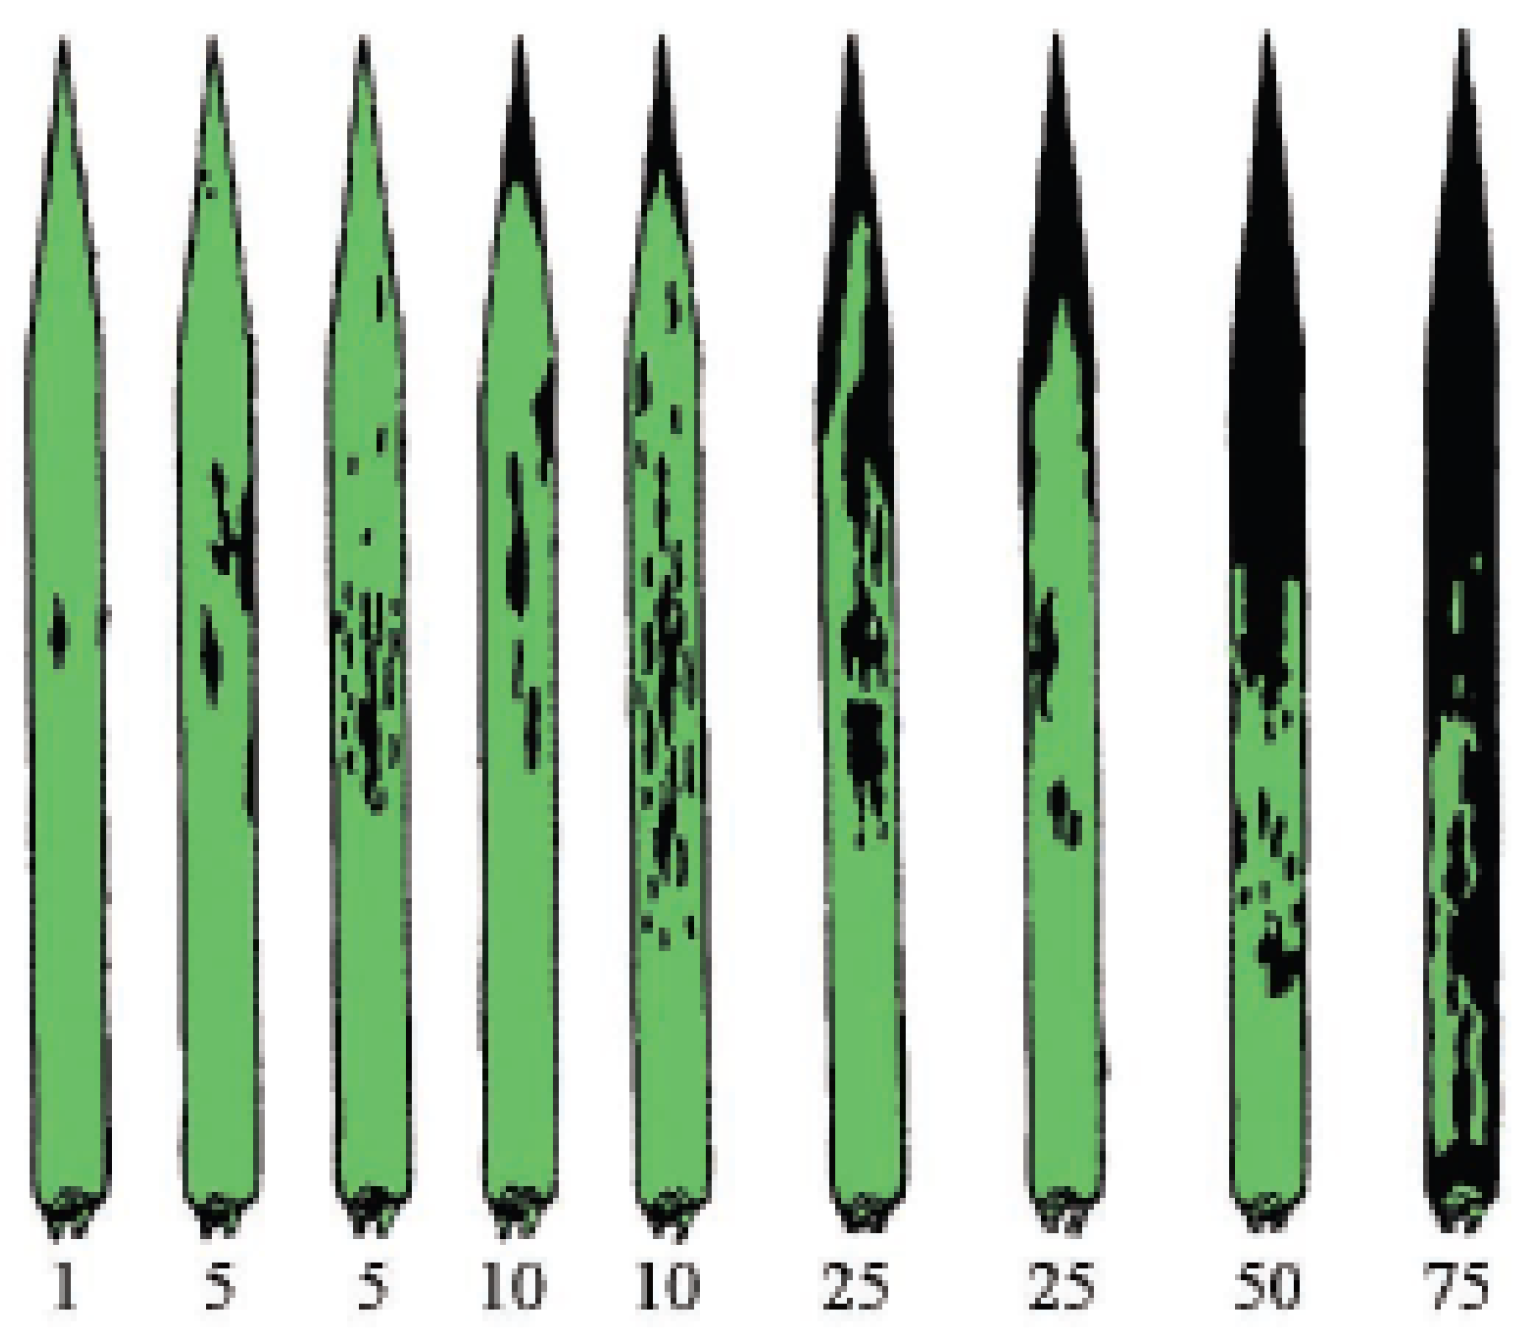
2.3. Severity of Septoria Leaf Blotch (SLB)

The severity of SLB disease was assessed at three distinct growth stages (BBCH 37–41, 59–65, and 75) using the methods detailed in the European and Mediterranean Plant Protection Organization (EPPO) standard (PP1/26(4), 2012) [28]. To evaluate disease severity, the diseased leaf area was visually assessed on the 1st leaf (flag leaf) (Figure 1) and the 2nd leaf of 10 randomly selected main tillers per plot, with the degree of infection on each plant’s leaves being recorded using the scale (Figure 2). This rigorous and standardized approach ensured accurate and reliable assessment of disease severity throughout the study. In each growing season, using the data collected during flag leaf fully unrolled, the beginning of flowering, and the medium milk phenological growth stages, the severity of SLB disease was quantified by calculating the area under the disease progress curve (AUDPC) using the following formula outlined by Simko and Piepho [29]. This standardized approach allowed for accurate and consistent measurement of disease severity across both growing seasons, enabling meaningful comparisons between treatments.
A U D P C = i = 1 n 1 ( y i + y i + 1 ) / 2 × ( t i + 1 t i )
where n is the total number of assessments; yi—disease severity (%) at the ith assessment; ti—days at the ith assessment.

2.4. Statistical Analysis

Data were analyzed using SAS statistical software 9.4 (SAS Institute Inc., Cary, NC, USA) without transformation. Data for SLB disease severity were analyzed using a mixed effects model with sowing time and seed rate as fixed effects and the year as a random effect. The differences in the severity of SLB across various sowing times for each seed rate, as well as across different seed rates within each sowing time, were analyzed individually using Duncan’s multiple range test at the significance level p ≤ 0.05. Pairwise comparison of means (among the sowing times for all seed rates, and among the seed rates for all sowing times), where significant effects were found, were made using the Tukey–Kramer method. For every data analysis, 95% significance levels were used.

3. Results

3.1. Weather Conditions during the Investigation Period

Figure 3 shows the temperature and precipitation for the decades of the growing season in 2021 and 2022. The average annual air temperature in the experimental area from 1991 to 2020 was 7.5 °C, and the annual precipitation amount was 566 mm. The warmest month was July (18.6 °C), while the coldest months were January and February (−3.0 °C and −2.6 °C, respectively). On average, the highest precipitation amount was recorded in July (80 mm), while the lowest amount was recorded in February, March, and April (31–32 mm). The average air temperature during the growing season (1 April–10 August) in 2021 was 1.3 °C higher than SCN, reaching 15.1 °C. The precipitation during the analyzed period was 178 mm, which is 17% less than the SCN amount for the same period. The snow cover lasted until the end of February, but the spring was relatively cool and late (April was 1.1 °C colder, and May was 1.5 °C colder, than normal). The last frost (temperature below 0 °C at a height of 5 cm) was recorded on 5 May. It started to significantly warm up from the 10th of May when the air temperature reached 10 degrees and above. The last months of the season (June and July) were considerably warmer (+3.3 °C and +4.3 °C anomaly) and drier (only 51% and 26% of the normal precipitation) than usual. The wettest period can be considered the second half of May when it did not rain for just one day from 14–28 May. Between the recorded growth stages BBCH 37–41 and BBCH 59–65, the amount of precipitation was low.

3.2. Multi-Factor Analysis of the Effect of Sowing Time and Seed Rate on the Severity of Septoria Leaf Blotch (SLB)

There were no statistically significant interactions between sowing times and seed rates (Table 1). The effect of seed rates was more pronounced in 2022, whereas the effect of sowing times was more noticeable in both study years.

3.3. The Severity of Septoria Leaf Blotch on the First and Second Leaves in Winter Wheat

SLB was rigorously assessed under field conditions. The mean values of leaf blotch severity were calculated for both the first and the second leaves, highlighting the widespread distribution and severity of the disease. SLB severity was meticulously monitored and recorded at three crucial growth stages of wheat (BBCH 37–41, BBCH 59–65, and BBCH 75).
It is noteworthy that during the initial growth stage (BBCH 37–41), all plants were healthy, and no SLB symptoms were observed in either year, regardless of sowing time or seed rate. Table 2 shows that in 2021, the leaf blotch severity (LBS) on the first leaf ranged from a mere 0.03% to a staggering 9.18%. Remarkably, during the BBCH 59–65 growth stage, the earliest sowing time resulted in the lowest LBS, while the optimal sowing time yielded the highest severity of 0.98%. The late-sown crop exhibited the lowest severity of 4.32, 4.40, and 4.67% at seed rates of 350, 450, and 400 seeds/m2, respectively, during the BBCH 75 growth stage. In 2022, during the BBCH 75 growth stage, the LBS was significantly higher (ranging from 16.75% to 24.13% at varying seed rates) for the early-sown wheat when compared to both the optimal and late-sown crops. Conversely, the optimal and late-sown crops exhibited lower LBS (ranging from 6.00% to 11.90% at varying seed rates), indicating a potential advantage to delaying sowing until a later time. When sown at the optimal time, seed rates of 350 and 400 seeds/m2 resulted in a lower LBS of 6.00% and 6.58%, respectively, demonstrating a significant difference in comparison to the seed rate of 450 seeds/m2, which yielded a LBS of 9.70%. SLB exhibited significant variation across different sowing times under natural infection conditions in both 2021 and 2022. During the 2021 growth stage BBCH 75, the early and optimal sowing times resulted in a higher SLB, whereas later sowing times exhibited a significant reduction in SLB on the first leaf. At the growth stage BBCH 75, late-sown plants had a lower SLB mean of 4.47%, while earlier sowing times resulted in increased severity, with wheat sown at early and optimal times exhibiting 7.03% and 8.93%, respectively. During 2022, plots sown at optimal and late times had significantly lower SLB means of 7.43% and 10.22%, respectively, while plots sown at early times exhibited a much higher SLB mean of 19.68%. There were no significant differences between seed rates during 2021, with SLB means remaining largely consistent across all growth stages. In contrast, during 2022’s BBCH 75 growth stage, plots with seed rates of 450 seeds/m2 exhibited a slightly higher SLB of 15.24%, as compared to seed rates of 350 and 400 seeds/m2, which had SLBs of 11.17% and 10.19%, respectively. The growing season of 2022 was especially rainy, which could have determined wet conditions, and may be associated with a higher SLB in the denser area than in the less dense area. 2021 was significantly less wet, and SLB remained similar across all seed rates.
The results for the second leaf at the BBCH 37–41 growth stage in both 2021 and 2022 mirrored those of the first leaf, with no SLB incidence (Table 3). During the BBCH 59–65 growth stage, SLB ranged from 2.45% to 5.65%, with early sowing times exhibiting the lowest SLB and optimal sowing times exhibiting the highest. No significant differences were observed between sowing times or seed rates at the BBCH 75 growth stage. However, at early sowing times, a lower SLB was observed in plots with a seed rate of 350 seeds/m2. At optimal sowing times, seed rates of 400 and 450 seeds/m2 resulted in a lower SLB of 36.88%. However, at late sowing times, a lower SLB of 31.50% was obtained from seed rates of 400 seeds/m2. This is in comparison to seed rates of 350 and 450 seeds/m2, which yielded SLBs of 33.90% and 34.75%, respectively. In 2022, during the BBCH 59–65 growth stage, late-sown plants exhibited SLBs ranging from 6.90% to 8.20%, which were significantly higher compared to early and optimal sowing times across all seed rates. Conversely, during the BBCH 75 growth stage, late-sown plants exhibited significantly lower SLBs compared to early and optimal sowing times across all seed rates. At different sowing times, the seed rate of 350 seeds/m2 yielded slightly lower SLB compared to other seed rates. In 2021, no significant differences were observed between sowing times at the BBCH 75 growth stage; however, in 2022, the lowest SLB mean of 28.88% was recorded in late-sown plants, with significant differences in comparison to early-sown (47.21%) or optimal (43.67%) plants. Like the first leaf, no significant differences were observed between seed rates at every stage of growth in 2021. However, during the BBCH 75 growth stage in 2022, plots with seed rates of 300 seeds/m2 exhibited a significantly higher SLB of 34.54% as compared to seed rates of 400 and 450 seeds/m2, which had SLBs of 40.36% and 44.59%, respectively.

3.4. Effect of Sowing Time and Seed Rate on the Area under Disease Progress Curve (AUDPC) Values of Septoria Leaf Blotch

No significant interaction was observed between sowing time and seed rate across both study years, as shown in Table 4. The mixed effects model identified sowing time and seed rate as key determinants of the area under disease progress curve (AUDPC) in 2022, with the influence of sowing time being more apparent in both study years. However, the effect of seed rates was more pronounced in 2022.
Table 5 provides precipitation amounts and temperature averages and their deviations from the long-term averages across various growth stages. The temperature was significantly higher than SCN for the late sowing time compared to the others. Between BBCH 59–65 and BBCH 75, the precipitation amount was half the SCN, but the temperature was significantly higher than SCN (the average temperature for the period was 20.6–22.4 °C depending on the sowing field).
The average air temperature during the 2022 growing season was 0.8 °C colder than SCN, reaching 13.0 °C. The precipitation amount during the season was 380 mm, which was 176% more than SCN. At the beginning of April, the last snow melted. April and May were cold (1.5–2 °C below SCN) and rainy (73–75% more precipitation than SCN). The last frost (air temperature less than 0 °C at a height of 5 cm) was recorded on 24 May. June was even wetter than spring (3.6 times more precipitation than SCN), but it was also 1.1 °C warmer. July, on the other hand, was colder and slightly wetter than SCN (0.8 °C colder and 20% more precipitation). The second half of May and two-thirds of July were particularly rainy, with many days of precipitation recorded. During this period, there were 8 days with heavy precipitation (at least 10 mm per day). Between BBCH 37–41 and BBCH 59–65 growing stages, the precipitation amount was almost four times higher than SCN, even though the air temperature was close to SCN or slightly lower. Between BBCH 59–65 and BBCH 75, the precipitation was higher than SCN for both early and optimal sowing times, but lower than SCN for the late sowing time. Meanwhile, the air temperature was significantly higher than SCN, and the average temperature for the period was 19.9–21.2 °C (depending on the sowing time, which determines the growth stages).
Significant variation in mean AUDPC values was observed among sowing times and seed rates, as shown in Figure 4. In 2021, the lowest AUDPC values were observed at the optimal sowing time across all seed rates. Conversely, the late sowing time at seed rates of 350 and 450 seeds/m2 yielded the highest AUDPC values of 445.75 and 424.18, respectively. In comparison to the late sowing time, both early and optimal sowing times exhibited significantly lower AUDPC values. Mean AUDPC values for the seed rate of 350 seeds/m2 at early and optimal sowing times (290.22 and 350.48, respectively) were significantly lower than the mean AUDPC value for the late sowing time. These findings illustrate the clear impact of sowing dates on the development of the disease. In 2022, the disease severity of test seed rates varied based on the time of sowing, highlighting the impact of environmental factors on disease severity, such as an exceptionally high precipitation amount between BBCH 37–41 and BBCH 59–65 stages. This observation underscores how different sowing times can be affected by these factors. No significant differences were observed between sowing times at the seed rate of 350 seeds/m2. However, increasing the seed rate to 450 seeds/m2 resulted in higher AUDPC values at early sowing times, with significant differences observed in comparison to other seed rates at optimal or late sowing times. The analysis of the data from 2021 and 2022 reveals that the impact of seed rate on AUDPC varies significantly across different sowing times. In 2021, with a p-value of 0.0166, early sowing showed a slight increase in AUDPC with higher seed rates (slope = 0.4348), while optimal sowing exhibited a slight decrease (slope = −0.1596), and late sowing showed an initial decrease followed by an increase in AUDPC (slope = −0.2157). In 2022, with a p-value of less than 0.0001, early sowing demonstrated a strong positive relationship between seed rate and AUDPC (slope = 0.9963), optimal sowing had a moderate increase (slope = 0.3751), and late sowing showed a significant increase in AUDPC with higher seed rates (slope = 0.9091).

4. Discussion

Our results showed that the severity of Septoria leaf blotch (SLB) varied among sowing times. The spread of the leaf spot pathogen may have coincided with crop stages that were not favorable for the pathogen’s infection at the planting dates when Septoria leaf spot prevalence was notably low. This could be due to various factors, such as resistance in the plants or weather conditions that were not conducive to the pathogen’s development. The findings of this study agreed with Akhileshwari et al. [32], who reported that adjusting planting dates is one of the crucial cultural practices that may be used to reduce the disease severity. The authors suggested that deliberate adjustment of planting dates resulted in a reduction in the severity of powdery mildew in sunflowers. According to Apeyuan et al. [33], selectively changing planting dates proved successful in controlling several plant diseases. SLB tends to thrive under conditions where plants experience prolonged drip wetting, ideally for at least 8 h, and high relative humidity levels of 98–100%. Consequently, the disease is commonly observed in regions characterized by ample moisture availability [34]. Specifically, adequate precipitation leading to extended periods of leaf wetness is crucial for successful infection. These prolonged leaf wetness periods facilitate pathogen infection [35]. The favorable weather conditions for the spread of the disease may be one of the most important factors that contributed to the difference in the effect of the sowing time on the severity of the disease. SLB epidemics are significantly influenced by specific meteorological conditions. Henze et al. [35] reported that the key conditions include an average temperature of approximately 13.62 °C, leaf wetness of around 92.39%, and minimal precipitation (0.04 mm per day). These conditions were consistently observed about 20 days before epidemic outbreaks. The study also found that an increase in temperature by 1 °C during the infection period reduced the latent period by 0.95 days, and an increase in average temperature during the latent period reduced it by 0.2 days. Kpu et al. [36] found that the intensity and prevalence of leaf spot of Telfairia occidentalis in the field were significantly influenced by the meteorological variables, such as air temperature, precipitation amount, relative humidity, and wind, which can determine the speed with which the spot disease spreads. This outcome is consistent with earlier research. Kone et al. [37] and Ilondu [38] reported that under humid and warm conditions, the spores of leaf spot diseases quickly germinated, causing the disease to expand further among the plants. Based on the results of our study, the decadal precipitation in the decade from 3 May to 2 June in 2022 was exceptionally high, and such wet conditions may be associated with higher fixed rates of leaf disease than in 2021, when precipitation was not as exceptionally high. Our findings showed that the severity of SLB in the first leaf in both study years at growth stage GS 75 was more significant in the early sowing time, which showed higher risks of infection than those sown at a late sowing time. In 2020 and 2021, in the first decade of September, when sowing was carried out, the average air temperature was 15.1 and 13.5 °C, respectively (SCN, 14.5 °C), and the amount of precipitation was lower than usual (9.2 mm in 2020, 1.3 mm in 2021, SCN 17 mm). Similarly, Shaw and Royle [19] found that winter wheat seeds planted early had slower stem expansions, giving the pathogen more time to spread from older to younger leaves. Conversely, compared to late-sown plants, early-sown plants generated more leaves, which increased the number of inoculums present. Additionally, other factors, such as the suppression of plant defense response under high-density planting, may contribute to increased susceptibility to SLB. Density-dependent light cues play a crucial role in regulating defense levels [39]. To avoid future shading by neighboring plants, plants exhibit a suite of responses to position their leaves favorably with respect to the light gradient [40]. An important light cue used by plants to detect future shading is the red to far-red ratio (R:FR) [41]. The R:FR ratio is typically lower in dense canopies than in open canopies. A low R:FR ratio represses the activity of the jasmonate pathway, a phytohormonal pathway involved in plant defense against necrotrophic pathogens [42]. Consequently, shade-avoidance responses and defense mechanisms are interconnected at the level of signal transduction networks through a common light cue, resulting in increased susceptibility to pathogens in competitive environments characterized by a low R:FR [42]. No significant differences were noticed among tested plant densities. Ansar et al. [43] found an increase in the development of SLB in plants sown with high density (600 tillers m−2). Increased disease severity was observed, likely due to higher relative humidity, which was influenced by the dense canopy created by higher seed rates and later sowing times. Dense canopies can trap moisture, leading to prolonged leaf wetness and favorable conditions for SLB development [44]. Our study found that lower seeding rates during the BBCH 75 growth stage in 2022 resulted in higher SLB incidence, contrary to typical findings in the literature. This could be due to microclimatic conditions at lower densities, such as increased leaf wetness duration promoting SLB, while higher densities might have dried quicker. Additionally, specific environmental factors during our study, like temperature and humidity, could have interacted differently with seeding rates. Pathogen spread dynamics and variations in host–pathogen interactions at different densities may also play a role. Further research is needed to fully understand these mechanisms and the conditions under which lower seeding rates lead to higher SLB incidence. Nevertheless, SLB can pose a threat in regions with lower humidity levels, as pathogens can exploit intermittent wet periods, which often occur due to regular dewfall [34]. According to Juroszek and Von Tiedemann [45], changing the sowing dates of crops can be an effective and low-cost option for rendering the crop less vulnerable to diseases. Several agronomic practices, e.g., late sowing and planting of resistant cultivars [18,46,47], have shown some potential to keep the disease levels low and minimize epidemics [48]. Late sowing can decrease the disease levels and the epidemic is generally delayed in winter wheat crops [49].
The AUDPC values were lowest in the optimal sowing time in 2021 and 2022, although the sowing time had an impact on disease development later in the season. This may have occurred as a result of inoculums from early-sown plots spreading to late-sown plots. Furthermore, in 2022, under early-sown conditions, possibly due to increasing temperature, Z. tritici multiplied quickly as the plants grew and caused infection in more plants than those at optimal or late-sown times. Aryal et al. [50] reported that later in the season, disease development was affected by seed infection. The similar findings of Gurung et al. [51], who also observed increased AUDPC values under late-sown conditions, nearly fully support the conclusions of the present study in 2021. The results of the AUDPC in 2022 may be related to the combined effects of terminal heat stress, easily available inoculums from the early-sown wheat fields, and lower-temperature and more humid conditions occurring on the second and third times of sowing. In 2022, there was an unfortunate rainy period from 3 May to 2 June, followed by a heat wave (from 24 June to 2 July, the maximum daytime temperature exceeded 27 °C); therefore, the conditions for the spread of the disease could have been very favorable. Additionally, the differences between the sowing time fields may be related to the different phase of plant growth and the plant’s sensitivity in that phase, even under the same meteorological conditions. According to Duveiller et al. [52], higher temperatures and increased inoculum pressure may make plants more susceptible to pathogen infection and promote the appearance of disease. A very late sowing time often did not avoid disease damage, especially in high temperatures, which is consistent with Nema and Joshi [53]. High temperature is most likely responsible for the increased AUDPC values under late-sown conditions since it makes spot blotch development more severe [53,54]. It is even possible that the early-seeded wheat crop formed as a source of inoculum and allowed the disease to spread, infecting late-seeded wheat heavily at crucial growth stages. Furthermore, the duration of the green leaf area in late-planted wheat is shorter, and this duration may be further decreased by the substantial inoculum load, which may have a greater effect due to the earlier grain-filling.
Our research was conducted under natural field infection conditions without the use of fungicides for disease control. In 2021, a high incidence of Microdochium nivale was observed during the early growth stages. This early infection likely prompted the plants to compensate for the damage by producing additional tillers. This compensatory growth may have mitigated the potential impact on yield, resulting in no significant differences across different sowing times. Furthermore, the optimal weather conditions during the crop development period likely facilitated the plants’ ability to recover from disease damage, contributing to yield stability across the treatments. In 2022, although SLB severity was lower at the lowest seed rate and increased slightly with higher seed rates, the overall impact on yield remained negligible. This suggests that the crop’s capacity to compensate for disease damage and the favorable growing conditions played a crucial role in maintaining yield stability. Additionally, the severity of SLB may not have reached a threshold level that significantly impacts yield. Favorable conditions during the growing season might have further sustained the yield despite the presence of disease.

5. Conclusions

Based on the data analysis, it is evident that the severity of Septoria leaf blotch (SLB) was significantly lower in winter wheat that was sown during the optimal sowing period (11–25 September) as compared to the early sowing period (before 10 September) and the late sowing period (from 26 September to 15 October). These findings provide strong evidence that the timing of sowing has a significant impact on the severity of SLB in winter wheat crops.
The severity of SLB disease was significantly lower in winter wheat crops sown at a rate of 350 seeds/m2, compared to those sown at rates of 400 and 450 seeds/m2. These findings provide robust evidence that the susceptibility of winter wheat to SLB is significantly influenced by the seeding rate, with lower seeding rates resulting in reduced disease severity.
It was determined that the seeding rate had the greatest impact on reducing the severity of SLB, followed by the sowing time. Based on the combination of our findings, utilizing the second sowing time window (between 11–25 September) at a seeding rate of 450 seeds/m2 may be an effective method to control the severity of SLB. This will provide valuable insights for farmers and agricultural practitioners seeking to reduce the impact of this devastating disease.
Our findings suggest that the effect of seed rate on AUDPC is influenced by sowing time, with early and late sowing times generally showing higher sensitivity to changes in seed rate compared to the optimal sowing time.

Author Contributions

Conceptualization, A.L.-S.; methodology, A.L.-S.; formal analysis, M.A.; investigation, A.L.-S.; writing—original draft preparation, M.A.; writing—review and editing, V.M. and R.S.; supervision, R.S. All authors have read and agreed to the published version of the manuscript.

Funding

Part of this research was supported by the long-term research program “Harmful Organ isms in Agro and Forest Ecosystems” implemented by the Lithuanian Research Centre for Agriculture and Forestry.

Institutional Review Board Statement

Not applicable.

Data Availability Statement

Data are contained within the article.

Acknowledgments

The authors would like to thank the technical team of the Department of Plant Pathology and Protection of the Institute of Agriculture, Lithuanian Research Centre for Agriculture and Forestry for their contribution to this research.

Conflicts of Interest

The authors declare no conflicts of interest.

References

  1. FAO. Cereal Supply and Demand Brief. Food and Agriculture Organization of the United Nations. Available online: https://www.fao.org/worldfoodsituation/csdb/en (accessed on 29 April 2024).
  2. Crop Production—Oficialiosios Statistikos Portalas. Available online: https://osp.stat.gov.lt/lietuvos-aplinka-zemes-ukis-ir-energetika-2021/zemes-ukis/augalininkyste (accessed on 29 April 2024).
  3. Nepal, S.; Shrestha, S.M.; Manadhar, H.K.; Yadav, R.K. Field Response of Wheat Genotypes to Spot Blotch under Different Sowing Dates at Rampur, Chitwan, Nepal. J. Agric. For. Univ. 2020, 4, 83–90. [Google Scholar] [CrossRef]
  4. El Jarroudi, M.; Kouadio, L.; Delfosse, P.; Giraud, F.; Junk, J.; Hoffmann, L.; Maraite, H.; Tychon, B. Typology of the Main Fungal Diseases Affecting Winter Wheat in the Grand Duchy of Luxembourg. J. Agric. Sci. Technol. 2012, 2, 1386–1399. [Google Scholar]
  5. El Jarroudi, M.; Kouadio, A.L.; Mackels, C.; Tychon, B.; Delfosse, P.; Bock, C.H. A Comparison between Visual Estimates and Image Analysis Measurements to Determine Septoria Leaf Blotch Severity in Winter Wheat. Plant Pathol. 2015, 64, 355–364. [Google Scholar] [CrossRef]
  6. Dean, R.; Van Kan, J.A.L.; Pretorius, Z.A.; Hammond-Kosack, K.E.; Di Pietro, A.; Spanu, P.D.; Rudd, J.J.; Dickman, M.; Kahmann, R.; Ellis, J.; et al. The Top 10 Fungal Pathogens in Molecular Plant Pathology. Mol. Plant Pathol. 2012, 13, 414–430. [Google Scholar] [CrossRef] [PubMed]
  7. Fones, H.; Gurr, S. The Impact of Septoria tritici Blotch Disease on Wheat: An EU Perspective. Fungal Genet. Biol. 2015, 79, 3–7. [Google Scholar] [CrossRef] [PubMed]
  8. Berraies, S.; Gharbi, M.S.; Rezgui, S.; Yahyaoui, A. Estimating Grain Yield Losses Caused by Septoria Leaf Blotch on Durum Wheat in Tunisia. Chil. J. Agric. Res. 2014, 74, 432–437. [Google Scholar] [CrossRef]
  9. Tadesse, Y.; Chala, A.; Kassa, B. Yield Loss Due to Septoria Tritici Blotch (Septoria tritici) of Bread Wheat (Triticum aestivum L.) in the Central Highlands of Ethiopia. J. Biol. Agric. Healthc. 2020, 10, 1–7. [Google Scholar] [CrossRef]
  10. Te Beest, D.E.; Shaw, M.W.; Pietravalle, S.; Van Den Bosch, F. A Predictive Model for Early-Warning of Septoria Leaf Blotch on Winter Wheat. Eur. J. Plant Pathol. 2009, 124, 413–425. [Google Scholar] [CrossRef]
  11. Hardwick, N.V.; Jones, D.R.; Slough, J.E. Factors Affecting Diseases of Winter Wheat in England and Wales, 1989–1998. Plant Pathol. 2001, 50, 650–652. [Google Scholar] [CrossRef]
  12. Hermoso, V.; Carvalho, S.B.; Giakoumi, S.; Goldsborough, D.; Katsanevakis, S.; Leontiou, S.; Markantonatou, V.; Rumes, B.; Vogiatzakis, I.N.; Yates, K.L. The EU Biodiversity Strategy for 2030: Opportunities and Challenges on the Path towards Biodiversity Recovery. Environ. Sci. Policy 2022, 127, 263–271. [Google Scholar] [CrossRef]
  13. Waggoner, P.E.; Aylor, D.E. Epidemiology: A Science of Patterns. Annu. Rev. Phytopathol. 2000, 38, 71–94. [Google Scholar] [CrossRef] [PubMed]
  14. Dennett, M.D. Effects of Sowing Date and the Determination of Optimum Sowing Date. In Wheat: Ecology and Physiology of Yield Determination; CRC Press: Boca Raton, FL, USA, 1999; pp. 123–140. [Google Scholar]
  15. Craigie, R.A.; Brown, H.E.; George, M. Grain Yield of Winter Feed Wheat in Response to Sowing Date and Sowing Rate. Agron. New Zealand 2015, 45, 1–8. [Google Scholar]
  16. Ponomarenko, A.; Goodwin, S.B.; Kema, G.H. Septoria tritici Blotch (STB) of Wheat. In Plant Health Instructor; American Phytopathological Society: St. Paul, MI, USA, 2011; Volume 10. [Google Scholar]
  17. Asseng, S.; Guarin, J.R.; Raman, M.; Monje, O.; Kiss, G.; Despommier, D.D.; Meggers, F.M.; Gauthier, P.P.G. Wheat Yield Potential in Controlled-Environment Vertical Farms. Proc. Natl. Acad. Sci. USA 2020, 117, 19131–19135. [Google Scholar] [CrossRef] [PubMed]
  18. Thomas, M.R.; Cook, R.J.; King, J.E. Factors Affecting Development of Septoria tritici in Winter Wheat and Its Effect on Yield. Plant Pathol. 1989, 38, 246–257. [Google Scholar] [CrossRef]
  19. Shaw, M.W.; Royle, D.J. Factors Determining the Severity of Epidemics of Mycosphaerella graminicola (Septoria tritici) on Winter Wheat in the UK. Plant Pathol. 1993, 42, 882–899. [Google Scholar] [CrossRef]
  20. Shaw, M.W. Effects of Temperature, Leaf Wetness and Cultivar on the Latent Period of Mycosphaerella graminicola on Winter Wheat. Plant Pathol. 1990, 39, 255–268. [Google Scholar] [CrossRef]
  21. Chungu, C.; Gilbert, J.; Townley-Smith, F. Septoria tritici Blotch Development as Affected by Temperature, Duration of Leaf Wetness, Inoculum Concentration, and Host. Plant Dis. 2001, 85, 430–435. [Google Scholar] [CrossRef] [PubMed]
  22. Parker, S.R.; Lovell, D.J.; Royle, D.J.; Paveley, N.D. Analysing Epidemics of Septoria tritici for Improved Estimates of Disease Risk. In Septoria on Cereals: A Study of Pathosystems; CABI Publishing: Cambridge, UK, 1999; pp. 96–107. [Google Scholar]
  23. Hansen, J.G.; Secher, B.J.M.; Jørgensen, L.N.; Welling, B. Thresholds for Control of Septoria Spp. in Winter Wheat Based on Precipitation and Growth Stage. Plant Pathol. 1994, 43, 183–189. [Google Scholar] [CrossRef]
  24. Coakley, S.M.; McDaniel, L.R.; Shaner, G. Model for Predicting Severity of Septoria tritici Blotch on Winter Wheat. Phytopathology 1985, 75, 1245–1251. [Google Scholar] [CrossRef]
  25. Tyldesley, J.B.; Thompson, N. Forecasting Septoria Nodorum on Winter Wheat in England and Wales. Plant Pathol. 1980, 29, 9–20. [Google Scholar] [CrossRef]
  26. Hoogenboom, G. Contribution of Agrometeorology to the Simulation of Crop Production and Its Applications. Agric. For. Meteorol. 2000, 103, 137–157. [Google Scholar] [CrossRef]
  27. Kochiieru, M.; Veršulienė, A.; Feiza, V.; Feizienė, D.; Shatkovska, K.; Deveikytė, I. The Action of Environmental Factors on Carbon Dioxide Efflux per Growing Season and Non-Growing Season. Sustainability 2024, 16, 4391. [Google Scholar] [CrossRef]
  28. European and Mediterranean Plant Protection Organization (EPPO). PP1/26(4)—Efficacy Evaluation of Fungicides. Bull. OEPP/EPPO Bull. 2012, 42, 419–425. [Google Scholar] [CrossRef]
  29. Simko, I.; Piepho, H.P. The Area under the Disease Progress Stairs: Calculation, Advantage, and Application. Phytopathology 2012, 102, 381–389. [Google Scholar] [CrossRef] [PubMed]
  30. Meier, U. Growth Stages of Mono- and Dicotyledonous Plants: BBCH Monograph; Open Agrar Repositorium: Quedlinburg, Germany, 2018; p. 204. [Google Scholar]
  31. Dabkevičius, Z.; Brazauskienė, I. Augalų Patologija; Lietuvos žemės ūkio universitetas: Kaunas, Lithuania, 2007; p. 496. [Google Scholar]
  32. Akhileshwari, S.V.; Amaresh, Y.S.; Naik, M.K.; Kantharaju, V.; Shankergoud, I.; Ravi, M.V. Effect of Dates of Sowing on Powdery Mildew Severity and Yield of Sunflower. Karnataka J. Agric. Sci. 2012, 25, 129–130. [Google Scholar]
  33. Apeyuan, K.D.; Nwankiti, A.O.; Oluma, O.A.H.; Ekefan, E.J.; Apeyuan, K.D.; Nwankiti, A.O.; Oluma, O.A.H.; Ekefan, E.J. Effect of Different Sowing Dates on Disease Initiation and Development of Roselle (Hibiscus sabdariffa L.) Leaf Spot Disease Caused by Coniella musaiensis Var. Hibisci in Makurdi, Central Nigeria. J. Geosci. Environ. Prot. 2017, 5, 94–101. [Google Scholar] [CrossRef]
  34. Toropova, E.Y.; Kazakova, O.A.; Piskarev, V.V. Septoria Blotch Epidemic Process on Spring Wheat Varieties. Vavilov J. Genet. Breed. 2020, 24, 139–148. [Google Scholar] [CrossRef]
  35. Henze, M.; Beyer, M.; Klink, H.; Verreet, J.A. Characterizing Meteorological Scenarios Favorable for Septoria tritici Infections in Wheat and Estimation of Latent Periods. Plant Dis. 2007, 91, 1445–1449. [Google Scholar] [CrossRef] [PubMed]
  36. Kpu, A.K.; Annih, M.G.; Ambang, A.L. Leaf Spot of Telfairia cccidentalis Incidence and Severity Influenced by Altitude and Planting Date in the West Region of Cameroon. CABI Agric. Biosci. 2022, 3, 32. [Google Scholar] [CrossRef]
  37. Kone, N.; Asare-Bediako, E.; Silue, S.; Kone, D.; Koita, O.; Menzel, W.; Winter, S. Influence of Planting Date on Incidence and Severity of Viral Disease on Cucurbits under Field Condition. Ann. Agric. Sci. 2017, 62, 99–104. [Google Scholar] [CrossRef]
  38. Ilondu, E.M. Etiology and Assessment of Leafspot Disease of Sweet Potato (Ipomoea batatas (L.) Lam) in Selected Farms in Delta State, Nigeria. Agric. Biol. J. North Am. 2013, 4, 476–484. [Google Scholar] [CrossRef]
  39. Ballaré, C.L.; Pierik, R. The Shade-Avoidance Syndrome: Multiple Signals and Ecological Consequences. Plant Cell Environ. 2017, 40, 2530–2543. [Google Scholar] [CrossRef] [PubMed]
  40. Douma, J.C.; de Vries, J.; Poelman, E.H.; Dicke, M.; Anten, N.P.R.; Evers, J.B. Ecological Significance of Light Quality in Optimizing Plant Defence. Plant Cell Environ. 2019, 42, 1077. [Google Scholar] [CrossRef] [PubMed]
  41. Novoplansky, A.; Cohen, D.; Sachs, T. How Portulaca Seedlings Avoid Their Neighbours. Oecologia 1990, 82, 490–493. [Google Scholar] [CrossRef]
  42. Leone, M.; Keller, M.M.; Cerrudo, I.; Ballaré, C.L. To Grow or Defend? Low Red: Far-Red Ratios Reduce Jasmonate Sensitivity in Arabidopsis Seedlings by Promoting DELLA Degradation and Increasing JAZ10 Stability. N. Phytol. 2014, 204, 355–367. [Google Scholar] [CrossRef]
  43. Ansar, M.; Cheema, M.N.; Leitch, M.H. Effect of Agronomic Practices on the Development of Septoria Leaf Blotch and Its Subsequent Effect on Growth and Yield Components of Wheat. Pak. J. Bot. 2010, 42, 2125–2138. [Google Scholar]
  44. Magboul, A.M.; Geng, S.; Gilchrist, D.G.; Jackson, L.F. Environmental Influence on the Infection of Wheat by Mycosphaerella graminicola. Phytopathology 1992, 82, 1407–1413. [Google Scholar] [CrossRef]
  45. Juroszek, P.; Von Tiedemann, A. Potential Strategies and Future Requirements for Plant Disease Management under a Changing Climate. Plant Pathol. 2011, 60, 100–112. [Google Scholar] [CrossRef]
  46. Gladders, P.; Paveley, N.D.; Barrie, I.A.; Hardwick, N.V.; Hims, M.J.; Langton, S.; Taylor, M.C. Agronomic and Meteorological Factors Affecting the Severity of Leaf Blotch Caused by Mycosphaerella graminicola in Commercial Wheat Crops in England. Ann. Appl. Biol. 2001, 138, 301–311. [Google Scholar] [CrossRef]
  47. Brown, J.K.M.; Chartrain, L.; Lasserre-Zuber, P.; Saintenac, C. Genetics of Resistance to Zymoseptoria tritici and Applications to Wheat Breeding. Fungal Genet. Biol. 2015, 79, 33–41. [Google Scholar] [CrossRef]
  48. Jørgensen, L.N.; Matzen, N.; Heick, T.M.; Havis, N.; Holdgate, S.; Clark, B.; Blake, J.; Glazek, M.; Korbas, M.; Danielewicz, J.; et al. Decreasing Azole Sensitivity of Z. Tritici in Europe Contributes to Reduced and Varying Field Efficacy. J. Plant Dis. Prot. 2021, 128, 287–301. [Google Scholar] [CrossRef]
  49. Jørgensen, L.N.; Hovmøller, M.S.; Hansen, J.G.; Lassen, P.; Clark, B.; Bayles, R.; Rodemann, B.; Jahn, M.; Flath, K.; Goral, T.; et al. EuroWheat.org—A Support to Integrated Disease Management in Wheat. Outlooks Pest Manag. 2010, 21, 173–176. [Google Scholar] [CrossRef]
  50. Aryal, L.; Shrestha, S.M.; Gopal Bahadur, K.C. Effect of Date of Sowing on the Performance of Drought Tolerant Wheat Genotypes to Spot Blotch at Rampur, Chitwan, Nepal. Int. J. Appl. Sci. Biotechnol. 2013, 1, 266–271. [Google Scholar] [CrossRef]
  51. Gurung, S.; Sharma, R.C.; Duveiller, E.; Shrestha, S.M. Comparative Analyses of Spot Blotch and Tan Spot Epidemics on Wheat under Optimum and Late Sowing Period in South Asia. Eur. J. Plant Pathol. 2012, 134, 257–266. [Google Scholar] [CrossRef]
  52. Duveiller, E.; Kandel, Y.R.; Sharma, R.C.; Shrestha, S.M. Epidemiology of Foliar Blights (Spot Blotch and Tan Spot) of Wheat in the Plains Bordering the Himalayas. Phytopathology 2005, 95, 248–256. [Google Scholar] [CrossRef] [PubMed]
  53. Nema, K.G.; Joshi, L.M. Spot-Blotch Disease of Wheat in Relation to Host: Age, Temperature and Moisture. Indian Phytopathol. 1973, 26, 41–48. [Google Scholar]
  54. Regmi, A.P.; Ladha, J.K.; Pasuquin, E.; Pathak, H.; Hobbs, P.R.; Shrestha, L.L.; Gharti, D.B.; Duveiller, E. The Role of Potassium in Sustaining Yields in a Long-Term Rice-Wheat Experiment in the Indo-Gangetic Plains of Nepal. Biol. Fertil. Soils 2002, 36, 240–247. [Google Scholar] [CrossRef]
Figure 1. The 1st leaf (flag leaf) in wheat [30].
Agriculture 14 00988 g001
Figure 2. Septoria leaf blotch on wheat, percentage of leaf area affected [31].
Agriculture 14 00988 g002
Figure 3. The average air temperature (solid line, left y axis) and the amount of precipitation (dark bar, right y axis) from the first decade of April to the first decade of August (x axis) in 2021 and 2022, and the standard climate norm for air temperature (dotted line) and precipitation (light bar) (SCN, average of 1991–2020).
Agriculture 14 00988 g003
Figure 4. Effect of sowing time and seed rate on the area under disease progress curve (AUDPC) values of Septoria leaf blotch in winter wheat in 2021 and 2022. Note. Means followed by the same small or capital letters do not significantly differ at the level of significance p ≤ 0.05.
Agriculture 14 00988 g004
Table 1. The combined impact of sowing time and seed rates on Septoria leaf blotch on the first and second leaves of winter wheat in 2021 and 2022.
SourceFirst LeafSecond Leaf
DFMean SquareF ValuePr > FDFMean SquareF ValuePr > F
2021
Sowing time260.297718.56<0.0001250.85580.510.6054
Seed rate20.29770.090.9127245.29330.460.6390
Sowing time × seed rate40.16610.050.9948443.45160.440.7808
2022
Sowing time2494.631928.68<0.000121149.590219.72<0.0001
Seed rate270.90024.110.02762308.54865.290.0115
Sowing time × seed rate411.19400.650.6325426.36110.450.7700
Note: DF—Degrees of freedom.
Table 2. Effect of sowing time and seed rate on the severity of Septoria leaf blotch on the first leaf of winter wheat at different growth stages, 2021 and 2022.
Seed Rate (Seeds m−2)Growth Stage
BBCH 59–65BBCH 75
Sowing Time
EarlyOptimalLateMeanEarlyOptimalLateMean
2021
3500.05 ± 0.05 aA0.45 ± 0.43 aA0.07 ± 0.09 aA0.19 ± 0.307.30 ± 1.58 aAB9.18 ± 3.9 aB4.32 ± 1.26 aA6.93 ± 3.06
4000.10 ± 0.08 aA0.55 ± 0.34 aB0.12 ± 0.12 aA0.26 ± 0.297.05 ± 1.77 aB8.88 ± 0.85 aB4.67 ± 1.35 aA6.87 ± 2.18
4500.03 ± 0.05 aA0.98 ± 0.58 aB0.32 ± 0.47 aAB0.44 ± 0.576.75 ± 0.28 aB8.75 ± 2.06 aB4.40 ± 0.81 aA6.63 ± 2.19
Mean0.06 ± 0.06 *0.66 ± 0.48 *0.18 ± 0.28 * 7.03 ± 1.27 *8.93 ± 2.30 *4.47 ± 1.06 *
2022
3502.88 ± 0.97
aA
2.75 ± 0.51
aA
2.28 ± 0.57
aA
2.64 ± 0.7016.75 ± 7.04
aB
6.00 ± 1.15
aA
10.75 ± 2.95
aAB
11.17 ± 6.11
4001.95 ± 0.71
aA
2.45 ± 0.78
aA
2.55 ± 0.40
aA
2.32 ± 0.6518.15 ± 4.95
aB
6.58± 0.75
aA
8.00 ± 2.73
aA
10.91 ± 6.15
4502.78 ± 2.05
aA
1.60 ± 1.01
aA
2.65 ± 0.69
aA
2.34 ± 1.3624.13 ± 5.80
aB
9.70 ± 1.11
bA
11.90 ± 5.28
aA
15.24 ± 7.81
Mean2.54 ± 1.312.27 ± 0.882.49 ± 0.54 19.68 ± 6.37
*
7.43 ± 1.93
*
10.22 ± 3.86
*
Note: (a, b) followed by the same letter in the column are not significantly different at the level of significance p ≤ 0.05. (A, B) followed by the same letter in the row are not significantly different at the level of significance p ≤ 0.05. Means within a row or column followed by (*) are significantly different at the level of significance p ≤ 0.05.
Table 3. Effect of sowing time and seed rate on the severity of Septoria leaf blotch on the second leaf of winter wheat at different growth stages under natural infection in 2021 and 2022.
Seed Rate (Seeds m−2)Growth Stage
BBCH 59–65BBCH 75
Sowing Time
EarlyOptimalLateMeanEarlyOptimalLateMean
2021
3502.53 ± 1.14 aA5.65 ± 4.14 aA2.58 ± 1.30 aA3.58 ± 2.7931.38 ± 4.93 aA38.00 ± 9.22 aA33.90 ± 14.67 aA34.43 ± 9.83
4002.50 ± 0.33 aA4.68 ± 2.36 aA2.55 ± 1.28 aA3.24 ± 1.7636.00 ± 8.25 aA36.88 ± 7.18 aA31.50 ± 13.27 aA34.79 ± 9.31
4502.45 ± 2.17 aA4.75 ± 0.75 aA3.25 ± 1.25 aA3.48 ± 1.6942.25 ± 6.34 aA36.88 ± 5.54 aA34.75 ± 14.26 aA37.96 ± 9.25
Mean2.49 ± 1.29 *5.03 ± 2.56 *2.79 ± 1.20 * 36.54 ± 7.6037.25 ± 6.7833.38 ± 12.81
2022
3502.73 ± 0.83 aA2.30 ± 0.82 aA6.90 ± 2.28 aB3.98
± 2.54
40.00 ± 8.66 aB38.25 ± 4.27 aB25.38 ± 3.19 aA34.54 ± 8.63 *
4001.73 ± 0.79 aA1.73 ± 0.27 aA8.20 ± 3.94 aB3.89
± 3.82
50.00 ± 12.19 aB45.38 ± 10.59 aB26.50 ± 8.78 aA40.63 ± 14.4 *
4502.23 ± 0.71 aA1.48 ± 1.01 aA7.03 ± 1.05 aB3.58
± 2.70
51.63 ± 6.16 aB47.38 ± 3.79 aB34.75 ± 5.54 aA44.59 ± 8.87 *
Mean2.23 ± 0.82 *1.84 ± 0.78 *7.38 ± 2.51 * 47.21 ± 10.06 *43.67 ± 7.49 *28.88 ± 7.16 *
Note: (a) followed by the same letter in the column are not significantly different at the level of significance p ≤ 0.05. (A, B) followed by the same letter in the row are not significantly different at the level of significance p ≤ 0.05. Means within a row or column followed by (*) are significantly different at the level of significance p ≤ 0.05.
Table 4. The combined influence of sowing time and seed rates on the area under disease progress curve (AUDPC) values of Septoria leaf blotch in 2021 and 2022.
Source20212022
DFMean SquareF ValuePr > FDFMean SquareF ValuePr > F
Sowing time255801.910.570.0004260290.522.70<0.0001
Seed rate22198.60.420.6637217517.76.600.0047
Sowing time × seed rate42172.60.410.798941764.60.660.6222
Table 5. Precipitation amount (mm), deviation from the long-term average (%), and average air temperature (°C), deviation from the long-term average (°C), between growth stages.
YearsFromToI SowingII SowingIII Sowing
2021BBCH 37–41BBCH 59–657.5 mm (−64%)
16.4 °C (0.7 °C)
9.9 mm (−68%)
16.3 °C (0.5 °C)
7.8 mm (−70%)
18.3 (2.1 °C)
BBCH 59–65BBCH 7524.6 mm (−50%)
20.6 °C (4.1 °C)
22.2 mm (−43%)
22.0 °C (5.5 °C)
22.3 mm (−54%)
22.4 °C (5.3 °C)
2022BBCH 37–41BBCH 59–65128.6 mm (289%)
14.7 °C (−1.1 °C)
72.3 mm (211%)
16.5 °C (0.4 °C)
122.7 mm (272%)
16.1 °C (−0.1 °C)
BBCH 59–65BBCH 7553.7 mm (46%)
19.9 °C (3.2 °C)
53.9 mm (23%)
20.0 °C (3.3 °C)
10,5 mm (−75%)
21.2 °C (4.1 °C)
Disclaimer/Publisher’s Note: The statements, opinions and data contained in all publications are solely those of the individual author(s) and contributor(s) and not of MDPI and/or the editor(s). MDPI and/or the editor(s) disclaim responsibility for any injury to people or property resulting from any ideas, methods, instructions or products referred to in the content.

