Article

Improving Sowing Uniformity of a Maize High-Speed Precision Seeder by Incorporating Energy Dissipator

Intelligent Equipment Research Center, Beijing Academy of Agriculture and Forestry Sciences, Beijing 100097, China
*
Author to whom correspondence should be addressed.
Agriculture 2024, 14(8), 1237; https://doi.org/10.3390/agriculture14081237
Submission received: 9 July 2024 / Revised: 22 July 2024 / Accepted: 25 July 2024 / Published: 26 July 2024

Abstract

:
To enhance the sowing uniformity of the vacuum seeder in the high-speed working state, a flexible energy-dissipation receiving device was designed. We analyzed the angle and velocity of seed ejection from the seed-metering device. Additionally, we explored the rheological properties of four different sodium alginate (SA) solutions. Combined with high-speed camera technology, the movement characteristics of four kinds of energy dissipators were revealed, and it was determined that the fabrication material of the energy dissipator is colloid with an SA percentage of 10%. The influence of the thickness of the energy dissipator body, impact velocity, and impact angle on the pre- and post-impact velocity difference and end-of-motion transverse displacement value was investigated. The quadratic regression equation between experimental factors and experimental indexes was established, and it was determined that the thickness of the energy dissipator was 7 mm. Field experiment results showed that the working speed was 12~16 km·h−1, the leakage rate was less than 6.83%, the multiple rates were less than 0.97%, the qualified rate was stable at more than 92.4%, and the qualified grain distance variation rate was stable at less than 16.57%. The designed energy-dissipation device is beneficial to improve the overall working performance of high-speed precision seeders. In the future, if the reliability and long-term performance of the energy-dissipation device are further improved, it will be able to meet the requirements for precision seeding under high-speed conditions.

1. Introduction

With the acceleration of China’s urbanization process, agricultural production has scaled up significantly. Business entities are now pursuing high-speed and high-efficiency production methods. As a result, high-speed precision seeders have become one of the crucial components in the mechanized production of maize [1,2,3]. The precision of high-speed maize seeders depends not only on the accuracy of individual key components but also on their ability to work together effectively. Seeds are transported from the seed box to the seed furrow through a series of processes, including filling, carrying, clearing, dropping, and guiding. These processes are conducted sequentially by the vacuum seed-metering device and the seed-guiding device [4,5,6,7,8]. The vacuum seed-metering device picks up the seeds precisely and carries them in a circular motion, while the seed-guiding device restrains the seeds from moving orderly into the seed furrow. The difficulty of cooperation between the two is that the seeds will start from the seed discharge port of the seed-metering device at a certain angle of ejection due to inertia. The position and direction of the seeds entering the seed-guiding device are different with different working speeds. After entering the seed-guiding device, the seeds will collide and bounce. Thus, the seeds cannot continue to enter the seed furrow in a single-seed orderly state, which reduces the sowing accuracy.
In Europe and the USA, high-speed precision planters have the seed-guiding device closely connected to the seed-metering device at the seed discharge port. Additionally, a binding force is applied to guide the seeds smoothly and orderly into the seed-guiding device. The Proesm K precision seeder, developed by [9], transports seeds from the seed box to the seed furrow by vacuum seed-metering device and seed-guiding tube. A vertical, lateral scraper is installed at the seed discharge port of the seed-metering device to force the seeds into the seed-guiding tube in a vertical direction. Chrono 700 high-speed precision seeder, developed by [10], consists of a vacuum seed-metering device and a pneumatic seed-guiding tube. The seed-metering device is inclined at 15 degrees, and the upper part of the seed-guiding tube is positioned close to the seed discharge port. Seeds separated from the seed-metering device enter the seed-guiding tube in a straight line under the action of gravity. The 3505 Planter precision seeder, developed by [11], consists of a vacuum seed-metering device and a belt-type seed-guiding device. Two oppositely rotating seed wheels are installed at the seed discharge port of the seed-metering device, which transfers the seeds to the conveyor belt of the belt-type seed-guiding device. The Tempo R precision planter developed by [12], is equipped with a pneumatic seed-metering device and an air-fed seed-guiding tube, with the help of a pressure-relief wheel and a positive airflow to guide the seed into the seed-guiding tube.
Currently, research in China mainly focuses on either seed-metering devices or seed-guiding devices. Due to the lack of a cooperative theoretical basis and advanced technology, the domestic seed-metering device and seed-guiding tube cannot be closely connected under high-speed working conditions. The difference in seed shape, high vibration frequency of the machine, and variations in seed injection angle into the seed-guiding device cause seeds to easily collide with the inner wall of the seed-guiding device. This prevents the formation of an orderly seed flow, which reduces the seeding uniformity and affects the seeding quality [13,14]. A few researchers in China have added collaborative parts to the seed discharge port of the seed-metering device or the upper part of the seed-guiding tube, which guides the seeds to enter the seed-guiding tube along the same position and direction. The linear seed-pushing device combined with the asymptotic gas-blocking device is only suitable for seed-metering disks with guide grooves, which have a narrow range of applications [15]. The uniformity and stability of seed guidance are poor at high rotational speeds of V-shaped grooved wheels, so it is not suitable for the high-speed working of the seeder [16]. Under the condition of not changing the structure of the seed-metering device or seed-guiding device and not adding a secondary auxiliary seeding device, the technology of stable and orderly seeding is studied to solve the problems of poor uniform grain distance, high leakage, and missed multiple rates caused by collision when seeds enter the seed-guiding device. This is of great significance to realize high-speed and precision seeding.
To eliminate the dynamic energy head that collides with the wall surface of the seed-guiding device and ensure that all seeds can enter the seed-guiding device in an orderly state, therefore improving the uniformity of the sowing of the vacuum seeder in the high-speed working state. A method of realizing the energy dissipation using shear-thinning fluid as the undertaking part was put forward. The dynamic relationship of the seed undertaking process was defined, and the key factors and numerical range affecting the energy-dissipation effect were determined. In addition, the high-speed camera technology was used to analyze the energy-dissipation process, to determine the best working parameters of the energy-dissipation parts. Finally, the feasibility and effectiveness of the energy-dissipation are verified by field experiments.

2. Materials and Methods

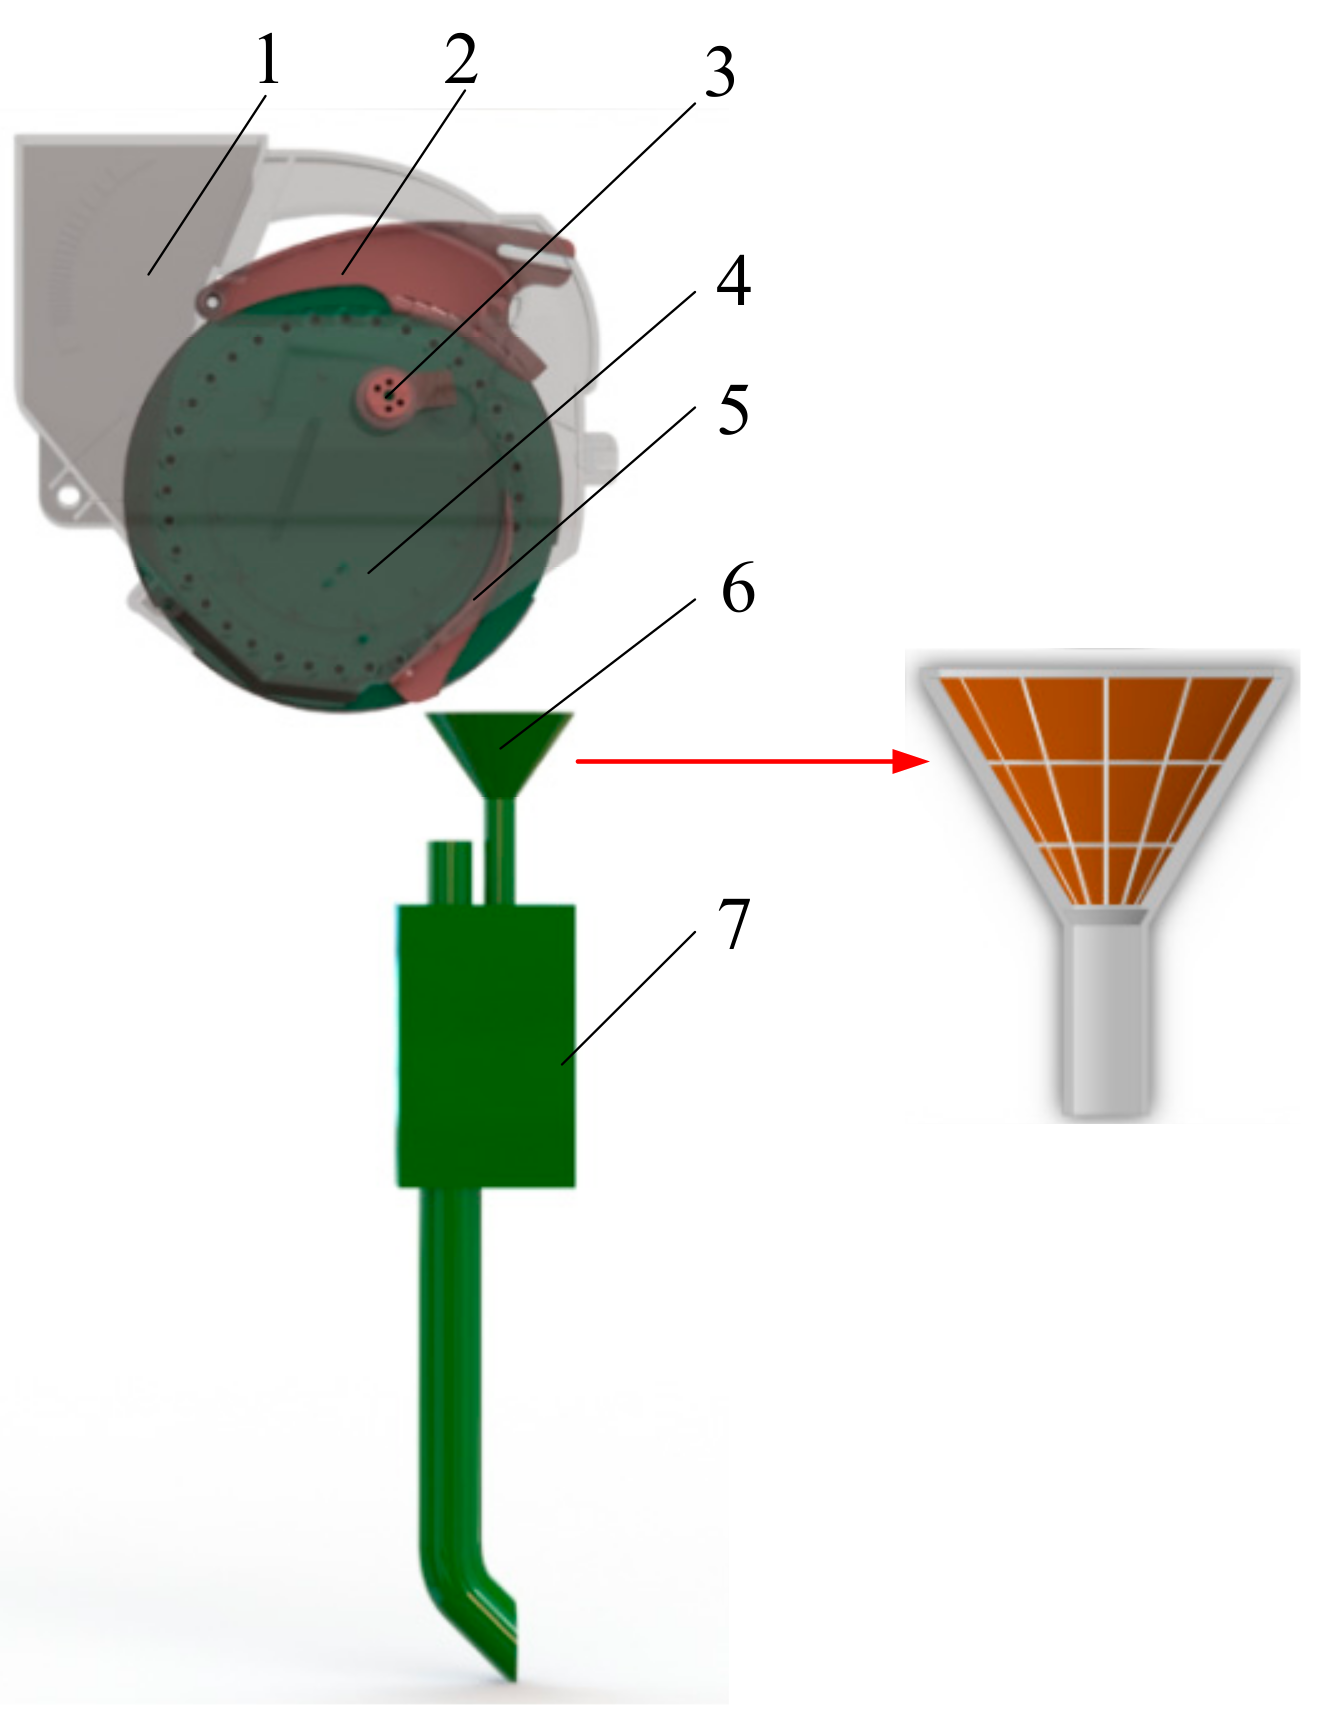
2.1. Seed Transport System of High-Speed Vacuum Seeder

As shown in Figure 1, the seed transport system of a high-speed vacuum seeder is mainly composed of a case, upper seed clearing knife, lower clearing knife, seed disk, forced clearing knife, energy-dissipation device, and positive-pressure airflow-assisted blowing seed-guiding device. When the sowing system is working, the single seed can be carried out under the synergistic effect of negative pressure, seed disk, and clearing knife. In the seed-throwing section, a single seed hits the energy-dissipation device under the action of inertia force and gravity. Because the kinetic energy of the seed is absorbed by the energy dissipator, the seed will fall into the barotropic airflow-assisted blow seed-guiding device along the wall or after a slight bounce. When the seed reaches the seed-guiding section, it is accelerated under the airflow blowing and then leaves the seed-guiding device to complete the whole seeding process.

2.2. Effect of Seed-Throwing Process on Qualified Rate of Grain Distance

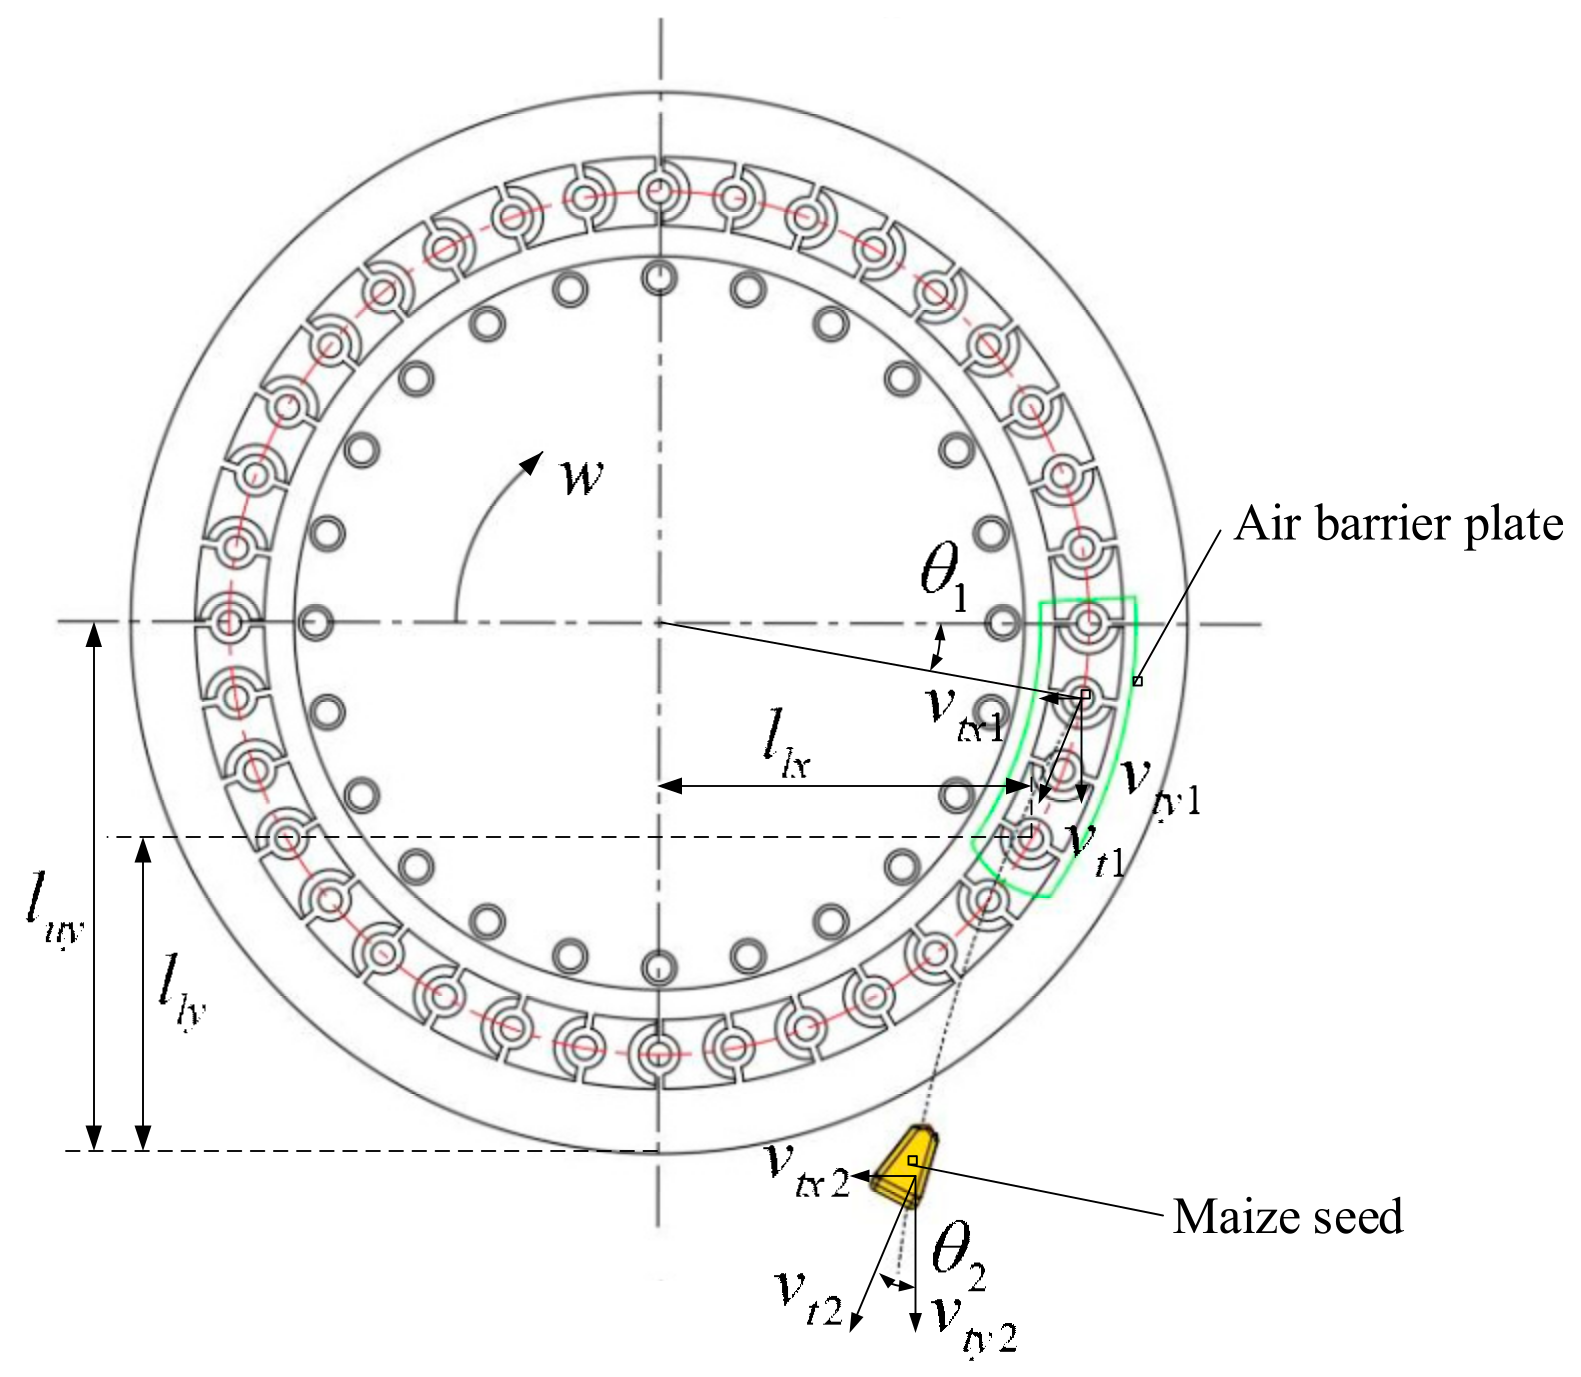
2.2.1. Motion Analysis in the Initial Stage of Seed-Throwing

As shown in Figure 2, a rectangular coordinate system is established with the horizontal direction as the x-axis and the vertical direction as the y-axis. Because the speed relative to the seed disk is zero when the seeds move circularly with the seed disk at a uniform speed, the instantaneous speed of the seeds leaving the seed-metering disk at the seed discharge port obeys the following Formula (1):
v t x 1 = 2 π n r 1 sin θ 1 v t y 1 = 2 π n r 1 cos θ 1 θ 1 = ( k t 1 ) 2 π Z n = 1 × 10 3 v 3.6 L Z
where v is the forward speed of the planter, km·h−1; vt1 is the speed of the seed as it leaves the seed disk, m·s−1; L is theoretical grain distance, mm; Z is the number of seed disk holes of the seed disk; n is the rotation speed of seed disk, r·s−1; r is the radius of the circle where the center of the seed disk hole is located, m; θ1 is the angle of rotation of seeds in the seed discharge area, degree; kt is the number of seed disk holes that seeds rotate in the seed discharge area.
Simplify Formula (1) to obtain the following Formula (2):
v t x 1 = 1 × 10 3 π v r 1 1.8 L Z sin ( 2 π k t 2 π z )
According to the analysis of Formula (2), the horizontal speed of seeds in the initial stage of seed-throwing is related to the forward speed of the seeder, the circle radius of seed disk holes, the number of seed disk holes rotated by seeds in the discharge area, the theoretical grain distance and the number of seed disk holes of seed disk. When the structure of the seed-metering device is determined, the horizontal velocity of the seed at the initial stage of seed-throwing is only positively correlated with the forward speed of the seeder and negatively correlated with the theoretical grain distance. Seeds with a certain initial velocity enter the seed-guiding device with a parabolic trajectory when thrown in an unconstrained state. The higher the speed of the seeder, the higher the horizontal velocity of the seeds, and the greater the transverse displacement, which in turn increases the probability of collision with the wall of the seed-guiding device.
Ideally, the seeds will break away from the seed disk when they reach the upper area of the air barrier plate, but it is impossible for the seeds to break away from the seed disk immediately when the actual working speed is at 8~16 km·h−1. In this study, the upper and lower limit areas of the air barrier plate were taken to calculate the speed of seeds leaving the seed disk and entering the seed-guiding device. Based on Formula (1) and the formula for accelerated motion, when the seeds are detached from the seed disk at the upper and lower limit positions, the speed is 0.183 m·s−1vt1 ≤ 0.321 m·s−1. Subsequently, the seed does parabolic motion with initial velocity vt1. The seed starts to move to the upper part of the seed-guiding device from the upper limit position (flush with the lower end surface of the seed disk), ignoring air resistance, the combined velocity of the seed at the end of the motion is 1.84 m·s−1vt2 ≤1.98 m·s−1; according to the displacement formula, we can obtain lux = 0 m, luy = 0.14 m. By the formula of the sine function, we can obtain that the angle θt of the seed entering the seed-guiding device is 0 degrees.
Similarly, it can be obtained that when the seed moves from the lower limit position, the combined velocity of the seed at the end of the motion is 1.01 m·s−1vt2 ≤ 1.055 m·s−1, the displacement of seed movement is 0.00796 m ≤ llx ≤ 0.0125 m, lly = 0.07 m, the angle θ2 of seed entering the seed-guiding device is 6.5~10.1 degrees. The angle value of the seed entering the seed-guiding device under actual working conditions cannot be the same as the theoretical value, so it is necessary to expand the width of the experimental value to investigate the motion law of the seed energy-dissipation process. Based on the above analysis, the angle of seeds entering the seed-guiding device θ2 ϵ [0°, 30°] and the speed of seeds entering the seed-guiding device 1 m·s−1vt2 ≤ 3 m·s−1 were selected for experimental study.

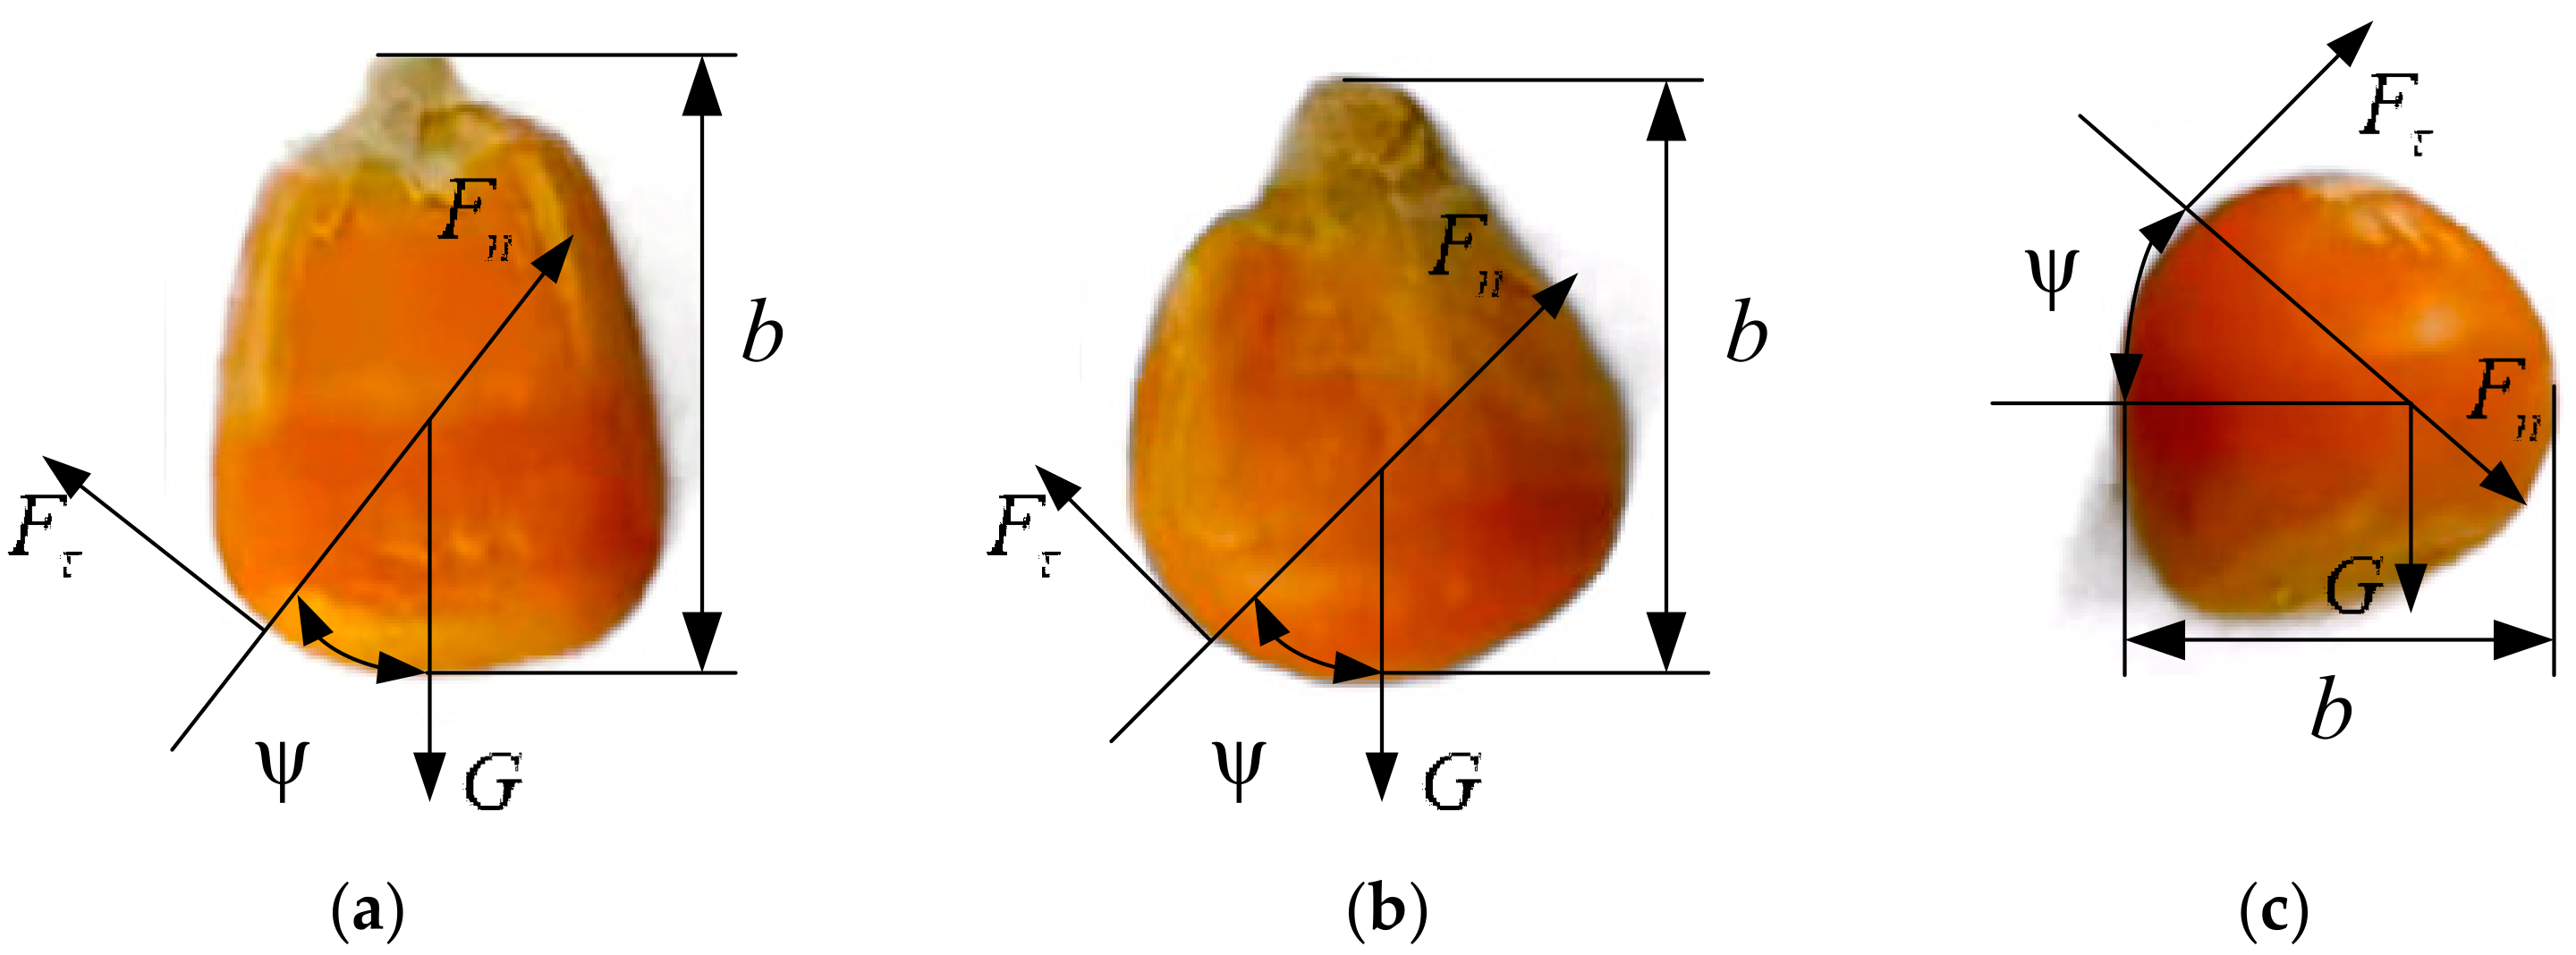
2.2.2. Analysis of Seed Collision Motion

Maize seeds can be classified as horse-tooth shape, spheroid shape, and ellipsoid shape according to their geometrical shapes, as shown in Figure 3. Due to the irregular shape of the seed, different parts of the seed impact the wall of the seed-guiding device, the direction of rotation in the seed guide tube is different, and the seed collision equation of motion obeys the following Formula [17,18,19,20]:
m d 2 x d t 2 = F n + F τ + G I d w p d t = F n b cos ψ F τ b sin ψ F n = 4 3 Y R 1 / 2 ξ n 3 / 2 F τ = S τ ξ τ G = m g
where Fn is the normal contact force, N; Fτ is the tangential contact force, N; G is the weight of the seed, N; I is the moment of inertia of the seed, kg·m2; wp is the angular velocity of the seed rotation, rad·s−1; b is the length of the long axis of the seed, m; ψ is the angle between the collision position of the seed and the long axis, degree; x is the displacement of the seed center, m; Y* is the equivalent Young’s modulus of the seed, Pa; R is the equivalent radius of the seed, m; ζn is the normal coincidence, m; ζτ is the tangential coincidence, m.
When the seed collides with the wall of the seed-guiding device, energy is absorbed by the deformation of the seed [21]; therefore, the kinetic energy equation after the collision is shown in Formula (4):
E = 1 2 m v p 2 0 q F n v n d q
where vp is the velocity before the seed impacts the wall surface, m·s−1; q is the normal momentum when the seed recovers deformation, N·s vn is the normal relative velocity between particles at the collision point, m·s−1.
Combined with Formulae (3) and (4), it can be seen that the irregular shape of seeds, inconsistent collision points, different rotational movements, and different kinetic energy losses after seeds bounce up result in different trajectories for seed bounce movements. To evaluate the order of seeds entering the seed-guiding device, it is necessary to analyze the changes in seed velocity and movement after collision.

2.3. Design of Energy-Dissipation Device and Principle of Seed Energy Dissipation

2.3.1. Design of Energy-Dissipation Device

Viscous fluid dampers are highly sensitive to velocity changes and can effectively absorb vibration and impact energy. They have been successfully used in bridges, engineering machinery, and rolling stock to absorb vibration shock energy and reduce equipment damage caused by shock [22,23,24,25]. The results of the study show that when the relative motion speed of the viscous fluid due to external excitation is small, the energy dissipated by the shear-thinning fluid is much larger than that dissipated by the shear-thickening fluid. Conversely, when the relative motion speed of the viscous fluid due to external excitation is large, the energy dissipated by the shear-thickening fluid is greater than that dissipated by the shear-thinning fluid [26]. Because the theoretical velocity of seeds entering the seed-guiding device is small, the external excitation to viscous fluid is also small. Therefore, the energy-dissipation characteristics of different types of viscous fluid are comprehensively compared and analyzed. Based on this analysis, we choose shear-thinning fluid as the material of energy-dissipation parts in this study.
The energy-dissipation device consists of a funnel and an energy dissipator. To facilitate the impacted seeds to quickly fall to the seed-guiding device, the inclination angle of the funnel is determined to be 70 degrees. The outlet of the funnel is directly connected to the air intake chamber of the seed-guiding device, so their diameters are identical. Since the energy-dissipation material is a viscoelastic fluid, grid strips are arranged on the inner wall of the funnel to prevent deformation under bumpy conditions. The energy-dissipation materials are laid in blocks within the grid.

2.3.2. Theoretical Model of Seed Energy Dissipation

The process of the seed impacting the energy-dissipation material after departure from the seed disk is a decelerating motion. As a viscous fluid, the shear-thinning fluid provides resistance to the seeds. From the initial moment of impact to the point of lowest velocity, the resistance experienced by the seeds is primarily due to liquid drag force and viscous shear stress [27,28]. Taking maize seeds as the analysis object, Formula (5) can be obtained according to the momentum theorem.
m v t 2 m v t 3 = 0 t e F e + F v i s F e = 1 2 ρ l C e A e v t 2 2 F v i s = f l A l A l = 2 π a e x l f l = η a v t 2 x
where vt2 is the velocity of the seed impacting the flexible material, m·s−1; vt3 is the minimum velocity of the seed after impacting the flexible material, m·s−1; te is the time of the seed impacting the flexible material, s; Fe and Fvis are the fluid drag force and viscous force exerted by the fluid on the seed, respectively, N; ρl is the density of the fluid, kg·m−3; Ce is the coefficient of resistance; Ae is the characteristic area, i.e., the seed entering the flexible material part of the horizontal projection, m2; fl is the shear stress exerted by the seed on the flexible body, N·m−2; Al is the characteristic area of fl acting on the surface of the seed, m2; ae is the equivalent radius of the seed, m; x is the length of the seed entering into the flexible material, m.
Simplify Formula (5) to obtain the following Formula (6):
v t 3 = v t 2 ρ l C e A e t e v t 2 2 + 4 π a e t e η a v t 2 2 m
Formula (6) represents the energy-dissipation equation after the seed impacts the flexible material. We can clearly find that the velocity after the seed impacts the flexible material is negatively correlated with the velocity of the seed impacting the flexible material and the viscosity of the fluid, respectively, i.e., the larger the velocity of the impact, the larger the value of the viscosity of the fluid and the larger the kinetic energy dissipated by the seed. The kinetic energy dissipated by the seed is related to the horizontal projection area of the seed entering flexible materials. Because maize seeds are irregular objects, the attitude of the seed impacting flexible materials will also affect the energy dissipation of the seed.

2.4. Preparation of Experimental Materials
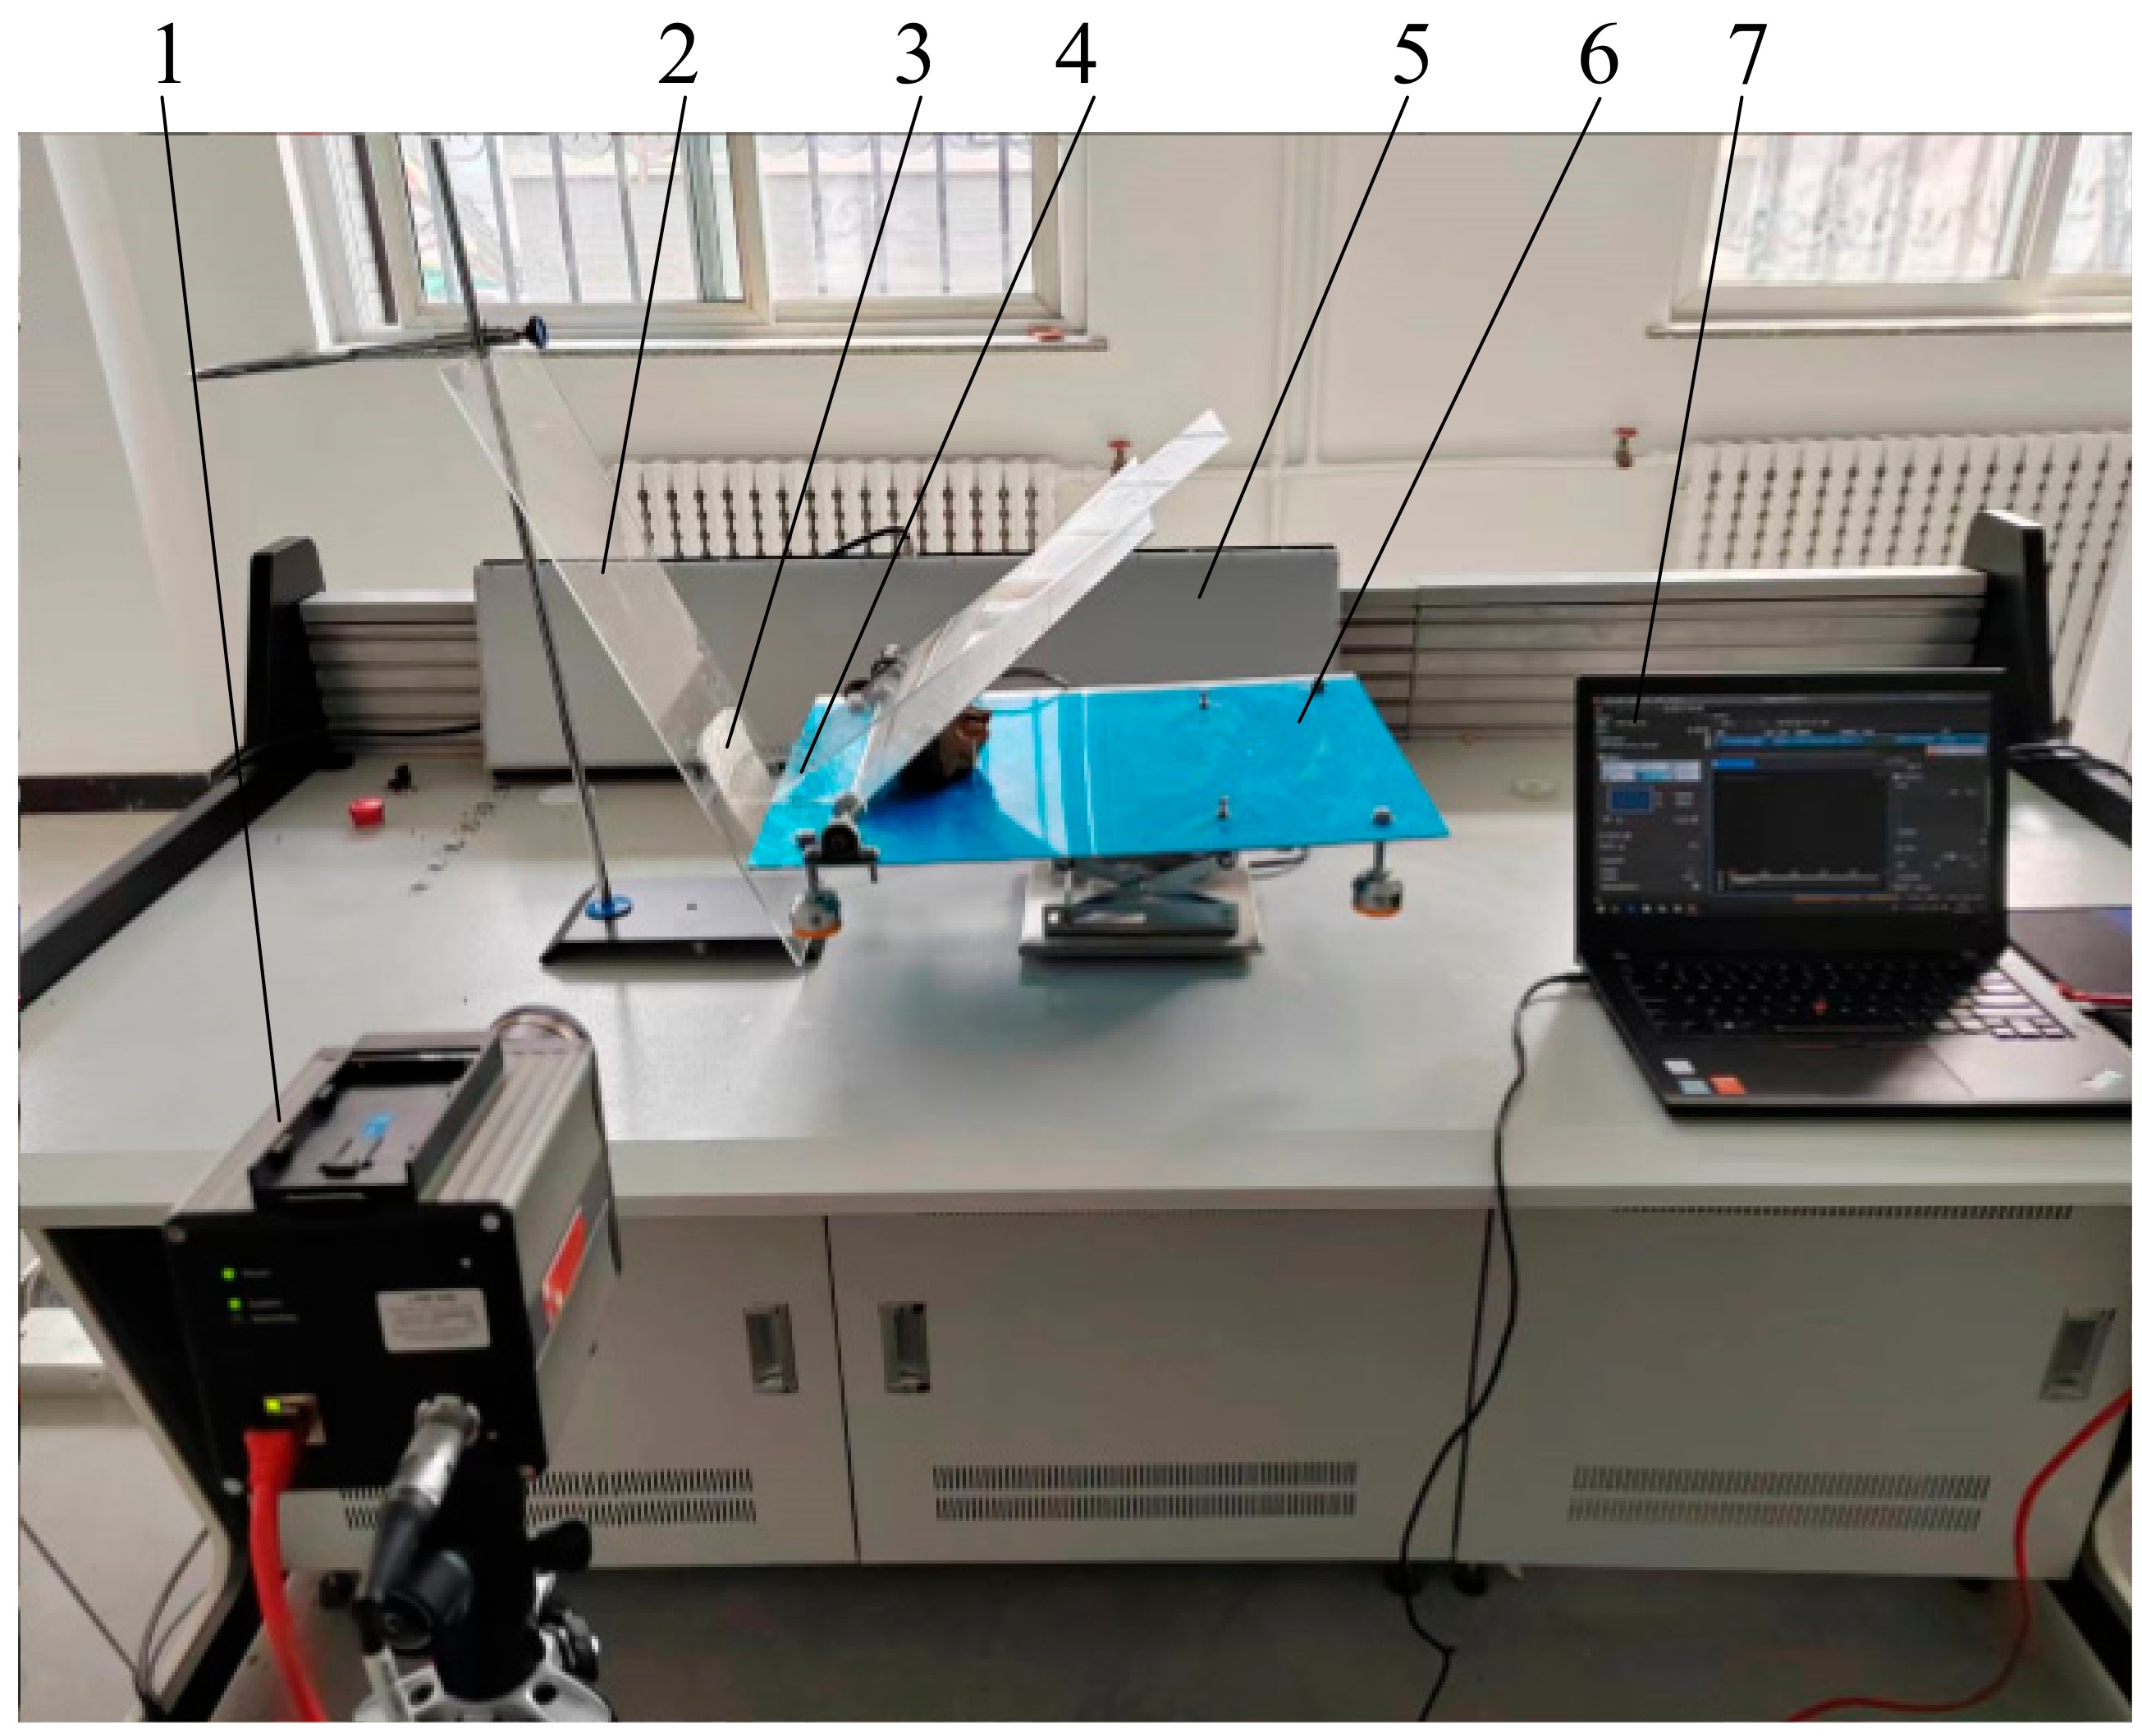
Sodium alginate (SA) dissolves in water to form a viscous colloid with good softness and uniformity. The viscosity of its aqueous solution increases with the increase in SA concentration [29,30]. Therefore, SA is selected as dispersed phase particles and deionized water as a dispersed medium to prepare shear-thinning fluid. A certain amount of SA (Shanghai Macklin Biochemical Co., Ltd., Shanghai, China) is dissolved in deionized water at 25 °C and then stirred in a magnetic stirring water bath (Spring instrument. Co., Ltd., Changzhou, China) until the SA was uniformly distributed. Under the same experimental conditions, the solutions were prepared with SA mass shares of 5%, 10%, 15% and 20%, respectively.

2.5. Test Bench

To study the feasibility of using SA to make an energy-dissipation effect, experiments were carried out on a self-made impact device test bench, as shown in Figure 4. The test equipment mainly consists of an L-PRI 1000 high-speed camera (produced by AOS Technologies AG, with a frame rate of 100 frames per second during the test), bracket, energy dissipator, and computer. During the test, the high-speed camera’s frame rate is set to 100 frames per second. Each experiment records the movement of the seeds with the high-speed camera, saves the video in. raw4 format, and imports it into the motion analysis software TEMA Classic 2021. The first step is to select the marker tracking point and set the algorithm and parameters for the point. The second step is to select the seed motion segment to identify and interpret the tracking point. The third step is to calibrate the seed motion segment in two dimensions. The fourth step is to display the tracking data and obtain the 2D-pixel coordinates of the maize seed in the image sequence. Finally, the speed, displacement and acceleration of the seeds were calculated by TEMA Classic software.
Under natural conditions, SA aqueous solution loses water, which directly affects its viscosity and elasticity if water loss is excessive. Therefore, for the test, the SA solution is made into an energy dissipator with dimensions of 150 × 150 × 2 mm and wrapped with 0.02 mm thick polyethylene material. (which meets the requirements of GB/T1040.3-2006 [31]). In practical applications, the energy-dissipation material is laid on a funnel with a fixed inclination angle, forming an energy-dissipation device. The inclination angle of the fixed energy-dissipation material bracket on the impact test bench is set to match that of the funnel, which is 70 degrees. In the test, the maize seeds are released manually by adjusting the height. The seeds slid down a smooth acrylic plate to achieve the desired impact speed. The movement angle of the seeds is changed by rotating the adjusting bracket. Zhengdan 958 maize seeds are selected, with a moisture content of 13% and a thousand-grain mass of 375 g.

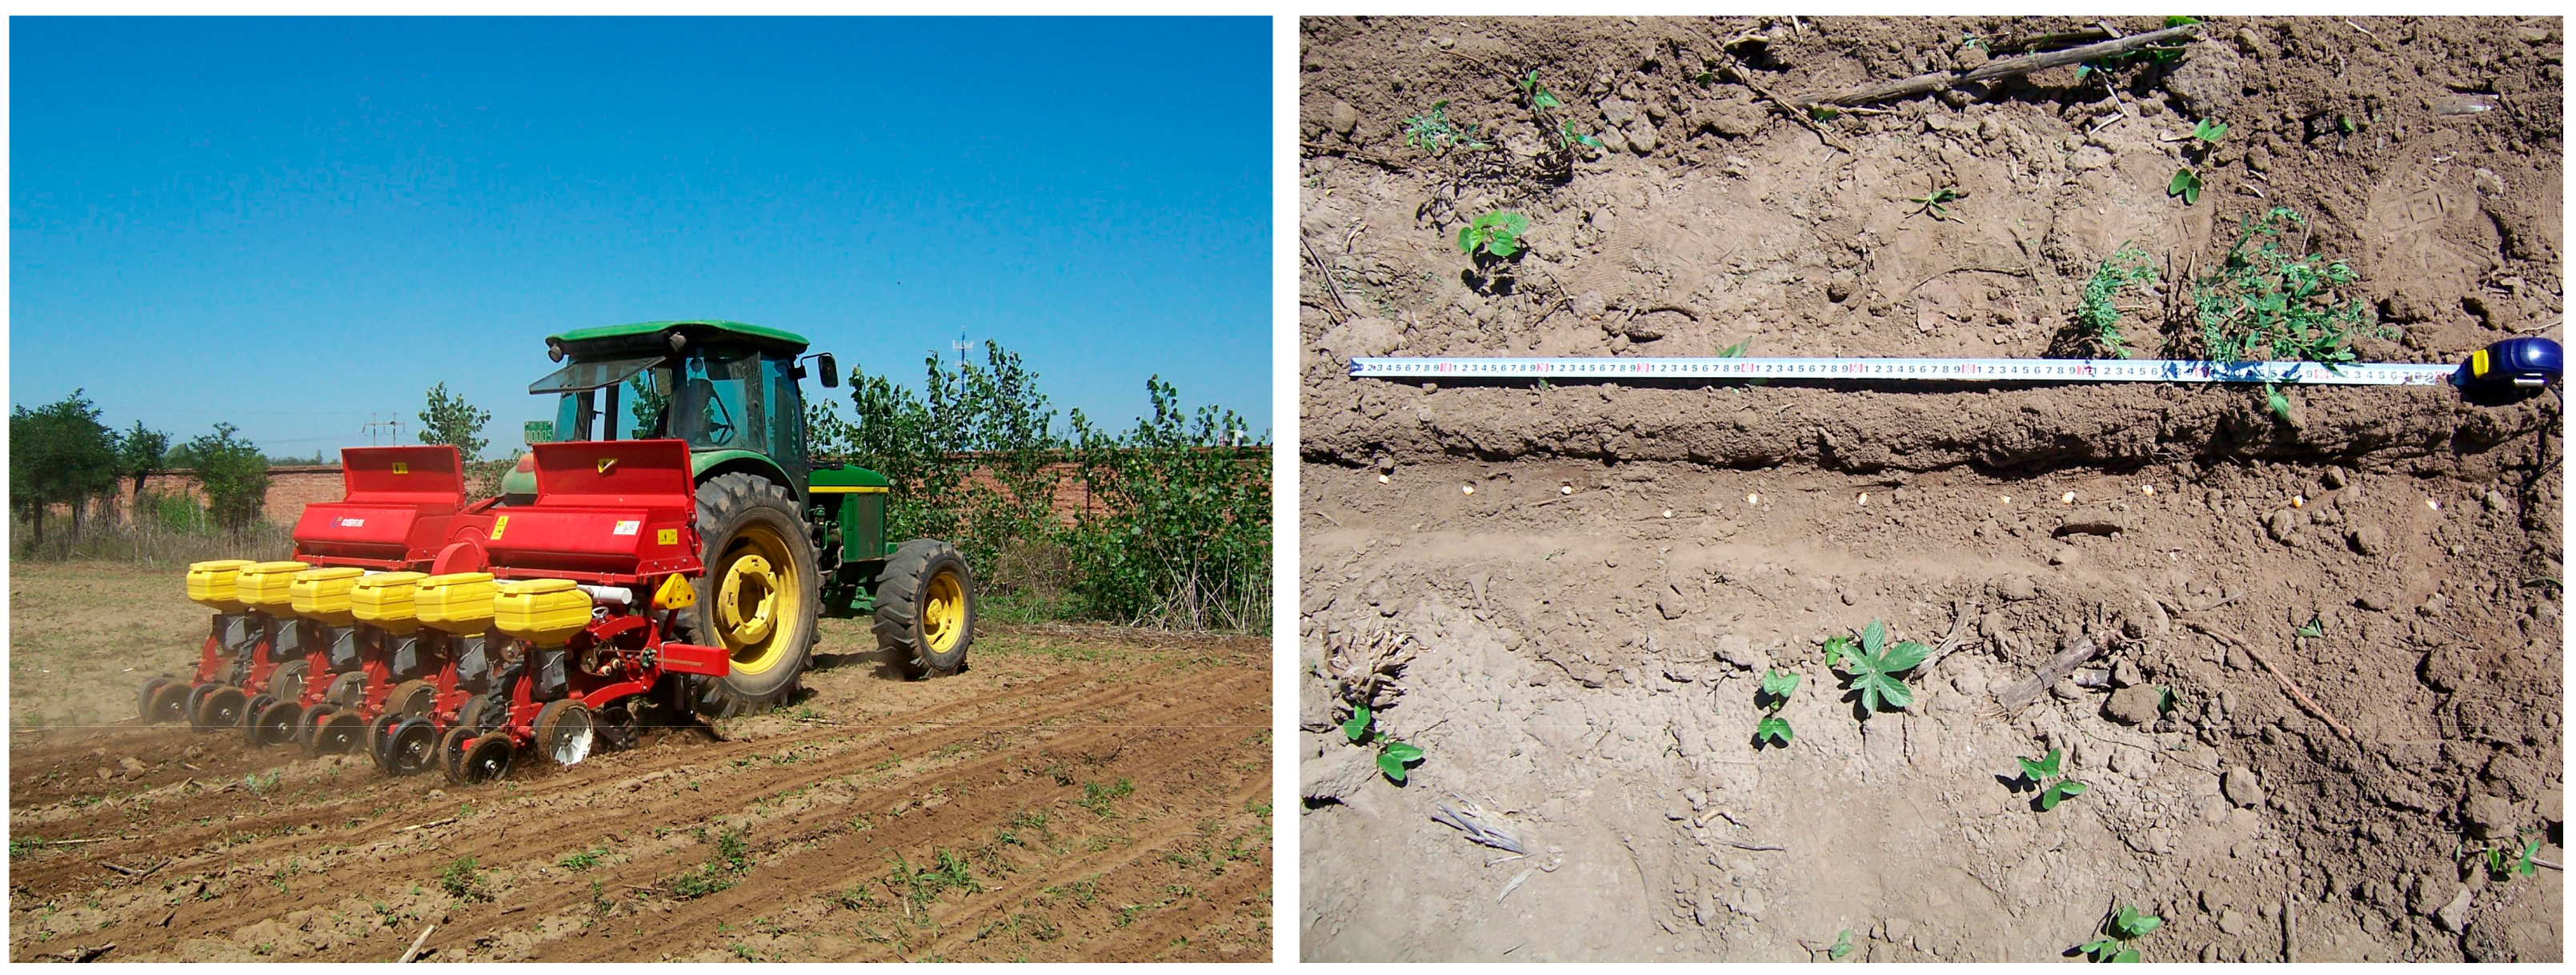
2.6. Field Experiments

To further verify the effect of the energy dissipator on sowing quality enhancement under high-speed conditions, the 2BQX-6J maize/soybean high-speed vacuum precision seeder, with and without an energy-dissipation device, was used as the test carrier. The field test was carried out at the Beijing Agricultural Machinery Experimental Station. The supporting power for the test was provided by a John Deere 1654 tractor (power 165 hp). The fan of the seed-metering device was driven by a hydraulic motor, with the fan pressure set at 4.5 kPa with an error of 0.5 kPa. The theoretical grain distance was set to 25 cm, and the soil type of the test site was sandy loam. Ungraded Zhengdan 958 maize seed was used in the test, and the field test site is shown in Figure 5. The length of the test area was set to 100 m, with the middle 20 m designated as the data collection area. The working speeds were set to 12 km·h−1, 14 km·h−1, and 16 km·h−1, respectively.

2.7. Experimental Scheme and Evaluation Index

2.7.1. Evaluation Index

The pre-and post-impact velocity difference and the end-of-motion transverse displacement value are used as the bench test indexes. The average value of 20 seeds in each group is taken to evaluate the test results. The calculation method of the experiment index is shown in Formula (7):
y 1 = j = 1 n ( v c j v m j ) n y 2 = j = 1 n x z n
where y1 is the pre- and post-impact velocity difference, m·s−1; y2 is the value of transverse displacement at the end of the movement, mm; vcj is the maximum velocity before the seed impacts the flexible body, m·s−1; vmj is the minimum velocity after the seed impacts the flexible body, m·s−1; xz is the horizontal position of the end of the seed movement (about to touch the tabletop), mm.
According to the requirements of JB/T10293-2013 [32] Technical Conditions for Single-Seed (Precision) Seeder, the field experiment was carried out with qualified rate, leakage rate, multiple rate, and qualified grain distance variation rate as experimental indexes. The calculation method of the experiment index is shown in Formula (8):
y 3 = n 1 N × 100 % y 4 = n 2 N × 100 % y 5 = n 0 N × 100 % y 6 = n i X i n 2 X 2 ¯ × 100 %
Specifically,
X i = x m x t n 1 = n i ( X i 0 ~ 0.5 ) n 2 = n i ( X i > 0.5 ~ 1.5 ) n 3 = n i ( X i > 1.5 ~ 2.5 ) n 4 = n i ( X i > 2.5 ~ 3.5 ) n 5 = n i ( X i > 3.5 ~ + ) n 2 = n 1 n 1 = n 1 + n 2 + n 3 + n 4 + n 5 2 n 2 n 0 = n 3 + 2 n 4 + 3 n 5 N = n 2 + 2 n 3 + 3 n 4 + 4 n 5
where y3 is the qualified rate, %; y4 is the multiple rate, %; y5 is the leakage rate, %; y6 is the qualified grain distance variation rate,%; Xi is the scale value, xm is measured seed spacing, mm; xt is theoretical seed spacing, mm; ni is the frequency.

2.7.2. One Factor and Multifactor Experimental Design

To study the rheological behavior of SA solution in a steady shear flow field, we used a DHR-2 rheometer (TA Instrument Co., Ltd., New Castle, DE, USA) to obtain the macroscopic response characteristics of SA solution under stress or strain conditions. To investigate the changes in the fluid under dynamic shear, time was taken as the independent variable, while the energy storage modulus and energy-dissipation modulus were taken as the dependent variables. Oscillatory tests were performed using the rheometer, setting the low shear rate to 0.1/s and the high shear rate to 100/s, with each time period lasting 20 s. The mass fractions of SA in the dispersed phase were 5%, 10%, 15% and 20%.
Based on the theoretical analysis of seed energy dissipation, the mass fraction of dispersed phase in the fluid, impact velocity, and impact angle are selected as experiment factors. The pre-and post-impact velocity difference and the transverse displacement at the end of the movement are selected as experiment indexes. A single-factor experimental study on the process of seed energy dissipation is carried out. The level codes of experimental factors are shown in Table 1.

2.7.3. Orthogonal Experimental Design

To improve the energy-dissipation effect of seed, it is necessary to optimize the structure of the energy-dissipation body. Based on the single-factor experiment, the thickness of the energy dissipator, impact velocity and impact angle are selected as experimental factors to carry out a quadratic regression orthogonal experiment with three factors and three levels. The level codes of experimental factors are shown in Table 2.

3. Results and Discussion

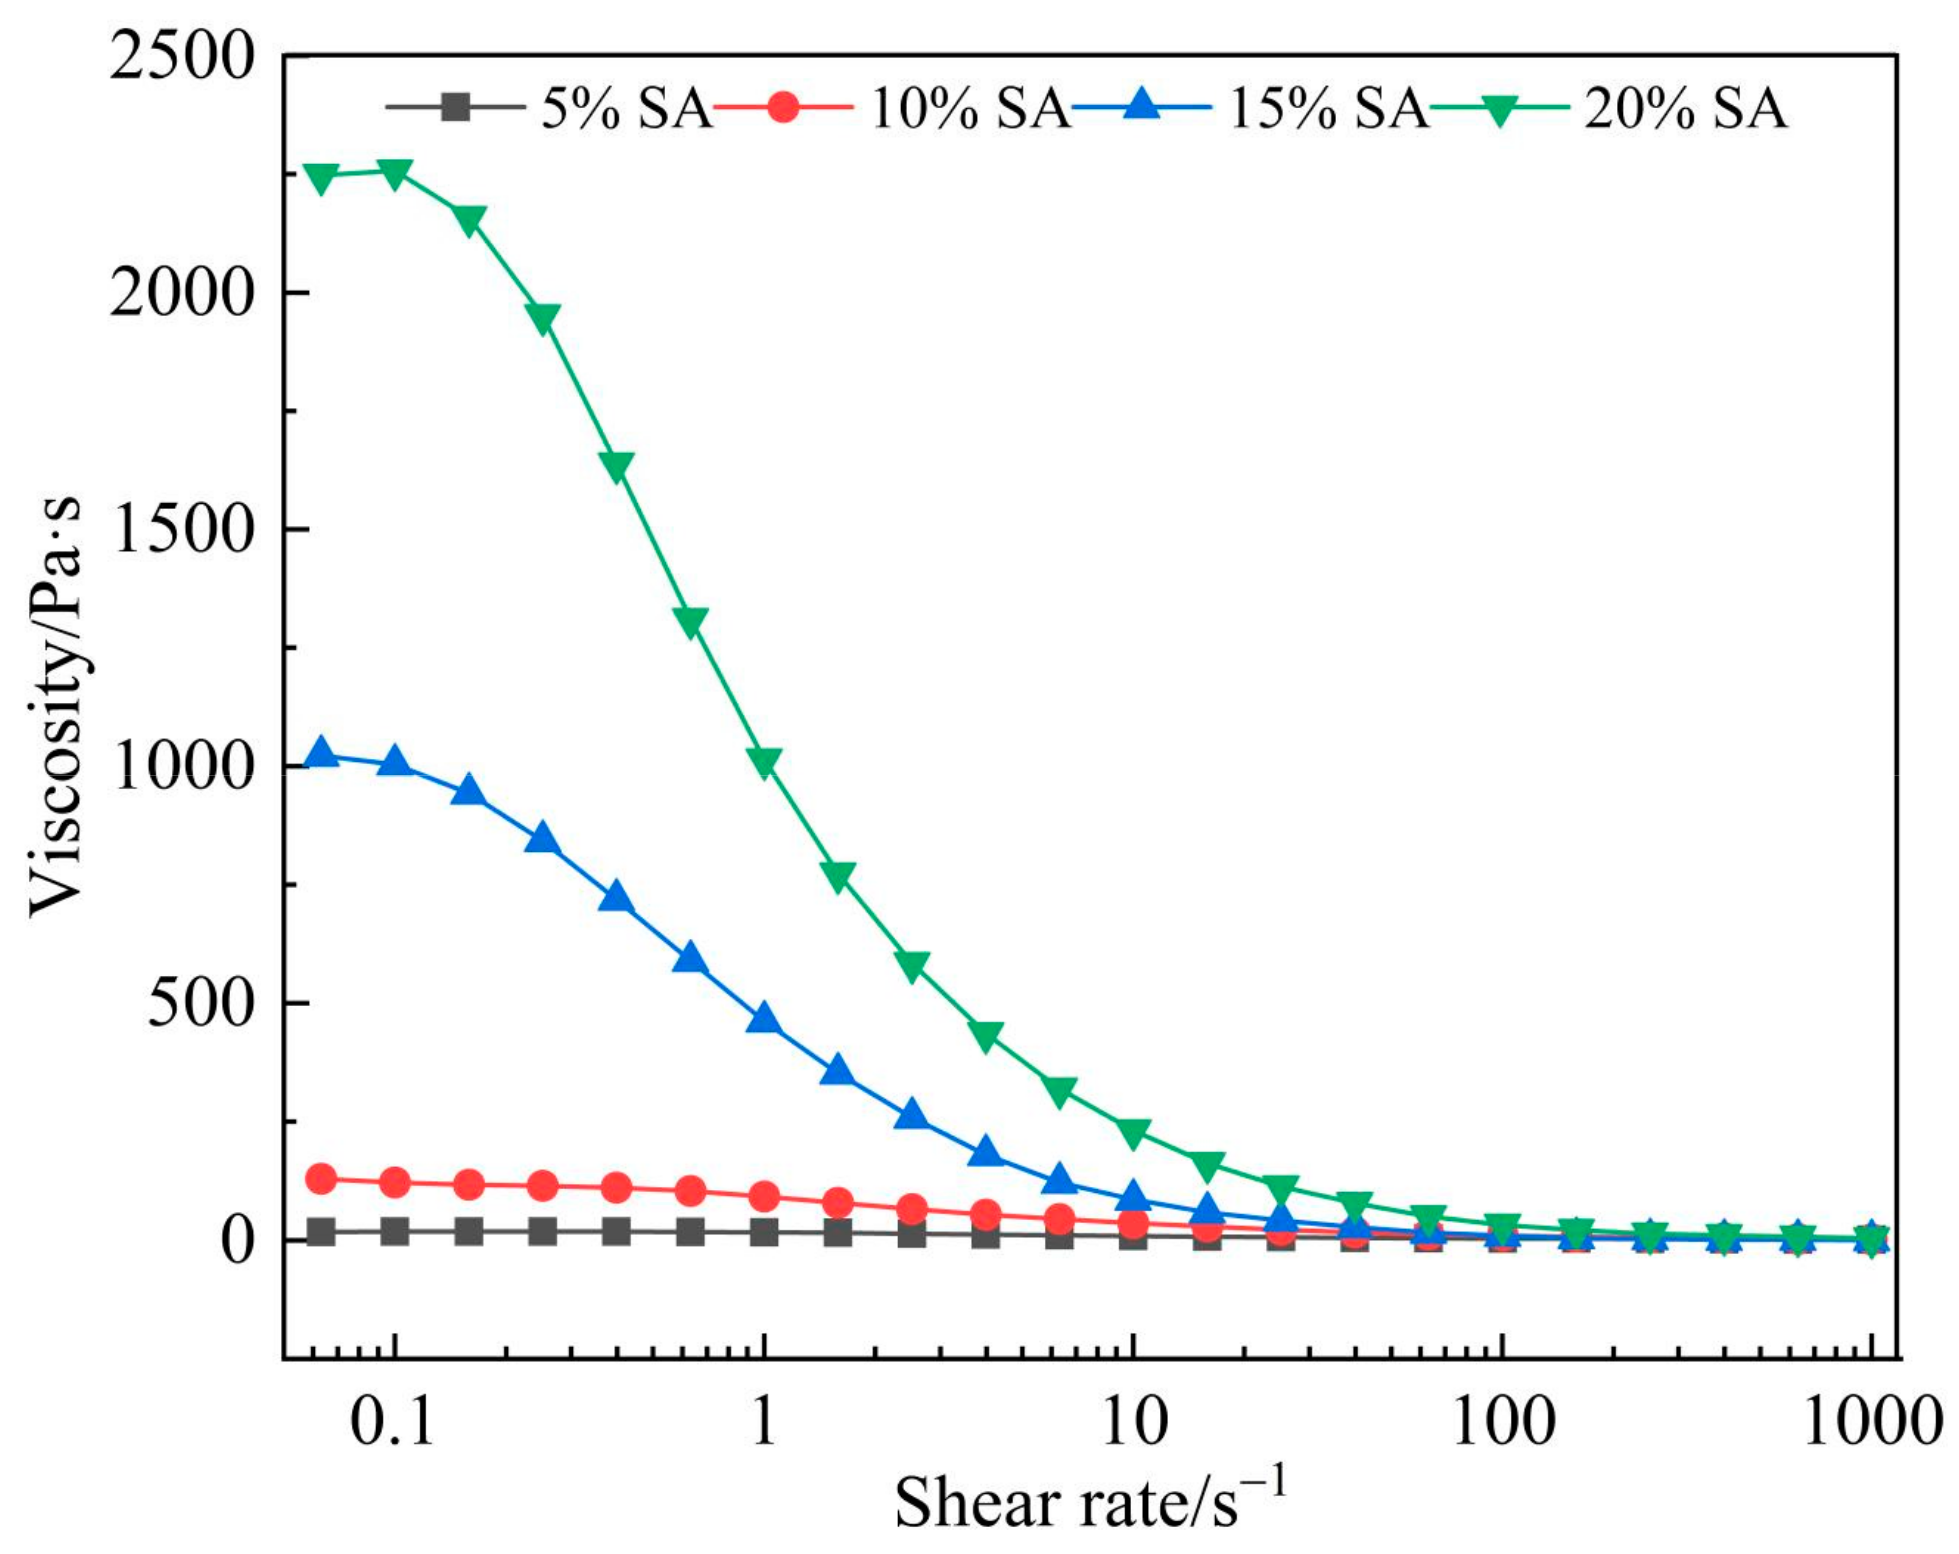
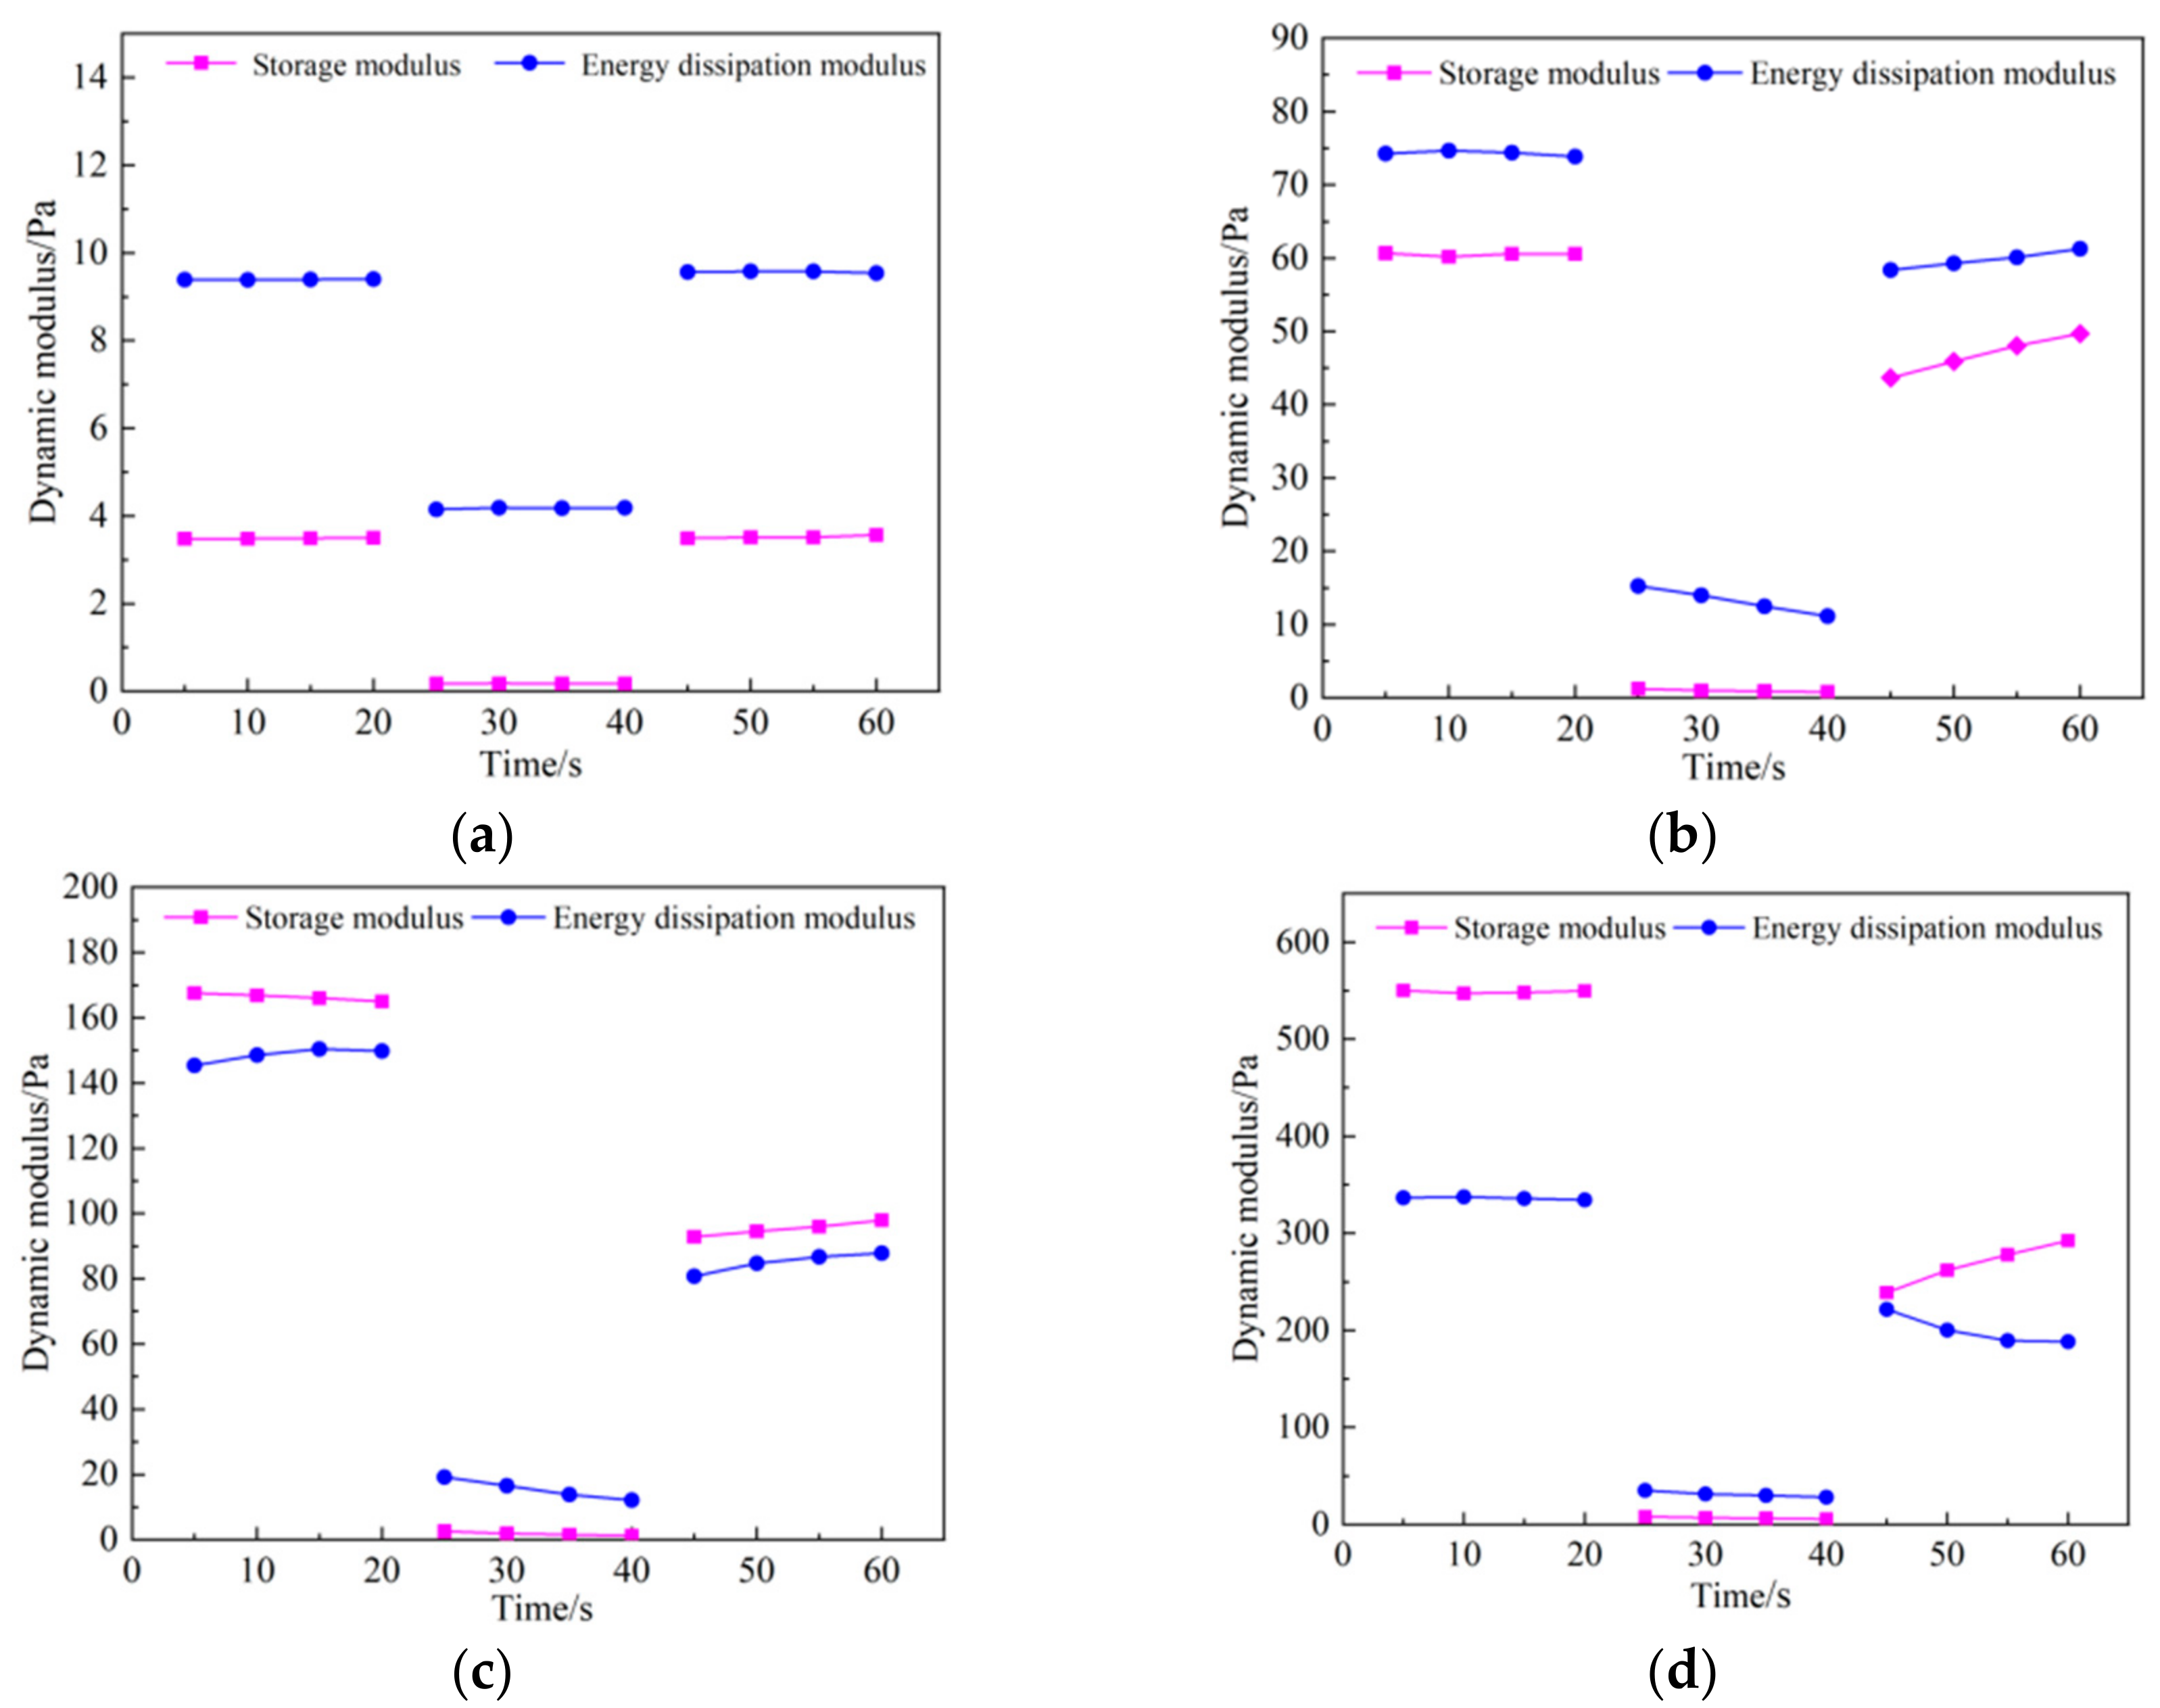
3.1. Analysis of Rheological Property of Shear-Thinning Fluid

Figure 6 shows the variation curves of fluid viscosity values with the shear rate for different SA mass fractions. It can be seen from the figure that when the mass fraction of SA is fixed value in the test level, the viscosity of fluid decreases with the increase of shear rate, which shows a continuous shear-thinning phenomenon. When the mass fraction of SA is less than 10%, and the shear rate is greater than 10/s, the fluid’s viscosity is very low, indicating a low critical shear rate. At a shear rate of 0.1/s, the viscosity values are 1003.3 Pa·s and 2257.5 Pa·s for SA mass fractions of 15% and 20%, respectively. The viscosity decreases significantly when the shear rate is increased to 100/s, indicating that a proper increase in SA is beneficial to increase the fluid’s critical shear rate.
The SA solution is a viscoelastic fluid, making the study of its viscoelasticity particularly important. According to the theory of viscoelasticity, elasticity represents the solid behavior of the system, while viscosity represents the liquid behavior. The elastic and viscous strengths of the system are expressed by the storage modulus (G′) and the dissipation modulus (G″), respectively [33]. When maize seeds impact on energy-dissipation parts made of SA solution at a certain velocity, the fluid movement process can be roughly divided into three stages under the action of shear force: the no-collision period under low shear rate, the collision period under high shear rate and recovery period under low shear rate.
Figure 7a–d record the values of energy storage modulus (G′) and energy-dissipation modulus (G″) for fluids with SA mass fractions of 5%, 10%, 15%, and 20%, respectively, across the three stages. As can be seen from the figure, the values of energy storage modulus and energy-dissipation modulus increase with the increase of the mass fraction of SA in the four sets of tests. Specifically, the values of G′ and G″ for 5% SA fluid are smaller, and the energy storage modulus of the fluid is smaller than the energy-dissipation modulus in the three time periods. Please note that G″ is larger than G′ during both the collision and recovery stages in the same set of tests, which indicates that the 5% SA fluid exhibits liquid-like behavior and has poor shape retention. For 10% SA fluid, the energy storage modulus is smaller than the energy-dissipation modulus throughout all three stages, but the values of G’ and G” increase significantly, indicating enhanced viscous and elastic properties. Therefore, it demonstrates that the 10% SA fluid can absorb energy and recover from deformation. For 15% SA fluid, the energy storage modulus is larger than the energy consumption modulus in the time period of 0~20 s and 40~60 s, which indicates that the fluid is a kind of solid and has a certain shape-retaining ability without shear action. The energy consumption modulus is larger than the energy storage modulus in the time period of 20~40 s, which indicates that the fluid mainly exhibits viscous characteristics when it is subjected to shear force. Thus, it proves that 15% SA fluid mainly consumes energy. The value of G′ for 15% SA fluid is approximately equal to three times 10% SA fluid, and the value of G″ for 15% SA fluid is approximately equal to twice 10% SA fluid for the collision-free period at a low shear rate. In the recovery period at a low shear rate, the value of G′ for 15% SA fluid is approximately equal to two times 10% SA fluid, and the difference between the two G″ values is very small, which indicates that the ability of 15% SA fluid to recover deformation in the absence of shear is slightly better than that of 10% SA fluid. The values of G′ and G″ are approximately equal for 15%SA fluid and 10% SA fluid for the collision period at a high shear rate. A comprehensive analysis of the rheological properties of the 10% SA and 15% SA fluids shows that the energy-dissipation modulus of both is approximately equal from the shear stage to the recovery stage, but there is a difference in specific rheological properties of both during the recovery stage. The G′ and G″ variation rules of 20% SA fluid and 15% SA fluid are the same in all three time periods, but the energy storage modulus of 20% SA fluid in the absence of shear is significantly increased, which indicates that the elastic properties of the fluid are better.
When seeds come into contact with the energy-dissipation body, the fluid flows under the influence of shear force, resulting in a damping force that dissipates external energy. In this paper, the shear-thinning fluid is used as the energy-dissipation material, which is laid in the middle of the seed-guiding device and the seed-metering device. In the ideal state, the seeds lose all their kinetic energy upon impact with the fluid, the fluid does not deform after impact, and the fluid exhibits excellent shape retention, which ensures that the seeds enter the seed-guiding device along the vertical direction. Fluid needs to have an appropriate balance of viscosity and elasticity. If the elasticity of the fluid is too low, the ability to recover from deformation is poor, which can easily cause sticking. Conversely, if the fluid’s elasticity is too high, it can cause the seeds to rebound, failing to meet the requirements for energy dissipation. In addition, the analysis shows that the 5% SA fluid is mainly in a liquid-like state, with a large amount of subsidence after seed impact, which makes it impossible to maintain the shape of the energy dissipator. Conversely, the 20% SA fluid is more elastic, with a sharp rebound after seed impact. Therefore, 5% SA and 20% SA fluids are not suitable as materials for energy-dissipation devices. Thus, 10% SA and 15% SA fluids will be selected for experimental studies on seed energy dissipation.

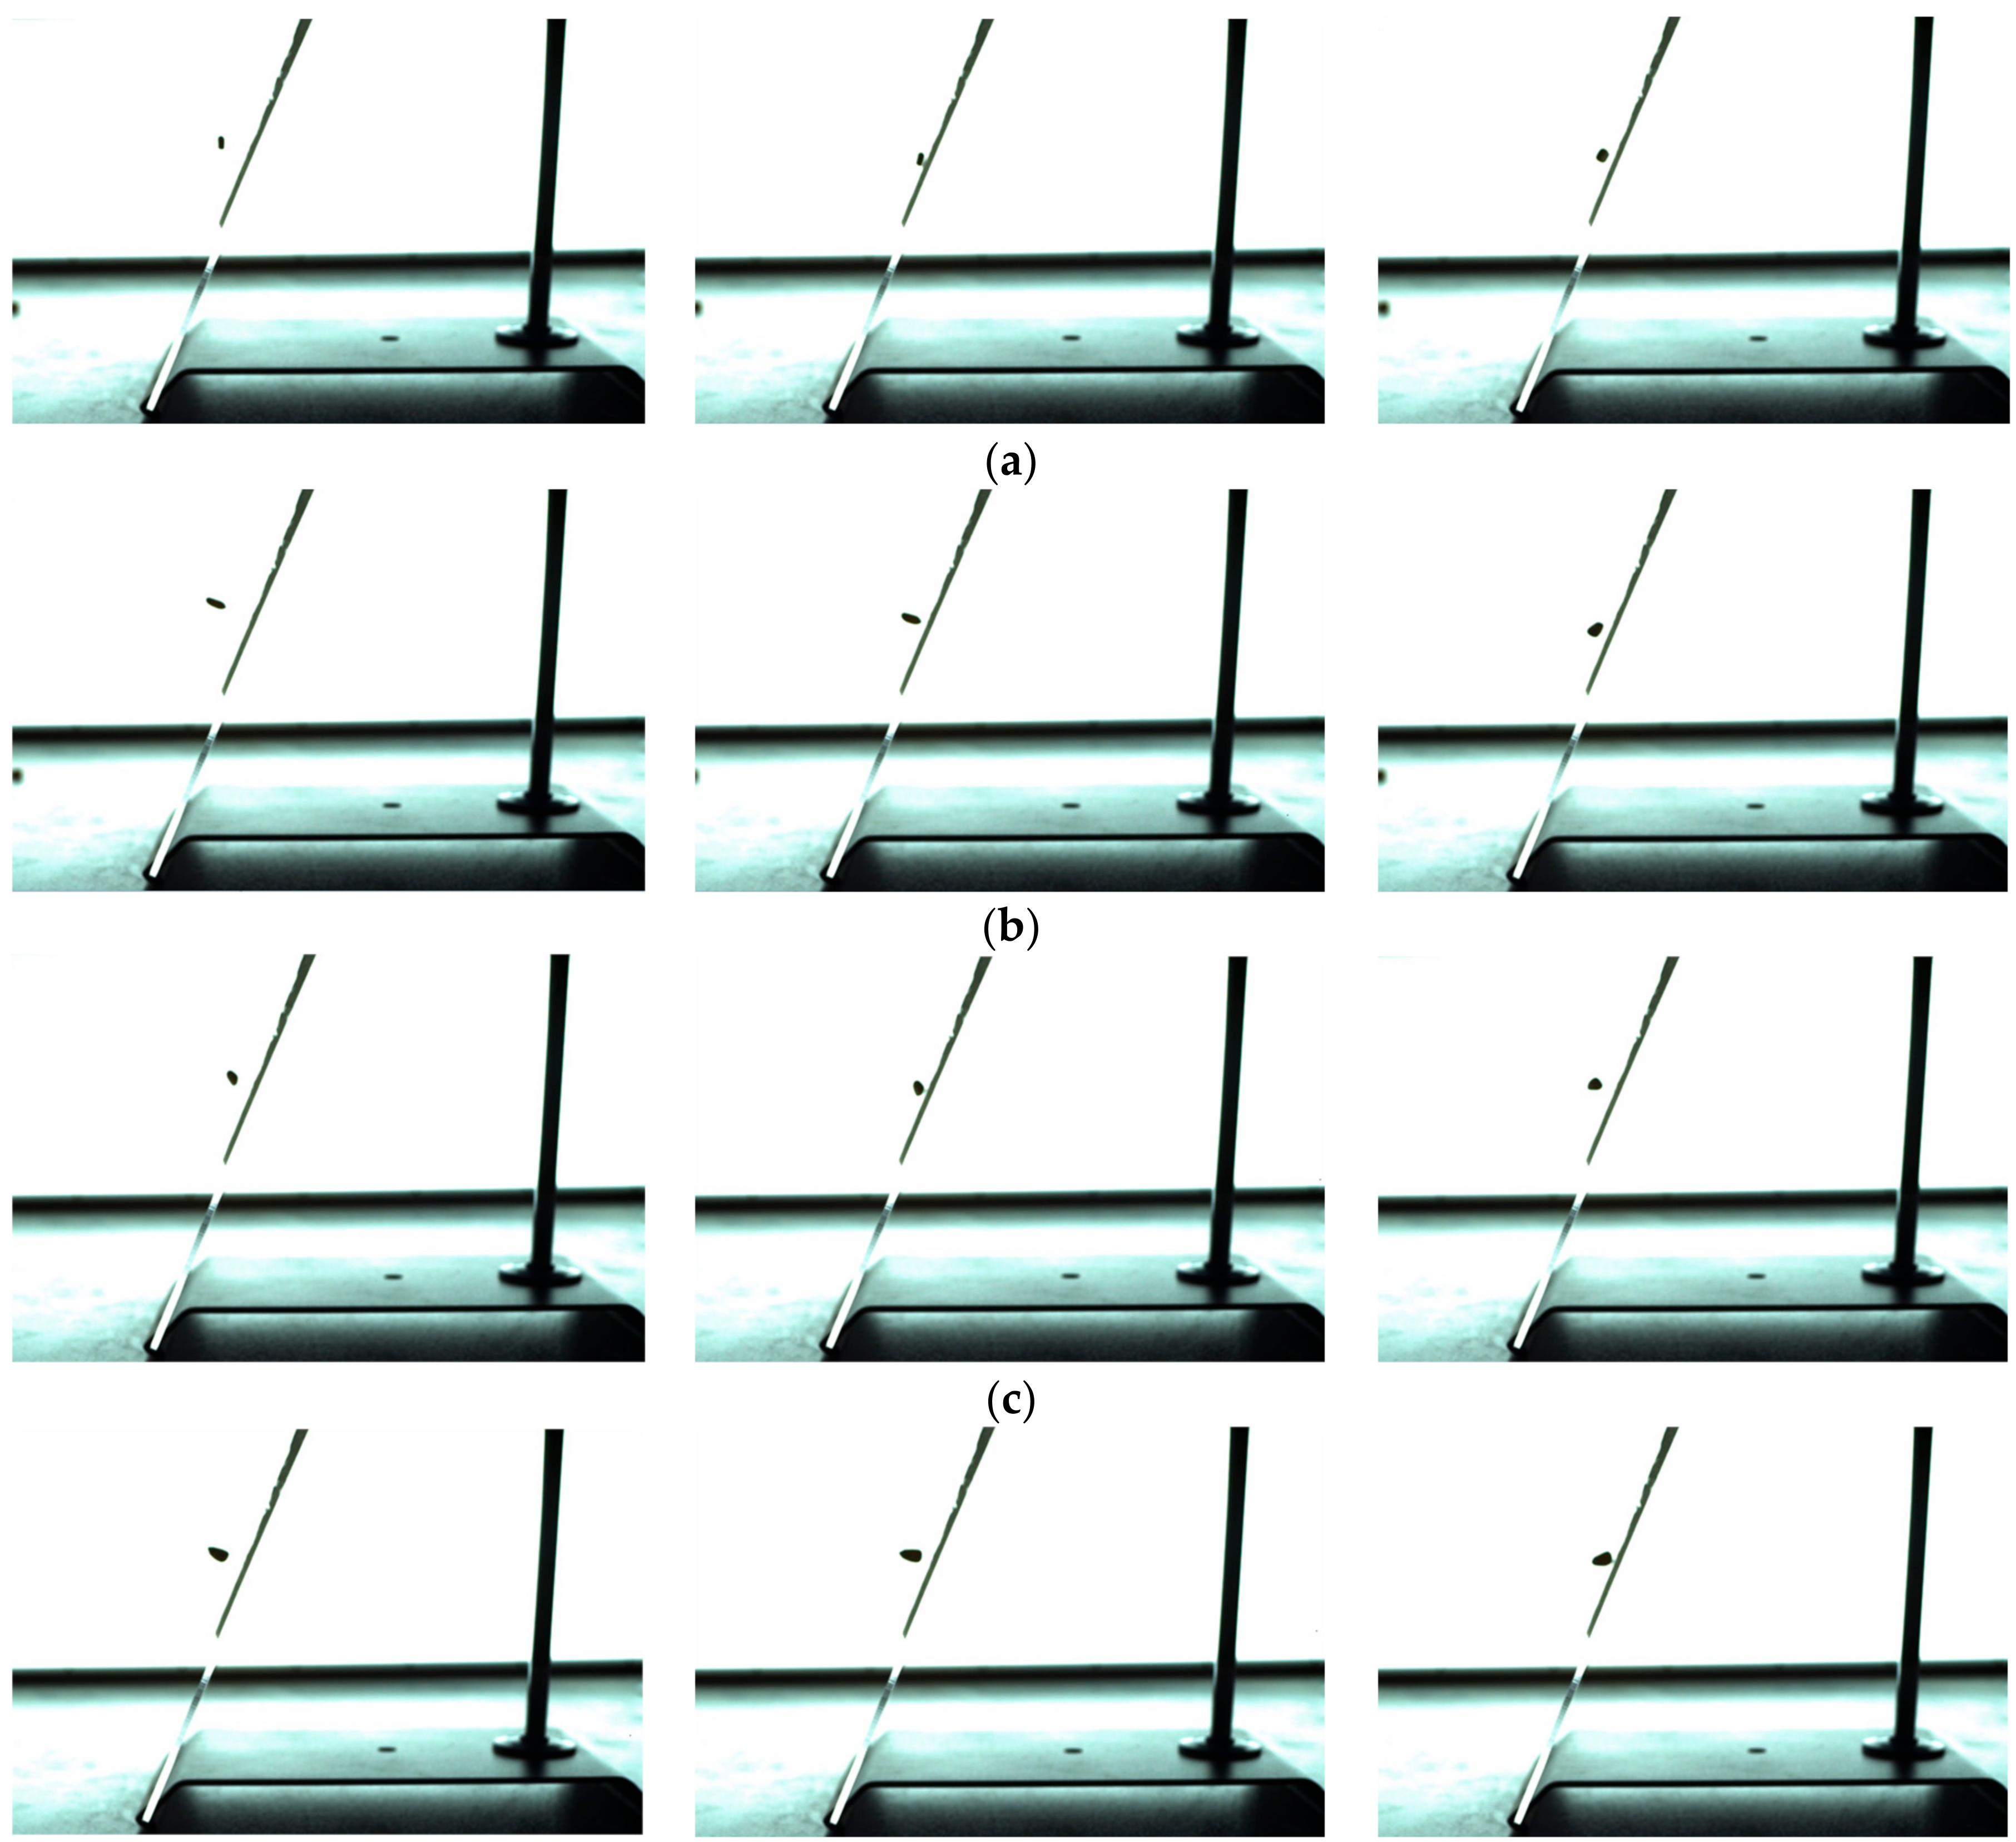
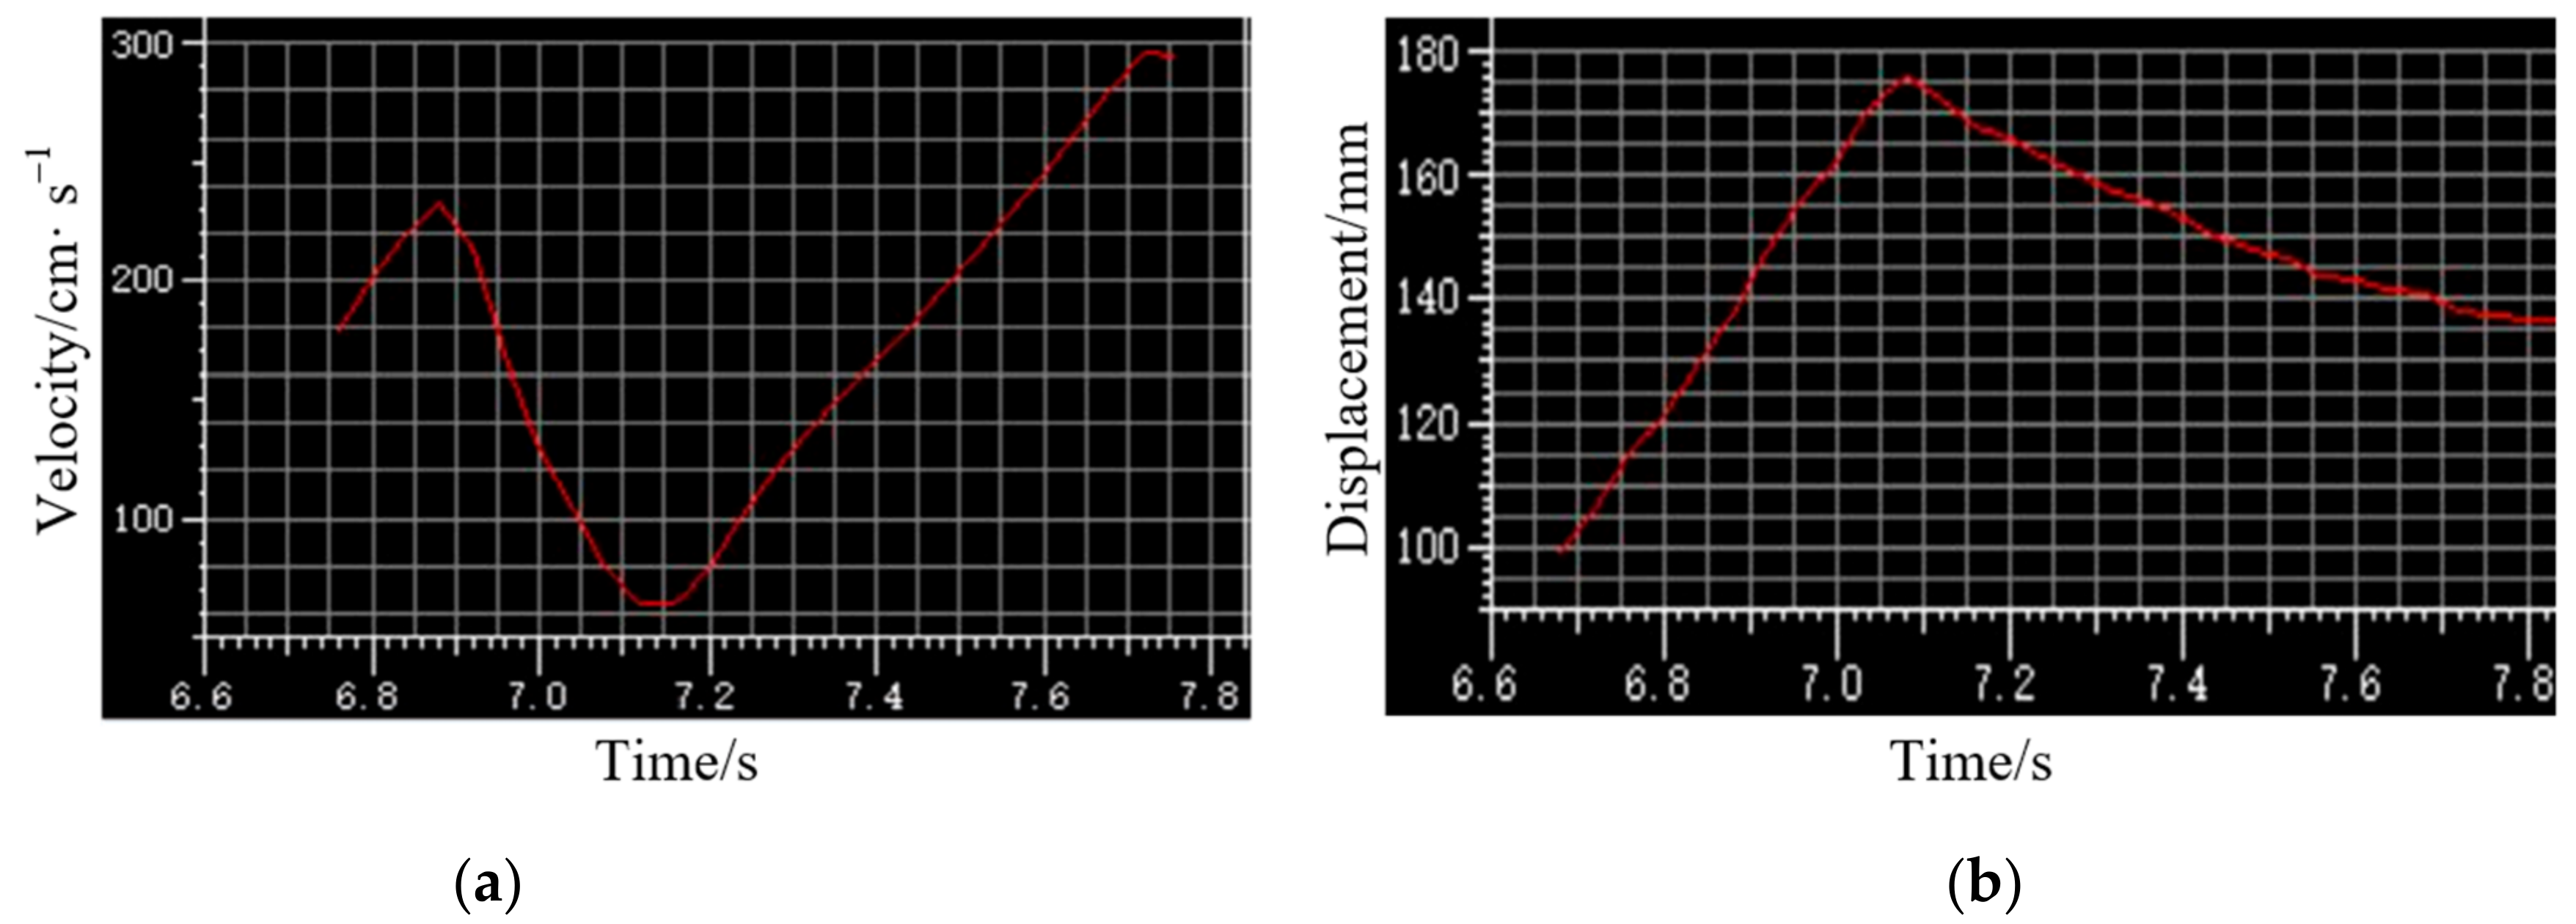
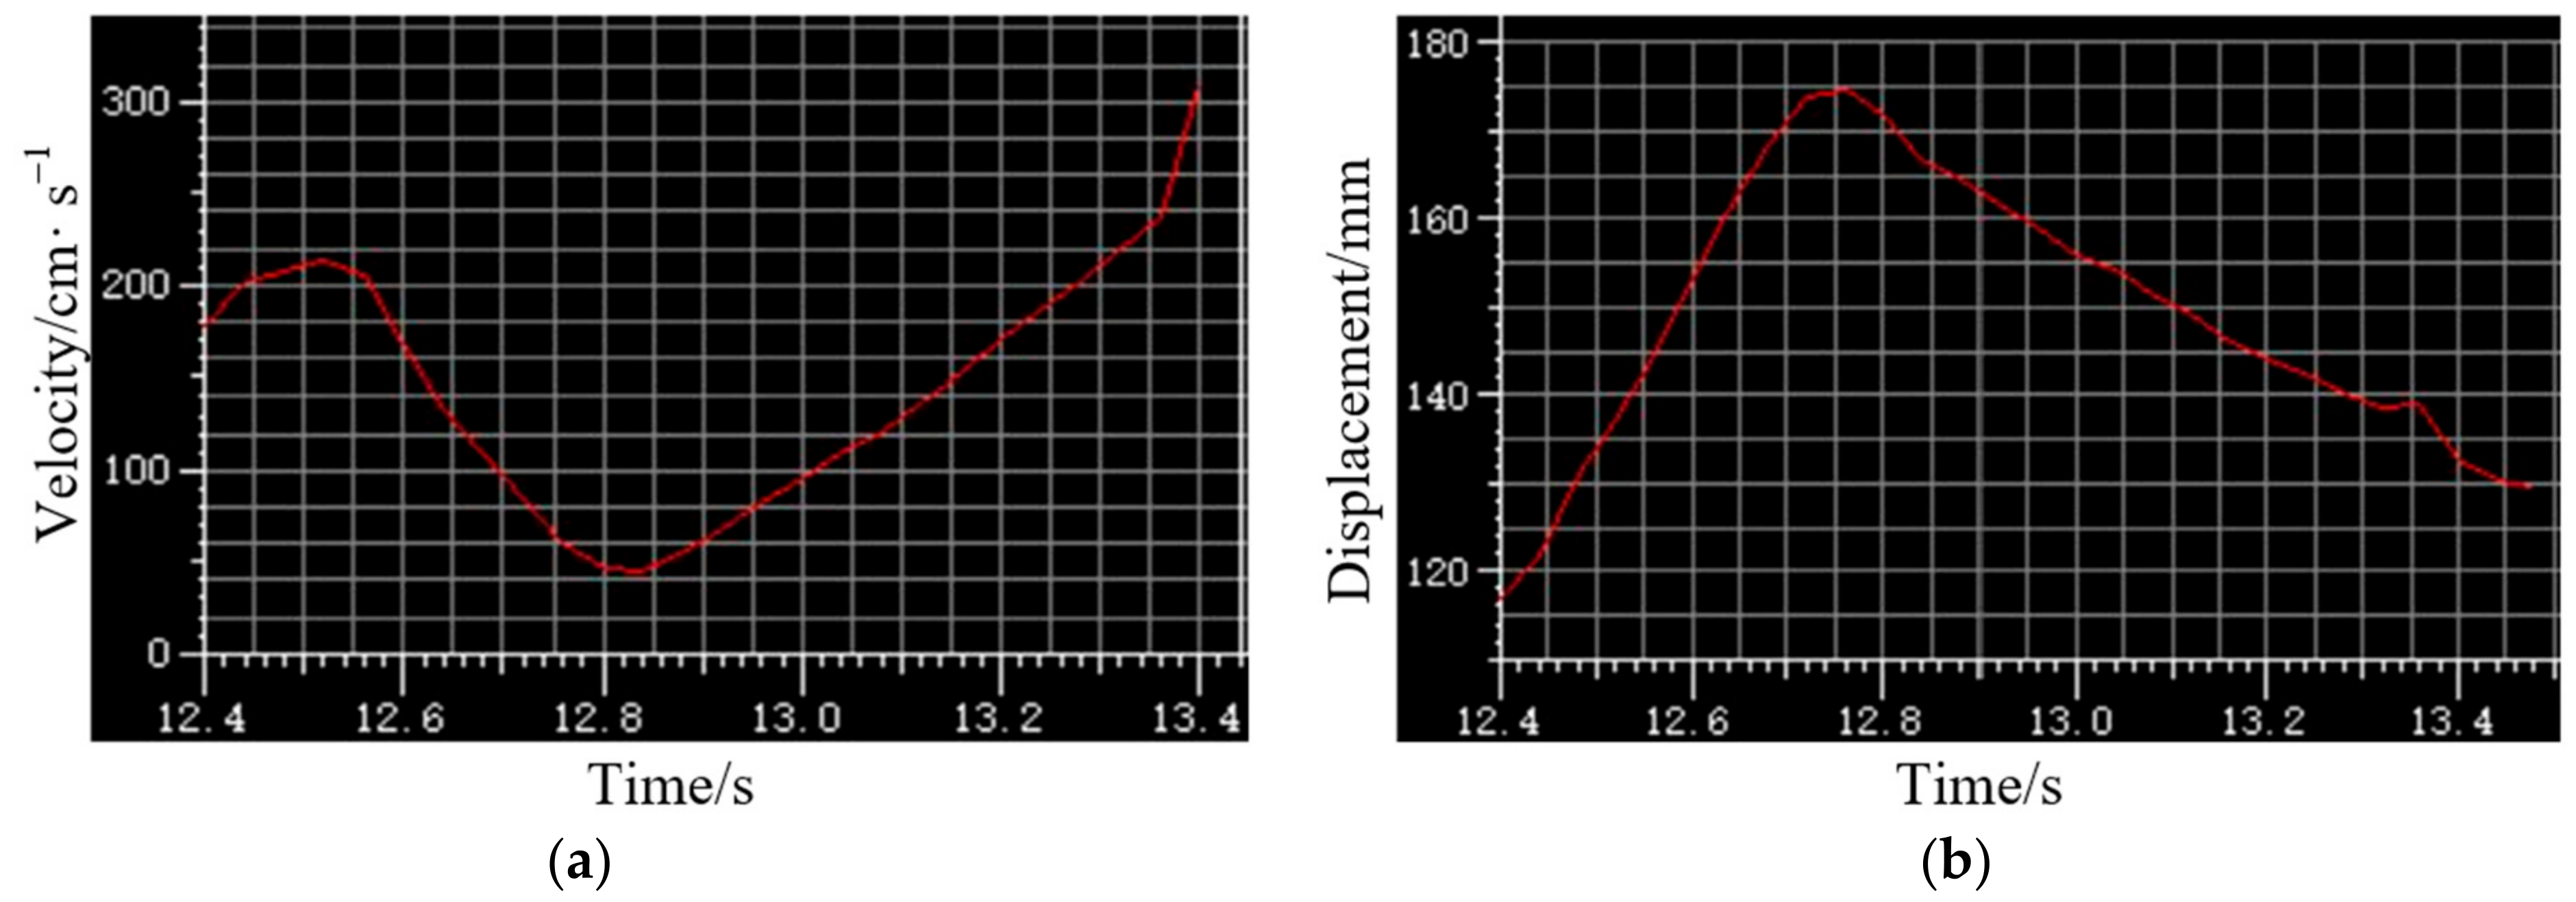
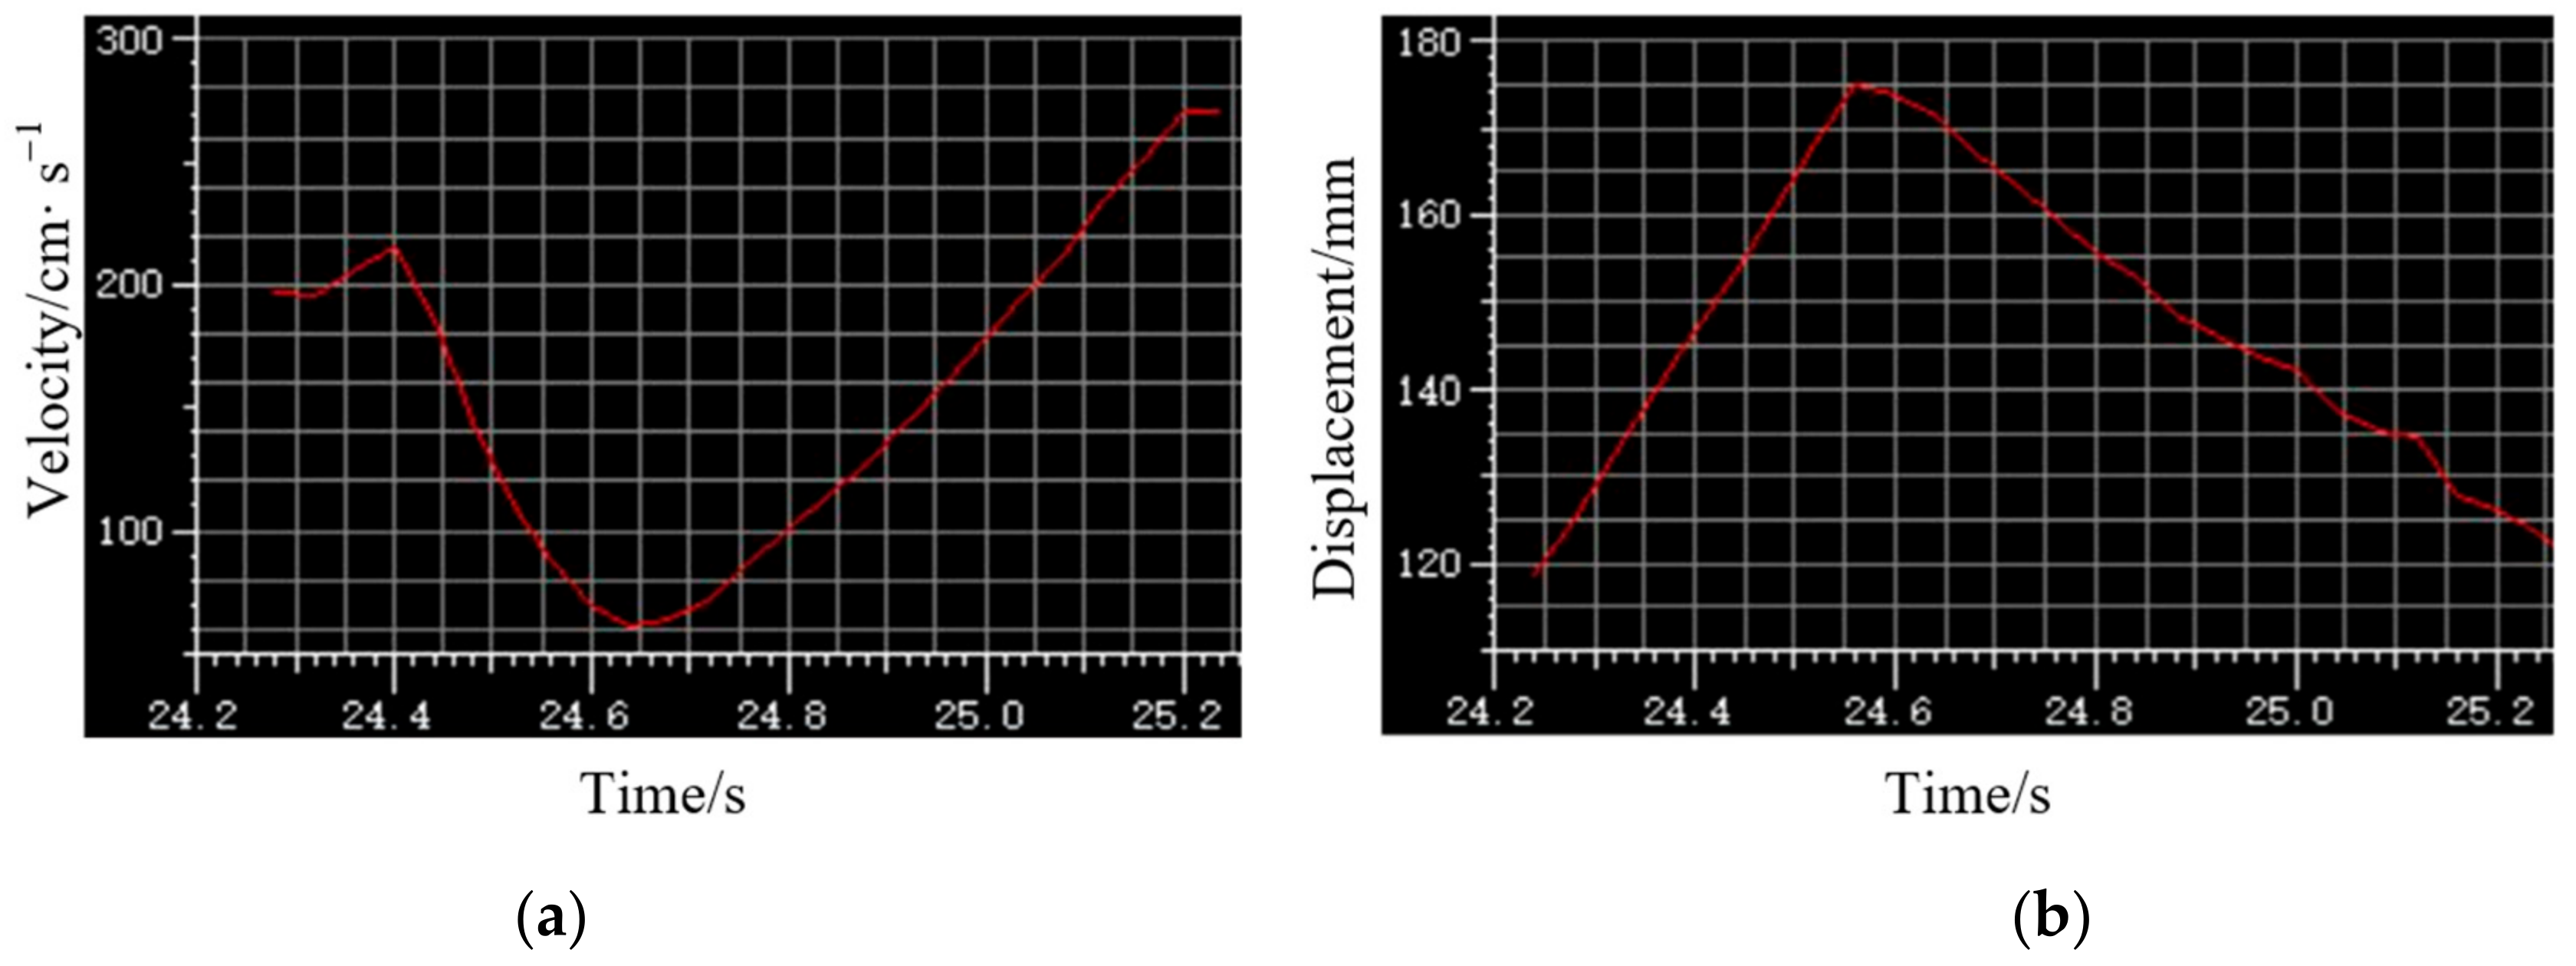
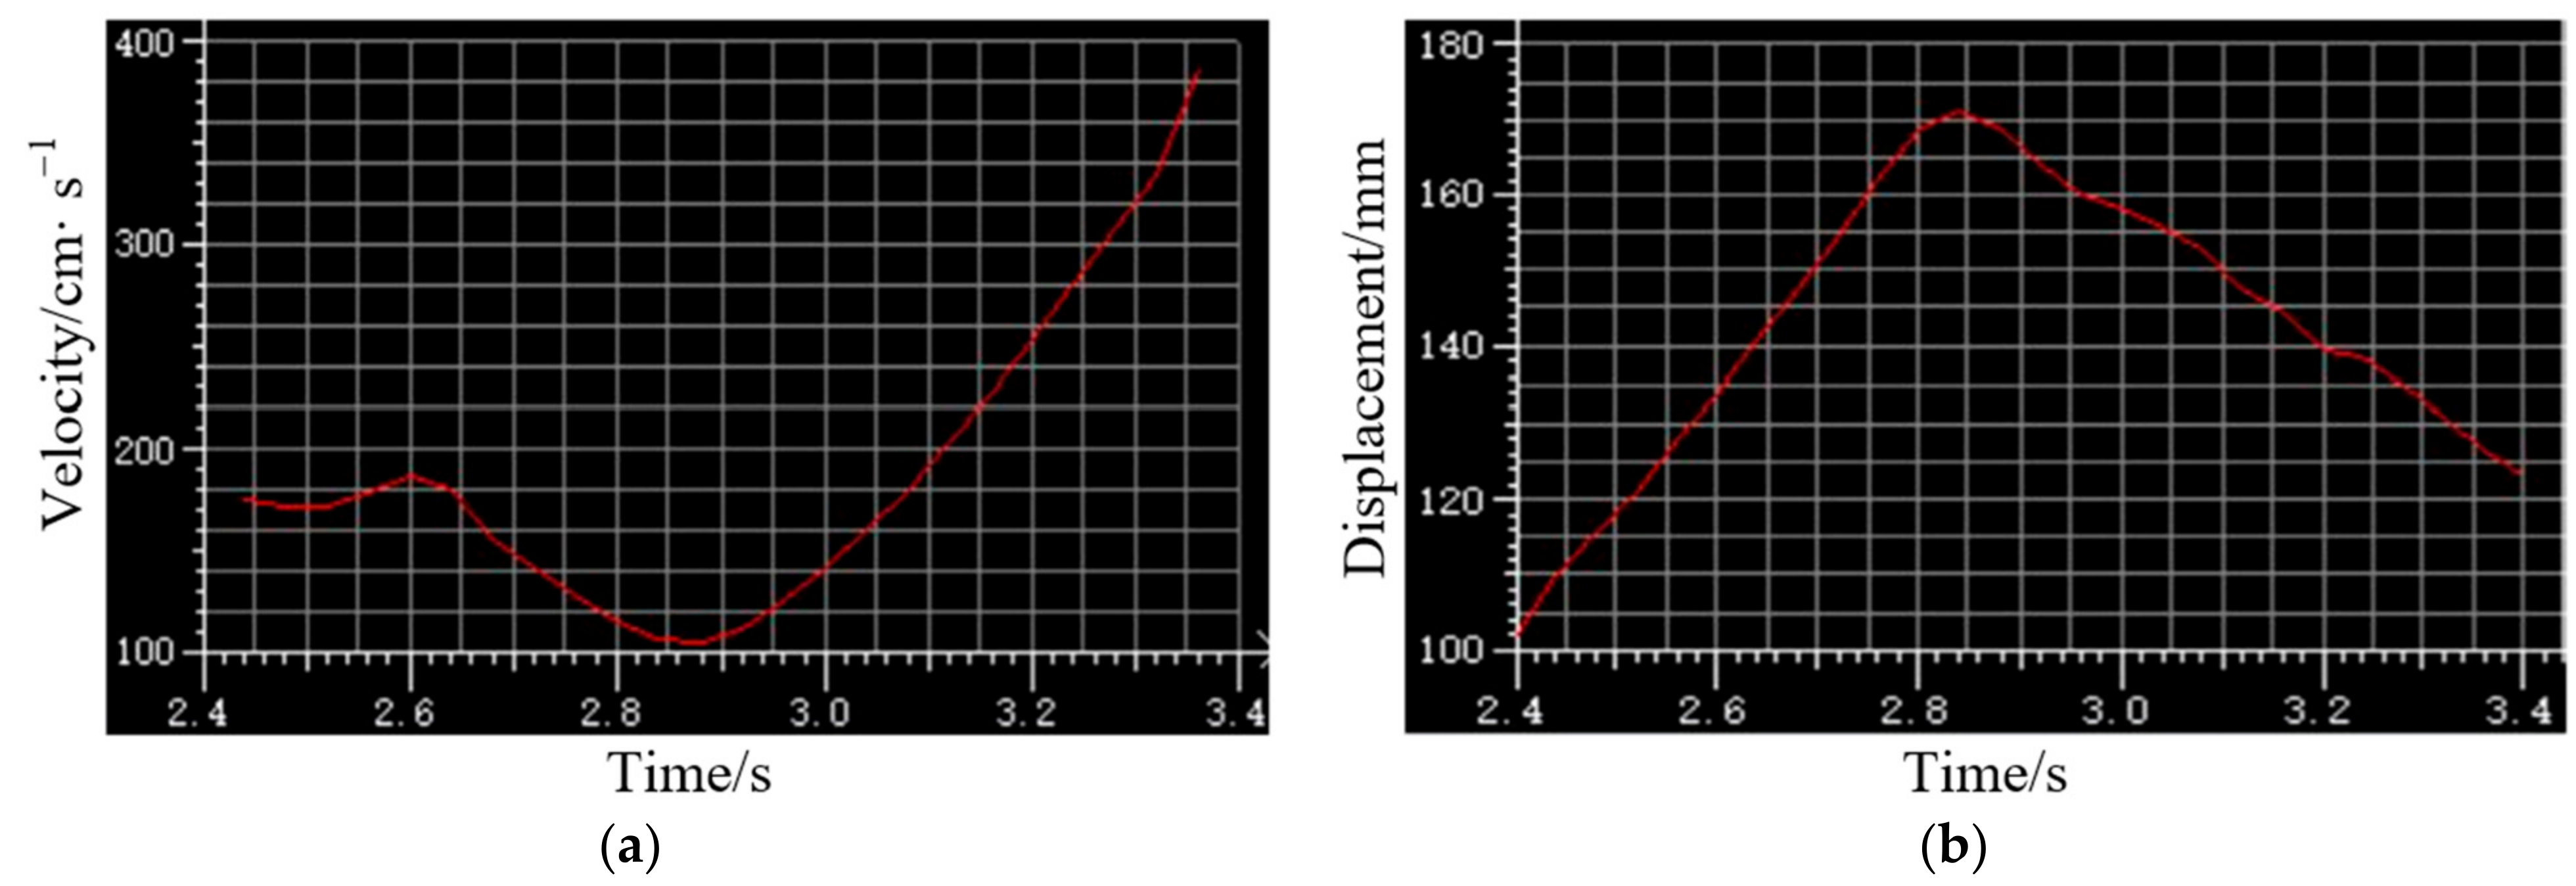
3.2. Analysis of the Seed Energy-Dissipation Process

3.2.1. Feasibility of the Seed Energy Dissipation

When the mass fraction of SA in the dispersed phase is 10%, the impact velocity is 2 m·s−1 and the impact angle is 30 degrees, maize seeds might impact flexible material in four postures: the largest side in the plane of seed contacts flexible material (broad-side impact), the tip of seed contacts flexible material (tip impact), the side of seed contacts flexible material (side impact) and the tail of seeds contacts flexible materials (bottom impact), as shown in Figure 8a–d in turn. Additionally, the movement posture of seeds changes obviously after impacting the energy-dissipation material. The movement of seeds after contact with flexible material is different, with different postures of seeds impacting flexible materials. This phenomenon is consistent with the theoretical analysis of the seed energy-dissipation equation.
The velocity and transverse displacement of the seed under four impact postures as a function of time are shown in Figure 9, Figure 10, Figure 11 and Figure 12.
By analyzing the time-velocity curves in Figure 9, Figure 10, Figure 11 and Figure 12, it can be seen that before and after the seeds hit the flexible materials, the seed velocity experienced three stages: acceleration, deceleration, and re-acceleration over time. Before the seeds contact the flexible material, due to the small height of the flexible material, the seed velocity increases slightly under gravity. After the seed comes into contact with the flexible material, the shear force is exerted on the flexible material, causing the material to flow and rapidly dissipate the seed’s kinetic energy of the seed, resulting in the seed’s velocity rapidly decreasing to a minimum. When the seed separates from the flexible material, it accelerates under the action of gravity, causing its velocity to increase. The seed’s velocity in the second stage is greatly reduced, which proves that the flexible materials designed in this paper effectively reduce the seed’s velocity. It also can be found that the reduction in kinetic energy varies with different impact postures. Specifically, the seed’s velocity decreased from 2.32 m·s−1 to 0.63 m·s−1 for broad-side impact, from 2.18 m·s−1 to 0.41 m·s−1 for tip impact, from 2.11 m·s−1 to 0.60 m·s−1 for side impact, and from 1.92 m·s−1 to 1.01 m·s−1 for bottom impact. The greater the pre- and post-impact velocity difference, the more effective the energy absorption of the energy dissipator. The seed velocity curve rapidly changes from a minimum in the second stage to continuous growth in the third stage, indicating that the seeds are not stuck in the flexible material.
By analyzing the time-transverse position curves in Figure 9, Figure 10, Figure 11 and Figure 12, it can be seen that before and after the seed impacts the flexible material, the seed’s transverse displacement goes through two stages: an increase followed by a decrease over time. Due to the horizontal impact velocity, the seed’s transverse displacement gradually increases before contacting the material. After the seed contacts the flexible material, the seed has a reverse horizontal velocity, and its transverse displacement gradually decreases, indicating the elasticity of the flexible material, which ensures that the seed quickly separates from the flexible material after impact. In the experiment, the energy-dissipation material bracket is fixed. Considering the arrangement position of the test device, it can be seen that the greater the transverse displacement of the seed’s moving end, the smaller the distance between the seed and the bracket’s end face, indicating a smaller bounce amplitude after impact. The transverse displacement of the seed’s moving end is the largest for broad-side impact, resulting in the smallest bounce amplitude. The transverse displacement values of the moving end of seeds are different under the four impact postures, but the difference is very small, which shows that seeds can enter the seed-guiding device along the same position. The above analysis verified the feasibility of using an SA solution to make an energy-dissipation device.

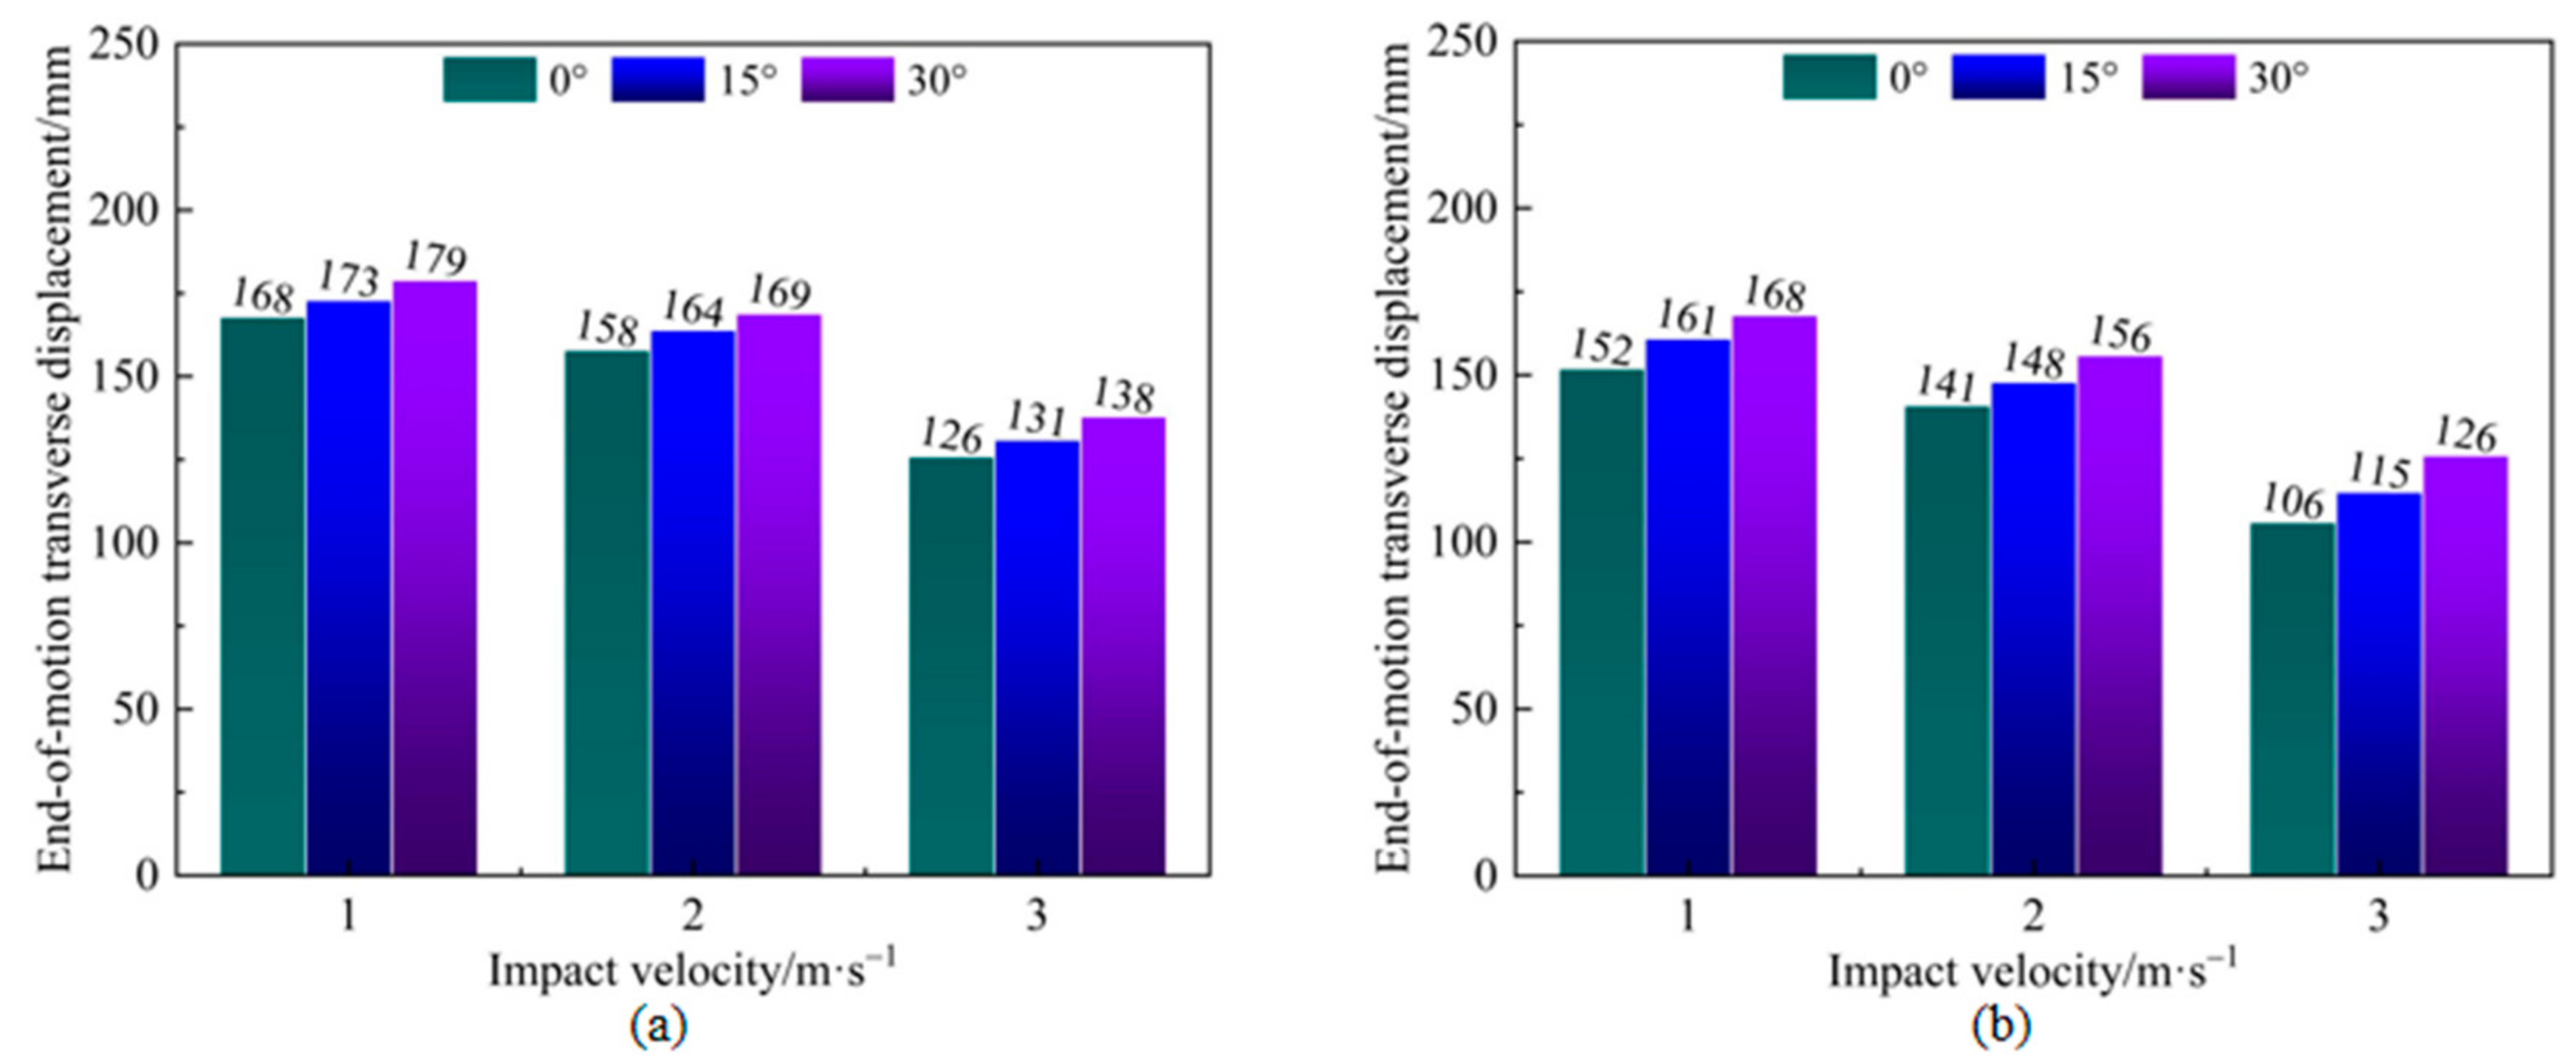
3.2.2. Influence of Experimental Factors on Energy-Dissipation Process

The influence of different mass fractions of fluid dispersed phase on the pre-and post-impact velocity difference is shown in Figure 13. When the impact angle is a fixed value in the test range, the energy dissipator can effectively dissipate the seed’s kinetic energy at each velocity level. The 10% SA fluid has a better kinetic energy-dissipation ability than the 15% SA fluid because the 10% SA fluid exhibits stronger flow performance under the same shear force, producing a larger damping force and thus dissipating more energy. At the same impact velocity, the pre- and post-impact velocity difference is smallest at an impact angle of 0 degrees and largest at an impact angle of 30 degrees. This may be because maize seeds are irregular objects; a larger impact angle increases the contact area with the energy dissipator during oblique motion, resulting in a larger trailing force from the fluid and greater kinetic energy dissipation.
The influence of different mass fractions of fluid dispersed phase on the transverse displacement values at the end of the seed movement is shown in Figure 14. At the same impact velocity and angle, the transverse displacement values of seeds impacting the 10% SA fluid are larger than those impacting the 15% SA fluid, further supporting the good energy absorption effect of the 10% SA fluid. Based on the above experimental results, 10% SA fluid is determined to be the fabrication material for the energy dissipator. However, within the test range, although the velocity difference of seeds after impacting the energy dissipator is significantly reduced, the post-impact seed velocity remains high. For example, when the impact velocity is 3 m·s−1 and the impact angle is 0 degrees, the pre-and post-impact velocity is 1.14 m·s−1, indicating the need to further optimize the energy dissipator’s structure.

3.3. Optimization of Energy Dissipator

To further reduce the bounce degree of seeds after impacting the energy dissipator, based on the previous test and analysis results, a regression orthogonal test design was carried out according to Box-Behnken central combination test design theory. The test scheme and results are shown in Table 3.

3.3.1. Analysis of Variance and Establishment of Regression Model

Using Design-Expert 10 software (Stat-Ease Ltd., Godward St NE, Minneapolis, MN, USA) to carry out regression analysis on the experiment data in Table 3, the regression equations between the pre- and post-impact velocity difference y1, end-of-motion transverse displacement value y2, energy dissipator thickness E, impact velocity F, and impact angle W as shown in Formula (10).
y 1 = 1.8 + 0.23 E + 0.078 F + 0.81 W + 0.045 E F 0.15 E 2 0.15 F 2 0.057 W 2 y 2 = 170.06 + 2.5 E 18.75 F + 6.25 W 8.18 F 2 + 4.83 W 2
The results of the variance analysis of the regression equation are shown in Table 4. The models of pre- and post-impact velocity difference and end-of-motion transverse displacement value are extremely significant. However, the lack of fit of regression equations is insignificant. The determination coefficients R2 of y1 and y2 are 0.9469 and 0.8574, respectively, which indicates that the predicted value of the regression equation has an excellent correlation with the actual value. The primary and secondary factors affecting the pre- and post-impact velocity difference and end-of-motion transverse displacement value are impact velocity F, impact angle W, and energy dissipator thickness E, in turn.

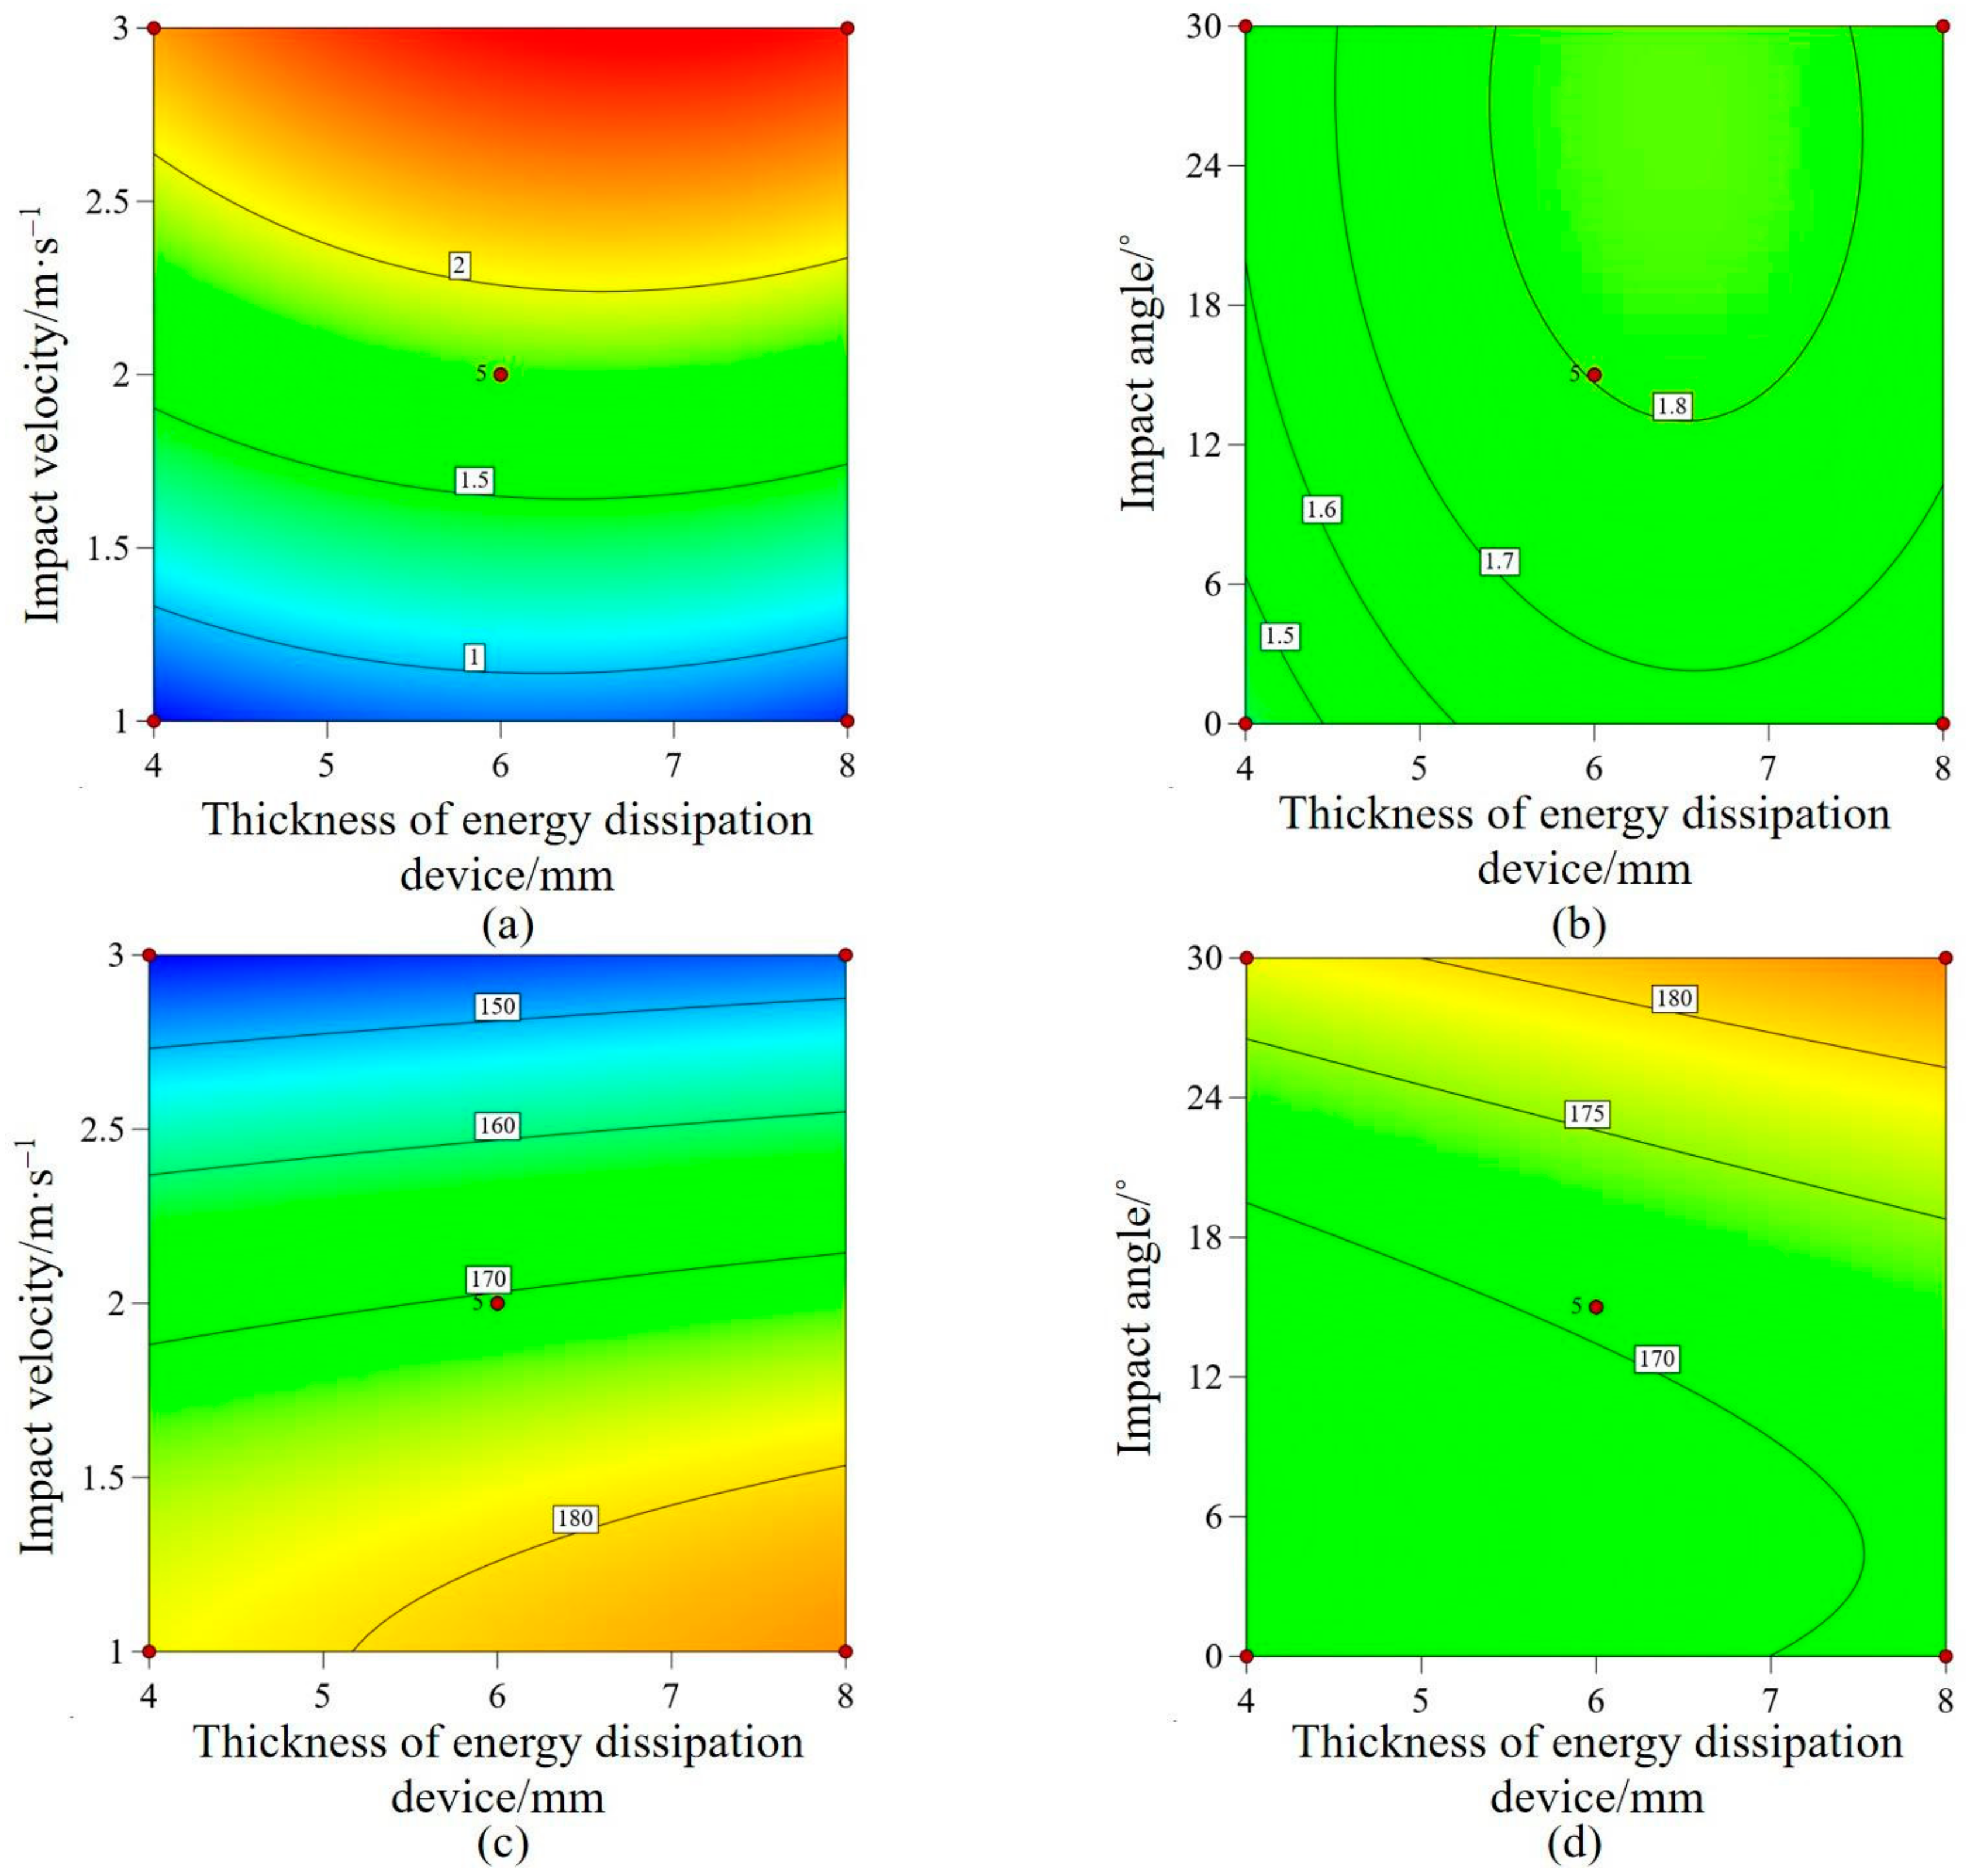
3.3.2. Analysis of the Influence Effect of Energy Dissipator Thickness

To analyze the relationship between the energy dissipator thickness and the energy-dissipation effect, contour plots between the elements and the indicators were obtained using the Design-Expert 10 software, as shown in Figure 15. At the same velocity level, the pre-and post-impact velocity difference increases with the energy dissipator thickness. However, when the energy dissipator increases from 6 mm to 8 mm, the growth rate of the pre-and post-impact velocity difference decreases. This may be because the seed’s impact velocity is small. The applied shear force cannot make the energy dissipator flow and then cannot dissipate more kinetic energy. Therefore, within the range of experimental values, there is an optimal thickness of the energy dissipator, which can dissipate the kinetic energy of seeds to the maximum extent. At a fixed impact velocity, the interaction between the thickness of the energy dissipator and the impact angle has a minimal effect on the pre-and post-impact velocity difference. When the impact angle or impact velocity is fixed, the end-of-motion transverse displacement is positively correlated with the energy dissipator thickness.

3.3.3. Parameter Optimization and Experimental Validation

To determine the optimal thickness of the energy-dissipation flexible bearing body, the maximum pre-and post-impact velocity difference and end-of-motion transverse displacement are used as the evaluation index. The regression model is solved by multi-objective optimization, and the optimization objective function and constraint conditions are shown in Formula (11).
m a x y 1 ( E , F ,   W ) 4 E 8 1 F 3 0 W 30 m a x y 2 ( E ,   F ,   W ) 4 E 8 1 F 3 0 W 30
Combined with the test results, it is observed that at each level of impact velocity, the pre-and post-impact velocity difference and end-of-motion transverse displacement are the smallest at an impact angle of zero. Therefore, the optimization calculation module of Design-Expert is used to determine the optimum thickness of the energy-dissipation flexible bearing body at three speeds when the impact angle is zero, as shown in Table 5. The optimal thickness of the energy-dissipation flexible bearing body for the optimized range of impact velocities is 6.3~6.9 mm. Because the thickness of the energy-dissipation flexible bearing body needs to meet the minimum bounce of the seed at all impact velocities, the predicted value at the maximum impact velocity was chosen as the optimal value. Considering the production difficulty, the thickness of the energy-dissipation flexible bearing body is determined to be 7 mm.
Verification tests were carried out to verify the accuracy of the optimization results, as shown in Table 5. The results showed that when the impact velocity was 1~3 m·s−1, the pre-and post-impact velocity difference was 0.71~2.41 m·s−1, with a seed velocity absorption ratio of 71~80.3%, indicating a better energy-dissipation effect. The difference between the predicted value and the actual value of the pre-and post-impact velocity difference is small. For the end-of-motion transverse displacement, the actual value is less than the predicted value, with an error of less than 8 mm. The main reason is that maize seeds are irregular in shape, and the postures of the seeds at the end of the movement are different. During image processing, the center of the seeds is taken as the measuring point, so the displacement values are different.

3.4. Analysis of Field Experiment Results

Comparative test results are shown in Figure 16. According to the field test results at different working speeds, the data analysis showed that the numerical differences for the same test index were very small at the same working speed level, which indicated that the seed transport system of the high-speed vacuum seeder could work continuously and stably. At all speed levels, the leakage rate was less than 6.83%, the multiple rate was less than 0.97%, the qualified rate was stable at more than 92.4%, and the qualified grain distance variation rate was stable at less than 16.57%. When working parameters were the same, the grain spacing uniformity was significantly better than the planter without the energy-dissipation device. For example, at a working speed of 14.13 km·h−1, the leakage rate decreased by 2.4%, the multiple rates decreased by 0.4%, the qualified index increased by 2.8%, and the qualified grain distance variation rate decreased by 3.63%. The results showed the same tendency with Li’s research [34]. This proves that the energy-dissipation device designed in this paper is beneficial for improving the overall working performance of high-speed precision seeders.

4. Conclusions

(1)
Seed-throwing in an unconstrained state and seed impact with the wall of the seed-guiding device results in poor sowing uniformity of the seeder under high-speed working.
(2)
The mass fraction of the fluid dispersed phase significantly influenced the energy dissipation and flexible undertaking. The results of rheological performance experiments show that the rheological properties of 10% SA and 15% SA fluids are similar. Both fluids exhibit good energy absorption and strong deformation recovery ability.
(3)
The motion posture, velocity, and displacement of the seed energy-dissipation process are evaluated, and it is determined that the material of the energy dissipator is the colloid with an SA percentage of 10%.
(4)
The thickness of the energy dissipator was determined to be 7 mm through regression orthogonal experiments and parameter optimization. The results of the validation experiments show that when the impact velocity was 1~3 m·s−1, the pre-and post-impact velocity difference was 0.71~2.41 m·s−1, the absorption ratio of seed velocity was 71~80.3%, indicating a better energy-dissipation effect.
(5)
The field experiment results prove that the high-speed vacuum seed transport system could work continuously and stably. When the working speed was 12~16 km·h−1, the leakage rate was less than 6.83%, the multiple rate was less than 0.97%, the qualified rate was stable at more than 92.40%, and the qualified grain distance variation rate was stable at less than 16.57%, which proves that the energy-dissipation device is beneficial for improving the overall working performance of high-speed precision seeder. In the future, the dynamics of seed movement, as they fall into the seed furrow, will be studied in detail, with the aim of enhancing the application of the energy-dissipation device in practical agricultural production.

Author Contributions

Conceptualization, G.W.; methodology, R.L.; software, R.L.; validation, Z.M.; formal analysis, R.L.; investigation, B.Y. and R.L.; resources, B.Y. and Z.M.; data curation, R.L.; writing—original draft preparation, R.L.; writing—review and editing, Z.M and G.W.; visualization, J.D. and R.L.; supervision, G.W.; project administration, J.D.; funding acquisition, Z.M. All authors have read and agreed to the published version of the manuscript.

Funding

This research was funded by the National Key Research and Development Program of China (2021YFD2000402) National Natural Science Foundation (32301705).

Institutional Review Board Statement

Not applicable.

Data Availability Statement

Data are contained within the article. The data presented in this study can be requested from the authors.

Conflicts of Interest

The authors declare no conflicts of interest.

References

  1. Kus, E. Evaluation of some operational parameters of a vacuum single-seed planter in maize sowing. J. Agric. Sci. Tarim Bilim. Derg. 2021, 27, 327–334. [Google Scholar]
  2. Yatskul, A.L.; Lemiere, J.P. Establishing the conveying parameters required for the air-seeders. Biosyst. Eng. 2018, 166, 1–12. [Google Scholar] [CrossRef]
  3. Yang, L.; He, X.T.; Tao, C.; Zhang, D.X.; Song, S.; Rui, Z.; Mantao, W. Development of mechatronic driving system for seed meters equipped on conventional precision corn planter. Int. J. Agric. Biol. Eng. 2015, 8, 1–9. [Google Scholar]
  4. Ding, Y.Q.; He, X.T.; Yang, L.; Zhang, D.X.; Cui, T.; Li, Y.H.; Zhong, X.J.; Xie, C.J.; Du, Z.H.; Yu, T.C. Low-cost turn compensation control system for conserving seeds and increasing yields from maize precision planters. Comput. Electron. Agric. 2022, 199, 107118. [Google Scholar] [CrossRef]
  5. Han, D.; Zhang, D.; Jing, H.; Yang, L.; Cui, T.; Ding, Y.; Wang, Z.; Wang, Y.; Zhang, T. DEM-CFD coupling simulation and optimization of an inside-filling air-blowing maize precision seed-metering device. Comput. Electron. Agric. 2018, 150, 426–438. [Google Scholar] [CrossRef]
  6. Pareek, C.M.; Tewari, V.K.; Machavaram, R. Multi-objective optimization of seeding performance of a pneumatic precision seed metering device using integrated ANN-MOPSO approach. Eng. Appl. Artif. Intell. 2023, 117, 105559. [Google Scholar] [CrossRef]
  7. Liu, Q.W.; He, X.T.; Yang, L.; Zhang, D.X.; Cui, T.; Qu, Z.; Yan, B.X.; Wang, M.T.; Zhang, T.L. Effect of travel speed on seed spacing uniformity of corn seed meter. Int. J. Agric. Biol. Eng. 2017, 10, 98–106. [Google Scholar]
  8. Shi, S.; Zhou, J.; Liu, H.; Fang, H.; Jian, S.; Zhang, R. Design and experiment of pneumatic precision seed-metering device with guided assistant seed-filling. Trans. Chin. Soc. Agric. Mach. 2019, 50, 61–70, (In Chinese with English Abstract). [Google Scholar]
  9. Sola. Proesm-K. Available online: https://solagrupo.com/es/pr/sembradoras-monograno/prosem-k-variant-manual-fija-Prosem%20K%20Variant%20manual%20fija-11 (accessed on 21 June 2024).
  10. Maschio. Chrono700. Available online: https://www.maschio.com/en/web/international/chrono-700 (accessed on 21 June 2024).
  11. Kinze. 3505Planter. Available online: https://www.kinze.com/planters/3505-planter/ (accessed on 21 June 2024).
  12. Vaderstad. TempoR. Available online: https://www.vaderstad.com/ca-en/planting/tempo-planter/powershoot/ (accessed on 21 June 2024).
  13. Liu, R.; Liu, L.J.; Li, Y.J.; Liu, Z.J.; Zhao, J.H.; Liu, Y.Q.; Zhang, X.D. Numerical simulation of seed-movement characteristics in new maize delivery device. Agriculture 2022, 12, 1944. [Google Scholar] [CrossRef]
  14. Liu, R.; Liu, L.J.; Li, Y.J.; Liu, Z.J.; Zhao, J.H.; Liu, Y.Q.; Zhang, X.D. Design and experiment of corn high speed air suction seed metering device with disturbance assisted seed-filling. Trans. Chin. Soc. Agric. Mach. 2022, 53, 50–59, (In Chinese with English Abstract). [Google Scholar]
  15. Li, Y.; Yang, L.; Zhang, D.; Cui, T.; Zhang, K.; Xie, C.; Yang, R. Analysis and test of linear seeding process of maize high speed precision metering device with air suction. Trans. Chin. Soc. Agric. Eng. 2020, 36, 26–35, (In Chinese with English Abstract). [Google Scholar]
  16. Zhao, S.; Chen, J.; Wang, J.; Chen, J.; Yang, C.; Yang, Y. Design and Experiment on V-groove dialing round type guiding-seed device. Trans. Chin. Soc. Agric. Mach. 2018, 49, 146–158, (In Chinese with English Abstract). [Google Scholar]
  17. Gao, Z.; Lu, C.Y.; Li, H.W.; He, J.; Wang, Q.J.; Huang, S.H.; Li, Y.X.; Zhan, H.M. Measurement method of collision restitution coefficient between corn seed and soil based on the collision dynamics theory of mass point and fixed surface. Agriculture 2023, 12, 1611. [Google Scholar] [CrossRef]
  18. Li, H.; Li, Y.; Tang, Z.; Xu, L.; Zhao, Z. Numerical simulation and analysis of vibration screening based on EDEM. Trans. Chin. Soc. Agric. Eng. 2011, 27, 117–121, (In Chinese with English Abstract). [Google Scholar]
  19. Li, X.P.; Zhang, W.T.; Xu, S.D.; Ma, F.L.; Du, Z.; Ma, Y.D.; Liu, J. Calibration of collision recovery coefficient of corn seeds based on high-speed photography and sound waveform analysis. Agriculture 2023, 13, 1677. [Google Scholar] [CrossRef]
  20. Wojtkowski, M.; Pecen, J.; Horabik, J.; Molenda, M. Rapeseed impact against a flat surface: Physical testing and DEM simulation with two contact models. Powder Technol. 2010, 198, 61–68. [Google Scholar] [CrossRef]
  21. Li, J.; Su, N.; Hu, J.; Yang, Z.; Sheng, L.; Zhang, X. Numerical analysis and experiment of abrasive flow machining microhole structure based on CFD-DEM coupling. Trans. Chin. Soc. Agric. Eng. 2018, 34, 80–88, (In Chinese with English Abstract). [Google Scholar]
  22. Chen, Y.; Geng, R.; Ma, L. Design and selection of fluid viscous devices for shock control of bridges. China Civ. Eng. J. 2007, 40, 55–61, (In Chinese with English Abstract). [Google Scholar]
  23. Elsinawi, A.H.; Jhemi, A.; Alhamaydeh, M. Adaptive seismic isolation of structures using MR-fluid dampers. In Proceedings of the 2013 5th International Conference on Modeling, Simulation and Applied Optimization, ICMSAO 2013, Hammamet, Tunisia, 28–30 April 2013. [Google Scholar]
  24. Jia, J.; Shen, X.; Du, J.; Wang, Y.; Hua, H. Design and experimental research on fluid viscous dampers. Chin. J. Mech. Eng. 2008, 44, 194–198, (In Chinese with English Abstract). [Google Scholar] [CrossRef]
  25. Park, B.; Lee, Y.; Park, M.; Ju, Y.K. Vibration control of a structure by a tuned liquid column damper with embossments. Eng. Struct. 2018, 168, 290–299. [Google Scholar] [CrossRef]
  26. Zhang, C.-H.; Wang, Y.; Du, J.-Y.; Wen, Z.-D. Effect of power-law fluid damping in a shock isolation system. J. Ship Mech. 2015, 19, 975–981, (In Chinese with English Abstract). [Google Scholar]
  27. Ma, J.; Liu, D.; Chen, X. Experimental study of oblique impact between dry spheres and liquid layers. Phys. Rev. E Stat. Nonlinear Soft Matter Phys. 2013, 88, 033018. [Google Scholar] [CrossRef] [PubMed]
  28. Ma, J.; Liu, D.; Chen, Z.; Chen, X. Agglomeration characteristics during fluidized bed combustion of salty wastewater. Powder Technol. 2014, 253, 537–547. [Google Scholar] [CrossRef]
  29. Lee, K.Y.; Mooney, D.J. Alginate: Properties and biomedical applications. Prog. Polym. Sci. 2012, 37, 106–126. [Google Scholar] [CrossRef]
  30. Zhu, J.; Marchant, R.E. Design properties of hydrogel tissue-engineering scaffolds. Expert Rev. Med. Devices 2011, 8, 607–626. [Google Scholar] [CrossRef]
  31. Li, W.C.; Qiao, K.; Zheng, Y.D.; Yan, Y.; Xie, Y.J.; Liu, Y.; Ren, H.M. Preparation, mechanical properties, fatigue and tribological behavior of duble crosslinked high strength hydrogel. J. Mech. Behav. Biomed. Mater. 2022, 126, 105009. [Google Scholar] [CrossRef] [PubMed]
  32. Ling, L.; Wu, G.W.; Wen, C.K.; Xiao, Y.J.; Fu, W.Q.; Dong, J.J.; Ding, J.H.; Meng, Z.J.; Yan, B.X. Influence of speed measurement method on performance of an electric-drive maize precision planter. Biosyst. Engineering. 2024, 238, 175–187. [Google Scholar] [CrossRef]
  33. Wittmer, J.P.; Xu, H.; Benzerara, O.; Baschnagel, J. Fluctuation-dissipation relation between shear stress relaxation modulus and shear stress autocorrelation function revisited. Mol. Phys. 2015, 113, 2881–2893. [Google Scholar] [CrossRef]
  34. Li, Y.; Yang, L.; Zhang, D.; Cui, T.; He, X.; Du, Z.; Wang, D. Performance analysis and structure optimization of the maize precision metering device with air suction at high-speed condition. Trans. Chin. Soc. Agric. Eng. 2022, 38, 1–11. [Google Scholar]
Figure 1. Seed transport system of high-speed vacuum seeder. (1) Case; (2) Upper seed clearing knife; (3) Lower clearing knife; (4) Seed disk; (5) Forced clearing knife; (6) Energy-dissipation device; (7) Positive-pressure airflow-assisted blowing seed-guiding device.
Agriculture 14 01237 g001
Figure 2. Schematic diagram of motion analysis of seeds after leaving seed disk.
Agriculture 14 01237 g002
Figure 3. Maize seeds of different shapes. (a) Horse-tooth shape; (b) Spheroid shape; (c) Ellipsoid shape.
Agriculture 14 01237 g003
Figure 4. Impact test bench. (1) L-PRI 1000 high-speed camera; (2) Acrylic plate bracket; (3) Energy dissipator; (4) Protractor; (5) Fill light; (6) Adjusting bracket; (7) Computer.
Agriculture 14 01237 g004
Figure 5. Field experiments.
Agriculture 14 01237 g005
Figure 6. Rheological curves of fluid under different mass fractions.
Agriculture 14 01237 g006
Figure 7. Viscoelasticity of fluid under different mass fractions. (a) 5% SA; (b) 10% SA; (c) 15% SA; (d) 20% SA.
Agriculture 14 01237 g007
Figure 8. Different postures of seeds impacting the energy dissipator. (a) Broad-side impact; (b) Tip impact; (c) Side impact (d) Bottom impact.
Agriculture 14 01237 g008
Figure 9. Motion analysis of broad-side impact. (a) Time-velocity curve; (b) Time-transverse position curve.
Agriculture 14 01237 g009
Figure 10. Motion analysis of tip impact. (a) Time-velocity curve; (b) Time-transverse position.
Agriculture 14 01237 g010
Figure 11. Motion analysis of side impact. (a) Time-velocity curve; (b) Time-transverse position curve.
Agriculture 14 01237 g011
Figure 12. Motion analysis of bottom impact. (a) Time-velocity curve; (b) Time-transverse position curve.
Agriculture 14 01237 g012
Figure 13. Influence of different mass fractions of fluid dispersed phase on the pre- and post-impact velocity difference. (a) 10% SA; (b) 15% SA.
Agriculture 14 01237 g013
Figure 14. Influence of different mass fractions of fluid dispersed phase on the transverse displacement. (a) 10% SA; (b) 15% SA.
Agriculture 14 01237 g014
Figure 15. Influence effect of two-factor interaction on evaluation index. (a) Influence effect of impact velocity and thickness on pre- and post-impact velocity difference; (b) Influence effect of impact angle and thickness on pre- and post-impact velocity difference; (c) Influence effect of impact velocity and thickness on end-of-motion transverse displacement; (d) Influence effect of impact angle and thickness on end-of-motion transverse displacement.
Agriculture 14 01237 g015
Figure 16. Comparative test results. (a) Leakage rate at different velocities; (b) Multiple rates at different velocity; (c) Qualified rate at different velocities; (d) Qualified grain distance variation rate at different velocities.
Agriculture 14 01237 g016
Table 1. Factor level of single-factor experiment.
LevelFactors
Mass Fraction of Dispersed Phase in Fluid/%Impact Velocity/m·s−1Impact Angle/°
11010
215215
3 330
Table 2. Factor level of quadratic regression orthogonal experiment.
LevelFactors
Thickness of Energy Dissipator E/mmImpact Velocity F/m·s−1Impact Angle W
−1410
06215
18330
Table 3. Design and results of the orthogonal experiment.
NumberThickness of Energy Dissipator E/(mm)Impact Velocity F/(m·s−1)Impact Angle W/(degree)Pre- and Post-Impact Velocity Difference y1/(m·s−1)Value of Transverse Displacement at the End of the Movement y2/(mm)
1−10−11.44167
2−1011.62178
31102.45145
41011.73185
5−1102.18141
601−12.33142
70001.78169
80001.86172
90−1−10.68180
10−1−100.65179
110001.81166
120112.47156
131−100.74184
140001.82175
150001.74171
160−110.91191
1710−11.59171
Table 4. Variance analysis of regression equations.
Source of Variationy1/(m·s−1)y1/(mm)
SSDFFPSSDFFP
Model5.549.00441.51<0.0001 **3453.249.0057.70<0.0001 **
E0.051.0034.480.0006 **50.001.007.340.03 *
F5.201.003731.64<0.0001 **2812.501.00412.74<0.0001 **
W0.061.0042.710.0003 **312.501.0045.860.0003 **
EF8.1 × 10−31.005.810.00467 **0.251.000.030.8535
EW4.0 × 10−41.000.290.6082.251.000.330.5835
FW2.0 × 10−31.001.450.2672.251.000.330.5835
E20.091.0067.75<0.0001 **0.131.000.330.8945
F20.091.0065.51<0.0001 **281.391.000.020.0004 **
W20.011.009.90.0162 *98.021.0041.290.0068 **
Lack of fit1.67 × 10−33.000.280.842.503.0014.390.971
Pure error8.1 × 10−34.00441.51<0.0001
Total5.5516.00
Note: * indicates significance at 0.05 level; ** denotes significance at 0.01 level.
Table 5. Parameter optimization and experimental validation results.
Impact Velocity/(m·s−1)Impact Angle/(°)Thickness/(mm)y1/(m·s−1)y2/(mm)
Predicted ValueMeasured ValuePredicted ValueMeasured ValuePredicted ValueMeasured Value
106.37.00.680.71180.8173.0
206.67.01.461.48169.7164.0
306.97.02.362.41142.1137.0
Disclaimer/Publisher’s Note: The statements, opinions and data contained in all publications are solely those of the individual author(s) and contributor(s) and not of MDPI and/or the editor(s). MDPI and/or the editor(s) disclaim responsibility for any injury to people or property resulting from any ideas, methods, instructions or products referred to in the content.

