
Screening New Mungbean Varieties for Terminal Drought Tolerance


Abstract
:1. Introduction
2. Materials and Methods
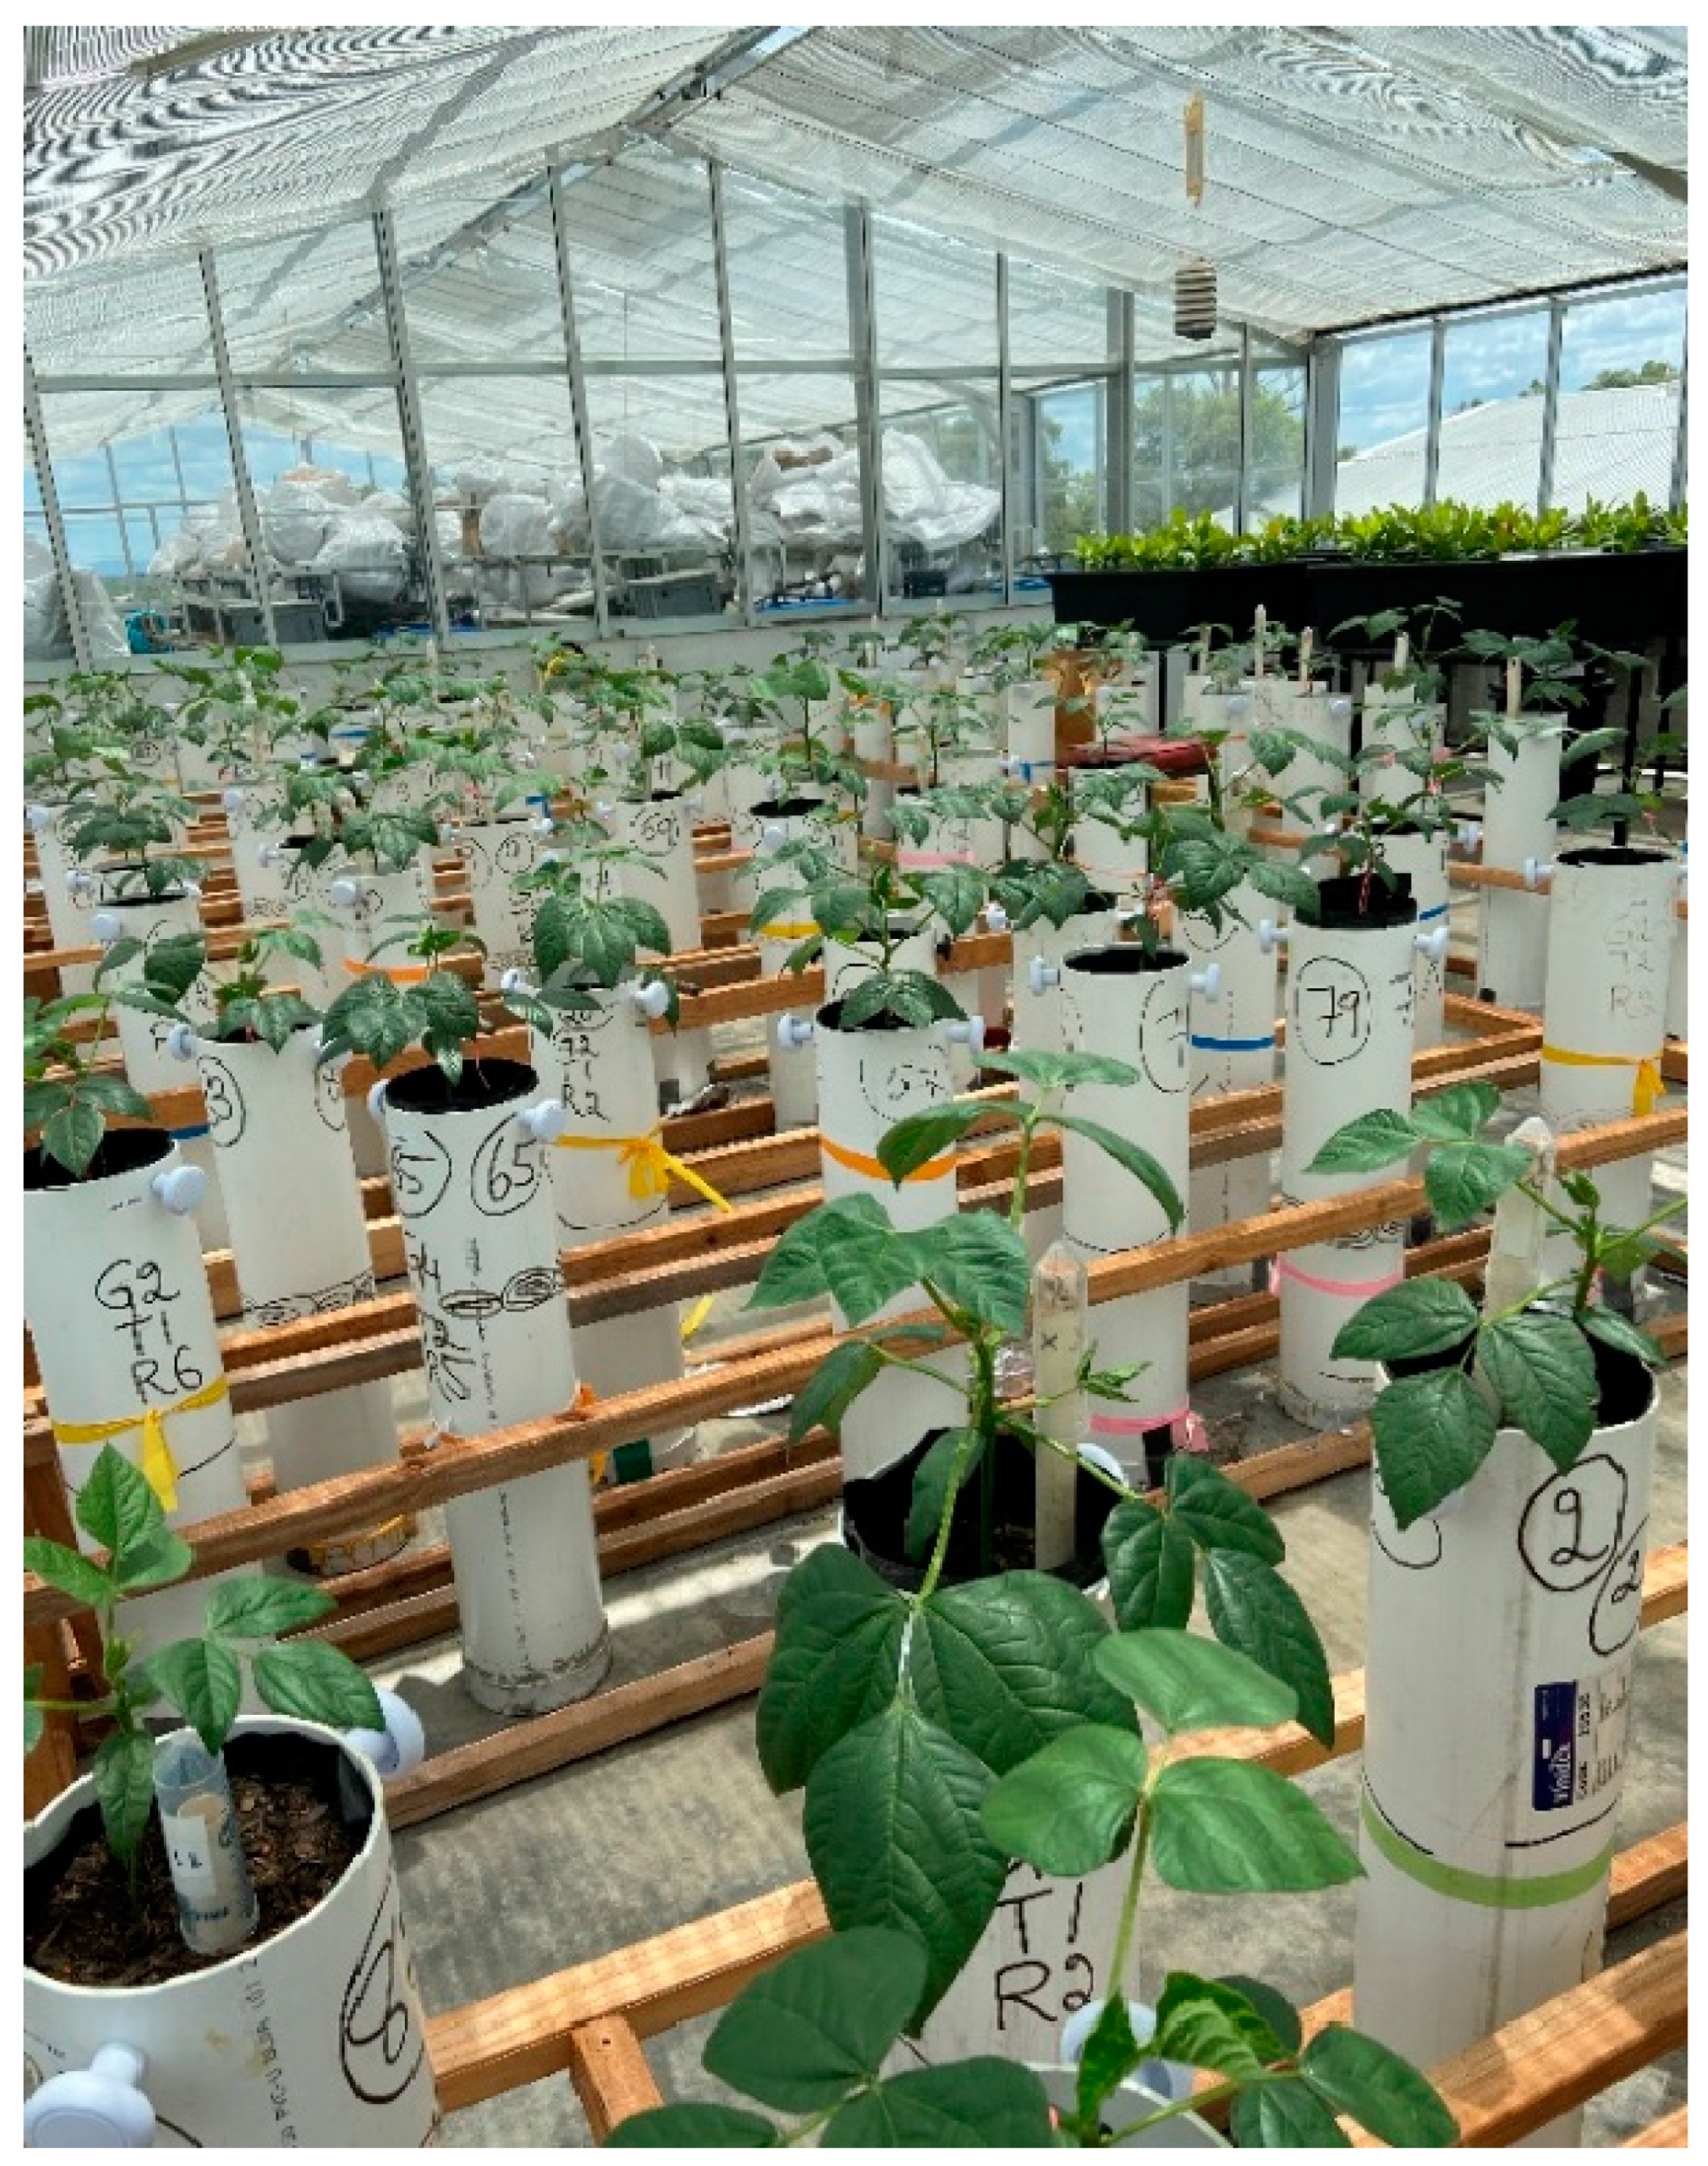
2.1. Plant Material and Growth Conditions
2.2. Experimental Design and Treatments
3. Data Collection
3.1. Plant Water Use and Plant Characters
3.2. Gas Exchange and Chlorophyll a Fluorescence
3.3. Relative Chlorophyll Measurement
3.4. Dry Matter, Yield Attributes and Water-Use Efficiency
4. Data Analysis
5. Results
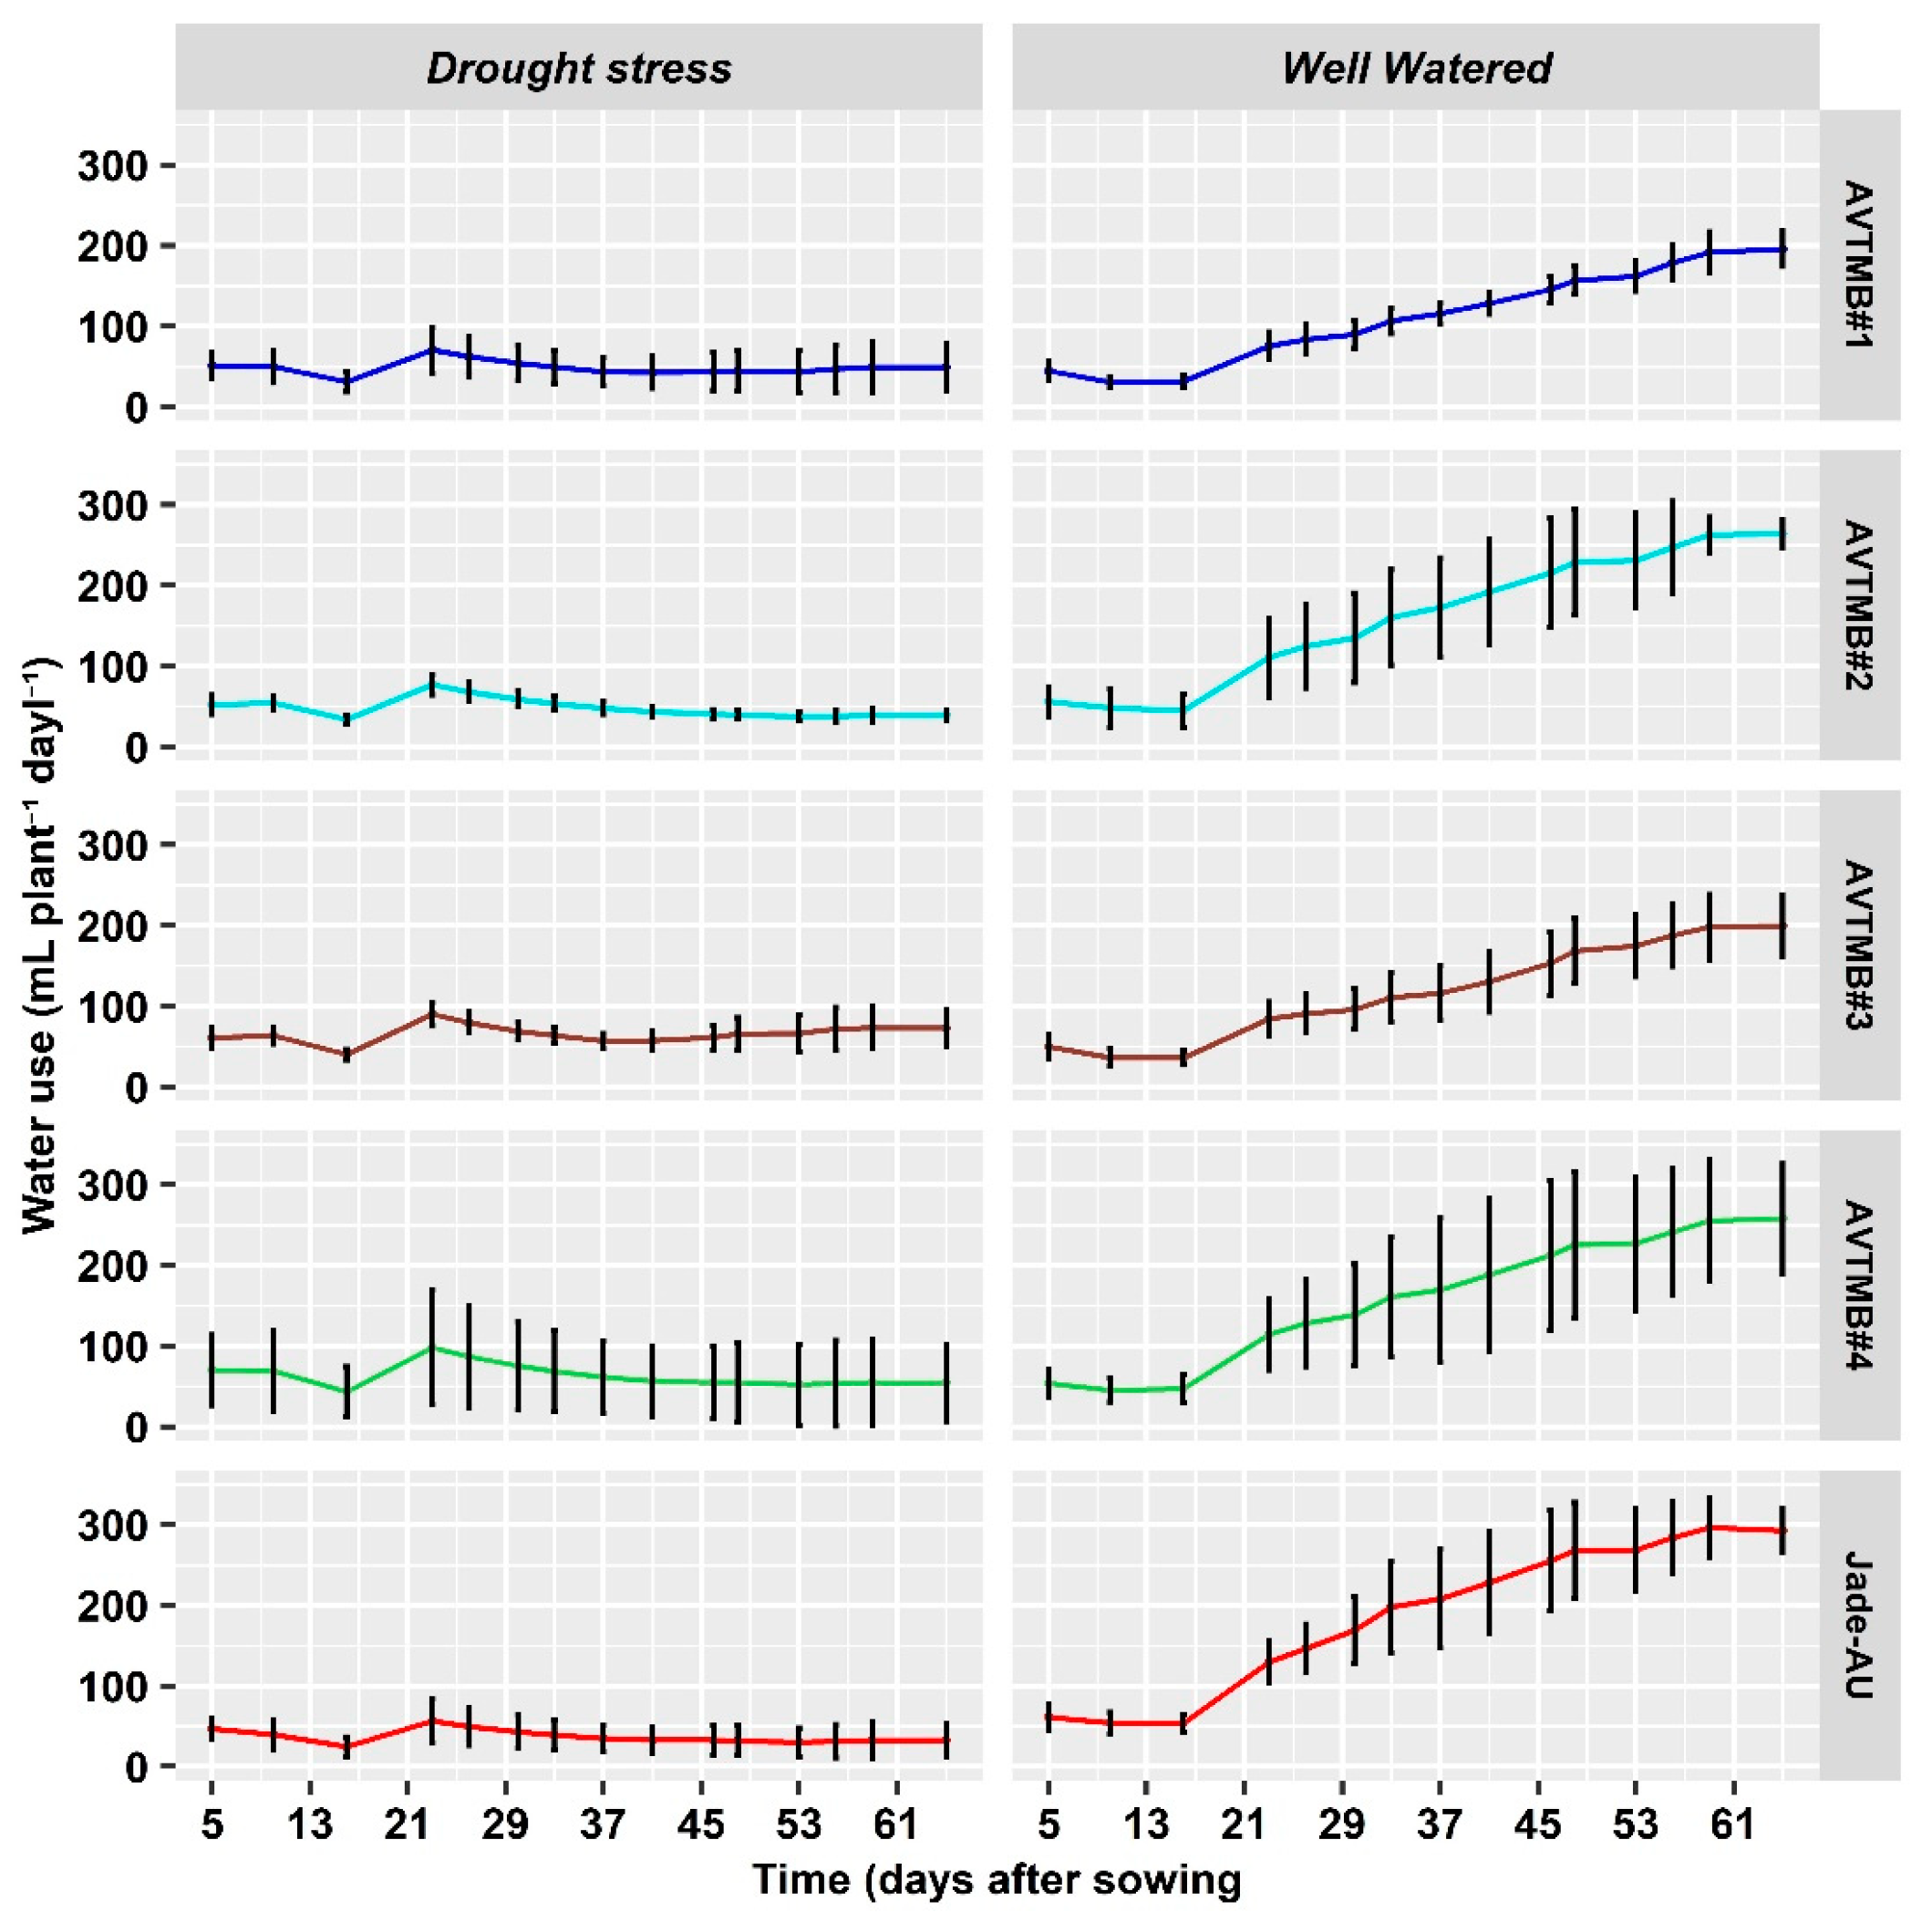
5.1. Water Applied
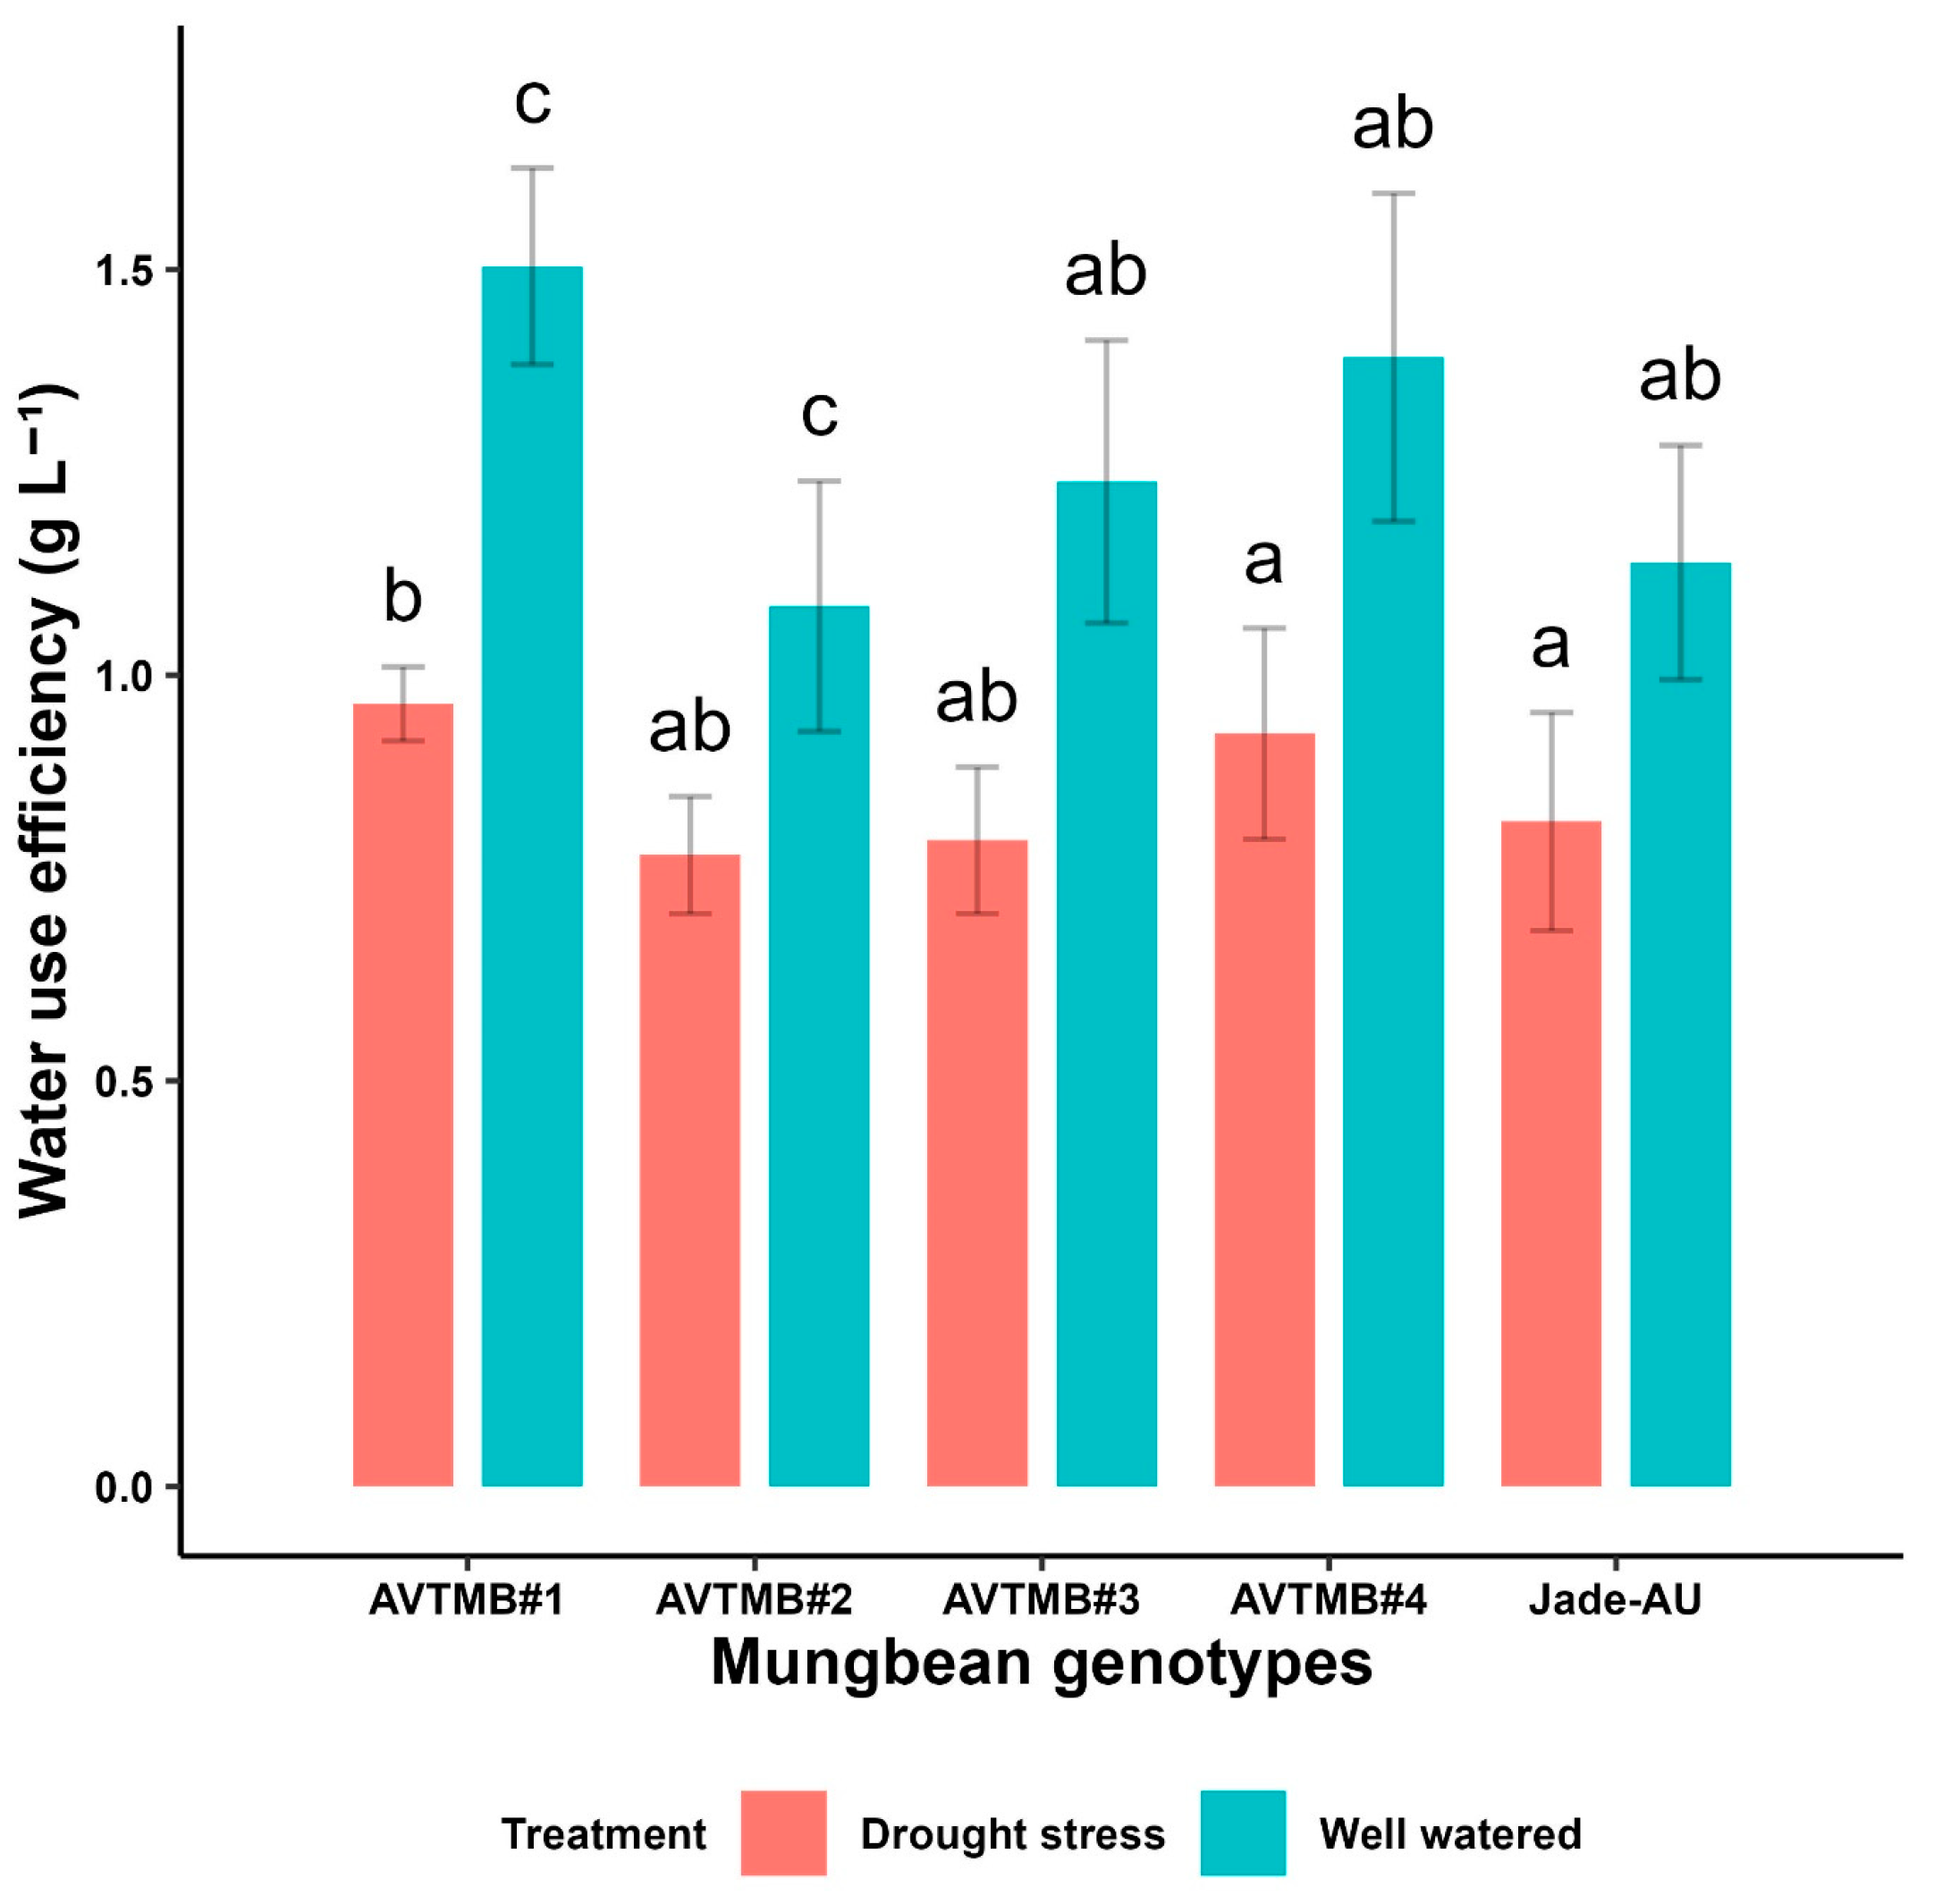
5.2. Water-Use Efficiency
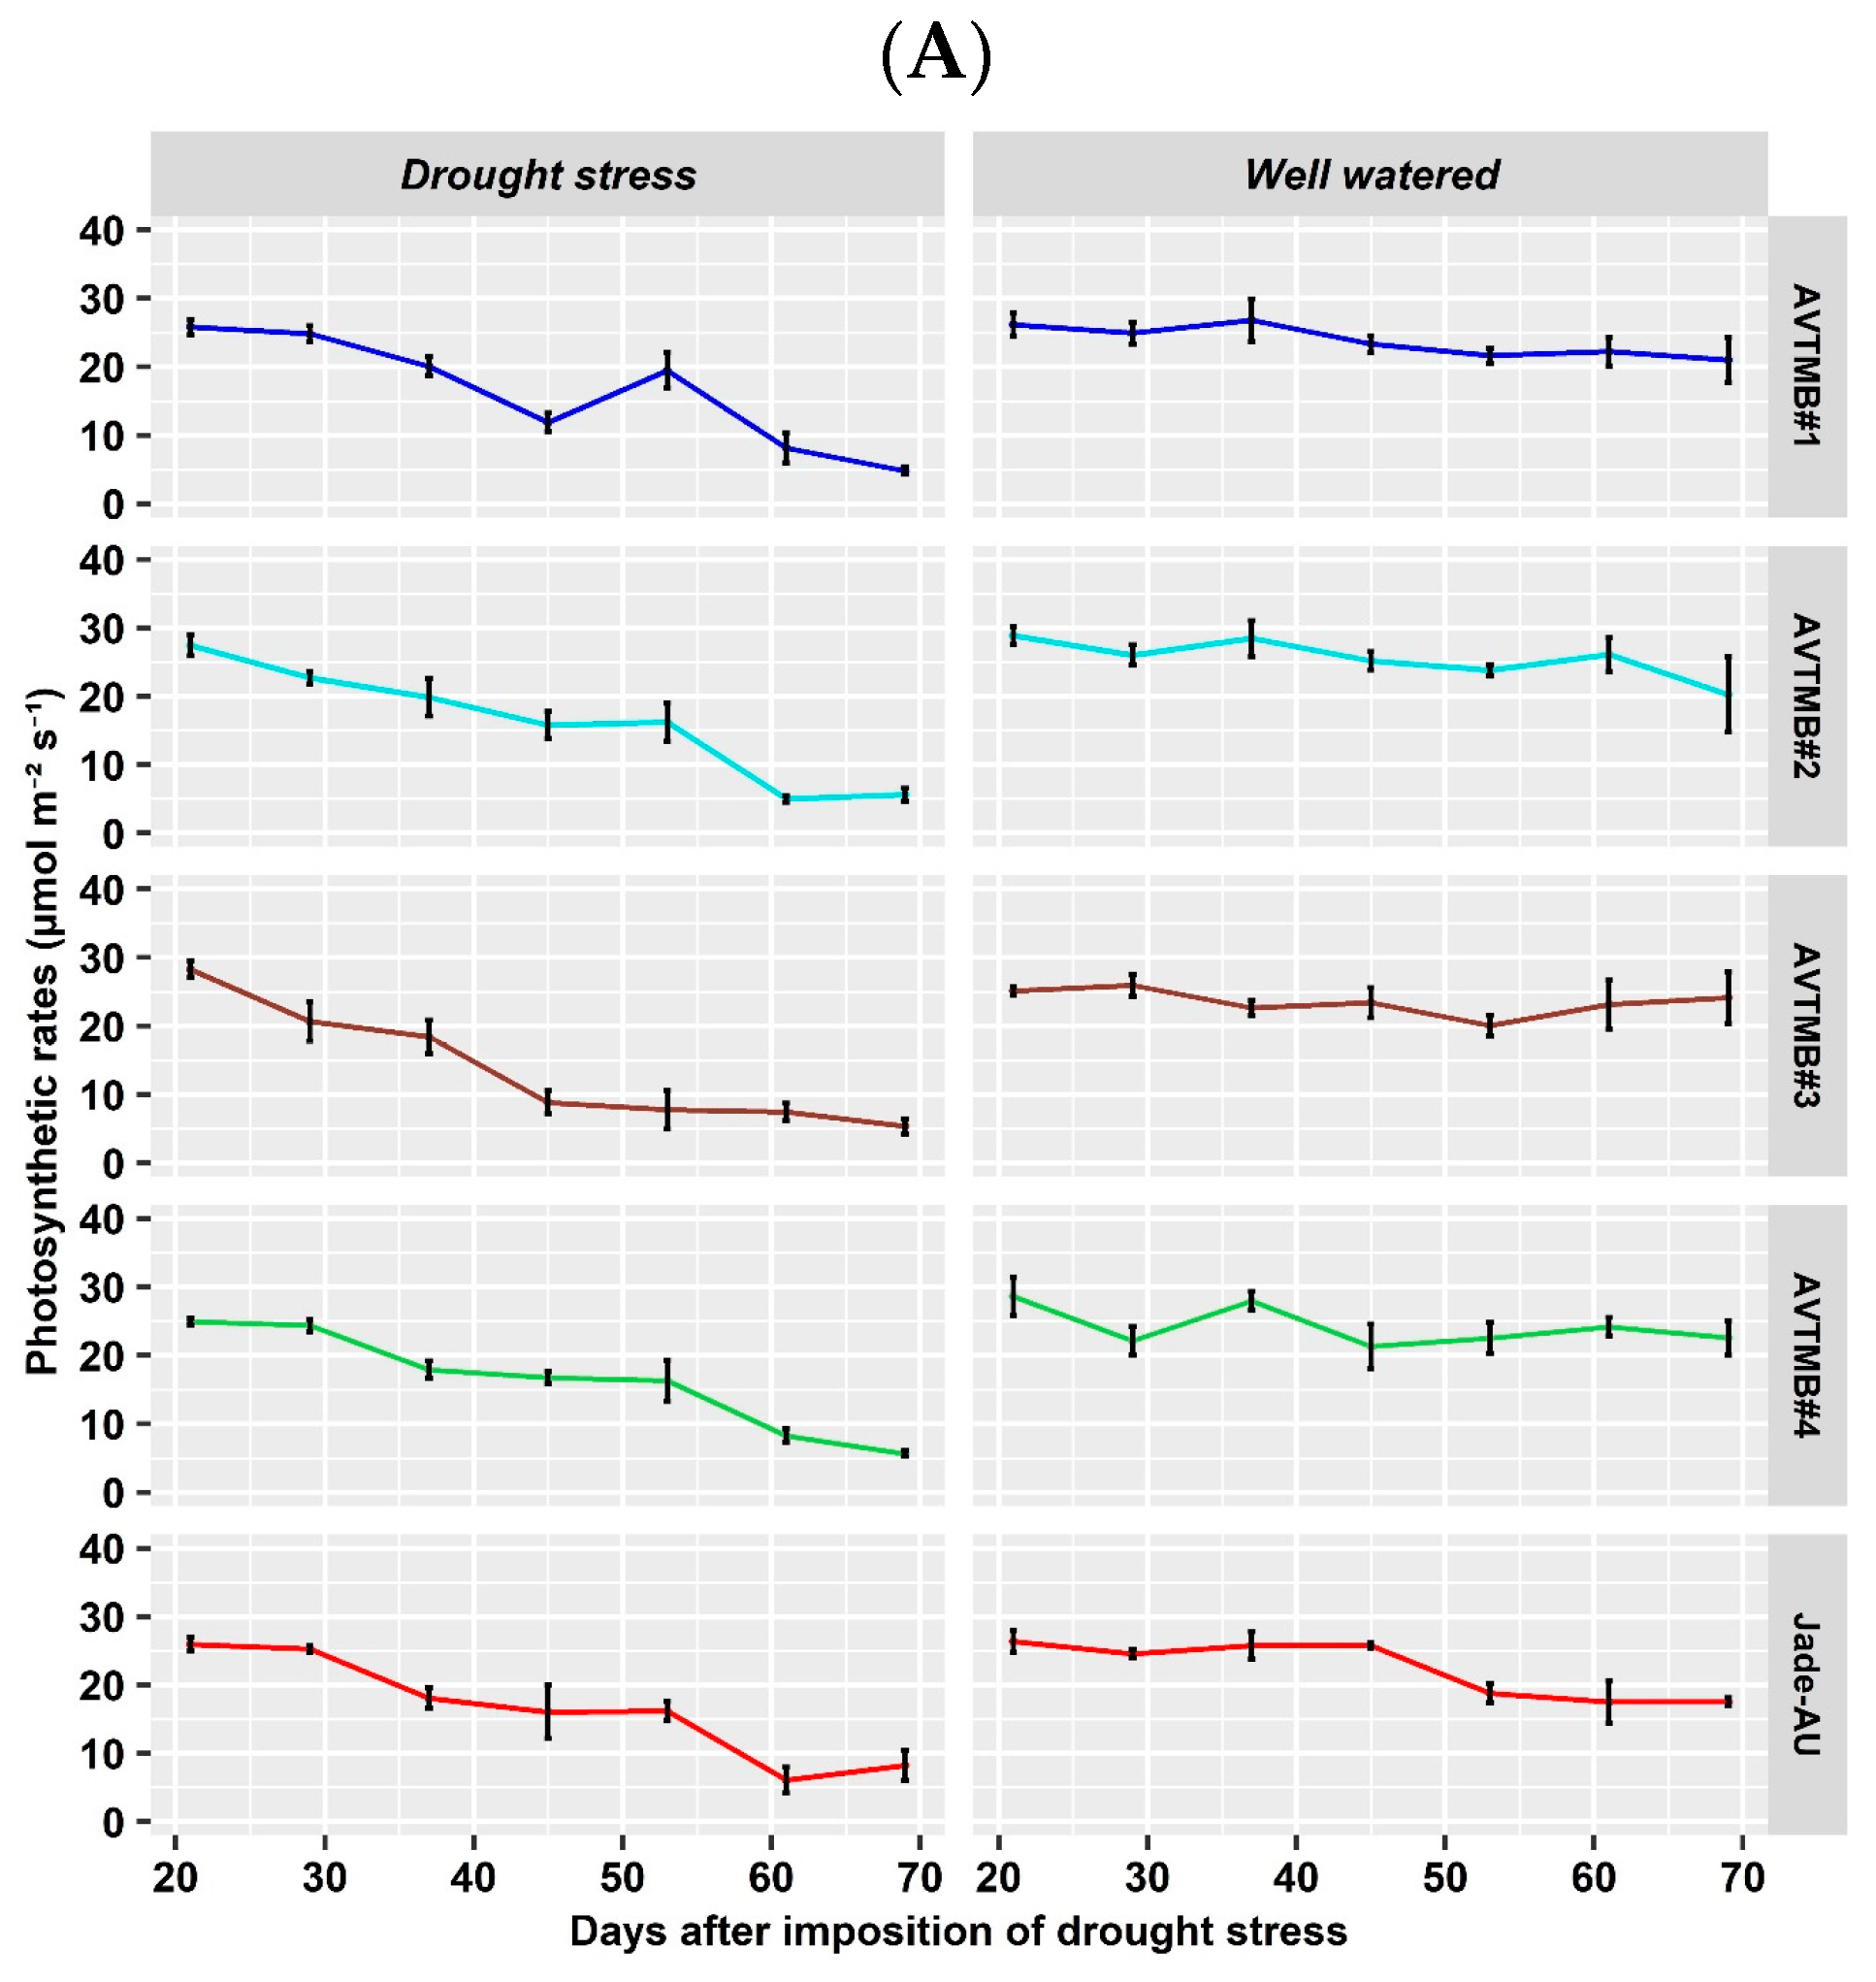
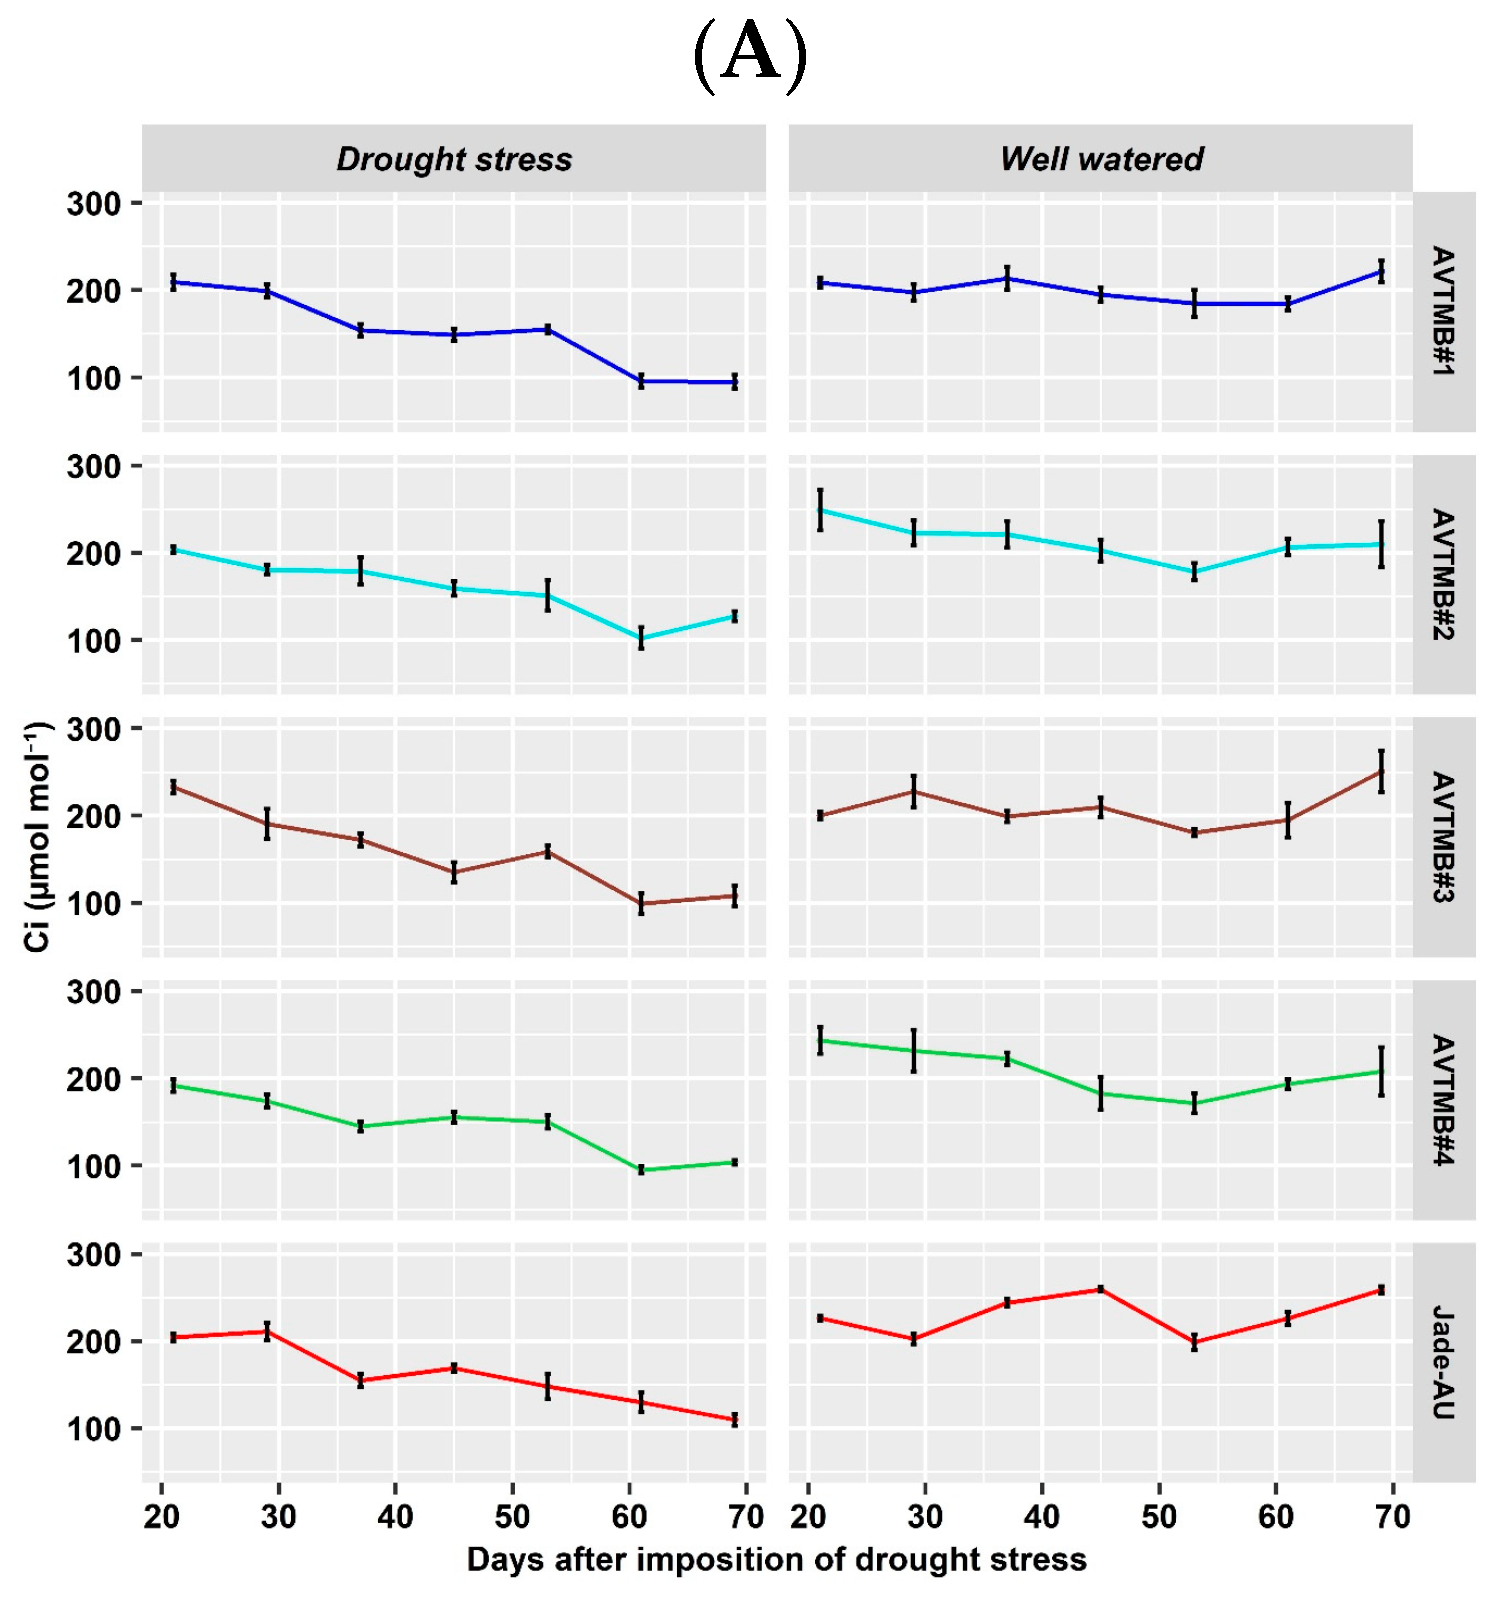
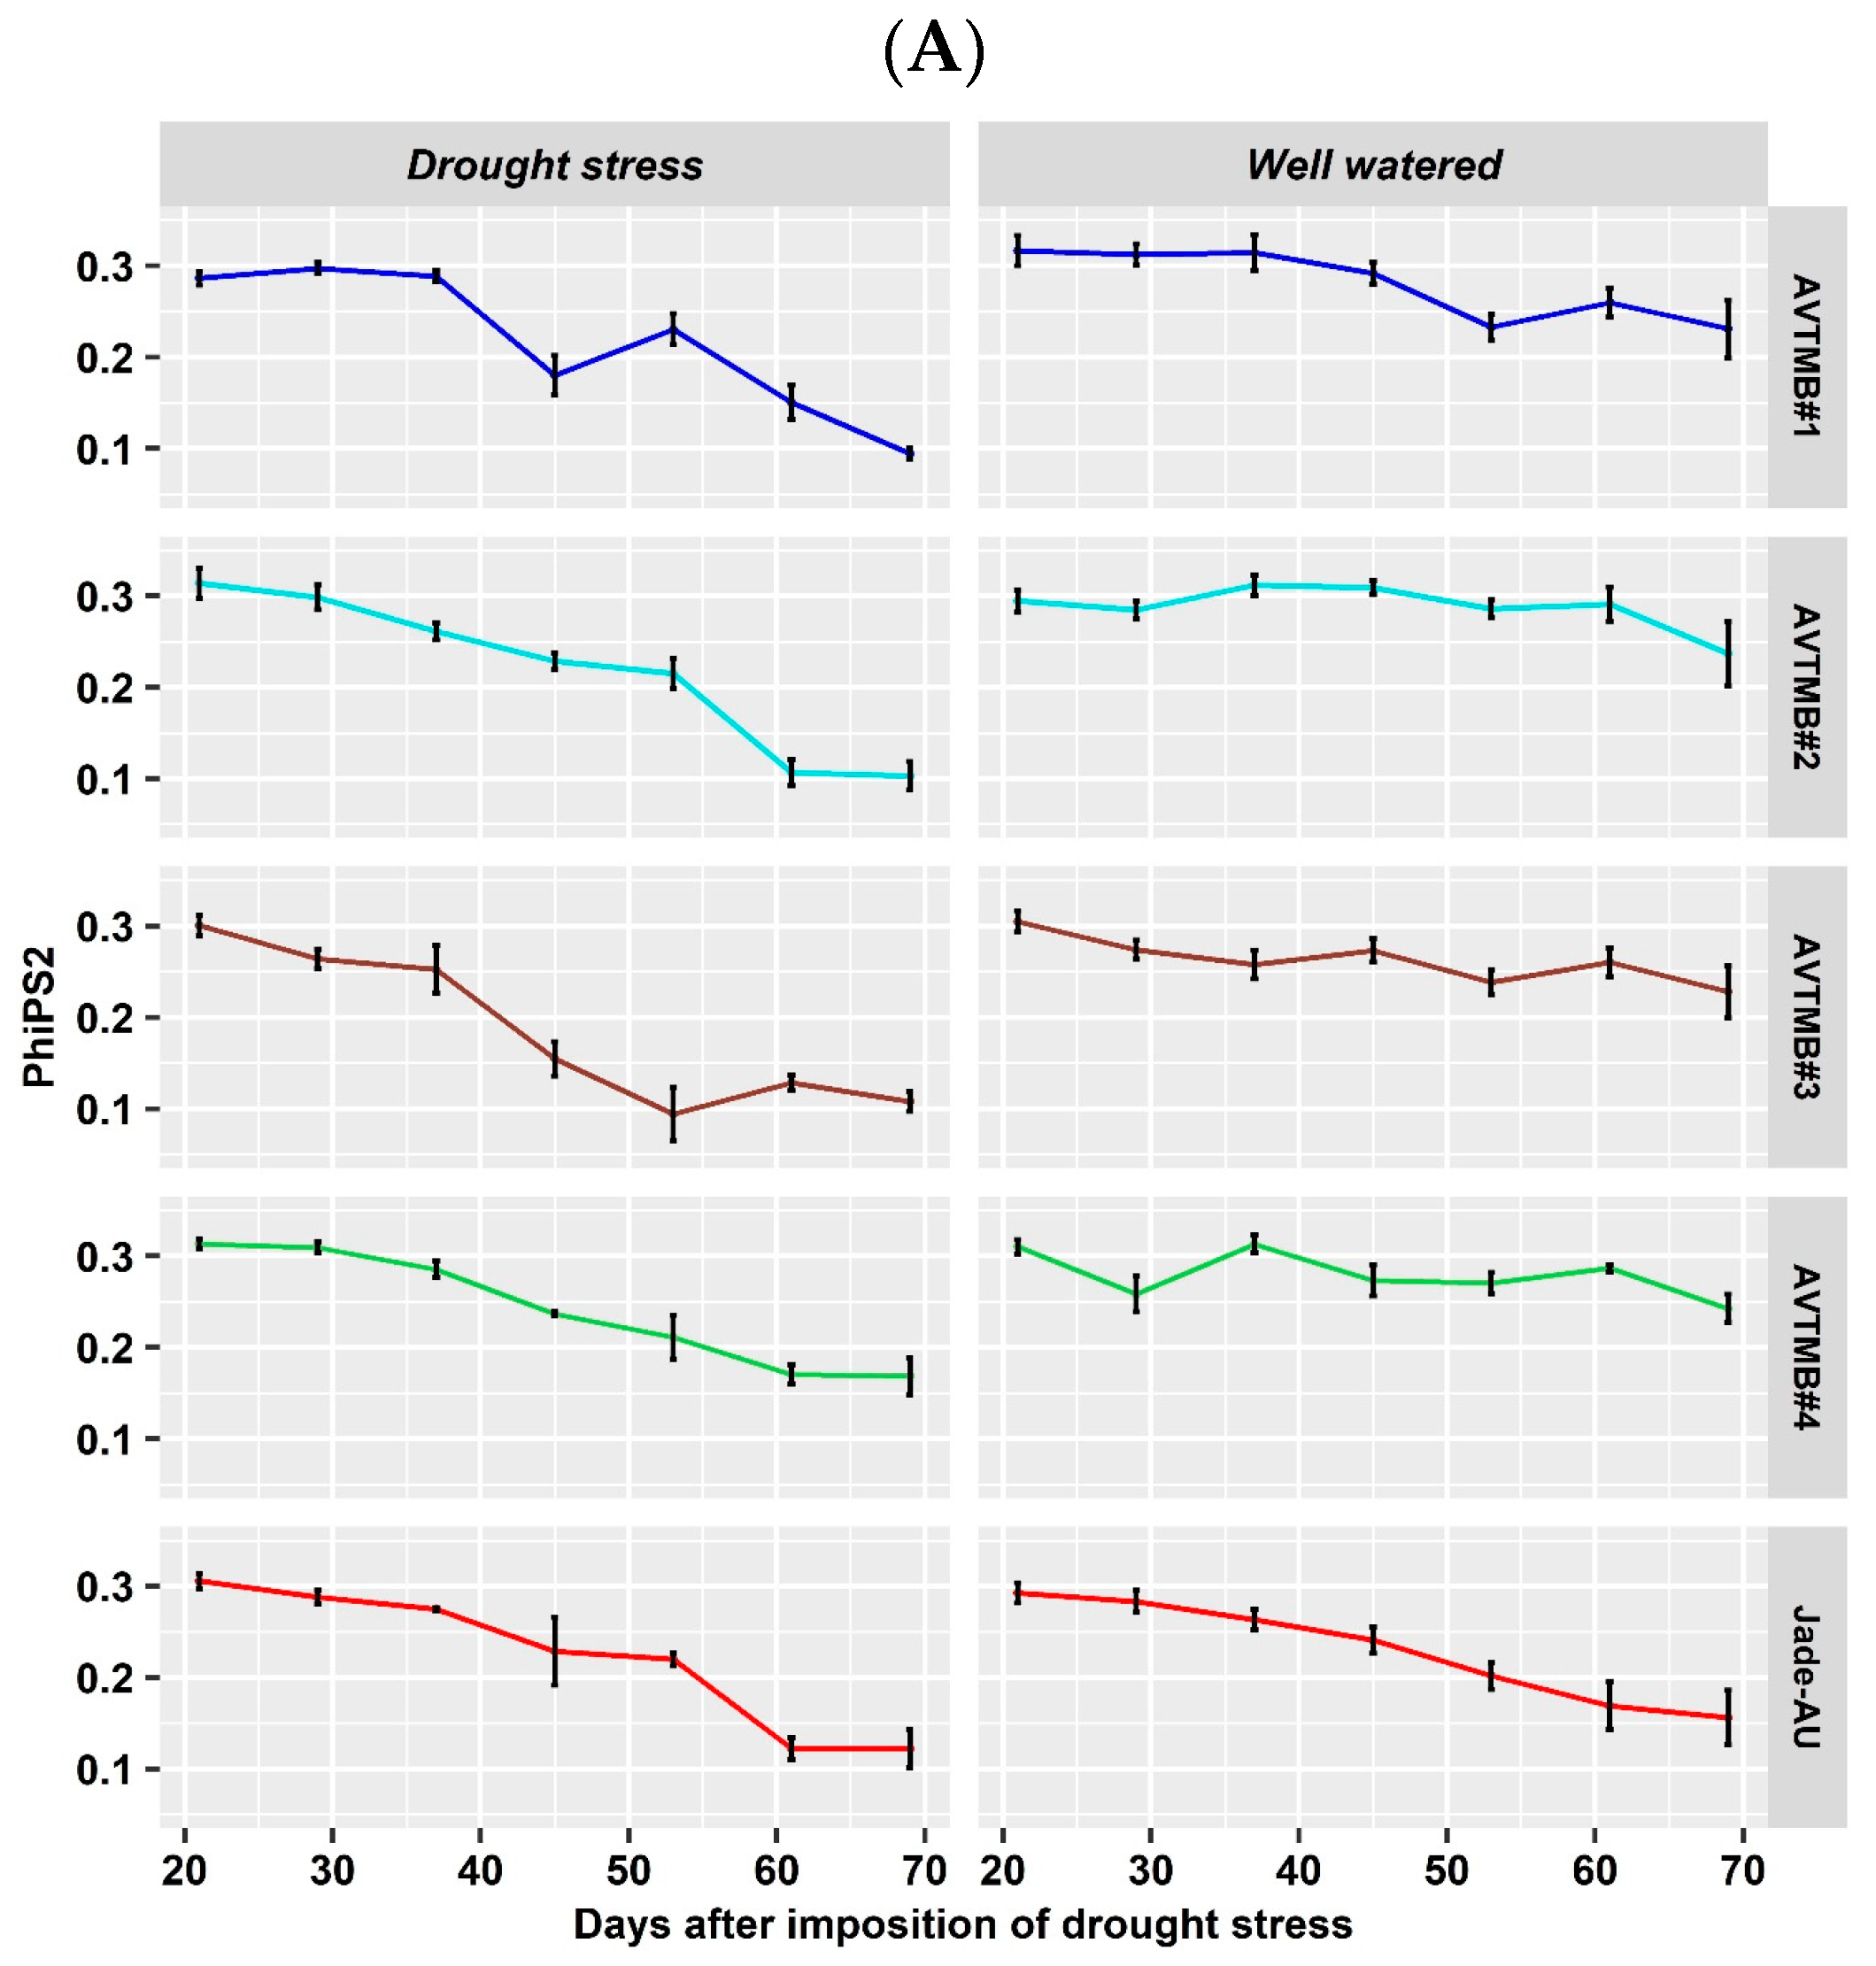
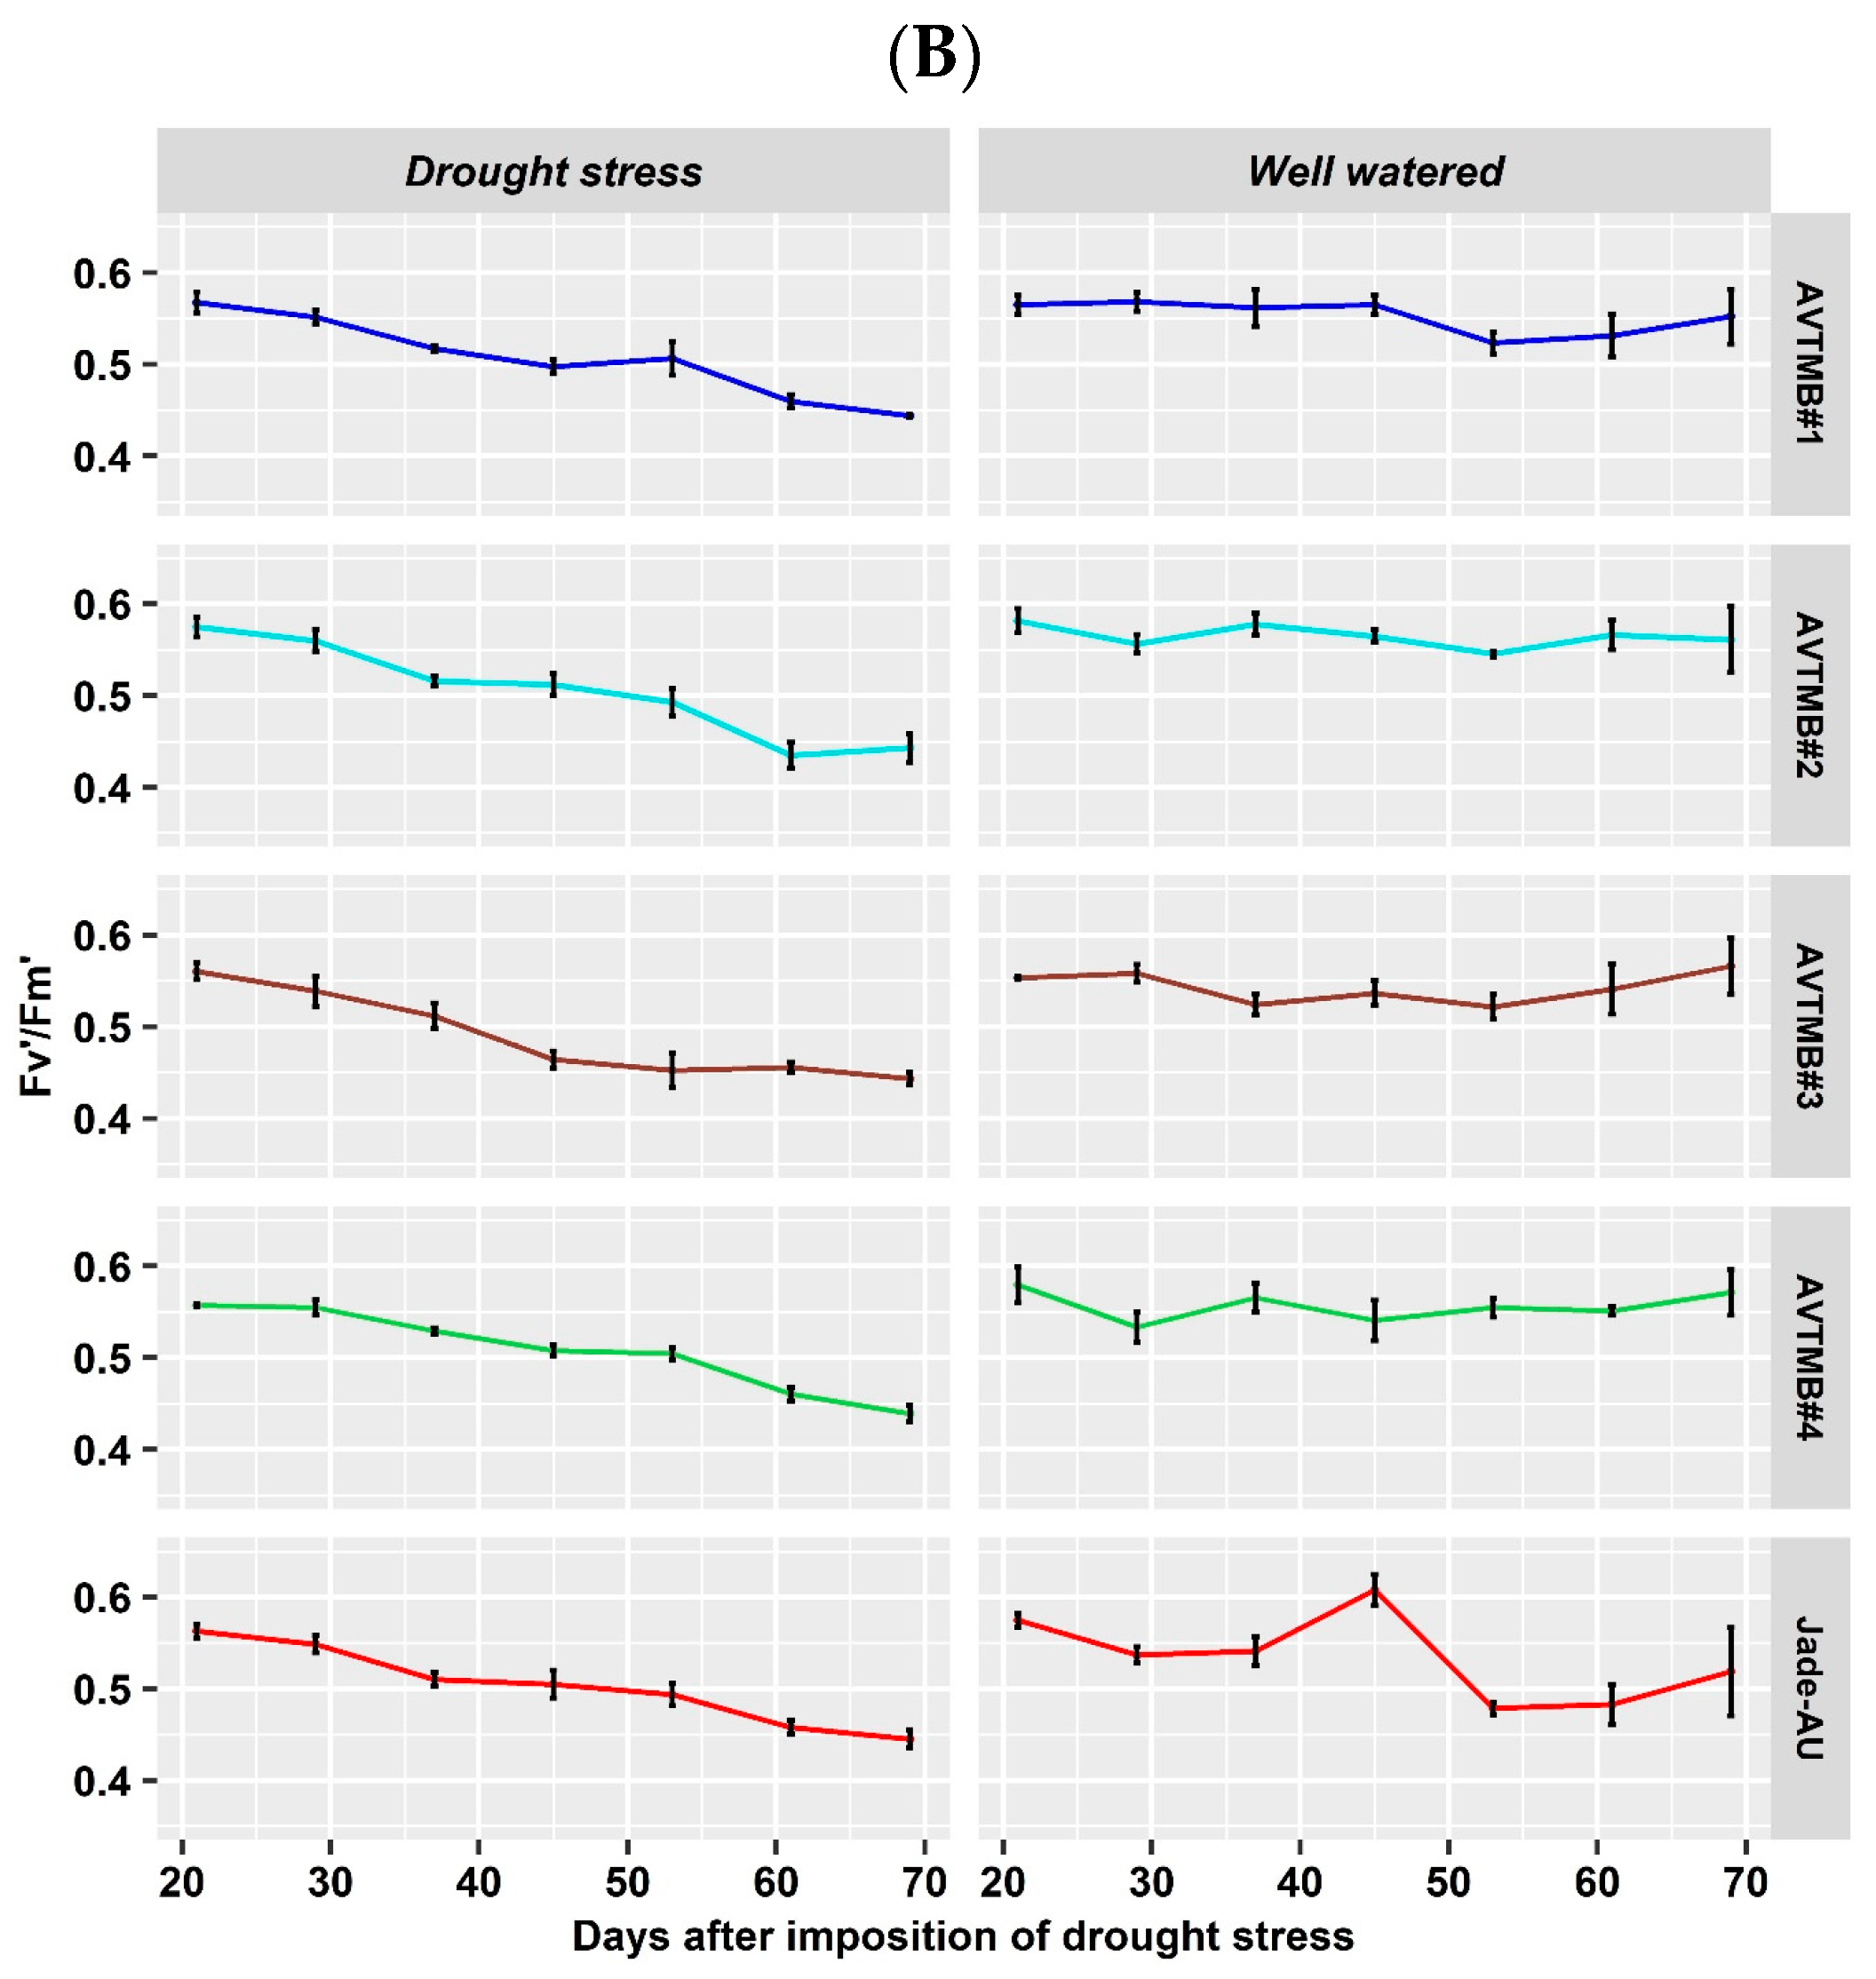
5.3. Leaf Gas Exchange and Chlorophyll a Fluorescence Parameter
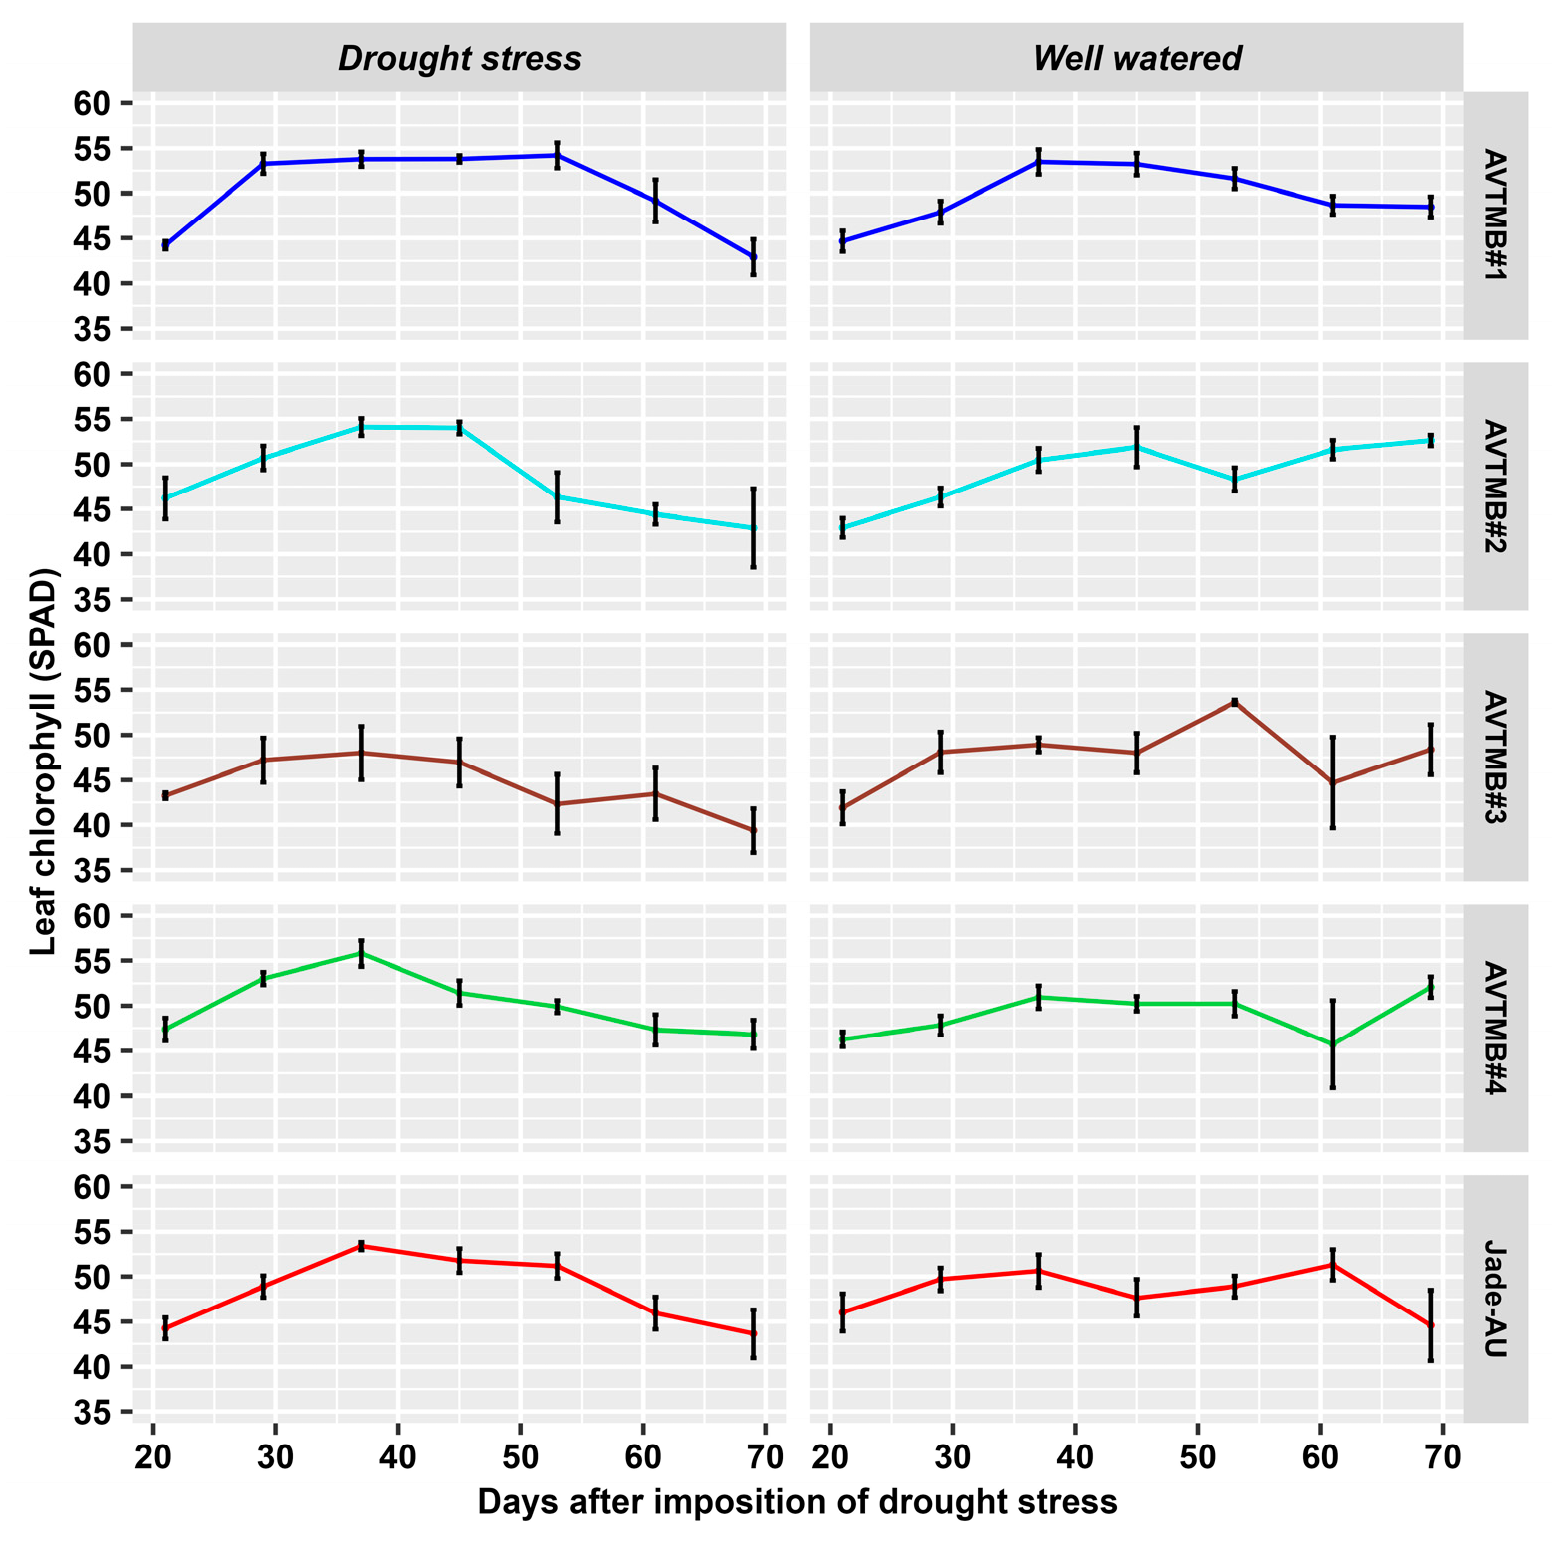
5.4. Leaf Chlorophyll Content
5.5. Dry Matter Production
5.6. Yield Attributes and Yield
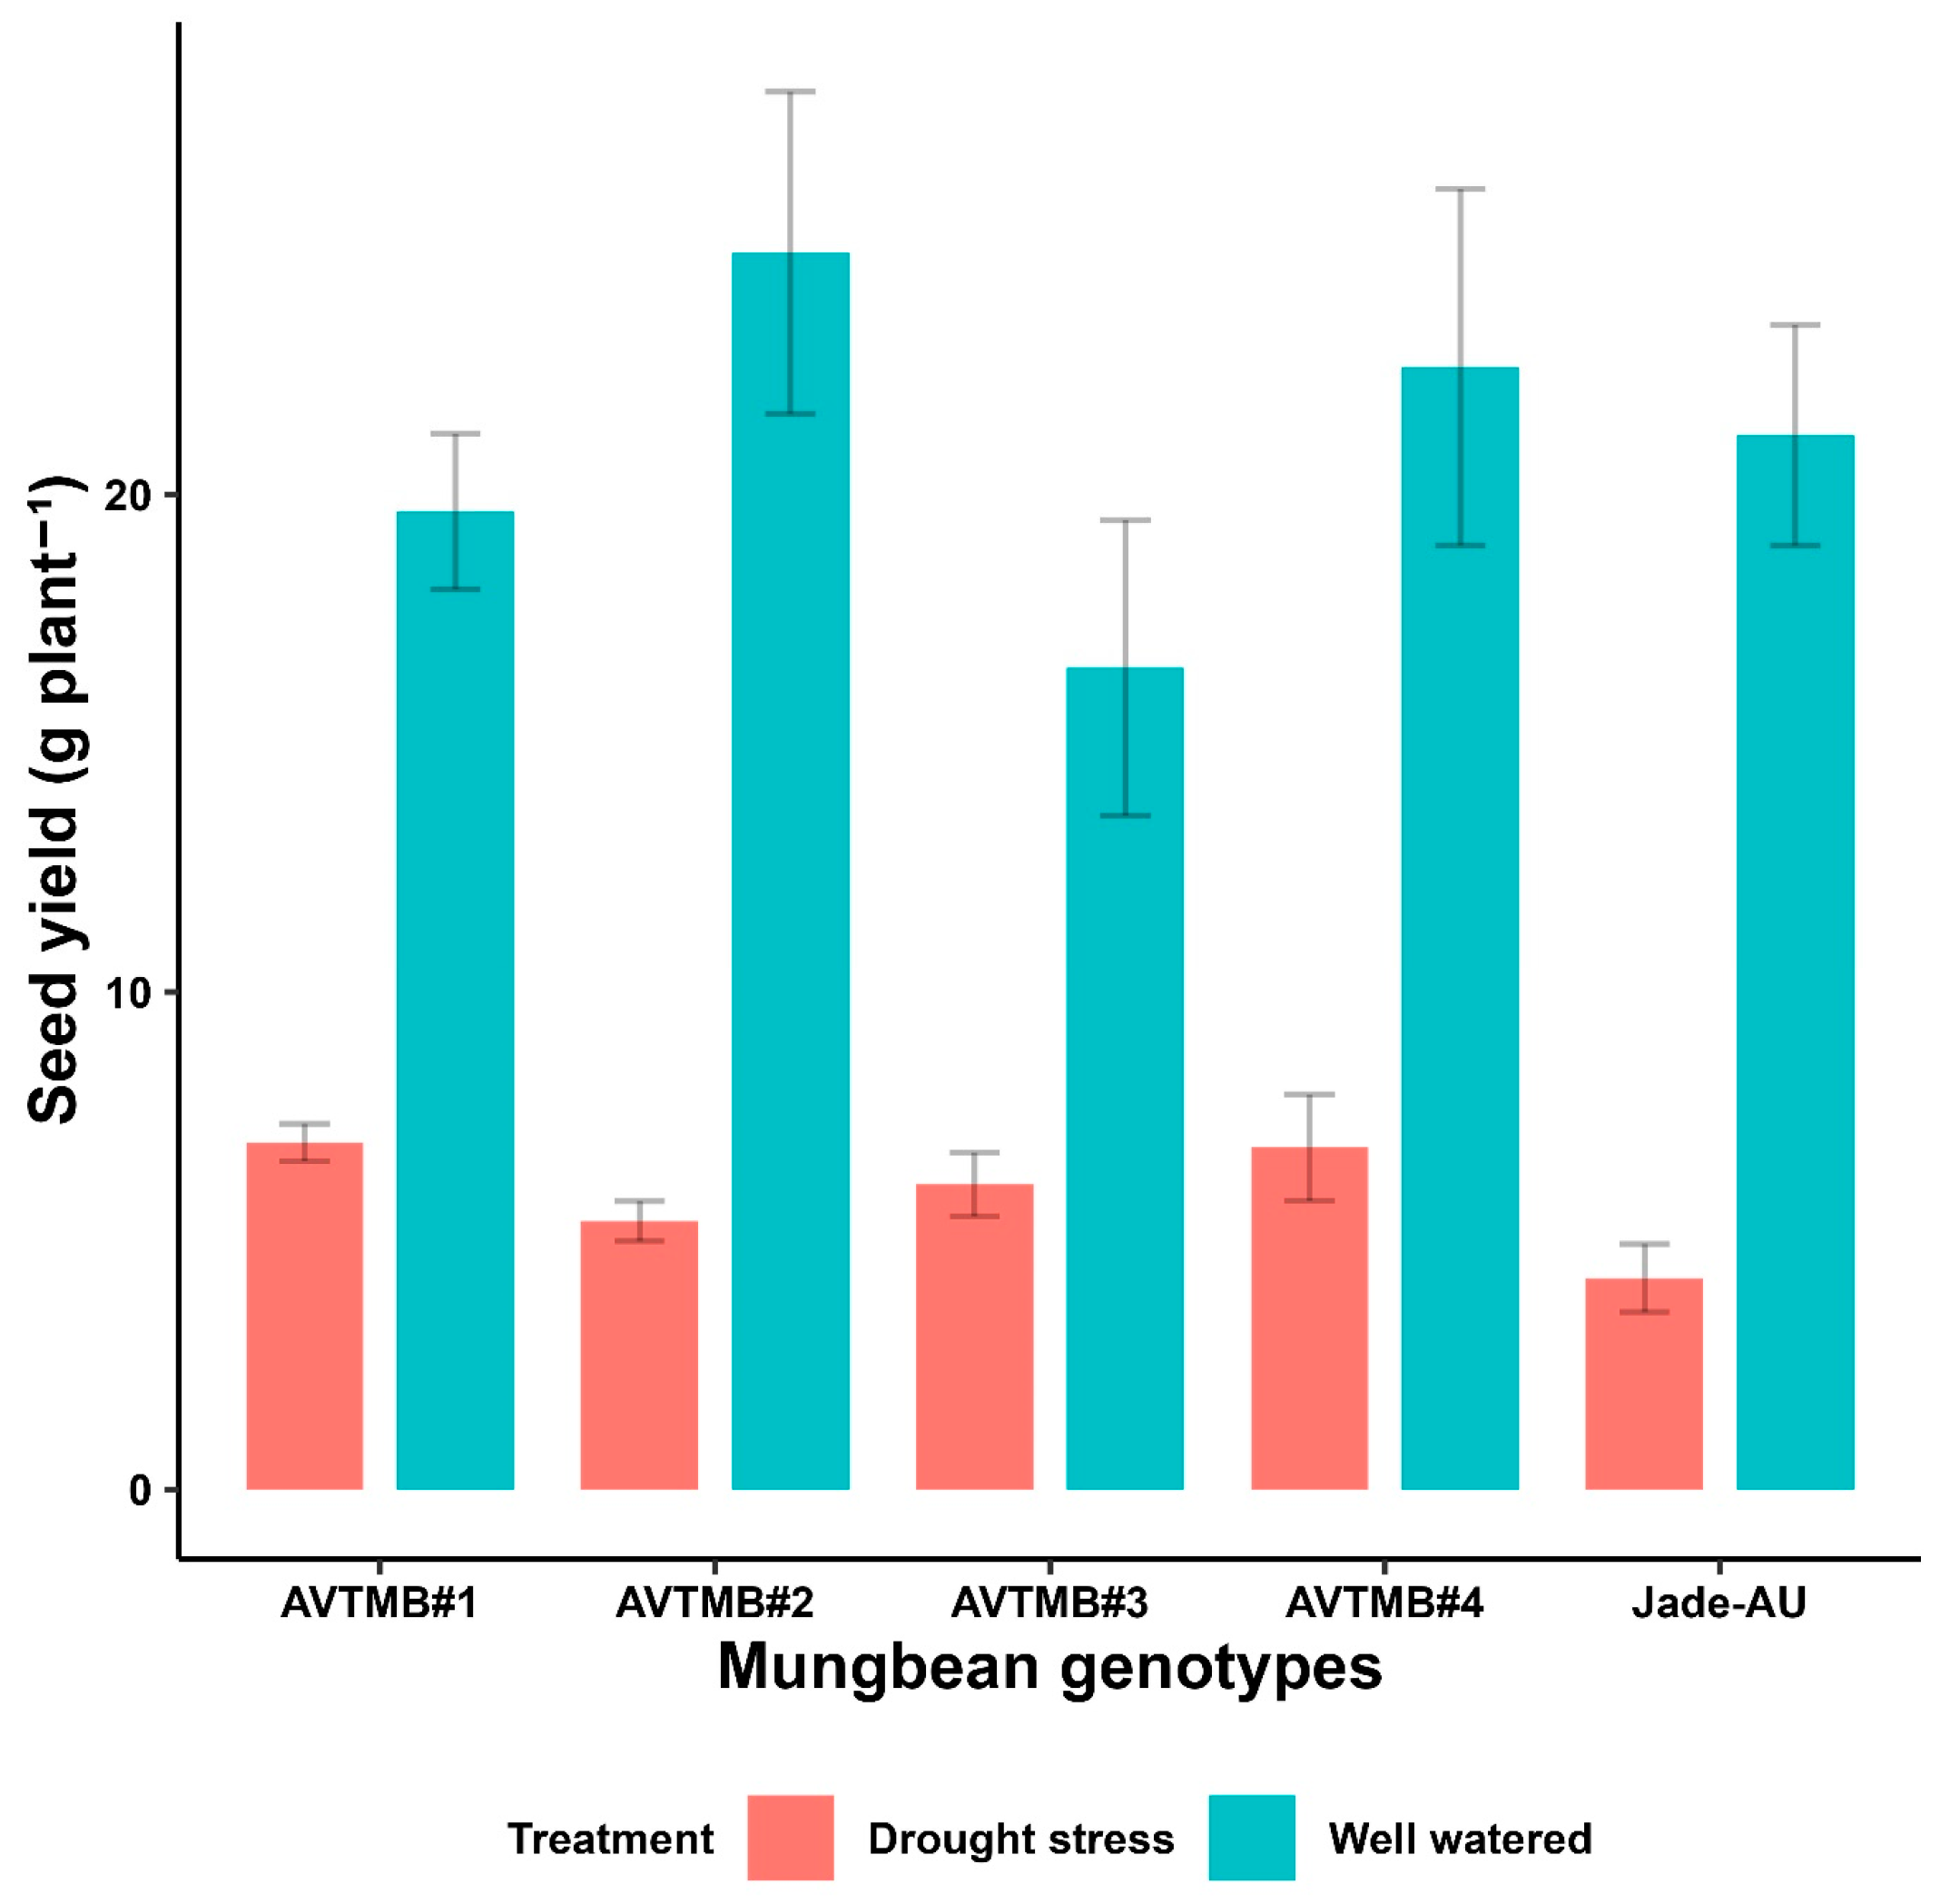
5.7. Seed Yield
6. Discussion
6.1. Water Potential
6.2. Crop Phenology
6.3. Effects of Drought Stress on Gas Exchange
6.4. Effects of Drought Stress on Chlorophyll a Fluorescence
6.5. Effect of Drought on Growth, Yield and Morphological Parameters
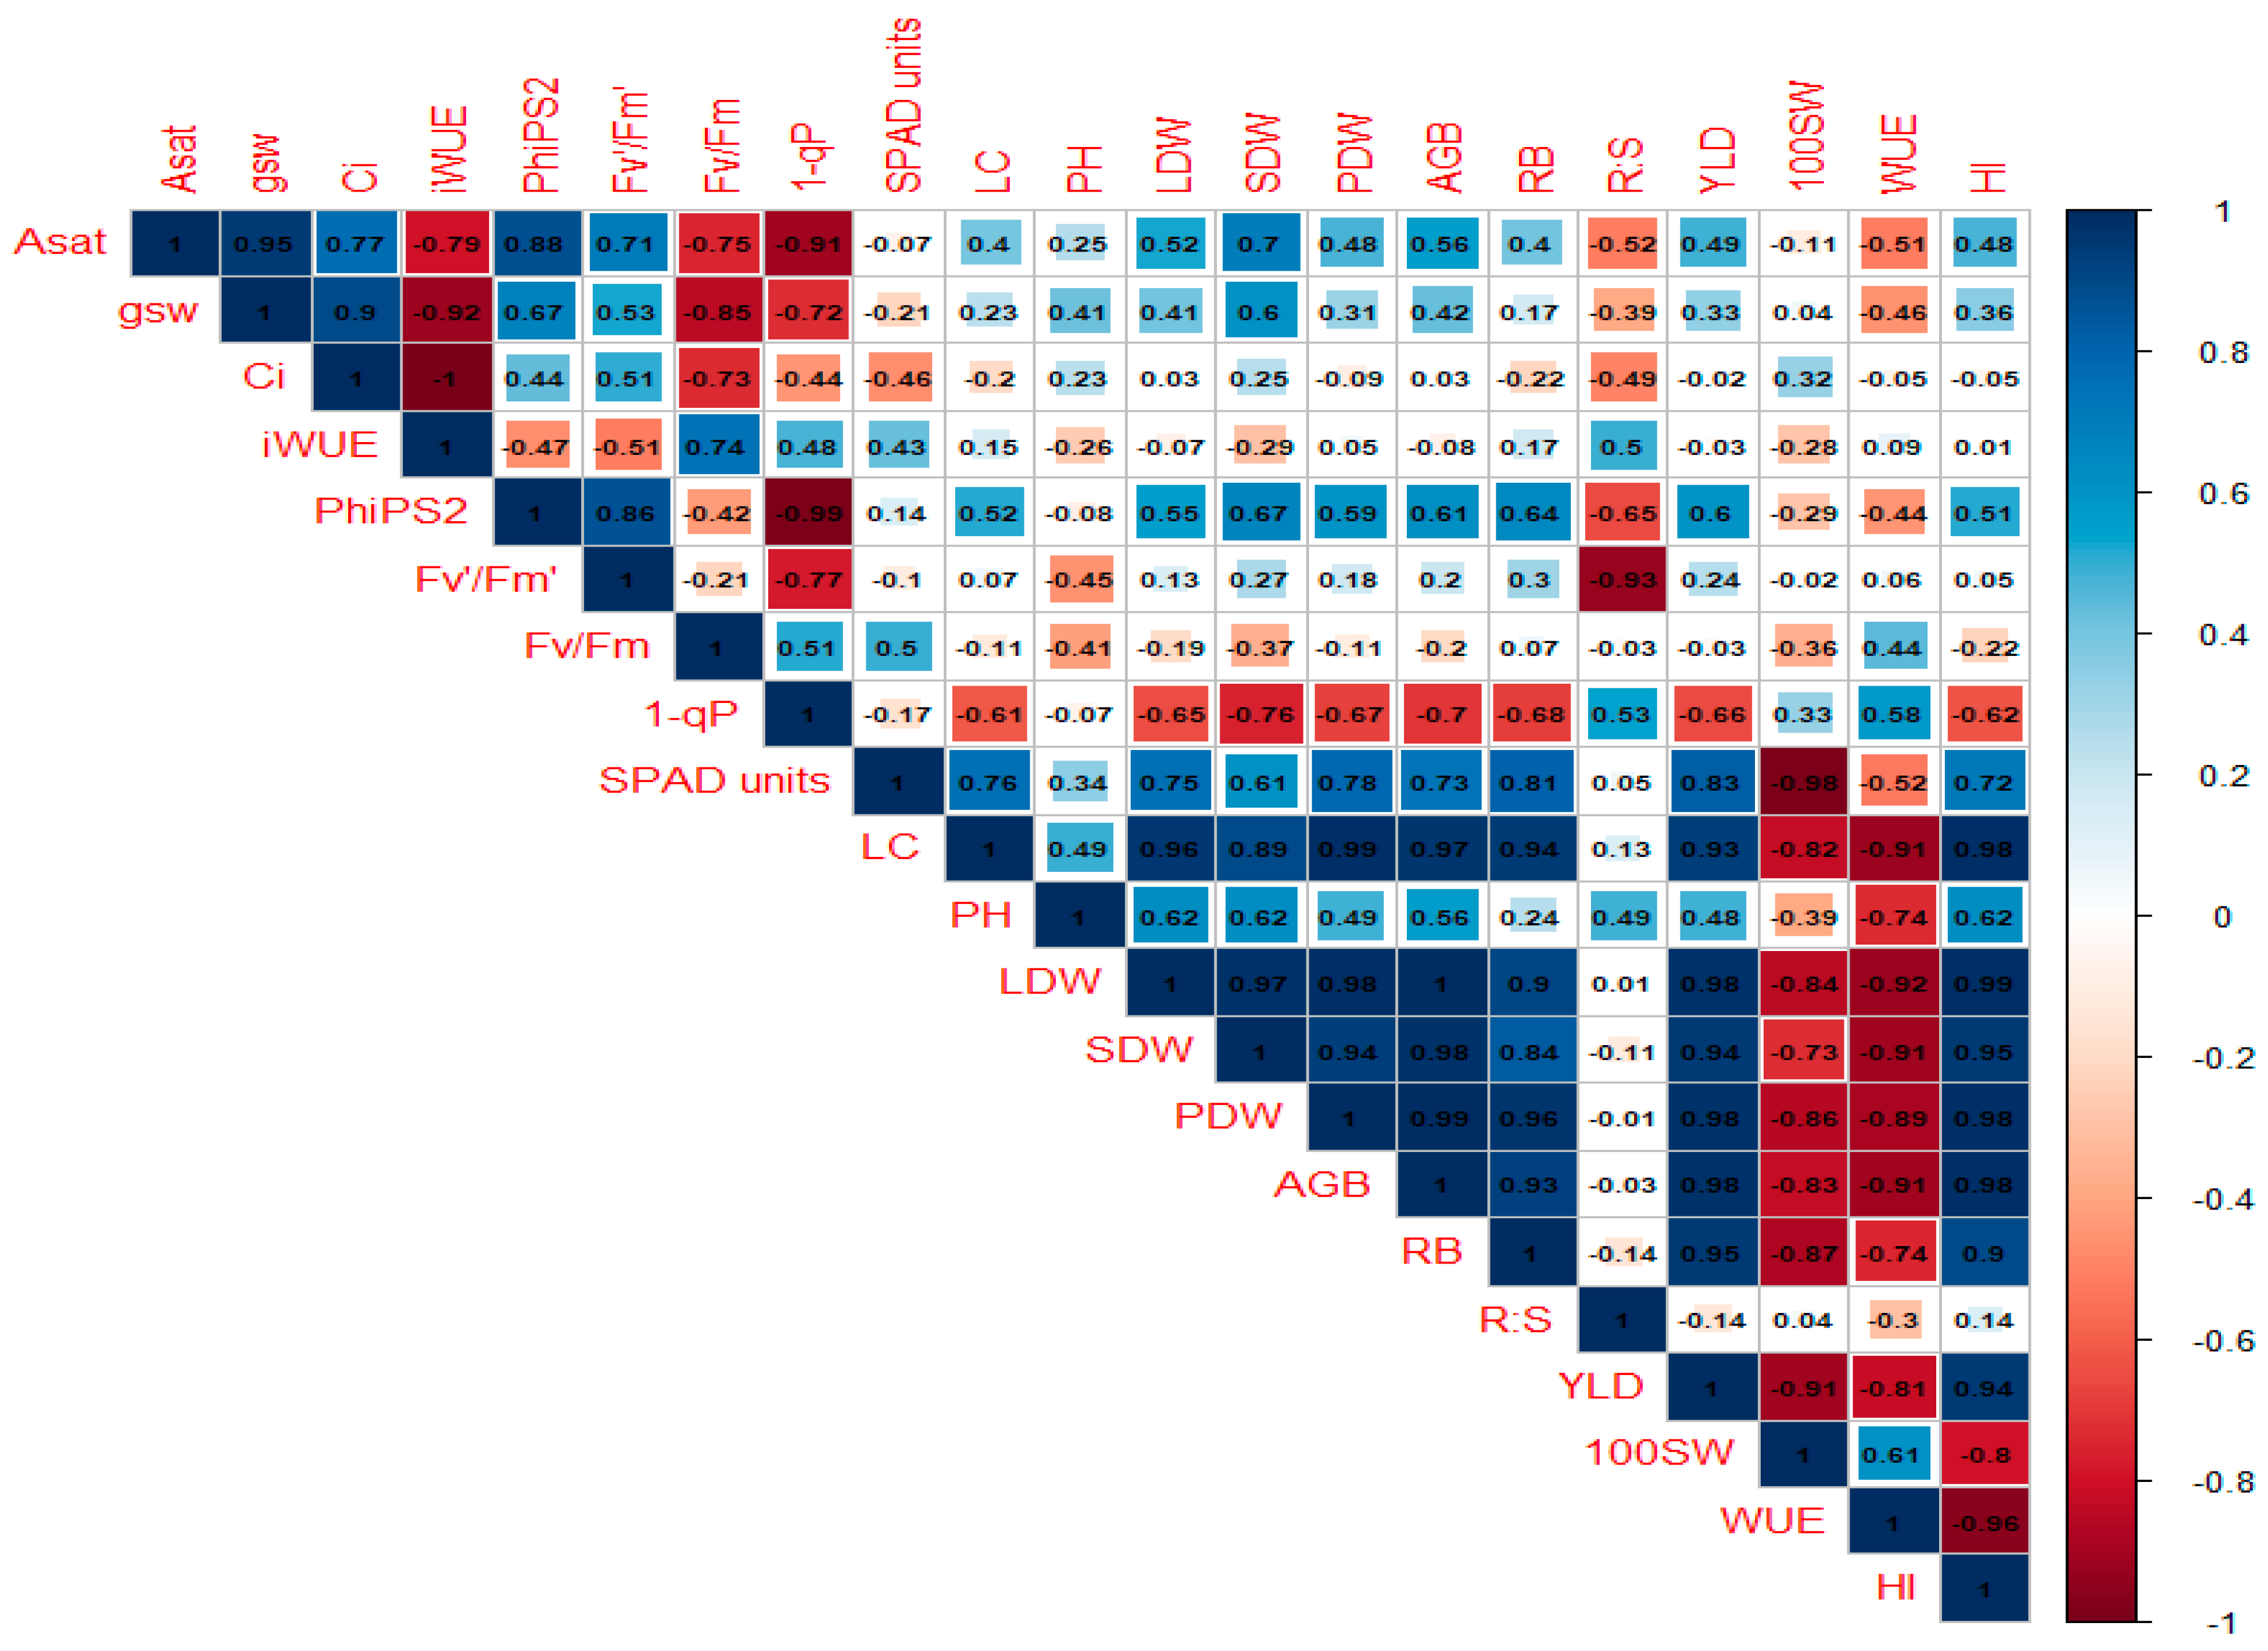
6.6. Correlation Analysis
7. Conclusions
Supplementary Materials
Author Contributions
Funding
Institutional Review Board Statement
Data Availability Statement
Acknowledgments
Conflicts of Interest
References
- Grain Research and Development Corporation (GRDC). Grow Notes, Mungbean. 2017. Available online: https://grdc.com.au/__data/assets/pdf_file/0014/315311/GRDC-GrowNotes-Mungbeans-Northern.pdf (accessed on 20 June 2017).
- Pratap, A.; Douglas, C.; Prajapati, U.; Kumari, G.; War, A.R.; Tomar, R.; Pandey, A.K.; Dubey, S. Breeding Progress and Future Challenges: Biotic Stresses. In The Mungbean Genome; Nair, R.M., Schafleitner, R., Lee, S.-H., Eds.; Springer International Publishing: Cham, Switzerland, 2020; pp. 55–80. [Google Scholar]
- Chauhan, Y.S.; Williams, R. Physiological and Agronomic Strategies to Increase Mungbean Yield in Climatically Variable Environments of Northern Australia. Agronomy 2018, 8, 83. [Google Scholar] [CrossRef]
- Wenham, K.; Williams, A.; Rachaputi, R.C.N.; Rossignol, T.; Collins, M. Critical Period of Moisture Vulnerability in Mungbeans. 2020. Available online: https://grdc.com.au/resources-and-publications/grdc-update-papers/tab-content/grdc-update-papers/2020/08/critical-period-of-moisture-vulnerability-in-mungbeans (accessed on 10 April 2021).
- Grain Research and Development Corporation (GRDC). Mungbeans. 2014. Available online: http://www.mungbean.org.au/ (accessed on 20 April 2019).
- Ahmad, A.; Selim, M.M.; Alderfasi, A.A.; Afzal, M.N. Effect of drought stress on mungbean (Vigna radiata L.) under arid climatic conditions of Saudi Arabia. Ecosyst. Sustain. Dev. 2015, 192, 185–193. [Google Scholar]
- Dutta, P.; Bera, A. Screening of mungbean genotypes for drought tolerance. Legume Res. 2008, 31, 145–148. [Google Scholar]
- IPCC. Fourth Assessment Report: Synthesis. 2007. Available online: https://www.ipcc.ch/assessment-report/ar4/ (accessed on 20 December 2018).
- Saxe, H.; Cannell, M.G.R.; Johnsen, Ø.; Ryan, M.G.; Vourlitis, G. Tree and forest functioning in response to global warming. New Phytol. 2001, 149, 369–399. [Google Scholar] [CrossRef]
- Mpelasoka, F.S.; Hennessy, K.J.; Jones, R.N.; Bates, B.C. Comparison of suitable drought indices for climate change impacts assessment over Australia towards resource management. Int. J. Climatol. 2008, 28, 1283–1292. [Google Scholar] [CrossRef]
- Nunes, C.; Moreira, R.; Pais, I.; Semedo, J.; Simões, F.; Veloso, M.M.; Scotti-Campos, P. Cowpea Physiological Responses to Terminal Drought—Comparison between Four Landraces and a Commercial Variety. Plants 2022, 11, 593. [Google Scholar] [CrossRef] [PubMed]
- Wang, Z.; Li, G.; Sun, H.; Ma, L.; Guo, Y.; Zhao, Z.; Gao, H.; Mei, L. Effects of drought stress on photosynthesis and photosynthetic electron transport chain in young apple tree leaves. Biol. Open 2018, 7, bio035279. [Google Scholar] [CrossRef]
- Reddy, A.R.; Chaitanya, K.V.; Vivekanandan, M. Drought-induced responses of photosynthesis and antioxidant metabolism in higher plants. J. Plant Physiol. 2004, 161, 1189–1202. [Google Scholar] [CrossRef] [PubMed]
- Kim, J.Y.; Mahé, A.; Brangeon, J.; Prioul, J.L. A maize vacuolar invertase, IVR2, is induced by water stress. Organ/tissue specificity and diurnal modulation of expression. Plant Physiol. 2000, 124, 71–84. [Google Scholar] [CrossRef]
- Fahad, S.; Bajwa, A.A.; Nazir, U.; Anjum, S.A.; Farooq, A.; Zohaib, A.; Sadia, S.; Nasim, W.; Adkins, S.; Saud, S. Crop production under drought and heat stress: Plant responses and management options. Front. Plant Sci. 2017, 8, 1147. [Google Scholar] [CrossRef]
- Posch, S.; Bennett, L.T. Photosynthesis, photochemistry and antioxidative defence in response to two drought severities and with re-watering in Allocasuarina luehmannii. Plant Biol. 2009, 11, 83–93. [Google Scholar] [CrossRef]
- Wu, Y.J.; Ren, C.; Tian, Y.; Zha, T.S.; Liu, P.; Bai, Y.J.; Ma, J.Y.; Lai, Z.R.; Bourque, C.P.A. Photosynthetic gas-exchange and PSII photochemical acclimation to drought in a native and non-native xerophytic species (Artemisia ordosica and Salix psammophila). Ecol. Indic. 2018, 94, 130–138. [Google Scholar] [CrossRef]
- Bauerle, W.L.; Dudley, J.B.; Grimes, L.W. Genotypic variability in photosynthesis, water use, and light absorption among red and Freeman maple cultivars in response to drought stress. J. Am. Soc. Hortic. Sci. 2003, 128, 337–342. [Google Scholar] [CrossRef]
- Kanouni, H.; Shahab, M.; Imtiaz, M.; Khalili, M. Genetic variation in drought tolerance in chickpea (Cicer arietinum L.) genotypes. Crop Breed. J. 2012, 2, 133–138. [Google Scholar]
- Karim, A.N.M.A.; Sarker, U.; Hasan, A.; Islam, N.; Uddin, M.R. Selection of Drought Tolerant High Yielding Chickpea Genotypes based on Field Performance and Genetic Variation in Bangladesh. Legume Res. Int. J. 2021, 44, 1131–1137. [Google Scholar] [CrossRef]
- Puangbut, D.; Jogloy, S.; Toomsan, B.; Vorasoot, N.; Akkasaeng, C.; Kesmala, T.; Rachaputi, R.; Wright, G.; Patanothai, A. Drought Stress: Physiological Basis for Genotypic Variation in Tolerance to and Recovery from Pre-flowering Drought in Peanut. J. Agron. Crop Sci. 2010, 196, 358–367. [Google Scholar] [CrossRef]
- Link, W.; Abdelmula, A.A.; Von Kittlitz, E.; Bruns, S.; Riemer, H.; Stelling, D. Genotypic variation for drought tolerance in Vicia faba. Plant Breed. 1999, 118, 477–483. [Google Scholar] [CrossRef]
- Hufstetler, E.; Boerma, H.; Carter, T.E.; Earl, H. Genotypic Variation for Three Physiological Traits Affecting Drought Tolerance in Soybean. Crop Sci. 2007, 47, 25–35. [Google Scholar] [CrossRef]
- Anyia, A.O.; Herzog, H. Genotypic Variability in Drought Performance and Recovery in Cowpea under Controlled Environment. J. Agron. Crop Sci. 2004, 190, 151–159. [Google Scholar] [CrossRef]
- Slama, I.; Talbi Zribi, O.; Nasreddine, Y.; Rouached, A.; Gharred, J.; Jdey, A.; Hanana, M.; Abdelly, C. Drought tolerance traits in Medicago species: A review. Arid Land Res. Manag. 2021, 36, 67–83. [Google Scholar] [CrossRef]
- Hussain, T.; Hussain, N.; Ahmed, M.; Nualsri, C.; Duangpan, S. Responses of Lowland Rice Genotypes under Terminal Water Stress and Identification of Drought Tolerance to Stabilize Rice Productivity in Southern Thailand. Plants 2021, 10, 2565. [Google Scholar] [CrossRef]
- Vassileva, V.; Signarbieux, C.; Anders, I.; Feller, U. Genotypic variation in drought stress response and subsequent recovery of wheat (Triticum aestivum L.). J. Plant Res. 2011, 124, 147–154. [Google Scholar] [CrossRef]
- Rahman, M.; Ullah, I.; Ahsraf, M.; Stewart, J.M.; Zafar, Y. Genotypic variation for drought tolerance in cotton. Agron. Sustain. Dev. 2008, 28, 439–447. [Google Scholar] [CrossRef]
- Shihab Uddin, S.U.; Shahnaj Parvin, S.P.; Awal, M. Morpho-physiological aspects of mungbean (Vigna radiata L.) in response to water stress. Int. J. Agric. Sci. Res. 2013, 3, 137–148. [Google Scholar]
- Naresh, R.; Purushottam; Singh, S.P.; Dwivedi, A.; Kumar, V. Effects of water stress on physiological processes and yield attributes of different mungbean (L.) varieties. Afr. J. Biochem. Res. 2013, 7, 55–62. [Google Scholar]
- Vu, T.T.H.; Le, T.T.C.; Pham, T.L. Growth responses and differential expression of VrDREB2A gene at different growth stages of mungbean (Vigna radiata L. Wilczek) under drought stress. Physiol. Mol. Biol. Plants 2021, 27, 2447–2458. [Google Scholar] [CrossRef] [PubMed]
- Bouyoucos, C. Les propriétés physiques du sol dépendent de sa texture et de sa structure. Bases Prod. Vég. 1983, 1, 67–87. [Google Scholar]
- Scholander, P.F.; Bradstreet, E.D.; Hemmingsen, E.A.; Hammel, H.T. Sap Pressure in Vascular Plants: Negative hydrostatic pressure can be measured in plants. Science 1965, 148, 339–346. [Google Scholar] [CrossRef]
- Anderson, C.J.R.A.; Rosas-Anderson, J.P. Leafscan (Version 1.3.21). Mobile Application Software. Available online: https://itunes.apple.com/app/id1254892230 (accessed on 5 March 2021).
- Long, S.P.; Bernacchi, C.J. Gas exchange measurements, what can they tell us about the underlying limitations to photosynthesis? Procedures and sources of error. J. Exp. Bot. 2003, 54, 2393–2401. [Google Scholar] [CrossRef]
- Maxwell, K.; Johnson, G.N. Chlorophyll fluorescence—A practical guide. J. Exp. Bot. 2000, 51, 659–668. [Google Scholar] [CrossRef]
- Piper, F.I.; Corcuera, L.J.; Alberdi, M.; Lusk, C. Differential photosynthetic and survival responses to soil drought in two evergreen Nothofagus species. Ann. For. Sci. 2007, 64, 447–452. [Google Scholar] [CrossRef]
- Melis, A. Photosystem-II damage and repair cycle in chloroplasts: What modulates the rate of photodamage ? Trends Plant Sci. 1999, 4, 130–135. [Google Scholar] [CrossRef] [PubMed]
- Wilson, K.E.; Huner, N.P. The role of growth rate, redox-state of the plastoquinone pool and the trans-thylakoid deltapH in photoacclimation of Chlorella vulgaris to growth irradiance and temperature. Planta 2000, 212, 93–102. [Google Scholar] [CrossRef] [PubMed]
- Sauer, T.; Prueger, J. Managing Soils to Achieve Greater Water Use Efficiency: A Review. Agron. J. 2001, 93, 271. [Google Scholar] [CrossRef]
- Bakeman, R. Recommended effect size statistics for repeated measures designs. Behav. Res. Methods 2005, 37, 379–384. [Google Scholar] [CrossRef] [PubMed]
- Payne, R.W. GenStat. WIREs Comput. Stat. 2009, 1, 255–258. [Google Scholar] [CrossRef]
- Saville, D.J. Multiple Comparison Procedures: The Practical Solution. Am. Stat. 1990, 44, 174–180. [Google Scholar] [CrossRef]
- R Core Team. R: A Language and Environment for Statistical Computing, R Version 4.0. 3; R Foundation for Statistical Computting: Vienna, Austria, 2020.
- Wei, T.; Wei, M.T. Package ‘corrplot’. Statistician 2016, 56, 316–324. [Google Scholar]
- Wickham, H. ggplot2: Elegant Graphics for Data Analysis. 2016. Available online: https://ggplot2.tidyverse.org (accessed on 5 May 2021).
- Siddique, M.; Hamid, A.; Islam, M. Drought stress effects on water relations of wheat. Bot. Bull. Acad. Sin. 2000, 41, 35–39. [Google Scholar]
- Reddy, Y.A.; Reddy, Y.N.; Ramya, V.; Suma, L.S.; Reddy, A.B.; Krishna, S. Drought adaptation: Approaches for crop improvement. In Millets and Pseudo Cereals; Woodhead Publishing: Sawston, UK, 2021; pp. 143–158. [Google Scholar]
- Silva, F.; Marques, A.; Chaveiro, A. Reactive oxygen species: A double-edged sword in reproduction. Open Vet. Sci. J. 2010, 4, 127–133. [Google Scholar] [CrossRef]
- Shavrukov, Y.; Kurishbayev, A.; Jatayev, S.; Shvidchenko, V.; Zotova, L.; Koekemoer, F.; De Groot, S.; Soole, K.; Langridge, P. Early flowering as a drought escape mechanism in plants: How can it aid wheat production? Front. Plant Sci. 2017, 8, 1950. [Google Scholar] [CrossRef] [PubMed]
- Akinyosoye, S.T.; Agbeleye, O.A.; Adetumbi, J.A.; Ukachukwu, P.C. Selection for earliness and seed yield in Mung bean accessions using REML/BLUP. Pesqui. Agropecu. Bras. 2021, 56, e02290. [Google Scholar]
- Sachdeva, S.; Bharadwaj, C.; Patil, B.S.; Pal, M.; Roorkiwal, M.; Varshney, R.K. Agronomic Performance of Chickpea Affected by Drought Stress at Different Growth Stages. Agronomy 2022, 12, 995. [Google Scholar] [CrossRef]
- Cornic, G.; Fresneau, C. Photosynthetic carbon reduction and carbon oxidation cycles are the main electron sinks for photosystem II activity during a mild drought. Ann. Bot. 2002, 89, 887–894. [Google Scholar] [CrossRef] [PubMed]
- Flexas, J.; Bota, J.; Galmés, J.; Medrano, H.; Ribas-Carbó, M. Keeping a positive carbon balance under adverse conditions: Responses of photosynthesis and respiration to water stress. Physiol. Plant. 2006, 127, 343–352. [Google Scholar] [CrossRef]
- Liu, X.; Fan, Y.; Long, J.; Wei, R.; Kjelgren, R.; Gong, C.; Zhao, J. Effects of soil water and nitrogen availability on photosynthesis and water use efficiency of Robinia pseudoacacia seedlings. J. Environ. Sci. 2013, 25, 585–595. [Google Scholar] [CrossRef] [PubMed]
- Chaves, M.M.; Oliveira, M.M. Mechanisms underlying plant resilience to water deficits: Prospects for water-saving agriculture. J. Exp. Bot. 2004, 55, 2365–2384. [Google Scholar] [CrossRef] [PubMed]
- Tezara, W.; Mitchell, V.; Driscoll, S.; Lawlor, D. Water stress inhibits plant photosynthesis by decreasing coupling factor and ATP. Nature 1999, 401, 914–917. [Google Scholar] [CrossRef]
- Demmig-Adams, B.; Adams, W.W., III. The role of xanthophyll cycle carotenoids in the protection of photosynthesis. Trends Plant Sci. 1996, 1, 21–26. [Google Scholar] [CrossRef]
- Zai, X.; Zhu, S.; Qin, P.; Wang, X.; Che, L.; Luo, F. Effect of Glomus mosseae on chlorophyll content, chlorophyll fluorescence parameters, and chloroplast ultrastructure of beach plum (Prunus maritima) under NaCl stress. Photosynthetica 2012, 50, 323–328. [Google Scholar] [CrossRef]
- Henriques, F.S. Leaf chlorophyll fluorescence: Background and fundamentals for plant biologists. Bot. Rev. 2009, 75, 249–270. [Google Scholar] [CrossRef]
- Force, L.; Critchley, C.; Van Rensen, J.J. New fluorescence parameters for monitoring photosynthesis in plants. Photosynth. Res. 2003, 78, 17–33. [Google Scholar] [CrossRef] [PubMed]
- Ranawake, A.; Dahanayaka, N.; Amarasingha, U.; Rodrigo, W.; Rodrigo, U. Effect of water stress on growth and yield of mung bean (Vigna radiata L). Trop. Agric. Res. Ext. 2012, 14, 1–4. [Google Scholar] [CrossRef]
- Farooq, M.; Wahid, A.; Lee, D.-J.; Ito, O.; Siddique, K.H.M. Advances in Drought Resistance of Rice. Crit. Rev. Plant Sci. 2009, 28, 199–217. [Google Scholar] [CrossRef]
- Taiz, L.; Zeiger, E. Plant Physiology; Sinauer Associates. Inc.: Sunderland, MA, USA, 2006. [Google Scholar]
- Hussain, M.; Malik, M.; Farooq, M.; Ashraf, M.; Cheema, M. Improving drought tolerance by exogenous application of glycinebetaine and salicylic acid in sunflower. J. Agron. Crop Sci. 2008, 194, 193–199. [Google Scholar] [CrossRef]


| Mungbean Varieties | Water Applied (L pot−1) | Water Applied (L pot−1) | |
|---|---|---|---|
| Well-watered | Drought stress | ||
| AVTMB-1 | 15.80 ± 0.72 b | 7.97 ± 0.39 a | |
| AVTMB-2 | 19.75 ± 1.05 ab | 7.85 ± 0.32 a | |
| AVTMB-3 | 15.89 ± 1.08 b | 8.44 ± 0.30 a | |
| AVTMB-4 | 19.26 ± 1.84 ab | 8.29 ± 0.53 a | |
| Jade-AU | 21.43 ± 0.79 a | 7.83 ± 0.39 a | |
| F-values | p-values | LSD | |
| Varieties (G) | 3.85 | 0.009 | 1.790 |
| Treatment (T) | 382.64 | <0.001 | 1.132 |
| G × T | 5.03 | 0.002 | 2.531 |
| Varieties | Water Potential (MPa) | Leaf Area (cm2) | ||
|---|---|---|---|---|
| Flowering Stage | Pod Filling Stage | at Flowering Stage | at Pod Filling Stage | |
| Well-watered | ||||
| AVTMB#1 | −0.75 ± 0.02 a | −0.58 ± 0.05 a | 207 ± 3.7 bcde | 187 ± 1.4 bcde |
| AVTMB#2 | −0.69 ± 0.03 a | −0.51 ± 0.02 a | 271 ± 6.5 e | 148 ± 3.0 abc |
| AVTMB#3 | −0.74 ± 0.05 a | −0.69 ± 0.09 a | 233 ± 8.4 de | 225 ± 2.3 e |
| AVTMB#4 | −0.74 ± 0.01 a | −0.61 ± 0.01 a | 206 ± 2.0 bcd | 212 ± 1.2 de |
| Jade-AU | −0.52 ± 0.08 b | −0.75 ± 0.09 a | 214 ± 7.5 cde | 205 ± 4.0 cde |
| Drought stress | ||||
| AVTMB#1 | −0.78 ± 0.05 abc | −0.76 ± 0.02 abc | 136 ± 4.8 a | 120 ± 10.2 a |
| AVTMB#2 | −0.76 ± 0.03 bcd | −0.78 ± 0.06 bcd | 157 ± 11.0 abc | 111 ± 5.1 a |
| AVTMB#3 | −0.81 ± 0.09 abc | −0.88 ± 0.02 b | 157 ± 19.9 abc | 162 ± 31.4 abcd |
| AVTMB#4 | −0.83 ± 0.04 ab | −0.86 ± 0.07 bc | 175 ± 12.2 abcd | 136 ± 2.5 ab |
| Jade-AU | −0.84 ± 0.04 a | −1.06 ± 0.03 a | 145 ± 2.4 ab | 147 ± 2.6 abc |
| Varieties (G) | ||||
| F-values | 6.03 | 5.94 | 3.21 | 8.58 |
| p-values | 0.003 | 0.003 | 0.037 | <0.001 |
| LSD | (0.05) | (0.12) | (26.91) | (25.33) |
| Treatment (T) | 47 | |||
| F-values | 47.30 | 38.98 | 78.94 | 65.79 |
| p-values | <0.001 | <0.001 | <0.001 | <0.001 |
| LSD | (0.03) | (0.08) | (17.02) | (16.02) |
| G × T | ||||
| F-values | 8.23 | 0.40 | 2.65 | 0.92 |
| p-values | <0.001 | 0.806 | 0.067 | 0.475 |
| LSD | (0.07) | (0.17) | (38.05) | (35.83) |
| Mean | −0.74 | −0.75 | 190 | 166 |
| CV% | 6.21 | 10 | 2.30 | 5.20 |
| Parameters | AVTMB#1 | AVTMB#2 | AVTMB#3 | AVTMB#4 | Jade-AU | p-Values, (LSD) | |||||||
|---|---|---|---|---|---|---|---|---|---|---|---|---|---|
| WW | DS | WW | DS | WW | DS | WW | DS | WW | DS | G | Trt | Gx Trt | |
| YLD | 19.67 ± 1.56 | 6.83 ± 1.20 | 24.87 ± 3.23 | 6.13 ± 0.61 | 16.13 ± 2.96 | 6.12 ± 0.88 | 22.57 ± 3.58 | 7.68 ± 0.90 | 21.20 ± 2.21 | 5.32 ± 0.67 | |||
| Log YLD | 1.31 cd | 0.89 b | 1.39 d | 0.80 ab | 1.21 c | 0.84 ab | 1.34 cd | 0.87 b | 1.33 cd | 0.70 a | 0.213, (0.10) | <0.001, (0.06) | 0.054. (1.44) |
| HI | 0.33 ± 0.02 | 0.35 ± 0.05 | 0.33 ± 0.03 | 0.32 ± 0.02 | 0.30 ± 0.03 | 0.33 ± 0.03 | 0.32 ± 0.04 | 0.32 ± 0.02 | 0.28 ± 0.02 | 0.28 ± 0.03 | 0.254 | 0.684 | 0.945 |
| Log HI | 0.12 ab | 0.14 a | 0.12 ab | 0.18 Ab | 0.11 ab | 0.12 ab | 0.12 Ab | 0.13 ab | 0.10 ab | 0.11 a | 0.216, (0.01) | 0.251, (0.01) | 0.860, (0.02) |
| 100SW | 6.20 ± 0.43 | 9.21 ± 1.29 | 5.30 ± 0.51 | 6.65 ± 0.15 | 5.82 ± 0.19 | 6.98 ± 0.55 | 6.12 ± 0.65 | 6.67 ± 0.32 | 5.53 ± 0.35 | 7.51 ± 0.39 | |||
| Log 100SW | 0.85 ab | 0.92 b | 0.79 a | 0.92 b | 0.83 ab | 0.87 ab | 0.84 ab | 0.89 ab | 0.81 ab | 0.92 b | 0.558, (0.04) | <0.001, (0.03) | 0.279, (0.06) |
| AGB | 59.63 ± 4.50 | 20.61 ± 2.95 | 74.70 ± 6.03 | 19.15 ± 1.09 | 55.19 ± 7.71 | 23.94 ± 2.18 | 71.28 ± 5.71 | 24.36 ± 2.44 | 75.60 ± 2.78 | 19.20 ± 0.59 | |||
| Log AGB | 1.78 cd | 1.30 b | 1.87 de | 1.26 ab | 1.72 c | 1.29 b | 1.85 de | 1.30 b | 1.88 e | 1.16 a | 0.264, (0.07) | <0.001, (0.04) | 0.003, (0.10) |
| RB | 5.16 ± 0.55 | 2.15 ± 0.16 | 6.01 ± 0.51 | 2.24 ± 0.10 | 4.75 ± 0.72 | 2.77 ± 0.27 | 6.13 ± 0.91 | 2.76 ± 0.20 | 6.19 ± 0.58 | 2.22 ± 0.13 | |||
| Log RB | 0.78 c | 0.43 ab | 0.83 c | 0.47 ab | 0.74 c | 0.54 b | 0.83 c | 0.48 ab | 0.84 c | 0.41 a | 0.727, (0.07) | <0.001, (0.05) | 0.071, (0.11) |
| R:S | 0.09 ± 0.01 | 0.12 ± 0.02 | 0.08 ± 0.01 | 0.12 ± 0.01 | 0.09 ± 0.01 | 0.12 ± 0.01 | 0.09 ± 0.01 | 0.12 ± 0.01 | 0.08 ± 0.01 | 0.12 ± 0.01 | |||
| Log R:S | 0.06 a | 0.03 ab | 0.03 a | 0.04 bcd | 0.04 a | 0.06 d | 0.03 a | 0.04 abc | 0.03 a | 0.05 cd | 0.162, (0.007) | <0.001, (0.004) | 0.134, (0.01) |
| PDW | 28.18 ± 2.12 | 8.26 ± 1.64 | 35.39 ± 4.20 | 8.11 ± 0.77 | 23.58 ± 4.11 | 10.17 ± 1.12 | 31.47 ± 4.14 | 10.25 ± 1.17 | 31.66 ± 2.83 | 6.57 ± 0.61 | |||
| Log PDW | 1.46 cd | 0.97 a | 1.54 d | 0.90 ab | 1.36 c | 0.93 b | 1.49 d | 0.98 b | 1.50 d | 0.79 a | 0.150, (0.09) | <0.001, (0.05) | 0.012, (0.12) |
| SDW | 12.6 ± 1.3 a | 4.8 ± 0.6 a | 15.8 ± 1.3 ab | 4.1 ± 0.1 a | 13.3 ± 1.5 ab | 5.3 ± 0.8 a | 15.8 ± 1.4 ab | 5.6 ± 0.9 a | 18.5 ± 0.4 b | 4.7 ± 0.3 a | |||
| Log SDW | 1.12 c | 0.71 b | 1.22 cd | 0.69 ab | 1.14 c | 0.69 ab | 1.21 cd | 0.70 b | 1.28 d | 0.59 a | 0.643, (0.07) | <0.001, (0.04) | 0.003, (0.10) |
| LDW | 13.66 ± 1.53 | 5.32 ± 0.67 | 17.41 ± 1.79 | 4.72 ± 0.26 | 13.49 ± 2.01 | 5.63 ± 0.75 | 17.88 ± 1.78 | 5.67 ± 0.63 | 19.26 ± 0.93 | 5.65 ± 0.40 | |||
| Log LDW | 1.15 b | 0.74 a | 1.25 bc | 0.73 a | 1.13 b | 0.69 a | 1.26 bc | 0.72 a | 1.30 c | 0.66 a | 0.389, (0.09) | <0.001, (0.06) | 0.160, (0.13) |
| PH | 56 ± 0.42 | 47 ± 3.72 | 56 ± 9.16 | 45 ± 9.25 | 59 ± 6.00 | 43 ± 2.11 | 56 ± 4.96 | 45 ± 2.67 | 56 ± 4.07 | 46 ± 5.80 | |||
| Log PH | 1.75 b | 1.68 a | 1.74 b | 1.65 a | 1.77 b | 1.64 a | 1.75 b | 1.65 a | 1.75 b | 1.66 a | 0.939, (0.04) | <0.001, (0.02) | 0.685, (0.05) |
| LC | 20 ± 1.60 | 11 ± 1.64 | 25 ± 2.16 | 9 ± 0.98 | 19 ± 2.88 | 12 ± 1.40 | 24 ± 2.07 | 10 ± 1.32 | 23 ± 0.92 | 8 ± 0.82 | |||
| Log LC | 1.32 cd | 1.04 b | 1.40 d | 1.00 ab | 1.28 b | 1.09 b | 1.39 cd | 1.02 ab | 1.37 cd | 0.93 a | 0.627, (0.07) | <0.001, (0.04) | 0.014, (0.10) |
Disclaimer/Publisher’s Note: The statements, opinions and data contained in all publications are solely those of the individual author(s) and contributor(s) and not of MDPI and/or the editor(s). MDPI and/or the editor(s) disclaim responsibility for any injury to people or property resulting from any ideas, methods, instructions or products referred to in the content. |
© 2024 by the authors. Licensee MDPI, Basel, Switzerland. This article is an open access article distributed under the terms and conditions of the Creative Commons Attribution (CC BY) license (https://creativecommons.org/licenses/by/4.0/).
Share and Cite
Ikram, S.; Bhattarai, S.; Walsh, K.B. Screening New Mungbean Varieties for Terminal Drought Tolerance. Agriculture 2024, 14, 1328. https://doi.org/10.3390/agriculture14081328
Ikram S, Bhattarai S, Walsh KB. Screening New Mungbean Varieties for Terminal Drought Tolerance. Agriculture. 2024; 14(8):1328. https://doi.org/10.3390/agriculture14081328
Chicago/Turabian StyleIkram, Sobia, Surya Bhattarai, and Kerry B. Walsh. 2024. "Screening New Mungbean Varieties for Terminal Drought Tolerance" Agriculture 14, no. 8: 1328. https://doi.org/10.3390/agriculture14081328