Article

Effect of Muddy Water Characteristics on Infiltration Laws and Stratum Compactum Soil Particle Composition under Film Hole Irrigation

State Key Laboratory of Eco-Hydraulics in Northwest Arid Region, Xi’an University of Technology, Xi’an 710048, China
*
Author to whom correspondence should be addressed.
Agriculture 2024, 14(8), 1377; https://doi.org/10.3390/agriculture14081377
Submission received: 3 July 2024 / Revised: 12 August 2024 / Accepted: 14 August 2024 / Published: 16 August 2024
(This article belongs to the Section Agricultural Soils)

Abstract

:
To investigate the impact of sediment on water infiltration and soil structure under muddy water irrigation conditions, indoor muddy water film hole infiltration experiments were conducted. Four different muddy water sediment concentrations (3%, 6%, 9%, 12%) and four typical sediment particle size distributions (which were quantified by the physical clay content with a particle size of less than 0.01 mm, d0.01: 9.13%, 16.46%, 27.34%, 44.02%) were employed to examine how muddy water properties affect infiltration law and the stratum compactum soil particle composition under film hole irrigation. The results showed that as the muddy water sediment concentration and physical clay content increased, the wetting front migration distance, cumulative infiltration amount, and soil water content gradually decreased simultaneously. The Kostiakov infiltration model effectively captured the changes in soil water infiltration during muddy water film hole irrigation, exhibiting a strong fit with a high coefficient of determination (R2 > 0.9). With higher muddy water sediment concentration, the deposition layer thickness increases within the same infiltration time. Conversely, higher physical clay content leads to a decrease in deposition layer thickness. The characteristics of the muddy water have a significant impact on the particle composition of the soil in the stratum compactum caused by film hole irrigation. The deposition layer has a lower relative content of fine soil particles compared to muddy water, but this content increases with higher muddy water sediment concentration and physical clay content. In the stranded layer soil, fine particles have a higher relative content than the original soil. Fine particle content increases notably with higher muddy water sediment concentration and physical clay content. The stranded layer soil particles exhibit a higher fractal dimension than the original soil, and as the infiltrated soil layer depth increases, the soil fractal dimension decreases until it matches the original soil. The fractal dimension increased with the increase in muddy water sediment concentration and physical clay content in muddy water irrigation conditions under the same soil layer depth. This research findings could serve as a theoretical foundation for understanding soil water movement under muddy water irrigation conditions.

1. Introduction

The rising demand for water in households and industries, driven by societal development, has led to a sharp increase in water scarcity. This trend has resulted in reduced irrigation water usage and worsened the agricultural water supply–demand imbalance [1,2]. For a long time, in response to water scarcity within China’s Yellow River Basin, certain irrigation districts resorted to using muddy water directly for irrigating farmlands [3]. Despite the positive impact of muddy water irrigation in alleviating drought, enhancing soil fertility, improving saline–alkali land, and enhancing soil texture, it also alters the mechanical composition of surface soil through sediment deposition and stranding [4]. This modification affects soil structure and disrupts the soil infiltration mechanism. Notably, the infiltration behavior of muddy water differs significantly from that of clear water, rendering past research on clear water irrigation irrelevant to muddy water scenarios. Furthermore, film hole irrigation, a novel ground water-saving technique, achieves localized watering by directing water flow onto a membrane and delivering it to the crop root-zone soil via non-continuous seepage interfaces [5,6]. This method integrates ground irrigation principles with drip irrigation benefits, enhancing irrigation water utilization efficiency and enabling better control over water infiltration during ground irrigation. Film hole irrigation outperforms traditional ground irrigation by conserving water, retaining fertilizer, preserving temperature, and boosting crop yields. As a result, investigating the infiltration mechanism of muddy water film hole irrigation emerges as a crucial focus in arid and semi-arid regions of the Yellow River Basin.
During the process of muddy water infiltration, sediment-laden water gradually forms a stratum compactum, creating a dual-layer structure in the soil with a dense upper layer and loose lower layer. The formation of this compact layer acts as a barrier to water infiltration, playing a crucial role in the process. When irrigating with muddy water, the soil’s infiltration capacity is primarily influenced by this compact layer. Wei et al. investigated the one-dimensional vertical infiltration characteristics of muddy water and its influencing factors through vertical infiltration experiments. They noted that muddy water decreased the soil’s infiltration capacity, particularly due to sediment concentration and the presence of physical clay particles in the water [7]. Bouwer et al. studied the infiltration behavior of muddy water, focusing on leakage issues in large ponds. They observed that sediment in muddy water settled in ponds, forming a staircase-like distribution from larger particles at the bottom to smaller particles at the top [8]. Nasirian et al. demonstrated that utilizing muddy water directly for field irrigation could decrease deep seepage and enhance channel water use efficiency [9]. Kang et al. conducted one-dimensional infiltration experiments using both muddy water and clear water to analyze the physical processes of muddy water infiltration. They also modified the existing Green–Ampt infiltration model to better suit the one-dimensional vertical infiltration of muddy water [10]. Jiang et al. found that changes in sediment concentration and particle size distribution in muddy water can greatly affect the soil moisture content distribution post-infiltration. Higher sediment concentration and finer particles result in slower water movement in the soil, with the impact of muddy water sediment on soil moisture content primarily affecting the water infiltration rate [11]. Studies by Fei et al., Zhong et al., and Liu et al. highlighted the significant influence of sediment in muddy water on soil infiltration capacity in muddy water film hole irrigation [12,13,14,15].
Previous studies on muddy water irrigation have primarily focused on describing the infiltration characteristics and influencing factors of muddy water, with an emphasis on experimental observations. However, these studies have not thoroughly investigated aspects such as soil pore structure on the field surface, the formation and development of stratum compactum, and the mechanisms by which sediment deposition and stranding in the soil impact water movement during muddy water infiltration. Therefore, this study utilizes indoor three-dimensional soil boxes to conduct experiments on muddy water infiltration, with the aim of exploring the mechanisms of water infiltration and stratum compactum formation under muddy water conditions, in order to establish a scientific foundation for muddy water irrigation in the Yellow River Basin in China.

2. Materials and Methods

2.1. Experimental Soil

The experiment was conducted at the State Key Laboratory of Eco-hydraulics in the Northwest Arid Region of Xi’an University of Technology. The experimental soil was sourced from Gaoling District, Xi’an City, China. It was air-dried and crushed after passing through a 2 mm sieve. The initial soil moisture content was 2.60%, the soil saturation moisture content was 0.37 kg/kg, and the field holding capacity was 0.26 kg/kg. Soil particle composition was determined using a Mastersize-20 laser particle size analyzer (Channel Technology Co., Ltd., Beijing, China), revealing d ≤ 0.002 mm at 5.36%, 0.002 mm < d ≤ 0.02 mm at 26.05%, and 0.02 mm < d ≤ 2 mm at 68.59%. The soil is classified as sandy loam soil according to international standards.

2.2. Experimental Muddy Water Sediment

Sediment particles in muddy water are classified based on their force status and the potential occurrence of the flocculation settling phenomenon. They are categorized as physical clay (particle size < 0.01 mm) and non-physical clay (particle size > 0.01 mm) [16]. Previous studies have shown that the content of physical clay with a particle size < 0.01 mm (d0.01) directly affects the infiltration behavior of muddy water [17]. As a result, this study assesses the variations in muddy water sediment particle size distribution composition utilizing d0.01 to examine the effects of muddy water sediment particle size distribution on soil infiltration.
Irrigation water samples taken from the Jinghui Canal irrigation area in Shaanxi Province, China, were analyzed for sediment content and particle size distribution, based on the characteristics of muddy water irrigation in the Yellow River Basin and the Yellow River water diversion area [18,19]. Sediments with varying particle size distributions, dried after sieving through a 1 mm soil sieve, were manually mixed using a weighing method to obtain four different concentrations of muddy water sediment (3%, 6%, 9%, 12%) needed for the experiment. The muddy water containing four different sediment particle size distributions (d0.01: 9.13%, 16.46%, 27.34%, 44.02%) was analyzed multiple times with a laser particle size analyzer. The muddy water with the four different sediment particle size distributions is presented in Table 1. The experimental design is depicted in Table 2.

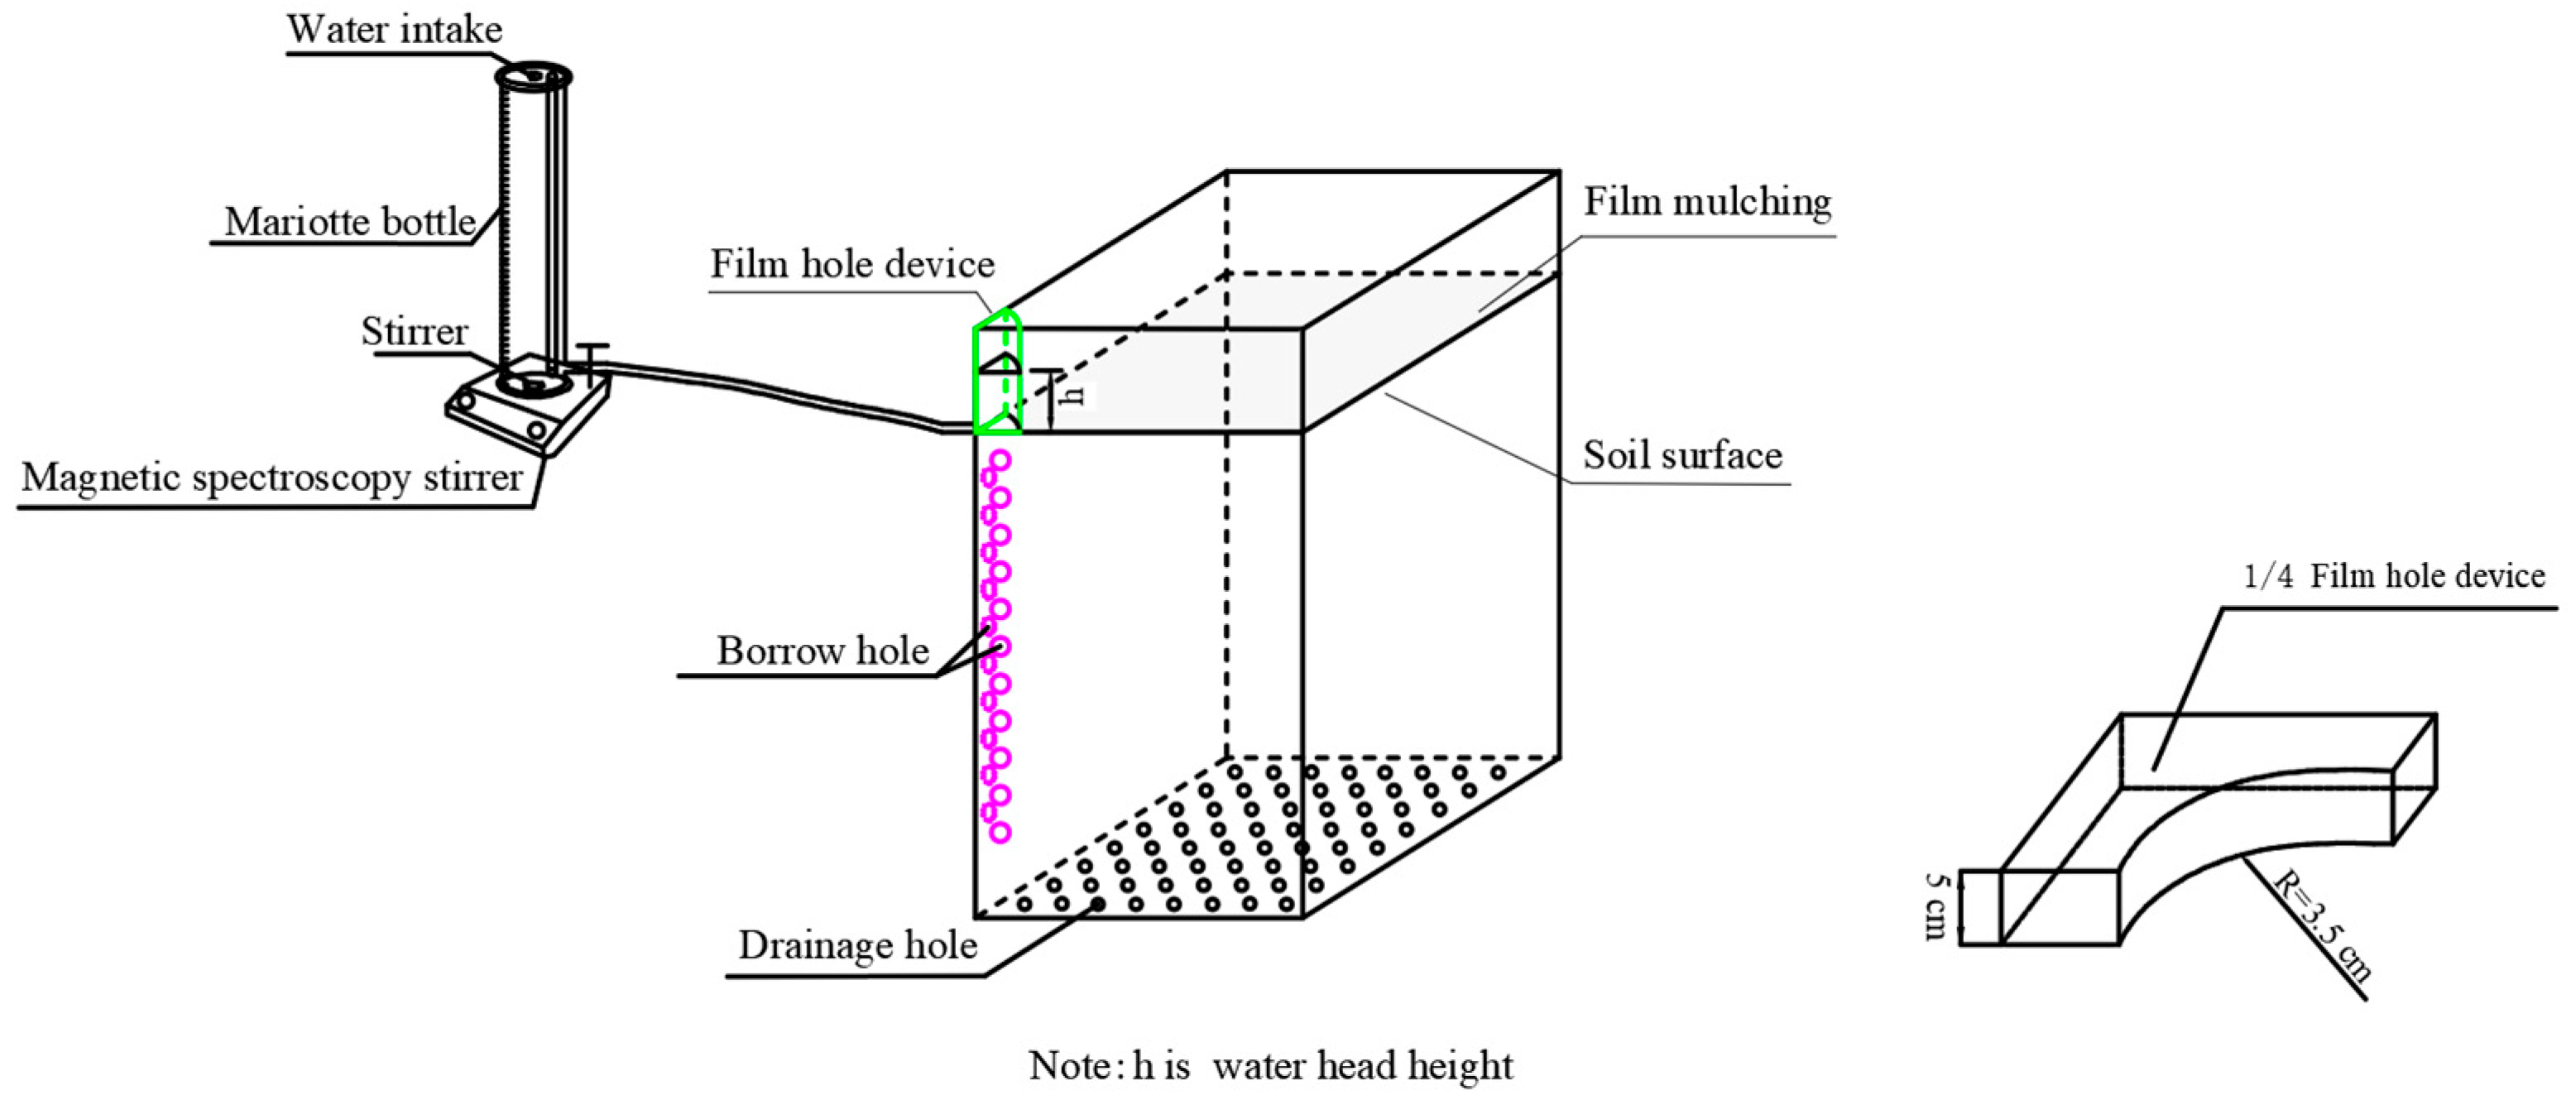
2.3. Experiment Device

Figure 1 shows the setup of the free infiltration experiment device with a single point source in the muddy water film hole. The device includes three main components: a soil box, a film hole device, and a Mariotte bottle. The soil box is constructed from 10 mm thick organic glass plates, measuring 24 cm in length, 20 cm in width, and 30 cm in height. Prior to the experiment, the inner walls of the soil box are cleaned, and soil samples are evenly layered (5 cm) based on a dry bulk density of 1.40 g/cm3 and loaded into the experimental soil box. To observe the migration of the wetting front during infiltration, a square water chamber with 1/4 film hole area serves as the infiltration source; this water chamber is made of 5 mm thick organic glass. It is attached to one corner of the soil box and allowed to stand for 24 h for stabilization.
The Mariotte bottle has an inner diameter of 9 cm and is connected to the soil box via a rubber tube. The magnetic spectroscopy stirrer, located beneath the Mariotte bottle, has a stirrer volume of less than 1 cm3, and its impact on the experimental outcomes may be minimal. The magnetic stirrer is activated during the experiment to maintain the stability of sediment content and grain size distribution in the muddy water within the Mariotte bottle, preventing settling at the bottom and influencing infiltration results. The height of the Mariotte bottle is adjusted to control the water level in the chamber, maintaining a water head height of 3.5 cm for consistent water supply. Burrow holes, each with a 1 cm diameter, are positioned along the side of the soil box, spaced 2 cm apart. Drainage holes are located at the base with a diameter of 0.5 cm, disregarding confined soil air pressure. Plastic film covers the soil box surface during the experiment to prevent moisture evaporation from impacting the results. Infiltration lasts 300 min for each experimental group, repeated thrice with mean values used for analysis. Figure 2 illustrates the soil structure post-muddy water infiltration, with a division into two components, the deposition layer and the stranded layer, as discussed in this paper.

2.4. Measurements and Calculations

(1) Cumulative infiltration amount: Record the water level in the Mariotte bottle at predefined time intervals (1, 2, 3, 4, 5, 10, 15, 20, 25, 30, 45, 60, 90, 120, 150, 180, 210, 240, 270, 300 min). Upon cessation of water supply, extract the remaining water from the film hole to calculate the total infiltration volume.
(2) Soil moisture content: Soil samples were collected post-experiment through layer-by-layer (every 2 cm) soil drilling and measured using the drying method.
(3) Wetting front distance: Use a marker to delineate the wetting front position on the exterior wall of the soil box at predetermined intervals, and measure it upon completion of the experiment.
(4) Deposition layer thickness: Measured using an electronic caliper accurate to 0.01 mm. Two distinct initial measurement points are marked on the exterior wall of the soil box prior to commencing the experiment. Throughout the experiment, the average measurement values at the two specified points are recorded at predetermined intervals to determine the thickness of the sediment layer.
(5) Deposition layer and stranded layer particle size distribution: The deposition layer samples can be obtained directly from the soil surface inside the film hole at the end of the experiment, while the stranded layer samples are collected from the soil sampling hole. Soil samples from each layer are obtained using soil sampling holes placed on both sides of the soil box with staggered sampling, as illustrated in Figure 1. The collected soil samples are dried, crushed, and analyzed for particle composition using a Mastersizer-2000 (Malvern Panalytical, Westborough, MA, USA) laser particle size analyzer.

2.5. Fractal Dimension Calculation

The application of fractal theory to quantitatively describe soil structure characteristics offers distinctive advantages. Specifically, it reveals the fractal relationship between the cumulative volume distribution of soil particles and the average particle size [20]:
V ( r < d i ) V a = d i d m a x 3 D
where di is the particle size of soil particles, with its value taken as the average of di and di + 1 particle sizes; V(r<di) represents the cumulative volume percentage of particles smaller than di; Va is the sum of the volumes of soil particles of each size; dmax is the average diameter of the largest soil particle; D is the fractal dimension.
By taking the logarithm of both sides of Equation (1) and simplifying,
D = 3 l g V ( r < d i )   / V a l g ( d i / d m a x )
The soil mechanic composition data are utilized to calculate the lg(V(r<di)/Va) and lg(di/dmax) values for soil samples of varying particle sizes di. The slope L is determined through linear regression analysis using the least squares method, and the soil fractal dimension is given by D = 3 − L.

2.6. Data Analysis

Statistical analysis was conducted using Microsoft Excel 2016. Pearson correlation analysis was used to analyze the relationship between different soil particle sizes and fractal dimensions. The experimental setup diagram was drawn using AutoCAD 2021. Experimental results were plotted using Origin 2021.
Kostiakov model [21]:
I = K t α
where i is the cumulative infiltration amount, cm; t is the infiltration time, min; K represents the fitting index; α represents the empirical index.

3. Results

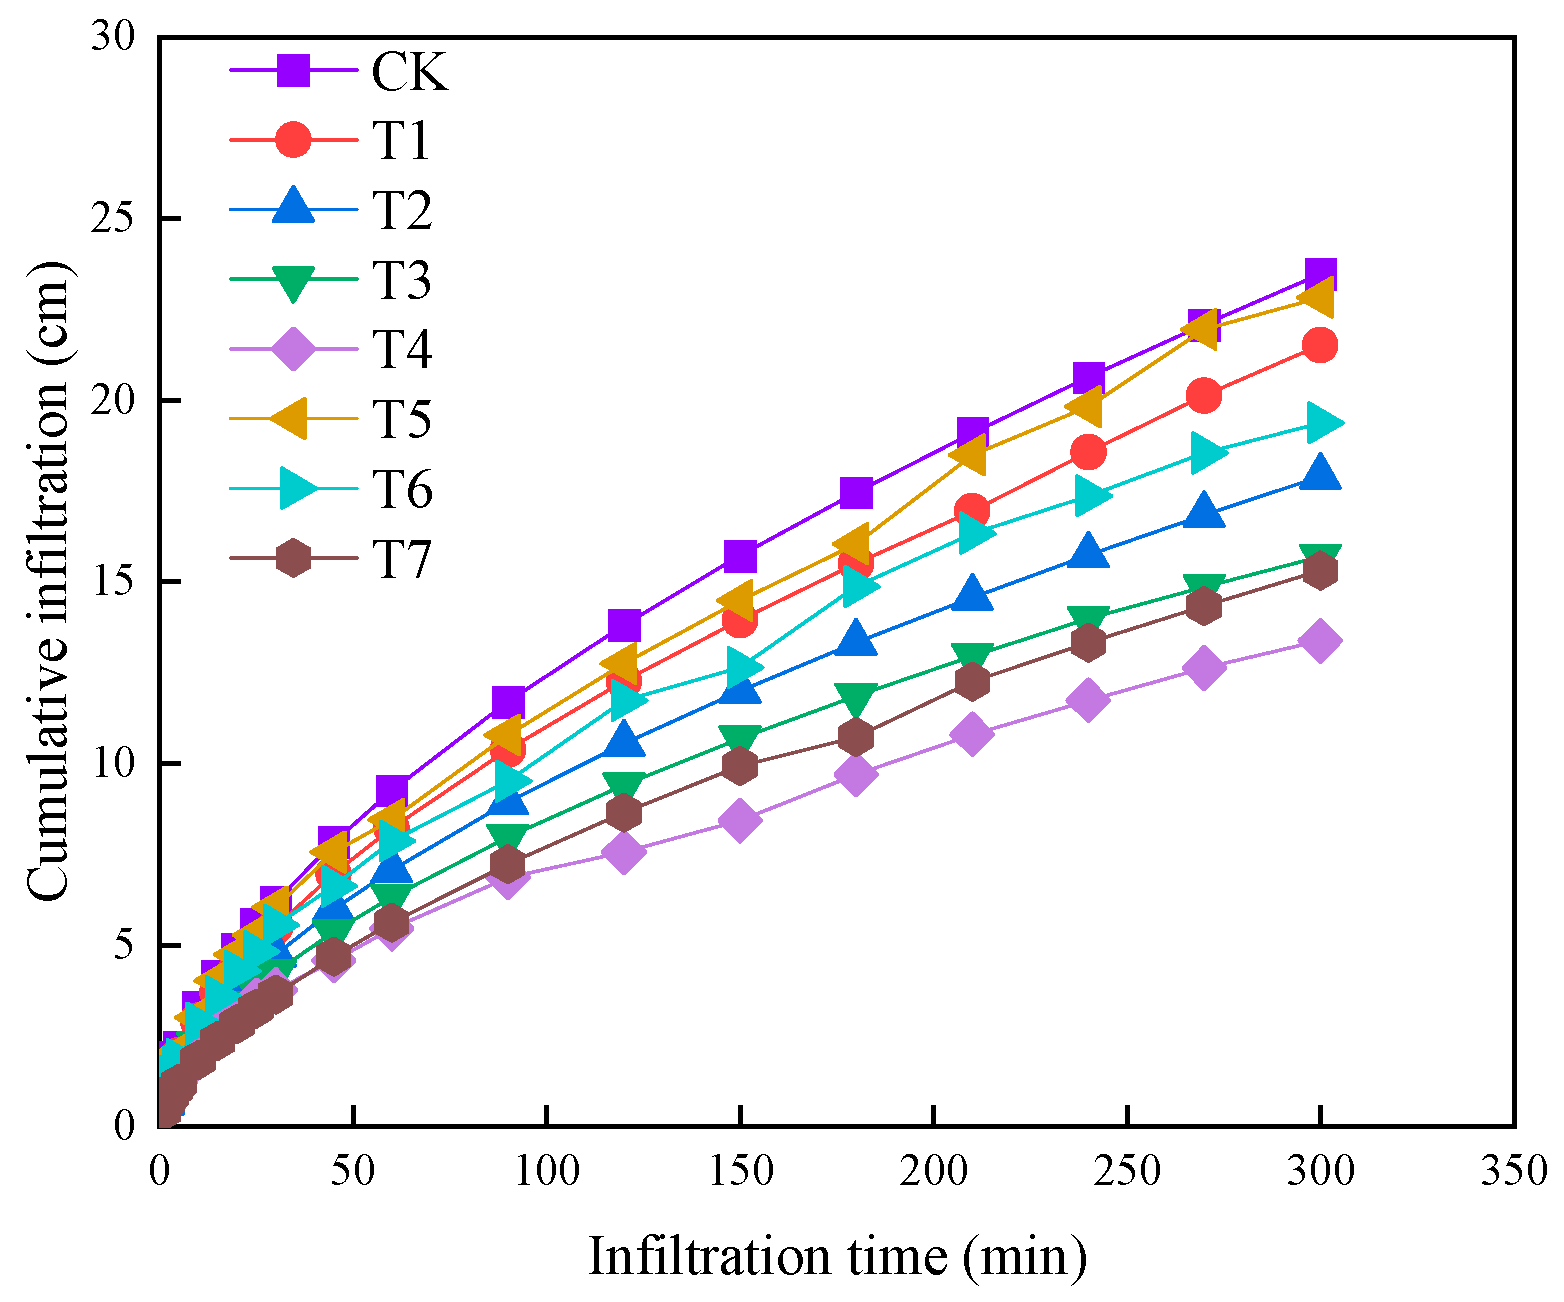
3.1. Cumulative Infiltration Amount

The curve depicting the cumulative infiltration amount with different treatments over time is illustrated in Figure 3. It is evident from the graph that as the experiment progresses, the cumulative infiltration amount for different treatments gradually increases. The cumulative infiltration amount at the experiment’s conclusion decreases from 23.47 cm to 21.51 cm, 17.70 cm, 15.68 cm, and 13.38 cm, corresponding to muddy water sediment concentrations of 0 (CK), 3% (T1), 6% (T2), 9% (T3), and 12% (T4), with reduction rates of 8.33%, 23.74%, 33.16%, and 43.01%, respectively. The increase in physical clay content in muddy water leads to a gradual decrease in cumulative infiltration amount. Specifically, increasing the physical clay content from CK to 9.13% (T5), 16.46% (T6), 27.34% (T2), and 44.02% (T7) successively results in decreased cumulative infiltration amounts of 23.47 cm, 22.83 cm, 19.37 cm, 17.90 cm, and 15.31 cm, with reduction rates of 2.72%, 17.46%, 23.74%, and 34.78% upon completion of irrigation.
The measured data from various treatments in Figure 3 were fitted using the Kostiakov model, with the results presented in Table 3. The determination coefficients for the fitting of cumulative infiltration amount against infiltration time (t) were all above 0.99, demonstrating a high level of accuracy in the Kostiakov model. The value of K decreases with increasing concentrations of muddy water sediment and physical clay content, while α remains relatively constant.

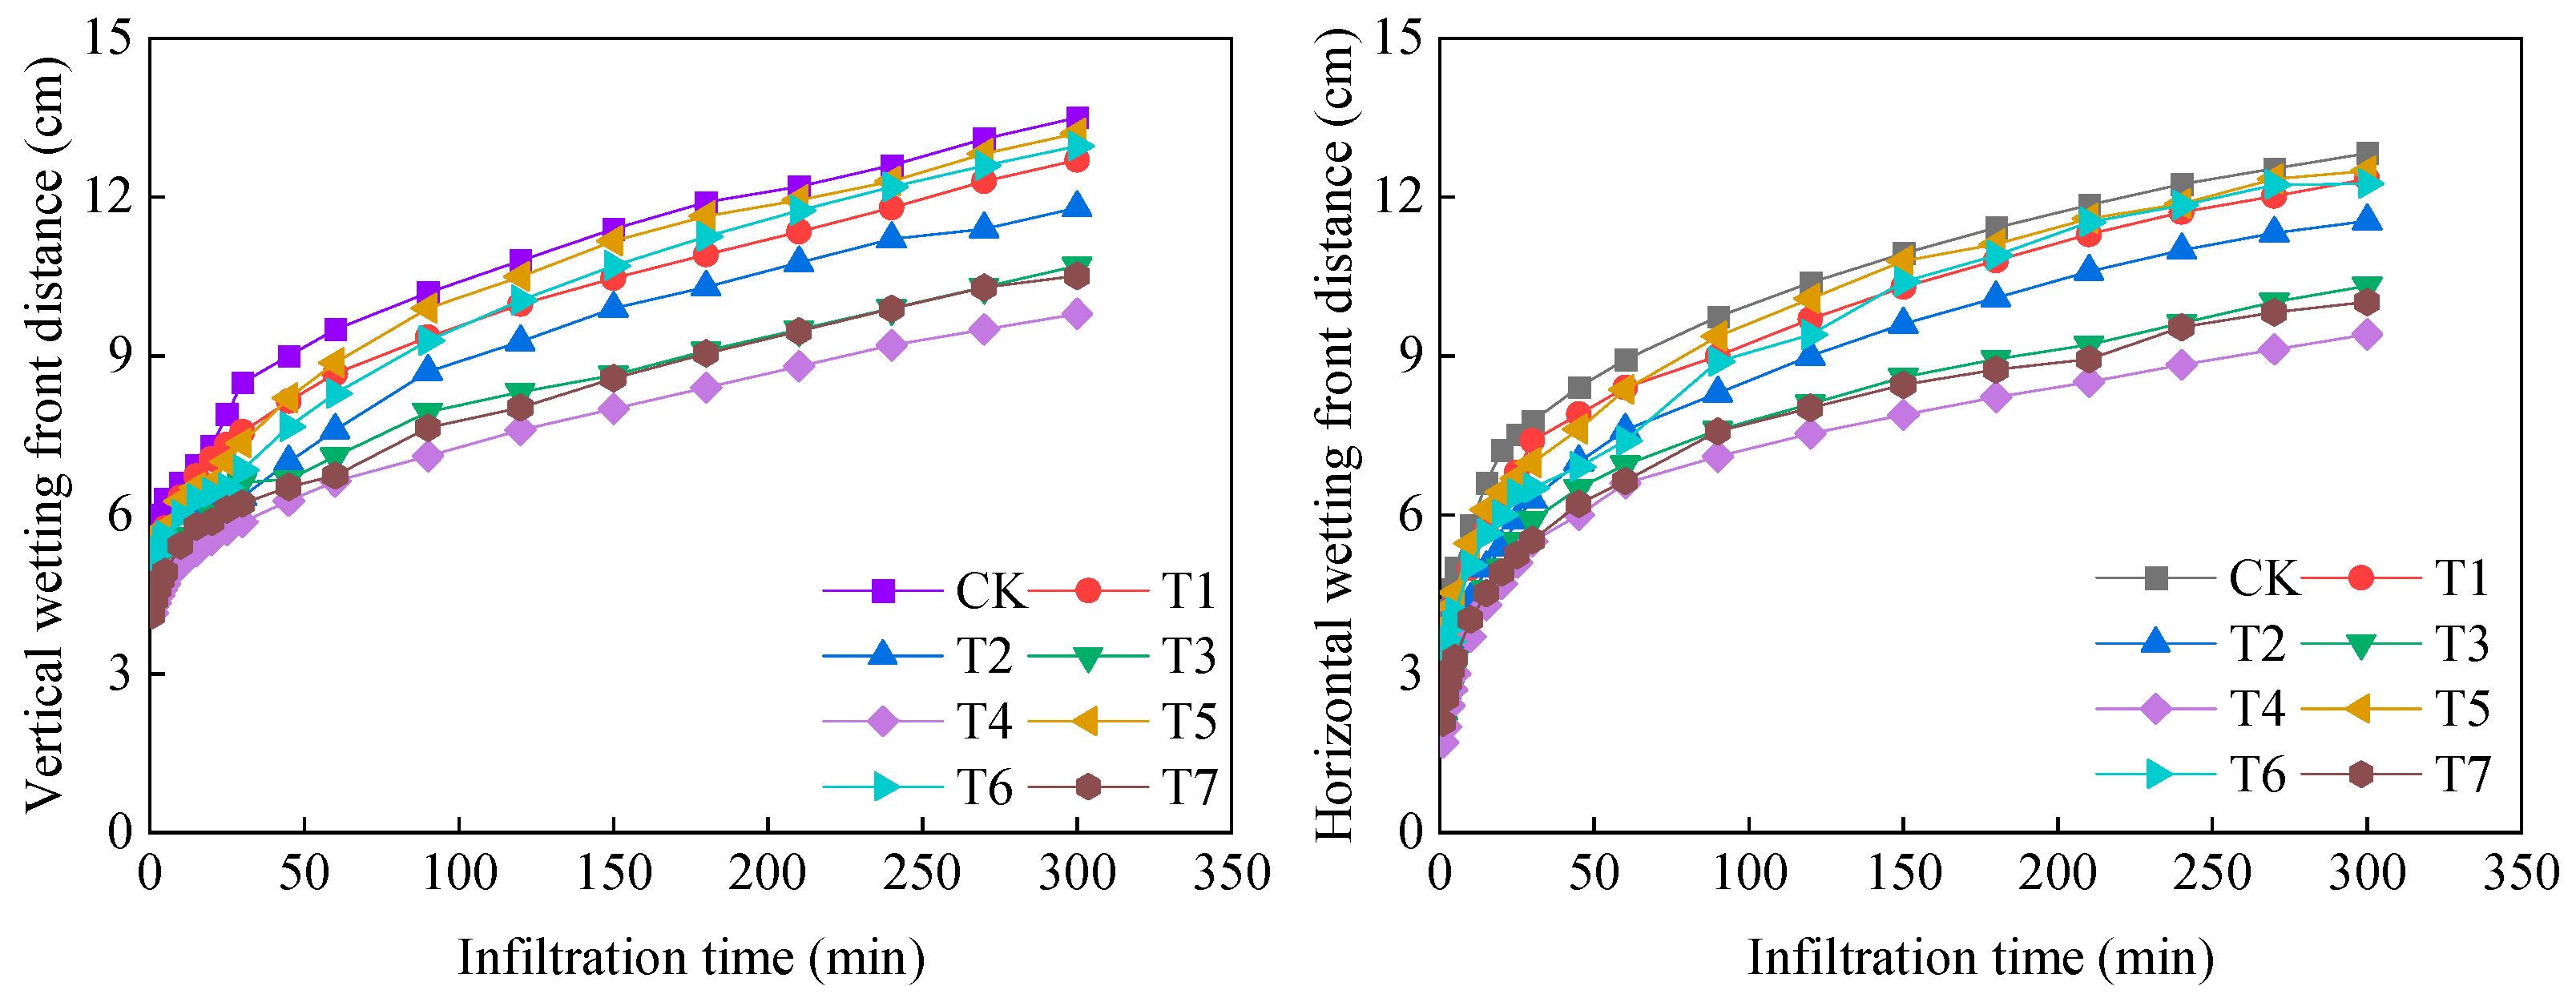
3.2. Wetting Front Distance

The wetting front migration curves in the horizontal and vertical directions under different treatments are presented in Figure 4. The graphs indicate a gradual decrease in the migration speed of the wetting front with the increasing duration of the experiment. Furthermore, higher concentrations of muddy water sediment result in shorter distances of wetting front migration for a given infiltration time. Towards the end of the experiment, compared to the control group (CK), the horizontal distances of wetting front migration for T1, T2, T3, and T4 decreased by 3.82%, 9.98%, 19.49%, and 26.66%, respectively, while the vertical distances decreased by 5.93%, 12.59%, 20.74%, and 27.41%. Additionally, an increase in physical clay content leads to a reduction in the distance of wetting front migration. Specifically, as the physical clay content increases from 0% to 44.02%, the horizontal migration distance at the end of the experiment decreases from 12.83 cm to 10.2 cm; similarly, the vertical migration distance decreases from 13.50 cm to 10.52 cm.

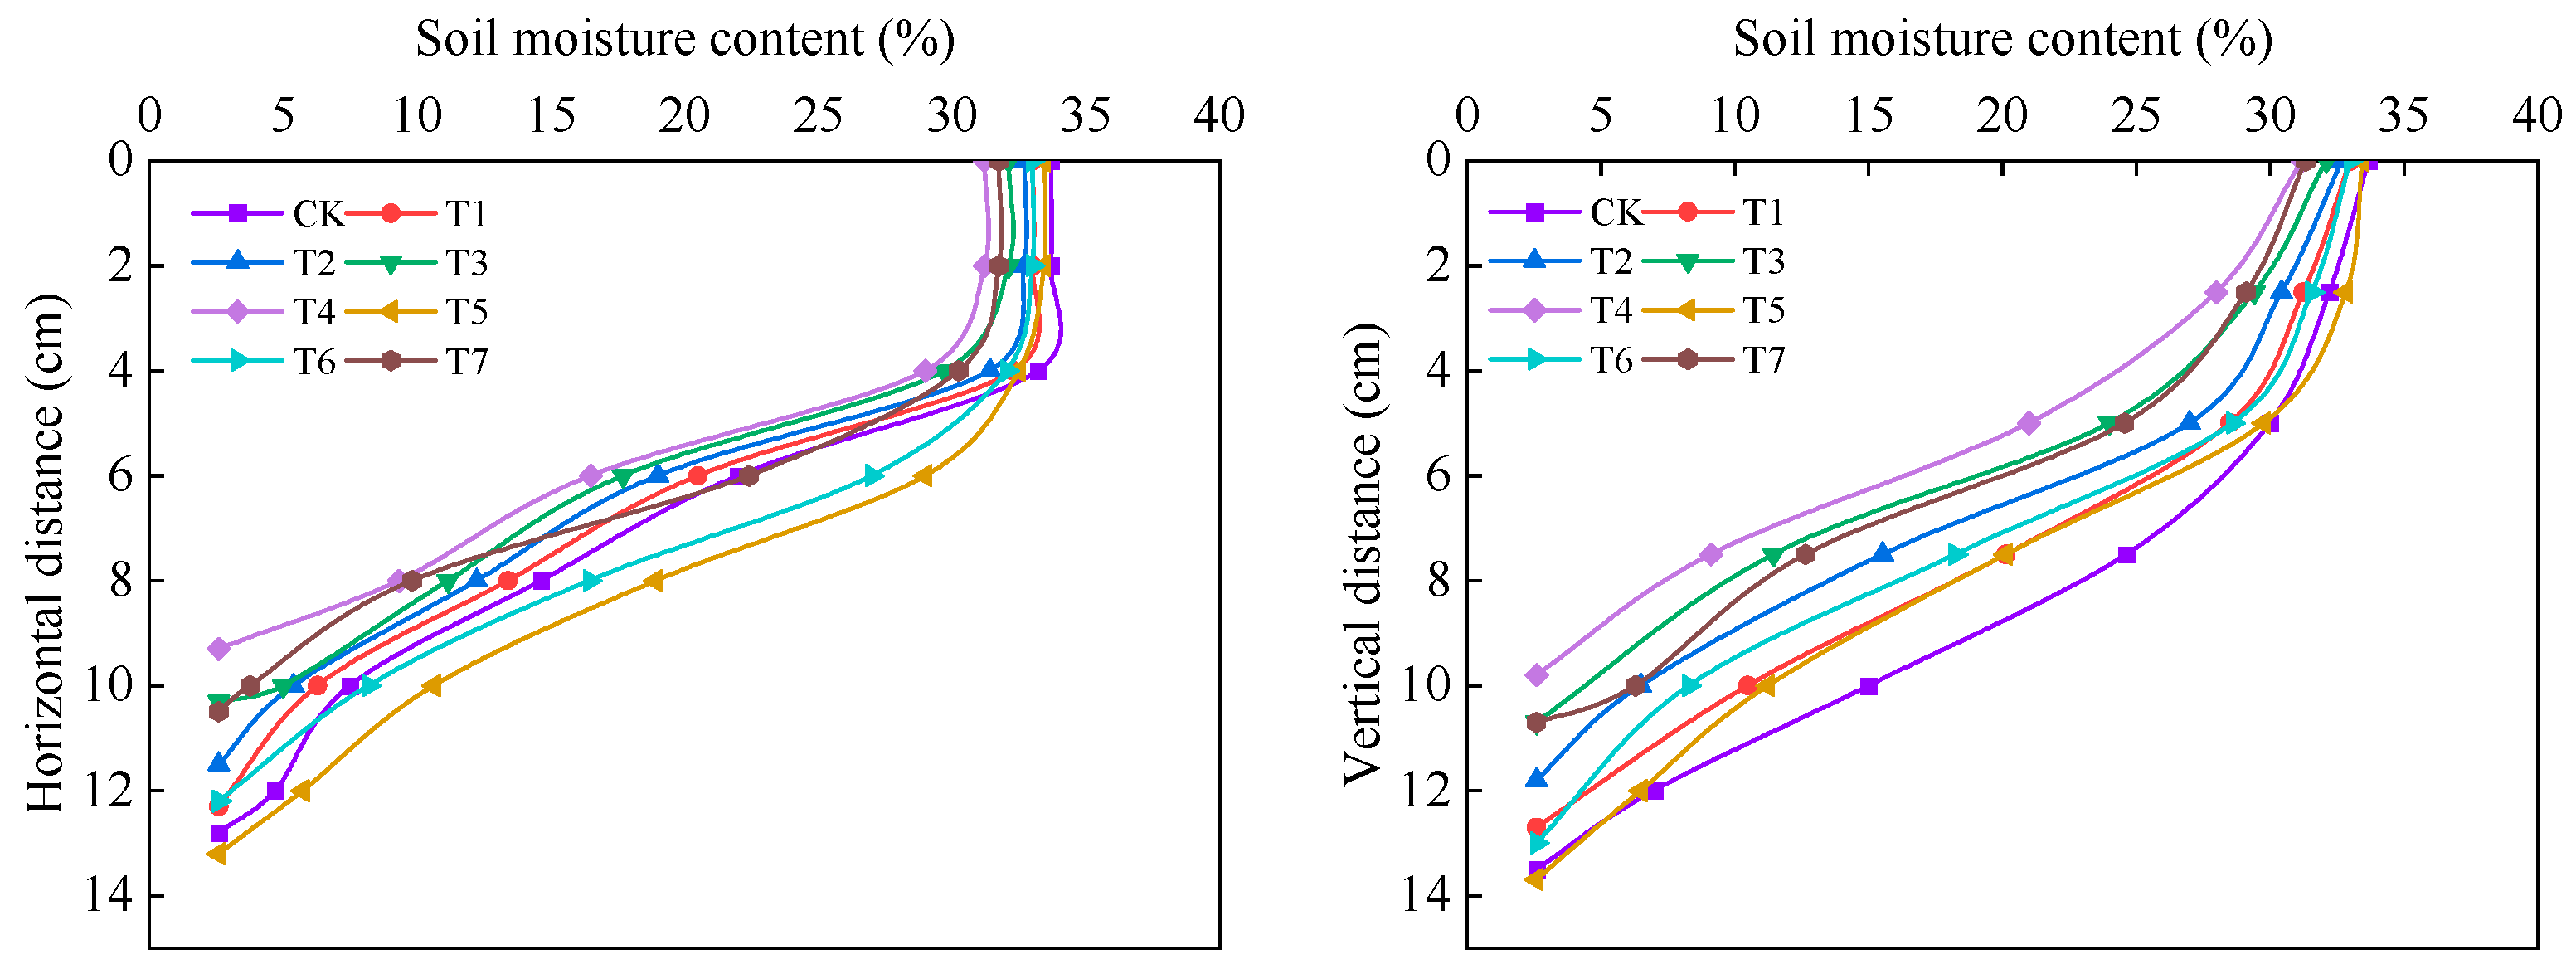
3.3. Soil Moisture Content Distribution

Figure 5 illustrates the soil moisture content distribution in both horizontal and vertical directions around the film hole after different infiltration treatments. The graph shows a gradual decrease in soil moisture content as the distance from the film hole center increases, returning to near initial levels. Additionally, higher sediment concentrations in muddy water led to decreased soil moisture content at the same depth. For instance, at a distance of 8 cm from the film hole center, the soil moisture content values for the CK, T1, T2, T3, and T4 treatments in the horizontal direction are 14.64%, 13.41%, 12.23%, 11.17%, and 9.34%, respectively. Compared to CK, the T1, T2, T3, and T4 treatments exhibit reductions of 8.41%, 16.46%, 23.71%, and 36.21%, respectively. Similarly, at a depth of 7.5 cm in the vertical direction, T1, T2, T3, and T4 treatments show decreases in soil moisture content of 18.26%, 37.01%, 53.53%, and 63.03%, respectively, compared to the clear water CK treatment.
The particle size distribution of muddy water significantly affects soil moisture content. As the physical clay content in muddy water increases, soil moisture content at the same infiltration depth gradually decreases. The soil layers of each treatment near the initial moisture content approach the center of the film hole. For instance, at a distance of 8 cm from the center of the film hole, the horizontal soil moisture content values for treatments T5, T6, T2, and T7 are 18.93%, 16.45%, 12.23%, and 9.82%, respectively. Taking T5 as the reference, the reductions in soil moisture content for T6, T2, and T7 are 13.10%, 29.53%, and 48.12%, respectively. In the vertical direction, the soil moisture content values for treatments T5, T6, T2, and T7 are 20.14%, 18.24%, 15.52%, and 12.66%, respectively. Relative to T5, the soil moisture content decrease for T6, T2, and T7 is 9.43%, 22.94%, and 37.14%, respectively.

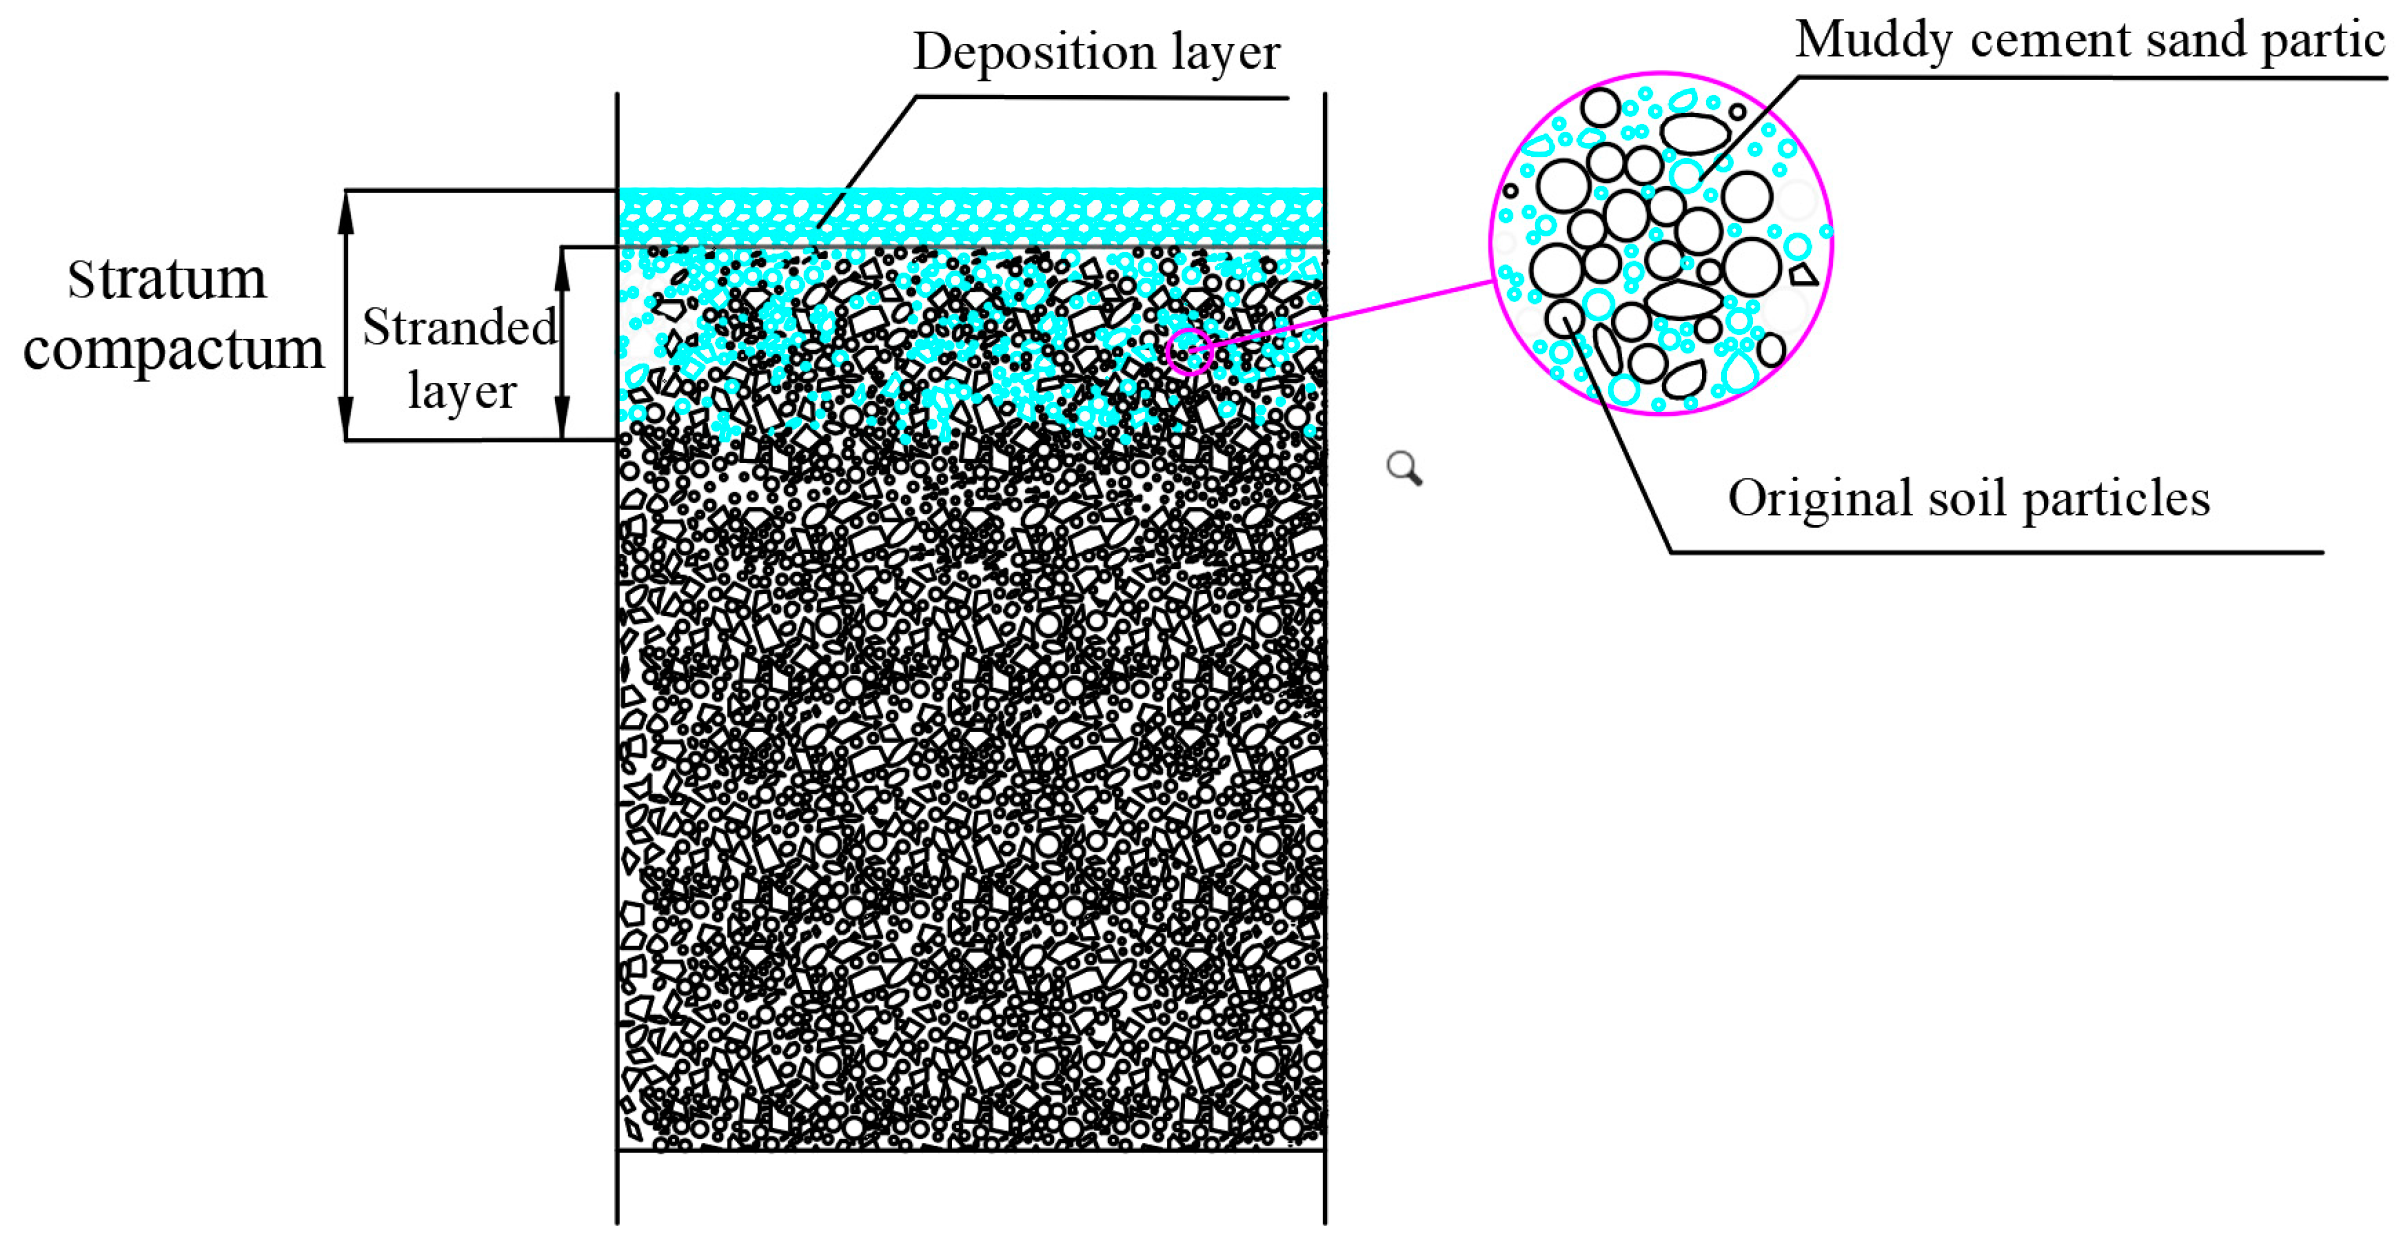
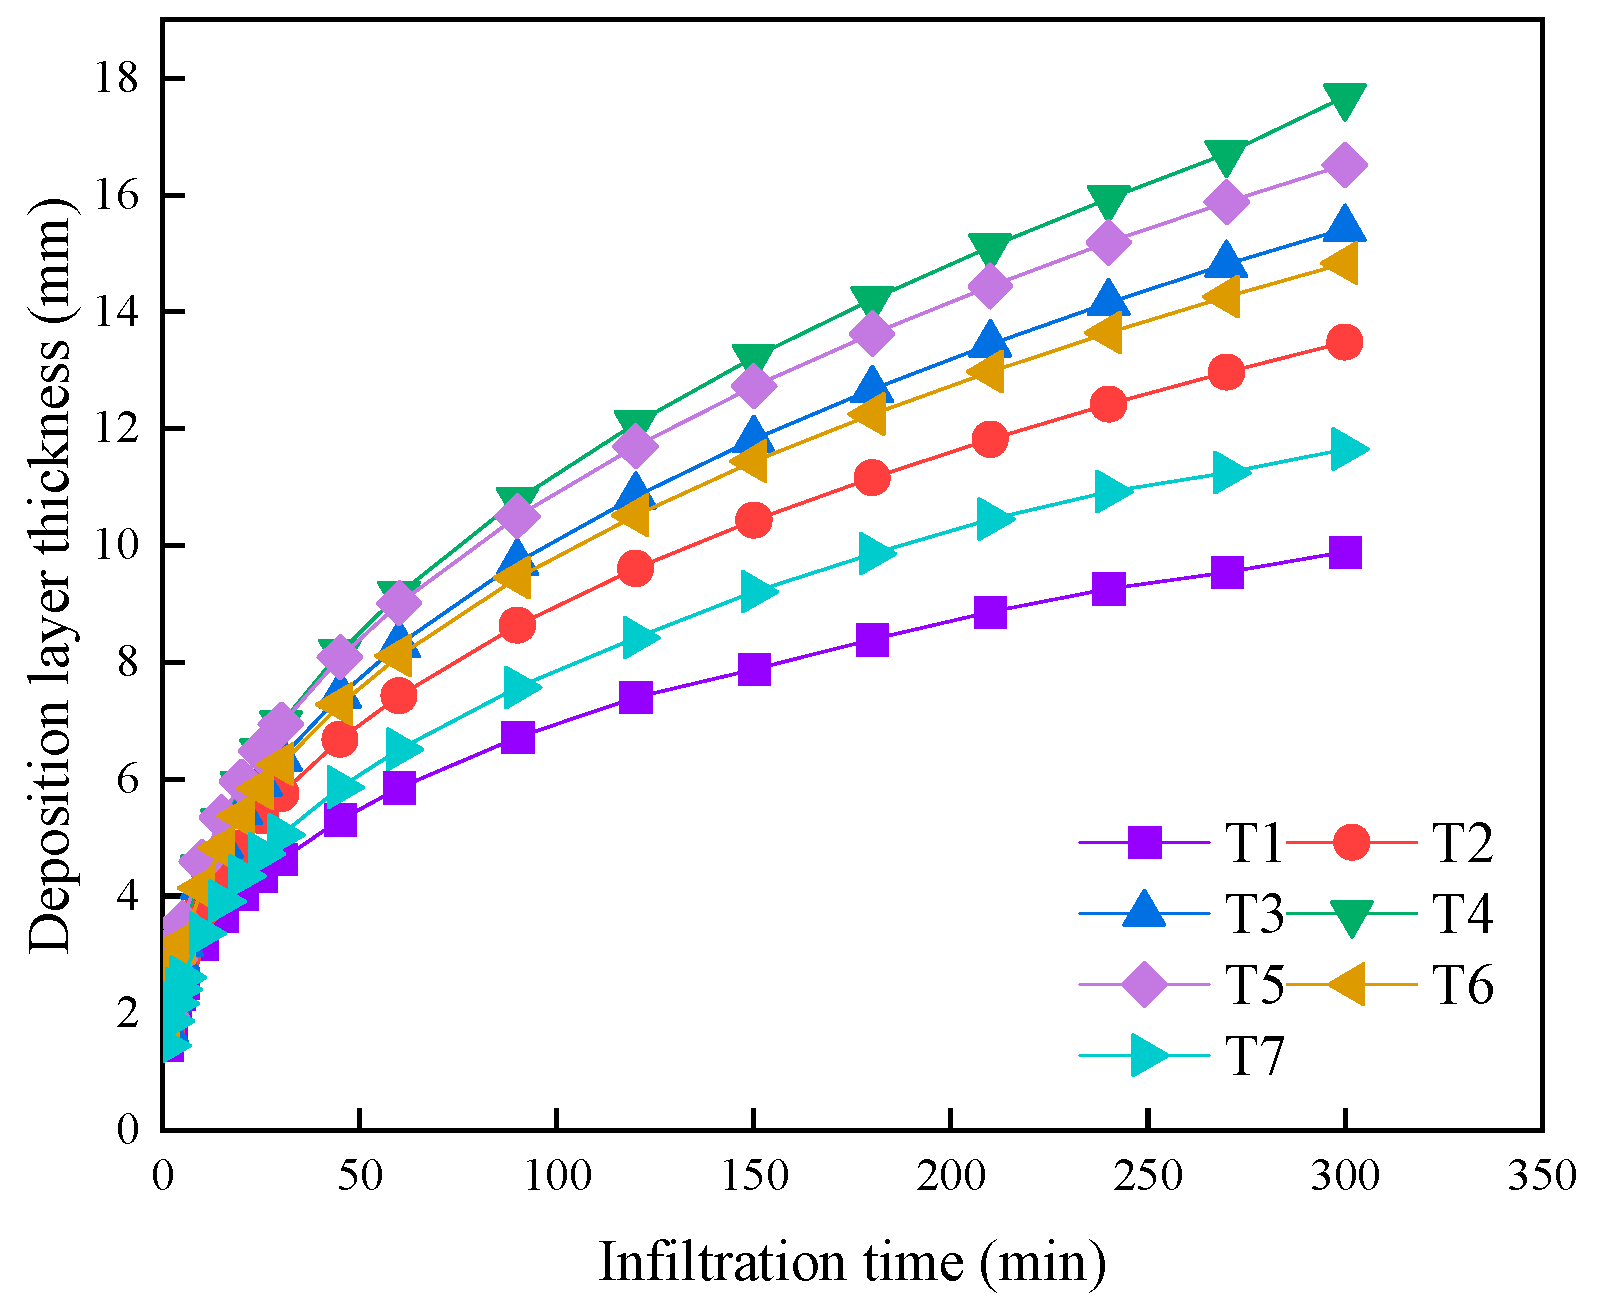
3.4. Deposition Layer Thickness

Figure 6 illustrates the relationship between the thickness of the deposition layer and the infiltration time under various treatments. The graph depicts a continuous increase in deposition layer thickness throughout the experiment. Initially, sediment deposition layer thickness increases rapidly, but the rate of increase gradually diminishes over time. By the experiment’s conclusion, the deposition layer thicknesses for treatments T1, T2, T3, and T4 are 9.89 mm, 13.49 mm, 15.43 mm, and 17.68 mm, respectively. A higher physical clay content in the muddy water results in a thinner deposition layer for the same infiltration time. The deposition layer thicknesses at the end of infiltration for treatments T5, T6, T2, and T7 are 16.52 mm, 14.83 mm, 13.49 mm, and 11.65 mm, correspondingly.
Through research and analysis, we have discovered that the thickness of the deposition layer is linked to the infiltration time in a power function relationship.
H = a t b
where H is the deposition layer thickness, mm; t is the infiltration time, min; a, b are fitting coefficients.
The results of the fitting are presented in Table 4. The determination coefficients R2 for the fitting are all above 0.99, indicating a strong fitting effect of the power function. The parameters a and b exhibit an increase with rising muddy water sediment concentration, while they decrease with higher physical clay content.
Fitting parameters a and b, using power functions based on muddy water sediment concentration and physical clay content, are determined as follows:
a = A e B ρ + C d 0.01
b = D e E ρ + F d 0.01
where ρ is the muddy water sediment concentration, %; d0.01 is the physical clay content, %; A, B, C, D, E, and F are fitting parameters. Based on Equations (5) and (6), a fitting for ρ and d0.01 is achieved:
a = 1.7998 e 0.0330 ρ 0.0138 d 0.01 , R 2 = 0.9474
b = 0.3382 e 0.0062 ρ 0.003 d 0.01 , R 2 = 0.8677
The determination coefficients R2 for Equations (7) and (8) are both above 0.85, demonstrating a strong fit. By combining Equations (7) and (8), we can derive a relationship model relating the thickness of the deposition layer to the infiltration time across varying levels of muddy water sediment concentration and physical clay content.
H = 1.7998 e 0.0330 ρ 0.0138 d 0.01 t 0.3382 e 0.0062 ρ 0.0003 d 0.01

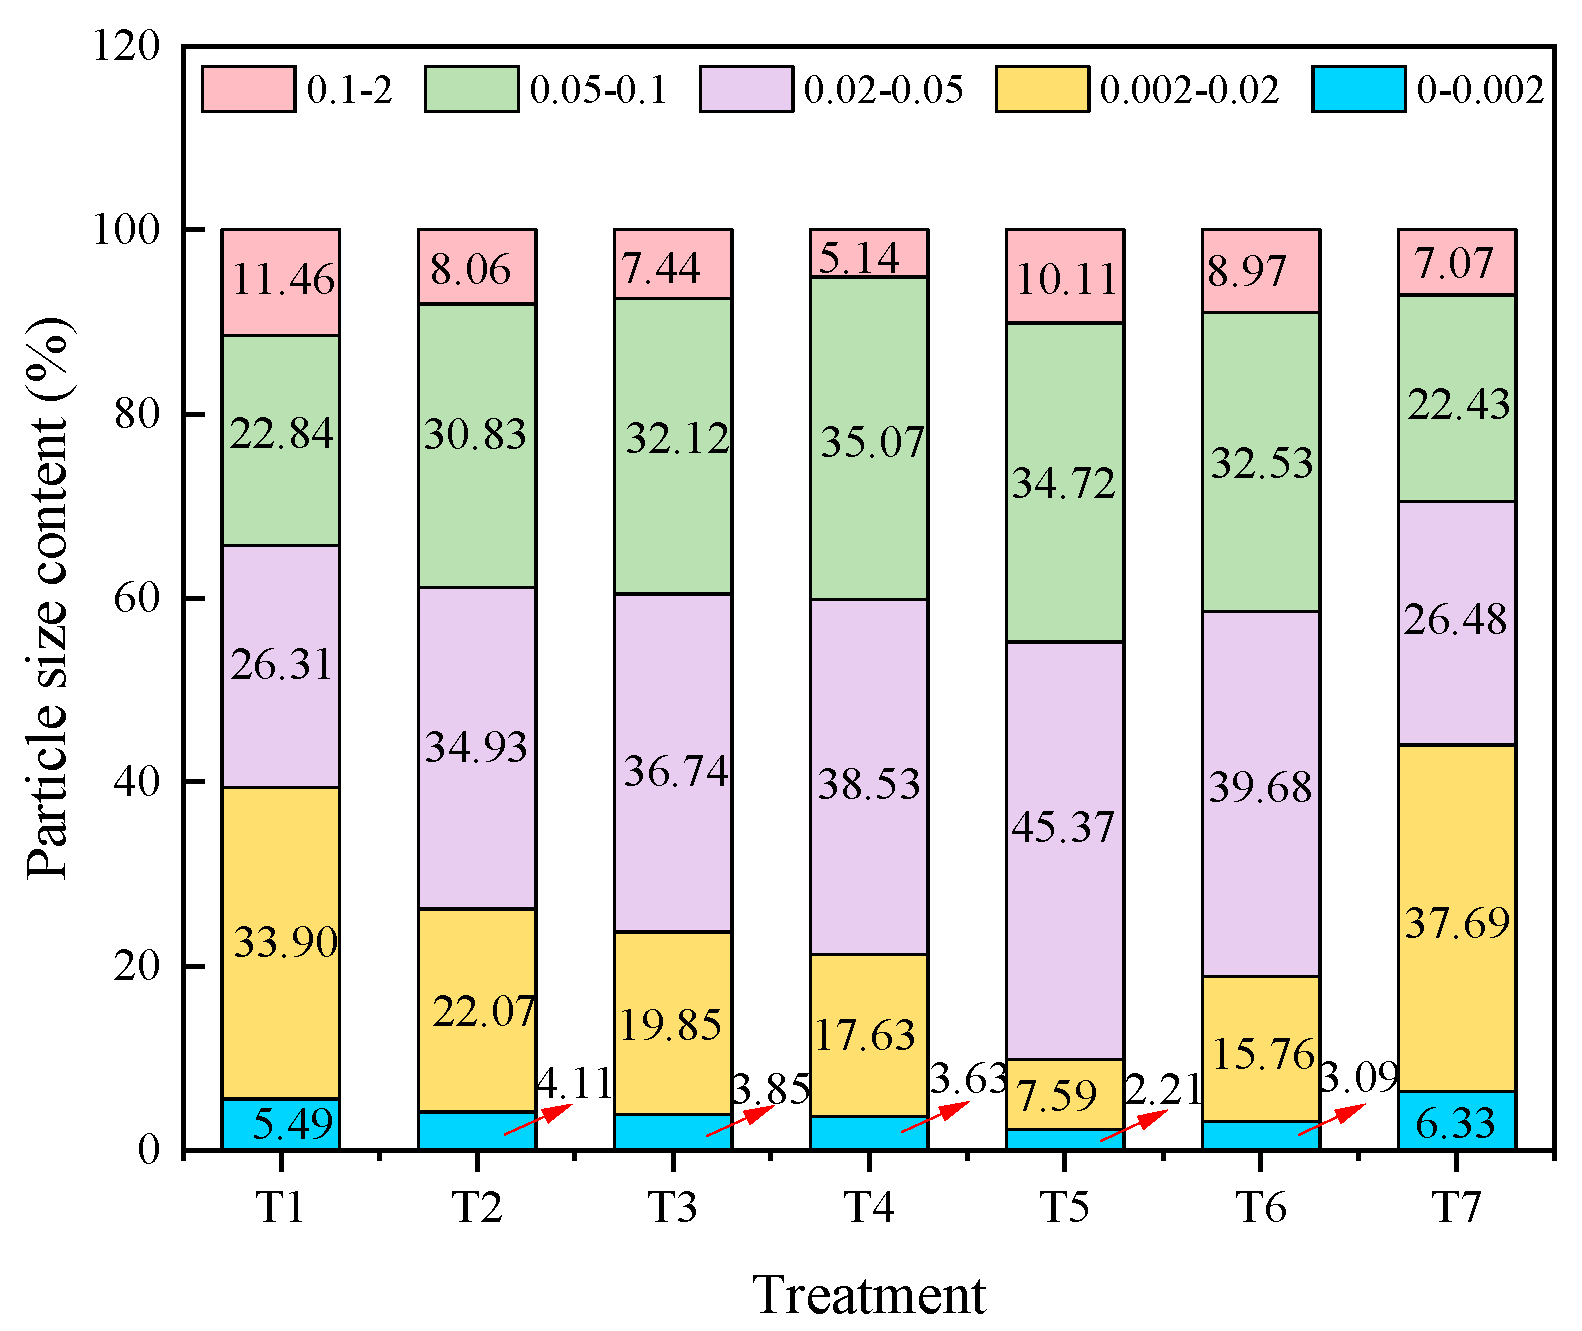
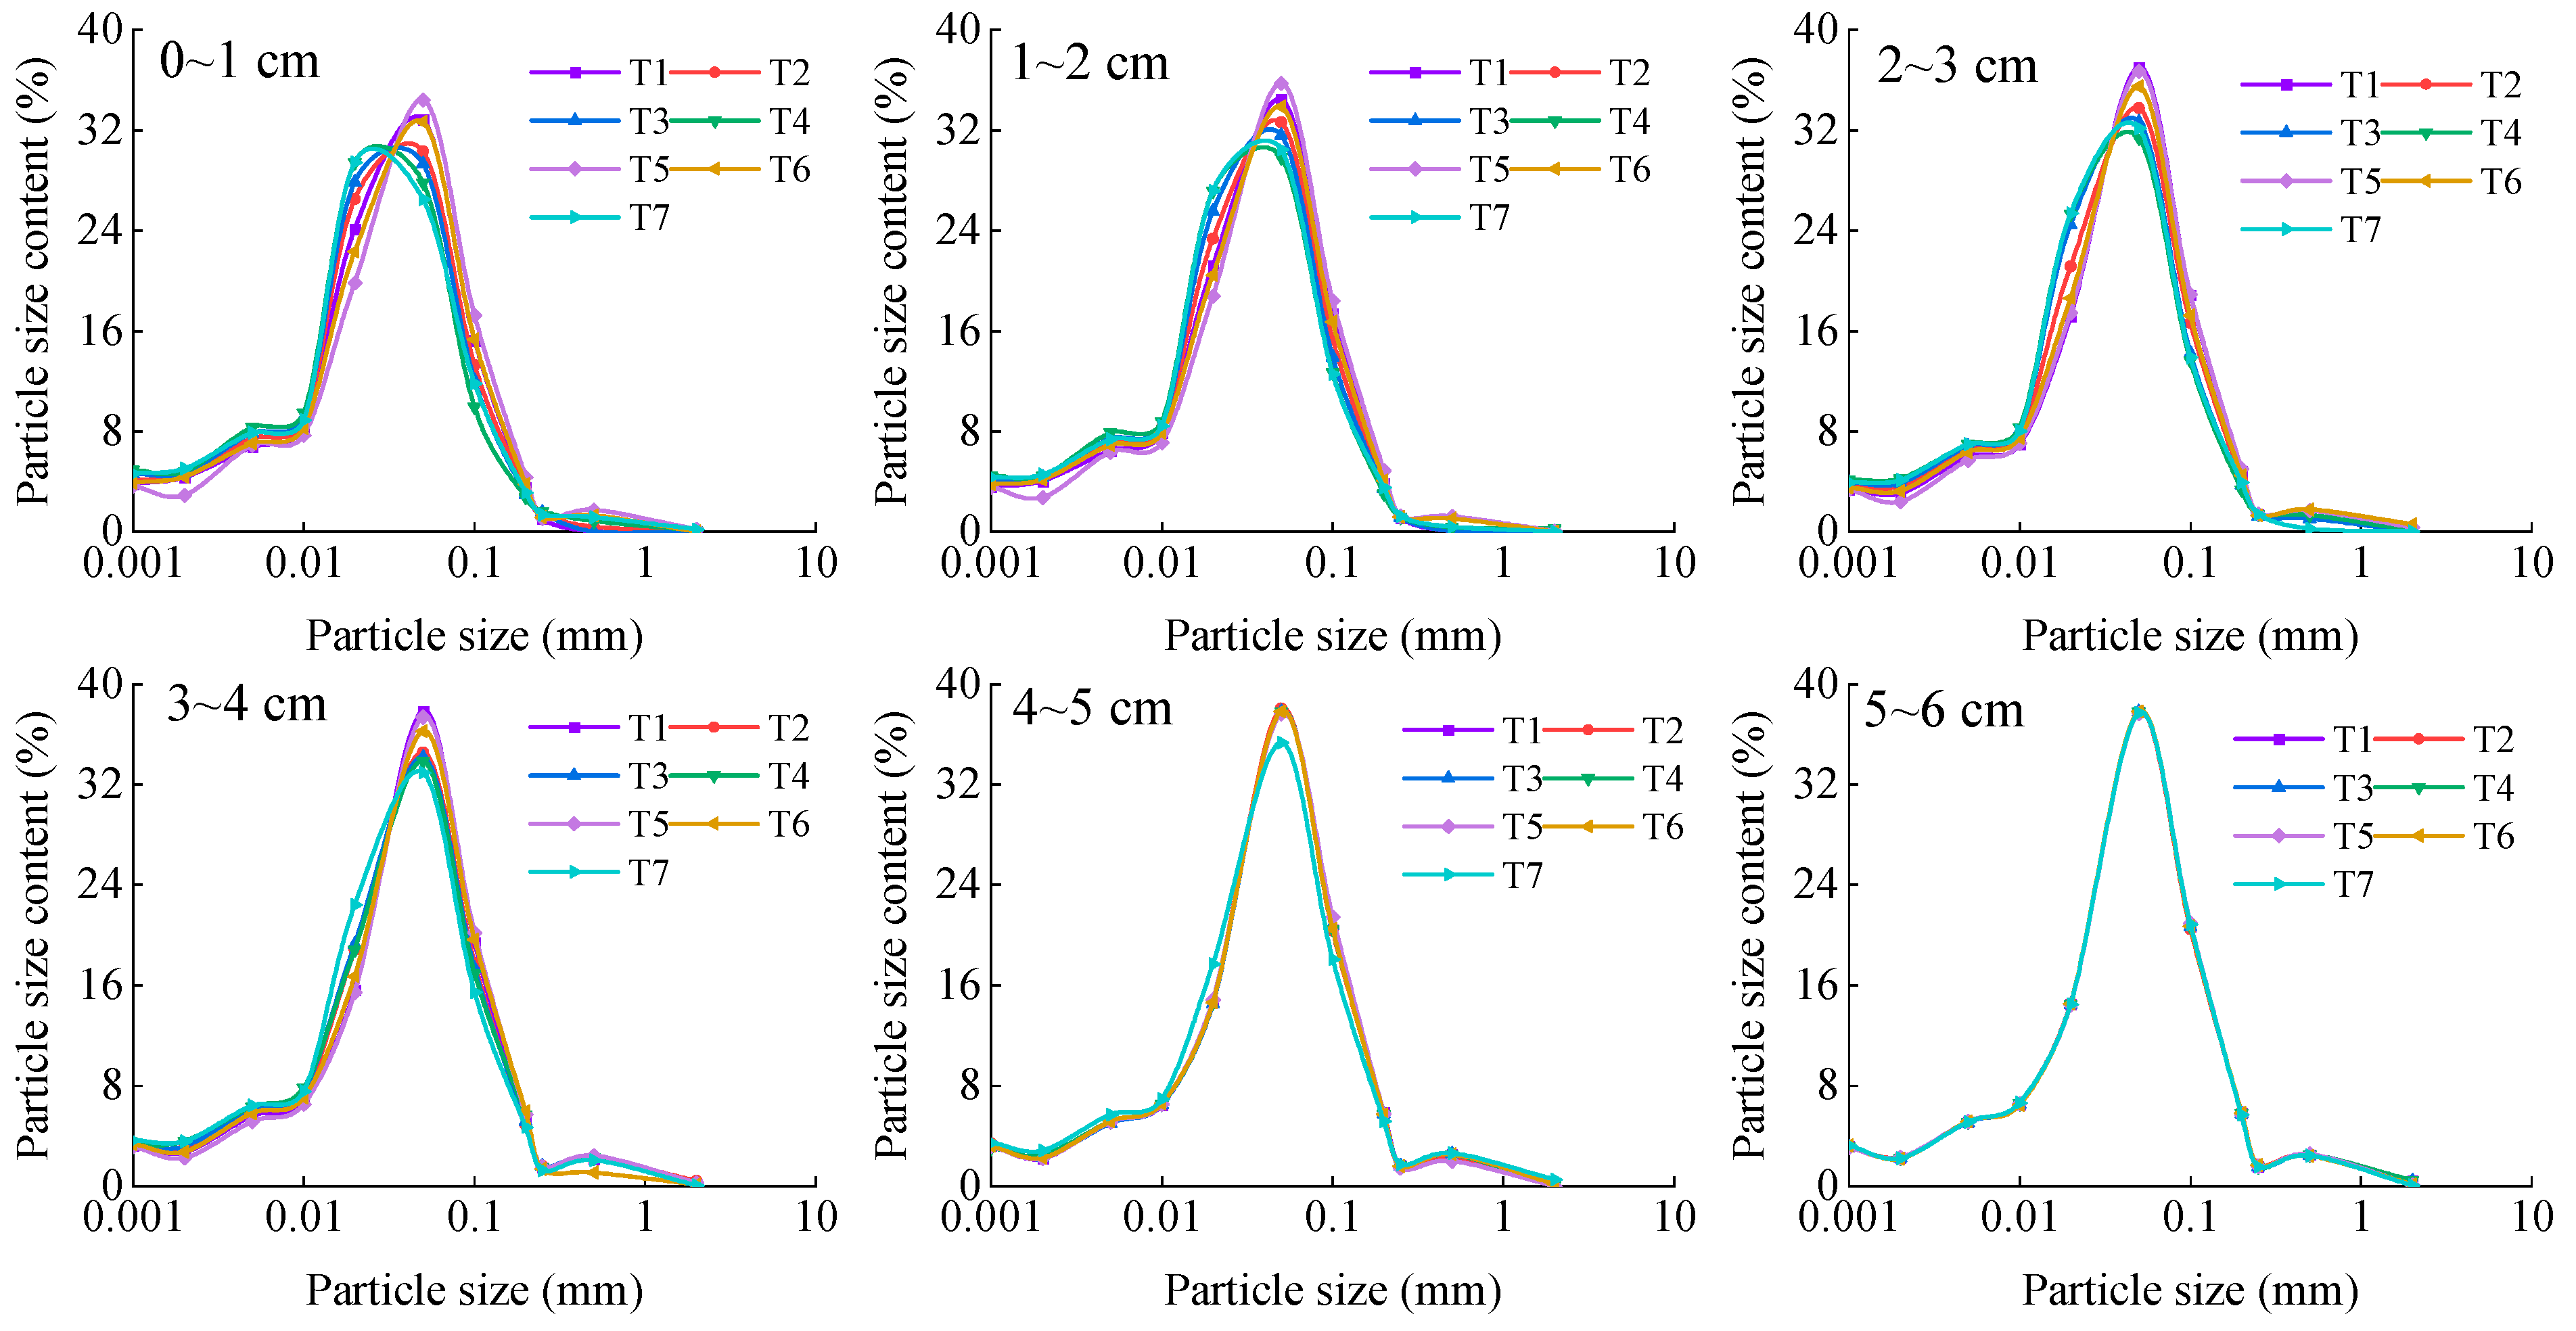
3.5. Composition of Stratum Compactum Soil Particles

3.5.1. Deposition Layer Soil Particles

Figure 7 shows that after irrigation, the deposition layer has lower fine particle (0–0.002 mm) content but higher coarse particle content compared to the original muddy water. This suggests that some fine particles infiltrated the original soil while coarse particles settled on the soil surface. The clay content in the deposition layer for T1, T2, T3, and T4 decreased by 31.89%, 49.01%, 52.23%, and 54.71%, respectively; the silt content decreased by 35.22%, 57.83%, 62.07%, and 66.31%, respectively, while the sand content increased by 53.02%, 86.37%, 92.63%, and 98.79%, respectively, compared to the original muddy water. Additionally, the physical clay content of T1, T2, T3, and T4 decreased by 19.75%, 39.21%, 43.82%, and 50.91%, respectively. For T5, T6, T2, and T7, the clay content in the deposition layer decreased by 72.59%, 61.67%, 49.02%, and 21.49%, respectively; the silt content decreased by 85.50%, 69.94%, 57.83%, and 27.98%, respectively; the sand content increased by 127.74%, 104.97%, 86.38%, and 41.34%, respectively; and the physical clay content decreased by 47.75%, 42.76%, 39.21%, and 29.63%, respectively.

3.5.2. Stranded Layer Soil Particles

Figure 8 displays the particle size distribution curve of the stranded layer under different treatments. The chart illustrates that by the end of the experiment, the stranded layer with varying sediment concentrations contains more fine soil particles but fewer coarse particles compared to the original soil content. Sediment concentration notably influences the soil particle size distribution of the stranded layer. As the concentration of muddy water sediment increases, more sediment particles infiltrate the soil, leading to an increase in silt and clay content in the stranded layer once the water supply for the experiment ceases. This results in a decrease in the proportion of sand particles, particularly in the 0–2 cm layer.
As the experiment progresses, the fine particle content in the soil layer farther away from the center of the membrane pore gradually decreases, while the coarse particle content increases. The various particle contents of the wet body gradually reach equilibrium with the original soil. At a depth of 3–4 cm, the particle analysis results of the T1 treatment closely resemble those of the original soil, indicating the 0–4 cm depth as the stranded layer range for the 3% sediment concentration treatment. Similarly, the particle analysis results of the T2, T3, and T4 treatments at a depth of 4–5 cm mirror those of the original soil, suggesting the 0–5 cm depth as the stranded layer range for the 6%, 9%, and 12% sediment concentration treatments.
After different sizes of muddy water particles infiltrate, the fine particle content in the soil layer after infiltration is higher than that of the original soil, while the coarse particle content is lower. As the physical clay content increases, more fine particles from the muddy water enter the soil, leading to an increase in silt and clay content in the soil layer after infiltration, and a decrease in sand content, particularly at depths of 0–2 cm.
With increasing physical clay content in muddy water, the amount of physical clay in the soil after infiltration also increases. This suggests that a higher relative content of physical clay in muddy water results in more physical clay particles entering the soil with infiltrating water, leading to a higher content in the stranded soil layer. Granule analysis of treatment T5 at 3~4 cm depth shows similarity to the original soil, defining a stranded layer range for the treatment with 9.13% physical clay content at 0~4 cm depth. Similarly, granule analysis of soil at 4~5 cm depth for treatments T6 and T7 with physical clay content of 16.45% and 44.02% resembles the original soil, defining a stranded layer range for treatments at 0~5 cm depth with physical clay contents of 16.45% and 44.02%.

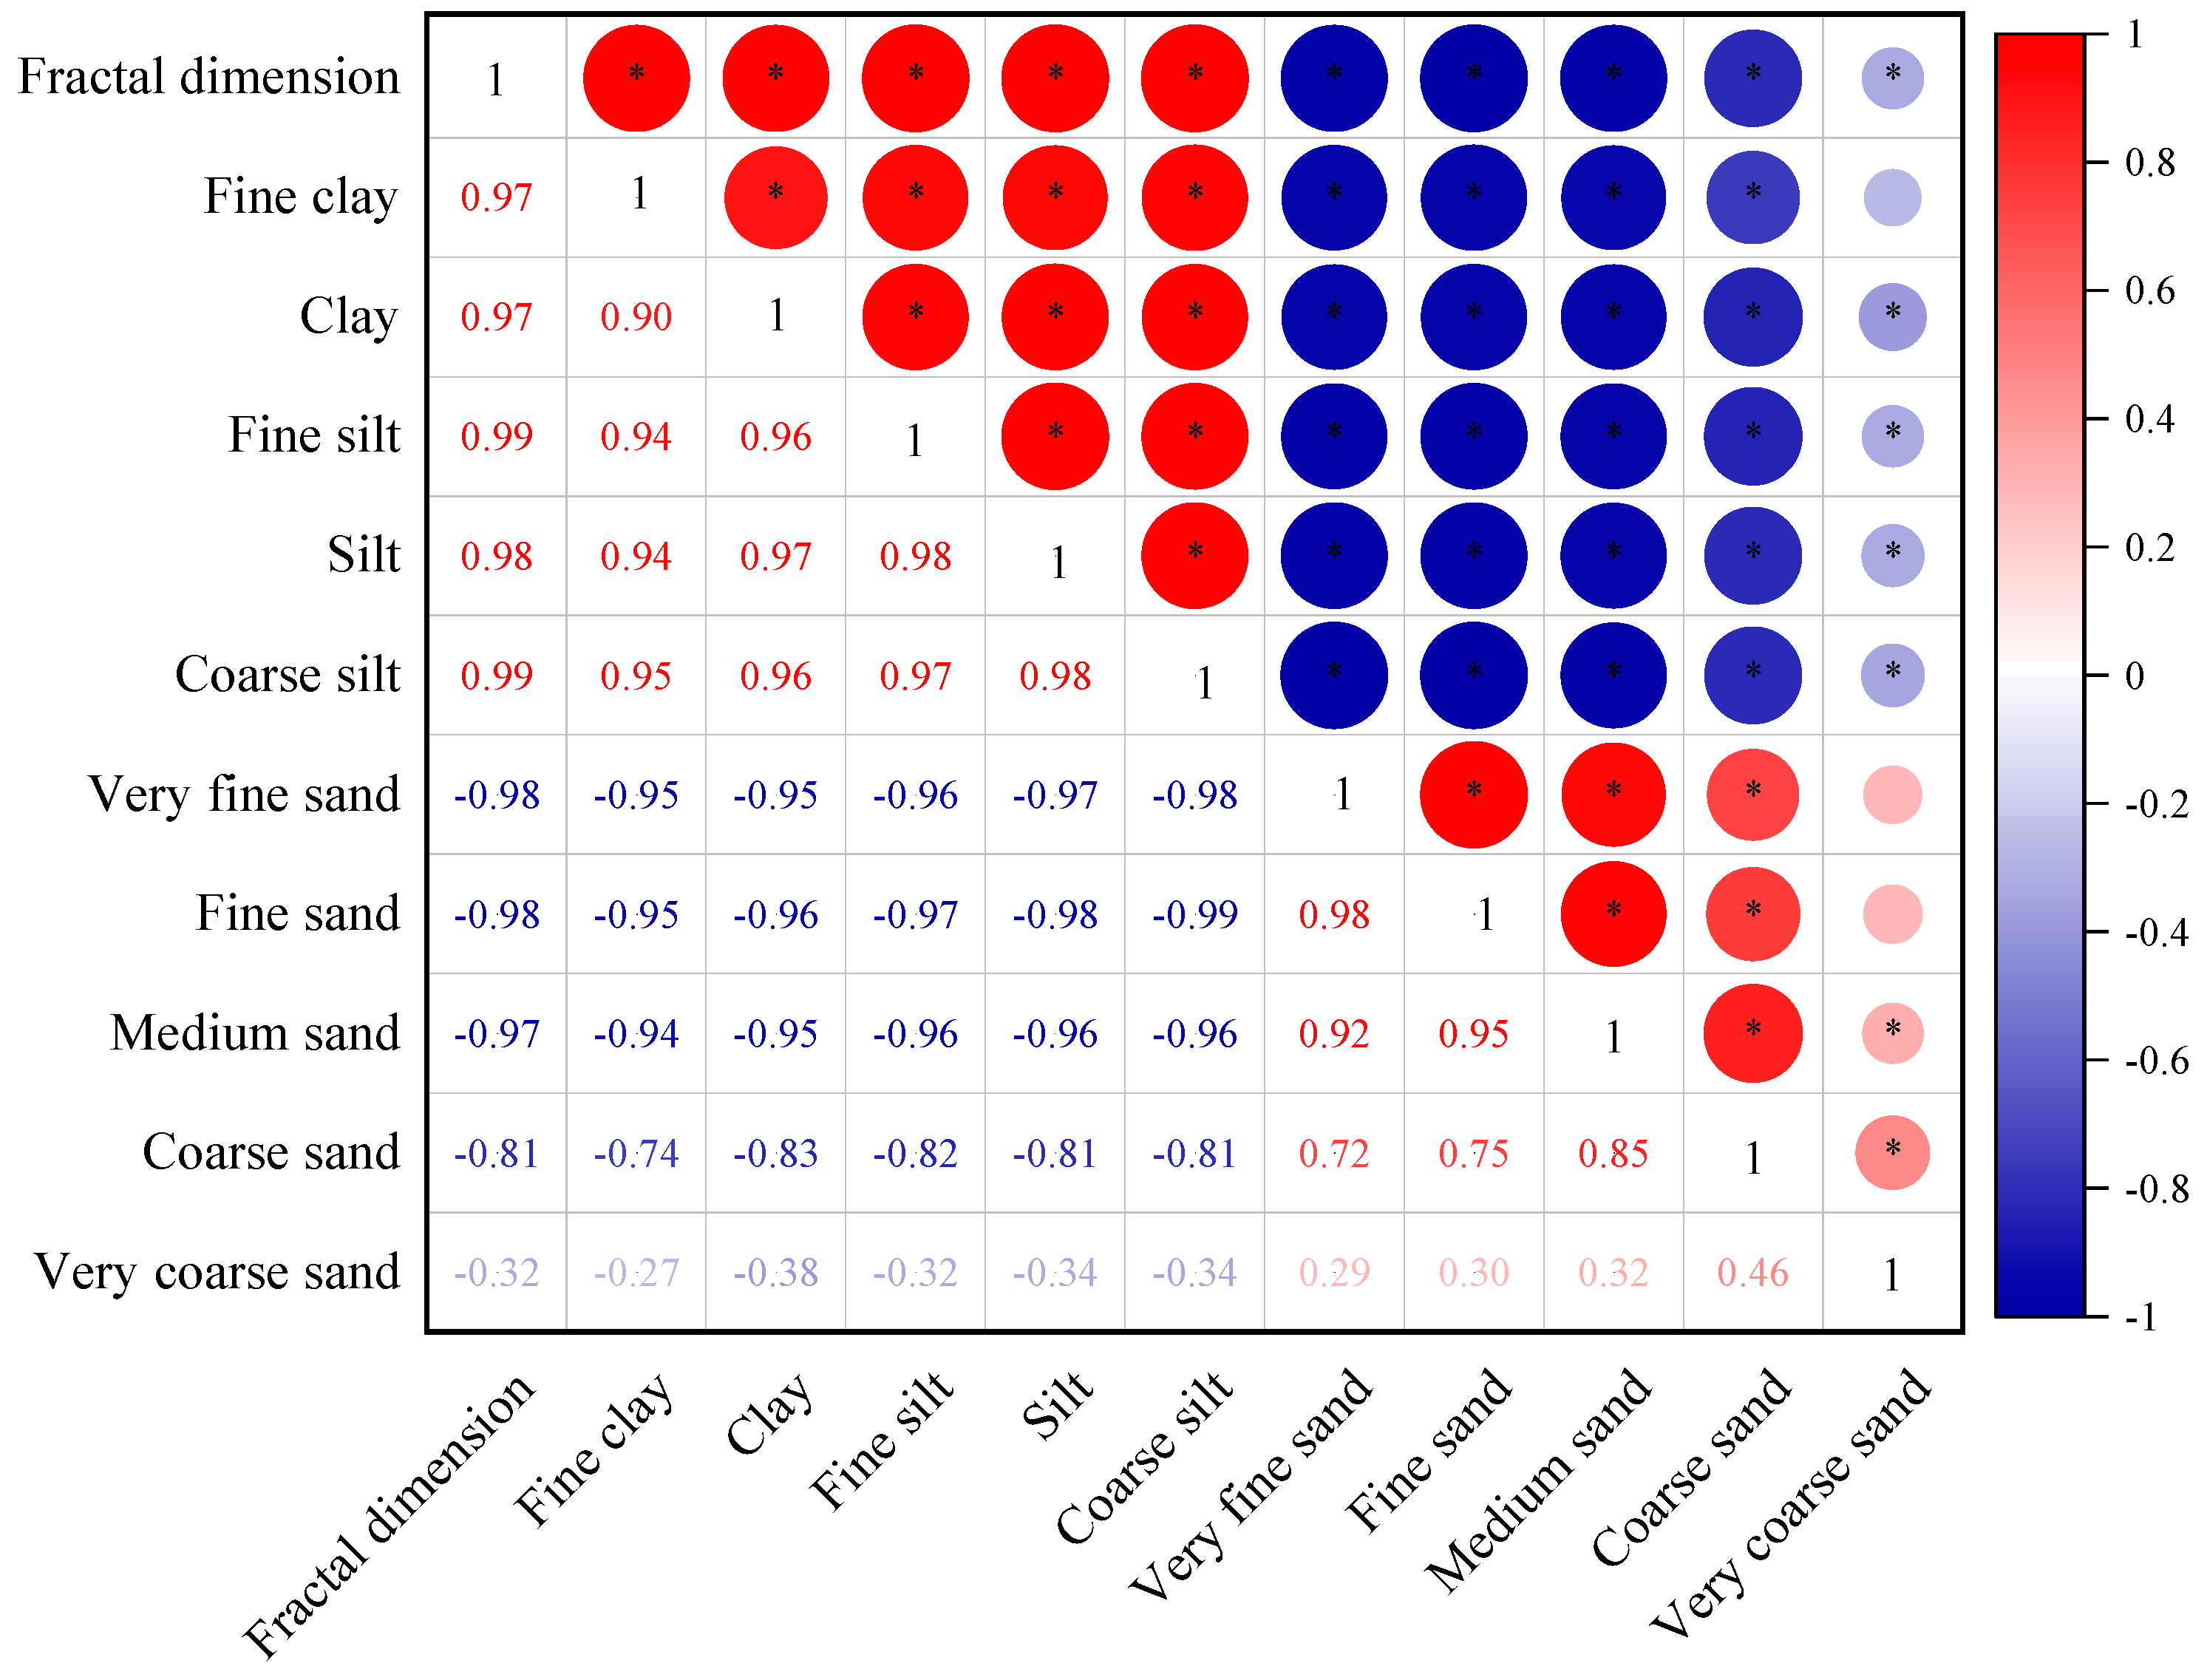
3.5.3. Soil Particle Fractal Dimension of the Stranded Layer

One of the inherent properties of soil is its fractal characteristics, and applying fractal theory allows for studying the soil’s structural properties. To investigate the impact of muddy water characteristics on the fractal dimension of soil particles in the film hole infiltration stranded layer, the fractal dimensions of soil particles at various depths in the stranded layer were individually determined. The calculation results are presented in Table 5, with determination coefficients exceeding 0.85, indicating high fitting precision. The fractal dimensions of soil particles in the stranded layer exceed those of the original soil. As the depth of the stranded layer increases, the soil fractal dimension decreases until aligning with that of the original soil. Keeping the physical clay content constant, muddy water sediment concentration notably affects the fractal dimension of soil particles in the stranded layer, particularly within the 0–2 cm range. Relative to the original soil, the fractal dimensions of soil treatments T1, T2, T3, and T4 at 0–1 cm increased by 2.16%, 2.65%, 3.28%, and 3.41%, respectively, and at 1–2 cm increased by 1.65%, 2.19%, 2.58%, and 3.07%. This suggests that higher muddy water sediment concentrations result in larger fractal dimensions, differing significantly from those of the original soil. Conversely, when the sediment concentration is stable, the fractal dimension increases with rising physical clay content.
To investigate the relationship between soil particle composition and fractal dimension, a correlation analysis was performed on the fractal dimensions of soil particles at various positions within the stranded layer and the particle size distribution. The results are depicted in Figure 9, showing a significant positive correlation (p < 0.01) between fractal dimension and the volume percentages of fine clay (0~0.001), clay (0.001~0.002), fine silt (0.002~0.005), silt (0.005~0.01), and coarse silt (0.01~0.02). A highly significant negative correlation (p < 0.01) was observed between fractal dimension and the volume percentages of very fine sand (0.02~0.05), fine sand (0.05~0.1), medium sand (0.1~0.2), coarse sand (0.2~0.5), and very coarse sand (0.5~2).

4. Discussion

Plastic film mulching is a widely used method for conserving water and soil moisture in regions with water scarcity around the world [22,23]. This study focuses on the water resource shortage and high sand content in irrigation water in the northwest irrigation area of China. It introduces the innovative film hole irrigation technology, which effectively addresses water scarcity in northern China and holds significant scientific importance. This research indicated that using muddy water for irrigation significantly reduced the infiltration capacity of film hole irrigation. As the concentration of sediment in muddy water increased, both cumulative infiltration and the distance of wetting front migration decreased. This was attributed to the thicker deposition layer formed by higher sand content in muddy water during the infiltration process, elongating the water infiltration path and decreasing soil infiltration capacity. Moreover, an increase in physical clay content in muddy water led to a gradual decrease in cumulative infiltration. This study revealed that a higher physical clay content resulted in more fine particles entering soil pores during infiltration, thickening the stranded layer and further reducing soil infiltration capacity.
The stratum compactum, formed by sediment particles suspended in muddy water on the soil surface, plays a critical role in water infiltration [24]. This study categorized the stratum compactum into two components for analysis: the deposition layer and the stranded layer. The research revealed that, following irrigation, the thickness of the deposition layer increased with sediment concentration in the muddy water but decreased with higher physical clay content. This was because as the sediment concentration rose, more fine particles were trapped in the soil, reducing pore space and leading to increased deposition on the soil surface. Conversely, higher physical clay content resulted in a lower proportion of coarse particles in the muddy water. During infiltration, a greater amount of fine particles entered the soil pores to form the stranded layer, while only a small portion of coarse particles settled on the soil surface as the deposition layer.
In addition, in this study, the relative content of fine particles (0–0.002) in the deposition layer was lower than that in sediment particles of muddy water. This indicated that the sediment in muddy water was not simply deposited on the soil surface. Instead, some fine particles infiltrated into the upper layer of the soil along with percolating water, leaving behind the remaining fine sediment to directly settle on the surface soil to form the deposition layer. This was consistent with the study by Zhong et al. [25]. With the increase in muddy water sediment concentration and physical clay content in muddy water, the content of clay and silt in the deposition layer decreased, while the content of sand increased. This might be because with a muddy water sediment concentration, more sediment particles in the muddy water were retained in the soil during the infiltration process, resulting in a lower content of fine particles in the deposited soil and a higher relative content of coarse particles. The higher the relative content of physical clay particles in muddy water sediment, the more fine sediment particles entered the soil and got trapped in the soil during the early stage of infiltration, making the soil denser. Some fine particles had difficulty continuing to enter the soil pores, eventually accumulating on the soil surface as part of the deposition layer. On the other hand, with the lower relative content of physical clay particles in muddy water sediment, most fine particles entered the soil pores along with the infiltrated water. Therefore, the higher the relative content of physical clay particles in muddy water sediment, the higher the relative content of physical clay particles in the deposition layer.
The stranded layer exhibited a significantly higher relative content of fine soil particles compared to the original soil, along with a significantly lower relative content of large particles. This resulted in an increase in soil clay content and a decrease in sand content, reflecting a refinement in particle composition. This observation further confirmed the presence of retention during water infiltration, wherein some fine particles from the muddy water infiltrated the original soil. The relative content of fine particles in the stranded layer increased with the increase in the sediment concentration and physical clay content of the muddy water, indicating that the higher the muddy water sediment concentration, the finer the sediment particles, and the more obvious the retention phenomenon, leading to more fine particles entering the original soil.
The fractal dimension of soil particles in the stranded layer was greater than that of the original soil due to its high dependence on fine particles [26,27]. During muddy water retention, fine particles infiltrated the soil, increasing their relative content and consequently raising the soil particle fractal dimension. This change in the fractal dimension reflected alterations in soil particle properties. Following muddy water infiltration, the original soil particle properties exhibited a finer texture and higher relative content of fine particles. The soil fractal dimension decreased as the depth of the stranded layer increased until it aligned with that of the original soil, suggesting that muddy water infiltration affected only the particle properties of the upper original soil, specifically those of the “stranded layer” as defined in this study. The fractal dimension showed a significant positive correlation with the content of clay and silt particles, indicating that coarser textures corresponded to smaller fractal dimensions, while finer textures resulted in larger fractal dimensions, consistent with prior research findings [28,29].

5. Conclusions

(1) The cumulative infiltration amount and wetting front distance decreased with the increase in muddy water sediment concentration and physical clay content in muddy water.
(2) The relative content of clay and silt in the deposition layer soil was lower than the sediment in the muddy water, and it increased with the increase in muddy water sediment concentration and physical clay content in muddy water. On the other hand, the stranded layer soil had a higher relative content of fine particles compared to the original soil. Clay and silt content also increased with the increase in sediment concentration and physical clay content in muddy water.
(3) The composition of soil particles in the stranded layer at a depth of 0–2 cm in the soil layer differed the most from the original soil. As the depth of the soil layer increased, the difference in soil particle composition from the original soil gradually decreased, and at a depth of 4–6 cm in the soil layer, the difference in soil particle composition from the original soil was relatively small.
(4) The fractal dimension of soil particles in the stranded layer was higher than that of the original soil. It decreased as the depth of the stranded layer increased, eventually matching the fractal dimension of the original soil. Additionally, the fractal dimension increased with higher sediment concentration and physical clay content. There was a strong positive correlation between the fractal dimension and the relative content of soil clay and silt particles, while a significant negative correlation existed with sand particles.

Author Contributions

Conceptualization, L.F.; methodology, Y.P. and R.X.; software, Q.W. and F.S.; validation, F.S. and R.Z.; formal analysis, Y.P.; investigation, L.F.; resources, L.F.; data curation, Y.P.; writing—original draft preparation, Y.P.; writing—review and editing, Y.P.; visualization, R.X.; supervision, R.Z.; project administration, L.F.; funding acquisition, L.F. All authors have read and agreed to the published version of the manuscript.

Funding

This research is supported by the National Natural Science Foundation of China (52079105), the Science and technology planning project of the Shaanxi Provincial Department of water resources (2024slkj-4), and the Doctoral Dissertations Innovation Fund of Xi’an University of Technology, China (310-252072215).

Institutional Review Board Statement

Not applicable.

Data Availability Statement

The data presented in this study are available upon request from the corresponding author.

Conflicts of Interest

The authors declare that they have no conflicts of interest in this research.

References

  1. Liu, S.S.; Gao, S.H.; Hsu, W.L.; Shiau, Y.C.; Liu, H.L. Mechanism Study on the Impact of China Population Structure Change on the Water Use of the Three Main Industries. Sustainability 2022, 14, 204. [Google Scholar] [CrossRef]
  2. Delpasand, M.; Bozorg-Haddad, O.; Loáiciga, H.A. Integrated virtual water trade management considering self-sufficient production of strategic agricultural and industrial products. Sci. Total Environ. 2020, 743, 140797. [Google Scholar] [CrossRef] [PubMed]
  3. Chen, L.N.; Zhao, Z.L.; Li, J.; Wang, H.M.; Guo, G.M.; Wu, W.B. Effects of muddy water irrigation with different sediment particle sizes and sediment concentrations on soil microbial communities in the Yellow River Basin of China. Agric. Water Manag. 2022, 270, 107750. [Google Scholar] [CrossRef]
  4. Chen, L.; Zhao, Z.L.; Guo, G.M.; Li, J.; Wu, W.B.; Zhang, F.X.; Zhang, X. Effects of muddy water irrigation with different sediment gradations on nitrogen transformation in agricultural soil of Yellow River Basin. Water Sci. Eng. 2022, 15, 228–236. [Google Scholar] [CrossRef]
  5. Chen, B.Q.; Liu, E.K.; Mei, X.R.; Yan, C.R.; Garré, S. Modelling soil water dynamic in rain-fed spring maize field with plastic mulching. Agric. Water Manag. 2018, 198, 19–27. [Google Scholar] [CrossRef]
  6. Yuan, Z.Q.; Zhang, R.; Wang, B.X.; Gao, B.Q.; Ayana, G.; Abera, D.; Ashraf, M.; Li, F.M. Film mulch with irrigation and rainfed cultivations improves maize production and water use efficiency in Ethiopia. Ann. Appl. Biol. 2019, 175, 215–227. [Google Scholar] [CrossRef]
  7. Wei, J.X.; Fei, L.J.; Liang, S.; Jie, F.L. Influence of Sediment Particle Size Distribution on Intermittent Infiltration of Water under Surge irrigation. J. Irrig. Drain. 2023, 42, 57–62. [Google Scholar] [CrossRef]
  8. Bouwer, H.; Ludke, J.; Rice, R.C. Sealing pond bottoms with muddy water. Ecol. Eng. 2001, 18, 233–238. [Google Scholar] [CrossRef]
  9. Nasirian, A.; Maghrebi, M.F.; Mohtashami, A. Numerical and Experimental Assessment of Suspended Material Effects on Water Loss Reduction from Irrigation Channels. Iran. J. Sci. Technol.-Trans. Civ. Eng. 2022, 46, 2483–2493. [Google Scholar] [CrossRef]
  10. Kang, S.X.; Fei, L.J.; Zhong, Y.; Zhao, P.H.; Yang, Z.; Fan, Q.W. A modified Green-Ampt infiltration model for muddy water. J. Hydrol. 2024, 629, 1306. [Google Scholar] [CrossRef]
  11. Jiang, R.R.; Fei, L.J.; Jin, S.J.; Fu, Y.L.; Zhong, Y. Effects of Silt Content and Clay and Sand Grade on Freedom Infiltration Characteristics of Muddy Water Film Hole irrigation. J. Soil Water Conserv. 2018, 32, 157–161. [Google Scholar] [CrossRef]
  12. Fei, L.J.; Wang, J.H. Effect of Clay and Sand Grades on Single-line Interference infiltration Characteristics of Muddy Water Film Hole Irrigation. Trans. Chin. Soc. Agric. Mach. 2016, 47, 105–112. [Google Scholar] [CrossRef]
  13. Zhong, Y.; Fel, L.J.; Kang, S.X.; He, J.; Zhu, S.J. Effect of soil bulk density on one-dimensional vertical infiltration and dense layer formation characteristics of muddy water. J. Arid Land Resour. Environ. 2022, 36, 91–98. [Google Scholar] [CrossRef]
  14. Liu, L.H.; Fei, L.J.; Chen, L.; Hao, K.; Zhang, Q.J. Effects of initial soil moisture content on soil water and nitrogen transport under muddy water film hole infiltration. Int. J. Agric. Biol. Eng. 2021, 14, 182–189. [Google Scholar] [CrossRef]
  15. Liu, L.H.; Fei, L.J.; Zhu, H.Y.; Hao, K.; Jie, F.L. Study on the Influence of Fertilizer Solution Concentration on Soil Water and Nitrogen Transport Characteristics Under Film Hole Irrigation. J. Soil Sci. Plant Nutr. 2021, 21, 1653–1665. [Google Scholar] [CrossRef]
  16. Wen, Z.C.; Xu, H.J.; Bai, Y.C. Criterion for stability of suspension-fluid mud stratified flow. Chin. J. Hydrodyn. 2021, 36, 252–264. [Google Scholar] [CrossRef]
  17. Bian, Y.L.; Cao, H.T.; Zhang, H.M.; Huang, F.G.; Song, C.J. An Experimental Study of Muddy Water Infiltration Affected by Sediment Concentration and Size. Water Sav. Irrig. 2018, 11, 39–47+50. Available online: https://kns.cnki.net/kcms2/article/abstract?v=jkwd3qsBIEJJv1ZYBSkWV143nT1kmJhe525ZgjUzPlrhNPwbeYNffO1ant4fiSgq_tB2LaWY81mbljsn-yo5swlk5NgPwjQrdjJRKzMvHJwh98c2Cvcz7Il_G2B1AjYnh6ldRIgO4DuZt10BT2XEWA==&uniplatform=NZKPT&language=CHS (accessed on 5 November 2018).
  18. Wang, J.; Na, W. Relationship between the Flood Cement and Cement Sand in the Yellow River Helong Reach Based on the Typical Sediment Content. J. Irrig. Drain. 2019, 38 (Suppl. S1), 107–110. [Google Scholar] [CrossRef]
  19. Chen, C.X.; Fu, J.; Wu, M.X.; Gao, X.; Ma, L.M. High-efficiency Sediment Transport Requirements for operation of the Xiaolangdi Reservoir in the Lower Yellow River. Water Supply 2022, 22, 8572–8586. [Google Scholar] [CrossRef]
  20. Su, W.; Gao, Y.M.; Gao, P.; Dong, X.D.; Wang, G.F.; Dun, X.J.; Xu, J.W. Effects of Different Vegetation Restoration Types on the Fractal Characteristics of Soil Particles in Earthy-Rocky Mountain Area of Northern China. Forests 2022, 13, 1246. [Google Scholar] [CrossRef]
  21. Kumar, M.; Sihag, P. Assessment of Infiltration Rate of Soil Using Empirical and Machine Learning-Based Models. Irrig. Drain. 2019, 68, 588–601. [Google Scholar] [CrossRef]
  22. Mendonça, S.R.; Avila, M.C.R.; Vital, R.G.; Evangelista, Z.R.; Pontes, N.D.; Nascimento, A.D. The effect of different mulching on tomato development and yield. Sci. Hortic. 2021, 275, 109657. [Google Scholar] [CrossRef]
  23. Jacquiod, S.; Bouchard, E.; Beguet, J.; Roure, F.; Cheviron, N.; Mougin, C.; Coffin, A.; Blouin, M.; Martin-Laurent, F. Effect of plastic film and hemp canvas mulching on soil properties, microbial diversity and lettuce yield. Plant Soil 2024. [Google Scholar] [CrossRef]
  24. Zhao, P.H.; Fel, L.J.; Liu, D.Y. Distribution of water and nitrogen in soil infiltration by fertilizer film hole irrigation under formation of soil dense layer. J. Drain. Irrig. Mach. Eng. 2023, 41, 709–715. [Google Scholar] [CrossRef]
  25. Zhong, Y.; Fel, L.J.; Zhu, S.J.; Kang, S.X.; Liu, L.H.; Hao, K.; Jie, F.L. Infiltration Characteristics of Muddy Water Film-Hole irrigation and Formation Characteristics of Dense Layers. J. Soil Water Conserv. 2022, 36, 238–246+254. [Google Scholar] [CrossRef]
  26. Feng, X.; Qu, J.J.; Tan, L.; Fan, Q.; Niu, Q.H. Fractal features of sandy soil particle-size distributions during the rangeland desertification process on the eastern Qinghai-Tibet Plateau. J. Soils Sediments 2020, 20, 472–485. [Google Scholar] [CrossRef]
  27. Dong, Z.; Mao, D.; Ye, M.; Li, S.; Ma, X.; Liu, S. Fractal features of soil grain-size distribution in a typical Tamarix cones in the Taklimakan Desert, China. Sci. Rep. 2022, 12, 16461. [Google Scholar] [CrossRef] [PubMed]
  28. Bai, Y.F.; Qin, Y.; Lu, X.R.; Zhang, J.T.; Chen, G.S.; Li, X.J. Fractal dimension of particle-size distribution and their relationships with alkalinity properties of soils in the western Songnen Plain, China. Sci. Rep. 2020, 10, 20603. [Google Scholar] [CrossRef]
  29. Li, H.; Zhang, Z.; Zhai, J.; Yang, L.; Long, H.C. Correlation between Soil Structural Parameters and Soil Adhesion Based on Water Film Theory. Coatings 2022, 12, 1743. [Google Scholar] [CrossRef]
Figure 1. Schematic diagram of experiment device.
Agriculture 14 01377 g001
Figure 2. Schematic diagram of soil structure after muddy water infiltration.
Agriculture 14 01377 g002
Figure 3. Variation in cumulative infiltration amount with infiltrated time under the conditions of muddy water film hole irrigation.
Agriculture 14 01377 g003
Figure 4. Variation in wetting front distance with infiltrated time under the conditions of muddy water film hole irrigation.
Agriculture 14 01377 g004
Figure 5. Soil moisture content at the center of the film hole in vertical and horizontal directions.
Agriculture 14 01377 g005
Figure 6. Variation in deposition layer thickness with infiltration time under the conditions of muddy water film hole irrigation.
Agriculture 14 01377 g006
Figure 7. Composition of soil particles in deposition layer under the conditions of muddy water film hole irrigation.
Agriculture 14 01377 g007
Figure 8. Composition of soil particles in the stranded layer at different positions under different treatments.
Agriculture 14 01377 g008
Figure 9. The correlation between the soil particle fractal dimension at different locations in the stranded layer and the soil particle size composition. Note: *, significant at the 0.05 level (p < 0.05).
Agriculture 14 01377 g009
Table 1. Particle size distribution composition of four types of sediment in muddy water.
Muddy Cement Sand TypesClay Content/%0~0.002 mmSilt Content/%0.002~0.02 mmSand Content/%0.02~2 mmPhysical Clay Content d0.01/%0~0.01 mm
A3.5913.3983.039.13
B5.520.8673.6416.46
C8.0631.3360.6127.34
D11.6443.3445.0244.02
Table 2. Muddy water infiltration experimental scheme.
TreatmentMuddy Water Sediment Concentration/%Physical Clay Content/%
CK0/
T1327.34
T26
T39
T412
T569.13
T616.46
T744.02
Table 3. Parameters characteristics of Kostiakov infiltration model fitting under the conditions of muddy water film hole irrigation.
TreatmentKαR2
CK0.8669 a0.5783 c0.9999
T10.7768 c0.5780 c0.9995
T20.6637 e0.5776 c0.9999
T30.6074 f0.5718 d0.9999
T40.5666 g0.5514 e0.9981
T50.7965 b0.5854 b0.9982
T60.7367 d0.5768 c0.9990
T70.4367 h0.6229 a0.9997
Note: the different letters indicate significant differences at p < 0.05 according to Duncan’s multiple-range test (n = 3).
Table 4. Coefficient of fitting between deposition layer thickness and infiltration time.
TreatmentabR2
T11.4690 d0.3361 d0.9998
T21.6089 c0.3727 dc0.9999
T31.7191 b0.3847 b0.9999
T41.7917 b0.3991 a0.9999
T51.9300 a0.3764 bc0.9999
T61.7500 b0.3747 bc0.9999
T71.4401 d0.3689 c0.9997
Note: the different letters indicate significant differences at p < 0.05 according to Duncan’s multiple-range test (n = 3).
Table 5. Fractal dimensions of soil particles at different positions in the stranded layer.
Stranded Layer Depth/cmTreatmentFractal DimensionR2Stranded Layer Depth/cmTreatmentFractal DimensionR2
0–1T12.55260.86973–4T12.50860.8951
T22.56480.8633T22.52660.8896
T32.58060.8595T32.5210.8863
T42.59140.3891T42.52480.8849
T52.53440.8829T52.50010.8983
T62.55620.8741T62.51540.8932
T72.58560.8582T72.53910.8799
1–2T12.54000.87684–5T12.50040.9001
T22.55350.8708T22.50650.8998
T32.56320.8657T32.49980.9005
T42.57550.8617T42.49830.8991
T52.52510.8876T52.49790.8989
T62.54960.8789T62.50030.8996
T72.57090.8639T72.52180.8939
2–3T12.52130.89065–6T12.49880.9002
T22.5410.8801T22.49990.9000
T32.55140.8719T32.49830.9000
T42.56220.8701T42.4990.9002
T52.51250.8917T52.49680.8995
T62.53120.8895T62.50040.9002
T72.55450.869T72.5020.8999
Disclaimer/Publisher’s Note: The statements, opinions and data contained in all publications are solely those of the individual author(s) and contributor(s) and not of MDPI and/or the editor(s). MDPI and/or the editor(s) disclaim responsibility for any injury to people or property resulting from any ideas, methods, instructions or products referred to in the content.

