

Fatigue Analysis of Shovel Body Based on Tractor Subsoiling Operation Measured Data


 , ,
, ,
Abstract
:1. Introduction
- (1)
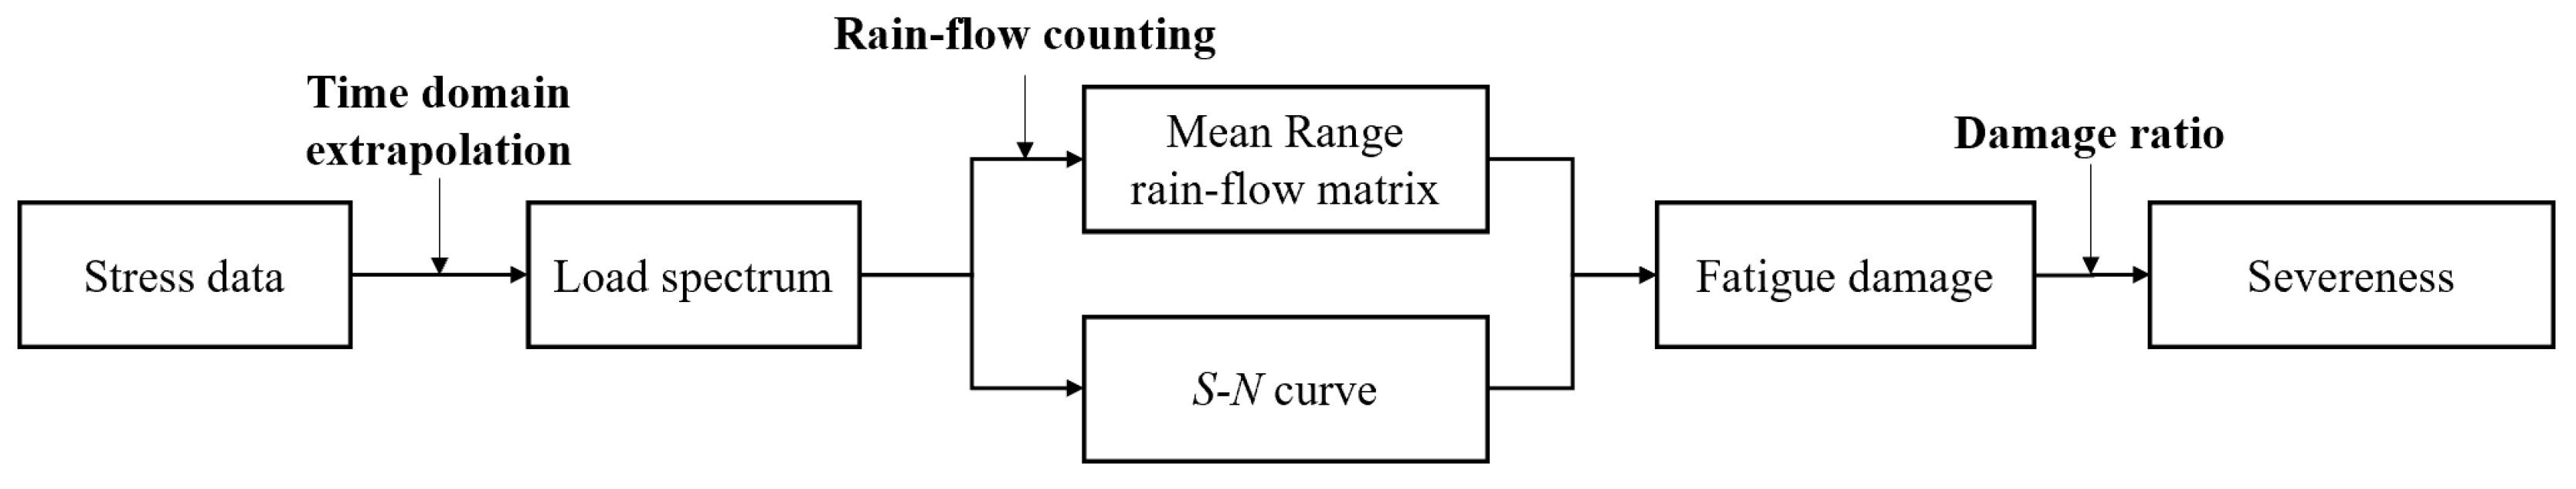
- This paper proposes a complete set of fatigue damage calculation and comparison methods for subsoiling shovels, which mainly includes four parts: real-time measurement of field condition data, extraction and extrapolation of stress load spectrum, linear accumulation damage calculation, and severeness analysis.
- (2)
- This study develops a tractor-operating condition parameter monitoring system to comprehensively monitor the operating parameters of key components during tractor operation. The system meets the data acquisition requirements of various tests, such as the tractor driving performance, hydraulic lifting performance, traction performance, and implementation of strain measurements.
- (3)
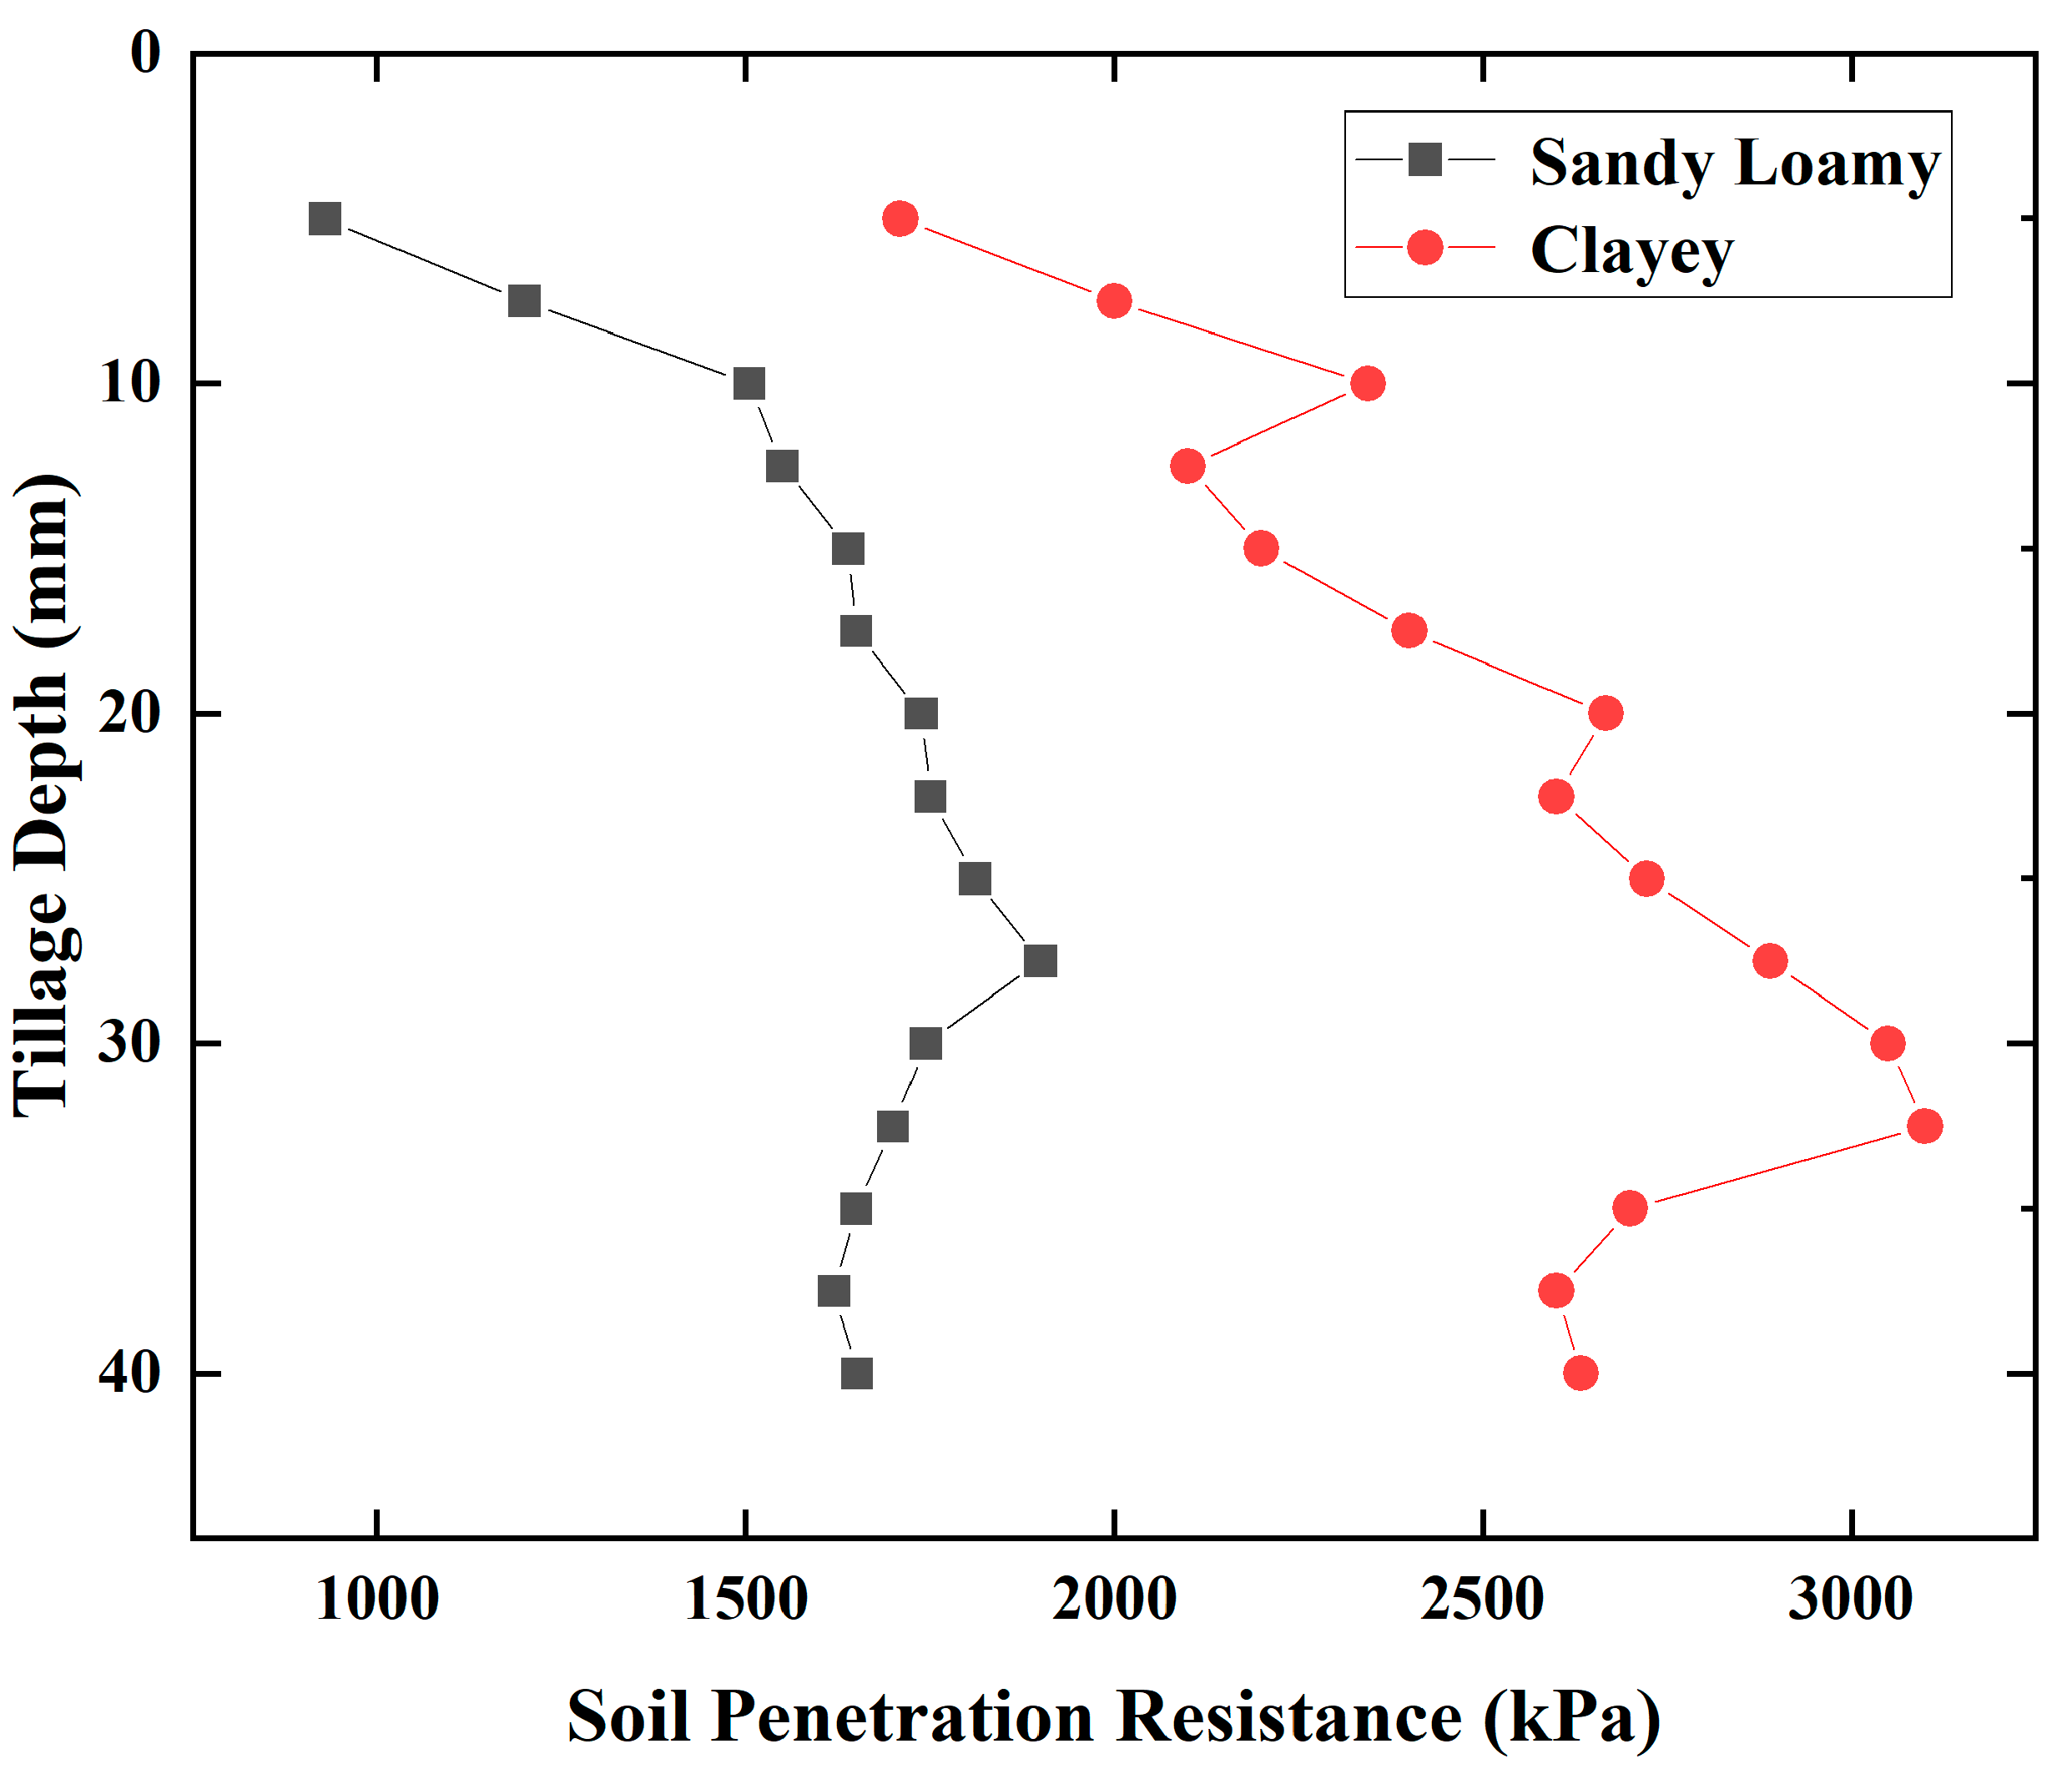
- With soil penetration resistance, farming depth, and operating speed as test variables, 18 test cases were carried out to verify the accuracy and effectiveness of the proposed method. This research provides a theoretical analysis method for optimizing machine tools and improving shovel body structure, which has certain practical value.
2. Materials and Methods
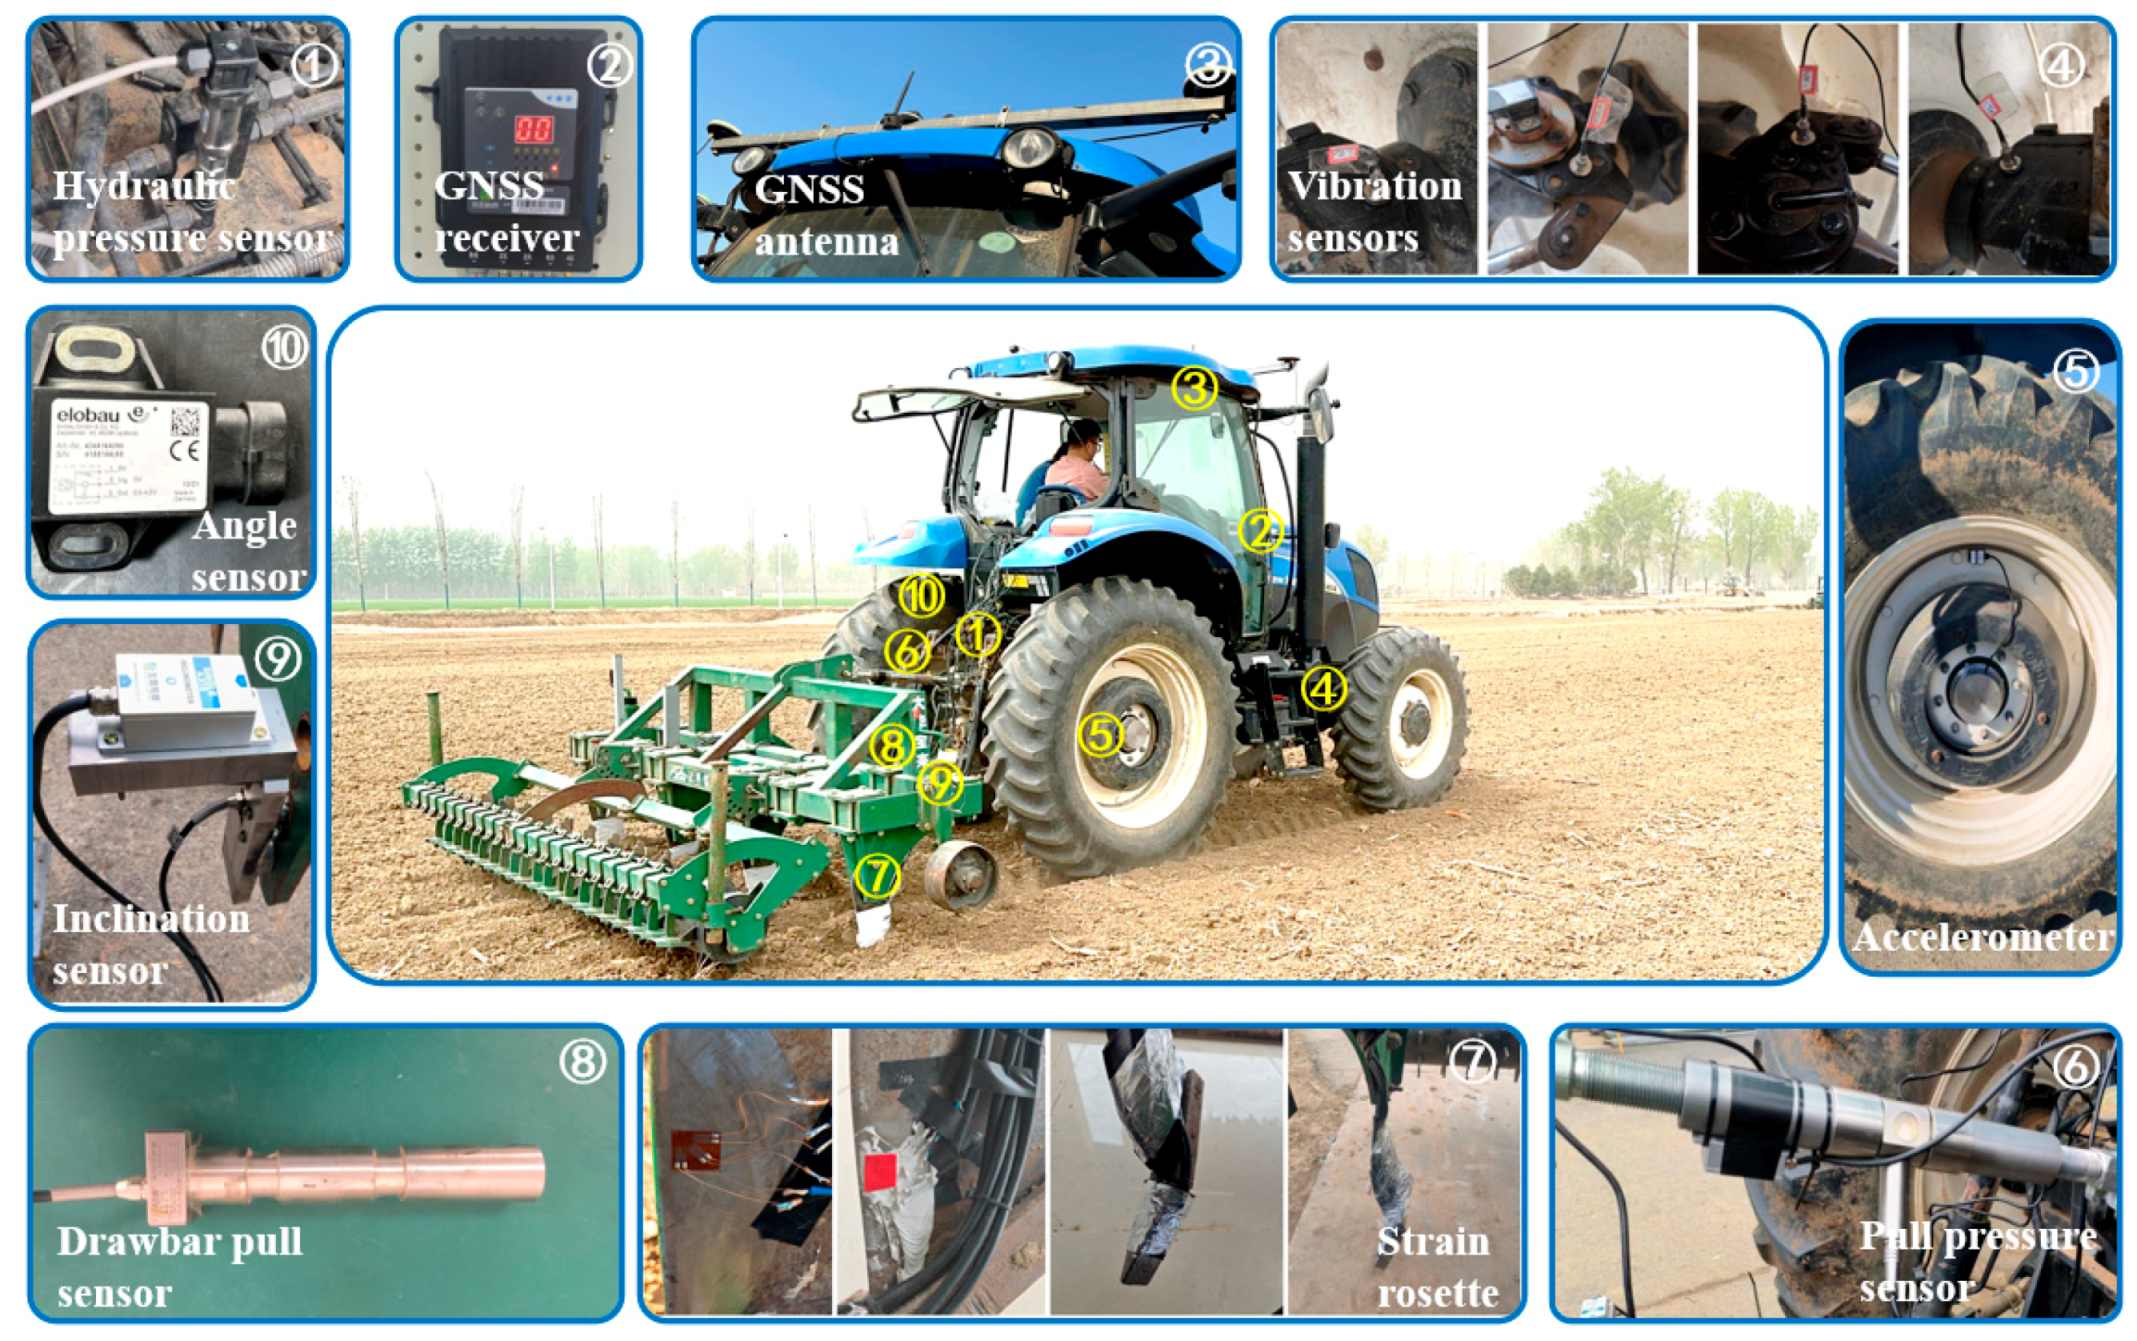
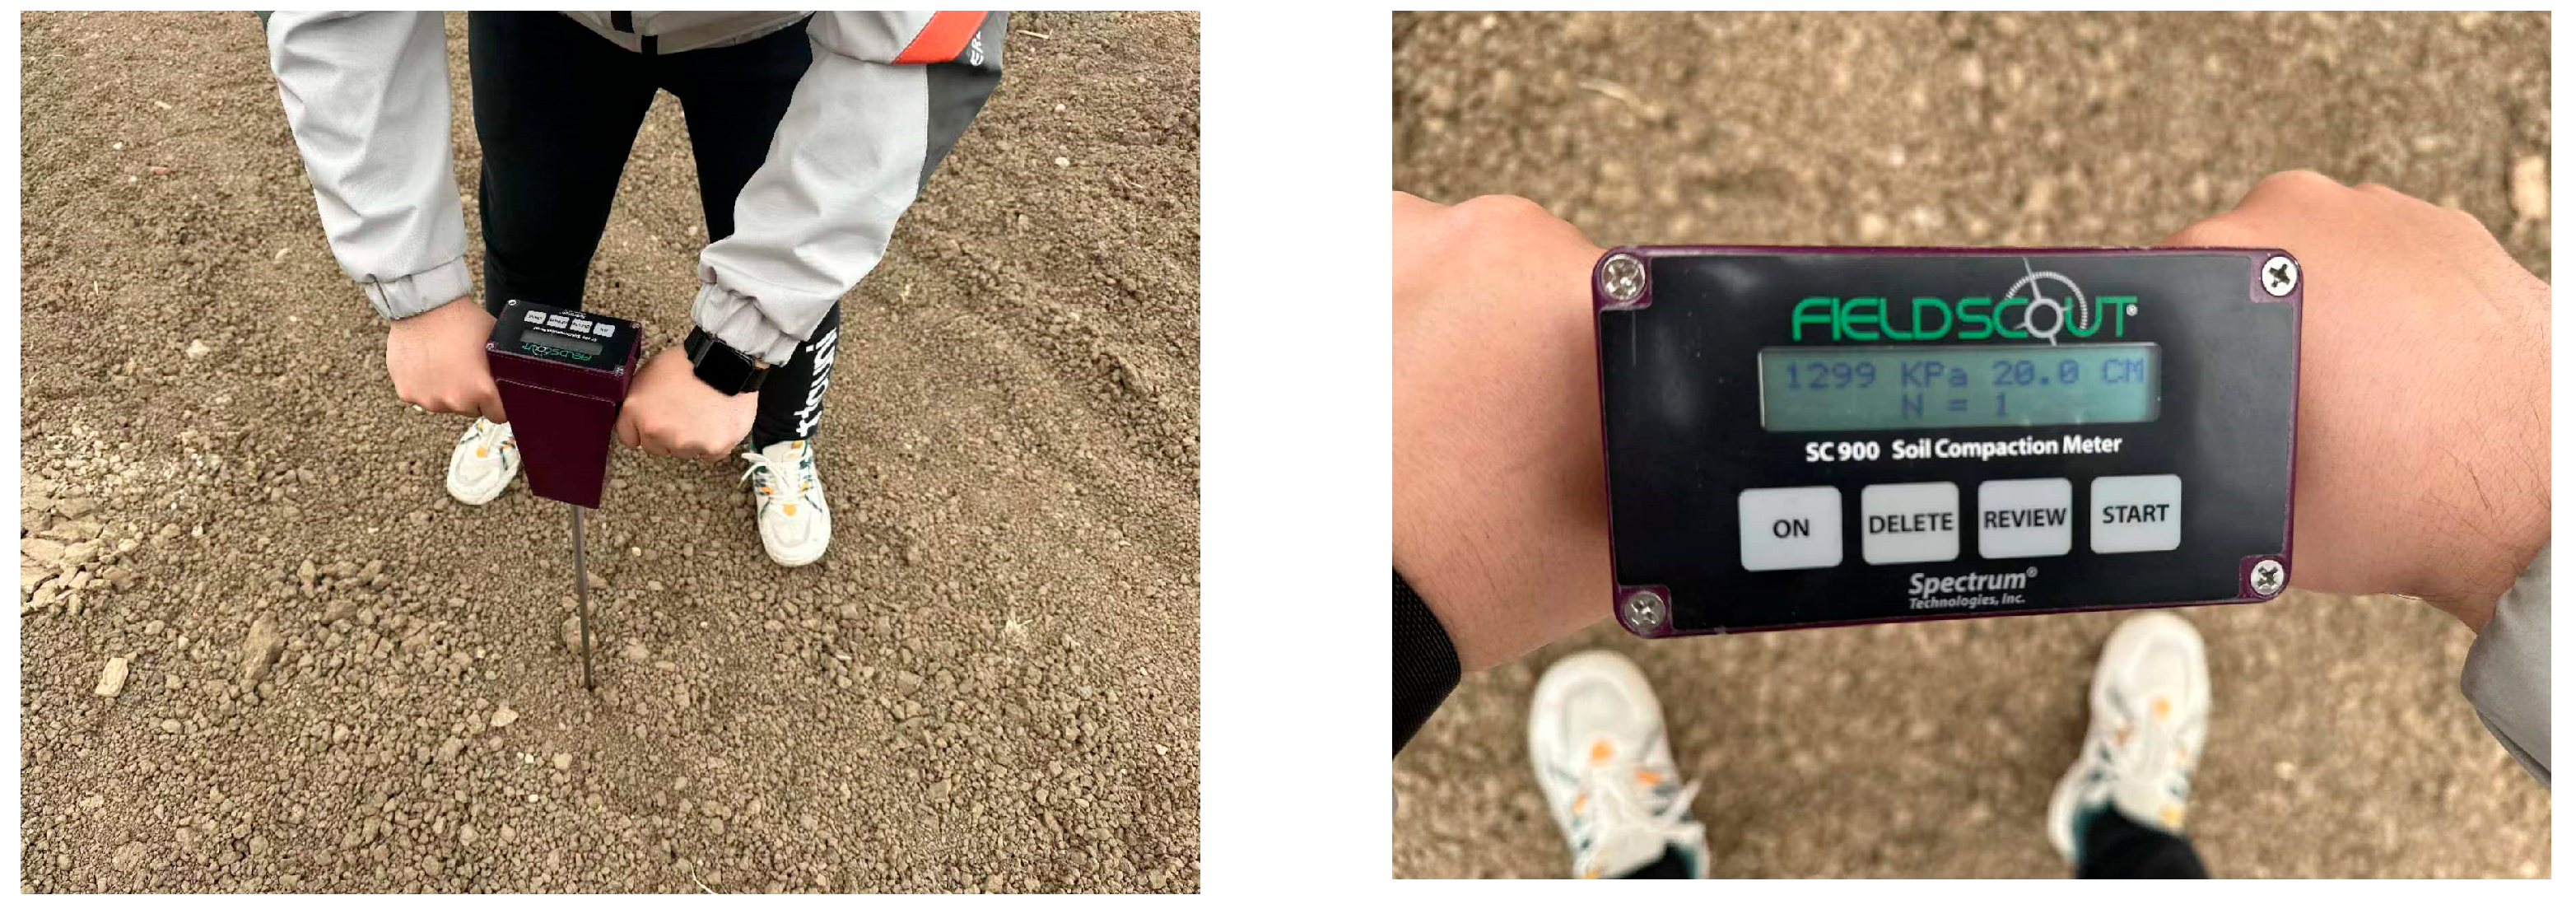
2.1. Monitoring System Design
2.2. Fatigue Analysis Method
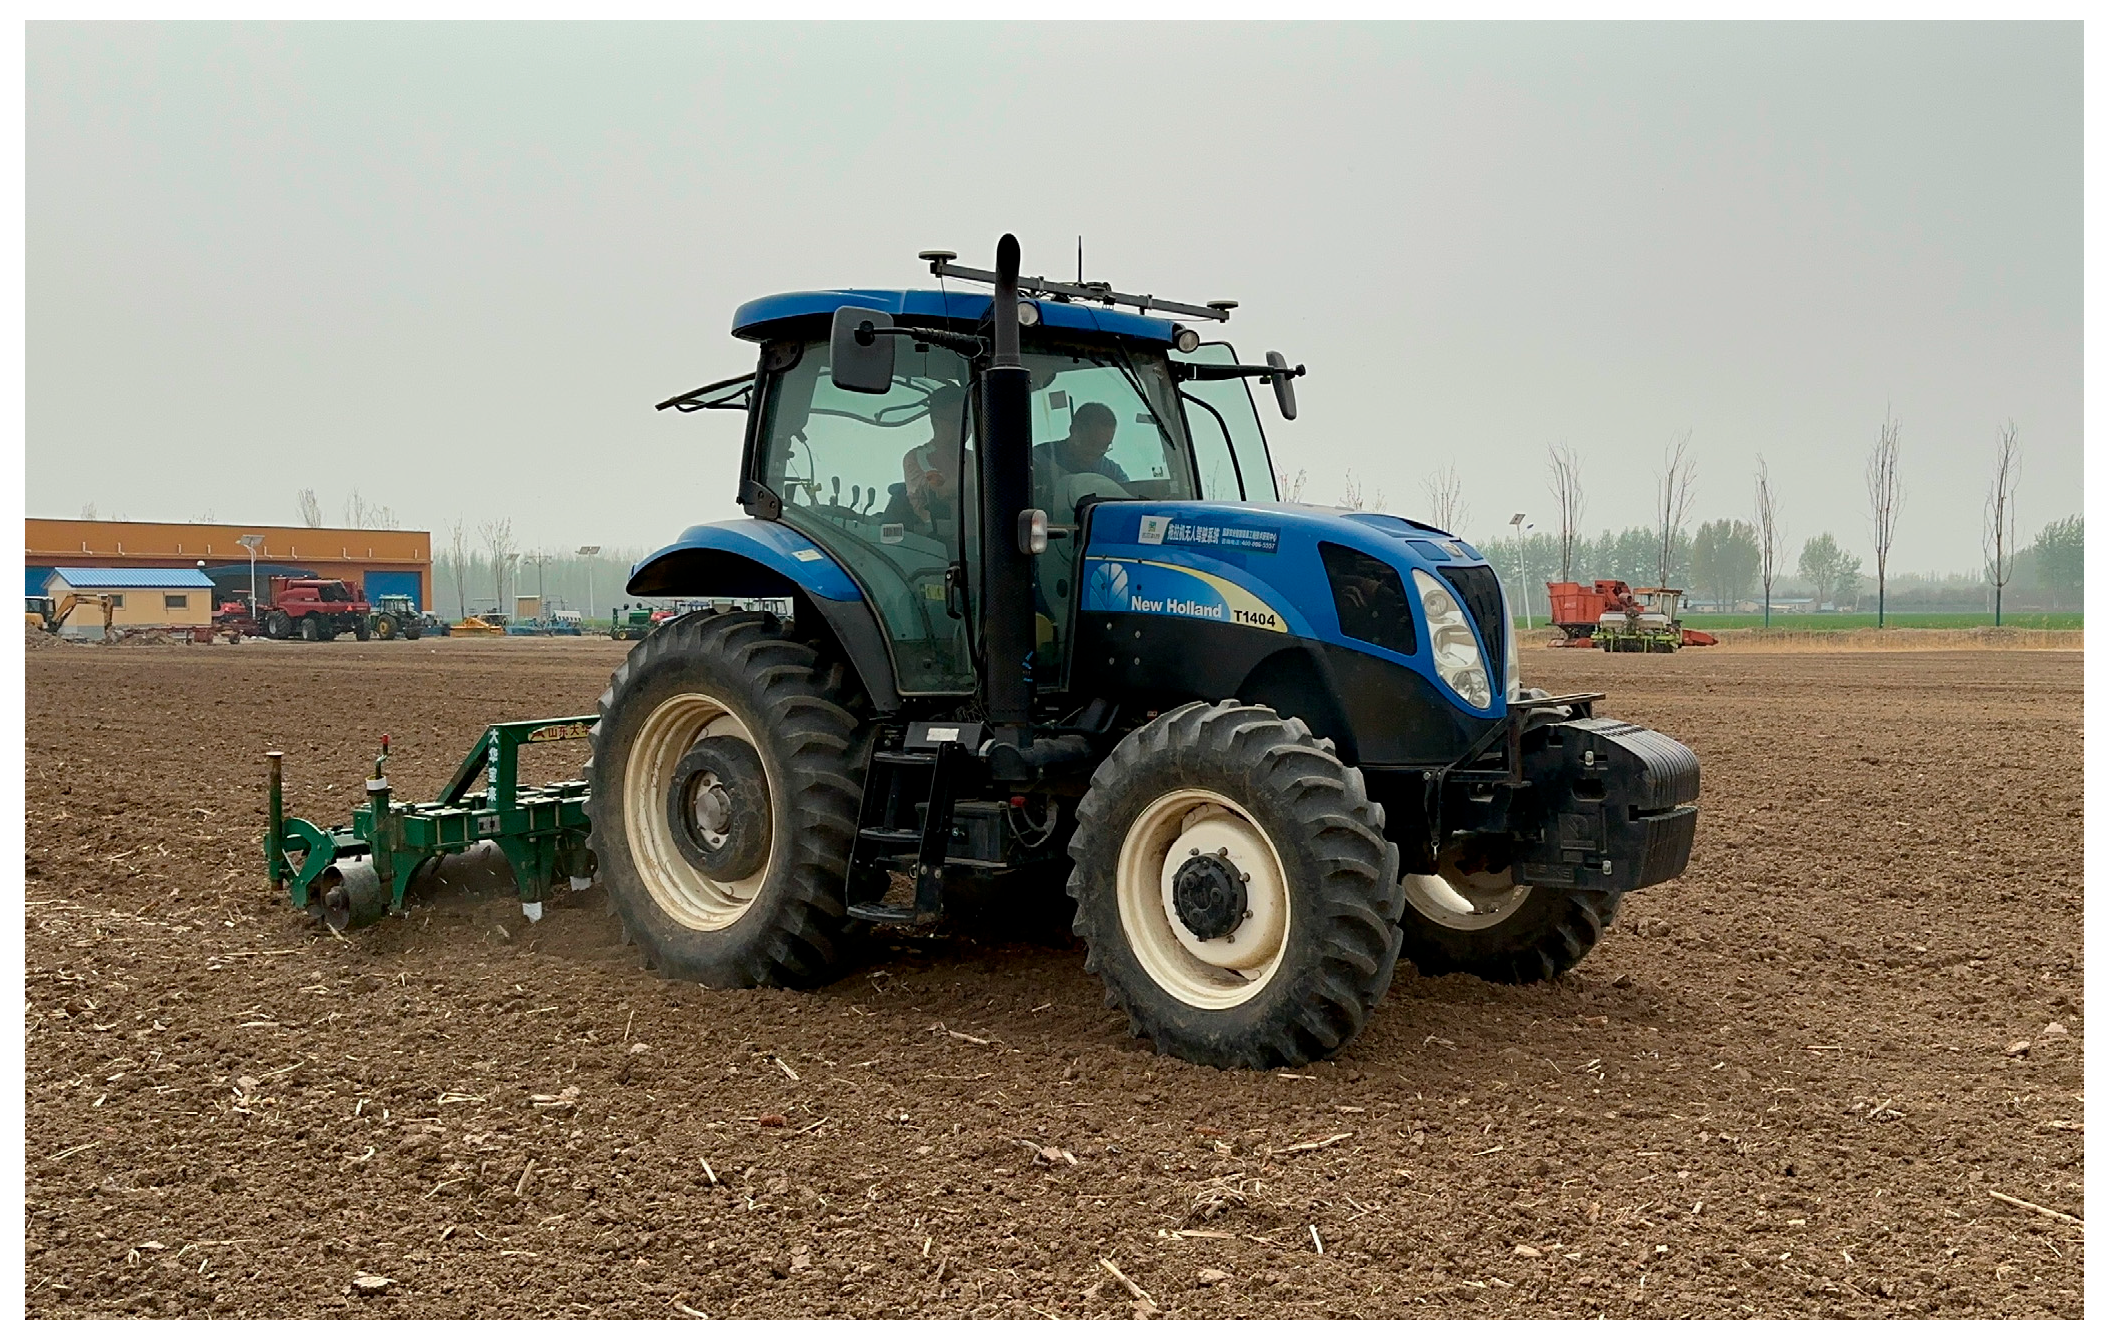
2.3. Field Test
3. Results and Discussion
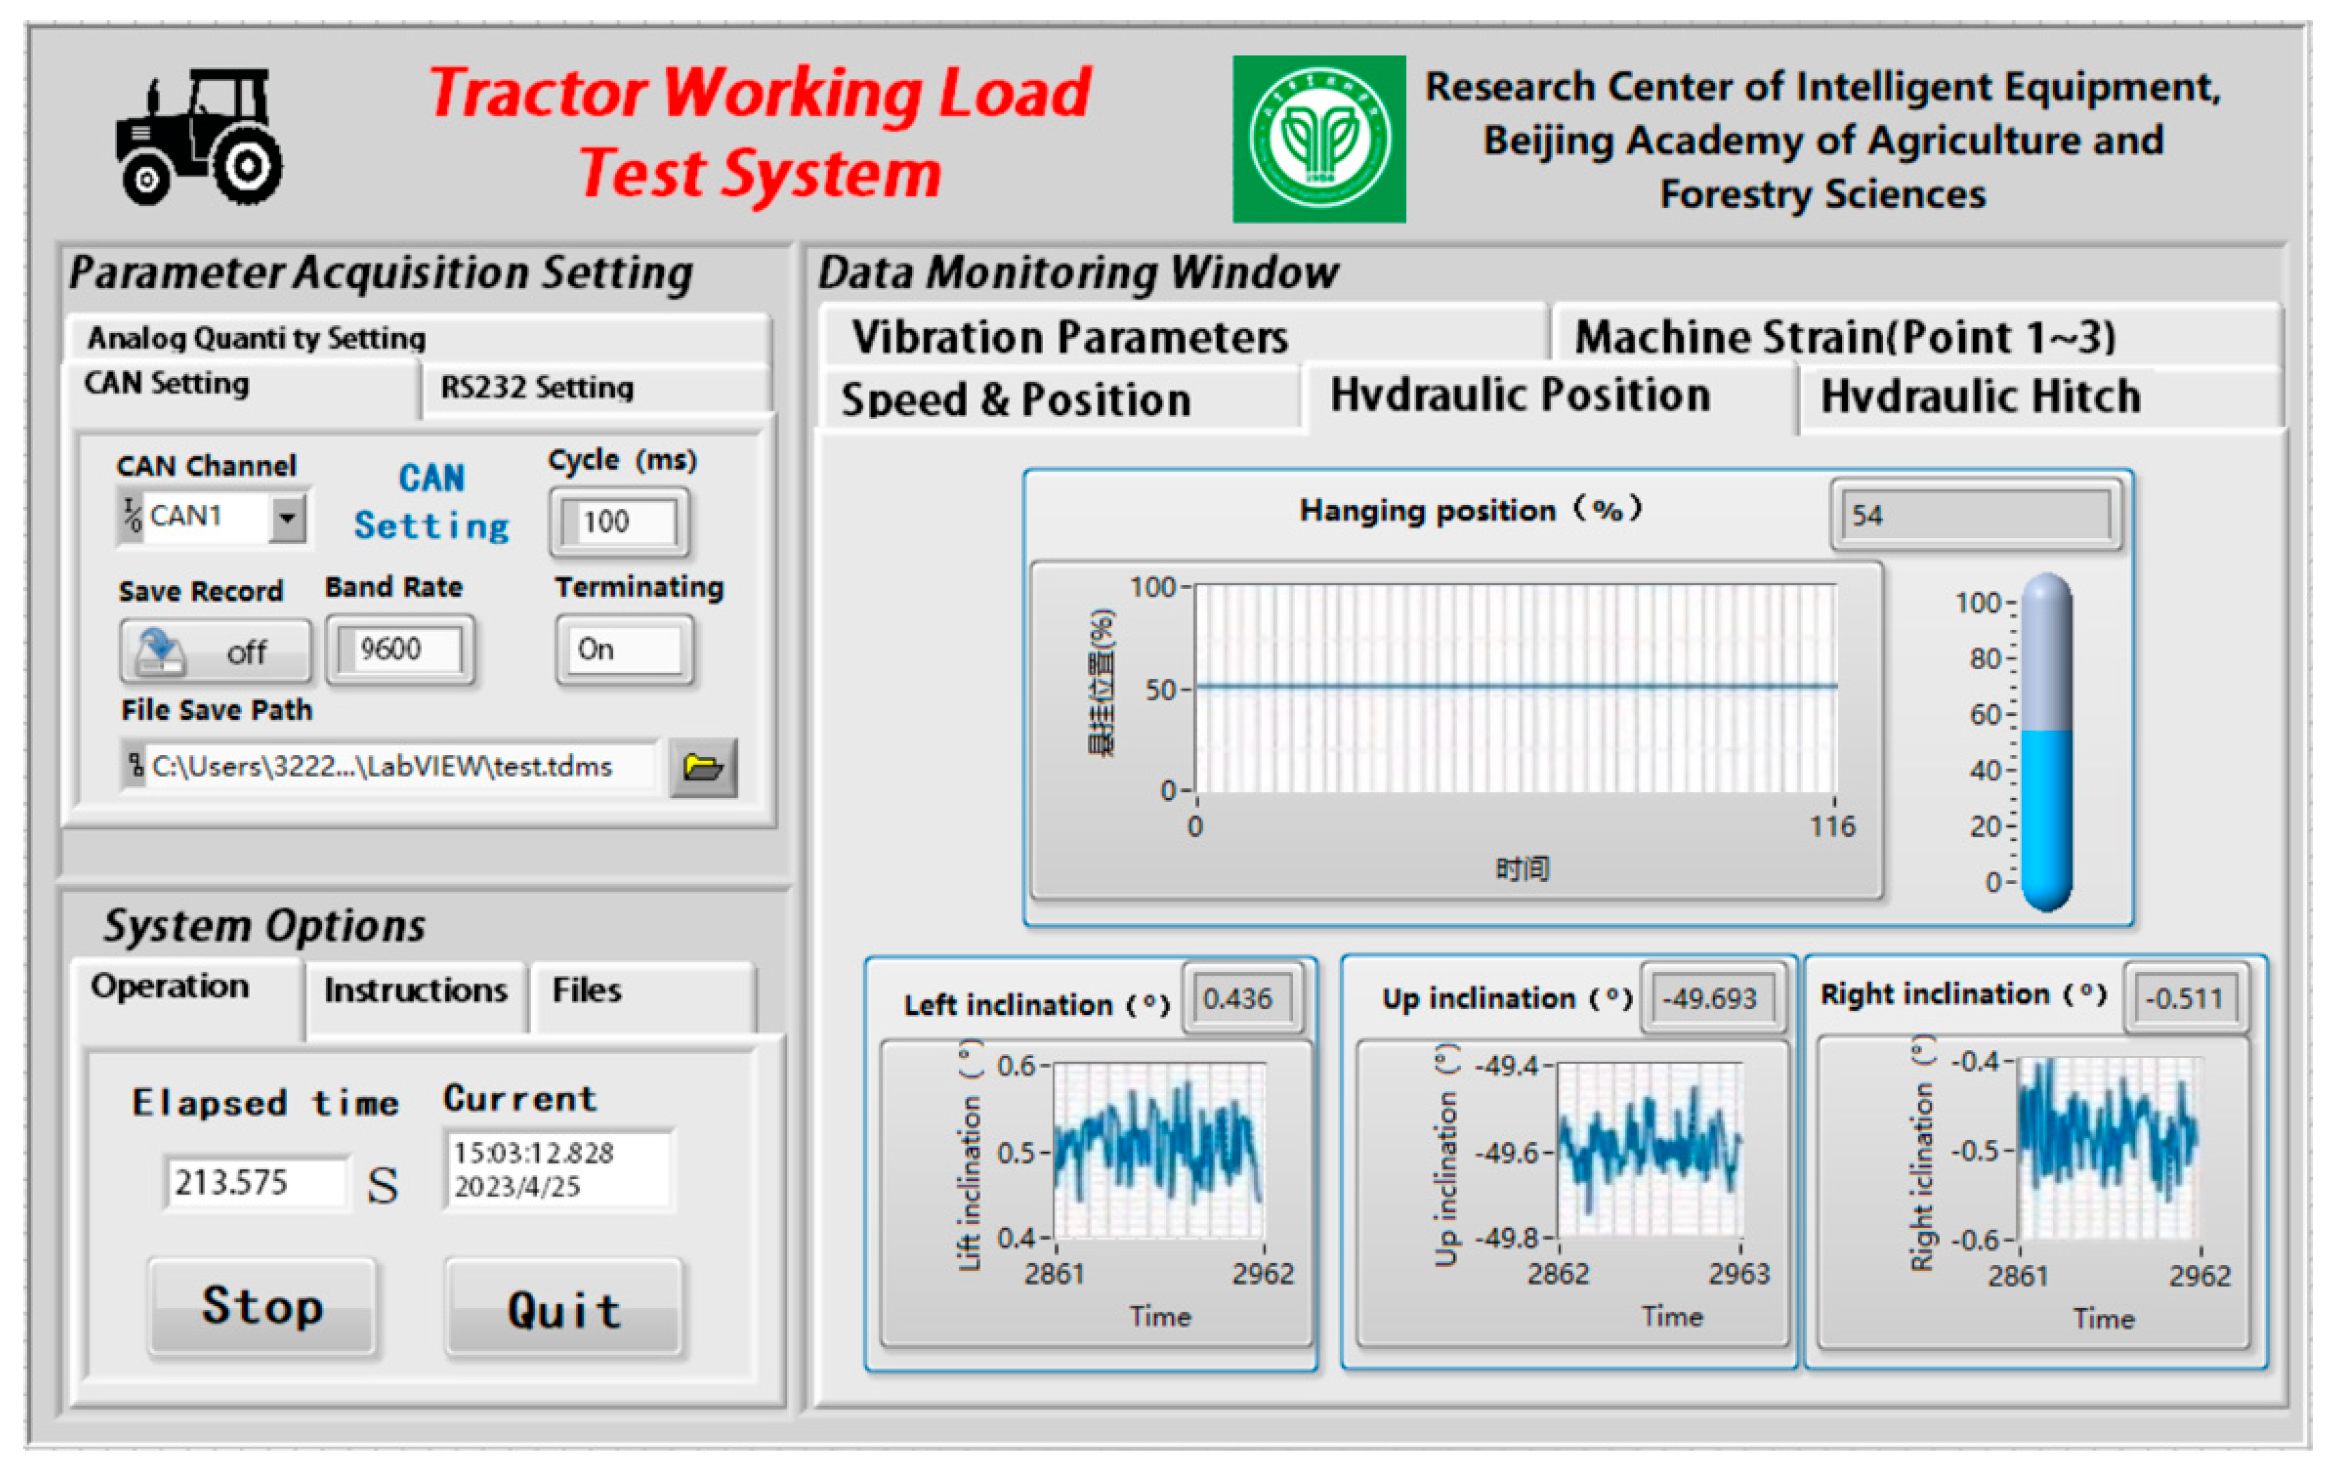
3.1. Monitoring System Test Results
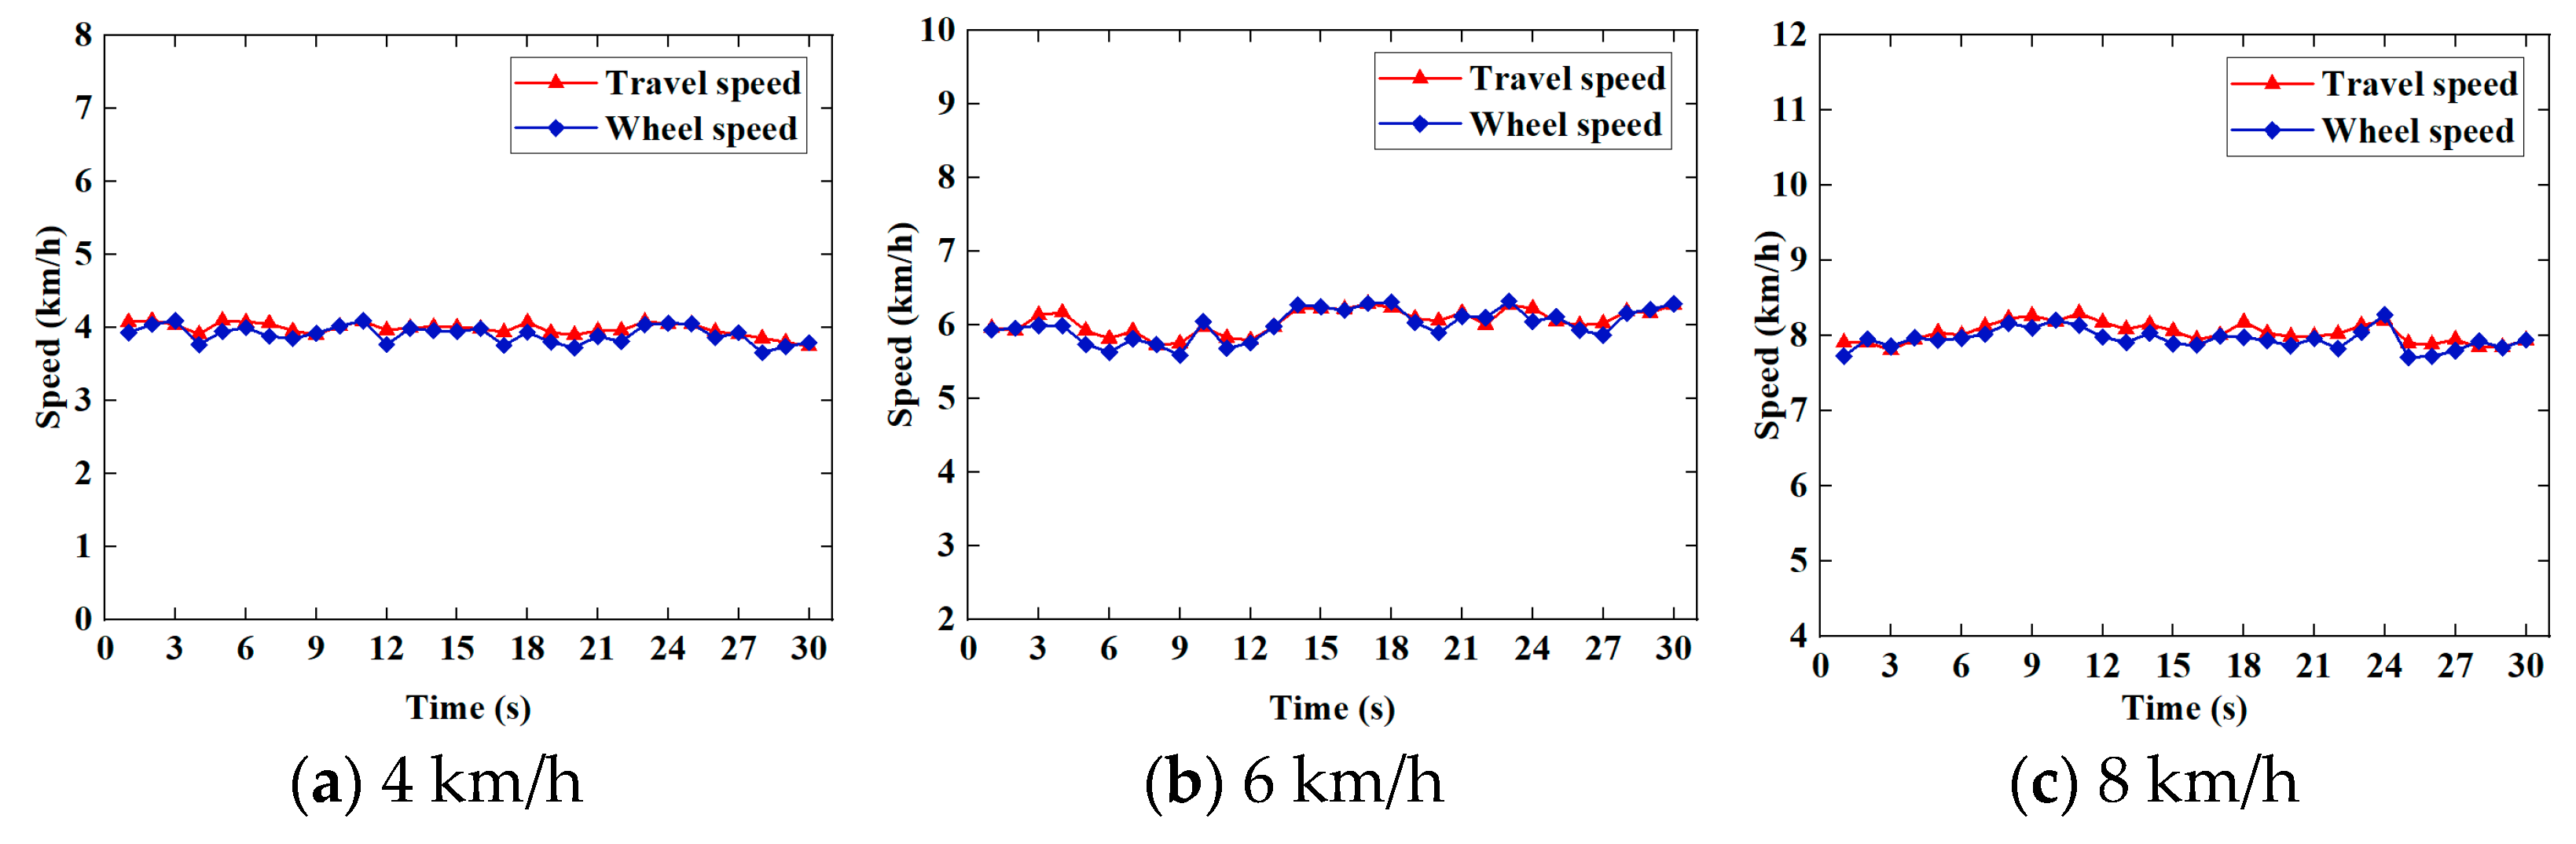
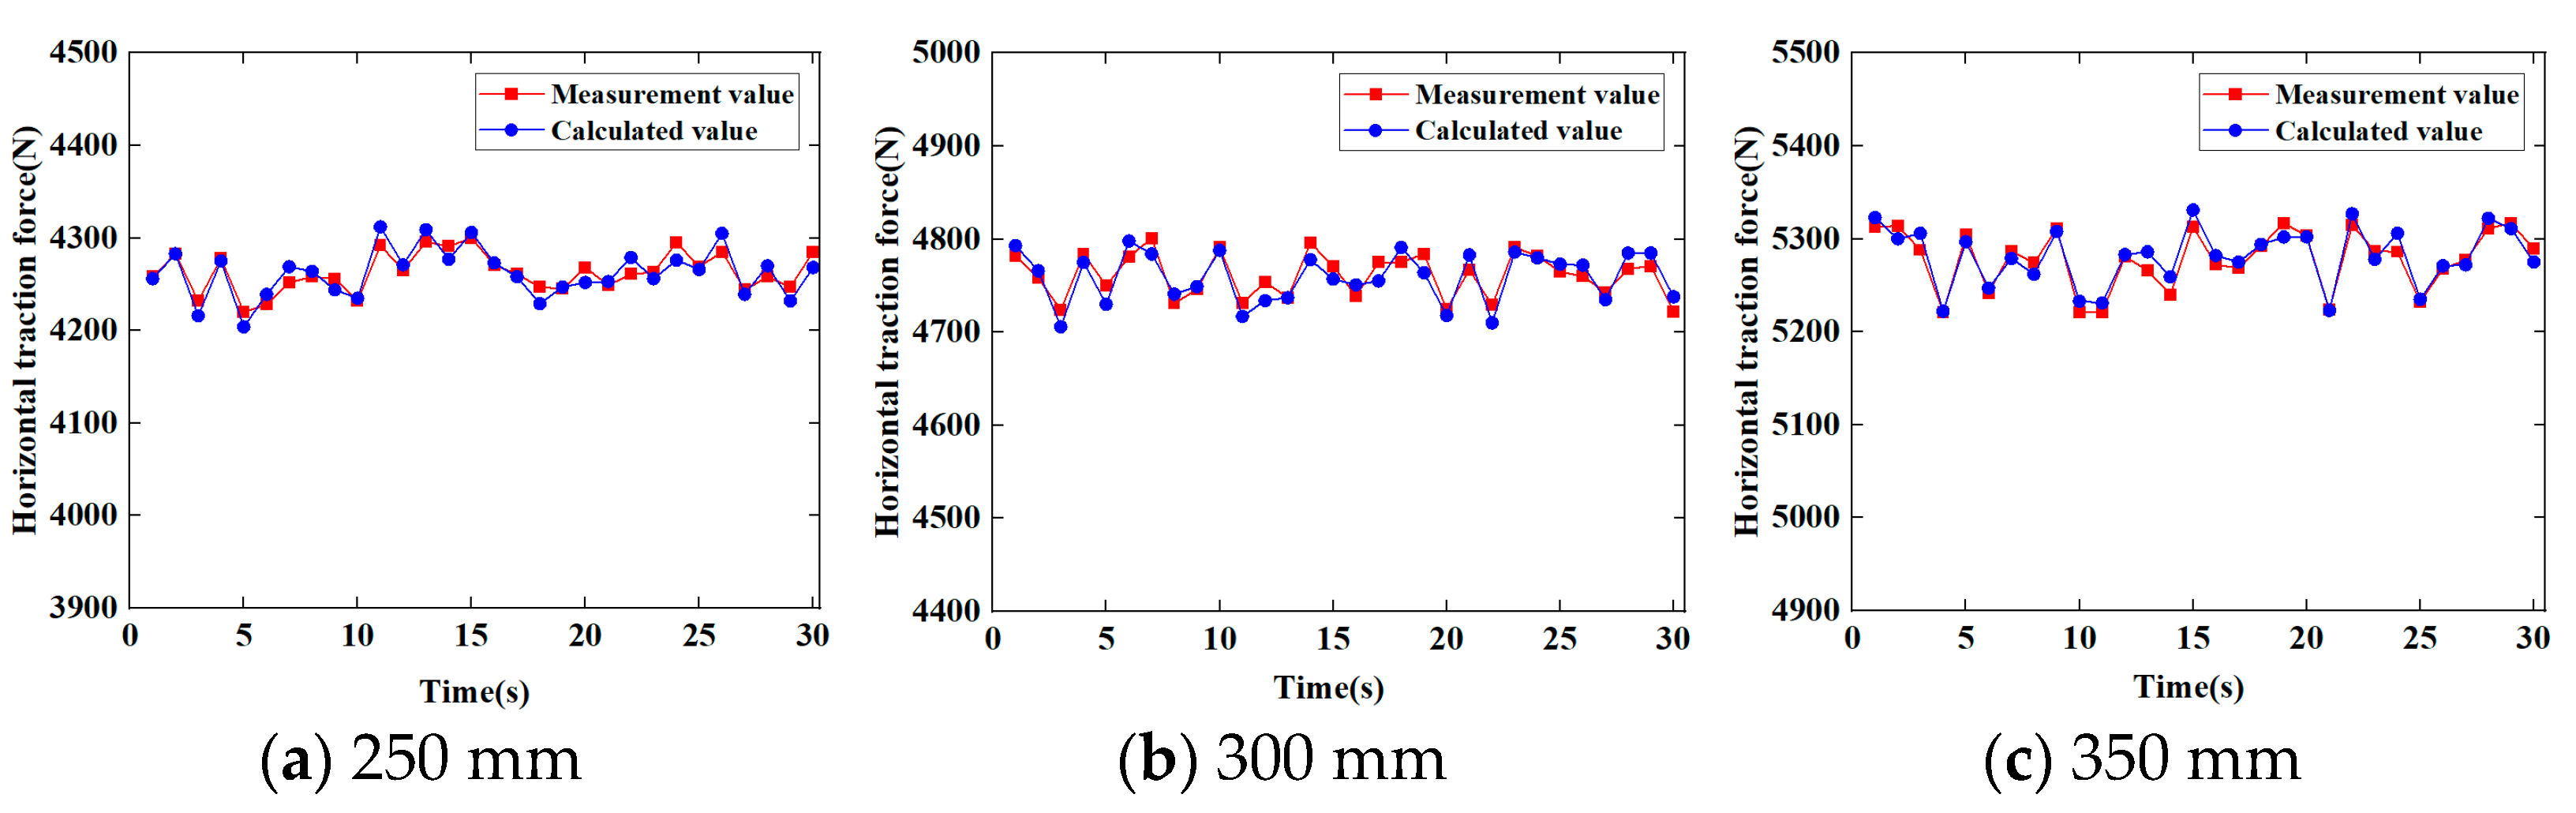
3.1.1. Signal Error Test Results
3.1.2. Typical Parameter Test Results
3.2. Fatigue Damage Calculation Results of Shovel Body
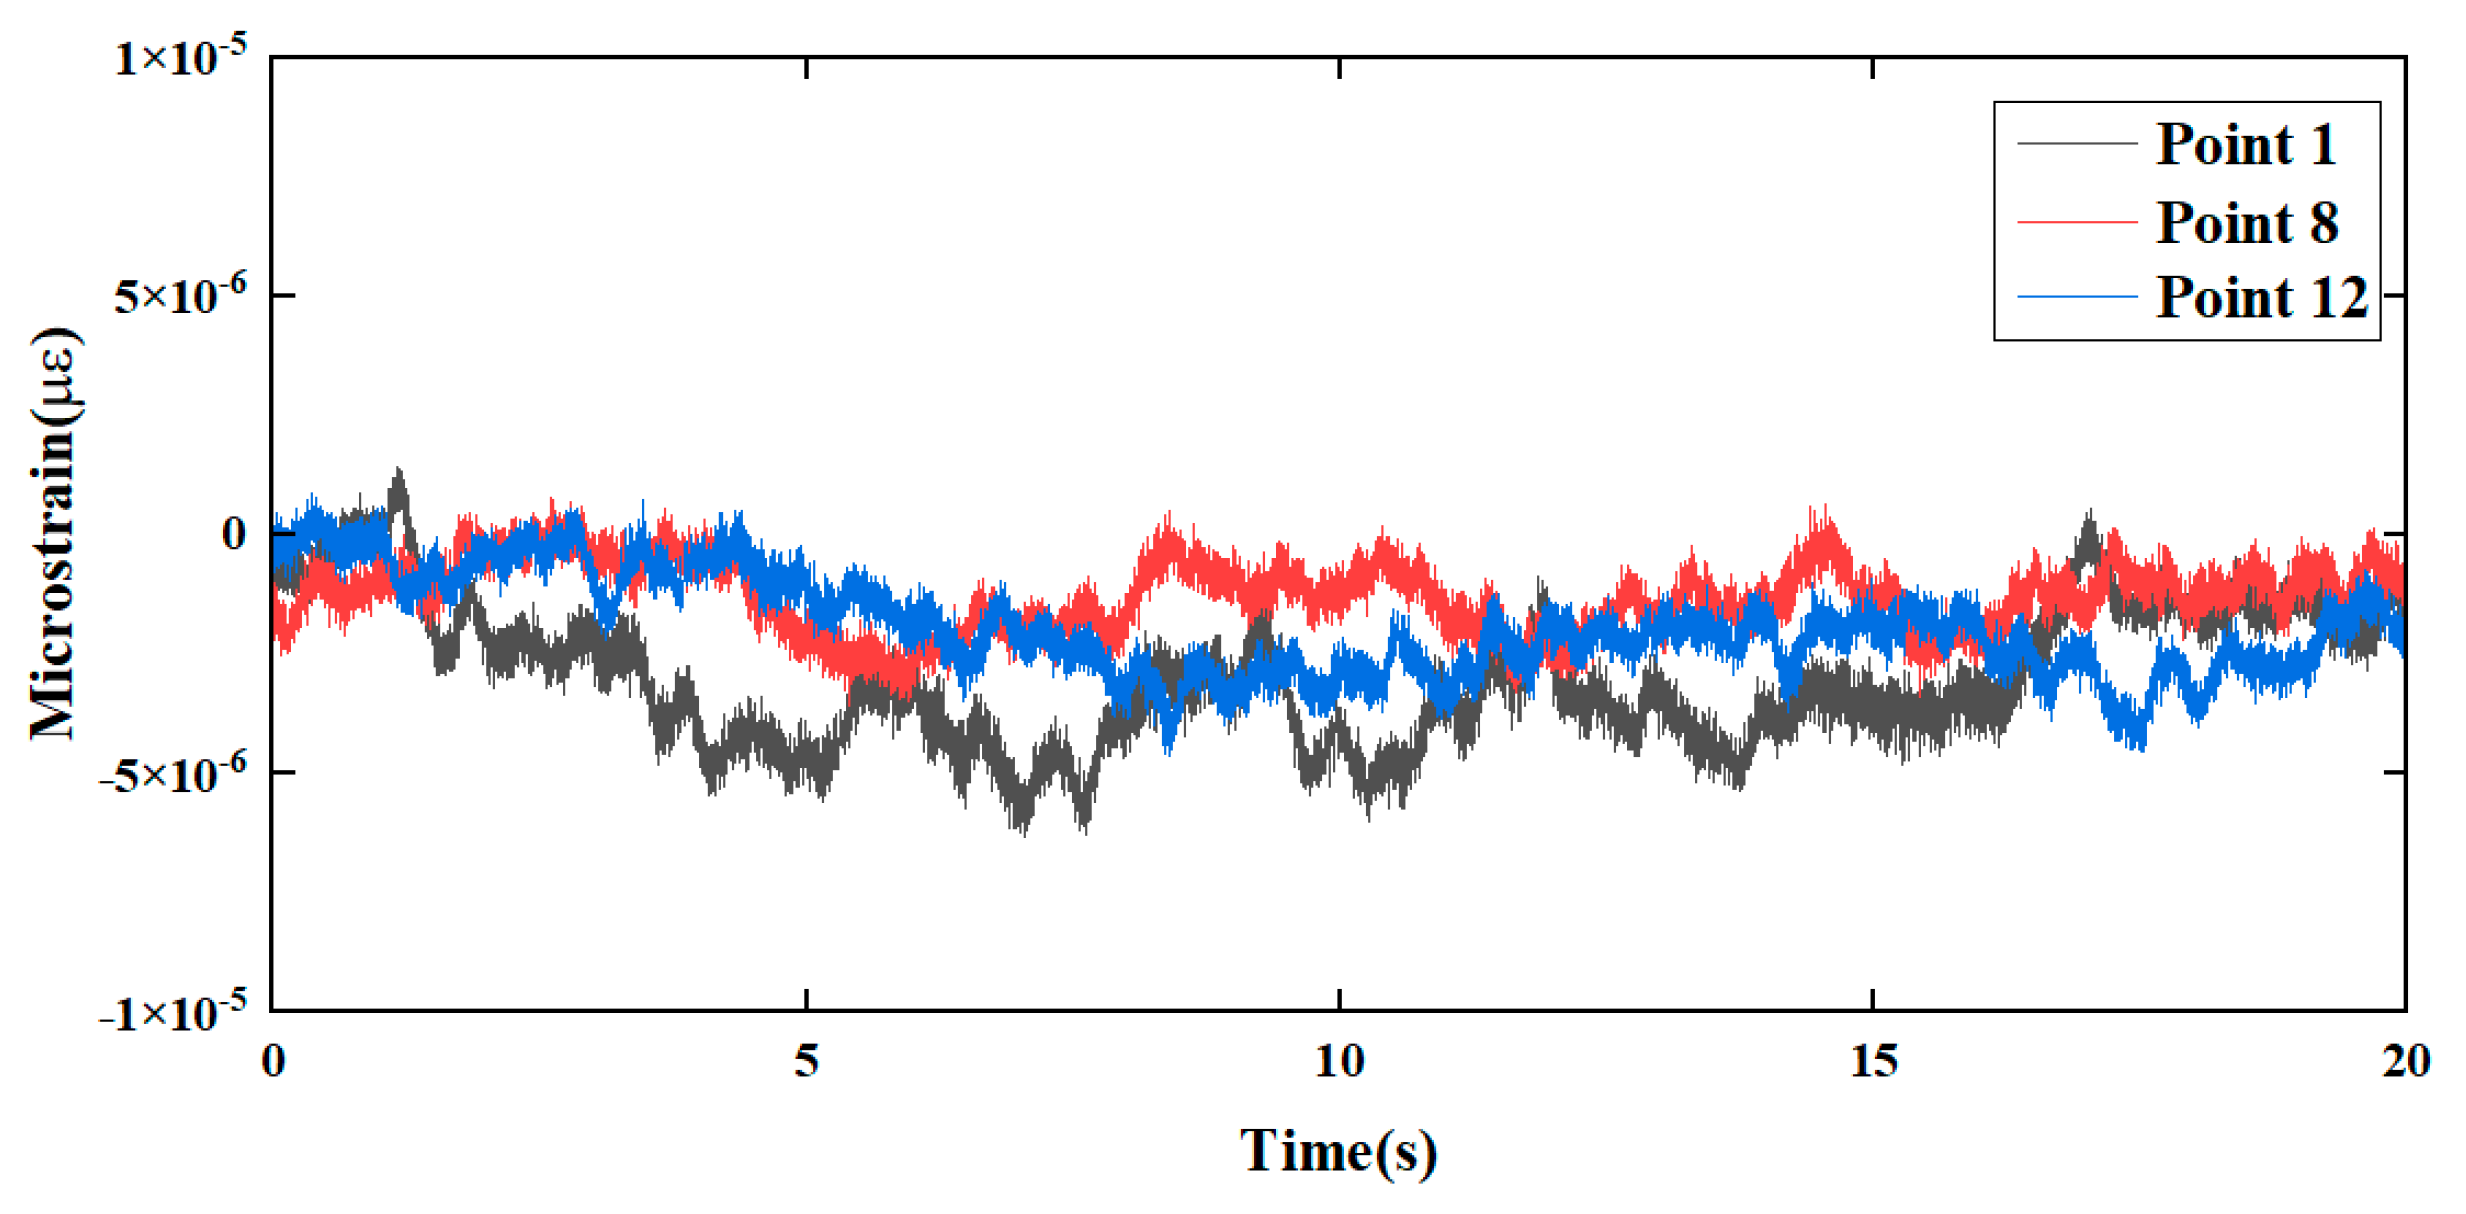
3.2.1. Load Spectrum Processing Results
3.2.2. Fatigue Damage Calculation Results
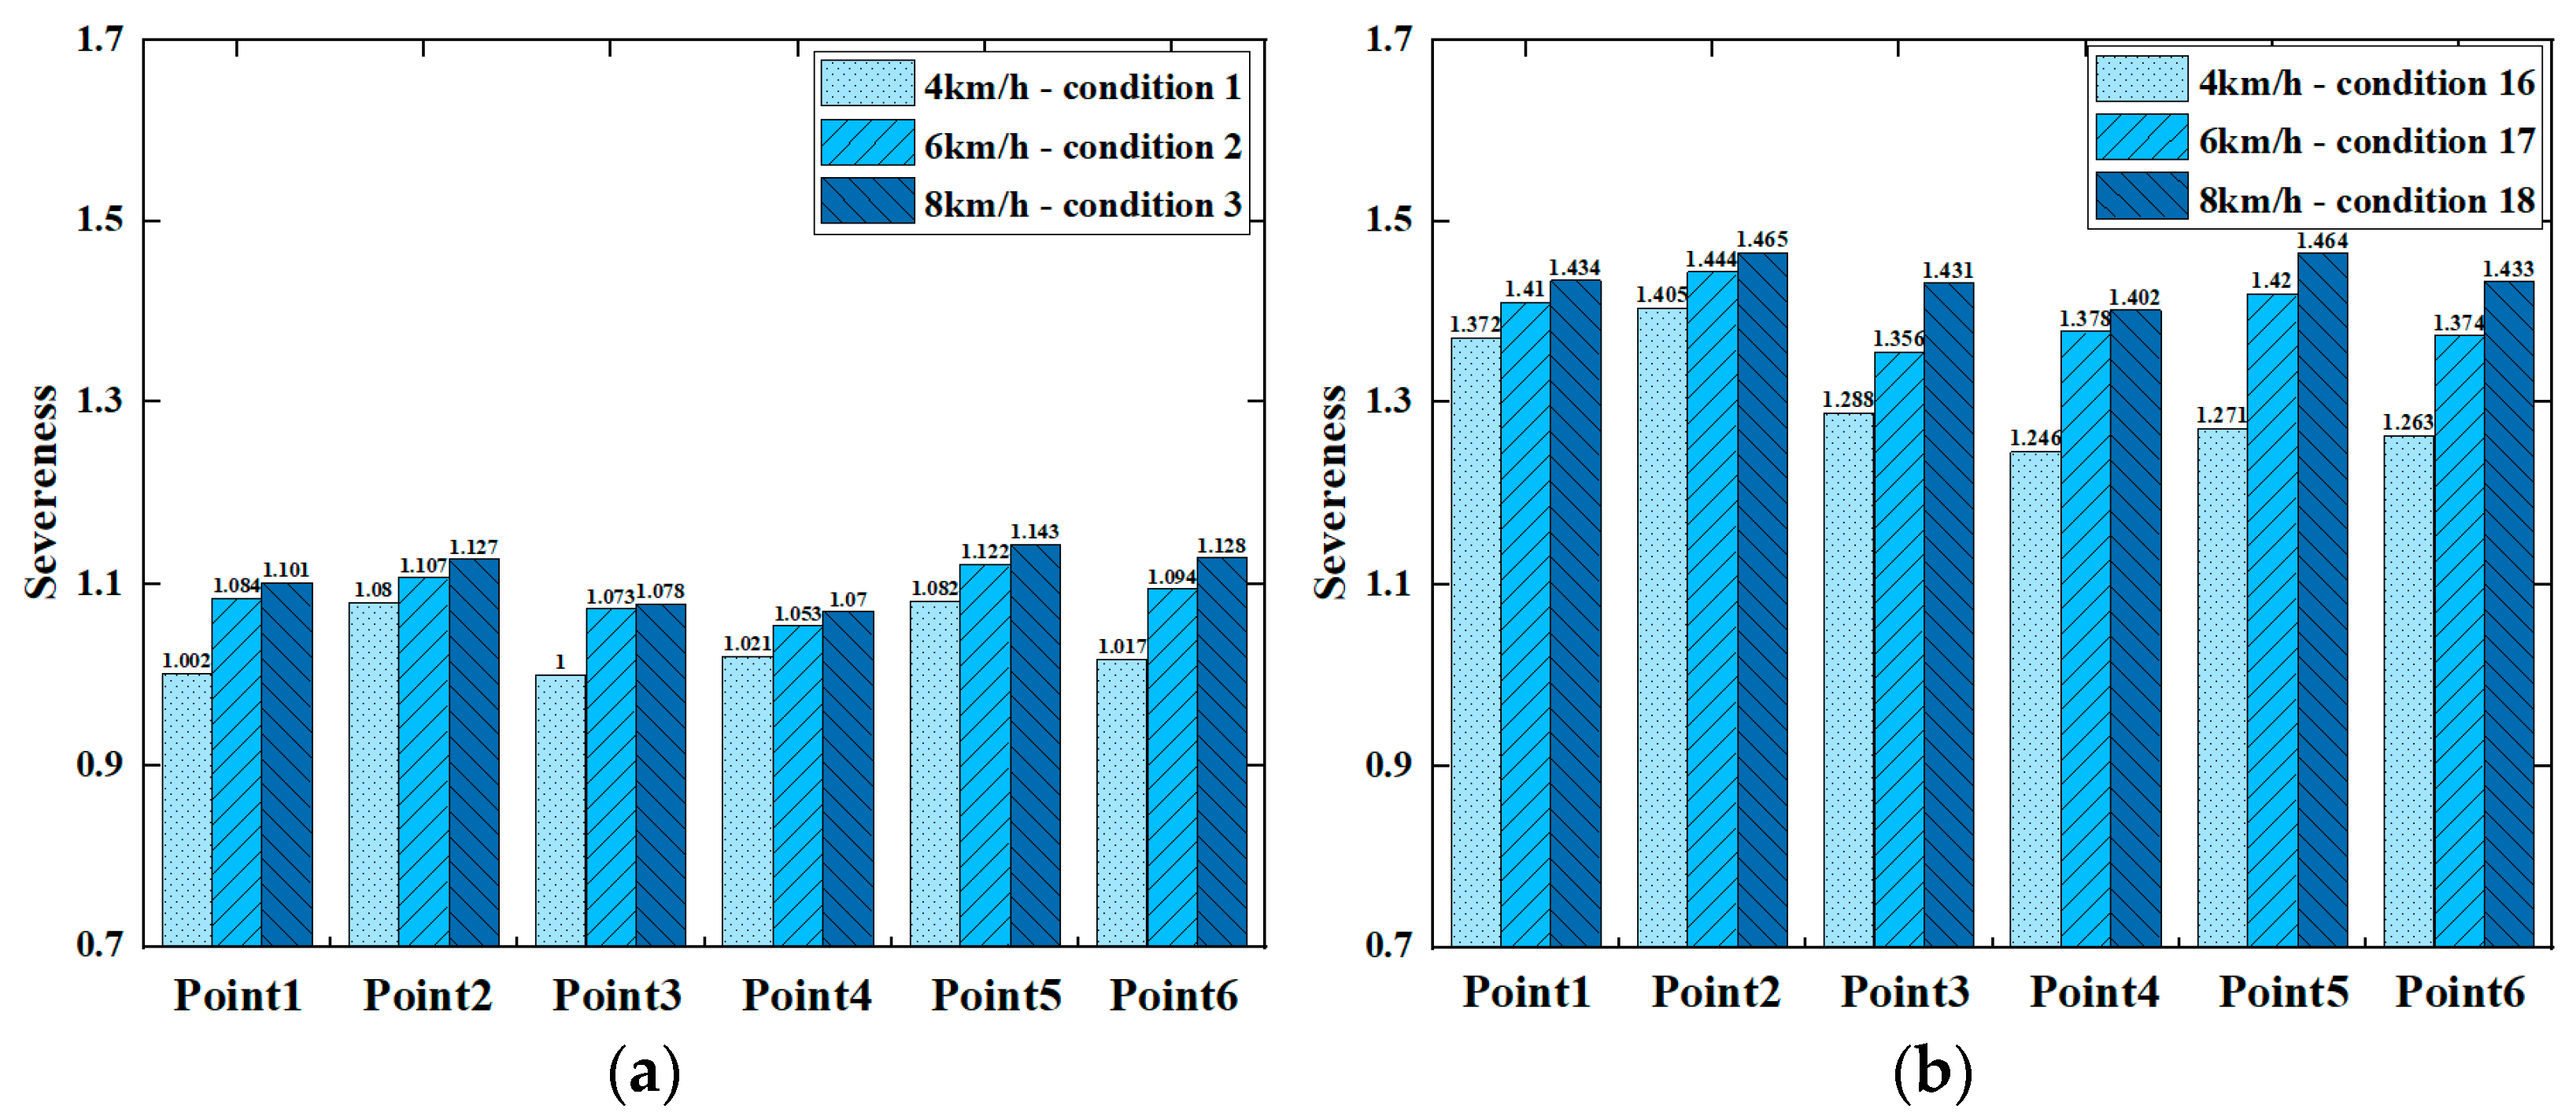
3.3. Fatigue Damage Impact Analysis Results
3.3.1. Soil Penetration Resistance
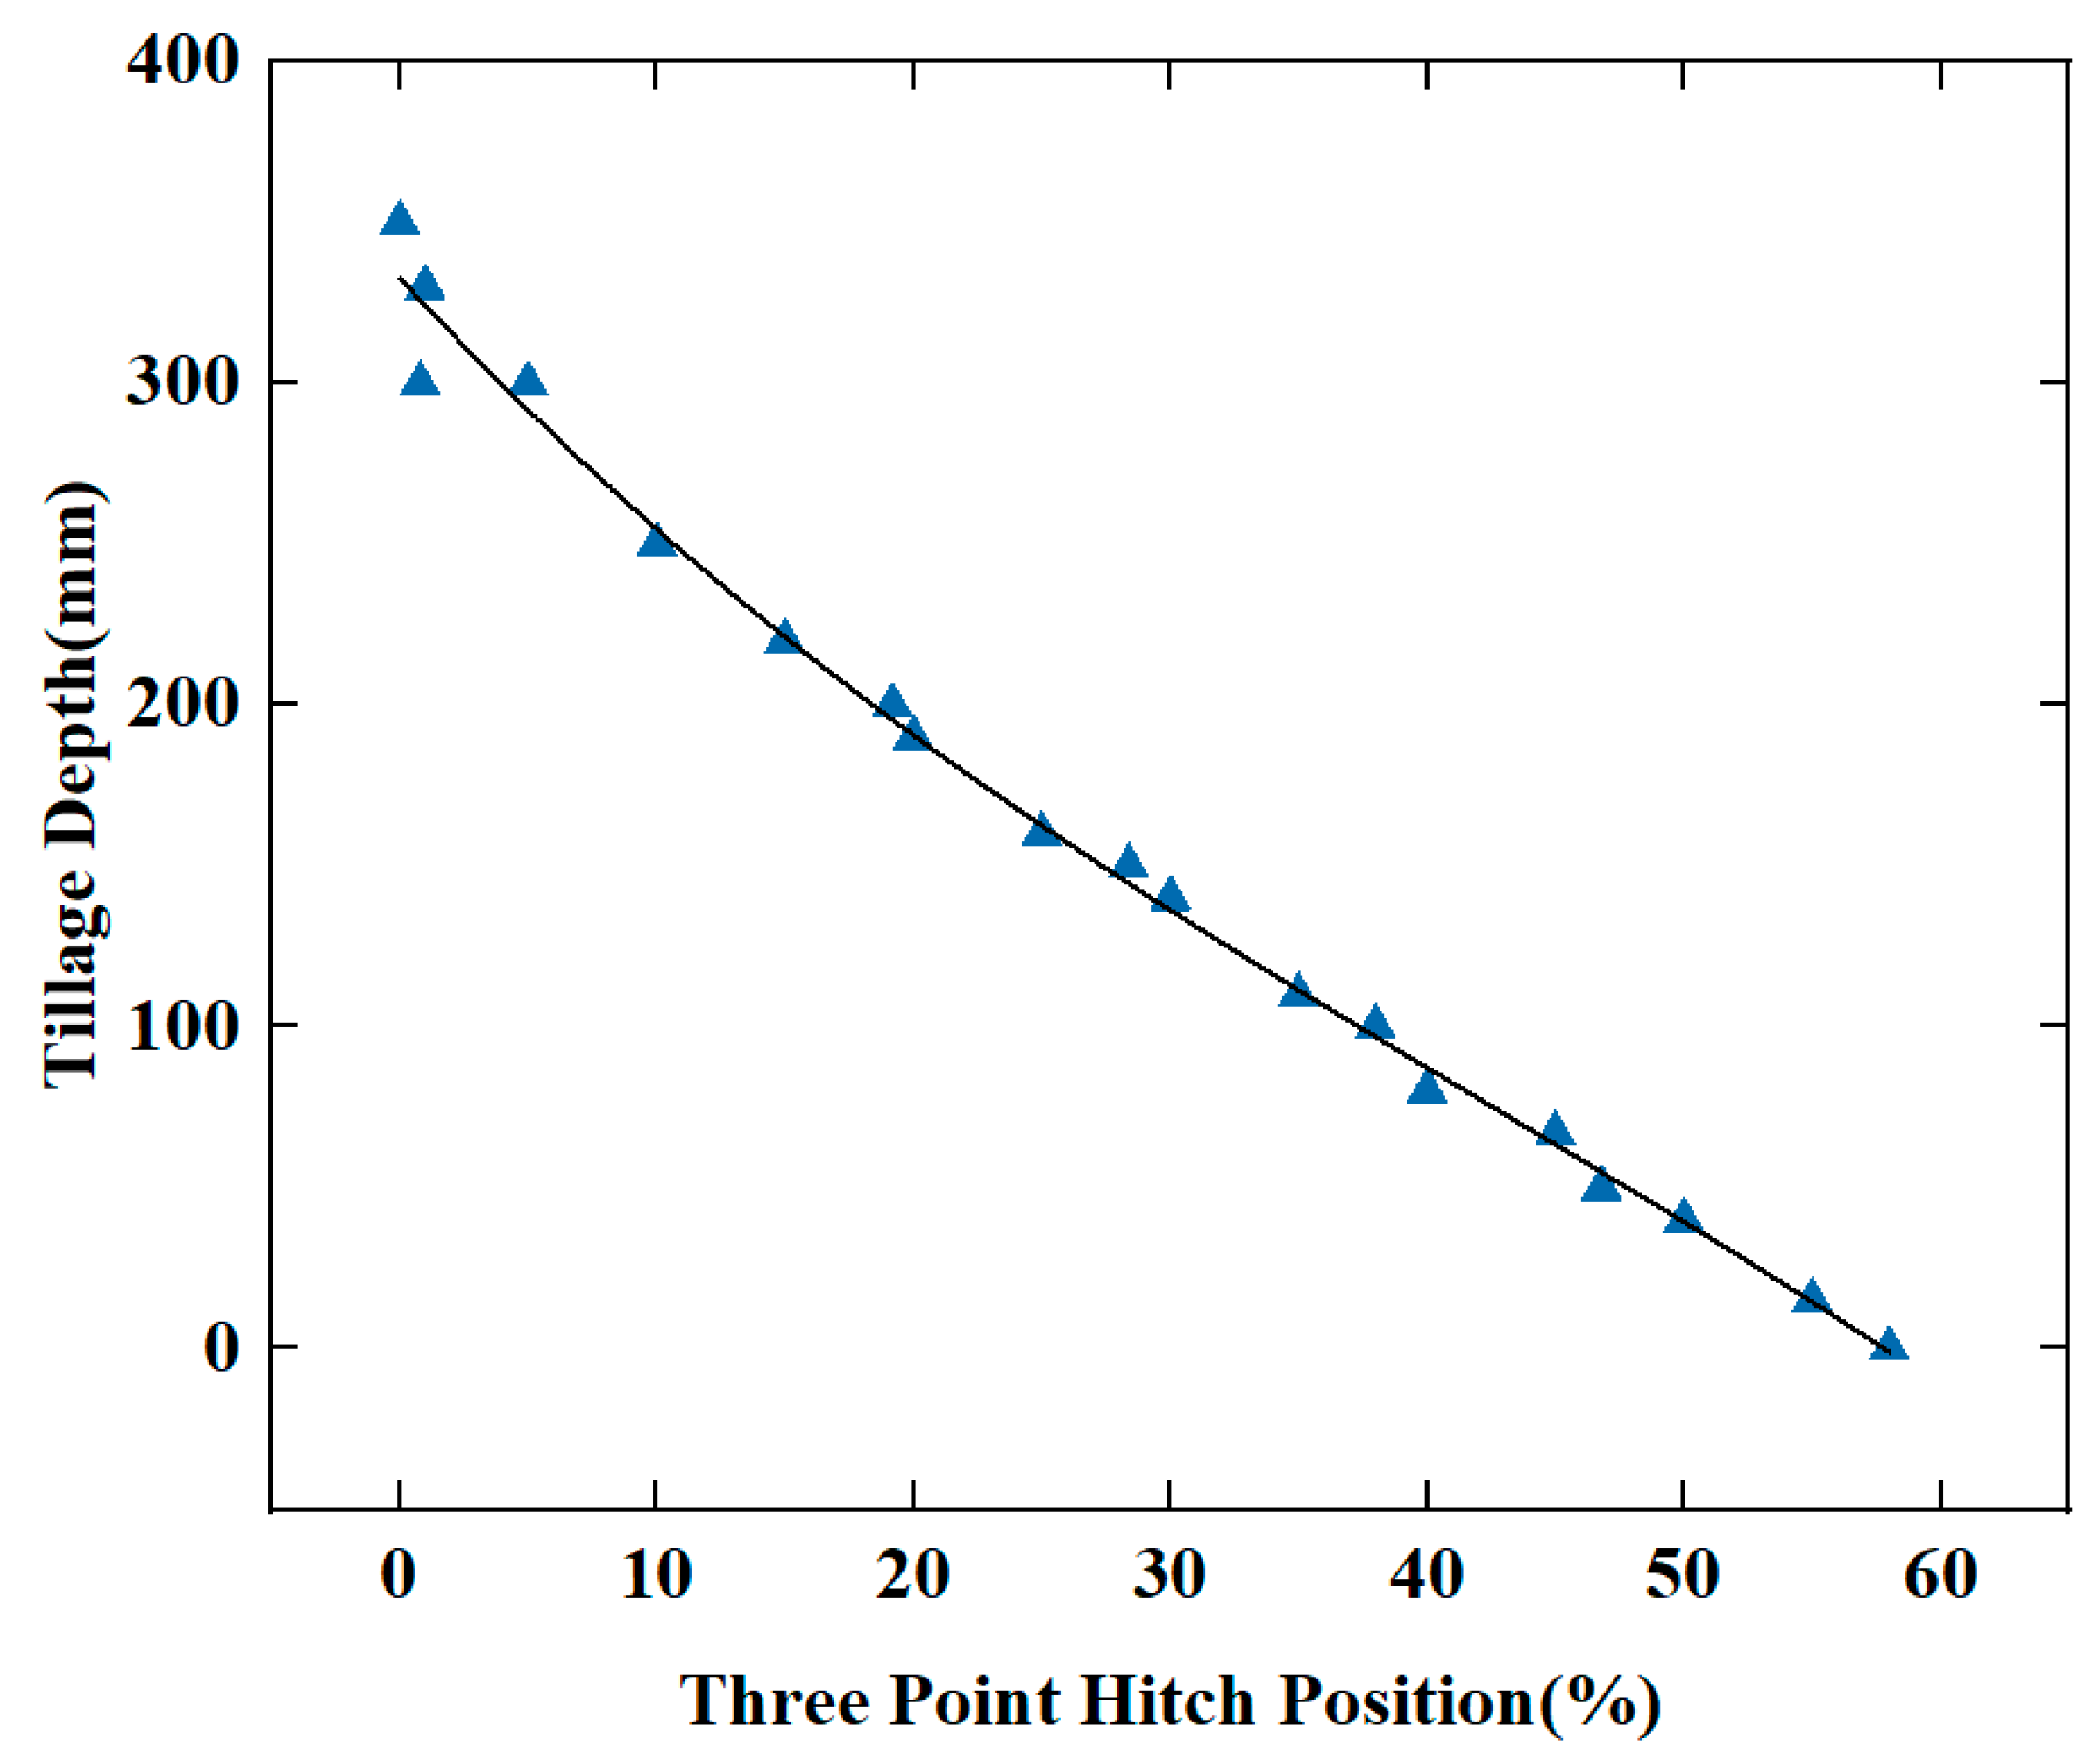
3.3.2. Tillage Depth
3.3.3. Operating Speed
4. Conclusions
Author Contributions
Funding
Institutional Review Board Statement
Data Availability Statement
Acknowledgments
Conflicts of Interest
References
- Kertész, Á.; Madarász, B. Conservation agriculture in Europe. Int. Soil Water Conserv. Res. 2014, 2, 91–96. [Google Scholar] [CrossRef]
- Lv, L.; Gao, Z.; Liao, K.; Zhu, Q.; Zhu, J. Impact of conservation tillage on the distribution of soil nutrients with depth. Soil Tillage Res. 2022, 225, 105527. [Google Scholar] [CrossRef]
- Cooper, R.J.; Hama-Aziz, Z.Q.; Hiscock, K.M.; Lovett, A.A.; Vrain, E.; Dugdale, S.J.; Sünnenberg, G.; Dockerty, T.; Hovesen, P.; Noble, L. Conservation tillage and soil health: Lessons from a 5-year UK farm trial (2013–2018). Soil Tillage Res. 2020, 202, 104648. [Google Scholar] [CrossRef]
- Jia, L.; Zhao, W.; Zhai, R.; Liu, Y.; Kang, M.; Zhang, X. Regional differences in the soil and water conservation efficiency of conservation tillage in China. Catena 2019, 175, 18–26. [Google Scholar] [CrossRef]
- Song, W.; Jiang, X.; Li, L.; Ren, L.; Tong, J. Increasing the width of disturbance of plough pan with bionic inspired subsoilers. Soil Tillage Res. 2022, 220, 105356. [Google Scholar] [CrossRef]
- Madarász, B.; Jakab, G.; Szalai, Z.; Juhos, K.; Kotroczó, Z.; Tóth, A.; Ladányi, M. Long-term effects of conservation tillage on soil erosion in Central Europe: A random forest-based approach. Soil Tillage Res. 2021, 209, 104959. [Google Scholar] [CrossRef]
- Zhang, Y.; Tan, C.; Wang, R.; Li, J.; Wang, X. Conservation tillage rotation enhanced soil structure and soil nutrients in long-term dryland agriculture. Eur. J. Agron. 2021, 131, 126379. [Google Scholar] [CrossRef]
- Ning, T.; Liu, Z.; Hu, H.; Li, G.; Kuzyakov, Y. Physical, chemical and biological subsoiling for sustainable agriculture. Soil Tillage Res. 2022, 223, 105490. [Google Scholar] [CrossRef]
- Yin, Y.; Zhao, C.; Zhang, Y.; Chen, J.; Luo, C.; Wang, P.; Chen, L.; Meng, Z. Development and application of subsoiling monitoring system based on edge computing using IoT architecture. Comput. Electron. Agric. 2022, 198, 106976. [Google Scholar] [CrossRef]
- Sun, J.; Wang, Y.; Ma, Y.; Tong, J.; Zhang, Z. DEM simulation of bionic subsoilers (tillage depth >40 cm) with drag reduction and lower soil disturbance characteristics. Adv. Eng. Softw. 2018, 119, 30–37. [Google Scholar] [CrossRef]
- Kim, Y.S.; Kim, T.J.; Kim, Y.J.; Lee, S.D.; Park, S.U.; Kim, W.S. Development of a real-time tillage depth measurement system for agricultural tractors: Application to the effect analysis of tillage depth on draft force during plow tillage. Sensors 2022, 20, 912. [Google Scholar] [CrossRef] [PubMed]
- Kim, Y.S.; Lee, S.D.; Baek, S.M.; Baek, S.Y.; Jeon, H.H.; Lee, J.H.; Siddique, M.A.A.; Kim, Y.J.; Kim, W.S.; Sim, T.; et al. Development of DEM-MBD coupling model for draft force prediction of agricultural tractor with plowing depth. Comput. Electron. Agric. 2022, 202, 107405. [Google Scholar] [CrossRef]
- Kešner, A.; Chotěborský, R.; Linda, M.; Hromasová, M.; Katinas, E.; Sutanto, H. Stress distribution on a soil tillage machine frame segment with a chisel shank simulated using discrete element and finite element methods and validate by experiment. Biosyst. Eng. 2021, 209, 125–138. [Google Scholar] [CrossRef]
- Tekeste, M.Z.; Balvanz, L.R.; Hatfield, J.L.; Ghorbani, S. Discrete element modeling of cultivator sweep-to-soil interaction: Worn and hardened edges effects on soil-tool forces and soil flow. J. Terramech. 2019, 82, 1–11. [Google Scholar] [CrossRef]
- Ovchinnikov, A.S.; Mezhevova, A.S.; Novikov, A.E.; Fomin, S.D.; Pleskachev, Y.N.; Borisenko, I.B.; Zvolinsky, V.P.; Tyutyuma, N.V.; Vorontsova, E.S. Energy and agrotechnical indicators in the testing of machine-tractor units with subsoiler. ARPN J. Eng. Appl. Sci. 2017, 12, 7150–7160. [Google Scholar]
- Shafaei, S.M.; Mousazadeh, H. Review and analysis of state of the art, challenges, and opportunities concerned with development of drawbar dynamometer for tractor platforms. Comput. Electron. Agric. 2024, 223, 109100. [Google Scholar] [CrossRef]
- Ucgul, M.; Saunders, C.; Fielke, J.M. Comparison of the discrete element and finite element methods to model the interaction of soil and tool cutting edge. Biosyst. Eng. 2018, 169, 199–208. [Google Scholar] [CrossRef]
- Hoseinian, S.H.; Hemmat, A.; Esehaghbeygi, A.; Shahgoli, G.; Baghbanan, A. Development of a dual sideway-share subsurface tillage implement: Part 2. Effect of tool geometry on tillage forces and soil disturbance characteristics. Soil Tillage Res. 2022, 215, 105200. [Google Scholar] [CrossRef]
- Wang, X.; Zhang, S.; Pan, H.; Zheng, Z.; Huang, Y.; Zhu, R. Effect of soil particle size on soil-subsoiler interactions using the discrete element method simulations. Biosyst. Eng. 2019, 182, 138–150. [Google Scholar] [CrossRef]
- Shafaei, S.M.; Loghavi, M.; Kamgar, S. A comparative study between mathematical models and the ANN data mining technique in draft force prediction of disk plow implement in clay loam soil. Agric. Eng. Int. CIGR J. 2018, 20, 71–79. [Google Scholar]
- Zhao, J.; Zhao, S.; Luding, S. The role of particle shape in computational modelling of granular matter. Nat. Rev. Phys. 2023, 5, 505–525. [Google Scholar] [CrossRef]
- Lei, Q.; Latham, J.P.; Tsang, C.F. The use of discrete fracture networks for modelling coupled geomechanical and hydrological behaviour of fractured rocks. Comput. Geotech. 2017, 85, 151–176. [Google Scholar] [CrossRef]
- Ahmadi, I. Effect of soil, machine, and working state parameters on the required draft force of a subsoiler using a theoretical draft-calculating model. Soil Tillage Res. 2016, 55, 389–400. [Google Scholar] [CrossRef]
- Ucgul, M.; Fielke, J.M.; Saunders, C. 3D DEM tillage simulation: Validation of a hysteretic spring (plastic) contact model for a sweep tool operating in a cohesionless soil. Soil Tillage Res. 2014, 144, 220–227. [Google Scholar] [CrossRef]
- Wen, C.; Xie, B.; Li, Z.; Yin, Y.; Zhao, X.; Song, Z. Power density based fatigue load spectrum editing for accelerated durability testing for tractor front axles. Biosyst. Eng. 2020, 200, 73–88. [Google Scholar] [CrossRef]
- Wen, C.; Xie, B.; Song, Z.; Yang, Z.; Dong, N.; Han, J.; Yang, Q.; Liu, J. Methodology for designing tractor accelerated structure tests for an indoor drum-type test bench. Biosyst. Eng. 2021, 205, 1–26. [Google Scholar] [CrossRef]
- Wen, C.K.; Li, R.C.; Zhao, C.J.; Chen, L.P.; Wang, M.H.; Yin, Y.X.; Meng, Z.J. An improved LSTM-based model for identifying high working intensity load segments of the tractor load spectrum. Comput. Electron. Agric. 2023, 210, 107879. [Google Scholar] [CrossRef]
- Kichler, C.M.; Fulton, J.P.; Raper, R.L.; McDonald, T.P.; Zech, W.C. Effects of transmission gear selection on tractor performance and fuel costs during deep tillage operations. Soil Tillage Res. 2011, 113, 105–111. [Google Scholar] [CrossRef]
- Moeinfar, A.; Mousavi-Seyedi, S.R.; Kalantari, D. Influence of tillage depth, penetration angle and forward speed on the soil/thin-blade interaction force. Agric. Eng. Int. CIGR J. 2014, 16, 69–74. [Google Scholar]
- Kim, Y.J.; Chung, S.O.; Choi, C.H. Effects of gear selection of an agricultural tractor on transmission and PTO load during rotary tillage. Soil Tillage Res. 2013, 134, 90–96. [Google Scholar] [CrossRef]
- Bauer, F.; Porteš, P.; Polcar, A.; Čupera, J.; Fajman, M. Differences in the wheel loads and contact pressure of the in-furrow and on-land rear tractor tyres with mounted and semi-mounted ploughs. Soil Tillage Res. 2022, 215, 105190. [Google Scholar] [CrossRef]
- Kim, J.H.; Kim, K.U.; Choi, C.W.; Wu, Y.G. Severeness of transmission loads of agricultural tractors. J. Biosyst. Eng. 1998, 23, 417–426. [Google Scholar]
- Kim, J.H.; Kim, K.U.; Wu, Y.G. Analysis of transmission load of agricultural tractors. J. Terramech. 2000, 37, 113–125. [Google Scholar] [CrossRef]
- Oksanen, T.; Öhman, M.; Miettinen, M. ISO 11783–Standard and its Implementation. IFAC Proc. Vol. 2005, 38, 69–74. [Google Scholar] [CrossRef]


| Sensor Type | Model Number | Parameters | Output Method |
|---|---|---|---|
| Vibration sensors | INV9822 | Uniaxial; Piezoelectric; IEPE Type | Analog Voltage |
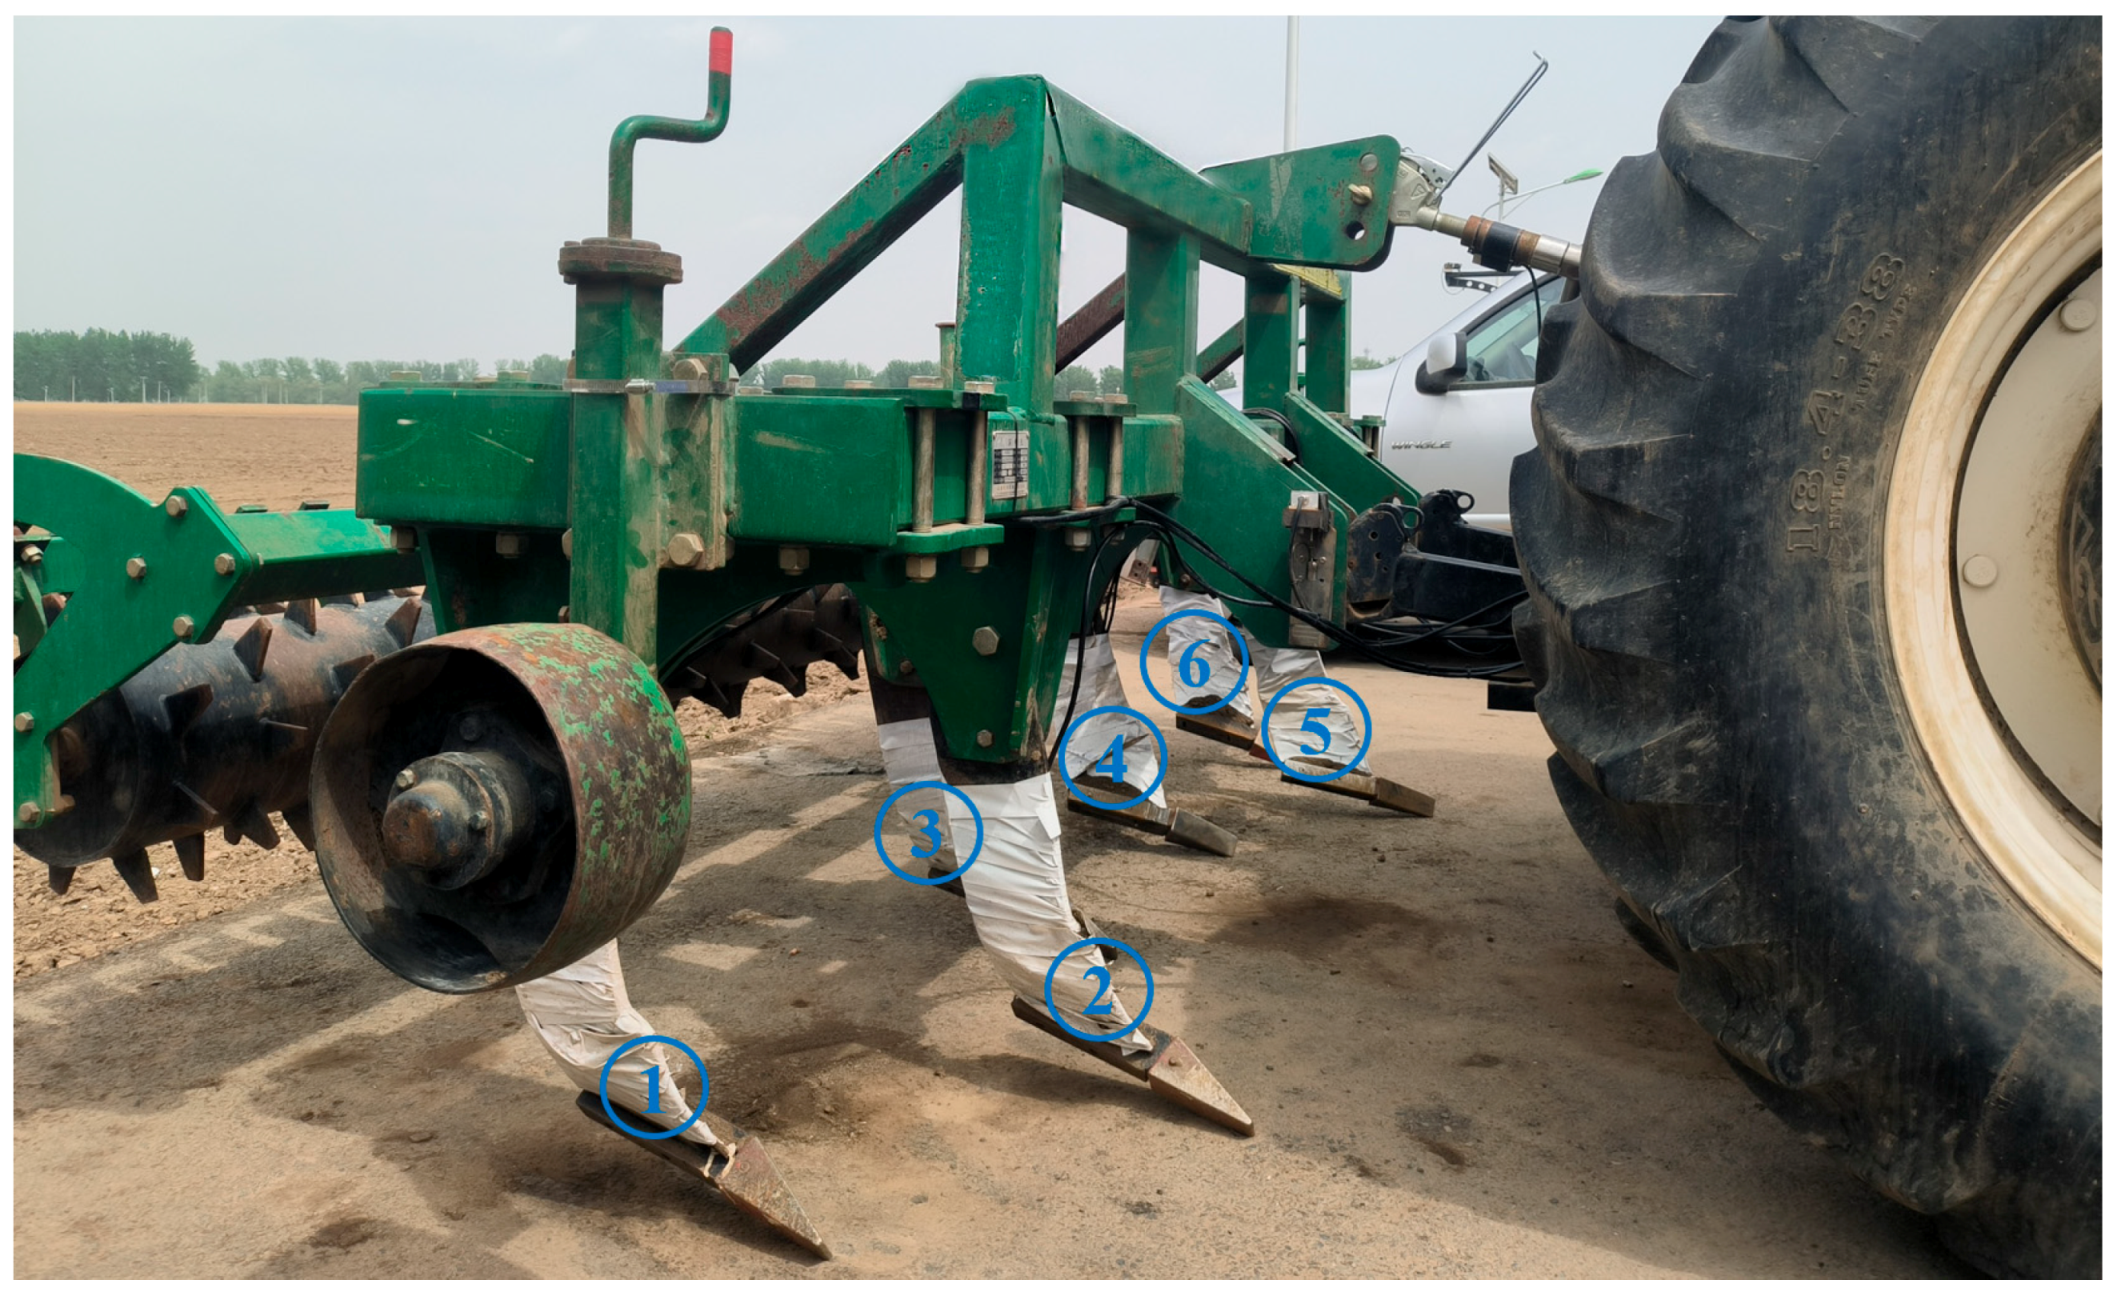
| Strain gauges | BHF350-3CA | Triaxial 45 ° Strain Flower; Sensitive Grid Resistance 350 Ω | Analog Voltage |
| Tension sensors | TZ207 | 12 V supply, 0–5 t range | RS485 |
| Traction sensors | TL08 | 12 V supply, 0–3 t range | Analog Voltage |
| Inclination sensor | BWM415 | 12 V supply, 0.01° accuracy, ±180° range | CAN |
| Hydraulic pressure sensor | MIK-P300 | 12 V supply, 0–40 MPa range | Analog Voltage |
| Acceleration sensor | ACC345 | 5 V power supply, output frequency 200 Hz, range 16 g | TTL |
| GNSS Receivers | AMG_PFZ202 | GPGGA, GPVTG statement output, output frequency 10 Hz | RS232 |
| Equipment | Parameters |
|---|---|
| Compact DAQ 9135 control host | 8 slots; operating temperature −40~70 °C |
| NI-9205 Voltage acquisition module | Maximum sampling rate 200 kS/s/ch |
| NI-9236 Strain gauge module | Maximum sampling rate 10 kS/s/ch; 8 channels |
| NI-9234 Vibration acquisition module | Maximum sampling rate 51.2 kS/s/ch; 4 channels |
| NI-9862 CAN Interface module | Transmission rate 1 Mbit/s; |
| Portable displays | Touch screen; mobile network connectable |
| Item | Specification |
|---|---|
| Engine rated power/hp | 142 |
| Engine rated speed/(r/min) | 2200 |
| Length × width× height/(mm × mm × mm) | 5290 × 2414 × 3115 |
| Total Weight/kg | 5400 |
| Track width/mm | 1530~2230 |
| Wheelbase/mm | 2739 |
| Item | Specification |
|---|---|
| Total Weight/kg | 1200 |
| Length × width× height/(mm × mm × mm) | 2600 × 2900 × 1350 |
| Required power/kW | 91.9~110.2 |
| Working depth/mm | 250~400 |
| Working width/mm | 2700 |
| Number of rows | 6 |
| Measured Depth (cm) | Soil Type | |
|---|---|---|
| Sandy and Loamy | Clayey | |
| 20 | 7.3% | 24.7% |
| 25 | 8.1% | 25.6% |
| 30 | 9.4% | 26.4% |
| 35 | 10.6% | 27.2% |
| Work Condition Number | Soil Type | Tillage Depth (mm) | Operating Speed | |||||
|---|---|---|---|---|---|---|---|---|
| Sandy and Loamy (1750 kPa) | Clayey (2750 kPa) | 250 | 300 | 350 | Slow (4 km/h) | Normal (6 km/h) | Fast (8 km/h) | |
| 1 | √ | √ | √ | |||||
| 2 | √ | √ | √ | |||||
| 3 | √ | √ | √ | |||||
| 4 | √ | √ | √ | |||||
| 5 | √ | √ | √ | |||||
| 6 | √ | √ | √ | |||||
| 7 | √ | √ | √ | |||||
| 8 | √ | √ | √ | |||||
| 9 | √ | √ | √ | |||||
| 10 | √ | √ | √ | |||||
| 11 | √ | √ | √ | |||||
| 12 | √ | √ | √ | |||||
| 13 | √ | √ | √ | |||||
| 14 | √ | √ | √ | |||||
| 15 | √ | √ | √ | |||||
| 16 | √ | √ | √ | |||||
| 17 | √ | √ | √ | |||||
| 18 | √ | √ | √ | |||||
| Number | Field Operating Condition | Principal Stress (MPa) | Drawbar Pull (kN) | |||||||
|---|---|---|---|---|---|---|---|---|---|---|
| Soil Type | Tillage Depth (mm) | Operating Speed (km/h) | Measurement Point | |||||||
| 1 | 2 | 3 | 4 | 5 | 6 | |||||
| 1 | Sandy and loamy (1750 kPa) | 250 | 4 | 6.78 | 9.13 | 6.73 | 5.35 | 9.29 | 7.02 | 3.20 |
| 2 | 6 | 9.64 | 11.29 | 8.66 | 7.68 | 12.01 | 12.16 | 3.52 | ||
| 3 | 8 | 10.96 | 12.17 | 9.68 | 8.46 | 14.98 | 12.24 | 3.81 | ||
| 4 | 300 | 4 | 11.34 | 17.31 | 8.49 | 8.36 | 15.45 | 12.37 | 3.37 | |
| 5 | 6 | 16.55 | 22.91 | 13.98 | 11.99 | 15.21 | 13.08 | 3.60 | ||
| 6 | 8 | 18.63 | 27.13 | 17.65 | 18.93 | 27.13 | 20.74 | 4.03 | ||
| 7 | 350 | 4 | 24.12 | 25.04 | 11.68 | 9.71 | 25.02 | 23.64 | 3.41 | |
| 8 | 6 | 25.67 | 28.53 | 20.68 | 19.97 | 28.53 | 24.81 | 3.62 | ||
| 9 | 8 | 25.88 | 30.98 | 19.56 | 20.34 | 29.86 | 26.95 | 4.16 | ||
| 10 | Clayey (2750 kPa) | 250 | 4 | 14.28 | 17.07 | 12.96 | 13.35 | 14.24 | 10.21 | 3.29 |
| 11 | 6 | 23.27 | 25.55 | 17.67 | 17.68 | 21.45 | 19.78 | 3.86 | ||
| 12 | 8 | 25.98 | 27.58 | 22.78 | 25.46 | 28.78 | 27.96 | 4.75 | ||
| 13 | 300 | 4 | 26.71 | 26.72 | 17.44 | 18.36 | 21.27 | 19.34 | 3.92 | |
| 14 | 6 | 30.21 | 32.37 | 25.97 | 21.99 | 31.08 | 26.55 | 4.64 | ||
| 15 | 8 | 30.61 | 33.39 | 27.65 | 28.93 | 32.78 | 29.75 | 5.18 | ||
| 16 | 350 | 4 | 28.68 | 29.16 | 26.68 | 19.71 | 27.02 | 26.12 | 4.66 | |
| 17 | 6 | 33.86 | 35.26 | 29.68 | 29.97 | 28.53 | 25.67 | 5.47 | ||
| 18 | 8 | 34.89 | 36.83 | 33.56 | 32.34 | 35.86 | 33.78 | 5.88 | ||
| Operating Condition | Measurement Point | Extreme Value Type | Threshold/MPa | Shape Parameter ξ | Scaling Parameter σ | Goodness of Fit |
|---|---|---|---|---|---|---|
| 4 | 1 | Maximum | 18.7482 | −1.10776 | 16.13427 | 0.998555 |
| Minimum | 4.14824 | −1.49567 | 22.43508 | 0.995136 | ||
| 2 | Maximum | 24.1929 | −1.17943 | 13.70053 | 0.996393 | |
| Minimum | 10.1929 | −1.1883 | 17.03445 | 0.960837 | ||
| 3 | Maximum | 14.7388 | −1.35723 | 2.226067 | 0.985659 | |
| Minimum | 5.2388 | −0.46093 | 1.680263 | 0.955347 | ||
| 15 | 4 | Maximum | 18.0215 | −1.14000 | 7.628577 | 0.996982 |
| Minimum | 30.1215 | −1.16723 | 7.353549 | 0.995532 | ||
| 5 | Maximum | 43.2032 | −0.59923 | 4.876758 | 0.966772 | |
| Minimum | 21.1032 | −1.19526 | 7.410575 | 0.993483 | ||
| 6 | Maximum | 22.1272 | −1.06036 | 1.165446 | 0.999607 | |
| Minimum | 17.7272 | −0.75911 | 0.988476 | 0.993430 | ||
| 18 | 4 | Maximum | 44.2627 | −1.45818 | 5.784182 | 0.974496 |
| Minimum | 26.1373 | −1.13002 | 18.53236 | 0.997188 | ||
| 5 | Maximum | 42.507 | −1.20883 | 64.52458 | 0.995447 | |
| Minimum | 21.8934 | −1.32865 | 6.643293 | 0.990065 | ||
| 6 | Maximum | 50.8316 | −1.38609 | 6.518919 | 0.999079 | |
| Minimum | 17.1376 | −1.08762 | 3.378114 | 0.998668 |
| Work Condition Number | Soil Type | Tillage Depth (mm) | Operating Speed | Fatigue Damage (×10−5) | Duncan’s Multiple Range Tests | |||||
|---|---|---|---|---|---|---|---|---|---|---|
| Measurement Point | ||||||||||
| 1 | 2 | 3 | 4 | 5 | 6 | |||||
| 1 | Sandy and loamy (1750 kPa) | 250 | 4 | 3.412 | 3.677 | 3.404 | 3.475 | 3.683 | 3.463 | Bc |
| 2 | 6 | 3.691 | 3.768 | 3.653 | 3.586 | 3.818 | 3.725 | Ac | ||
| 3 | 8 | 3.749 | 3.836 | 3.669 | 3.642 | 3.892 | 3.840 | Ab | ||
| 4 | 300 | 4 | 3.776 | 4.092 | 3.690 | 3.739 | 3.997 | 3.883 | Bb | |
| 5 | 6 | 4.003 | 4.215 | 3.866 | 3.703 | 3.914 | 3.901 | Ba | ||
| 6 | 8 | 4.038 | 4.296 | 4.101 | 4.066 | 4.353 | 4.083 | Ab | ||
| 7 | 350 | 4 | 4.240 | 4.259 | 3.896 | 3.995 | 4.268 | 4.233 | Aa | |
| 8 | 6 | 4.263 | 4.407 | 4.168 | 4.085 | 4.403 | 4.295 | Aa | ||
| 9 | 8 | 4.270 | 4.532 | 4.076 | 4.121 | 4.414 | 4.388 | Aa | ||
| 10 | Clayey (2750 kPa) | 250 | 4 | 3.773 | 4.113 | 3.813 | 3.828 | 3.996 | 3.762 | Cc |
| 11 | 6 | 4.221 | 4.263 | 3.998 | 4.016 | 4.101 | 4.089 | Bc | ||
| 12 | 8 | 4.288 | 4.410 | 4.163 | 4.208 | 4.409 | 4.302 | Ac | ||
| 13 | 300 | 4 | 4.415 | 4.423 | 3.989 | 4.086 | 4.096 | 4.088 | Cb | |
| 14 | 6 | 4.707 | 4.843 | 4.269 | 4.112 | 4.398 | 4.330 | Bb | ||
| 15 | 8 | 4.726 | 4.858 | 4.540 | 4.605 | 4.862 | 4.658 | Ab | ||
| 16 | 350 | 4 | 4.670 | 4.782 | 4.385 | 4.243 | 4.326 | 4.300 | Ba | |
| 17 | 6 | 4.801 | 4.915 | 4.616 | 4.691 | 4.833 | 4.677 | Aa | ||
| 18 | 8 | 4.883 | 4.988 | 4.872 | 4.773 | 4.985 | 4.878 | Aa | ||
Disclaimer/Publisher’s Note: The statements, opinions and data contained in all publications are solely those of the individual author(s) and contributor(s) and not of MDPI and/or the editor(s). MDPI and/or the editor(s) disclaim responsibility for any injury to people or property resulting from any ideas, methods, instructions or products referred to in the content. |
© 2024 by the authors. Licensee MDPI, Basel, Switzerland. This article is an open access article distributed under the terms and conditions of the Creative Commons Attribution (CC BY) license (https://creativecommons.org/licenses/by/4.0/).
Share and Cite
Zhang, B.; Bai, T.; Wu, G.; Wang, H.; Zhu, Q.; Zhang, G.; Meng, Z.; Wen, C. Fatigue Analysis of Shovel Body Based on Tractor Subsoiling Operation Measured Data. Agriculture 2024, 14, 1604. https://doi.org/10.3390/agriculture14091604
Zhang B, Bai T, Wu G, Wang H, Zhu Q, Zhang G, Meng Z, Wen C. Fatigue Analysis of Shovel Body Based on Tractor Subsoiling Operation Measured Data. Agriculture. 2024; 14(9):1604. https://doi.org/10.3390/agriculture14091604
Chicago/Turabian StyleZhang, Bing, Tiecheng Bai, Gang Wu, Hongwei Wang, Qingzhen Zhu, Guangqiang Zhang, Zhijun Meng, and Changkai Wen. 2024. "Fatigue Analysis of Shovel Body Based on Tractor Subsoiling Operation Measured Data" Agriculture 14, no. 9: 1604. https://doi.org/10.3390/agriculture14091604