Article

Modeling for Apple-Slice Drying in Carbon Dioxide Gas

School of Mechanical Engineering, Hanoi University of Science and Technology, Hanoi 112400, Vietnam
*
Author to whom correspondence should be addressed.
Agriculture 2024, 14(9), 1642; https://doi.org/10.3390/agriculture14091642
Submission received: 6 August 2024 / Revised: 10 September 2024 / Accepted: 14 September 2024 / Published: 19 September 2024
(This article belongs to the Section Agricultural Product Quality and Safety)

Abstract

:
In this study, a numerical model of a modified air-drying process of apple slices that considers the conjugate heat and mass transfer in the drying chamber is developed. Inside the apple slice sample, the continuum model is incorporated to describe the non-isothermal two-phase transport. The intra- and extra-sample heat, mass, and momentum transfer are coupled to simulate the transportation phenomena inside the drying chamber using the finite volume method implemented in computational fluid dynamic software (COMSOL Multiphysics 6.0). In this manner, temperature, velocity, moisture content of the drying agent inside the chamber, sample temperature, and moisture content distributions can be predicted. The validity of the proposed model is confirmed by a good agreement between the numerical and experimental data in terms of the overall evaporation rate and temperature. The simulation results indicate that the maldistribution of the convective heat and mass transfer resistance on the sample surface is significant. This can be explained by the nonuniform velocity distribution inside the drying chamber. Additionally, both experimental and numerical observations show that the drying process can be divided into two periods: the quasi-constant drying rate and falling drying rate periods. The impact of dryer operational conditions on the drying process is numerically investigated.

1. Introduction

Convective drying of fruits and vegetables offers several benefits, including extending shelf life, reducing food waste, and ensuring availability during the off-season. optimization of the drying process often requires a product-quality-centered approach targeting uniform and high-quality results in energy consumption, cycle time, and quality maintenance. In addition to the thermal effects, the appearance of oxygen in the drying agent is one of the main factors causing the degradation of sensitive nutrition components [1,2]. To restrain these unintended consequences, a modified air-drying technique has been developed. Indeed, the modified air can be gas or a gas mixture whose composition can be adjusted to exclude O2, such as CO2, N2, or a mixture of volatile compounds and air [2,3]. The application ability of this modern drying technique has been experimentally assessed for several foods such as apple, guava, potato, ginger, strawberry, pineapple, and carrot [1,4,5,6,7,8,9,10,11]. Particularly, apples, guava, papaya, and potato can yield better quality and ginger can retain bioactive ingredients if they are dried in an inert gas compared with hot air [1,5,9]. In one study, optimization of the drying condition of strawberries in a closed-cycle modified atmosphere dryer was investigated, in which the best product quality was found using an agent with 9.47% oxygen [6]. Pineapple can retain its volatile compounds and l-ascorbic acid if the air is modified by adding ethanol [10,11]. Additionally, an experimental study performed with nitrogen-enriched air showed that oxygen reduction can improve several product-quality parameters of carrots [7]. Those experimental results evidenced that the modified air-drying technique can yield better drying product quality compared to the conventional hot-air-drying process. However, the published data related to the experimental research are not sufficient for optimized designing and proper operating conditions of the modified air dryers. The fundamental understanding of the heat and mass transfer process inside the drying product and the thermo-hydraulic interaction between the sample and drying agent is mandatory for the wide application of modified air drying.
In terms of modeling, modified atmospheric drying can be considered as a convective drying process of food. Thus, the mathematical model developed for hot-air drying may also be applied for modified atmospheric drying. The intra-sample heat and mass transfer process that occurs during convective drying has been described by empirical, semi-empirical, and theoretical models. The evolution of the moisture ratio was mathematically fitted by using empirical correlations such as the Page model, Newton model, Logarithmic model, and Henderson and Pabis model [12,13]. These deterministic correlations can accurately reflect the experimental drying curves. However, the extrapolation ability of the empirical correlations is questionable, leading to limitations in the practical application of these models. To be more accurate, the external heat and mass transfer resistance between the drying sample and the drying agent was considered in semi-empirical models, whereas the temperature and moisture content distribution inside the sample was neglected. Those semi-empirical models are mathematically simple and computationally inexpensive [14,15,16,17]. Since the physical transport phenomenon is partly accounted for, the prediction ability of semi-empirical models is improved compared to empirical models. Recently, an anomalous model was built based on the simplified solution of the anomalous diffusion model for an infinite slab to extend the application ability of semi-empirical models. However, the internal distributions of temperature and moisture and the effects of those distributions have been not considered [18].
Theoretical models are the most comprehensive ones considering intra- and extra-sample heat and mass transfer. Classically, the Fourier law and Fick law have been employed to describe the heat and mass fluxes inside the sample, whereas the convective heat and mass transfer coefficients have been used to express the extra-sample transport resistances [4,12,19]. These diffusion models are also known as phenomenological models. By solving the heat and mass conservation equation system, the internal moisture content and temperature profile can be obtained numerically. To improve the model accuracy, the effective thermal conductivity and effective moisture diffusivity can be considered as complicated functions of moisture content and temperature. Although experimental observations can be well reflected by classical theory models, in the two phases, i.e., vapor and liquid water mixture, flow is not accounted for. Thus, in these examples, the liquid-vapor phase transition was assumed to occur at the sample surface only. This implies that the internal evaporation that happened during the intensive drying process at elevated temperatures cannot be modeled. Another coarse way to model the drying process is to opt for the receding front model, which assumes that the liquid water is mainly stationary [20,21]. In that research, the sample was separated as the wet core and dried part with the receding front boundary where the internal evaporation occurs. The drawback of the receding front approach is that the capillary pumping effect is not accounted for. This model may be suitable for the intensive drying process where the drying process is mainly controlled by heat transfer. The most rigorous physics-based theoretical model developed for describing convective drying, which is referred to as a continuum model, was proposed by Whitaker in 1960. In this continuum model, the transport phenomena involved in the drying process such as liquid capillary flow, internal vaporization, and air-vapor convective-diffusive flow were accounted for. Based on the underlying ideal of continuum models, Karim and his coauthors [22] were successful in modeling the drying of apple samples by 3D models.
In these models, constant ambient conditions and heat and mass transfer coefficients are assigned for the entire sample surface. These ideal boundary conditions may lead to inaccuracy of the calculated results since the maldistribution of the velocity, temperature, and relative humidity inside the dryer is remarkable. It should be noted that the flow maldistribution inside the industrial-scale dryer becomes more significant due to the interaction between the drying agent and a large number of drying samples. Thus, our major motivation in this study is to couple the intra- and extra-sample transport process to provide a better understanding of the impact of flow maldistribution on the uniformity of moisture content and temperature distribution. The model-based studies performed in this work can also be extended to assess the drying behavior of an actual dryer where numerous samples can be dried simultaneously.
In this work, a sophisticated computational fluid dynamic (CFD) model was developed to investigate the drying kinetics of the modified air-drying process, where CO2 gas was used as the drying agent instead of hot air. In this model, the intra- and extra-sample heat, mass, and momentum transport processes were taken into account simultaneously. Following this Introduction section, the proposed model is described in detail. Afterward, the simulated results are compared with the experimental observations. Additionally, a parametric study is conducted by performing a series of simulations to evaluate the effects of the drying conditions on the evaporation and temperature of apple slices.

2. Modeling

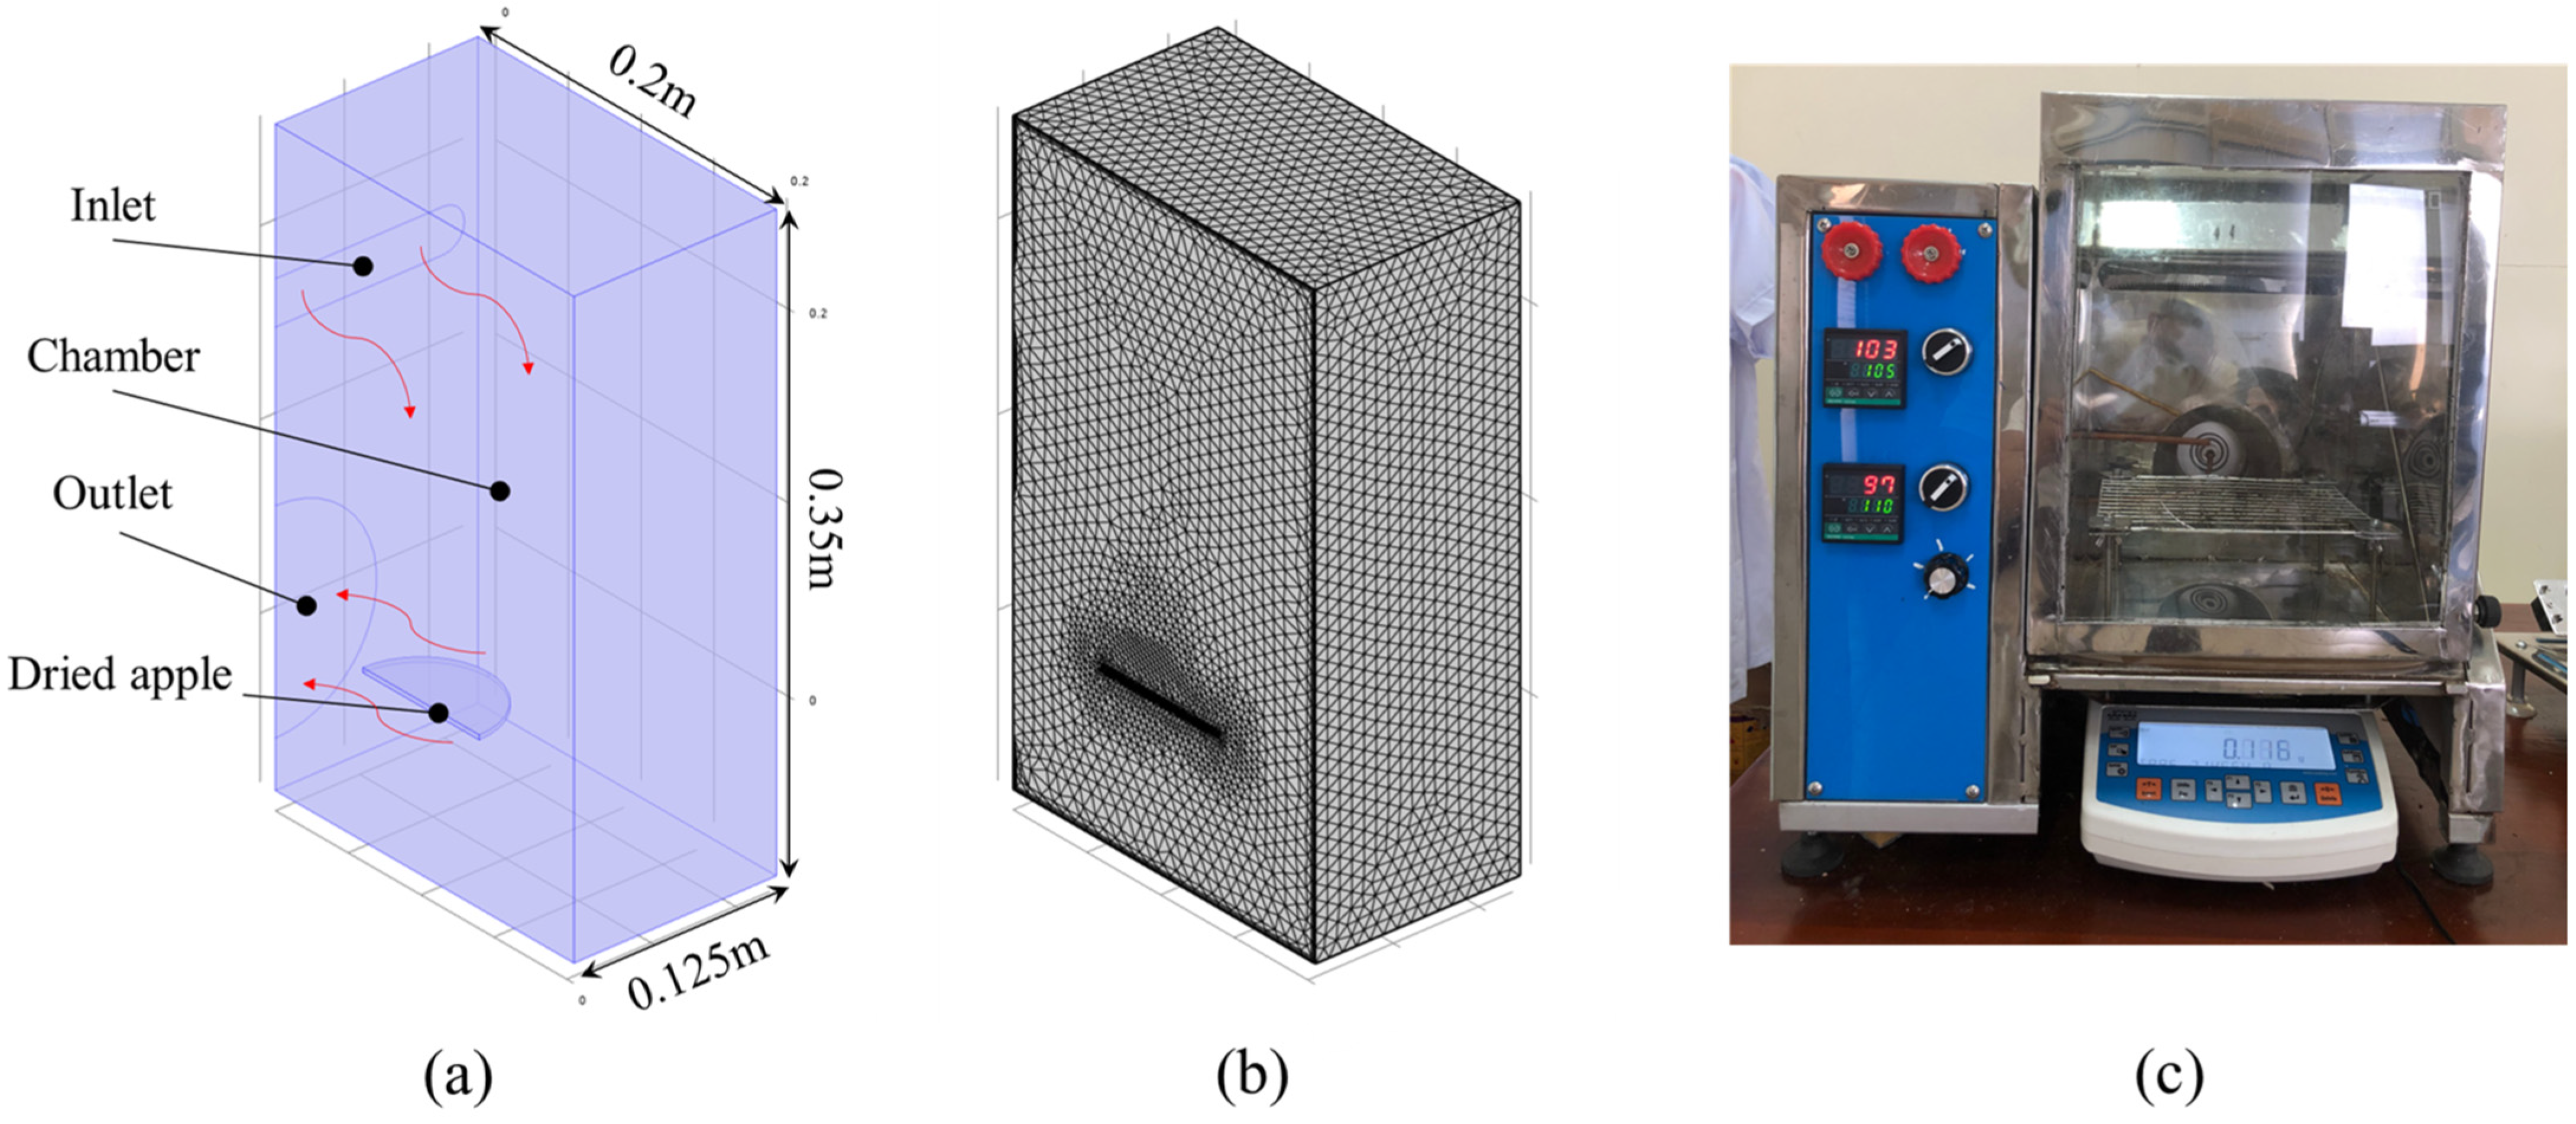
2.1. Problem Description

One drying apparatus was built to evaluate the drying behavior of the fruit layers with different drying agents. A sketch of the drying chamber with dimensions of H × D × W = 200 mm × 250 mm × 350 mm is shown in Figure 1. The chamber is insulated to avoid heat loss. Carbon dioxide from storage tanks is heated to the designed temperature before blowing into the chamber. One slice of apple is placed on the tray, the mass of which is checked continuously by an analytical balance (RAD WAG PS750, Radom, Poland). Every 3 min, the sample mass is recorded and stored in a computer. Temperatures at the center of the drying sample are monitored continuously during drying by a T-type thermocouple sensor (Omega, Norwalk, CT, USA).
In this work, apple (Malus pumila) fruit is used as the drying product because it is one of the most consumed fruits in the world and easily browns due to oxidation [1,23]. The Breeze apple imported from Freshco, New Zealand, was bought in Winmart, Hanoi, Vietnam, with identical ripeness. Before drying, it was cleaned and cut into about 2 mm thick slices with a diameter of 4 cm. In each drying case, one apple slice was put on the tray after the chamber temperature was stable. The mass of the dried sample and the temperature of the central apple slice were recorded during the drying until the mass reached a constant value, at which the evaporation ceased. In each drying case, the initial moisture content was checked by a thermo-plus (GMP500, ThermoPlus Air Inc, New York, NY, USA). Particularly, the fresh sample was dried at 120 °C for 2 h to determine the mass of liquid water and dry solid. The initial moisture content was about 85.1%. For the CO2 drying experiments, the gas velocity at the inlet was maintained at 2 m/s, whereas the gas temperature varied in a range from 105 °C to 120 °C. Product quality, especially the color of the dried apple slices, depends not only on temperature but also on the drying time. Thus, it is expected that high temperatures resulting in fast evaporation can give an insignificant change in the product color without the presence of oxygen [24,25]. However, this work concerned only evaporation kinetics; product quality is the next step of this work, in which we will conduct experiments in a wide range of drying conditions.

2.2. Mathematical Model

Apple slices are considered as porous media, and the drying agent is a continuous phase. The mathematical model includes conservation equations for three transport phases inside the drying sample and equations for the agent.

2.2.1. Model for Porous Media

For the porous media, the continuous model developed by [22] and [26] is recalled, in which the water–liquid transportation is described by capillary pressure as Darcy’s law:
τ ϕ S w ρ w + . ρ w k w k r , w μ w P D c c w = R e v a p
in which ϕ is apparent porosity; S w is the saturation of water; ρ w ( k g / m 3 ) , μ w ( P a . s ) , and c w ( k g / m 3 ) are density, viscosity, and mass concentration of water, respectively; k w ( m 2 ) and k r , w ( m 2 ) are the intrinsic permeability and relative permeability of water; D c m 2 / s is capillary diffusivity; Revap (kg/m3s) is the volumetric evaporation rate; p (Pa) is total pressure; and τ (s) is time.
The capillary diffusivity Dc is
D c = ρ w k w k r , w μ w p c c w
The conservation equation of vapor is written as
τ ϕ S g ρ g ω v + . ρ g ω v k g k r , g μ v P ϕ S g ρ g D e f f , g ω v = R e v a p
in which S g , ρ g ( k g / m 3 ) , k g m 2 , and k r , g m 2 are the saturation, density, intrinsic permeability, and relative permeability of gas and ω v , μ v P a . s are the mass fraction and viscosity of vapor.
Mass fraction of gas ω g is calculated by
ω g = 1 ω v
The gas phase is an ideal mixture of water vapor and carbon dioxide, in which the gas pressure Δ P is calculated based on the mass balance for the gas phase:
τ P M g R T ϕ S g + ρ g k g k r , g μ g P = R e v a p
where Mg (kg/mol) is the gas molecular weight, R (J/molK) is the universal gas constant, and T (°C) is product temperature.
Energy conservation of the element is expressed by
ρ e f f c p , e f f T τ + . ρ g k g k r , g μ g h g ( ρ w k w k r , w μ w P D c c w ) . h w = . k e f f T h f g R e v a p
in which hg (J) and hfg (J) are gas enthalpy and water enthalpy, respectively. The effective thermal conductivity k e f f (W/mK), effective thermal density ρ e f f (kg/m3), and effective heat capacity c p , e f f (J/kgK) of the material are calculated as follows:
k e f f = ϕ S g k t h , g + S w k t h , w + 1 ϕ k t h , s
ρ e f f = ϕ S g ρ g + S w ρ w + 1 ϕ ρ s
c p , e f f = ρ g c p , g ϕ 1 S w + ρ w c p , w ϕ S w + ρ s c p , s 1 ϕ
The evaporation rate R e v a p inside the apple sample is determined by
R e v a p = K e v a p M v R T p v , e q p v
where the evaporation constant Kevap is the reciprocal of equilibration time teq. For apples, this constant is about 103 s−1 [22,26,27]. The equilibrium pressure of vapor pv,eq and the partial vapor pressure pv are taken from isotherm of apple as in [1,22], but the properties of air are replaced by the properties of CO2.

2.2.2. Model for Gas Phase

Standard k ε is chosen as the model for gas transportation to calculate the velocity field. The heat and mass conservation equations are expressed as follows:
ρ g c p , g T g τ + ρ g u h g + k t h , g T g = 0
c i τ D c i + u c i = 0
where ρ g (kg/m3), c p , g (J/kgK), k t h , g (W/mK), and T g °C are the density, heat capacity, thermal conductivity, and temperature of gas; u (m/s) is the gas velocity; and c i (kg/m3) is the mass concentration of species i in gas.
At the sample surface, conjugate conditions are applied, in which the continuity of the thermal and vapor concentration field specifies the qualities of temperature, vapor concentration, heat and mass fluxes of a body, and flow at the vicinity of the interface. The gas phase is an ideal mixture of vapor and CO2. The convective–diffusive mass transfer equation is used to compute the vapor distribution in the gas phase. The conjugate heat transfer equation is where the convective thermal energy provided from the gas is used for both latent and sensible heating. The impermeable condition is assigned for the liquid water on this porous media and gas interface. The heat lost from the dryer is negligible.
The physical properties of water, vapor, and carbon dioxide were extracted from EES32 software (version 6.883) 3D and fitted as functions of temperature. The results are briefly presented in Table 1.
The input parameters including permeabilities and diffusivities were taken from [5] and are shown in Table 2.

2.2.3. Model Implementation

The proposed model was implemented in COMSOL Multiphysics 6.0. Figure 1b shows the mesh of the model, in which mesh is the structure mesh. The maximum mesh size of the sample was configured to be at least 10 times smaller compared to the chamber domain. Additionally, a boundary layer was created for the sample surface to enhance the calculation accuracy. The simulations were conducted with different mesh resolutions. The results obtained with the meshes with different element numbers (i.e., 0.3 million, 0.8 million, and 1.5 million) resulted in an unchanged evolution of moisture content over time. Particularly, the maximum element size of the sample and the chamber are 0.235 mm and 8.31 mm, respectively, for the mesh of 0.3 million elements. Thus, the mesh with 0.3 million elements was used for all simulation cases.

3. Results

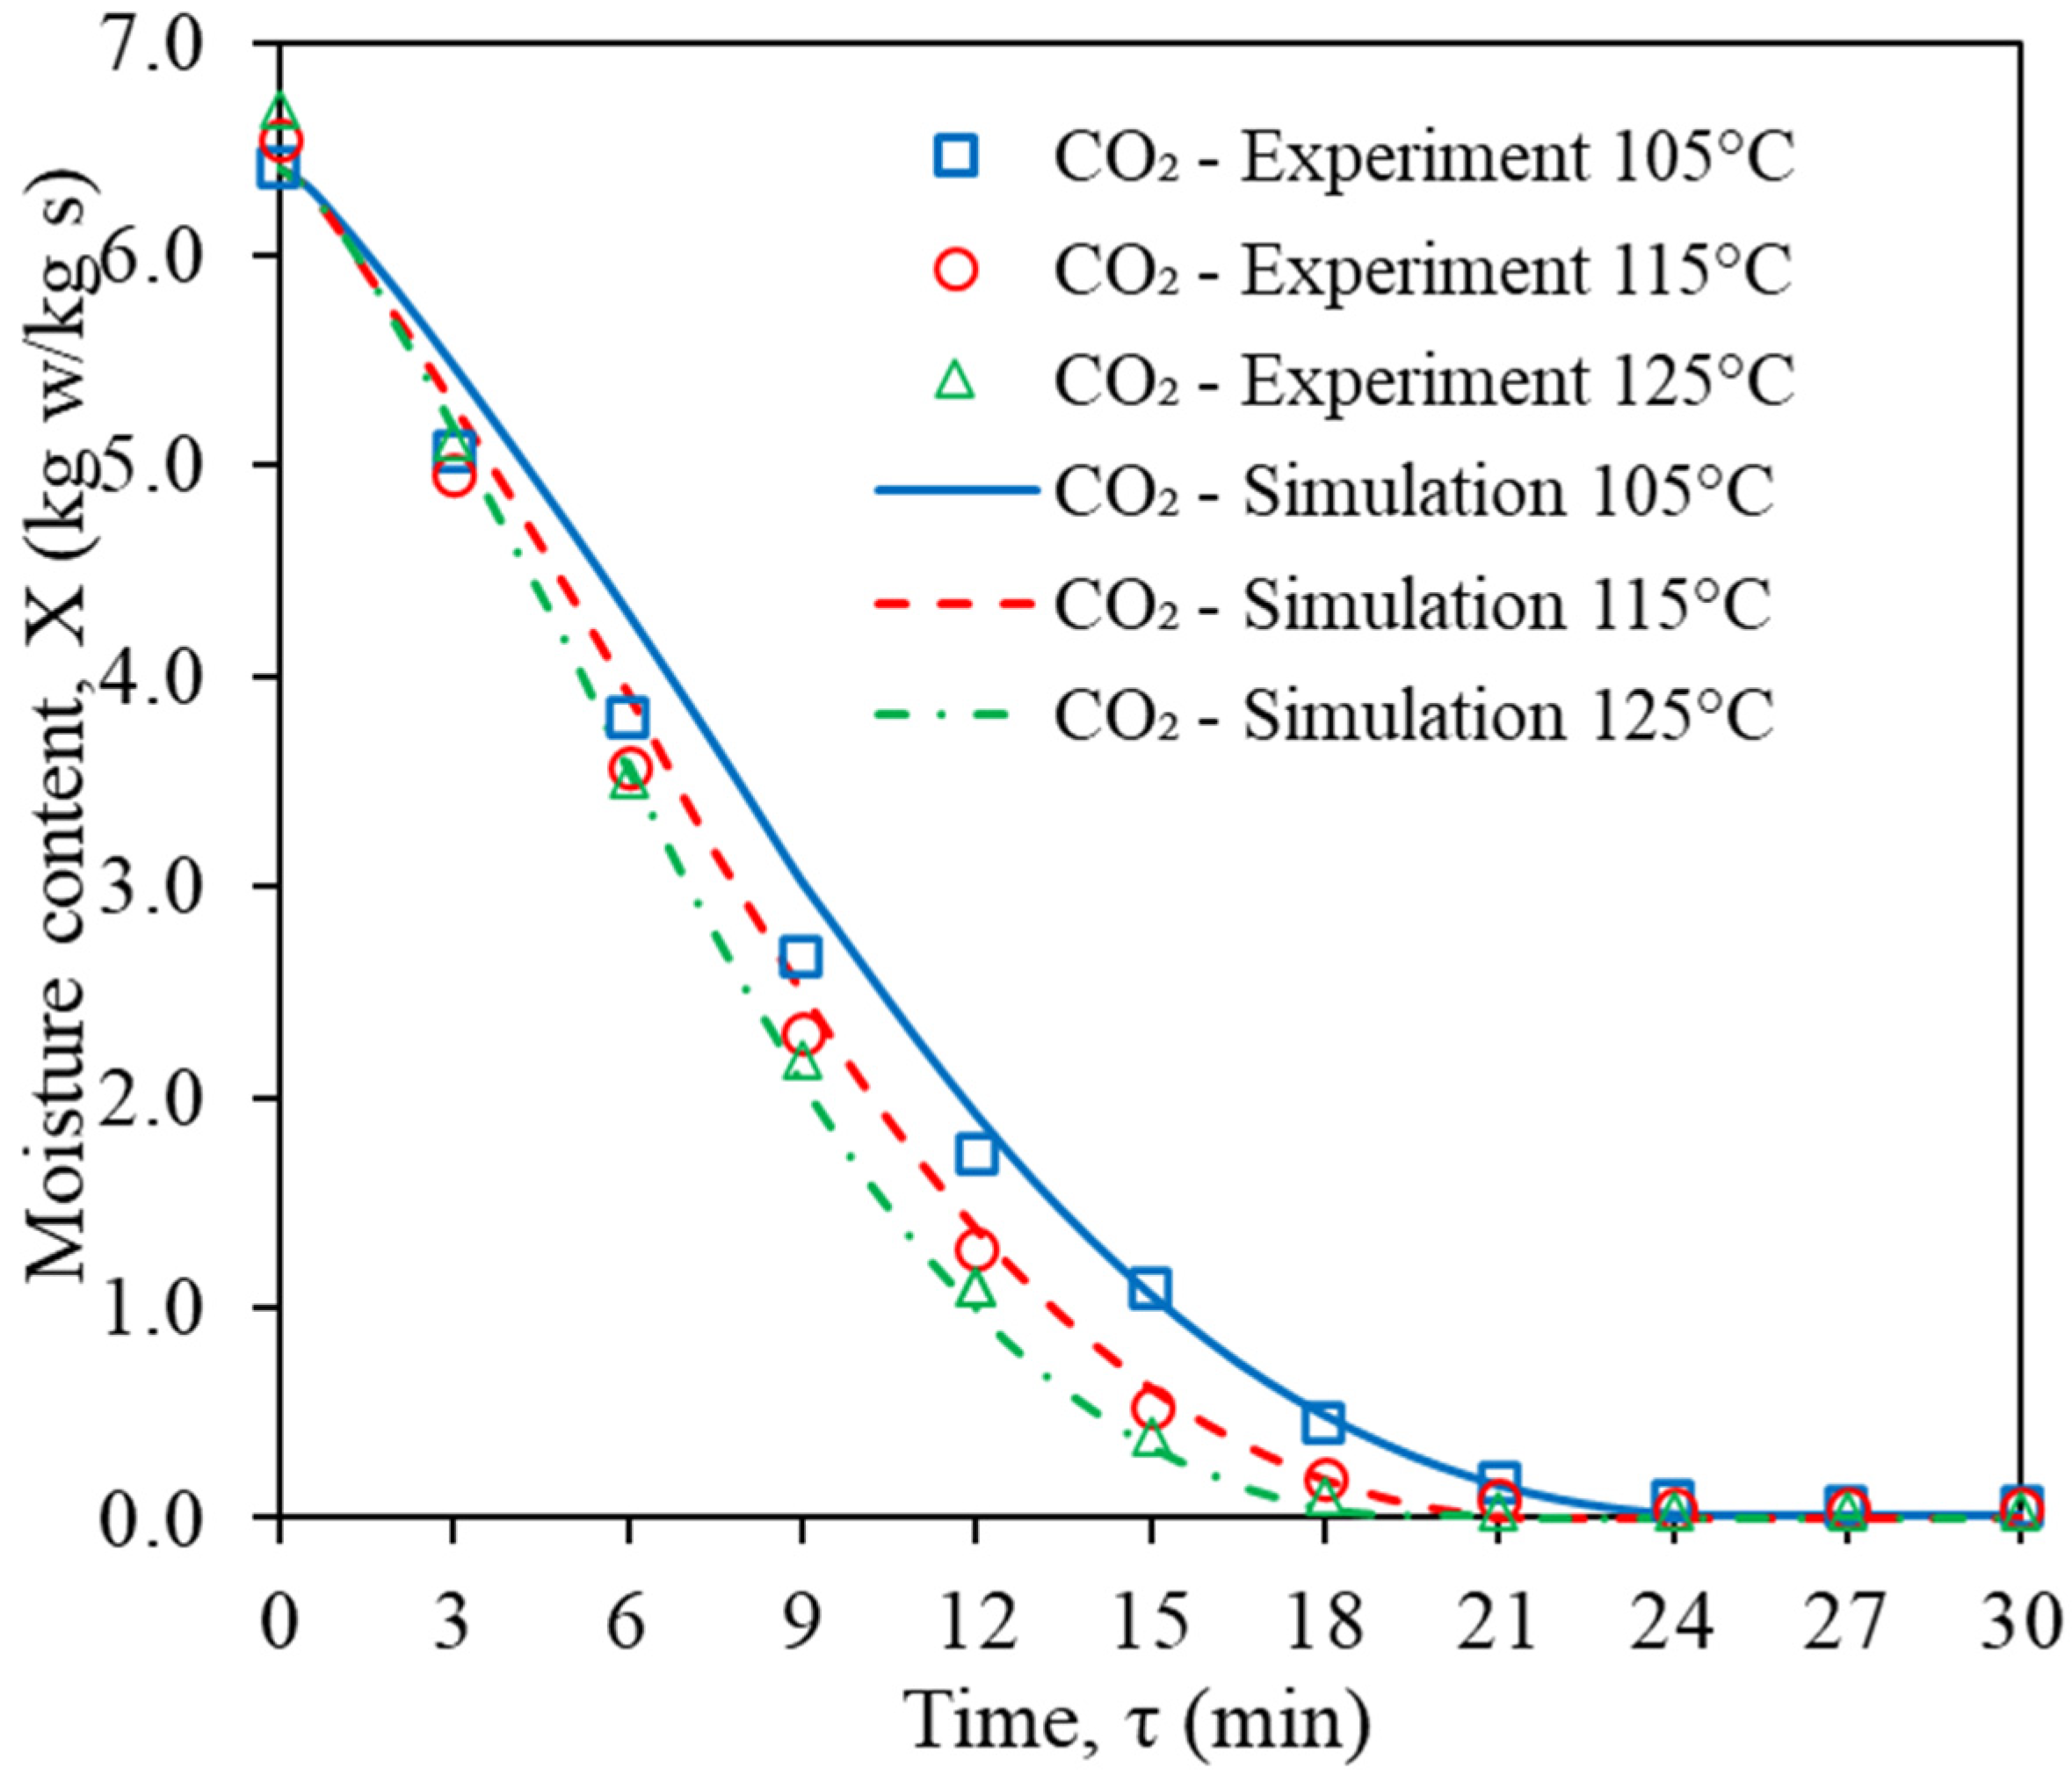
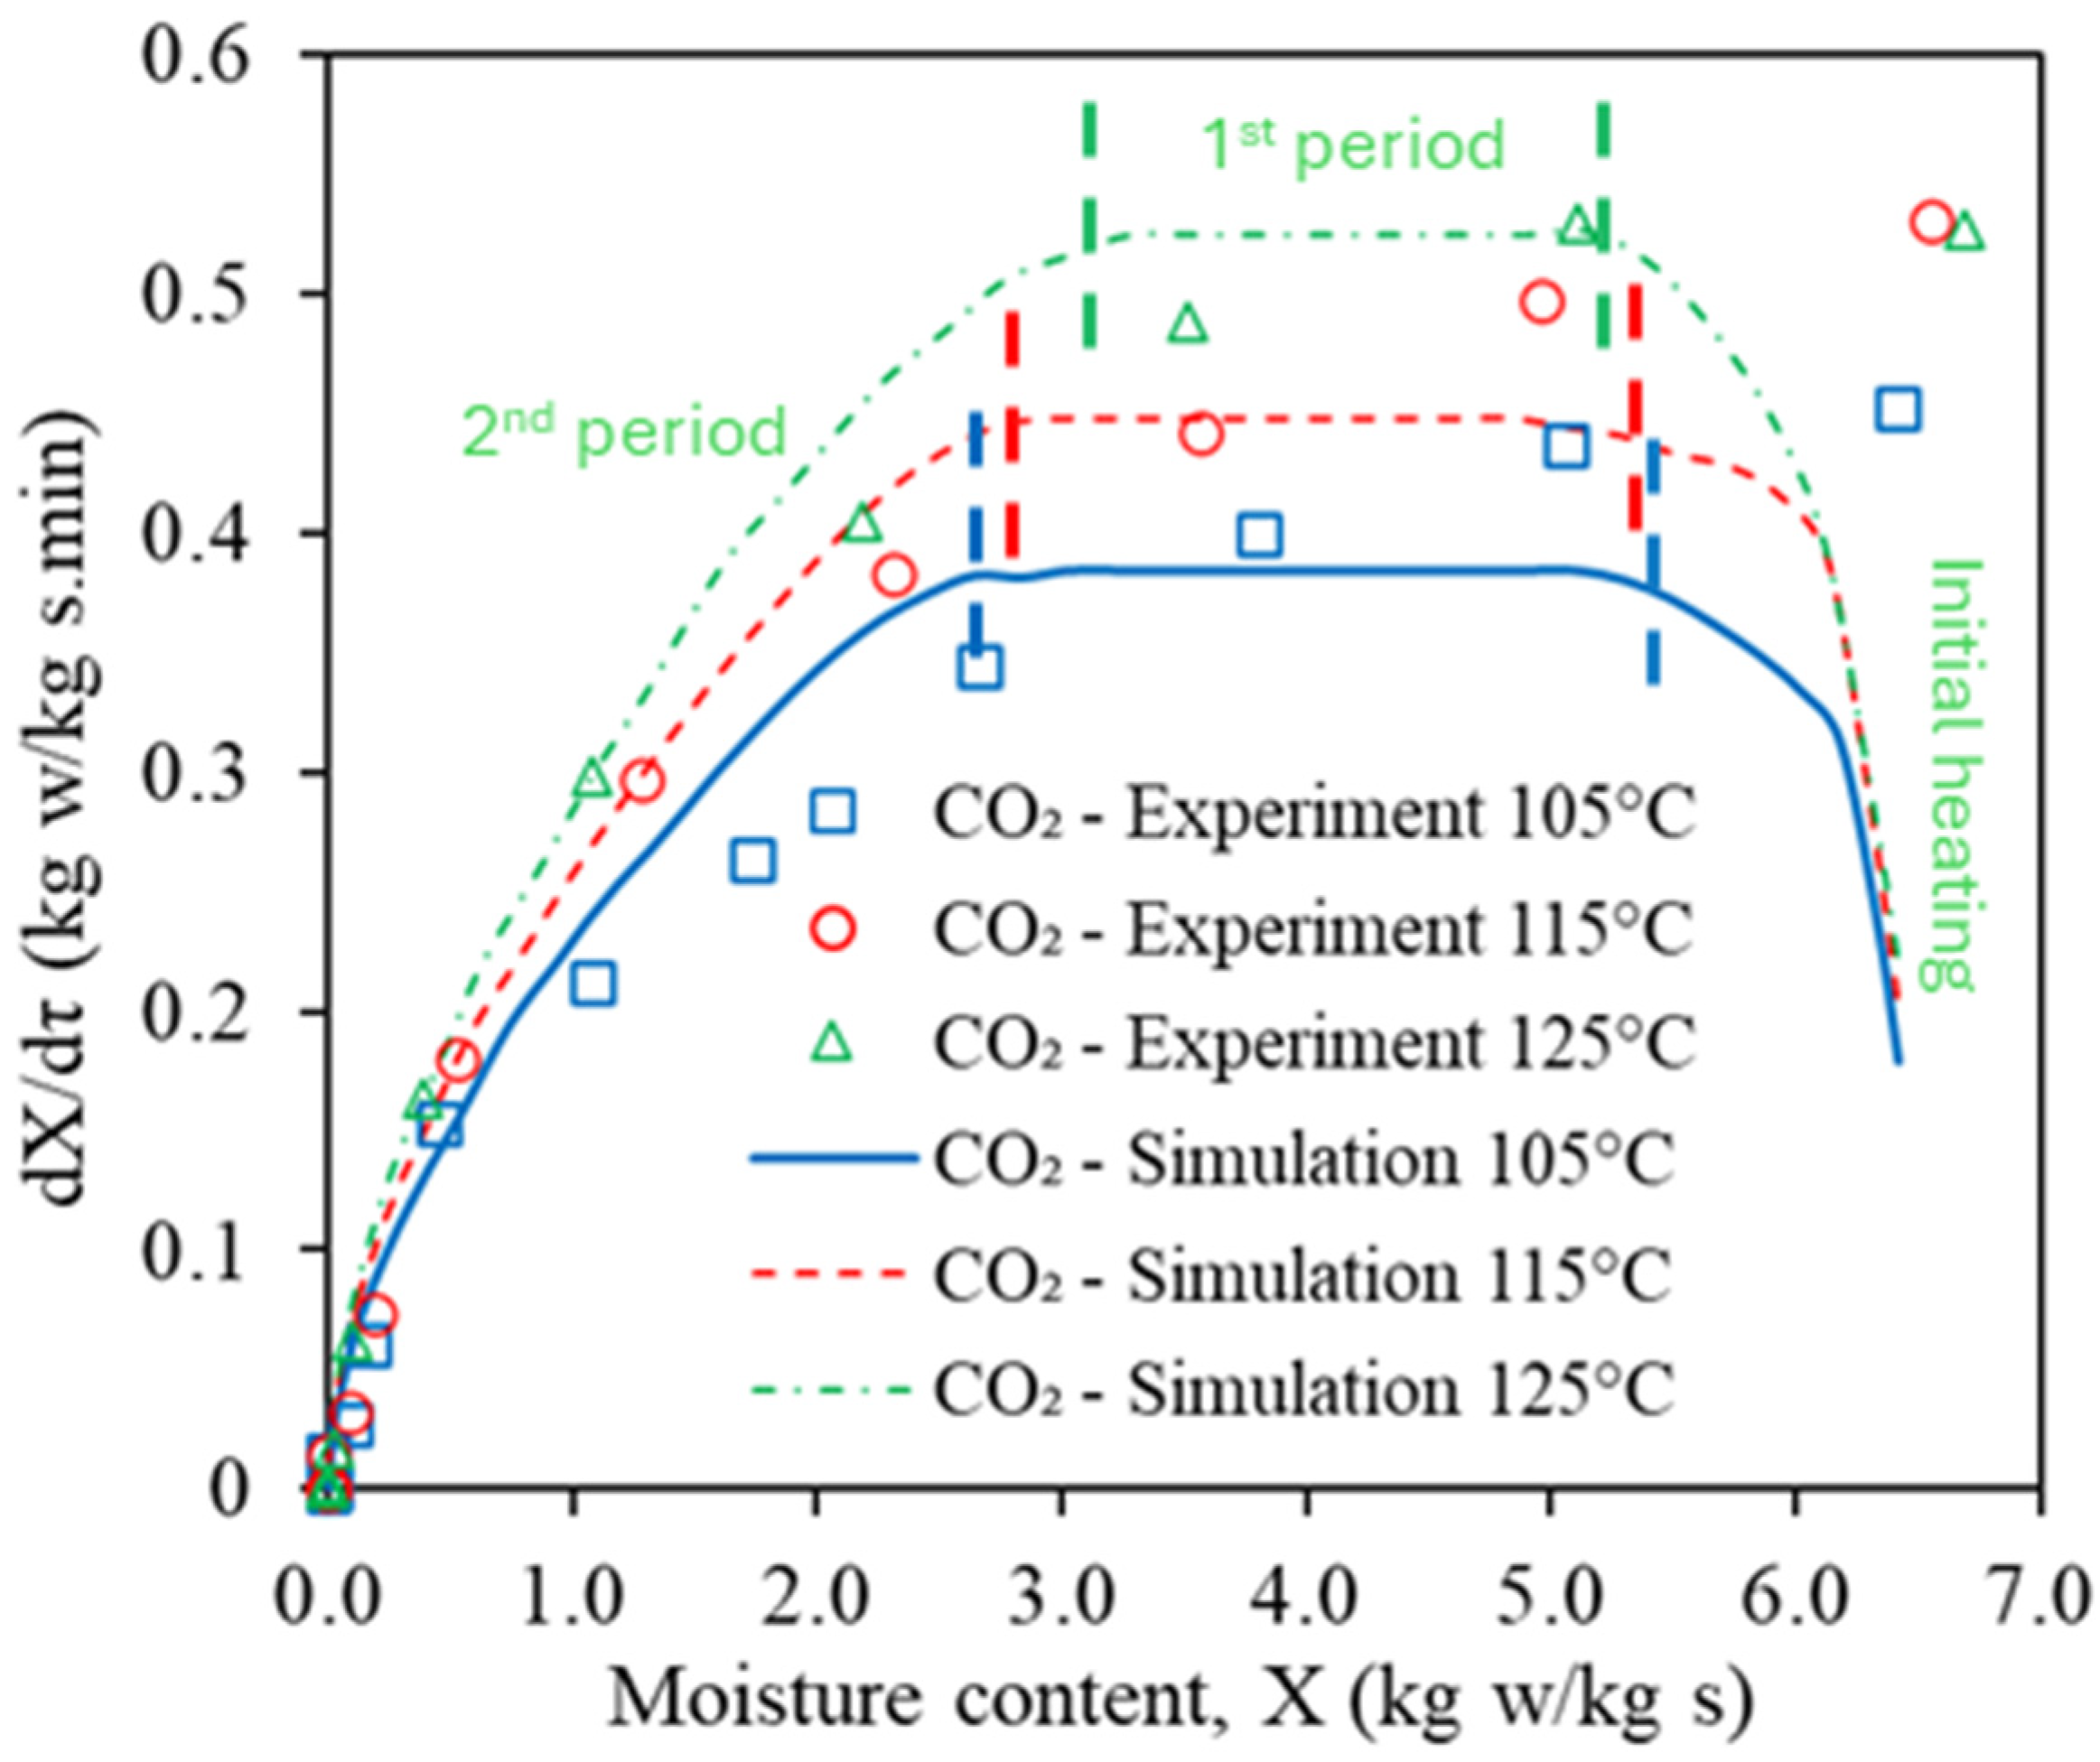
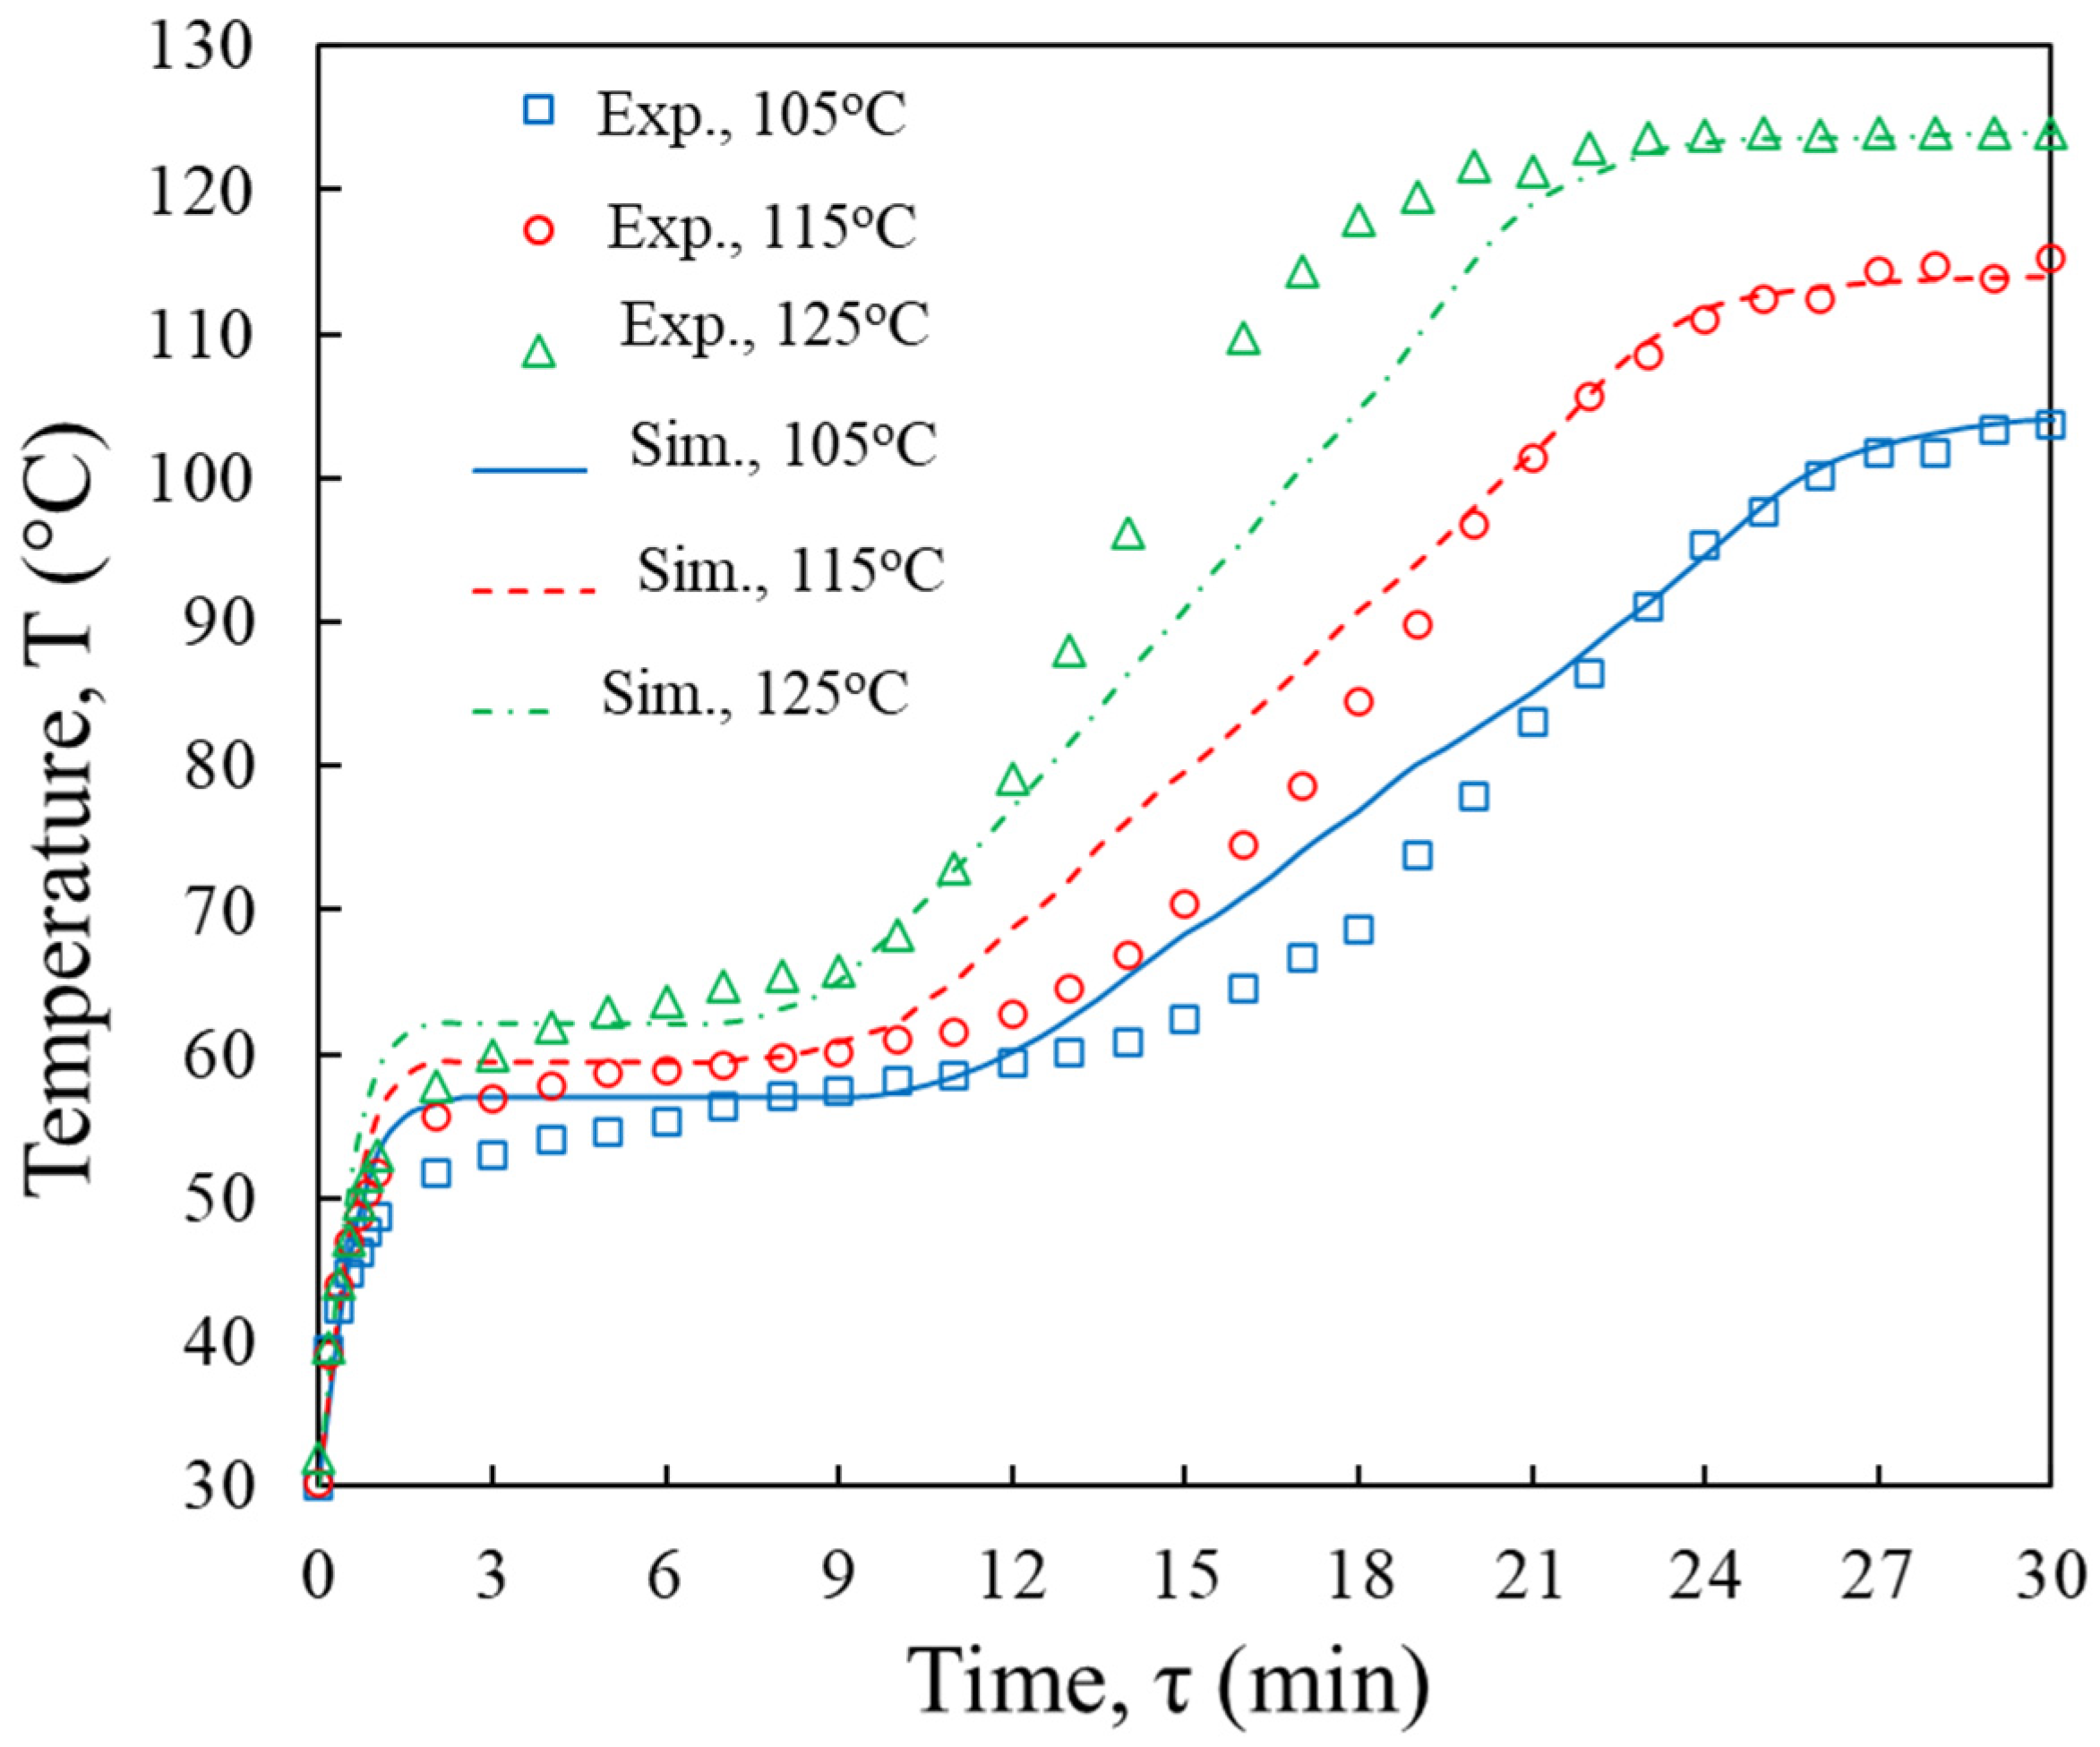
3.1. Model Validation

To validate the simulated model, CFD simulations were conducted for different inlet temperatures of the CO2 agent. Figure 2, Figure 3 and Figure 4 show the comparisons of average moisture content, evaporation velocity, and average temperature of apple slices calculated by simulation and experiment. In general, all cases show good agreement.
Regarding the numerical evaporation rate presented in Figure 3, the drying process can be divided into three periods: the heating period, the constant drying period, and the falling drying rate period. During the heating period, the increasing temperature leads to the increase in vapor pressure at the surface, resulting in an increase in the drying rate. This heating period is not observed in the experimental drying curve. This may be due to the data-recording cycle of the experiments, which cannot capture all changes in sample mass. When the convective thermal energy transferred from the drying agent to the sample is balanced with the latent heat of evaporation, the constant drying rate period commences. The constant drying rate period is maintained due to the liquid water flow from the sample center to the sample surface under the capillary effect. For both the experiment and simulation, it can be observed that at a higher temperature, the faster evaporation results in earlier transition points between the constant and the falling drying periods. The reason may come from the fact that the liquid capillary flow is not compensated for in the fast evaporation, and the sample surface becomes partly dry. After the transition points, the drying rate reduces in the falling drying rate period [29].
The temperatures of the sample centers are presented in Figure 4, corresponding with the evaporation periods. For all the inlet drying temperatures, firstly, the temperature increases to the adiabatic temperature when the evaporation speed is constant, and enough water moves to the surface for the evaporation rate to remain constant. After that, the temperature increases gradually to the gas temperature corresponding with the falling drying period when the evaporation is slow, and the supplied heat is used for not only evaporation but also heating the sample.

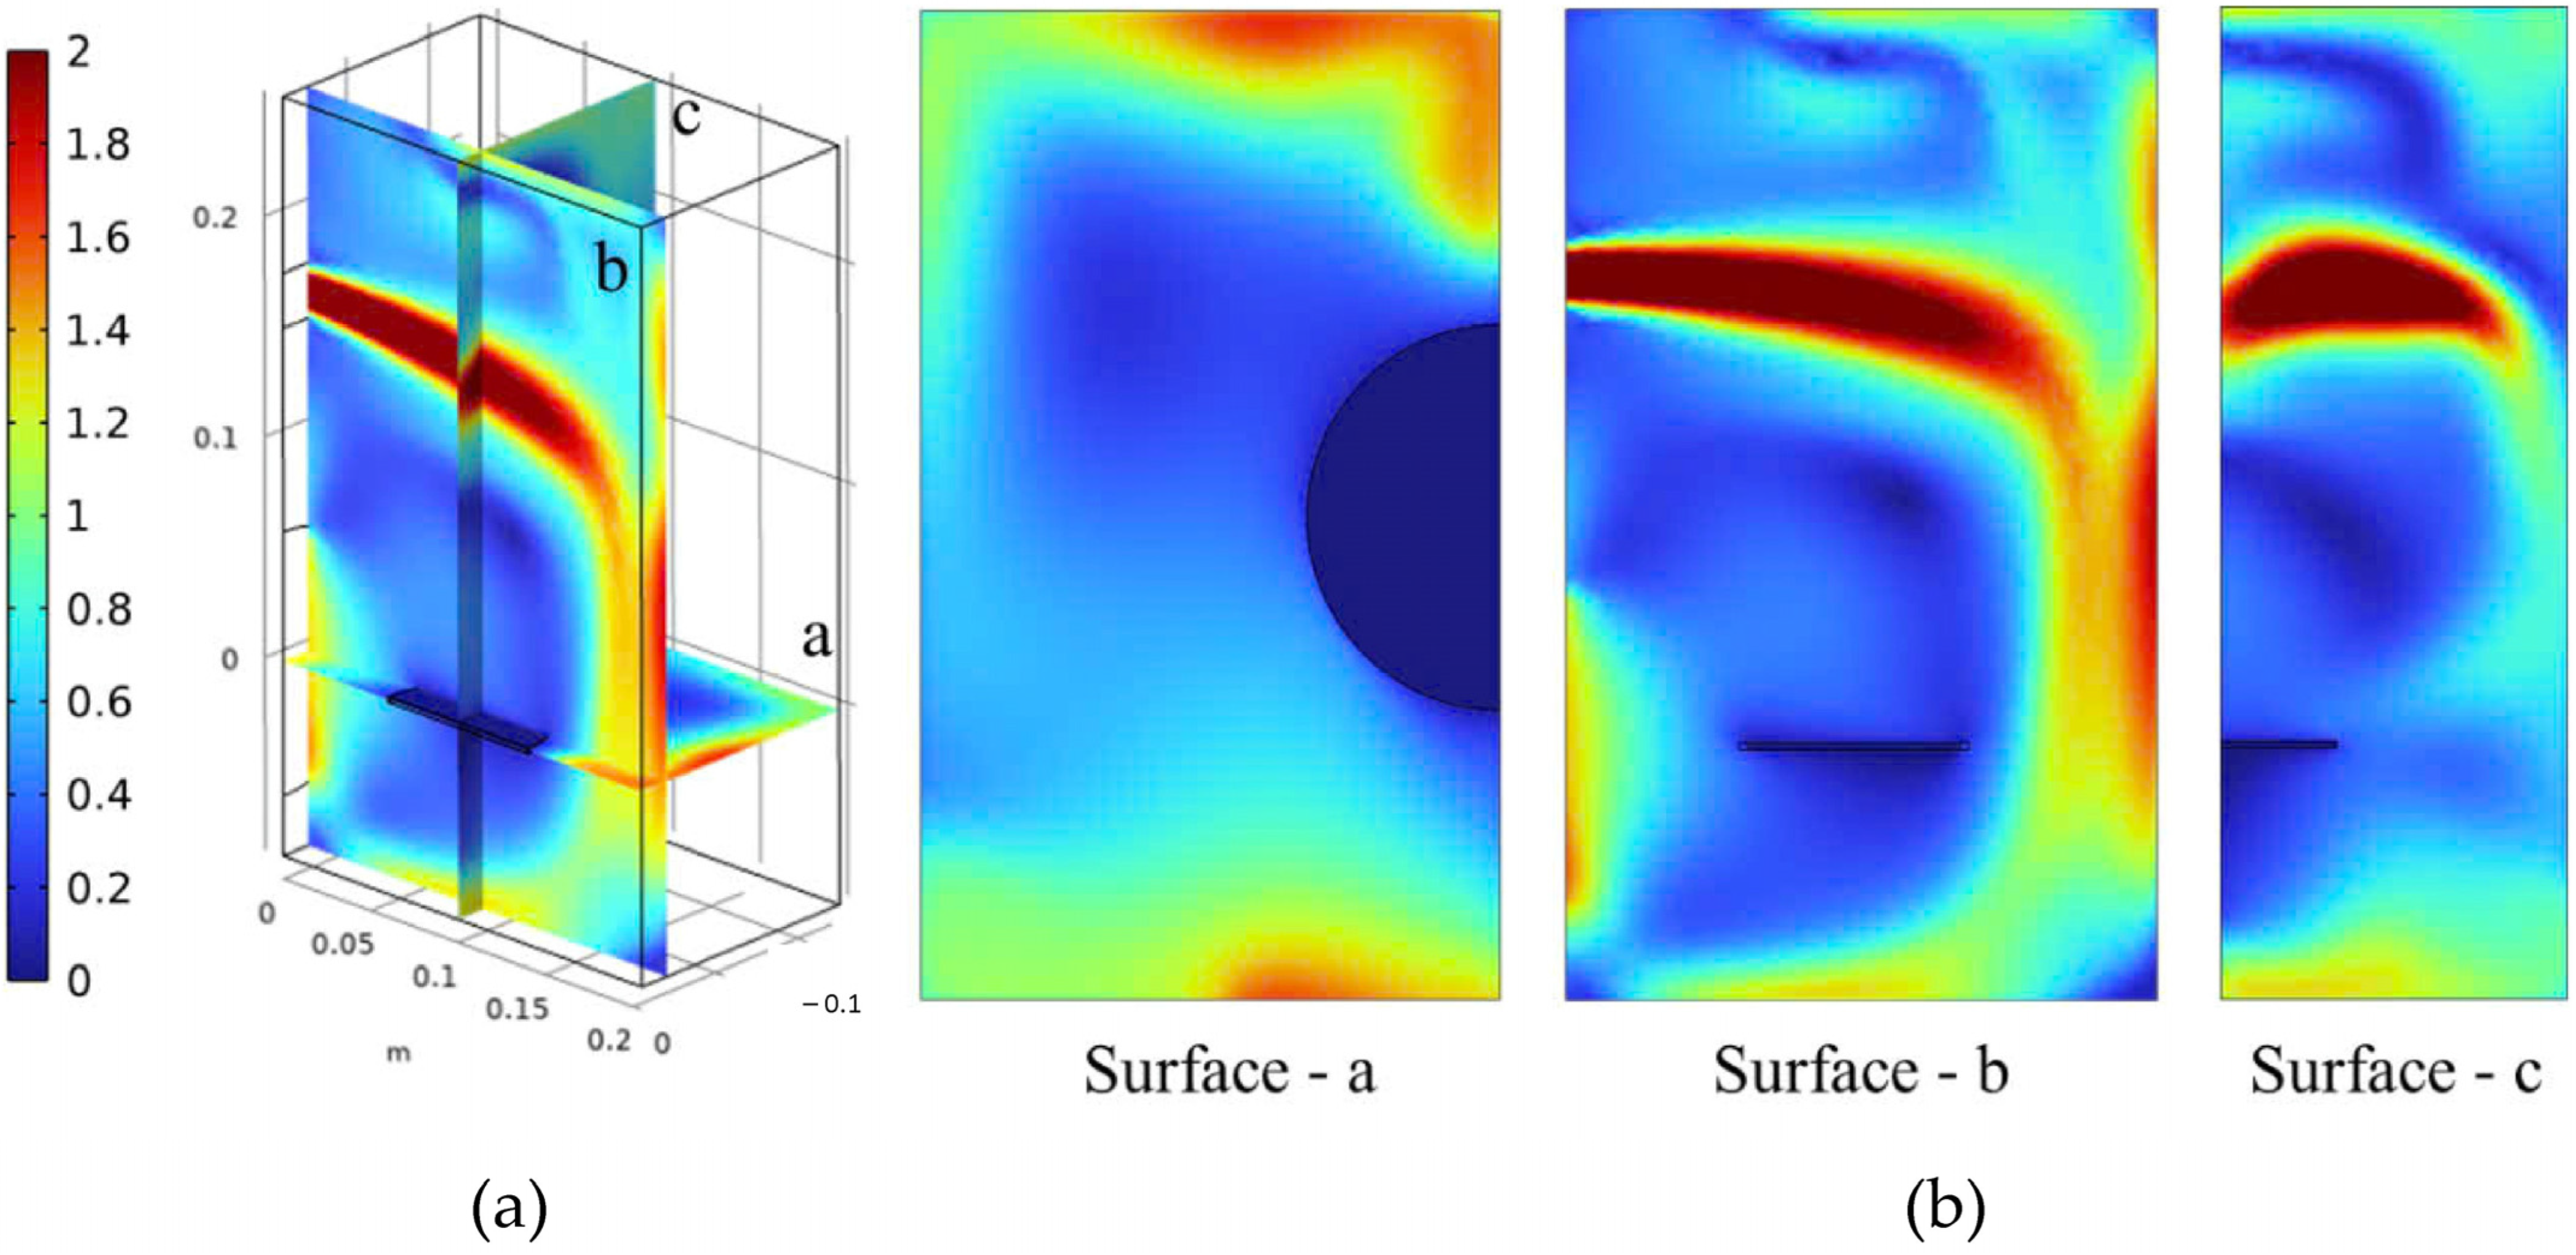
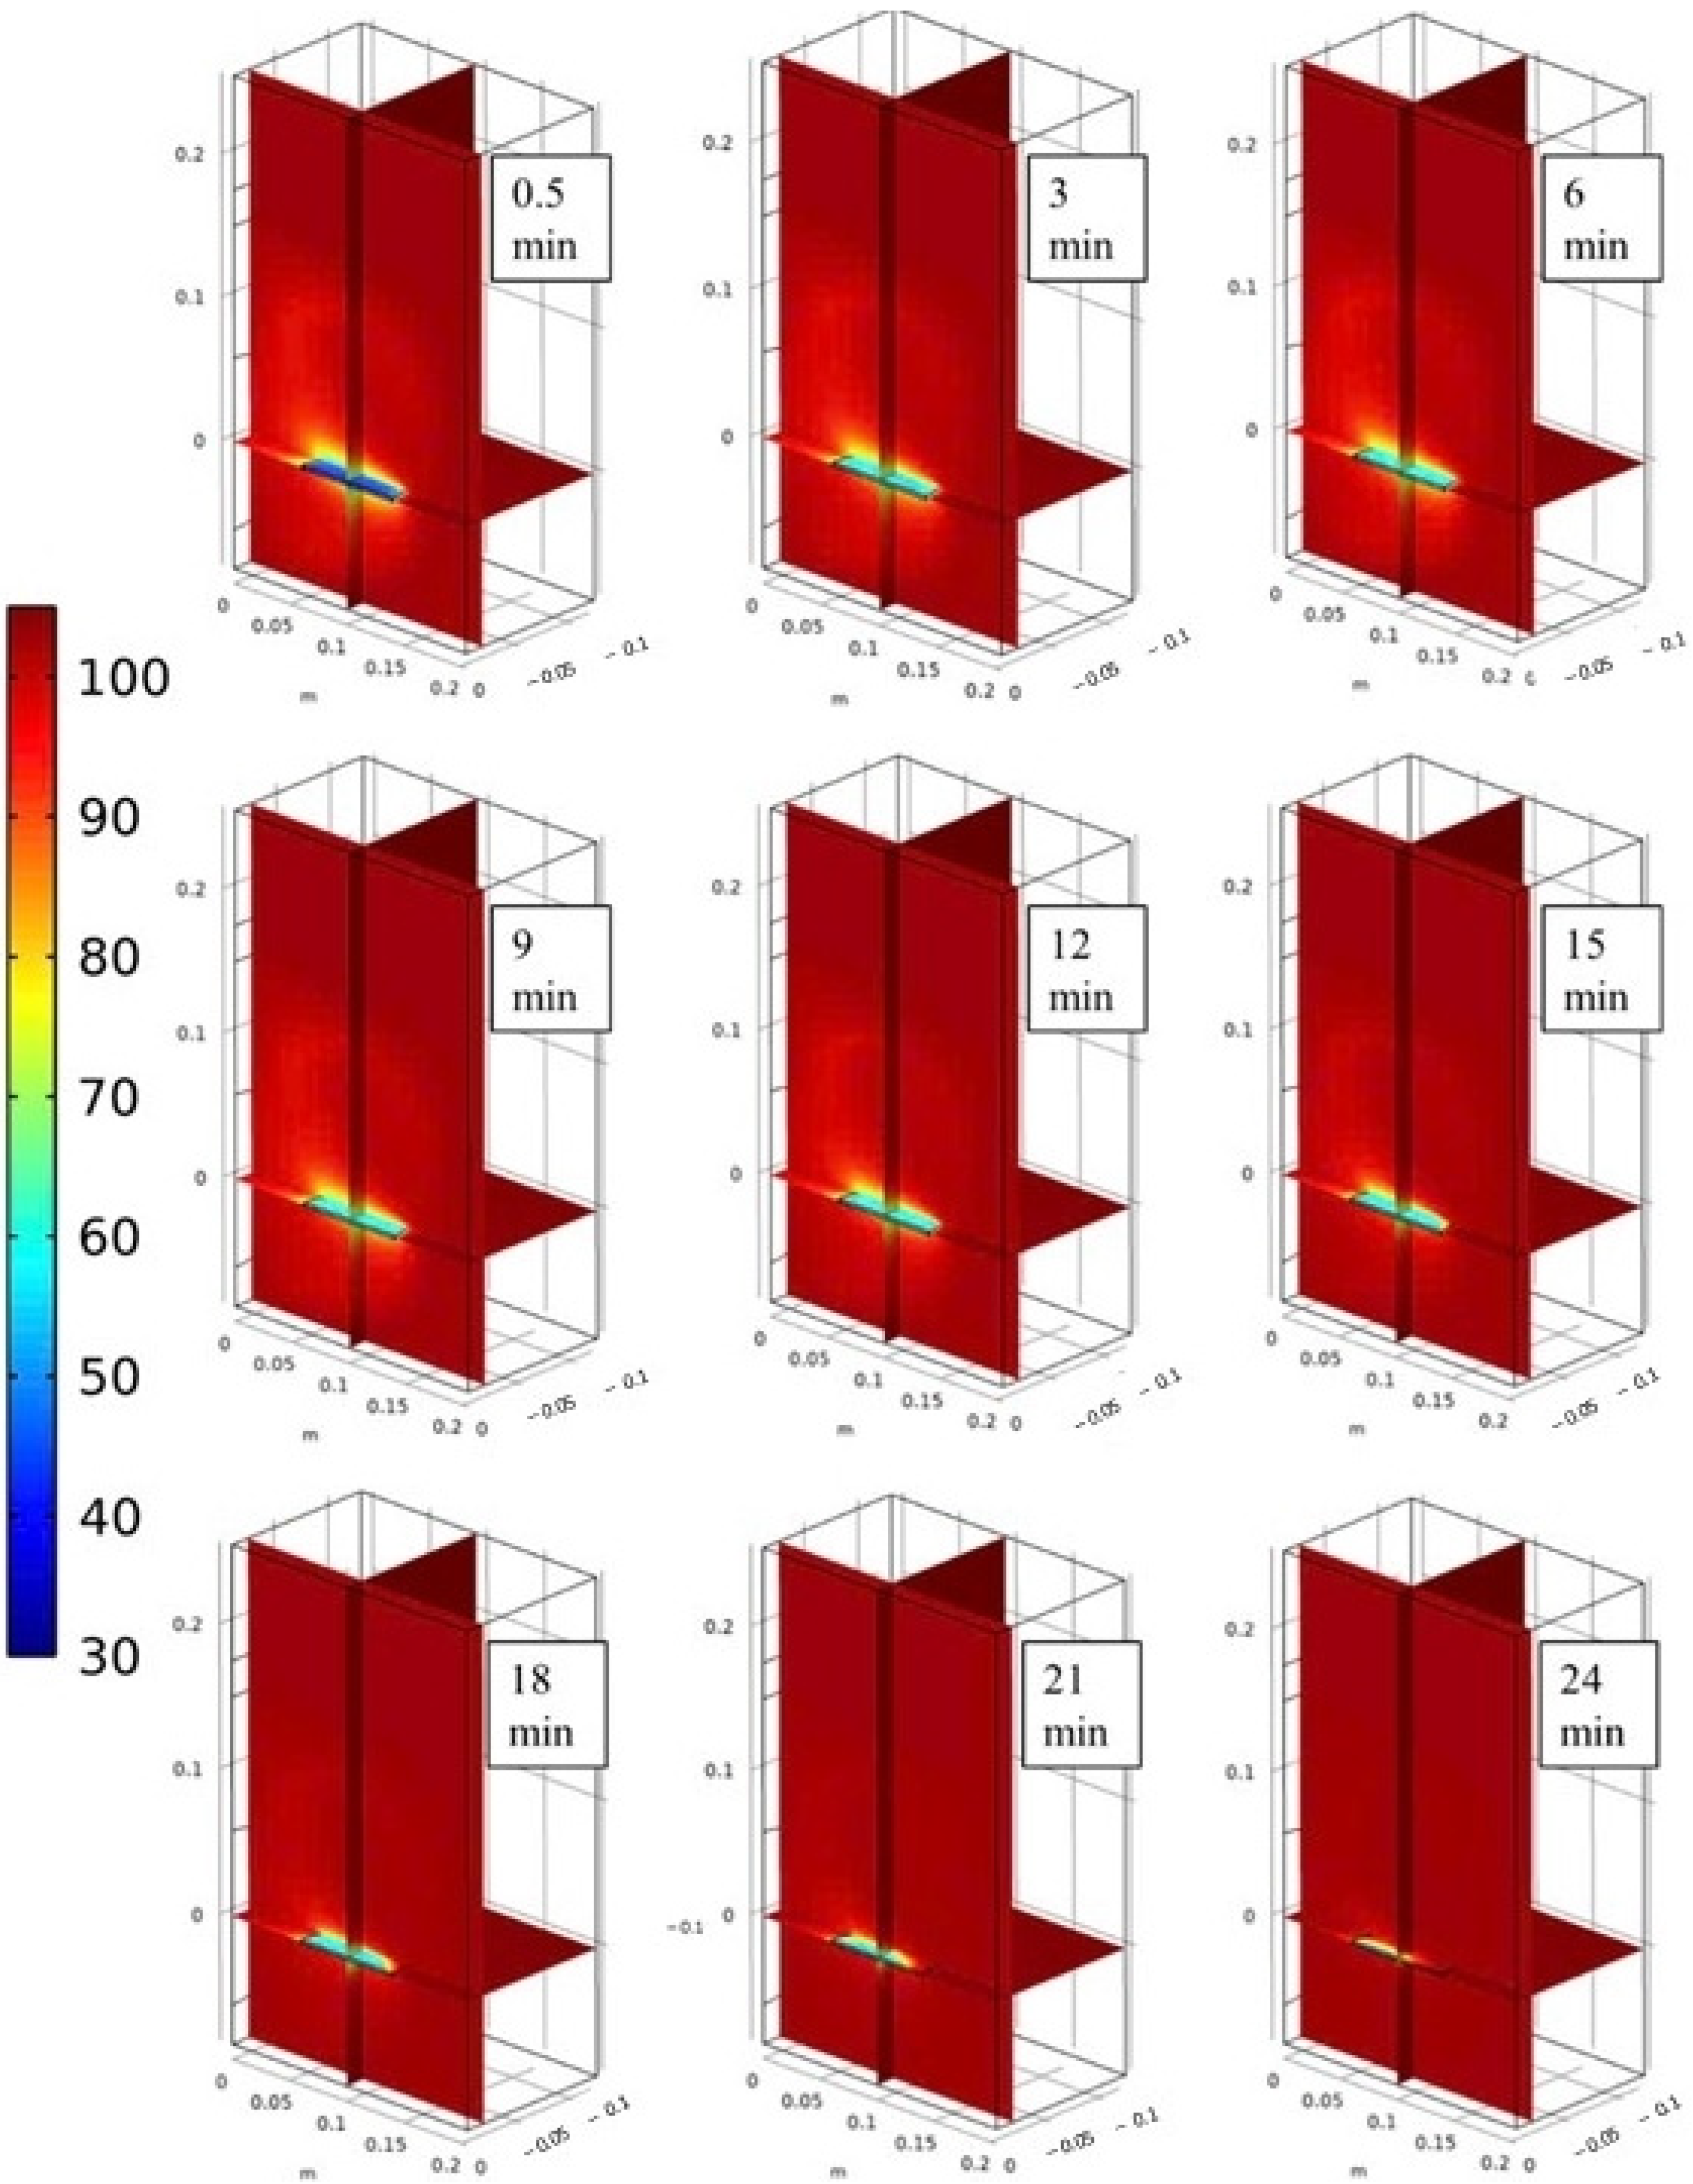
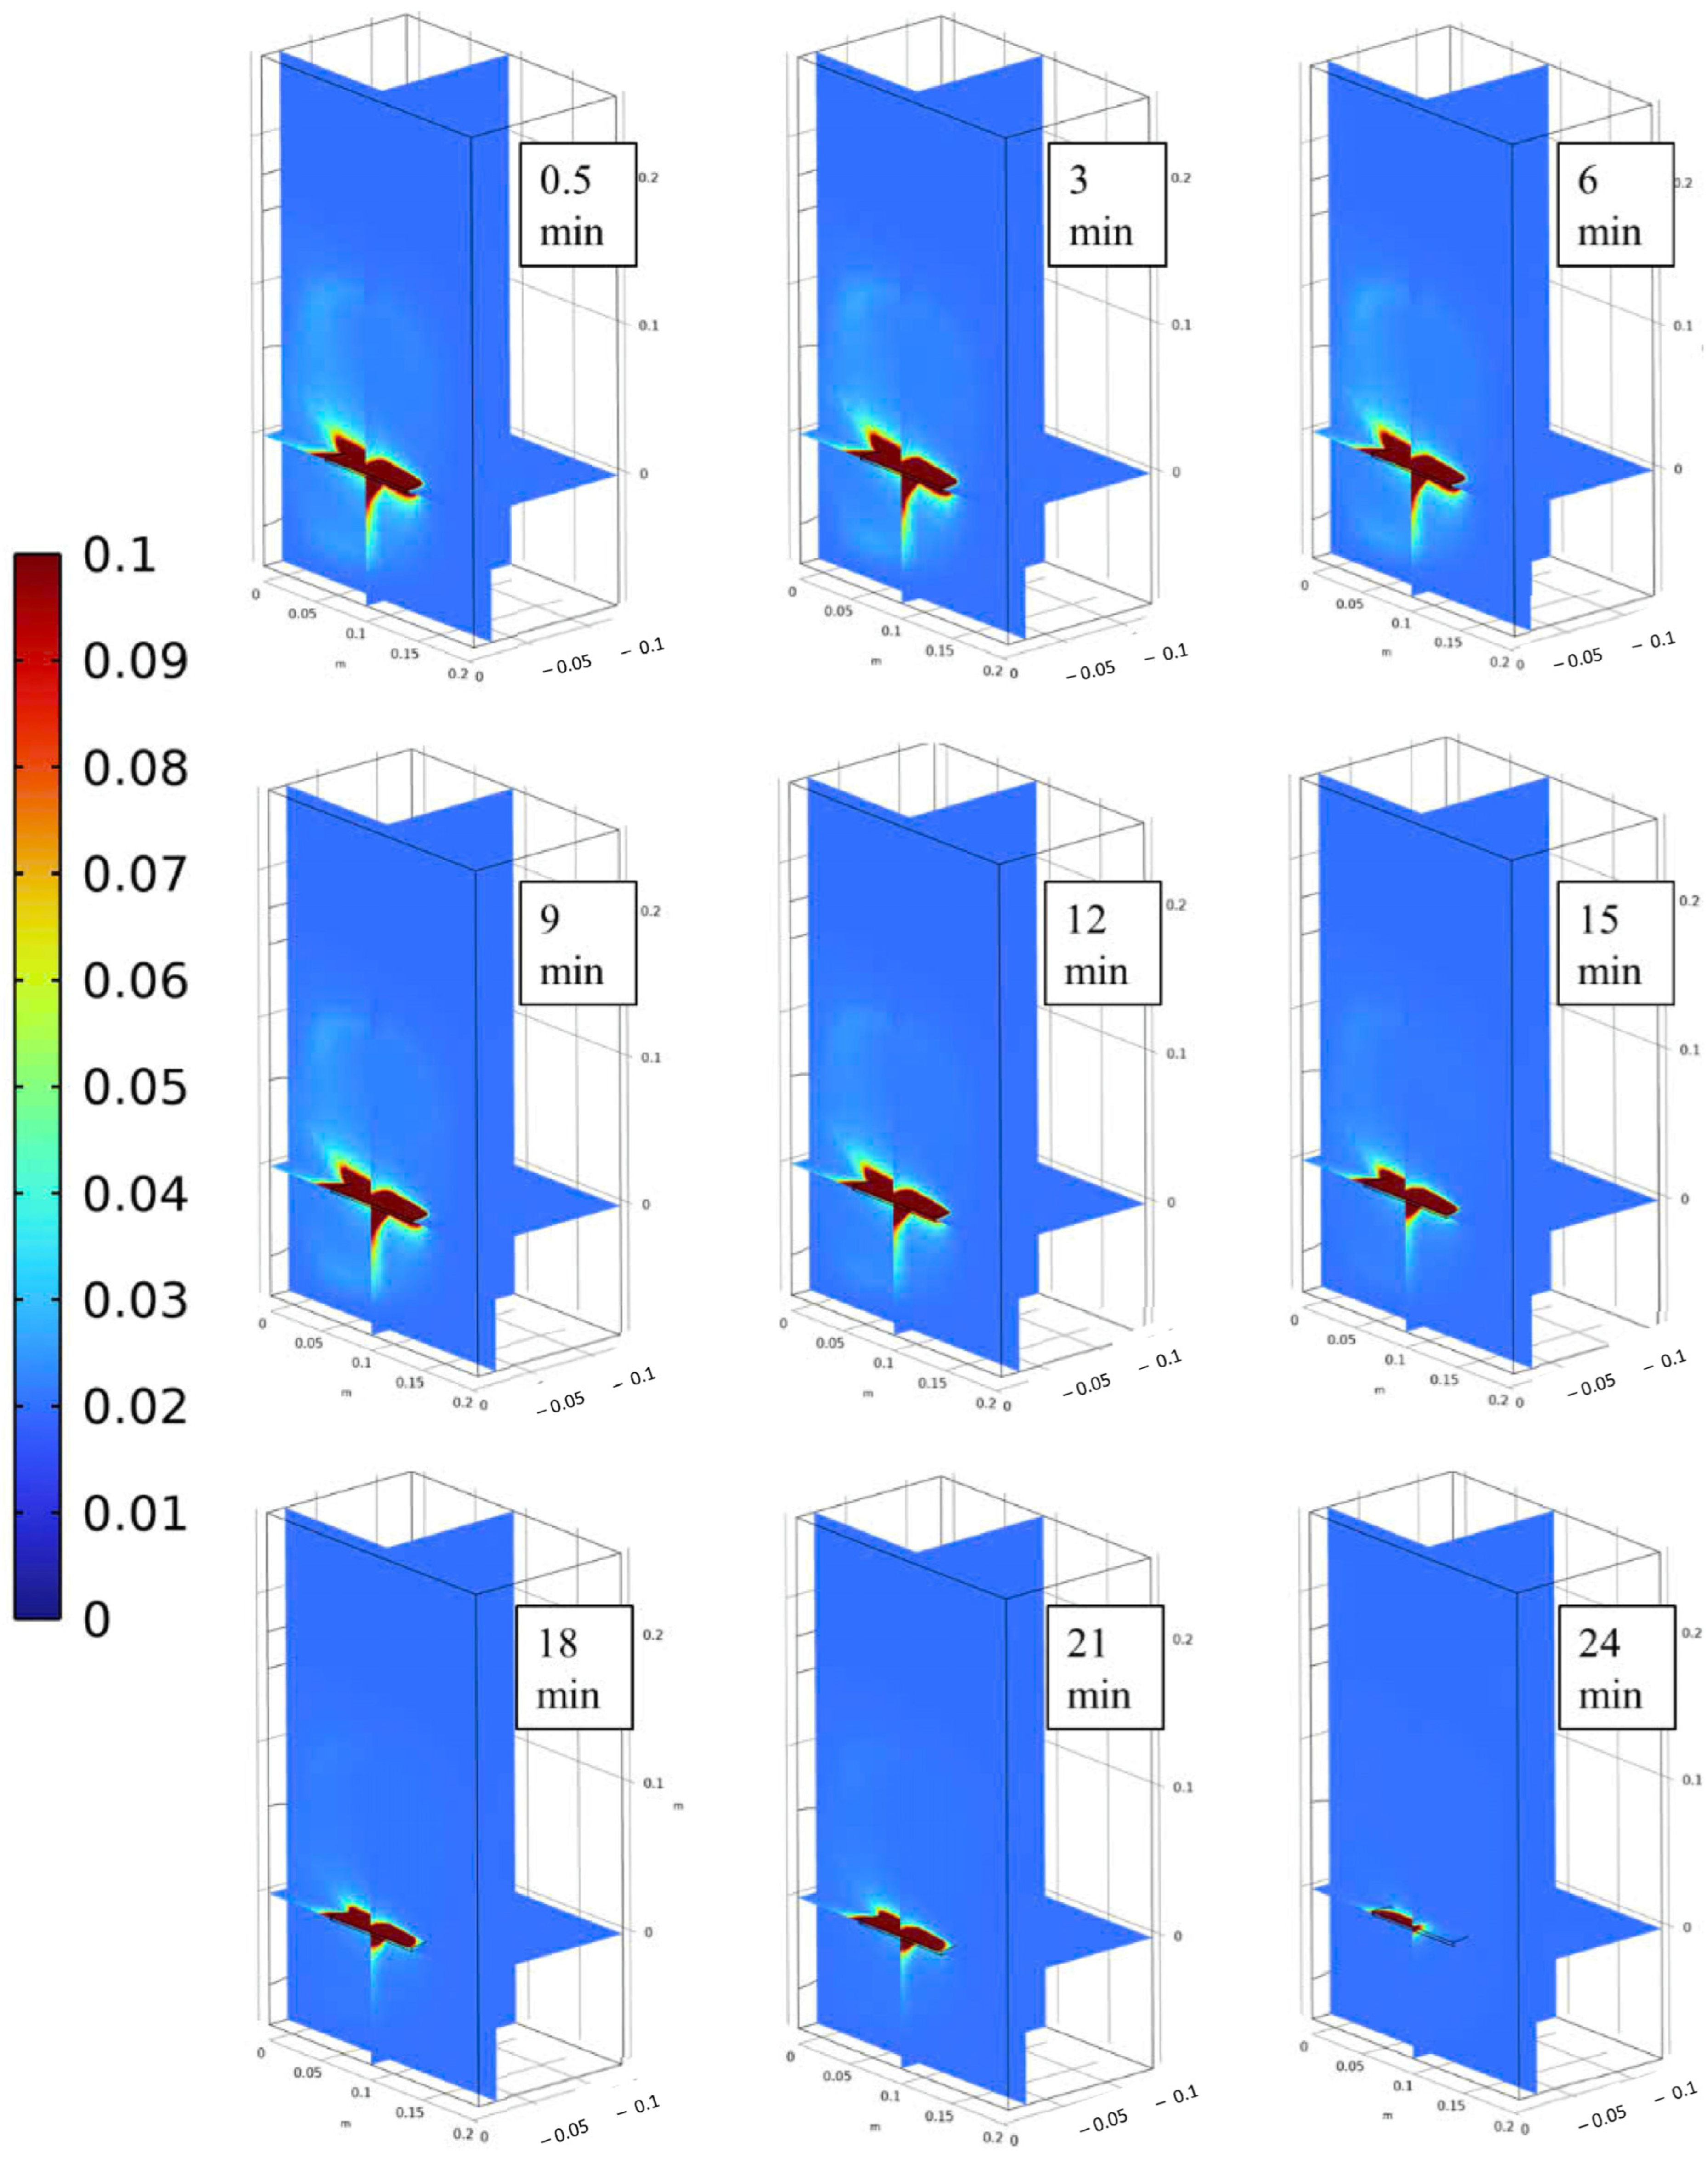
3.2. Velocity, Temperature, and Moisture Distributions of Gas

Velocity fields inside the dryer at the inlet velocity of 2 m/s and inlet gas temperature of 105 °C are shown in Figure 5. It is observed that the gas velocity is the highest near the inlet surface; then, gas flows to the wall and recirculates around the chamber. At the area near the tray, the velocity is unevenly distributed on the tray, and the average value is as slow as around 0.6 m/s. The boundary conjugate condition on the surface of sample is calculated directly so the simulation can capture this velocity distribution. This is one of the advantages of the simulation for a whole dryer system where the complex temperature and velocity distributions of gas can be combined inside the model.
Figure 6 presents the temperature field of the gas inside the dryer system. The temperature is low at the area near the sample surface as a result of evaporation, especially during the 3 min to 12 min corresponding with the constant drying period. After this period, this area’s temperature increases gradually due to the falling evaporation period.
Moisture content distributions are shown in Figure 7. The moisture content near the sample is much higher than the other areas for all time periods due to the evaporation from the sample. However, it is similar to the temperature difference: in the first drying period, there are big differences between the evaporation area and other areas inside the dryer, and then these differences reduce gradually until the end of drying process.

3.3. Temperature and Moisture Content Distributions of Dried Sample

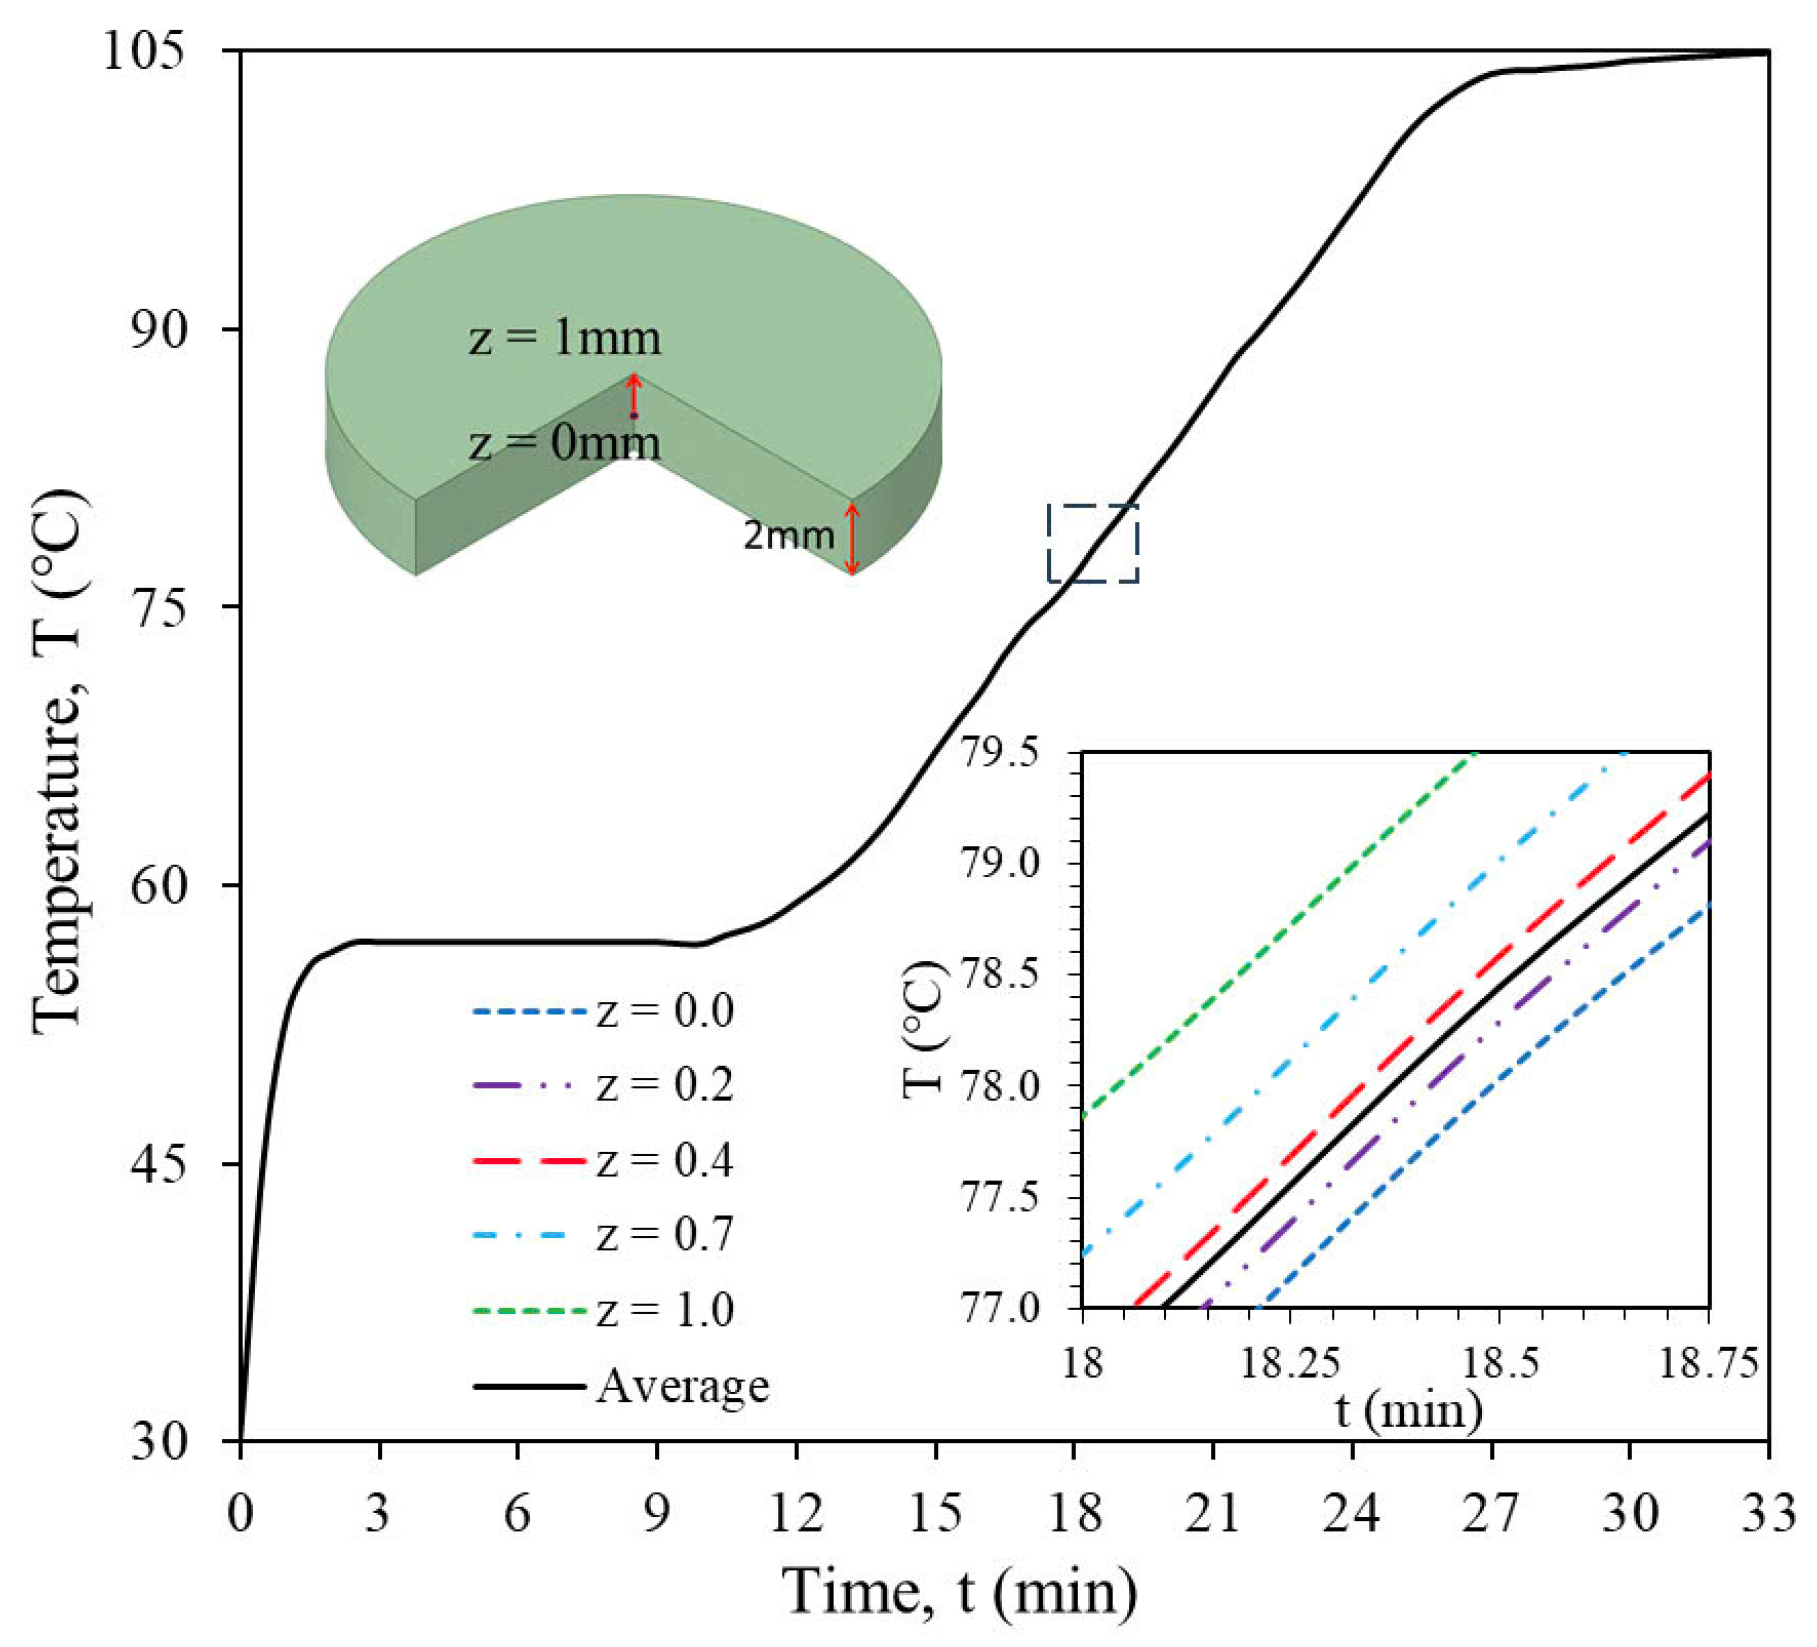
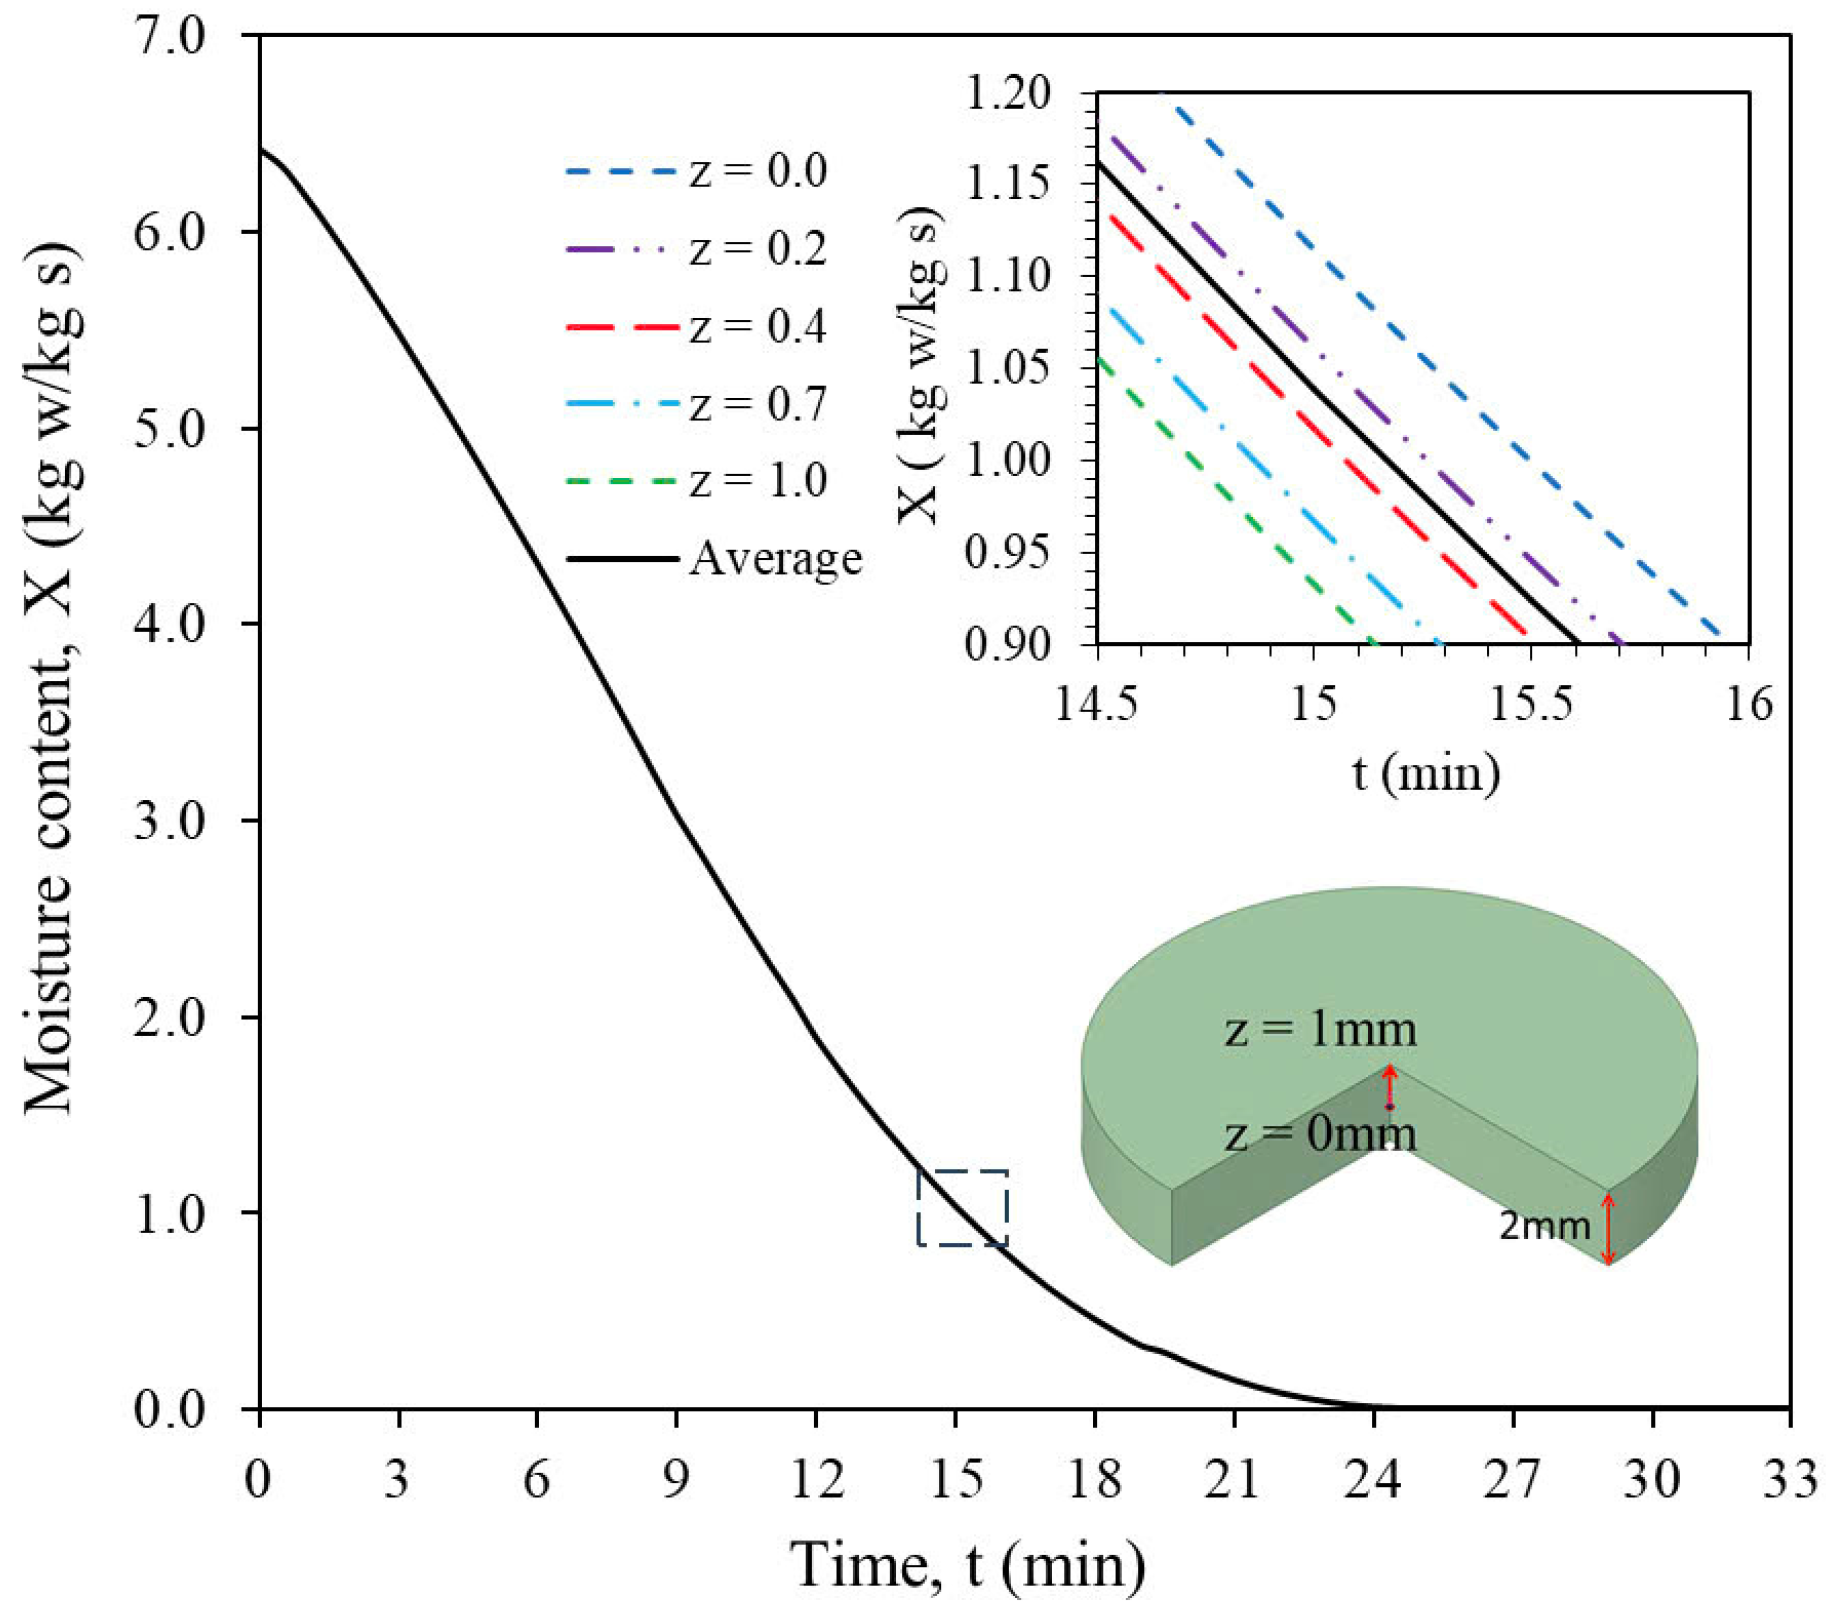
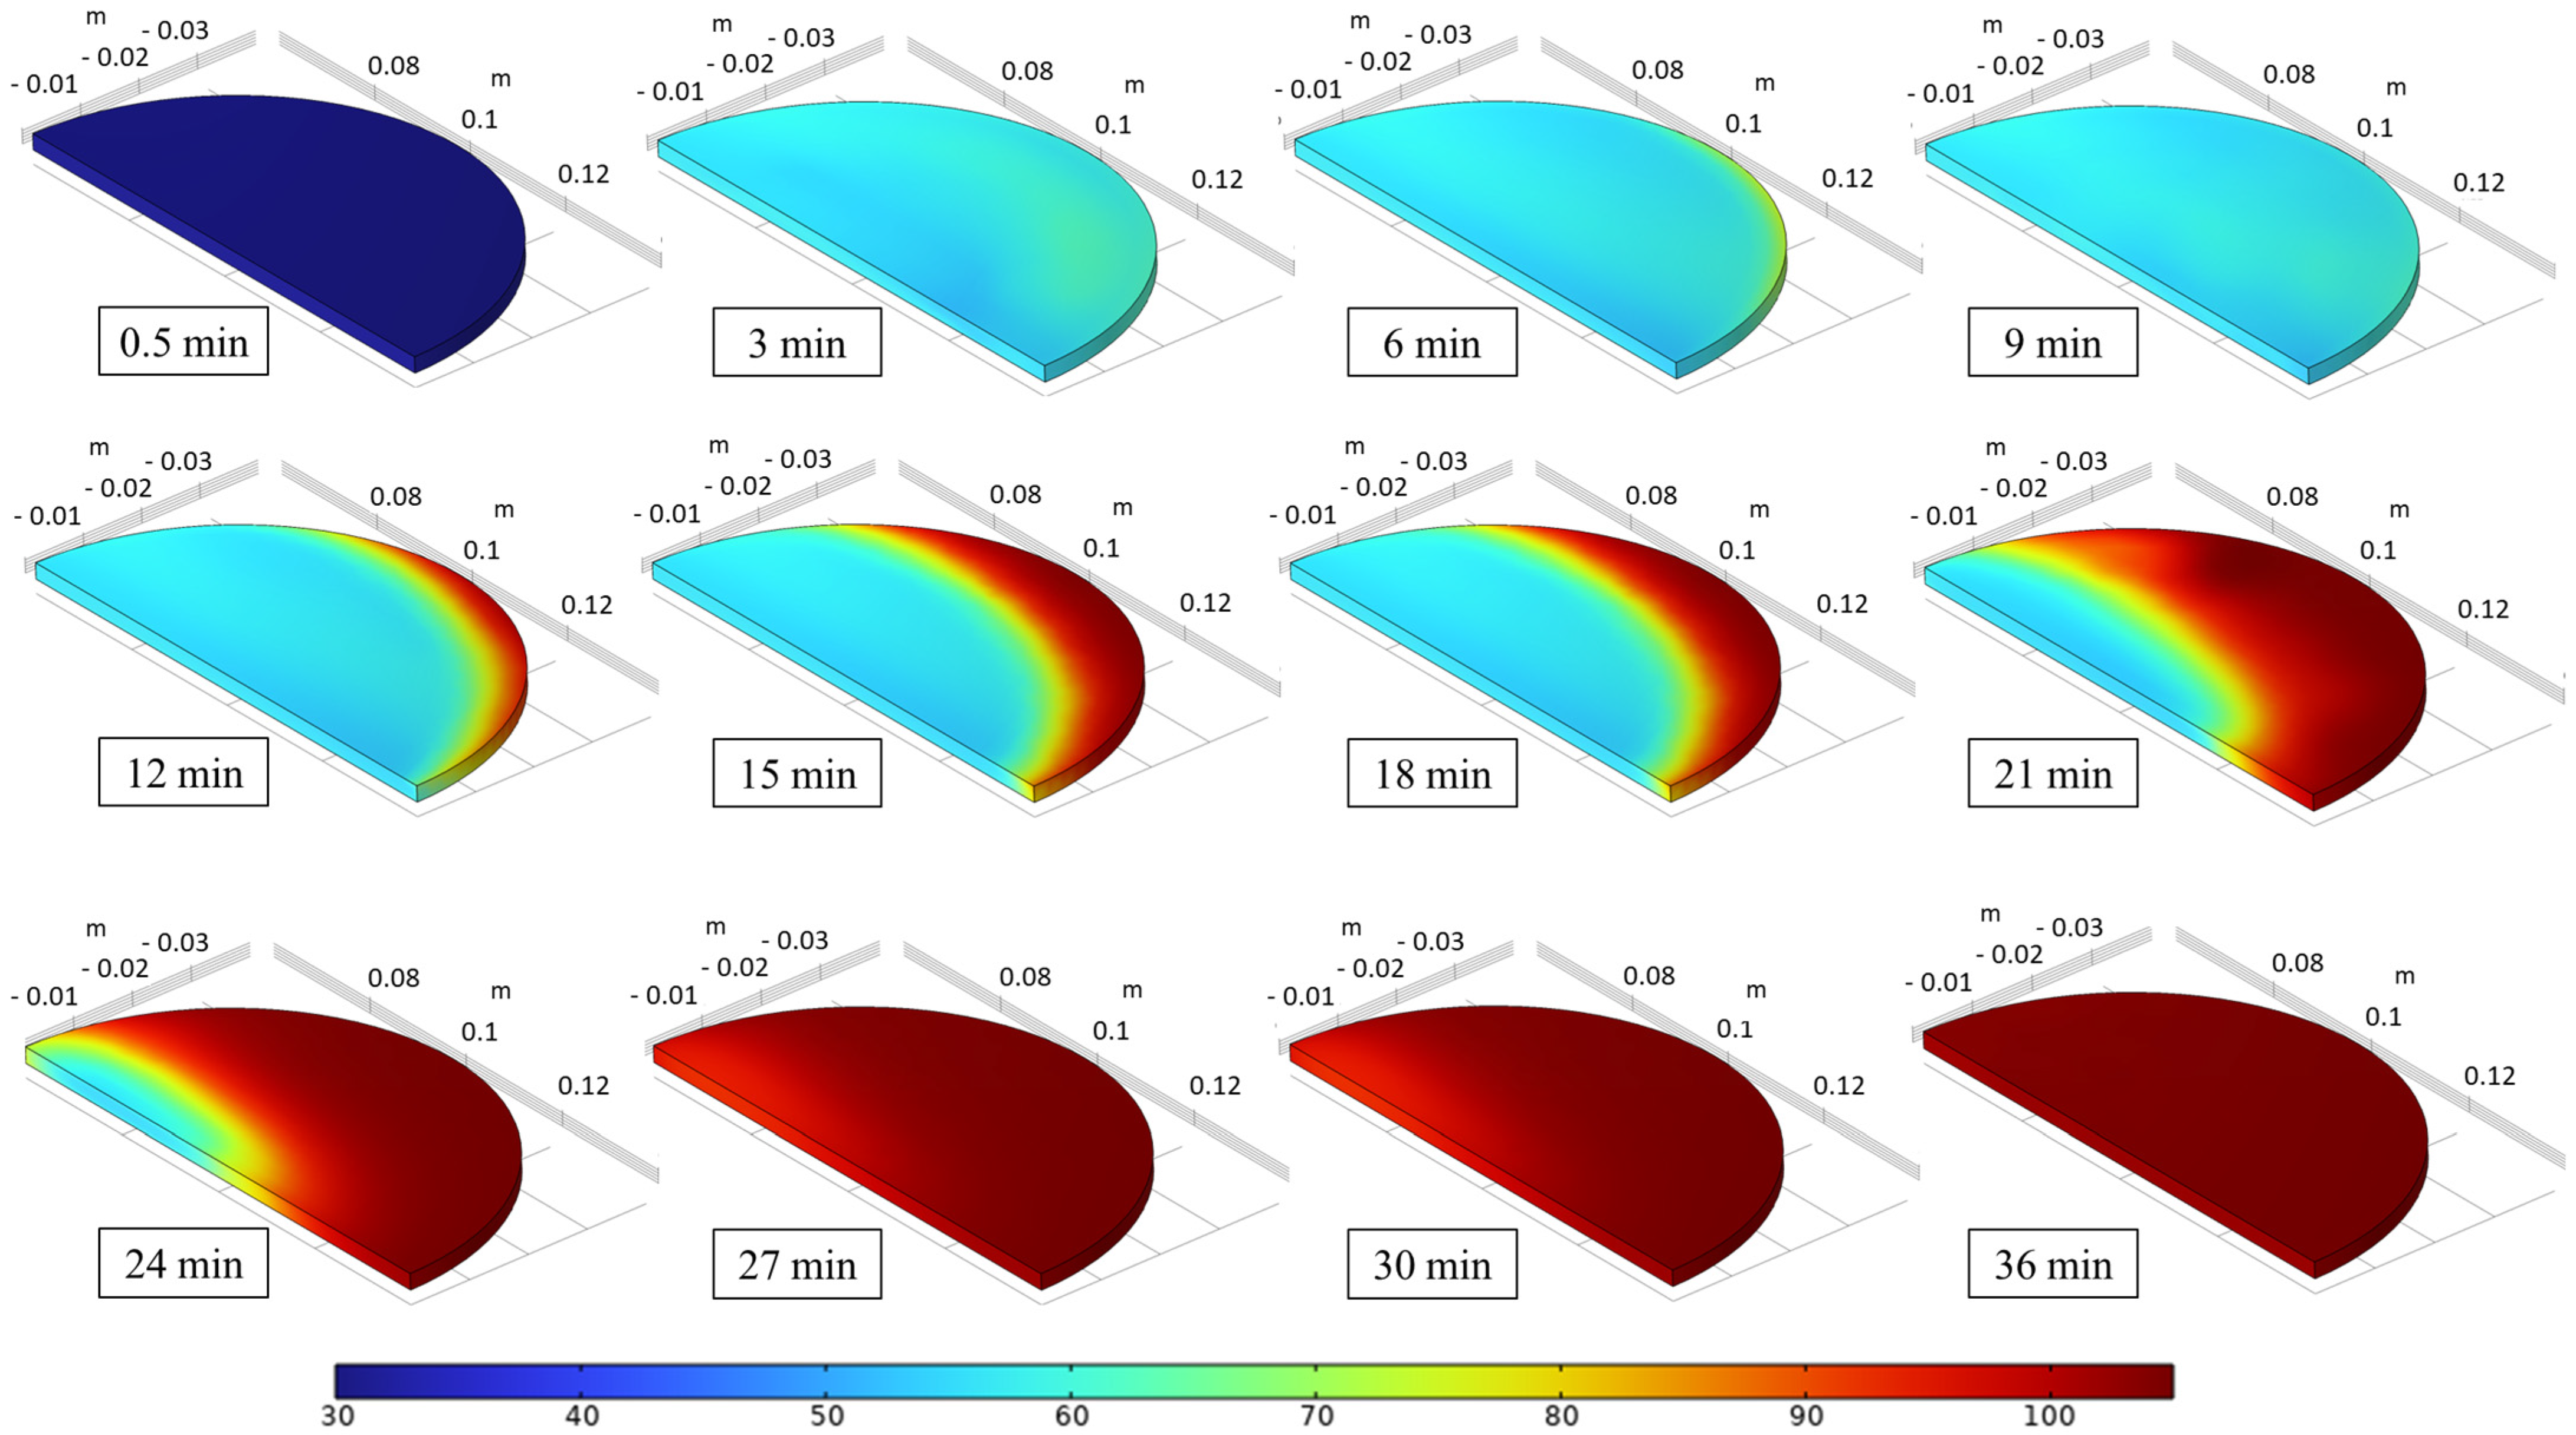
3.3.1. Temperature and Moisture Content Distributions

The temperature and moisture content, which are the average values of the perpendicular face of the center line, are presented in Figure 8 and Figure 9. At all time periods, the moisture content of the center is higher than the surface, while the temperature of the center is lower than the surface. The moisture content difference between the center and surface is about 0.3 kg w/kg.s at 18 min, while the temperature difference is 2 °C. For the whole drying process, this difference in moisture remained significantly, but it reduced according to the drying time. Generally, the temperature distributions according to the thickness are insignificant during the drying process. This marginal temperature difference may stem from two reasons. Firstly, the thermal energy transported to the sample surface is partly used for water evaporation. Thus, the sensible heating effect at the surface is insignificant compared to the normal conductive heating process. Secondly, it can be expected that the Biot number magnitude of the heat transfer process in the z-axis is small due to the small value of sample thickness. In the falling drying rate period, the first reason becomes weaker when the sample surface is not wetted sufficiently. Therefore, in the second drying period, the temperature difference is comparatively higher than in the constant drying period.

3.3.2. Temperature and Moisture Content Distributions of the Sample

The distributions of temperature and moisture content of the sample are presented in Figure 10 and Figure 11. Firstly, there is a temperature increase versus time in the beginning period, and then this is almost uniform as the adiabatic temperature, which is described in Figure 4 corresponding with the constant drying period. After that, the temperature increases gradually in the whole surface area. Hower, the increase varies due to the distributions of the gas velocity. Additionally, the spatial temperature decreases from the surface to the center, and this trend agrees with the theoretical heat transfer. The surface part exposed to the high-velocity gas is heated up faster than the other area due to the fast heat transfer. For the moisture change of the sample, there is a significant variety of moisture distributions. The moisture at the center is higher than the surface, but the area near the high-gas-velocity area evaporates faster than the other area, because in the high-velocity space, the mass transfer occurs faster. From the significant effects of the gas fields, the CFD simulation is necessary to completely evaluate the drying kinetic in the whole drying system.

4. Conclusions

In this study, a CFD simulation of a system drying apple slices in CO2 by COMSOL Multiphysics is presented. It is the first time the intra-sample and extra-sample heat, mass, and momentum transport processes are modeled simultaneously and coupled. The simulation model is solved to yield the spatial distributions of temperature and moisture versus time in 3D models of both the sample and gas. The model validity is implied by a fairly good agreement between the numerical and experimental temperature evolutions and evaporation kinetics. The simulation results favor the theoretical hypothesis, where the drying process can be divided in three periods: the initial heating, constant drying, and falling drying periods. The impact of drying temperatures on the magnitude of moisture content of the transition point between the constant and falling drying rate periods is clarified numerically. Additionally, the gas velocity distribution inside the dryer can be considered as the reason for the maldistribution of the moisture content and temperature along the gas stream. It can be expected that in the future, this CFD model can capture the complicated transport phenomena inside the industrial- and pilot-scale dryers for optimization of the drying process in terms of drying kinetics. In addition to the energy aspect, the impact of the CO2 environment on product quality and nutrition values should be investigated. Furthermore, the quality deterioration kinetic equation shall be integrated inside the CFD model to fully simulate the nature of the drying process in the future.

Author Contributions

Methodology, T.T.H.T.; software, T.C.D. and Q.T.L.; validation, T.T.H.T.; data curation, Q.T.L.; writing—original draft, T.C.D.; writing—review and editing, T.T.H.T.; visualization, T.C.D.; supervision, T.T.H.T. All authors have read and agreed to the published version of the manuscript.

Funding

This work was supported by funding from the Ministry of Education and Training (MOET), Vietnam (grant number B2022-BKA-11).

Institutional Review Board Statement

Not applicable.

Data Availability Statement

The data used to support the findings of this study are included within the article.

Conflicts of Interest

The authors declare no conflicts of interest.

Nomenclature

ciMass concentration of species i in gas (kg/m3)
cwWater mass concentration (kg/m3)
cvVapor mass concentration (kg/m3)
cgGas mass concentration (kg/m3)
cp,effEffective specific heat capacity (J/kgK)
cp,w, cp,g, cp.sSpecific heat capacity of water, gas, and solid (J/kgK)
Dc, Deff,g, DvgCapillary diffusivity, effective gas diffusivity, and vapor gas binary diffusivity (m2/s)
hg, hwGas enthalpy and water enthalpy (J)
hfgLatent heat evaporation (J/kg)
KevapEvaporation constant
kwIntrinsic permeability of water (m2)
kr,wRelative permeability of water (m2)
kgIntrinsic permeability of gas (m2)
kr,gRelative permeability of gas (m2)
keffEffective thermal conductivity (W/mK)
kth,g, kth,w, kth,sThermal conductivity of gas, water, and solid (W/mK)
Mv, MgVapor molecular weight and gas molecular weight (kg/mol)
PTotal pressure (Pa)
pv, pgPartial pressure of vapor and gas (Pa)
pv,eqEquilibrium vapor pressure (Pa)
pv,satSaturation vapor pressure (Pa)
pambAmbient pressure (Pa)
RUniversal gas constant (J/molK)
RevapEvaporation rate (kg/m3s)
Sw, SgSaturation of water and gas, respectively
Sw0, Sv0, Sg0Initial saturation of water, vapor, and gas
TProduct temperature (°C)
TgGas temperature (°C)
uGas velocity (m/s)
Δ V g , Δ V w , Δ V s Volume of gas, water, and solid (m3)
XMoisture content (kg w/kg s)
zCoordinate (mm)
ϕ Apparent porosity
μ w , μ g Viscosity of water and gas (Pa·s)
ω v , ω g Mass fraction of vapor and gas
ρ w , ρ g Density of water and gas (kg/m3)
ρ e f f Effective density (kg/m3)
τ Time (s)

References

  1. Hawlader, M.; Perera, C.O.; Tian, M. Properties of modified atmosphere heat pump dried foods. J. Food Eng. 2006, 74, 392–401. [Google Scholar] [CrossRef]
  2. Mujumdar, A.S.; Law, C.L. Drying Technology: Trends and Applications in Postharvest Processing. Food Bioprocess. Technol. 2010, 3, 843–852. [Google Scholar] [CrossRef]
  3. Alwazeer, D.; Örs, B. Reducing atmosphere drying as a novel drying technique for preserving the sensorial and nutritional notes of foods. J. Food Sci. Technol. 2019, 56, 3790–3800. [Google Scholar] [CrossRef] [PubMed]
  4. Liu, Y.; Wu, J.; Miao, S.; Chong, C.; Sun, Y. Effect of a Modified Atmosphere on Drying and Quality Characteristics of Carrots. Food Bioprocess. Technol. 2014, 7, 2549–2559. [Google Scholar] [CrossRef]
  5. Hawlader, M.N.A.; Perera, C.O.; Tian, M. Comparison of the Retention of 6-Gingerol in Drying of Ginger Under Modified Atmosphere Heat Pump Drying and other Drying Methods. Dry. Technol. 2006, 24, 51–56. [Google Scholar] [CrossRef]
  6. Cam, I.B.; Basunal Gulmez, H.; Eroglu, E.; Topuz, A. Strawberry drying: Development of a closed-cycle modified atmosphere drying system for food products and the performance evaluation of a case study. Dry. Technol. 2018, 36, 1460–1473. [Google Scholar] [CrossRef]
  7. Liu, Y.-H.; Miao, S.; Wu, J.-Y.; Liu, J.-X. Drying and Quality Characteristics of Flos Lonicerae in Modified Atmosphere with Heat Pump System. J. Food Process Eng. 2014, 37, 37–45. [Google Scholar] [CrossRef]
  8. O’Neill, M.B.; Rahman, M.S.; Perera, C.O.; Smith, B.; Melton, L.D. Color and density of apple cubes dried in air and modified atmosphere. Int. J. Food Prop. 1998, 1, 197–205. [Google Scholar] [CrossRef]
  9. Hawlader, M.N.A.; Perera, C.O.; Tian, M.; Yeo, K.L. Drying of Guava and Papaya: Impact of Different Drying Methods. Dry. Technol. 2006, 24, 77–87. [Google Scholar] [CrossRef]
  10. Santos, P.H.S.; Silva, M.A. Kinetics of L -Ascorbic Acid Degradation in Pineapple Drying under Ethanolic Atmosphere. Dry. Technol. 2009, 27, 947–954. [Google Scholar] [CrossRef]
  11. Braga, A.M.P.; Silva, M.A.; Pedroso, M.P.; Augusto, F.; Barata, L.E.S. Volatile Composition Changes of Pineapple during Drying in Modified and Controlled Atmosphere. Int. J. Food Eng. 2010, 6, 1–12. [Google Scholar] [CrossRef]
  12. Khanlari, Y.; Aroujalian, A.; Fazel, S.; Fathizadeh, M. An Experimental Work and Mathematical Modeling on Kinetic Drying of Tomato Pulp Under Different Modified Atmosphere Conditions. Int. J. Food Prop. 2014, 17, 1–12. [Google Scholar] [CrossRef]
  13. Nadhari, W.N.A.W.; Hashim, R.; Sulaiman, O.; Jumhuri, N. Drying kinetics of oil palm trunk waste in control atmosphere and open air convection drying. Int. J. Heat. Mass. Transf. 2014, 68, 14–20. [Google Scholar] [CrossRef]
  14. Jannot, Y.; Talla, A.; Nganhou, J.; Puiggali, J.-R. Modeling of Banana Convective Drying by the Drying Characteristic Curve (DCC) Method. Dry. Technol. 2004, 22, 1949–1968. [Google Scholar] [CrossRef]
  15. Akpinar, E.K. Determination of suitable thin layer drying curve model for some vegetables and fruits. J. Food Eng. 2006, 73, 75–84. [Google Scholar] [CrossRef]
  16. Chen, X.D.; Putranto, A. Reaction Engineering Approach (REA) to Modeling Drying Problems: Recent Development and Implementations. Dry. Technol. 2015, 33, 1899–1910. [Google Scholar] [CrossRef]
  17. Compaore, A.; Dissa, A.O.; Rogaume, Y.; Putranto, A.; Chen, X.D.; Mangindaan, D.; Zoulalian, A.; Rémond, R.; Tiendrebeogo, E. Application of the reaction engineering approach (REA) for modeling of the convective drying of onion. Dry. Technol. 2017, 35, 500–508. [Google Scholar] [CrossRef]
  18. Vega-Castro, O.; Osorio-Arias, J.; Duarte-Correa, Y.; Jaques, A.; Ramírez, C.; Núñez, H.; Simpson, R. Critical Analysis of the Use of Semiempirical Models on the Dehydration of Thin-Layer Foods Based on Two Study Cases. Arab. J. Sci. Eng. 2023, 48, 15851–15863. [Google Scholar] [CrossRef]
  19. Anabel, F.; Celia, R.; Germán, M.; Rosa, R. Determination of effective moisture diffusivity and thermodynamic properties variation of regional wastes under different atmospheres. Case Stud. Therm. Eng. 2018, 12, 248–257. [Google Scholar] [CrossRef]
  20. Vu, H.T.; Tsotsas, E. Mass and Heat Transport Models for Analysis of the Drying Process in Porous Media: A Review and Numerical Implementation. Int. J. Chem. Eng. 2018, 2018, 1–13. [Google Scholar] [CrossRef]
  21. Elustondo, D.; Elustondo, M.P.; Urbicain, M.J. Mathematical modeling of moisture evaporation from foodstuffs exposed to subatmospheric pressure superheated steam. J. Food Eng. 2001, 49, 15–24. [Google Scholar] [CrossRef]
  22. Kumar, C.; Joardder, M.U.; Farrell, T.W.; Millar, G.J.; Karim, A. A porous media transport model for apple drying. Biosyst. Eng. 2018, 176, 12–25. [Google Scholar] [CrossRef]
  23. Agarla, M.; Napoletano, P.; Schettini, R. Quasi Real-Time Apple Defect Segmentation Using Deep Learning. Sensors 2023, 23, 7893. [Google Scholar] [CrossRef] [PubMed]
  24. Demiray, E.; Yazar, J.G.; Aktok, Ö.; Çulluk, B.; Çalışkan Koç, G.; Pandiselvam, R. The Effect of Drying Temperature and Thickness on the Drying Kinetic, Antioxidant Activity, Phenolic Compounds, and Color Values of Apple Slices. J. Food Qual. 2023, 2023, 1–12. [Google Scholar] [CrossRef]
  25. Vega-Gálvez, A.; Ah-Hen, K.; Chacana, M.; Vergara, J.; Martínez-Monzó, J.; García-Segovia, P.; Lemus-Mondaca, R.; Di Scala, K. Effect of temperature and air velocity on drying kinetics, antioxidant capacity, total phenolic content, colour, texture and microstructure of apple (var. Granny Smith) slices. Food Chem. 2012, 132, 51–59. [Google Scholar] [CrossRef]
  26. Le, K.H.; Tsotsas, E.; Kharaghani, A. Continuum-scale modeling of superheated steam drying of cellular plant porous media. Int. J. Heat. Mass. Transf. 2018, 124, 1033–1044. [Google Scholar] [CrossRef]
  27. Heinen, M.; Vrabec, J.; Fischer, J. Communication: Evaporation: Influence of heat transport in the liquid on the interface temperature and the particle flux. J. Chem. Phys. 2016, 145, 81101. [Google Scholar] [CrossRef] [PubMed]
  28. Isaac, O.; Thiemer, K. Biochemische Untersuchungen von Kamilleninhaltsstoffen. III. In-vitro-Versuche über die antipeptische Wirkung des (-)-alpha-Bisabolols. Arzneimittelforschung 1975, 25, 1352–1354. [Google Scholar]
  29. Le, K.H.; Hampel, N.; Kharaghani, A.; Bück, A.; Tsotsas, E. Superheated steam drying of single wood particles: A characteristic drying curve model deduced from continuum model simulations and assessed by experiments. Dry. Technol. 2018, 36, 1866–1881. [Google Scholar] [CrossRef]
Figure 1. Experimental drying system: (a) symmetry schematic diagram, (b) meshing, and (c) real picture.
Agriculture 14 01642 g001
Figure 2. Comparisons of average moisture content between experiment and simulation.
Agriculture 14 01642 g002
Figure 3. Comparisons of evaporation rate content between experiment and simulation.
Agriculture 14 01642 g003
Figure 4. Comparisons of average temperature between experiment and simulation.
Agriculture 14 01642 g004
Figure 5. Gas velocity distribution: (a) the whole dryer; (b) corresponding surfaces - a, surface - b, and surface - c.
Agriculture 14 01642 g005
Figure 6. Gas temperature distributions.
Agriculture 14 01642 g006
Figure 7. Gas moisture fraction distributions.
Agriculture 14 01642 g007
Figure 8. Z-axial temperature distribution of sample dried at Tinlet = 105 °C.
Agriculture 14 01642 g008
Figure 9. Z-axial moisture content distribution of sample dried at Tinlet = 105 °C.
Agriculture 14 01642 g009
Figure 10. Temperature contour of sample dried at Tinlet = 105 °C.
Agriculture 14 01642 g010
Figure 11. Moisture content contour of sample dried at Tinlet = 105 °C.
Agriculture 14 01642 g011
Table 1. Properties of fluid in the simulation.
ParameterAmountUnit
Water density ρ w = 1.492 × 10 5 T 3 0.005768 T 2 + 0.01135 T + 1000 kg/m3
Water heat capacity c p , w = 3.139 × 10 9 T 4 7.645 × 10 7 T 3 + 7.415 × 10 5 T 2 0.0029 T + 4.218 kJ/kgK
Water thermal conductivity λ w = 4.02 × 10 8 T 3 1.561 × 10 5 T 2 + 0.002374 T + 0.5562 W/mK
Water dynamic viscosity μ w = 3.357 × 10 11 T 4 9.245 × 10 9 T 3 + 9.942 × 10 7 T 2 5.541 × 10 5 T + 0.00178 kg/m·s
Vapor heat capacity c p , v = 1.143 × 10 9 T 3 + 8.019 × 10 7 T 2 + 1.653 × 10 4 T + 1.863 kJ/kgK
Vapor thermal conductivity λ v = 7.301 × 10 8 T 2 + 6.834 × 10 5 T + 0.01672 W/mK
Vapor dynamic viscosity μ v = 8.863 × 10 12 T 2 + 3.606 × 10 8 T + 8.954 × 10 6 kg/m·s
Carbon dioxide density ρ a , C O 2 = 4.586 × 10 8 T + 1.381 × 10 5 kg/m3
Carbon dioxide heat capacity c p , g = 1.042 × 10 6 T 2 + 1.127 × 10 3 T + 0.8141 kJ/kgK
Carbon dioxide thermal conductivity c p , g = 1.042 × 10 6 T 2 + 1.127 × 10 3 T + 0.8141 W/mK
Carbon dioxide dynamic viscosity μ g = 1.605 × 10 11 T 2 + 4.827 × 10 8 T + 1.375 × 10 5 kg/m·s
Table 2. Input parameters used for simulation.
ParametersFormula
Apple tissue intrinsic permeability k w = 5.578 × 10 12 ϕ ( 1 ϕ ) 2
Gas intrinsic permeability k g = 4 × 10 12
Permeabilities of water and gas for apple k r , w = S w 3
k r , g = 1.01 e 10.86 S w
Gas diffusivity D e f f , g = D v g S g ϕ 4 / 3
D v g = 1.81 × 10 6 exp 16,900 / R T [28]
Disclaimer/Publisher’s Note: The statements, opinions and data contained in all publications are solely those of the individual author(s) and contributor(s) and not of MDPI and/or the editor(s). MDPI and/or the editor(s) disclaim responsibility for any injury to people or property resulting from any ideas, methods, instructions or products referred to in the content.

