Article

Assessing the Environmental Sustainability of Organic Wine Grape Production with Qualified Designation of Origin in La Rioja, Spain

by
Adrián Agraso-Otero
1,
Javier J. Cancela
2,3,
Mar Vilanova
3,4,
Javier Ugarte Andreva
5,
Ricardo Rebolledo-Leiva
6 and
Sara González-García
1,3,*
1
CRETUS, Department of Chemical Engineering, School of Engineering, University of Santiago de Compostela, 15782 Santiago de Compostela, Spain
2
GI-1716, Proyectos y Planificación, Departamento Ingeniería Agroforestal, Escola Politécnica Superior de Enxeñaría, Universidade de Santiago de Compostela, Rúa Benigno Ledo s/n, 27002 Lugo, Spain
3
CropQuality: Crop Stresses and Their Effects on Quality (USC), Associate Unit of Instituto de Ciencias de la Vid y del Vino (ICVV-CSIC), 27002 Lugo, Spain
4
Instituto de Ciencias de la Vid y del Vino-ICVV (CSIC, UR, GR) Finca La Grajera, 26007 Logroño, Spain
5
Servicio de Investigación Agraria y Sanidad Vegetal, Gobierno de La Rioja, 26071 Logroño, Spain
6
Department of Computing and Industries, Faculty of Engineering Sciences, Universidad Católica del Maule, Av. San Miguel 3605, Talca 3460000, Chile
*
Author to whom correspondence should be addressed.
Agriculture 2025, 15(5), 536; https://doi.org/10.3390/agriculture15050536
Submission received: 28 January 2025 / Revised: 26 February 2025 / Accepted: 27 February 2025 / Published: 28 February 2025

Abstract

:
Vineyards are significant demanders of fertilisers, pesticides, soil tillage and water. This study assessed the environmental profile of an organic grape production system with La Rioja qualified designation of origin using a cradle-to-gate life cycle assessment (LCA). The ReCiPe method was applied to assess the environmental impacts, while the Available WAter REmaining method was used to estimate the water scarcity. Additionally, the biodiversity loss, a global issue exacerbated by agricultural practices, was evaluated along with an ecosystem service indicator, pollination, to provide a more comprehensive analysis. This study employed two functional units: one kilogram of grapes and one hectare of land. The results revealed that the environmental impacts on global warming were more than ten times lower than those reported in most studies reviewed in the literature, primarily due to the effects of direct land use changes associated with pruning waste management. The total emissions in this category were 99.51 kg CO2 eq per hectare or 15.31 g CO2 eq per kilogram of grapes. Agrochemical-related emissions were identified as the environmental hotspot. The water scarcity was estimated at 48.4 litres per kilogram of grapes, mainly attributed to agrochemical dispersion. The biodiversity loss was largely driven by land transformation, with plants being the most impacted taxon. However, a high abundance of pollinators was observed in spring, contributing to improved grape quality and natural pest control. These findings could help highlight the environmental benefits of organic viticulture and the good practices implemented in this pilot.

1. Introduction

Grapes are among the most widely cultivated crops on the planet, covering an estimated 7.2 million hectares globally in 2023. In terms of the global vineyard surface area, Spain covers 945,000 hectares, followed by France, China and Italy [1]. However, when it comes to wine production, the rankings shift: France tops the list with 48 million hL, followed by Italy with 38.3 million hL and Spain with 28.3 million hL [1].
Grapes are demanding crops in terms of fertilisers and phytosanitary products, as well as soil tillage [2]. In quantitative terms, grape cultivation for wine production accounts for about 2% of the global GHG emissions from the sector and about 0.3% of the annual worldwide emissions [3]. One alternative to this is organic agriculture, which focuses on the responsible use of energy, the maintenance of biodiversity and the enhancement of soil fertility using natural substances and processes [4]. Thus, organic viticulture aims to reduce the use of pesticides and synthetic fertilisers by implementing various practices that promote adequate biodiversity within the production system [5].
Water consumption is another crucial factor in agriculture, as the water demand represents roughly three-quarters of the total freshwater use, with more than half being lost during storage or transport [6]. The global average water footprint for the viticulture phase has been estimated at approximately 610 L per kilogram of grapes, which is clearly influenced by irrigation [7]. Practices that could help to minimise water use include drip irrigation, particularly subsurface drip irrigation, which facilitates direct water access to the roots, and fertigation, which supplies nutrients in a soluble form through irrigation [8].
In agriculture, the use of agrochemicals generates significant environmental impacts, being one of the main causes of contamination of drinking water and watersheds [9]. In addition, their application negatively impacts soil quality by decreasing the organic matter content, and it also pollutes the air, as some of their ingredients remain in the atmosphere for extended periods, where they decompose under the influence of sunlight, altering their chemical composition [10].
Life cycle assessment (LCA) is a widely recognised tool for assessing resource use and environmental impacts to support the transition towards a sustainable agriculture sector [11,12,13]. It measures the environmental burdens related to greenhouse gas emissions, acidification and fossil resource demand [13]. However, LCA still lacks a full understanding of the broader environmental costs and benefits of human activities [14]. Evaluating ecosystem services (ESs) is crucial for a more holistic view, covering aspects like carbon sequestration and pollination, new issues that have been under-represented in this type of research [15]. ESs are defined as the broad range of direct, indirect, and intermediate benefits that people derive from ecosystems, considered from a human well-being perspective [16]. Biodiversity decline is a major issue in agriculture, threatening 24,000 of 28,000 endangered species due to intensive farming practices and increased agrochemical and water use [17]. Additionally, agriculture drives around 90% of global deforestation [18]. Pollination is also vital, with 87% of major food crops and 35% of the crop production volume depending on animal pollinators [19].
Rioja wine is one of Spain’s most internationally renowned wines and holds Spain’s oldest designation of origin (DO), established in 1925. In 1991, it became the first qualified designation of origin (DOCa) in Spain, further cementing its prestige and quality [20]. The DO and DOCa are quality labels that ensure products are always elaborated, processed and prepared in the specific geographical region. However, DOCa is more restrictive in some aspects [21]. Spain has a total of 70 DOs, of which only two are DOCas: Rioja and Priorato [22]. La Rioja DOCa allows a maximum planting density of 10,000 vines per hectare of land and a maximum production of 6500 kg of red grapes per hectare and 9000 kg of white grapes per hectare, prioritising product recognition and quality over quantity [23].
Although grapes are a widely studied crop, both in the agricultural phase and in their subsequent transformation into wine [24,25], La Rioja DOCa stands out as one of the most prestigious wine-producing regions in the world. Therefore, it is crucial to analyse the agricultural practices in this region, not only from a productive and economic standpoint but also from an environmental perspective. Consequently, this research analyses not only the impact on typical environmental impact categories linked to agricultural systems, such as the global warming, acidification, or eutrophication, but also the water scarcity level, the biodiversity loss caused by the transformation of habitats for this purpose and the influence of pollination on this crop. Moreover, the fact that this is an organic farming system adds further relevance to this study, considering that only approximately 13% of vineyards in Spain are managed organically, highlighting the potential for expanding sustainable practices in the sector and the importance of understanding their environmental impacts [26].
In this context, the present manuscript aims to evaluate the environmental impacts of an organic red grape cultivation system without irrigation in La Rioja DOCa, as this sector requires a shift towards environmentally friendly practices. It is hoped that the findings of this research can help highlight these practices as benchmarking options to achieve an eco-friendly Spanish wine sector, since it is one of the most important in the world. To do so, a comprehensive environmental assessment has been carried out using the LCA methodology due to its capacity to provide an exhaustive analysis of environmental impacts by examining multiple indicators and considering all the inputs and outputs throughout the entire life cycle of the agricultural system being assessed.

2. Materials and Methods

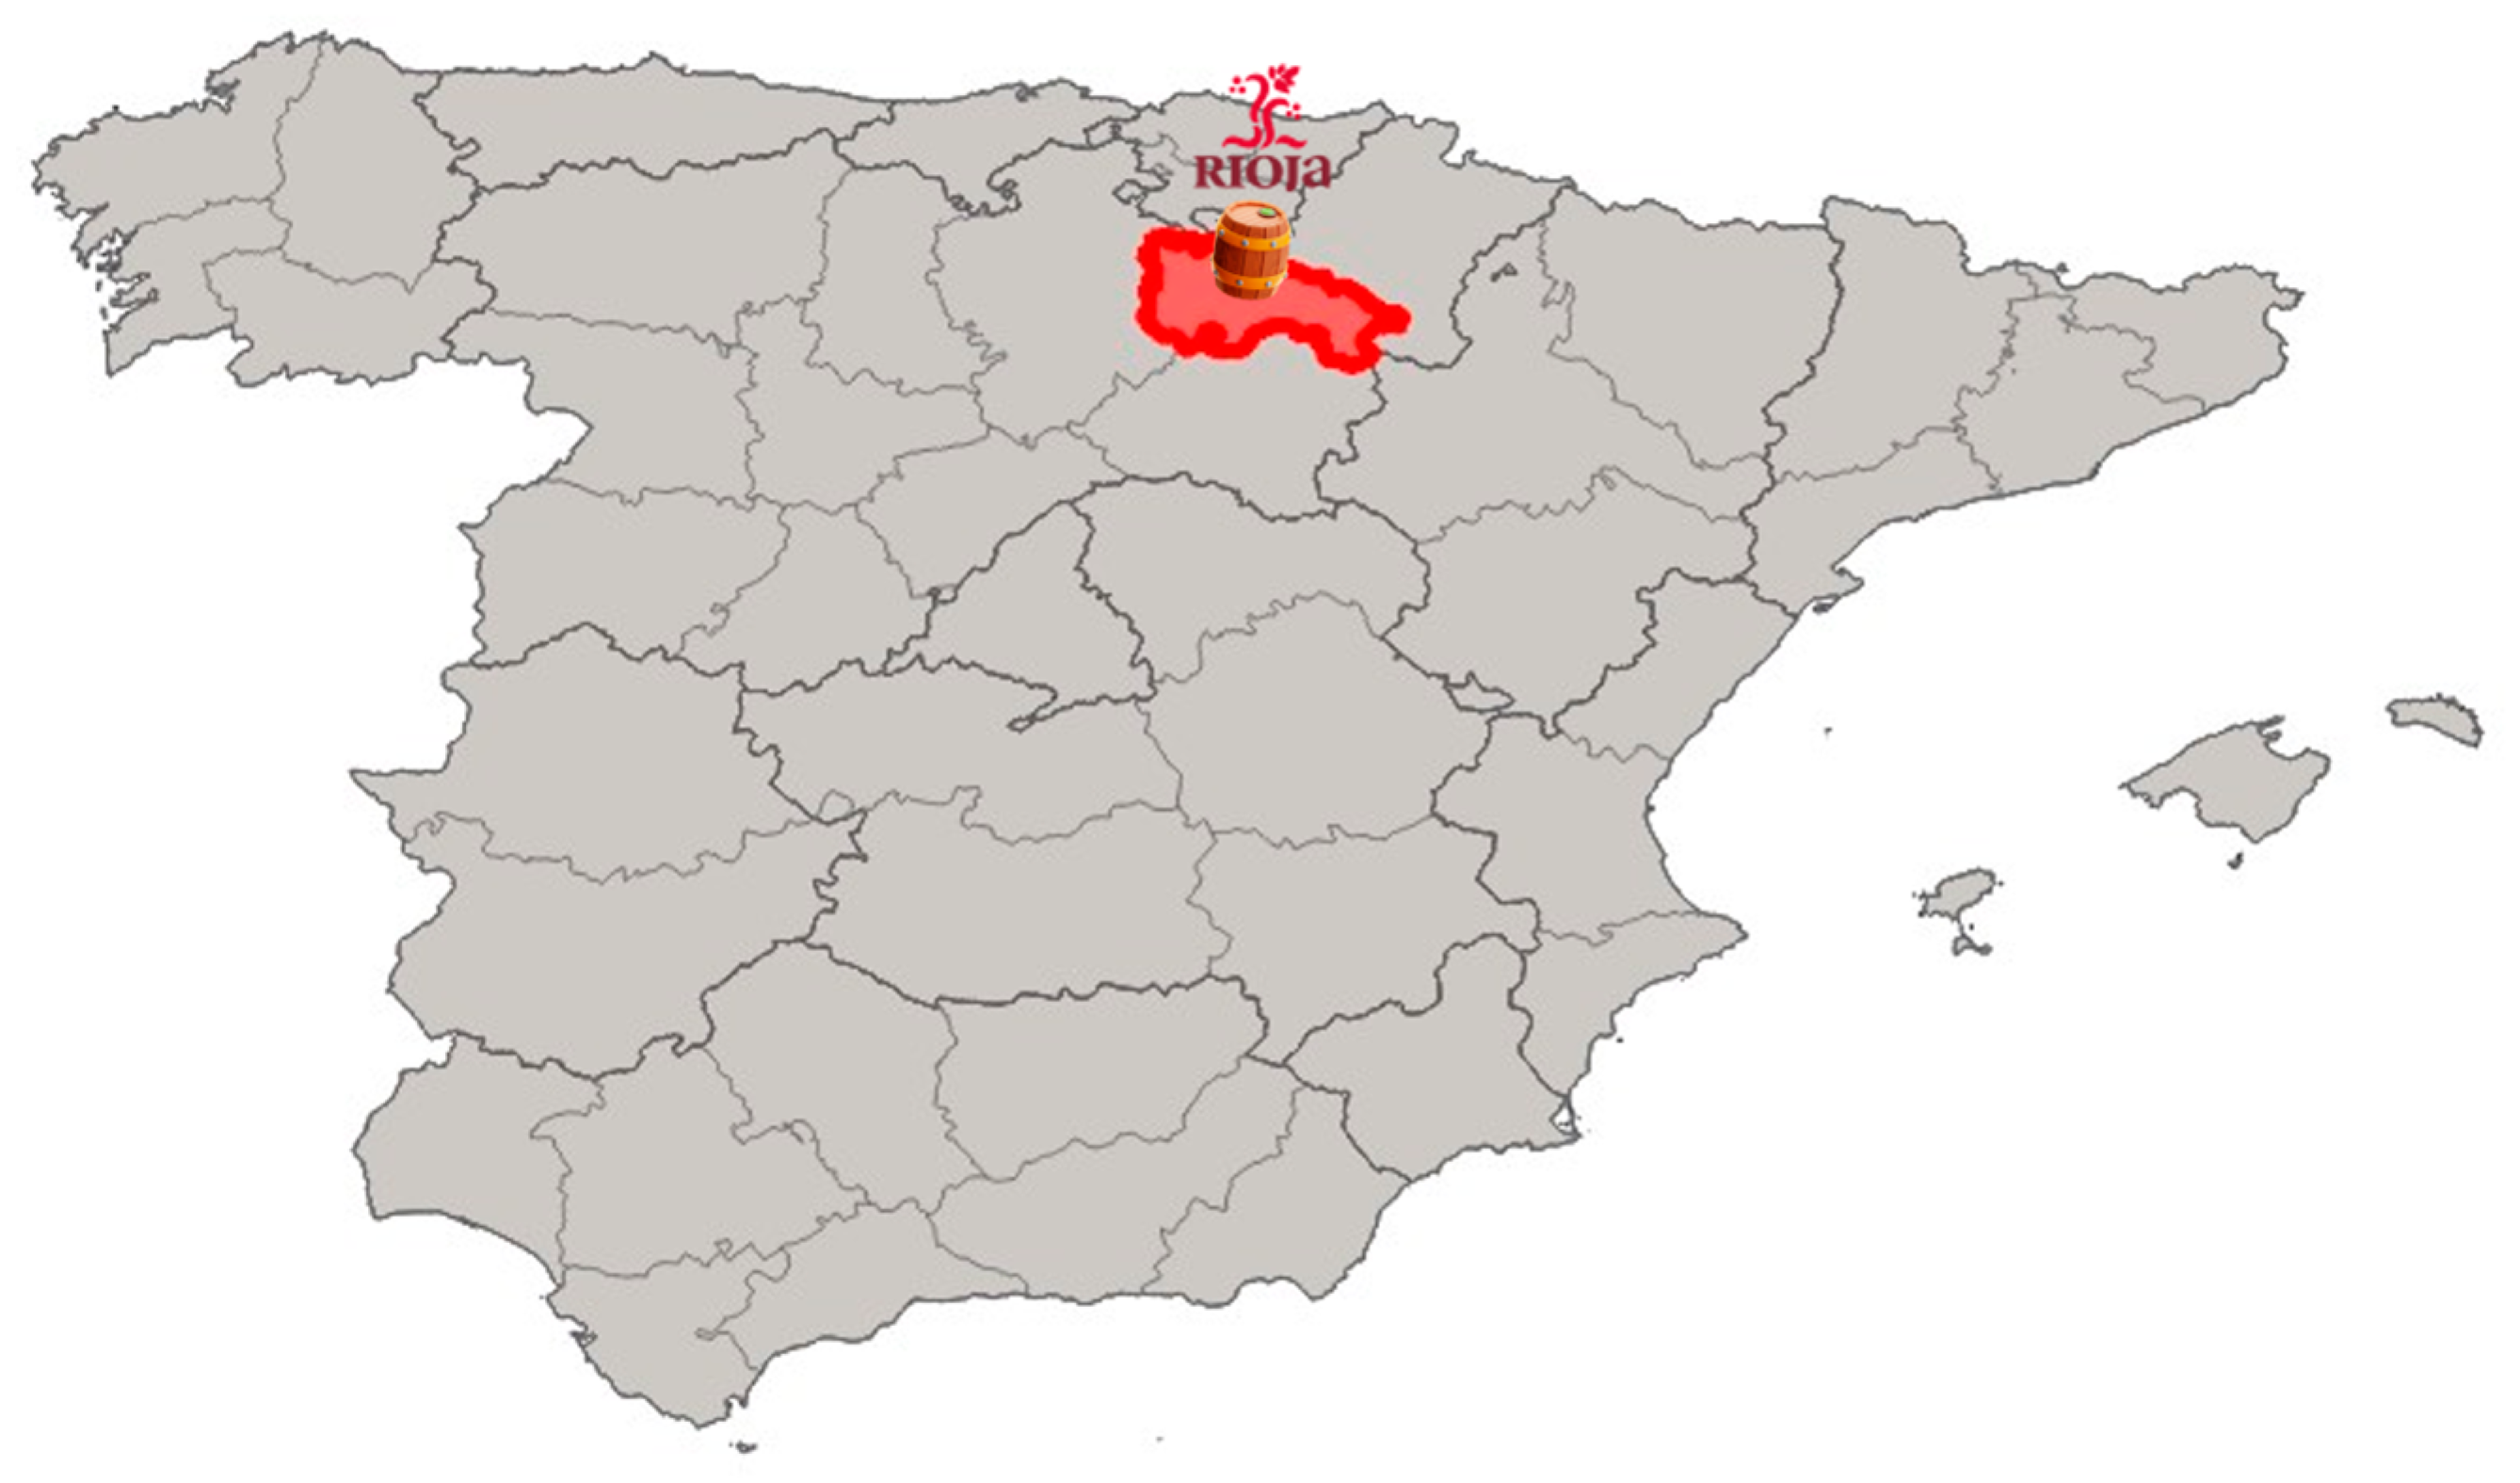
2.1. Study Area and Evaluated Scenario

This study was carried out in a vineyard located in La Rioja Alta subzone, northern Spain (42°26′34.1″ N, 2°30′58.2″ W) (Figure 1), one of the three subzones that are part of this DOCa. The region is characterised by a continental Mediterranean climate with annual rainfall of about 450 mm. The total cultivated area is about 2.6 ha, located in a single plot, and the field is completely flat. The production is about 6.5 t/ha of ‘Tempranillo’ grapes, from which about 4.5 t/ha of wine is produced. It is important to point out that the land is not irrigated, as rainwater is already sufficient for crop growth, using water only to disperse the agrochemicals. In addition, this farm holds an organic production certification, ensuring that the grapes produced meet the highest quality standards while respecting the environment and preserving the soil fertility. This is achieved through the optimal use of natural resources, fertilisation with organic matter, and the application of approved phytosanitary treatments, such as copper and sulphur [27]. In terms of the agricultural activities, the season begins in February with the pruning of the vines, followed by the shredding of the plant remains, which are left on the ground as organic matter. Subsequently, the soil is fertilised with 700 kg/ha of organic fertiliser and ploughed twice. As the plants develop, unwanted parts such as leaves or damaged bunches are selectively removed to ensure optimal growth. Between May and July, different phytosanitary treatments are applied to protect the crop, including the application of 4 kg/ha of copper and 28 kg/ha of sulphur, culminating in the grape harvest in September. Moreover, 8 t/ha of pruning waste is generated, which is shredded and incorporated into the soil. This primary information was collected through targeted interaction with farmers using specifically designed questionnaires. The practices discussed here are representative, as, despite the data being from the 2023 campaign, the field operations and inputs remain consistent across campaigns and throughout the entire vineyard area.
On the other hand, it is important to note that the climatic and soil characteristics in La Rioja can vary across subzones. For this reason, these cultivation practices can be extended to other vineyards after conducting a prior study of such variability, as this study focuses only on the characteristics of this pilot.

2.2. Environmental Assessment

The environmental impacts of the studied scenario were evaluated through the attributional approach of the LCA framework. The following sections provide an overview of the different methodological stages based on ISO 14040 and 14044 [28,29].

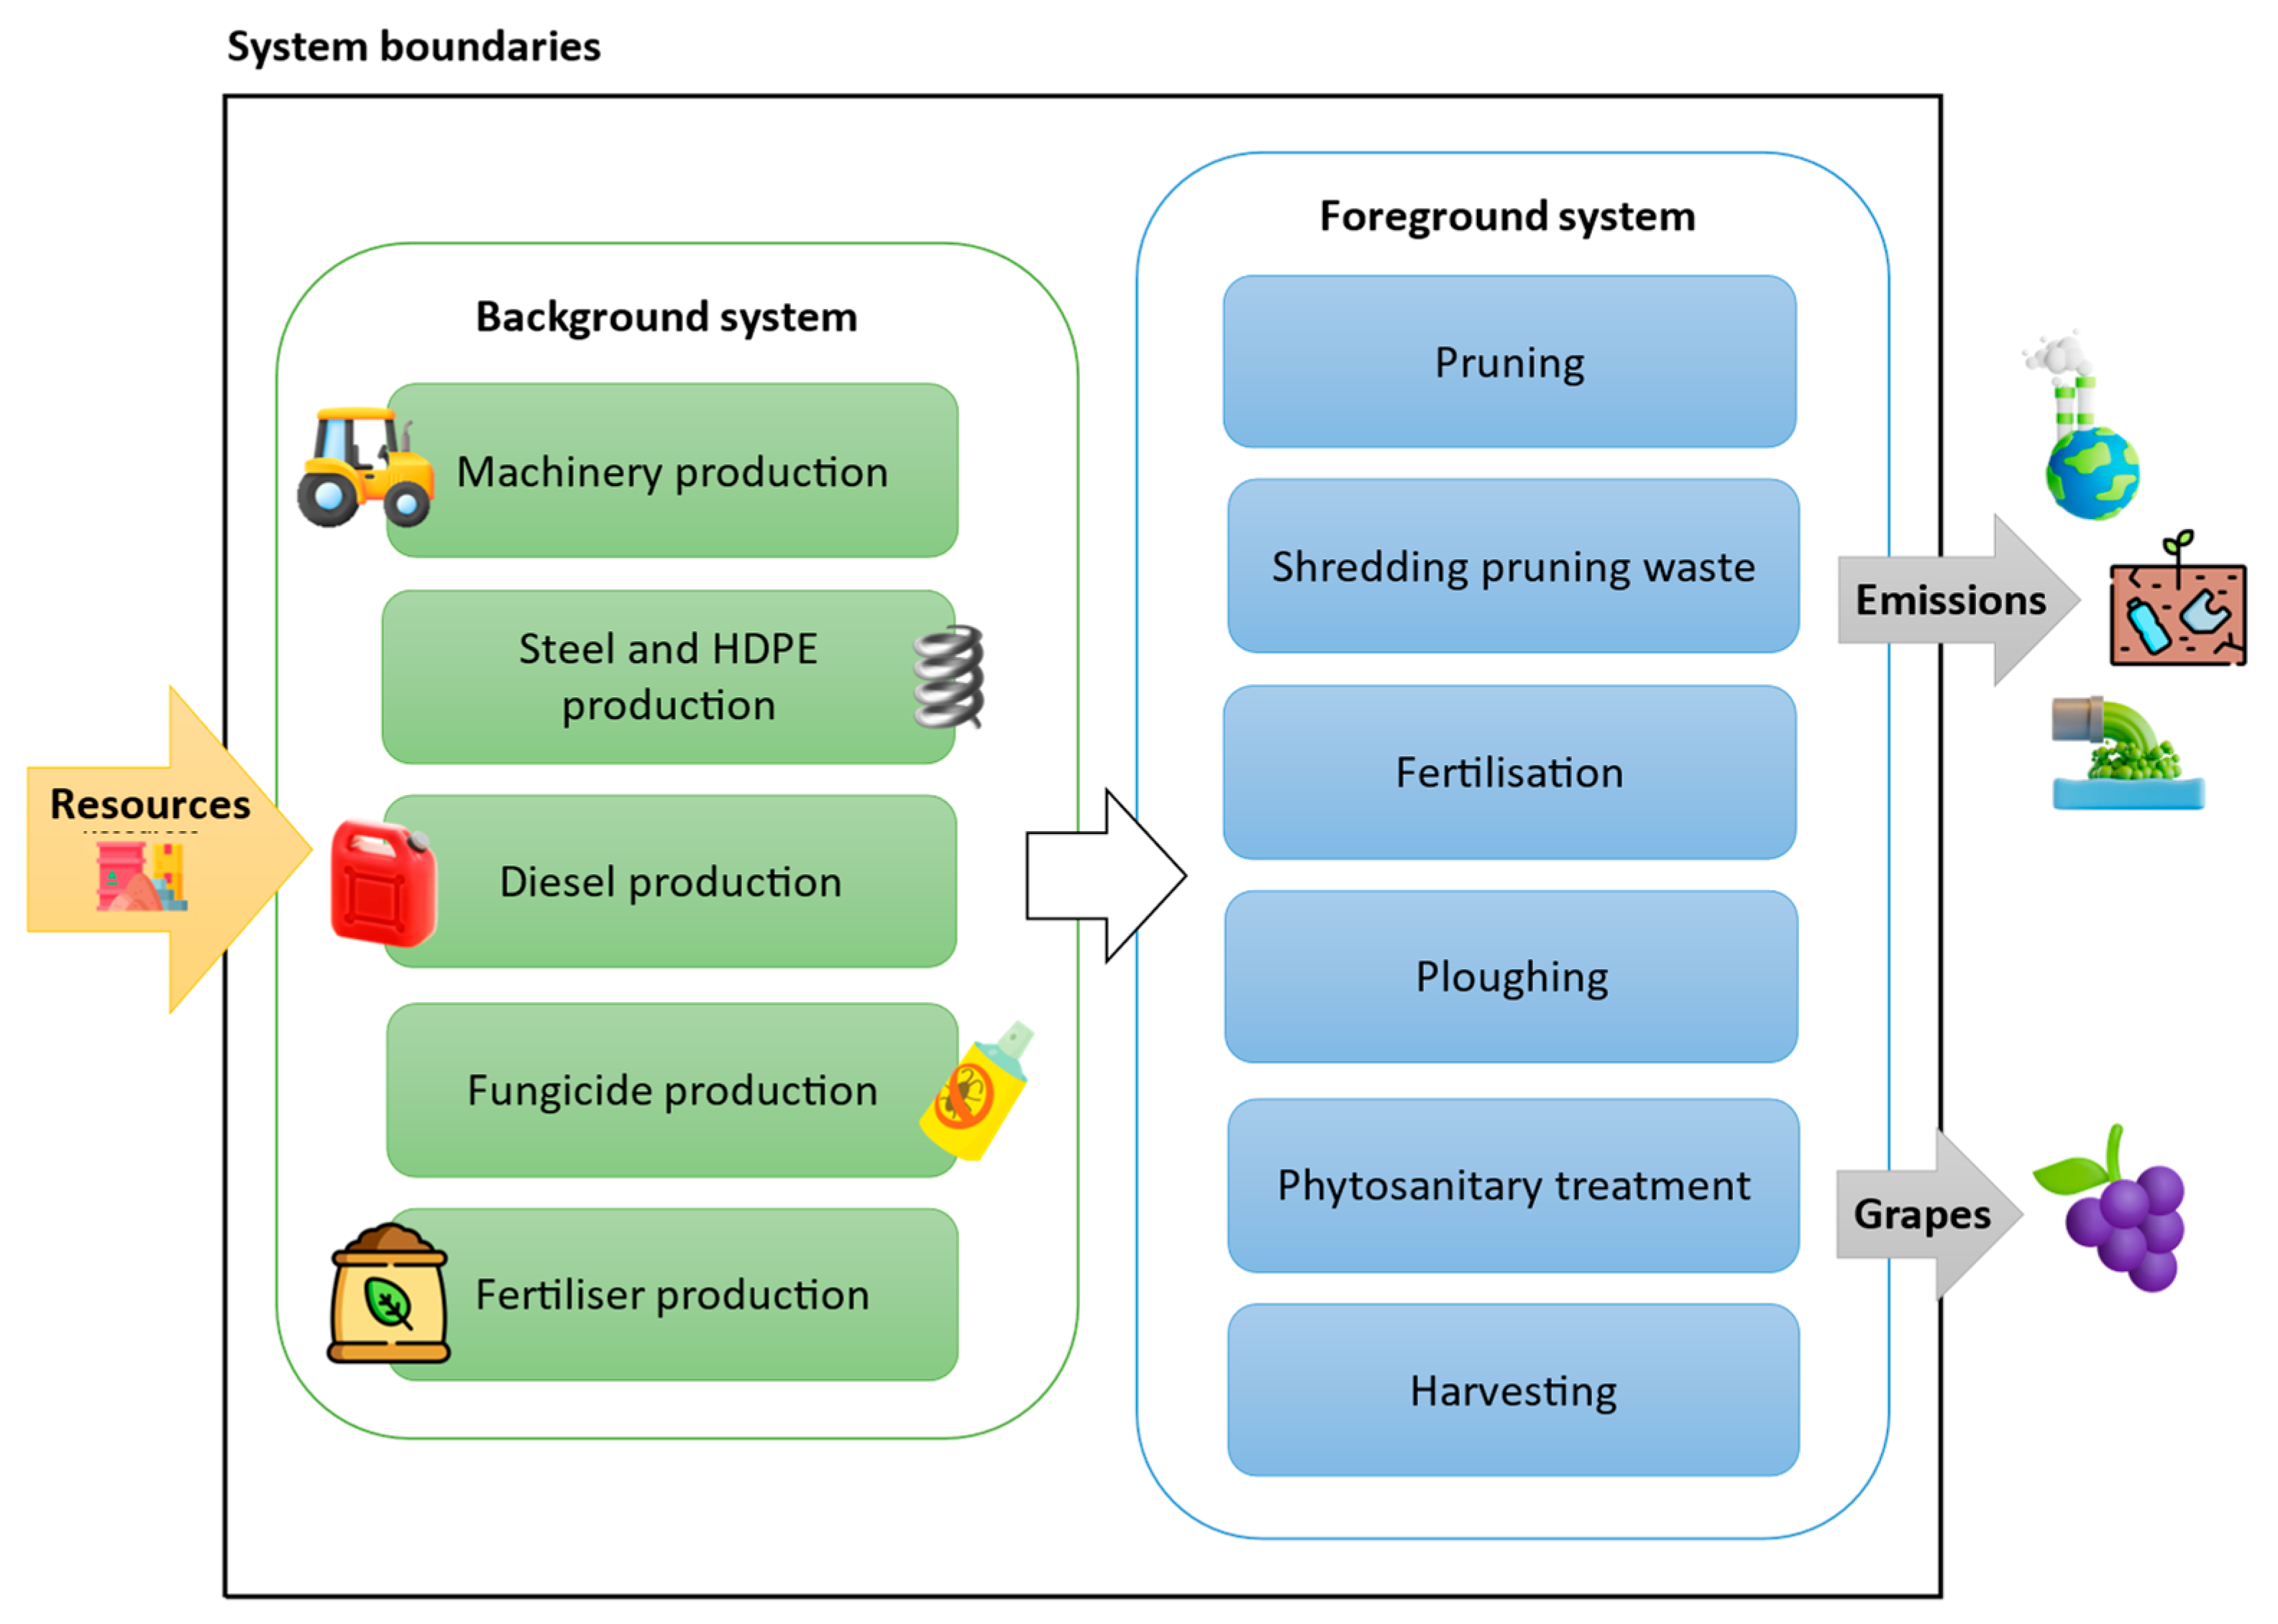
2.2.1. Goal and Scope Definition

The aim of the environmental analysis is to evaluate the impacts linked to this organic red grape cultivation system in one of the most renowned wine-producing regions globally, with the goal of promoting the adoption of more sustainable practices within the Spanish wine industry. To accomplish this, two functional units (FUs) were selected:
(i)
FU1: One hectare of land, to evaluate farming practices without considering the yield of the farm and then see which ones can be acted upon to achieve a better environmental profile [30].
(ii)
FU2: One kilogram of produced grapes, to quantify the impacts per unit of product harvested. Thus, the winery stage could opt for a raw material with a lower environmental impact [31], as well as being the most useful when comparing the benefits of this organic farming system with others published in the literature.
Figure 2 summarises the cradle-to-gate system boundaries, ranging from the extraction of resources (e.g., minerals, fuel) to the manufacture of inputs (e.g., fertilisers and fungicides), field machinery (e.g., tractor, tillage) and materials used for the infrastructure of the vineyard (e.g., high-density polyethylene (HDPE) for grape collection and steel for posts and wires). In this regard, the installation of 500 steel posts and the use of approximately 13,200 m of steel wire per ha have been applied to support the vines and ensure proper growth of the bunches, as well as the use of plastic boxes for the collection and transport of grapes. The useful life of these materials has been considered in their assignment to the operation time considered (1 year), with a lifespan of 36 years for steel and 10 years for plastic boxes [32,33].
In addition, the use of machinery, its maintenance and its end-of-life management were included within the system boundaries. No allocation was needed as only one product (i.e., grapes) is obtained from the system, because the pruning residues remain on the land as organic amendment.

2.2.2. Life Cycle Inventory

The quality and representativeness of environmental analysis using the LCA methodology depend directly on the quality of the data used in its development. In this study, wherever possible, primary data provided directly by the farmer through questionnaires on farming practices, including the use of machinery and agrochemicals, have been used. To model the background processes, i.e., those that are not under the direct control of the farmer (such as agrochemical production, diesel production and the emissions associated with its combustion), secondary data obtained from the Ecoinvent® database version 3.9.1 were used [34]. A summary of the data used and their sources is presented in Tables S1 and S2 in the Supplementary Materials (SMs).
In addition, several empirical models were used to estimate the field emissions from agrochemical application. The Intergovernmental Panel on Climate Change (IPCC) Guidelines for National Greenhouse Gas Inventories were used to quantify the direct and indirect N2O emissions, as well as those resulting from volatilisation/deposition and leaching [35]. The emissions of nitrogen dioxide (NO2) and ammonia (NH3), mainly caused using the organic fertiliser, were estimated according to the European Environment Agency (EEA) and the European Monitoring and Evaluation Programme (EMEP) [36]. The nitrate (NO3) emissions discharged into water were calculated according to the model of Faist Emmenegger et al. [37], assuming inceptisol to be the dominant soil order, an annual rainfall of 450 mm/year and an average vineyard root depth of 1 m [38,39]. For the emissions of phosphates released into water, both by leaching and run-off, the SALCA-P method was followed [40]. Finally, the emissions from phytosanitary products were also estimated according to the European Commission’s Product Environmental Footprint Category Rules [41], estimating their emissions into the air, water and soil (9%, 1% and 90%, respectively).
Regarding the field emissions due to land use change, the indirect (iLUC) and direct land (dLUC) use change emissions were considered. iLUC are defined as those emissions due to the transformation of land use in a different area because of the occupation of the land for the cultivation of the assessed crop, as calculated following the method of Schmidt et al. [42] and taking into account the productivity capacity factor provided by Haberl et al. [43]. dLUC are emissions resulting from the management practices applied to the land under study, i.e., the management of pruning waste in the vineyard, which is crushed and left on the land [42]. Table 1 displays a summary of the main inventory data collected from the farmers as well as the corresponding on-field emissions.
Moreover, to ensure the quality and reliability of the data provided, an uncertainty analysis following the Monte Carlo method [44] was performed on the system using SimaPro® software. The results of this analysis are presented in Table S3 in the Supplementary Materials.

2.2.3. Life Cycle Impact Assessment

The estimation of the environmental profile of the vineyard activities requires transformation of the inventory data (inputs and outputs) into environmental impacts. In this regard, some impact categories with high importance within the agricultural sector [45,46] have been considered in the analysis: global warming (GW), stratospheric ozone depletion (SOD), terrestrial acidification (TA), freshwater eutrophication (FE), marine eutrophication (ME), human non-carcinogenic toxicity (HNCT), land use (LU) and water scarcity (WS). To achieve this, the characterisation factors from the ReCiPe 2016 v1.06 Hierarchist Midpoint World (2010) method [47] were applied, except for water scarcity, which was assessed using the Available WAter REmaining (AWARE) method v1.2c [48], to consider both the water consumption and the availability at a regional scale (specifically for Spain), as the ReCiPe indicator only considers the former. From an endpoint perspective, the global potential species loss indicator (PDF) has been considered in the analysis to measure the impact of land use, both land occupation and land transformation stressors, on biodiversity. Finally, as increasing attention is being paid to the ecosystem services provided by insect pollinators [49], the valuation of the pollination service to crops has also been considered because pollinators affect the food supply on a global scale, with crops dependent on them contributing approximately 35% of the total crop production by volume [50]. A description of the procedure for estimating both biodiversity-related factors is detailed below. The product system was modelled using SimaPro® software version 9.4 [51].

Global Potential Species Loss

To gain a broader understanding of the environmental performance of this wine system, the overall potential loss of species, calculated as the potentially disappearing fraction (PDF), was assessed. This model, developed by Chaudhary et al. [52] and further complemented by Chaudhary and Brooks [53], provides a framework for quantifying and projecting the biodiversity loss due to land use at a global scale, based on data collected from five different taxonomic groups: mammals, birds, amphibians, reptiles and plants. Biodiversity loss is applied in 804 different terrestrial ecoregions, with the case study being located in the ecoregion PA0406 (Cantabrian mixed forests) [54], and 175 countries. The local characterisation factors reported by Chaudhary et al. [52] for six different land use types (annual crops, permanent crops, pasture, urban, extensive forestry and intensive forestry) were used to calculate the probability of extinction for each species. Therefore, the model was used to analyse the damage generated at the ecosystem level, so it can be included as an endpoint category [55]. For all the necessary calculations, the software Microsoft Excel® 365 MSO was used, based on land use/land transformation data obtained from SimaPro® software version 9.4 [51].

Pollination

The pollination analysis was carried out using the free Integrated Valuation of Ecosystem Services and Trade-offs (InVEST) crop pollination model [56]. Also, to perform the spatial and temporal variations, the QGIS software version 3.34.12 was used [57]. The InVEST crop pollination model focuses on wild bees as a key pollinator and on two main aspects: pollinator supply and pollinator visits to crops [56]. For the pollinator supply, the model focuses on estimating their relative abundance per pixel based on the availability of nesting sites, the abundance of floral resources for feeding and the average distances pollinators can travel to flowers from their nests. For the crop visits, they are based on the supply of pollinators from nearby areas, the quality of flowers in the soil type and the behaviour of the bees. Among the benefits of this ecosystem service are that it increases the yield, quality and stability of fruit and seeds crops as diverse as almond and coffee. Indeed, Klein et al. [58] found that 87 of 115 globally important crops benefit from animal pollination, a service that was valuated in terms of billions per year worldwide. Other animals, such as butterflies or birds, can act as pollinators too, but bees are the most important group.
The model translates the land cover into an index of suitability (0–1) for bees to create a pollinator source map, with higher scores indicating greater relative bee abundance. To simulate this, the model requires the following data: a land use land cover (LULC) map, a biophysical table paired with the LULC map that has the nesting suitability and floral resources for each season and a guild table with the properties of the active seasons, nesting preferences, mean flight distance and relative abundance. The LULC map was downloaded from CORINE Land Cover for 2018 using the Copernicus Land Monitoring Service [59]. The bee species abundance in Spain were taken from the paper of Bartomeus et al. [60] about the Iberian bees database and the other parameters for the guild and pollinator table were taken from the varied literature [61,62,63].

3. Results

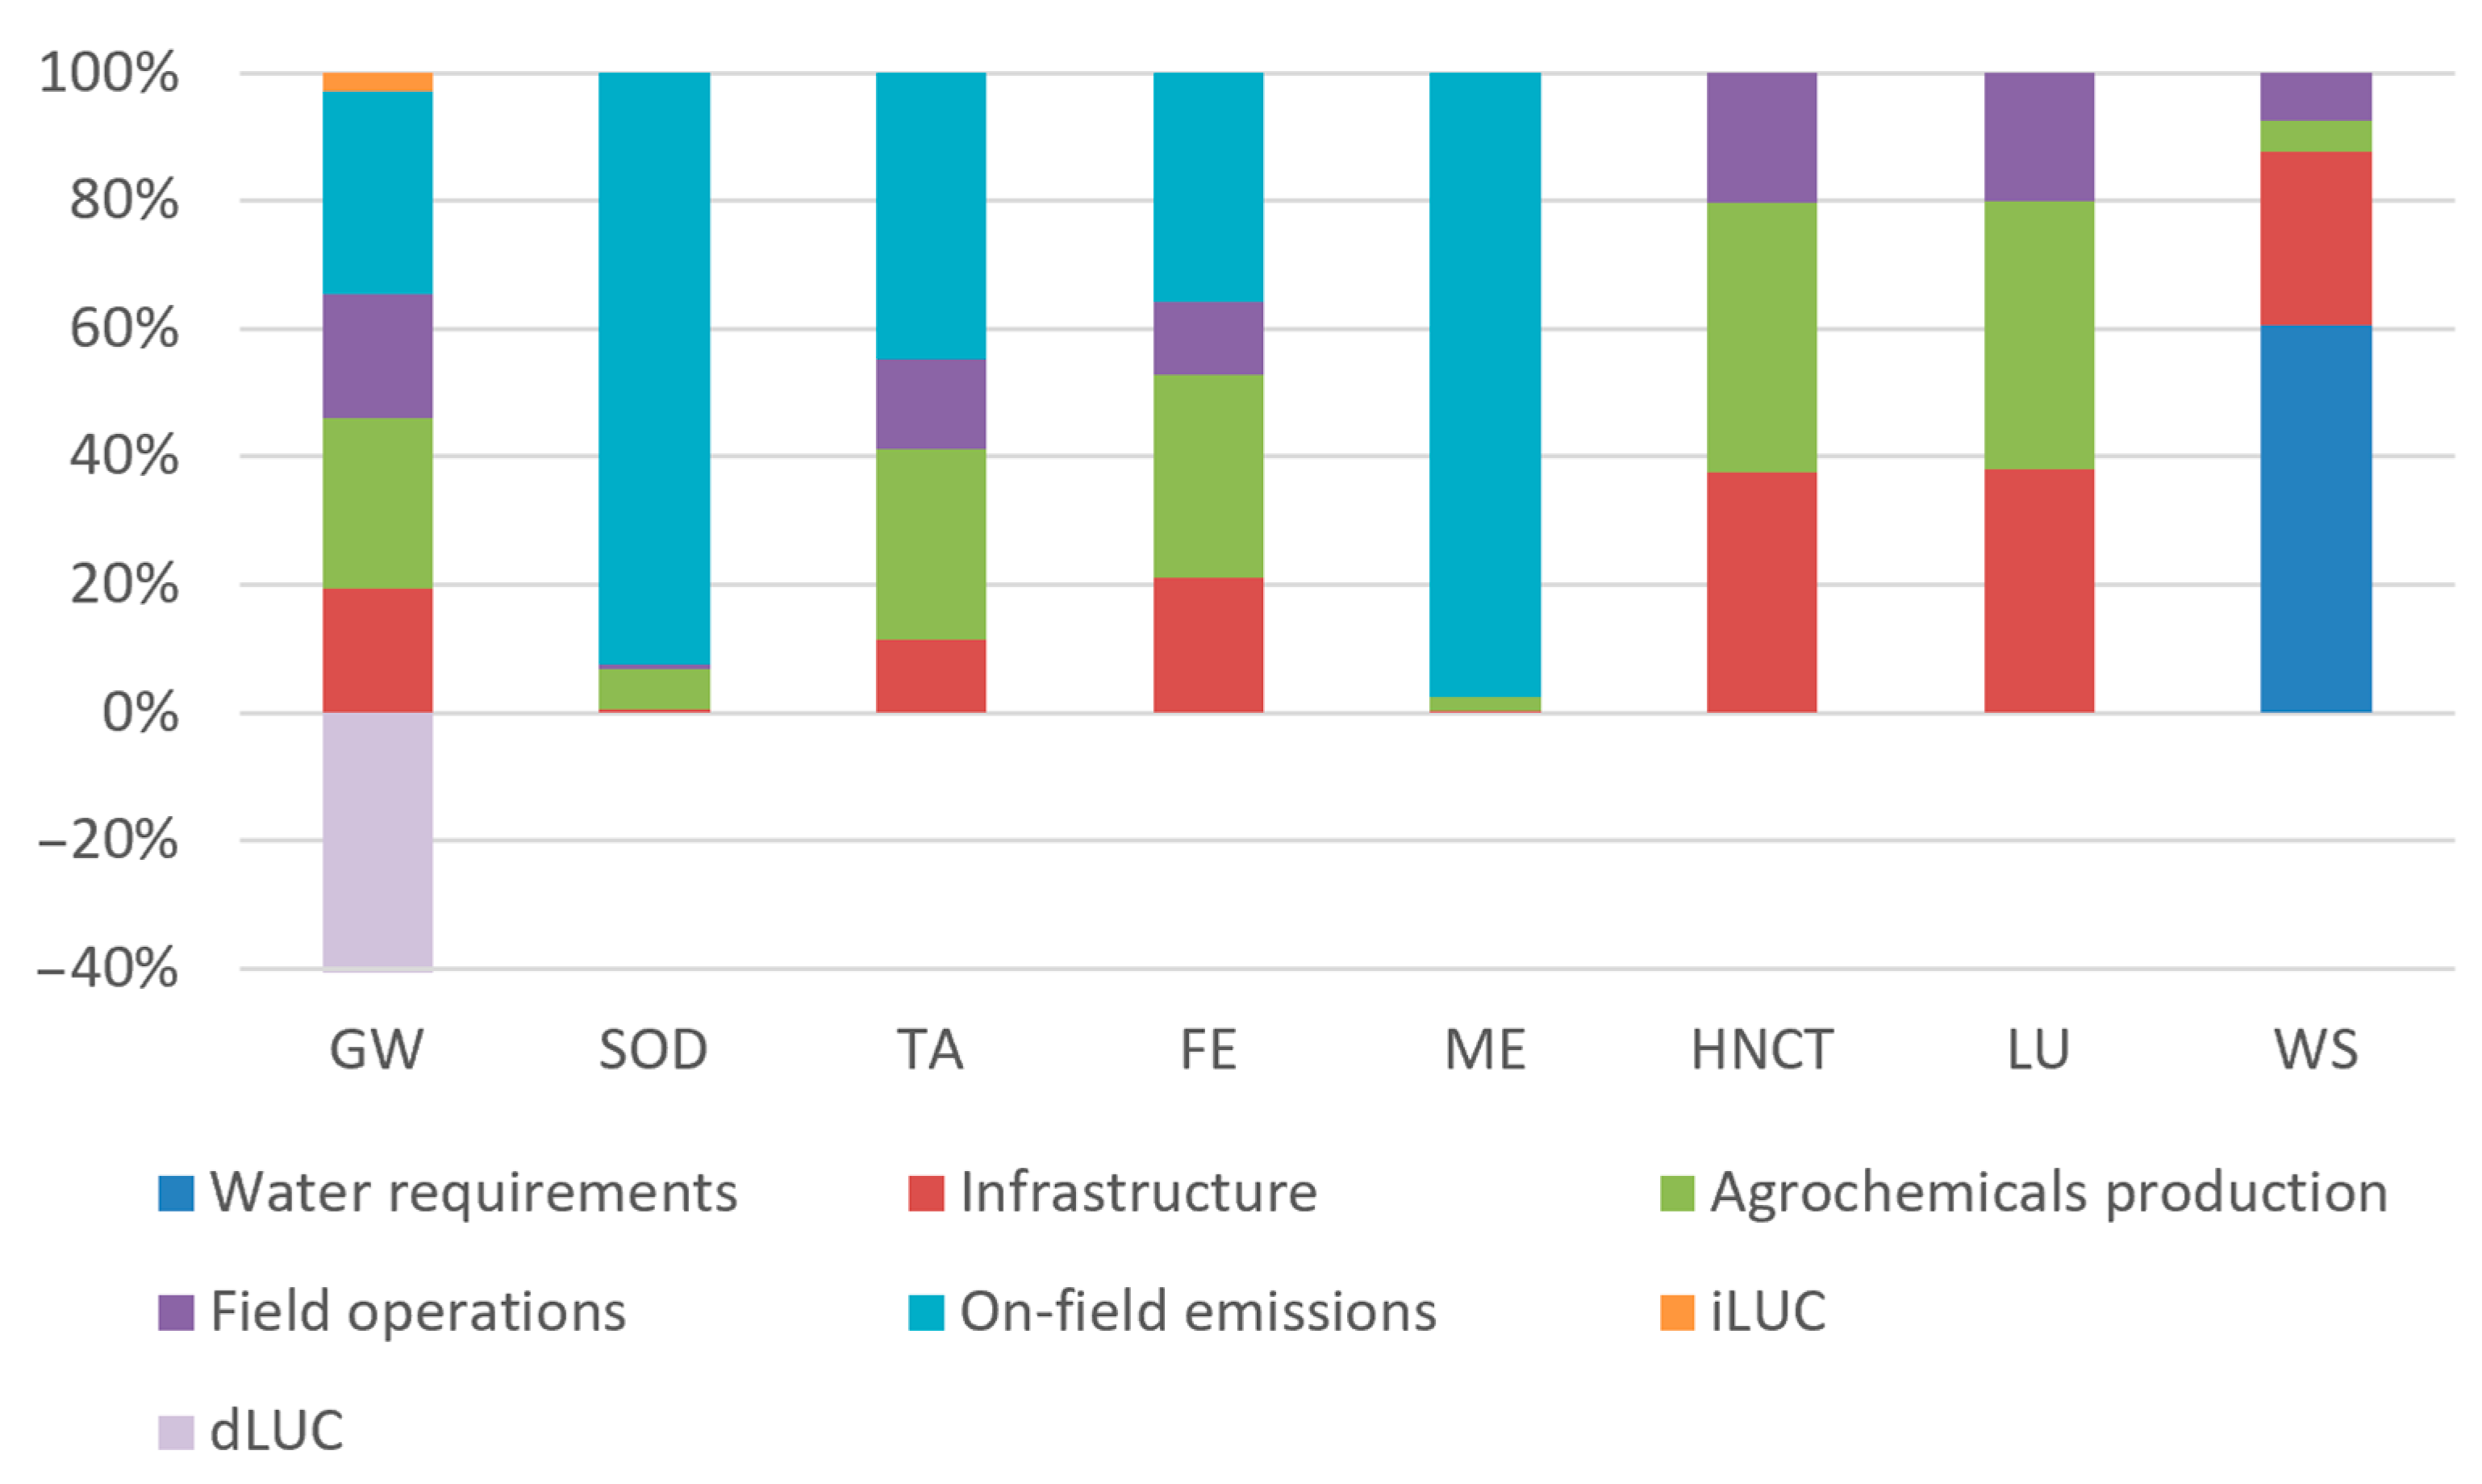
3.1. Environmental Impact Profile

The environmental profile results provide a comprehensive overview of the impacts associated with the grape growing system under study. These results are essential for understanding the contribution of different processes to the overall environmental burden and serve as a basis for future research in the field. Table 2 presents the total impacts for each analysed category and functional unit, serving as a basis for a detailed discussion and contextual comparison with the findings from previous research.
To identify the main contributors and potential areas for improvement, Figure 3 illustrates the distribution of the impacts across the analysed categories, providing insight into the contribution of each activity carried out. The activity that is responsible for the greatest number of impacts at a general level is field emissions, a category grouping together emissions into the air, soil and water derived from the use of agrochemicals. The next stage with the greatest contribution to the environmental profile is the production of chemicals used for pest control or fertilisation, followed by the impacts derived from the infrastructure related to the vineyard itself, such as steel wire or water pipes. Finally, the one that generates the least number of total impacts is field operations, i.e., those derived from the consumption of machinery for each of the operations carried out in the field and the combustion of the fuel consumed.
Monte Carlo analysis was performed with a 95% confidence interval and 2000 iterations to assess the variability of the obtained parameters. The analysis reveals that the mean values given are quite similar to the obtained results, with standard deviations close to zero in almost all the categories (Table S3 in Supplementary Materials). This indicates that the input data have very little associated uncertainty, except for GW and LU, which suggests that these are the most sensitive impact categories in the model, with a relative standard deviation of 39% and 22%, respectively. The variability observed in these categories highlights their dependence on uncertain input parameters, making them more sensitive to fluctuations.
GW is one of the impact categories in which the environmental burdens are more evenly distributed, with the stages that have the greatest weight being the production of agrochemicals and the field emissions derived from their use, with 27% and 32%, respectively. It is worth noting that in this category, the total impact is considerably reduced due to the high weight of the dLUC, which offsets 1246 kg CO2 eq per hectare because of the carbon fixed in the soil by the pruning remains that are crushed and left on the ground, that is, they account for 92% of the total emissions in this category. Moreover, these good practices have a long-term effect, helping to mitigate soil degradation, increase fertility, and enhance microbial activity, all of which positively impact the vineyard’s productivity and health [64]. It is important to note that emissions in this category come mainly from CO2, CH4, N2O and SF6 generated in the production of pesticides and steel, the combustion of diesel fuel in the tractor and the application of nitrogen fertilisers in the field.
The categories with the highest weight of on-field emissions are SOD and ME, with more than 90% of the total impacts, followed by TA, with almost half of the category contribution (45%). This is due to emissions from N2O and CH4 released into the atmosphere in the case of SOD and to NH4 and NO3 in ME, both due to the transformation of nitrogen from fertilisers in its different forms. This is in line with the findings of Müller [65], who stated that the application of nitrogen fertilisers in agriculture has increased N2O emissions, posing a significant risk to the stratospheric ozone layer. On the other hand, ammonia derived from the application of nitrogen fertiliser and SO2 derived from the industrial production of pesticides are the main emissions that contribute to TA. Moving on to FE, the emissions are more equally distributed, with the largest contributor being field emissions, with 36% of the total, followed by the manufacture of chemicals used for soil fertilisation and pest control, with 32% and 16%, respectively. In the FE category, the emissions are caused by BOD5 and COD, from steel and pesticide production, and especially phosphates, which come from the transformation of the phosphorus contained in the fertiliser used in the field. In terms of LU, the impacts primarily stem from the occupation and transformation of forests, associated mainly with the production of steel for infrastructure and the production of necessary pesticides. Both are the main contributors to this category. For HNCT, the profile is quite similar to that obtained for LU, with infrastructure and pesticide production responsible for around 40% of the impacts. Finally, in the WS category, the main hotspot (with 60%) is the water needed for fertiliser and pesticide dispersion, followed by the water requirements associated with infrastructure production. Overall, despite the emissions resulting from diesel combustion and the use of machinery for land and grape care, field operations have the least impact on the environmental profile of the crop.
Therefore, in order to achieve an even better environmental profile, future research should focus on reducing the use of agrochemicals. Although it is an organic system, agrochemicals still play a significant role, as their production and the emissions from their use are responsible for the majority of impacts in almost all the selected categories. Additionally, in La Rioja, this agricultural phase accounts for almost 50% of the wine production impacts on GW, or nearly the entirety of the impacts on eutrophication [66]. As a result, these actions would also have a significant impact on the subsequent stage of the supply chain, making it crucial to reach out to farmers and governments to promote this transition towards a more sustainable sector.

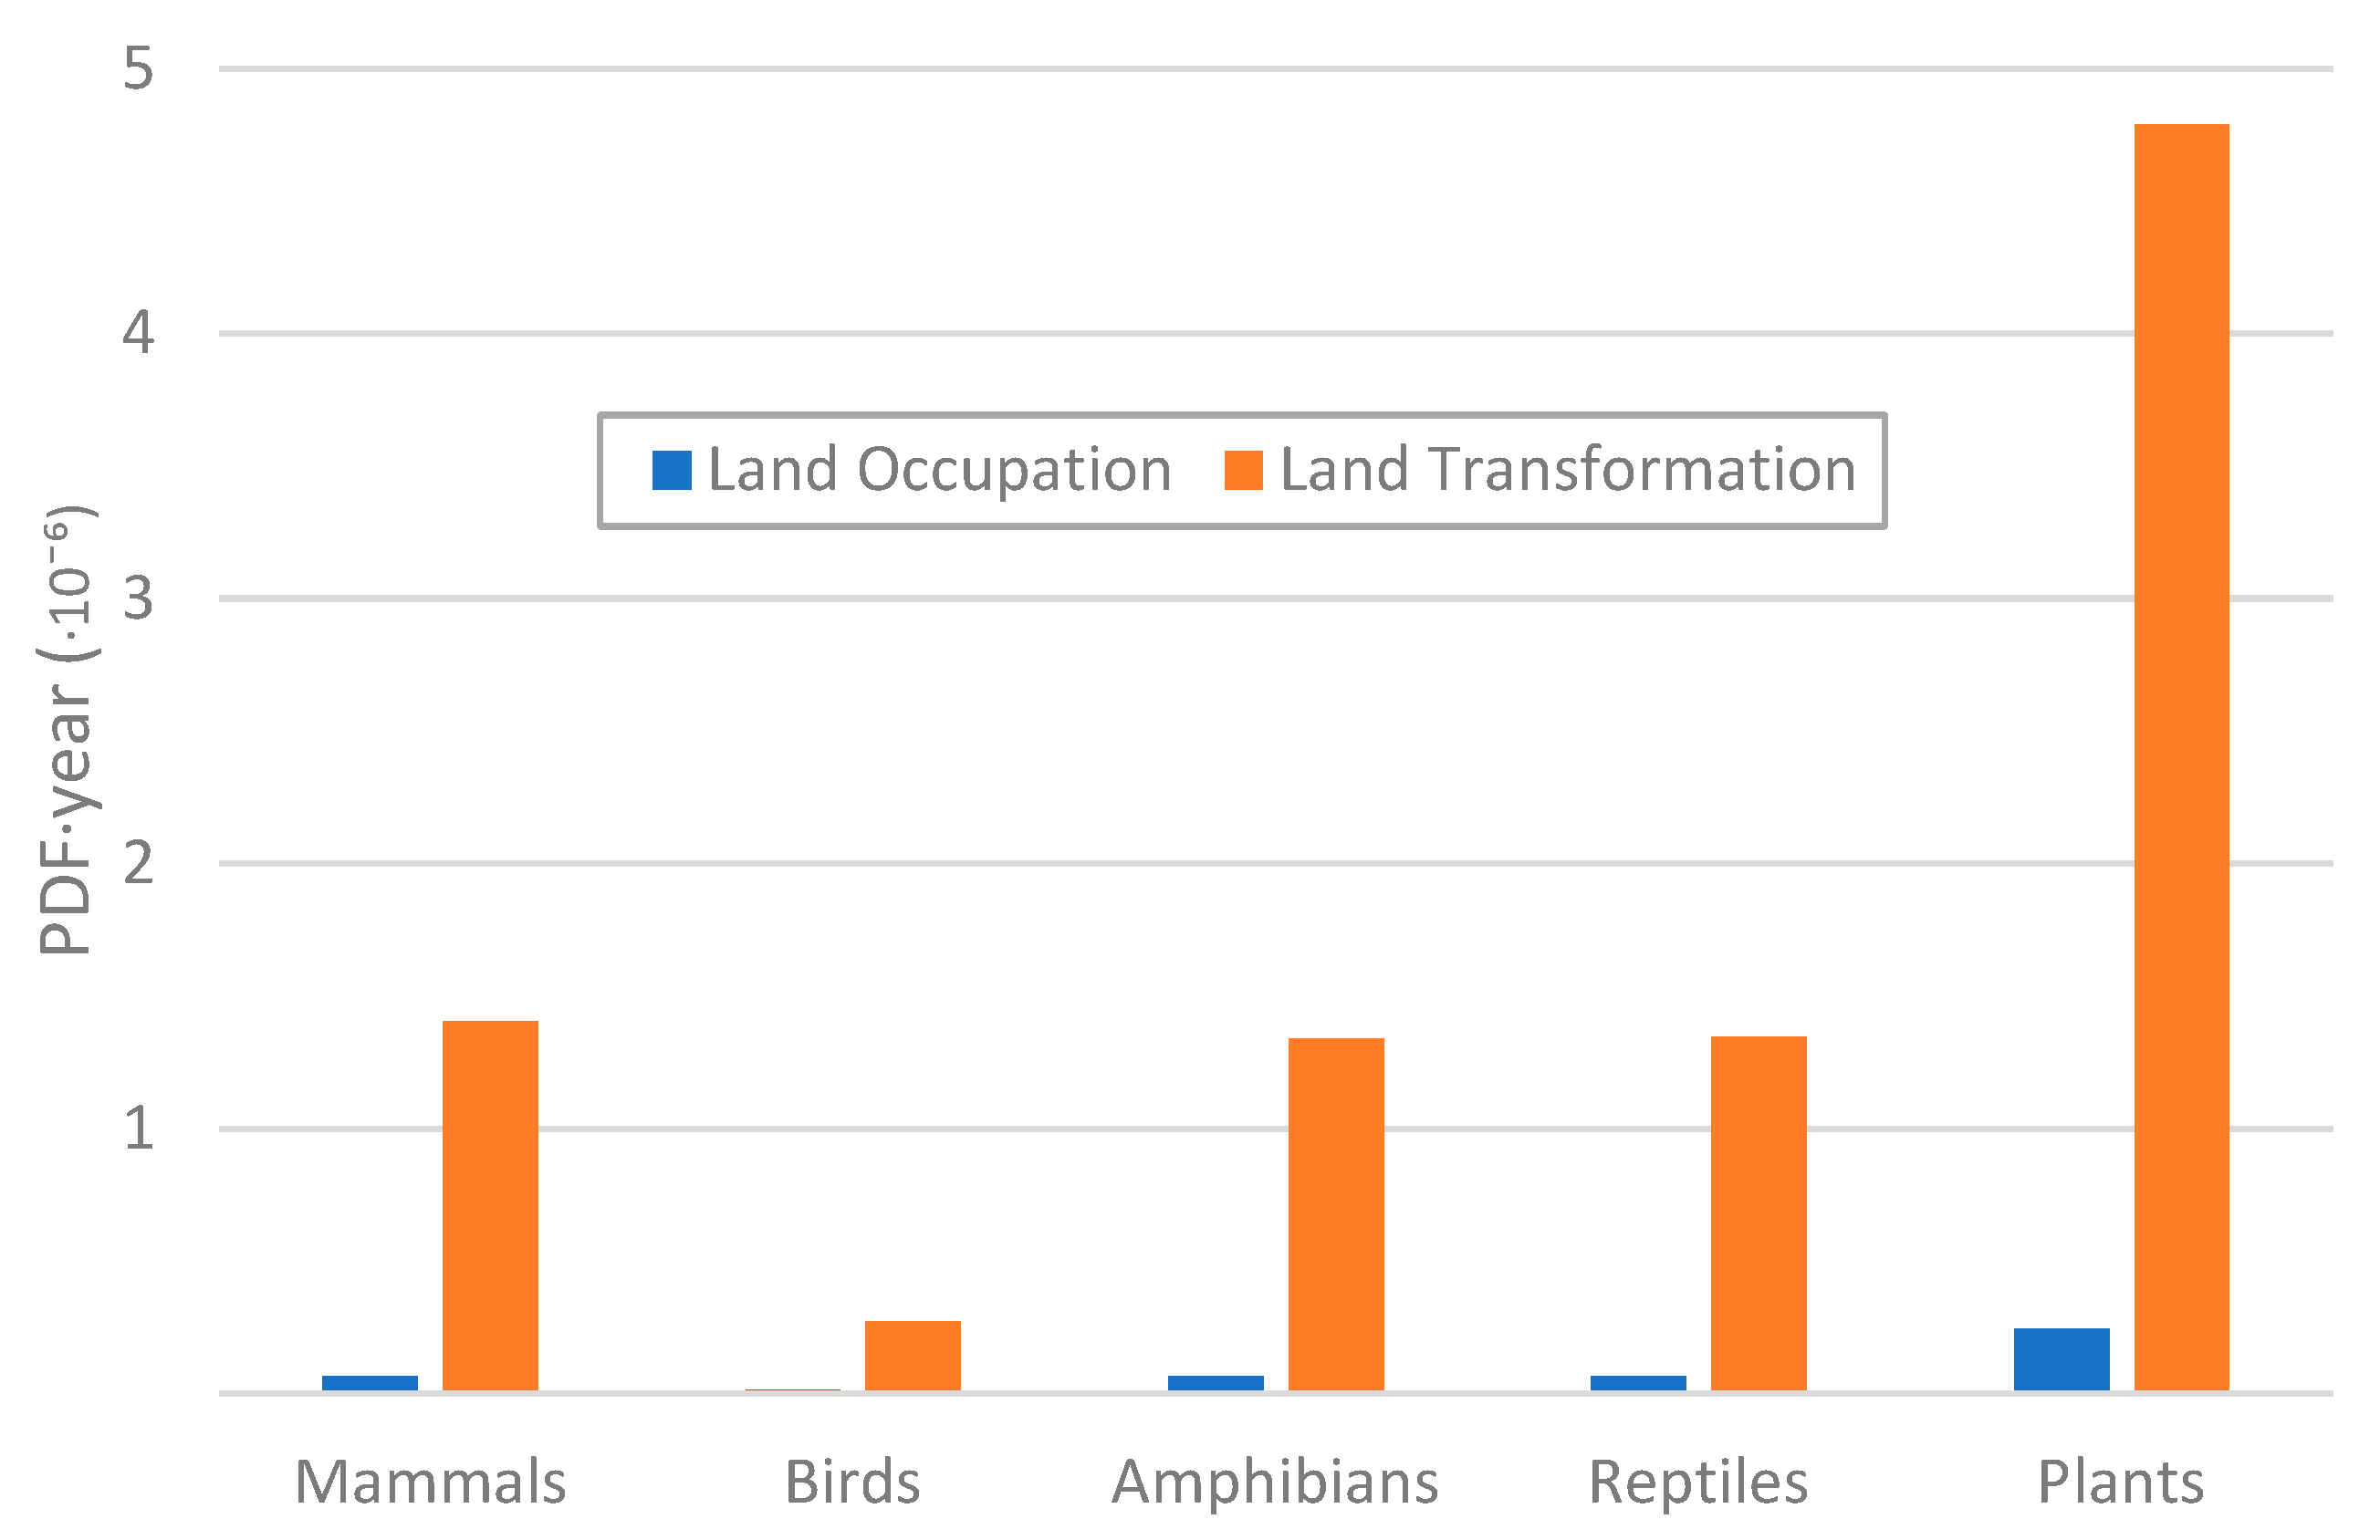
3.1.1. Global Potential Species Loss

The impacts due to land occupation for this type of crop are distributed over a single year, as this is the duration of the cultivation, while the impacts due to land type transformation, i.e., from natural (as pasture) to agricultural use, are spread over the first 20 years of land occupation, as suggested by some authors [67]. The combined result obtained for the mean value of the five taxonomic groups considered is 1.93 × 10⁻⁸ PDF·year. It is also important to note that most of the impacts of the system studied are due to the transformation of the soil for grape cultivation (95%), with the occupation of the soil for this purpose representing a lower percentage of the impacts (5%). This means that the transformation involves significant changes to the land’s characteristics, being much more responsible for the potential loss of species than the agricultural practices currently carried out on the land. Lago-Oliveira et al. [68], in their study on crop rotations with chickpea and wheat, obtained similar results, with a biodiversity loss of 1.25 × 10⁻⁸ PDF·year. This is probably due to the limited field operations carried out in both cases, as well as the fact that the land use transformation, the main driver of biodiversity loss, is also oriented towards a cropping system, so it is to be expected that the values may be similar. Examining each taxonomic group individually, Figure 4 shows that the impacts are not uniform. Plants are the most threatened taxon, followed by mammals, amphibians and reptiles, with birds being the least affected by this ecosystem service. This aligns with the findings of Chaudhary and Brooks [53], as the richness of plant species in this ecoregion is far superior to other taxa, making them the most impacted. For mammals, amphibians and reptile, the species richness and vulnerability scores are similar, resulting in minimal differences between these groups. In contrast, although the bird species richness in the region is slightly higher than that of the other three groups, their vulnerability score is significantly lower because their mobility is easier, which explains why they are the least affected.

3.1.2. Pollination

As a result of the study of this ES in the region, a detailed map illustrating the total abundance of pollinators per hectare during the summer and spring seasons was generated (Figure 5). These seasons were specifically selected because they represent the periods of peak pollinator activity and where field operations are carried out.
For the specific case of La Rioja vineyard, this study reveals a pollinator abundance ratio of 0.1241 for spring and 0.0225 for summer. These values highlight the varying levels of pollinator presence across different seasons. In comparison, the maximum recorded pollinator abundance ratios in the region are 0.1703 during spring and 0.1523 during summer. The previous ratios indicate that the abundance of pollinators in the vineyard during spring is notably high, reaching 73% of the maximum value observed across all the land use types in the region. However, in summer, this ratio drops significantly, representing only 15% of the maximum value. Among the benefits of this ES for the grapes are the increase in the yield and quality of the product and that it can help to reduce the amount of pesticides used, especially in spring when there is a greater abundance of pollinators in the parcel [69]. The ability to apply these ecosystem services in vineyard management is crucial. The high pollinator abundance in spring underscores the importance of supporting biodiversity, particularly in critical seasons. These findings not only provide valuable insights into the seasonal dynamics of pollinator populations but also serve as a benchmark for assessing the effectiveness of conservation and management practices aimed at enhancing pollinator habitats in vineyard environments.

4. Discussion

Having described the environmental profile obtained for the analysed system, a comparison with the findings from the literature related to the sector will now be conducted. Casson et al. [70] supported some of the findings presented in this manuscript, as their research on different conventional and more innovative vineyard management strategies in Northern Italy, focusing on changes in fertilising rates and technologies used, also identified agrochemicals as the primary environmental hotspots in all cases.
The results of other studies published in Spain will now be considered, as crop management is heavily influenced by factors such as the specific climatic conditions of each region and the characteristics of the soil, with the aim of ensuring that the vineyards are relatively close to the one studied. Gazulla et al. [66] analysed the impacts generated throughout all the stages of Crianza wine production in La Rioja, highlighting that there is no irrigation in the agricultural phase except in a non-organic scenario. Values of 503 g CO2 eq for GW and 2.1 g SO2 eq for TA were identified for the viticulture phase per 0.75 L bottle of wine, for which 1.27 kg of grapes are required. Therefore, the results for GW are nearly 25 times higher, which can be attributed to the large amount of fertiliser used, five times greater than that in this study, which, in addition to the impacts associated with its production, leads to very high on-field emissions. Furthermore, for TA, the results are also different and around 25% higher than those reported in the present study, since some items, such as pesticide production, were not considered within the system boundaries in the reference study [66], leading to unaccounted SO2 emissions (among others) whose weight is significant in this impact category.
The study conducted by García Castellanos et al. [24] considered different cultivation scenarios in the region of Murcia (south-east of Spain). If only scenarios in which there is no irrigation are considered, to rule out the impacts derived from this stage, values of 1.27 g SO2 eq and 249 g CO2 eq were identified for the conventional cultivation scenario and 1.94 g SO2 eq and 162 g CO2 eq for the organic scenario. The values in terms of TA are comparable to those reported in this present study (1.36 g SO2 eq). On the contrary, there is a large difference in GW, being for this case study (15.31 g CO2 eq) in the order of 10 and 16 times lower in impact compared to the organic and conventional scenarios, respectively. This significant difference is mainly attributed to the demand for diesel in agricultural activities, which is set at 116.45 L, almost three times higher than in this case study, whose combustion contributes significantly to this category. Meneses et al. [71] evaluated the impact per bottle of 0.75 L over the life cycle of red wine production in Catalonia (north-east Spain) in a scenario typically without irrigation, although it may be necessary during extremely dry years (less than 5529 m3/ha) to compensate. In terms of GW, the impact of the agricultural phase is 242 g CO2 eq per 0.75 L of wine, while for TA it is 1.47 g SO2 eq, with 1.07 kg of grapes being necessary to produce this amount of wine. Again, the results obtained in this manuscript are notably better in terms of GW, being nearly 15 times lower, which can be attributed to the fact that pruning residues are not left in the field to offset part of the climate change emissions, as the amounts of fertilisers and diesel applied are similar. Meanwhile, for TA, the results are practically the same, which should be the case since the ammonia emissions are considered negligible, while they are the main cause of these impacts in this study. Laca et al. [30] studied the production of this drink in Asturias (north Spain), under the PDO Cangas and in a system without irrigation, obtaining an impact of the agricultural phase of 1.42 kg CO2 eq per kg of grapes, which is quite high compared to the rest of the studies reviewed. This could be attributed to the fact that pruning waste is incinerated, resulting in a significant amount of emissions contributing to this category, specifically around 60% of the total. Sinisterra-Solís et al. [12] also analysed a series of scenarios in the PDO Utiel-Requena (east Spain), two of them without irrigation and with Tempranillo grapes. In terms of GW, the conventional and organic scenarios reached emissions of 0.11 kg CO2 eq and 96 g of CO2 per kg of grapes, respectively. Focusing only on organic, which is the most similar, values such as 1 mg CFC11 eq for SOD, 4.1 g SO2 eq for TA, 0.82 g P eq for FE and 0.01 g N eq for ME were reported. Consequently, the impacts in categories such as GW, TA and FE are significantly higher, primarily due to the use of machinery and the emissions derived from the production and application of agrochemicals, with approximately 4000 kg of manure applied per hectare. In contrast, in the case of SOD, the reported N₂O emissions are lower than those calculated in this manuscript, and since this substance is the main contributor to this category, the resulting impact in terms of SOD is therefore lower. A similar pattern is observed for ME, where the reported impacts are lower because the NO3 emissions from fertilisers are not taken into account, despite being the main contributor to this category in the present study.
Volanti et al. [72] studied five different vineyards with organic practices in Italy, reporting the results per hectare. Paying attention to the only scenario without irrigation to make the profile as similar as possible to that of this study, they reported 438.3 kg CO2 eq and 2.5 kg SO2 eq per ha. The impacts on GW are clearly worse than those reported in this study, being more than four times higher, almost entirely attributed to the use of machinery and the diesel it requires, in addition to the fact that pruning residues are not used as organic amendments to offset part of these emissions. For TA, the data reported by Volanti et al. [72] are slightly lower, as the use of fertilisers is not reported, meaning that the on-field emissions derived from their use have not been accounted for, and in this study, these emissions were the main contributor to this category.
Upon reviewing the studies on water scarcity in vineyards using the AWARE methodology, two key studies stand out: one by Borsato et al. [73], which analysed the impacts of the production of an Italian wine, and the another by Villanueva-Rey et al. [25], which examined the water footprint of the Ribeiro grape in Spain (northwest Spain). Villanueva-Rey et al. [25] reported an impact of 212 L eq per kg of harvested grapes in a non-irrigated scenario, with the majority allocated to the dispersion of the necessary pesticides (40%). The amount of pesticides used is quite similar, while the water required for their dispersion is significantly higher. This can be attributed to the wide variety of different products used, each of which may have very specific water requirements, highlighting the relatively low water usage and, thus, the practices implemented in this case study. Particularly high is the impact reported by Borsato et al. [73], who obtained a water scarcity of 1.32 m3 per bottle of wine, of which approximately 1.2 m3 corresponds to the agricultural phase, i.e., nearly 25 times higher than in this study. This is mainly due to the high water consumption for irrigation of the vineyards, which represents 85% of the total impacts [73]. Discounting this aspect, with water only needed for the dispersion of agrochemicals, the water demand would be approximately 60–70 L per kg of grapes, while the water used for the dispersion of agrochemicals in this study is about 30 L per kg of grapes. Considering that the reported amount of agrochemicals is almost double [73], it can be estimated that the results obtained are in line with these findings.
In general, the environmental profile obtained is better than the vast majority of results reported in the literature reviewed in Spain, highlighting the positive environmental outcomes of the practices applied. This suggests that the organic grape growing system in La Rioja exhibits a relatively low environmental impact when compared to other organic and conventional methods reported in the literature. Therefore, the practices implemented contribute to the promotion of sustainable viticulture in the region, supporting the notion that organic farming can play a crucial role in reducing the environmental footprint of this sector in Spain. To achieve this, it is essential to establish restrictive policies that encourage the transition towards cleaner and more sustainable agriculture, while also raising awareness among farmers about its benefits and the environmental impacts associated with different production systems. Without political support, farmers may be reluctant to change practices that are already economically beneficial to them.

5. Study Limitations

The global potential species loss indicator has a number of limitations when it comes to quantifying the potential loss of biodiversity, which is important to clarify. The indicator focuses solely on the effects on mammals, amphibians, birds, reptiles, and plants, excluding the effects on other taxonomic groups of equal importance, such as insects or fungi. Furthermore, while characterisation factors are quantified for different land use intensities, they do not comprehensively cover specific management regimes, such as organic farming, which means the results may be somewhat general. Nevertheless, it serves as an interesting starting point for including impacts on native biodiversity in environmental studies, although further work is needed to develop more detailed indicators [74].
The model used to quantify the pollination ecosystem service also has limitations. It is not capable of estimating the relative patterns of pollinator abundance, as it relies solely on indices. This is because estimating factors such as the nest density or resource availability is difficult, which complicates the estimation of economic values based on them. The model is also not valid for evaluating whether bee populations are sustainable in the current landscape, as it only provides a representation of the current state of the input data. Furthermore, the model focuses exclusively on bees as pollinators and does not account for others, such as wasps or bats [56]. Additionally, when creating the database with the necessary parameters for the model, such as the pollinator species, abundance or nesting and floral resource availability, region-specific data were not available and estimates were made using the literature on studies in other regions/countries. So, for more accurate results, field observations and sampling in the region would be required.
It should also be highlighted that, although the primary data collected are considered representative and applicable to all the years of vineyard operation, they correspond to a single campaign. Therefore, it would be valuable to have a longer-term sample in order to quantify the real variations in vineyard performance due to climatic or external factors.

6. Conclusions

This manuscript evaluates the environmental profile of an organic and non-irrigated grape production system in La Rioja with qualified designation of origin. The quantified impacts are lower in almost all the categories than in other studies consulted in the literature about grape or wine production in Spain, which highlights the effective environmental practices carried out. Particularly noteworthy is the low profile obtained in terms of GW, which is primarily attributed to the role of pruning residues, which are crushed and left on the ground, contributing to the dLUC and offsetting most of the emissions in this category. The main hotspots in the system are related to the production of agrochemicals and the on-field emissions resulting from their use, followed by the impacts associated with infrastructure. As expected, due to the limited field operations carried out, their contribution to the overall environmental profile is relatively low. In terms of water scarcity, the main factor responsible is the demand for water for the dispersion of agrochemicals, which is at least in line with the amount of water used for this purpose in other reviewed studies. It is also important to highlight that the taxonomic group least affected by grapevine cultivation in this region is birds, as despite being the most abundant taxon, they have greater mobility, whereas plants are the most affected group. Finally, from the pollination analysis, it can be observed that the pollinator activity is much higher in spring than in summer, reaching values close to the maximum observed for other types of soil in the region. This suggests the possibility of applying pest control strategies centred on the use of pollinators.
As points for improvement, despite the good environmental profile obtained, efforts should focus on reducing the use of fertilisers and pesticides in the field to minimise the impacts associated with their production and application. This could be achieved by optimising their use or exploring alternative solutions, such as the use of reclaimed water, which provides certain nutrients to the soil, reducing the need for chemical inputs. In addition, preventing soil erosion through nature-based solutions, such as plant cover, could help improve soil fertility and reduce the need for supplementary fertilisation.

Supplementary Materials

The following supporting information can be downloaded at https://www.mdpi.com/article/10.3390/agriculture15050536/s1. Table S1: Source of the data used for environmental analysis; Table S2: Ecoinvent process taken from each activity; Table S3: Results obtained from the Montecarlo method for both functional units (FU1: 1 kg of grapes; FU2: 1 ha of land). References [34,35,36,37,40,41,42,44] are cited in the Supplementary Materials.

Author Contributions

Conceptualisation, A.A.-O. and S.G.-G.; methodology, A.A.-O., R.R.-L. and S.G.-G.; software, A.A.-O. and S.G.-G.; validation, R.R.-L. and S.G.-G.; formal analysis, A.A.-O.; investigation, A.A.-O., M.V. and S.G.-G.; resources, J.J.C., M.V., J.U.A. and S.G.-G.; data curation, A.A.-O. and M.V.; writing—original draft preparation, A.A.-O.; writing—review and editing, M.V., R.R.-L. and S.G.-G.; visualisation, A.A.-O.; supervision, S.G.-G.; project administration, S.G.-G. and J.J.C.; funding acquisition, S.G.-G. and J.J.C. All authors have read and agreed to the published version of the manuscript.

Funding

This research has been partially supported by the project Transition to sustainable agri-food sector bundling life cycle assessment and ecosystem services approaches (ALISE) (TED2021-130309B-I00), funded by MCIN/AEI/10.13039/501100011033/ and the European Union NextGenerationEU/PRTR, and by the project “Sustainable management of water resources in irrigated agriculture in the SUDOE area (I-ReWater-S1/2.5/E0136)”, co-funded by the programme INTERREG SUDOE and by the STAR4BBS (No. 101060588) project, funded by the European Commission HORIZON–CL6–2021-ZEROPOLLUTION-01. A.A.-O. and S.G.-G. belong to the Galician Competitive Research Group (GRC ED431C 2021/37) and to the Cross-disciplinary Research in Environmental Technologies (CRETUS Research Center, ED431G 2023/12).

Institutional Review Board Statement

Not applicable.

Data Availability Statement

The data presented in this study are available upon reasonable request from the first author.

Conflicts of Interest

The authors declare no conflicts of interest.

Abbreviations

The following abbreviations are used in this manuscript:
DOCaQualified Designation of Origin
LCALife Cycle Assessment
GHGGreenhouse Gas Emissions
ESEcosystem Services
DODesignation of Origin
IPCCIntergovernmental Panel on Climate Change
EEAEuropean Environmental Agency
EMEPEuropean Monitoring and Evaluation Programme
GWGlobal Warming
SODStratospheric Ozone Depletion
TATerrestrial Acidification
FEFreshwater Eutrophication
MEMarine Eutrophication
HNCTHuman Non-Carcinogenic Toxicity
LULand Use
WSWater Scarcity
PDFGlobal Potential Species Loss

References

  1. International Organisation of Vine and Wine. State of the World Vine and Wine Sector in 2023. 2024. Available online: https://www.oiv.int/sites/default/files/2024-04/OIV_STATE_OF_THE_WORLD_VINE_AND_WINE_SECTOR_IN_2023.pdf (accessed on 4 December 2024).
  2. Geppert, C.; da Cruz, M.; Alma, A.; Andretta, L.; Anfora, G.; Battaglia, D.; Burgio, G.; Caccavo, V.; Chiesa, S.G.; Cinquatti, F.; et al. Climate and landscape composition explain agronomic practices, pesticide use and grape yield in vineyards across Italy. Agric. Syst. 2024, 215, 103853. [Google Scholar] [CrossRef]
  3. Trioli, G.; Sacchi, A.; Corbo, C.; Trevisan, M. Environmental Impact of Vinegrowing and Winemaking Inputs: An European Survey. Internet J. Vitic. Enol. 2015, 7/2. Available online: https://www.infowine.com/wp-content/uploads/2024/04/libretto12728-02-1.pdf (accessed on 4 December 2024).
  4. European Commission. Organic Farming. Available online: https://agriculture.ec.europa.eu/farming/organic-farming_en (accessed on 20 February 2025).
  5. Provost, C.; Pedneault, K. The organic vineyard as a balanced ecosystem: Improved organic grape management and impacts on wine quality. Sci. Hortic. 2016, 208, 43–56. [Google Scholar] [CrossRef]
  6. Hedley, C.B.; Knox, J.W.; Raine, S.R.; Smith, R. Water: Advanced Irrigation Technologies. In Encyclopedia of Agriculture and Food Systems; Elsevier: Amsterdam, The Netherlands, 2014; pp. 378–406. [Google Scholar] [CrossRef]
  7. Matos, C.; Castro, M.; Baptista, J.; Valente, A.; Briga-Sá, A. The use of water in wineries: A review. Sci. Total Environ. 2024, 951, 175198. [Google Scholar] [CrossRef]
  8. International Organisation of Vine and Wine. Sustainable Use of Water in Winegrape. 2021. Available online: https://www.oiv.int/sites/default/files/2022-09/2021-oiv-collective-expertise-document-sustainable-use-of-wa_en.pdf (accessed on 9 December 2024).
  9. Parween, T.; Jan, S. Pesticide consumption and threats to biodiversity. In Ecophysiology of Pesticides; Elsevier: Amsterdam, The Netherlands, 2019; pp. 39–73. [Google Scholar] [CrossRef]
  10. Pandey, R.; Mishra, S.K.; Mishra, M.K. Agrochemicals and Their Impact on Environment. In Recent Trends in Plant Protection; NIPA: Seoul, Republic of Korea, 2024; Available online: https://www.researchgate.net/publication/375485756 (accessed on 17 December 2024).
  11. Shrestha, P.; Karim, R.A.; Sieverding, H.L.; Archer, D.W.; Kumar, S.; Nleya, T.; Graham, C.J.; Stone, J.J. Life cycle assessment of wheat production and wheat-based crop rotations. J. Environ. Qual. 2020, 49, 1515–1529. [Google Scholar] [CrossRef]
  12. Sinisterra-Solís, N.K.; Sanjuán, N.; Estruch, V.; Clemente, G. Assessing the environmental impact of Spanish vineyards in Utiel-Requena PDO: The influence of farm management and on-field emission modelling. J. Environ. Manag. 2020, 262, 110325. [Google Scholar] [CrossRef]
  13. Fan, J.; Liu, C.; Xie, J.; Han, L.; Zhang, C.; Guo, D.; Niu, J.; Jin, H.; McConkey, B.G. Life Cycle Assessment on Agricultural Production: A Mini Review on Methodology, Application, and Challenges. Int. J. Environ. Res. Public Health 2022, 19, 9817. [Google Scholar] [CrossRef]
  14. Maia de Souza, D.; Lopes, G.R.; Hansson, J.; Hansen, K. Ecosystem services in life cycle assessment: A synthesis of knowledge and recommendations for biofuels. Ecosyst. Serv. 2018, 30, 200–210. [Google Scholar] [CrossRef]
  15. Lago-Olveira, S.; Moreira, M.T.; González-García, S. Quantifying spatially explicit LCA midpoint characterization factors to assess the impact of specific farming practices on ecosystem services. Ecosyst. Serv. 2025, 71, 101686. [Google Scholar] [CrossRef]
  16. Millennium Ecosystem Assessment. Ecosystems and human well-being: Synthesis. Phys. Teach. 2005, 34, 534. [Google Scholar]
  17. ICDA Sustainability. Food System Impacts on Biodiversity Loss. Available online: https://icdasustainability.org/report/food-system-impacts-on-biodiversity-loss-2023/ (accessed on 27 September 2024).
  18. European Union. Regulation (EU) 2023/1115 of the European Parliament and of the Council of 31 May 2023. Off. J. Eur. Union 2023, 150, 206–247. [Google Scholar]
  19. Katumo, D.M.; Liang, H.; Ochola, A.C.; Lv, M.; Wang, Q.F.; Yang, C.F. Pollinator diversity benefits natural and agricultural ecosystems, environmental health, and human welfare. Plant Divers. 2022, 44, 429–435. [Google Scholar] [CrossRef] [PubMed]
  20. BOE. Orden de 3 de Abril de 1991 por la que se Otorga el Carácter de Calificada a la Denominación de Origen «Rioja» y se Aprueba el Reglamento de la Misma y su Consejo Regulador. 1991. Available online: https://www.boe.es/diario_boe/txt.php?id=BOE-A-1991-8566 (accessed on 9 December 2024).
  21. BOE. Ley 25/1970, de 2 de Diciembre, de Estatuto de la Viña, del Vino y de los 1970. Available online: https://www.boe.es/buscar/doc.php?id=BOE-A-1970-1316 (accessed on 9 December 2024).
  22. Spanish Government. Designations of Origin, Protected Geographical Indications and Traditional Specialties Guaranteed. Available online: https://administracion.gob.es/pag_Home/en/Tu-espacio-europeo/derechos-obligaciones/empresas/inicio-gestion-cierre/derechos/denominaciones-origen.html (accessed on 17 September 2024).
  23. DOCa Rioja Regulatory Board. Denominación de Origen Rioja. Available online: https://riojawine.com/ (accessed on 27 September 2024).
  24. García Castellanos, B.; García García, B.; García García, J. Evaluation of the Sustainability of Vineyards in Semi-Arid Climates: The Case of Southeastern Spain. Agronomy 2022, 12, 3213. [Google Scholar] [CrossRef]
  25. Villanueva-Rey, P.; Quinteiro, P.; Vázquez-Rowe, I.; Rafael, S.; Arroja, L.; Moreira, M.; Feijoo, G.; Dias, A. Assessing water footprint in a wine appellation: A case study for Ribeiro in Galicia, Spain. J. Clean. Prod. 2018, 172, 2097–2107. [Google Scholar] [CrossRef]
  26. Dejo-Oricain, N.; Fernández-Olmos, M.; Gargallo-Castel, A.F. Determinants of organic wine production: An application in the DOC Rioja wine industry. Span. J. Agric. Res. 2022, 20, e0104. [Google Scholar] [CrossRef]
  27. Government of La Rioja. Producción Ecológica. Available online: https://www.larioja.org/agricultura/es/calidad-agroalimentaria/produccion-ecologica (accessed on 4 September 2024).
  28. ISO 14044:2006; Environmental Management—Life Cycle Assessment—Requirements and Guidelines. ISO: Geneve, Switzerland, 2006.
  29. ISO 14040:2006; Environmental Management—Life Cycle Assessment—Principles and Framework. ISO: Geneve, Switzerland, 2006.
  30. Laca, A.; Gancedo, S.; Laca, A.; Díaz, M. Assessment of the environmental impacts associated with vineyards and winemaking. A case study in mountain areas. Environ. Sci. Pollut. Res. 2021, 28, 1204–1223. [Google Scholar] [CrossRef]
  31. Viveros Santos, I.; Renaud-Gentié, C.; Roux, P.; Levasseur, A.; Bulle, C.; Deschênes, L.; Boulay, A.-M. Prospective life cycle assessment of viticulture under climate change scenarios, application on two case studies in France. Sci. Total Environ. 2023, 880, 163288. [Google Scholar] [CrossRef]
  32. ARECO. Análisis Comparado de Diferentes Opciones de Distribución de Frutas y Hortalizas en España Mediante el Análisis de Ciclo Vida (ACV). 2017. Available online: https://areco.org.es/wp-content/uploads/2021/02/Resumen_ejecutivo_Estudio_ACV_ARECO.pdf (accessed on 29 November 2024).
  33. Roselli, L.; Casieri, A.; de Gennaro, B.C.; Sardaro, R.; Russo, G. Environmental and economic sustainability of table grape production in Italy. Sustainability 2020, 12, 3670. [Google Scholar] [CrossRef]
  34. Ecoinvent. Data with Purpose. Available online: https://ecoinvent.org/ (accessed on 21 August 2024).
  35. IPCC. Climate Change 2023: Synthesis Report. Contribution of Working Groups I, II and III to the Sixth Assessment Report of the Intergovernmental Panel on Climate Change; Lee, H., Romero, J., Eds.; IPCC: Geneva, Switzerland, 2023. [Google Scholar]
  36. EMEP/EEA. EMEP/EEA Air Pollutant Emission Inventory Guidebook 2023; Technical Guidance to Prepare National Emission Inventories; European Environment Agency: Copenhagen, Denmark, 2023. [Google Scholar]
  37. Faist, M.; Zah, R.; Reinhard, J. Sustainable Quick Check for Biofuels (SQCB): A Web-based tool for streamlined biofuels’ LCA. In Environmental Informatics and Industrial Environmental Protection: Concepts, Methods and Tools; Shaker Verla: Aachen, Germany, 2009; pp. 297–303. [Google Scholar]
  38. USDA. The Twelve Orders of Soil Taxonomy. Available online: https://www.nrcs.usda.gov/resources/education-and-teaching-materials/the-twelve-orders-of-soil-taxonomy (accessed on 9 January 2025).
  39. Bordoni, M.; Meisina, C.; Vercesi, A.; Bischetti, G.; Chiaradia, E.; Vergani, C.; Chersich, S.; Valentino, R.; Bittelli, M.; Comolli, R.; et al. Quantifying the contribution of grapevine roots to soil mechanical reinforcement in an area susceptible to shallow landslides. Soil Tillage Res. 2016, 163, 195–206. [Google Scholar] [CrossRef]
  40. Prasuhn, V. Erfassung der PO4-Austräge für die Ökobilanzierung; SALCA-Phosphor: Agroscope, Switzerland, 2006; Volume 20. [Google Scholar]
  41. European Commission. Product Environmental Footprint Category Rules Guidance; PEFCR Guid; European Commission: Ispra, Italy, 2018. [Google Scholar]
  42. Schmidt, J.H.; Weidema, B.P.; Brandão, M. A framework for modelling indirect land use changes in Life Cycle Assessment. J. Clean. Prod. 2015, 99, 230–238. [Google Scholar] [CrossRef]
  43. Haberl, H.; Erb, K.H.; Krausmann, F.; Gaube, V.; Bondeau, A.; Plutzar, C.; Gingrich, S.; Lucht, W.; Fischer-Kowalski, M. Quantifying and mapping the human appropriation of net primary production in earth’s terrestrial ecosystems. Proc. Natl. Acad. Sci. USA 2007, 104, 12942–12947. [Google Scholar] [CrossRef] [PubMed]
  44. Rubinstein, R.Y.; Kroese, D.P. Simulation and the Monte Carlo Method, 3rd ed.; John Wiley & Sons: Hoboken, NJ, USA, 2016. [Google Scholar] [CrossRef]
  45. Pérez, R.; Fernández, C.; Laca, A.; Laca, A. Evaluation of Environmental Impacts in Legume Crops: A Case Study of PGI White Bean Production in Southern Europe. Sustainability 2024, 16, 8024. [Google Scholar] [CrossRef]
  46. Lago-Olveira, S.; Cancela, J.J.; Tubío, M.; Moreira, H.F.; Moreira, M.T.; González-García, S. Environmental benefits of ozonated water for sustainable grapevine disease control: A life cycle and carbon sequestration analysis. J. Clean. Prod. 2024, 478, 143999. [Google Scholar] [CrossRef]
  47. Huijbregts, M.A.J.; Steinmann, Z.J.N.; Elshout, P.M.F.; Stam, G.; Verones, F.; Vieira, M.; Zijp, M.; Hollander, A.; van Zelm, R. ReCiPe2016: A harmonised life cycle impact assessment method at midpoint and endpoint level. Int. J. Life Cycle Assess. 2017, 22, 138–147. [Google Scholar] [CrossRef]
  48. Boulay, A.M.; Bare, J.; Benini, L.; Berger, M.; Lathuillière, M.J.; Manzardo, A.; Margni, M.; Motoshita, M.; Núñez, M.; Pastor, A.V.; et al. The WULCA consensus characterization model for water scarcity footprints: Assessing impacts of water consumption based on available water remaining (AWARE). Int. J. Life Cycle Assess. 2017, 23, 368–378. [Google Scholar] [CrossRef]
  49. Hanley, N.; Breeze, T.D.; Ellis, C.; Goulson, D. Measuring the economic value of pollination services: Principles, evidence and knowledge gaps. Ecosyst. Serv. 2015, 14, 124–132. [Google Scholar] [CrossRef]
  50. Porto, R.G.; de Almeida, R.F.; Cruz-Neto, O.; Tabarelli, M.; Viana, B.F.; Peres, C.A.; Lopes, A.V. Pollination ecosystem services: A comprehensive review of economic values, research funding and policy actions. Food Secur. 2020, 12, 1425–1442. [Google Scholar] [CrossRef]
  51. PRé Sustainability. Simapro Database Manual. Methods Library; PRé Sustainability: Amersfoort, The Netherlands, 2024. [Google Scholar]
  52. Chaudhary, A.; Verones, F.; De Baan, L.; Hellweg, S. Quantifying Land Use Impacts on Biodiversity: Combining Species-Area Models and Vulnerability Indicators. Environ. Sci. Technol. 2015, 49, 9987–9995. [Google Scholar] [CrossRef]
  53. Chaudhary, A.; Brooks, T.M. Land Use Intensity-Specific Global Characterization Factors to Assess Product Biodiversity Footprints. Environ. Sci. Technol. 2018, 52, 5094–5104. [Google Scholar] [CrossRef]
  54. Olson, D.M.; Dinerstein, E.; Wikramanayake, E.D.; Burgess, N.D.; Powell, G.V.; Underwood, E.C.; D’amico, J.A.; Itoua, I.; Strand, H.E.; Morrison, J.C.; et al. Terrestrial ecoregions of the worlds: A new map of life on Earth. Bioscience 2001, 11, 933–938. [Google Scholar] [CrossRef]
  55. Lago-Olveira, S.; El-Areed, S.R.M.; Moreira, M.T.; González-García, S. Improving environmental sustainability of agriculture in Egypt through a life-cycle perspective. Sci. Total Environ. 2023, 890, 164335. [Google Scholar] [CrossRef] [PubMed]
  56. Natural Capital Project. InVEST Crop Pollination Model. Stanford University. Available online: https://naturalcapitalproject.stanford.edu/invest/crop-pollination (accessed on 9 October 2024).
  57. QGIS Development Team. QGIS Geographic Information System (Version 3.36.3). Open Source Geospatial Foundation Project. Available online: http://qgis.osgeo.org (accessed on 9 October 2024).
  58. Klein, A.-M.; Vaissière, B.E.; Cane, J.H.; Steffan-Dewenter, I.; Cunningham, S.A.; Kremen, C.; Tscharntke, T. Importance of pollinators in changing landscapes for world crops. Proc. R. Soc. B Biol. Sci. 2007, 274, 303–313. [Google Scholar] [CrossRef] [PubMed]
  59. European Environment Agency. CORINE Land Cover 2018. Copernicus Land Monitoring Service. Available online: https://land.copernicus.eu/pan-european/corine-land-cover/clc2018 (accessed on 9 October 2024).
  60. Bartomeus, I.; Lanuza, J.B.; Wood, T.J.; Carvalheiro, L.; Molina, F.P.; Collado, M.Á.; Aguado-Martín, L.O.; Alomar, D.; Álvarez-Fidalgo, M.; Fidalgo, P.Á.; et al. Iberian bees database. Ecosistemas 2022, 31, 2380. [Google Scholar] [CrossRef]
  61. Zhao, Z.; Shan, R.; Sun, X.; Sun, J.; Wang, B.; Wang, Z. Mapping and assessing supply and demand of crop pollination services in Shandong Province, China. J. Clean. Prod. 2023, 426, 139024. [Google Scholar] [CrossRef]
  62. Sanguet, A.; Wyler, N.; Guinaudeau, B.; Waller, N.; Urbina, L.; Huber, L.; Fischer, C.; Lehmann, A. Mapping Ecological Infrastructure in a Cross-Border Regional Context. Land 2023, 12, 2010. [Google Scholar] [CrossRef]
  63. Natural Capital Project. InVEST 3.10.2 Data. Available online: http://releases.naturalcapitalproject.org/?prefix=invest/3.10.2/data/ (accessed on 25 October 2024).
  64. Torres, I.F.; Bastida, F.; Hernández, T.; García, C. The effects of fresh and stabilized pruning wastes on the biomass, structure and activity of the soil microbial community in a semiarid climate. Appl. Soil Ecol. 2015, 89, 1–9. [Google Scholar] [CrossRef]
  65. Müller, R. The impact of the rise in atmospheric nitrous oxide on stratospheric ozone: This article belongs to Ambio’s 50th Anniversary Collection. Theme: Ozone Layer. Ambio 2021, 50, 35–39. [Google Scholar] [CrossRef]
  66. Gazulla, C.; Raugei, M.; Fullana-I-Palmer, P. Taking a life cycle look at crianza wine production in Spain: Where are the bottlenecks? Int. J. Life Cycle Assess. 2010, 15, 330–337. [Google Scholar] [CrossRef]
  67. Brandão, M.; Canals, L.M. Global characterisation factors to assess land use impacts on biotic production. Int. J. Life Cycle Assess. 2013, 18, 1243–1252. [Google Scholar] [CrossRef]
  68. Lago-Olveira, S.; Rebolledo-Leiva, R.; Garofalo, P.; Moreira, M.T.; González-García, S. Environmental and economic benefits of wheat and chickpea crop rotation in the Mediterranean region of Apulia (Italy). Sci. Total Environ. 2023, 896, 165124. [Google Scholar] [CrossRef]
  69. Griffiths-Lee, J.; Davenport, B.; Foster, B.; Nicholls, E.; Goulson, D. Sown wildflowers between vines increase beneficial insect abundance and richness in a British vineyard. Agric. Entomol. 2023, 25, 139–151. [Google Scholar] [CrossRef]
  70. Casson, A.; Ortuani, B.; Giovenzana, V.; Brancadoro, L.; Corsi, S.; Gharsallah, O.; Guidetti, R.; Facchi, A. A multidisciplinary approach to assess environmental and economic impact of conventional and innovative vineyards management systems in Northern Italy. Sci. Total Environ. 2022, 838, 156181. [Google Scholar] [CrossRef] [PubMed]
  71. Meneses, M.; Torres, C.M.; Castells, F. Sensitivity analysis in a life cycle assessment of an aged red wine production from Catalonia, Spain. Sci. Total Environ. 2016, 562, 571–579. [Google Scholar] [CrossRef] [PubMed]
  72. Volanti, M.; Cubillas Martínez, C.; Cespi, D.; Lopez-Baeza, E.; Vassura, I.; Passarini, F. Environmental sustainability assessment of organic vineyard practices from a life cycle perspective. Int. J. Environ. Sci. Technol. 2022, 19, 4645–4658. [Google Scholar] [CrossRef]
  73. Borsato, E.; Giubilato, E.; Zabeo, A.; Lamastra, L.; Criscione, P.; Tarolli, P.; Marinello, F.; Pizzol, L. Comparison of Water-focused Life Cycle Assessment and Water Footprint Assessment: The case of an Italian wine. Sci. Total Environ. 2019, 666, 1220–1231. [Google Scholar] [CrossRef]
  74. Lago-Olveira, S.; Ouhemi, H.; Idrissi, O.; Moreira, M.T.; González-García, S. Promoting more sustainable agriculture in the Moroccan drylands by shifting from conventional wheat monoculture to a rotation with chickpea and lentils. Clean. Environ. Syst. 2024, 12, 100169. [Google Scholar] [CrossRef]
Figure 1. Map of Spain divided into autonomous communities and provinces, with La Rioja highlighted in red and the location of the grape cultivation system identified with a barrel.
Agriculture 15 00536 g001
Figure 2. System boundaries of the vineyard with the main activities and processes considered.
Agriculture 15 00536 g002
Figure 3. Contribution of factors to the environmental profile. GW: global warming; SOD: stratospheric ozone depletion; TA: terrestrial acidification; FE: freshwater eutrophication; ME: marine eutrophication; HNCT: human non-carcinogenic toxicity; LU: land use; WS: water scarcity.
Agriculture 15 00536 g003
Figure 4. Disaggregation of the biodiversity per taxon group.
Agriculture 15 00536 g004
Figure 5. Map of the pollinator abundance in spring (left) and summer (right), with the approximate location of the farm indicated by arrows.
Agriculture 15 00536 g005
Table 1. Main inventory data associated with the viticulture system expressed per hectare of land.
InputsValueUnit
Tractor3.96kg
Diesel39.90kg
Tillage13.49kg
Water2.40m3
N (organic fertiliser)35.00kg
P2O5 (organic fertiliser)35.00kg
K2O (organic fertiliser)70.00kg
Pesticides32.00kg
Steel51.39kg
High-density polyethylene5.62kg
OutputsValueUnit
Grapes6.50t
Air emissions
CO2 (iLUC)37.88kg
CO2 (dLUC)−1246kg
N2O1.43kg
NO21.40kg
NH38.50kg
Copper17.67mg
Sulphur1.81kg
Water emissions
PO4−3 (groundwater)0.21kg
PO4−3 (river)0.58kg
NO314.80kg
Copper1.89g
Sulphur0.20kg
Soil emissions
Sulphur18.14kg
Table 2. Total impacts by impact category for each of the analysed functional units. GW: global warming, SOD: stratospheric ozone depletion, TA: terrestrial acidification, FE: freshwater eutrophication, ME: marine eutrophication, HNCT: human non-carcinogenic toxicity, LU: land use, WS: water scarcity.
Impact CategoryFU1: 1 ha of LandFU2: 1 kg Grapes
ValueUnitValueUnit
GW99.51kg CO2 eq15.31g CO2 eq
SOD0.02kg CFC11 eq2.62mg CFC11 eq
TA8.83kg SO2 eq1.36g SO2 eq
FE0.74kg P eq0.11g P eq
ME4.51kg N eq0.69g N eq
HNCT1.00t 1,4-DCB0.15kg 1,4-DCB
LU24.26m2 a crop eq37.32cm2 a crop eq
WS315m348.4L
Disclaimer/Publisher’s Note: The statements, opinions and data contained in all publications are solely those of the individual author(s) and contributor(s) and not of MDPI and/or the editor(s). MDPI and/or the editor(s) disclaim responsibility for any injury to people or property resulting from any ideas, methods, instructions or products referred to in the content.

