Article

Research on Walnut (Juglans regia L.) Yield Prediction Based on a Walnut Orchard Point Cloud Model

1
School of Technology, Beijing Forestry University, Beijing 100083, China
2
State Key Laboratory of Efficient Production of Forest Resources, Beijing 100083, China
3
Key Laboratory of National Forestry and Grassland Administration on Forestry Equipment and Automation, Beijing 100083, China
4
School of Technology, China Agricultural University, Beijing 100083, China
5
School of Grassland Science, Beijing Forestry University, Beijing 100083, China
*
Author to whom correspondence should be addressed.
Agriculture 2025, 15(7), 775; https://doi.org/10.3390/agriculture15070775
Submission received: 3 March 2025 / Revised: 28 March 2025 / Accepted: 31 March 2025 / Published: 3 April 2025

Abstract

:
This study aims to develop a method for predicting walnut (Juglans regia L.) yield based on the walnut orchard point cloud model, addressing issues such as low efficiency, insufficient accuracy, and high costs in traditional methods. The walnut orchard point cloud is reconstructed using unmanned aerial vehicle (UAV) images, and the semantic segmentation technique is applied to extract the individual walnut tree point cloud model. Furthermore, the tree height, canopy projection area, and volume of each walnut tree are calculated. By combining these morphological features with statistical models and machine learning methods, a prediction model between tree morphology and yield is established, achieving prediction accuracy with a mean absolute error (MAE) of 2.04 kg, a mean absolute percentage error (MAPE) of 17.24%, a root mean square error (RMSE) of 2.81 kg, and a coefficient of determination (R2) of 0.83. This method provides an efficient, accurate, and economically feasible solution for walnut yield prediction, overcoming the limitations of existing technologies.

Graphical Abstract

1. Introduction

Walnuts (Juglans regia L.) have economic, nutritional, and medicinal value [1,2,3,4,5,6]. With the increasing demand for consumption, walnut yield and quality have gained widespread attention. The accuracy of walnut yield prediction is crucial for farmers’ income and agricultural management decisions.
Currently, research methods for walnut yield prediction are still inadequate [7,8,9], but the yield prediction technologies for related agricultural and forestry crops have already formed a multi-dimensional technical system [10,11,12]. Manual counting is the most direct method, predicting yield through field sampling and statistics [13]. This method is reliable but inefficient, and it is difficult to implement in large-scale planting areas. Satellite- or drone-captured photos are used to monitor planting areas, evaluating crop growth conditions through vegetation indices [14,15]. However, these methods often fail to accurately assess individual trees. Image processing techniques based on the visible spectrum are used to identify fruits [16,17]. However, as shown in Figure 1, the color of walnut tree leaves is similar to that of the fruit, and the dense canopy structure causes significant fruit occlusion, making it difficult to distinguish the fruits accurately. Multi-spectral or hyperspectral cameras capture information from different bands to enhance image processing. However, this technology is costly and requires specialized equipment and analysis software. The fruit yield prediction method based on spectral and morphological features, which establishes the relationship between independent variables and yield using machine learning regression models [18], has the advantage of not relying on unique parameters of a single crop for yield prediction. Many regression methods based on statistics and machine learning (ML), such as multiple linear regression (MLR) [19], partial least squares regression (PLSR) [20], random forest regression (RFR) [21], and support vector regression (SVR) [22], have been implemented to achieve accurate yield prediction for various crops. However, despite progress in improving prediction accuracy, how to enhance the interpretability and generalization ability of models during model construction remains an unresolved issue.
Point cloud data are a common representation in three-dimensional (3D) scenes [23,24], and extensive research has been conducted on yield prediction in other agricultural and forestry fields using computer vision and deep learning technologies [25]. Chen [26] developed an automated strawberry flower detection system based on UAV and deep learning technology for yield prediction. The system achieved efficient and accurate strawberry flower counting using images captured by UAVs and the Faster R-CNN model, helping growers better plan resources. Maimaitijiang [27] used multi-modal data collected by low-cost UAVs and combined them with a deep neural network model to predict soybean yield. The results showed that the DNN-based model performed excellently for different soybean varieties and was not affected by spatial variability, demonstrating high accuracy and robustness. Chen [28] developed a channel based on light detection and ranging (LiDAR) and multi-spectral image data to automatically extract spectral and morphological features of apple trees, using an ensemble learning model to predict individual apple tree yield. The results indicated that three selected features (canopy volume, ratio vegetation index, and CPA1) were the most important for yield prediction, and the ensemble model outperformed the base learners. Choudhury [29] evaluated the ability of multi-spectral, hyperspectral, 3D point cloud, and machine learning technologies to improve the estimation of wheat genotype biomass and grain yield. Tesfaye [30] proposed a method combining machine learning, spatiotemporal cloud restoration, and phenological analysis for predicting farm-level wheat yield. Generalized linear regression and random forest models performed excellently, providing an effective tool for predicting wheat yield at the field scale.
In summary, the research methods for walnut yield prediction are still significantly lacking. Although various methods have been applied in other agricultural and forestry fields, each method has certain limitations when applied to walnut yield prediction. Manual counting is intuitive and reliable but inefficient for large-scale applications. While remote sensing technology can provide macro monitoring, it cannot be accurate at the individual tree level. Image processing technology is limited by the similarity in color between walnut tree leaves and fruits, as well as the dense canopy structure, making it difficult to distinguish fruits. Multi-spectral and hyperspectral technologies can improve image recognition accuracy but are limited by their high cost and the need for specialized equipment, restricting their widespread application. While statistical models and machine learning methods help improve prediction accuracy, there is still room for improvement in model interpretability and generalization ability.
In response to these challenges, this study proposes a method for constructing a walnut orchard point cloud model based on 3D reconstruction from UAV images. Using point cloud semantic segmentation technology, individual walnut tree point cloud models are extracted, and morphological features (tree height, canopy projection area, and volume) are further calculated. By combining these morphological features with statistical models and machine learning methods, a prediction model between tree morphology and yield is established, and model accuracy is evaluated. This method is expected to overcome the limitations of existing technologies, providing an efficient, accurate, and economically feasible solution for walnut yield prediction.

2. Materials and Methods

2.1. Data Acquisition and Application

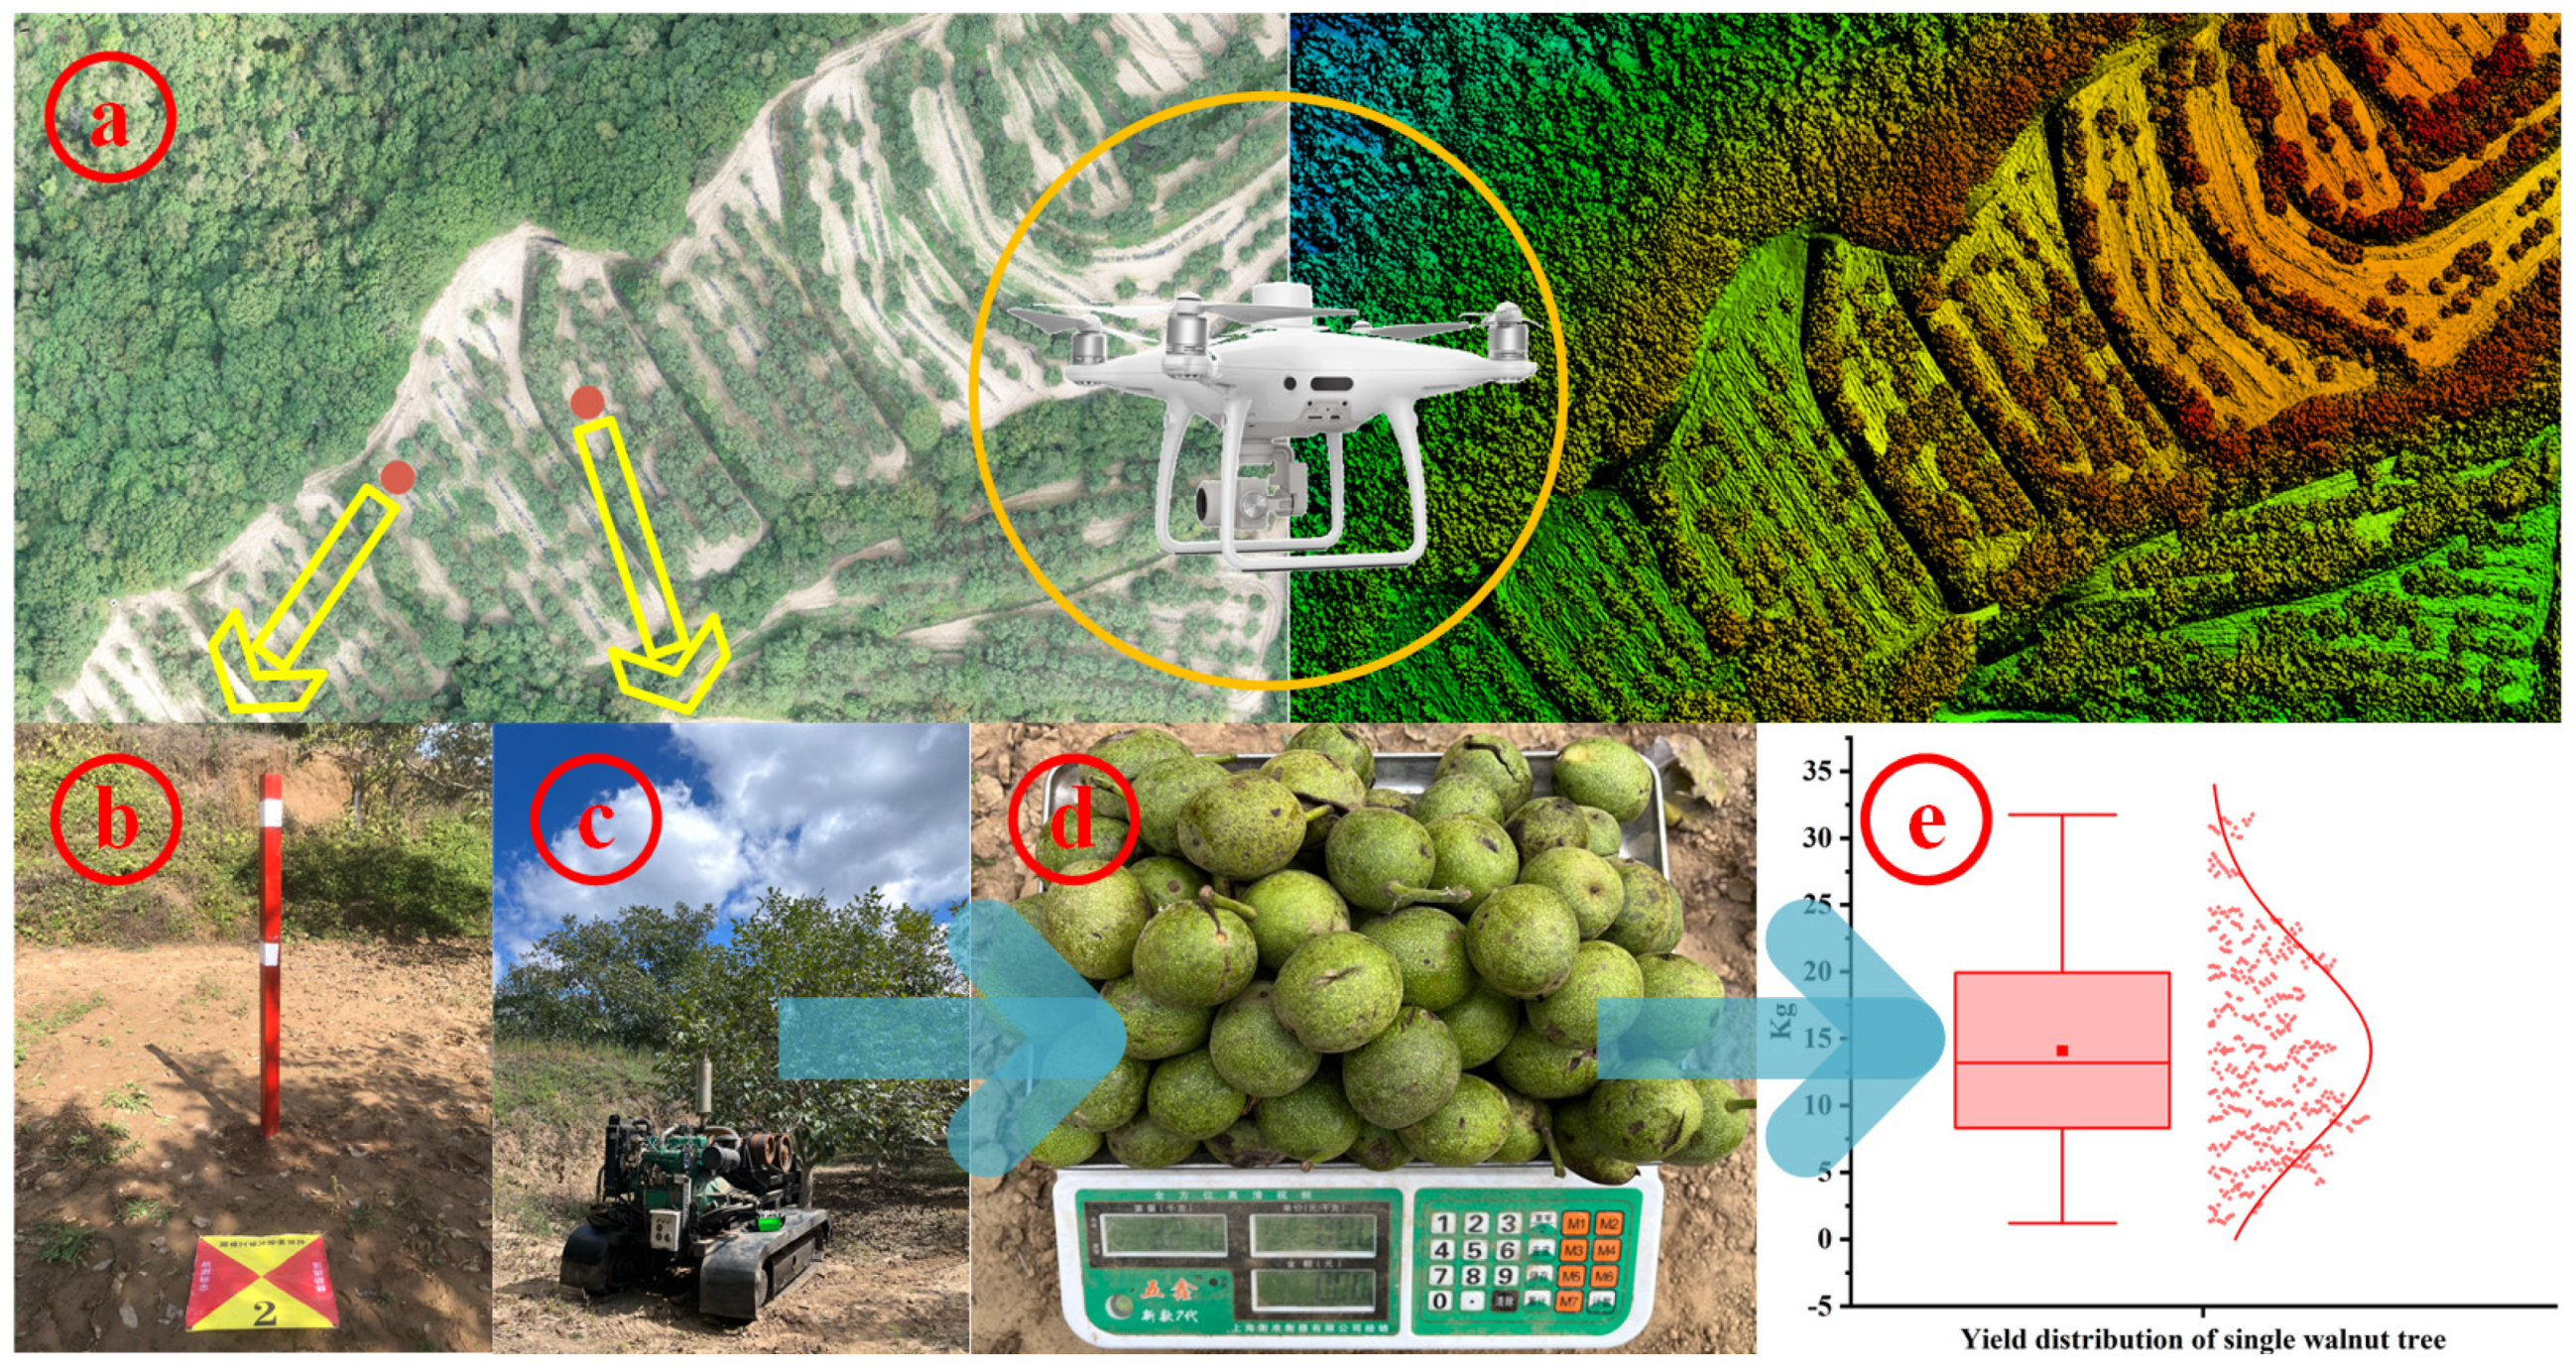
This study focuses on the walnut planting base in Huanglong County, Yan’an City, Shaanxi Province, China (35°49′ N, 109°49′ E, 1555 m above sea level). The experimental area is located in a typical mountainous and hilly region, with the walnut orchard consisting of only the Xiangling variety and the same tree age. The orchard layout follows contour-based planting with uniform planting row spacing rules. The total area of the walnut orchard is 26,705.954 m2, with 492 walnut trees. The experimental scheme is shown in Figure 2. During the experiment, the weather was clear, and multi-angle images of the walnut orchard were captured using a DJI Phantom 4 RTK UAV. Network RTK was used, with a coordinate system of WGS84, and RTK data with centimeter-level positioning accuracy were stored in the UAV images. The UAV flight height was 25 m, and the camera gimbal angle was −45°. The ground sample distance (GSD) was 0.68 cm/pixel, with both side and vertical overlap rates set to 80%. The camera model was DJI FC6310R, with a 20-megapixel resolution and a photo resolution of 5742 × 3648. To restore the scale of the walnut orchard point cloud model, several photogrammetry control markers were arranged in the experimental area. A harvest machine was used to collect the walnuts, and an electronic scale was used to weigh and record the collected walnuts. The yield of individual walnut trees showed an approximately normal distribution, with an observation range of 1.19–31.74 kg, a median of 13.21 kg (IQR = 11.61 kg, Q1 = 8.32 kg, Q3 = 19.93 kg), and an arithmetic mean of 14.10 ± 7.31 kg. Most of the tree yields concentrated between 8 and 20 kg, indicating good overall yield stability and following the general distribution pattern of biological yield.

2.2. Reconstruction of the Walnut Orchard Point Cloud Model Based on Neural Radiance Field

This study employs Nerfstudio [31] to reconstruct the 3D model of the walnut orchard. As shown in Figure 3, neural radiance field (NERF) is a neural network model used for rendering 3D scenes. It implicitly learns a static 3D scene through a multilayer perceptron (MLP), enabling the synthesis of complex scenes from any viewpoint. The camera poses of the walnut orchard images are calculated using COLMAP [32], and the UAV walnut orchard images, along with the computed camera pose data, are input into the MLP network for rendering. This creates a neural radiance field that describes the color and voxel density of the walnut orchard scene, which is then used to generate and export the walnut orchard point cloud model.
First, a ray is emitted from the camera’s optical center in the direction of a specific pixel on the 2D image plane. This ray will pass through the walnut orchard’s physical space, and samples are taken along the ray. The sampled point positions are encoded and input into the MLP. The MLP approximates the implicit function F θ , which is expressed as follows:
F ( T ) ( R , G , B , δ )
where F ( T ) is the input vector to the MLP representing the sampled point’s position coordinates and ( R , G , B , δ ) is the output vector of the MLP, where ( R , G , B ) represents the color of the sampled point and δ represents the voxel density.
For convenience, let the color of the sampled point be represented by c , i.e., ( R , G , B , δ ) = ( c , δ ) . The MLP generates a radiance field that describes the color and voxel density of all sampled points in the walnut orchard scene. The colors and voxel densities of the sampled points are rendered by weighting the colors of each sampled point along the camera ray by voxel density and then integrating them to calculate the color of the pixel on the image plane through which the camera ray passes. The integral is computed as follows:
C r = t n t f T ( t ) δ ( r ( t ) ) c ( r t , d ) d t T t = exp t n t δ r s d s
where C r represents the pixel color, T t represents the accumulated transmission coefficient, r t = o   + t d represents the camera ray with near and far boundaries at t n and t f , δ ( r ( t ) ) represents the density of the sampled point at position r ( t ) , and c ( r t , d ) represents the color of the sampled point at position r ( t ) .
MLP networks struggle to estimate continuous points along the camera ray; therefore, to improve the efficiency of rendering, a stratified sampling method is used to segment the camera ray for approximation. The region to be integrated, [ t n ,   t f ] , is uniformly divided into N parts, and uniform random sampling is performed in each small region. Thus, Formula (2) simplifies to
C ^ r = i = 1 N T i ( 1 e x p ( δ i ω i ) ) c i T i = exp j = 1 i 1 δ i ω i
where ω i = t i + 1 t i represents the distance between adjacent sample points.
Since neural networks have difficulty learning high-frequency information, directly using the camera pose as input to the network results in low rendering resolution. To address this, positional encoding is used to map the input to higher frequencies. The formula for this encoding is as follows:
γ p = ( sin 2 0 π p , cos 2 0 π p , , sin 2 H 1 π p , cos 2 H 1 π p )
where the camera position is set with H = 10 and the camera view angle is set with H = 4 .
After calculating the rendered pixel color C ^ r , it is compared with the pixel color along the camera ray on the pixel plane, resulting in the training loss. The loss function for the entire view is obtained by iterating over all of the pixels in the same view, as follows:
£ = r R | C ^ r C r | 2 2
where C ^ r is the rendered pixel color, C r is the pixel color along the camera ray direction, and R represents all of the pixels in one view.
By optimizing the MLP network weights using the loss function, iterative adjustments are made to approximate the true form of the walnut orchard scene. This continues until convergence conditions are met, completing the training of the walnut orchard neural radiance field and obtaining its scene model. The walnut orchard neural radiance field represents both the 3D spatial structure and color information of the walnut orchard, which is mapped to the world coordinate system and recorded to obtain the walnut orchard point cloud model, completing the 3D reconstruction of the walnut orchard.

2.3. Semantic Segmentation of the Walnut Orchard Point Cloud Model Based on PointNet++

PointNet++ [33] is an extension of PointNet [34], designed to address the limitations of PointNet in handling complex scenes and multi-scale features. While PointNet is capable of processing unordered point clouds, it has limitations in extracting local features and handling multi-scale features. PointNet++ overcomes these limitations by introducing hierarchical feature learning and local feature aggregation, significantly improving performance in point cloud classification and segmentation tasks.
In this study, the walnut orchard point cloud dataset generated in Section 2.2 is used. Each point cloud is represented as a six-dimensional vector: the three-dimensional coordinates ( X ,   Y ,   Z ) and the color information ( R ,   G ,   B ) . The walnut orchard point cloud dataset is divided into two categories: 0 represents the walnut tree point cloud and 1 represents other point clouds. The semantic segmentation of the walnut orchard point cloud involves the following steps:
First, at each layer, PointNet++ groups the input point cloud and selects the neighboring points for each point using the k-nearest neighbor algorithm. The calculation formula is
N N p i , k = p j     p i p j 2 ε }
where NN p i , k represents the k -nearest neighboring points of point p i and ε is the distance threshold.
Then, a local PointNet network is used to extract features for each point and its neighborhood. The feature transformation is performed using an MLP, as expressed by the following formula:
F l o c = M L P m a x M L P p i
where p i is the point in the point cloud and “max” represents the pooling operation.
Next, the final global feature vector is generated through layer-wise feature integration and a global pooling layer. The calculation formula is as follows:
F g l o b a l = m a x i F l o c , i
where F loc , i is the local feature and max i represents the global pooling operation.
Finally, the point cloud is classified and semantically segmented through a fully connected layer. The final label for each point is computed using the softmax layer:
p y i = c = e x p w c T F g l o b a l j e x p w j T F g l o b a l
where c represents the class and w c is the weight for class c .
During training, the PointNet++ network uses the cross-entropy loss function to optimize the classification task. The loss function is defined as follows:
L = 1 N i = 1 N c = 1 C y i , c l o g y ^ i , c
where N is the total number of points, C is the number of classes, and y i , c and y ^ i , c represent the true label and the predicted probability, respectively.
In the semantic segmentation process of the walnut orchard point cloud, since only the walnut tree point cloud needs to be segmented, the model is designed to recognize and segment only the “walnut tree” class. The performance of the model is evaluated using the intersection over union (IoU) for each class. The IoU for each class is calculated as follows:
I o U c = T P c T P c + F P c + F N c
where TP c , FP c , and FN c represent the true positives, false positives, and false negatives for class c , respectively.

2.4. Calculation of Walnut Tree Morphological Features Based on the Walnut Tree Point Cloud Model

After performing semantic segmentation on the walnut orchard point cloud model, the point cloud data of each walnut tree are obtained as an N × 6 vector, where N represents the number of points in the point cloud. The first three columns represent the position coordinates ( X ,   Y ,   Z ) , and the last three columns ( R ,   G ,   B ) represent the color information of the point cloud.
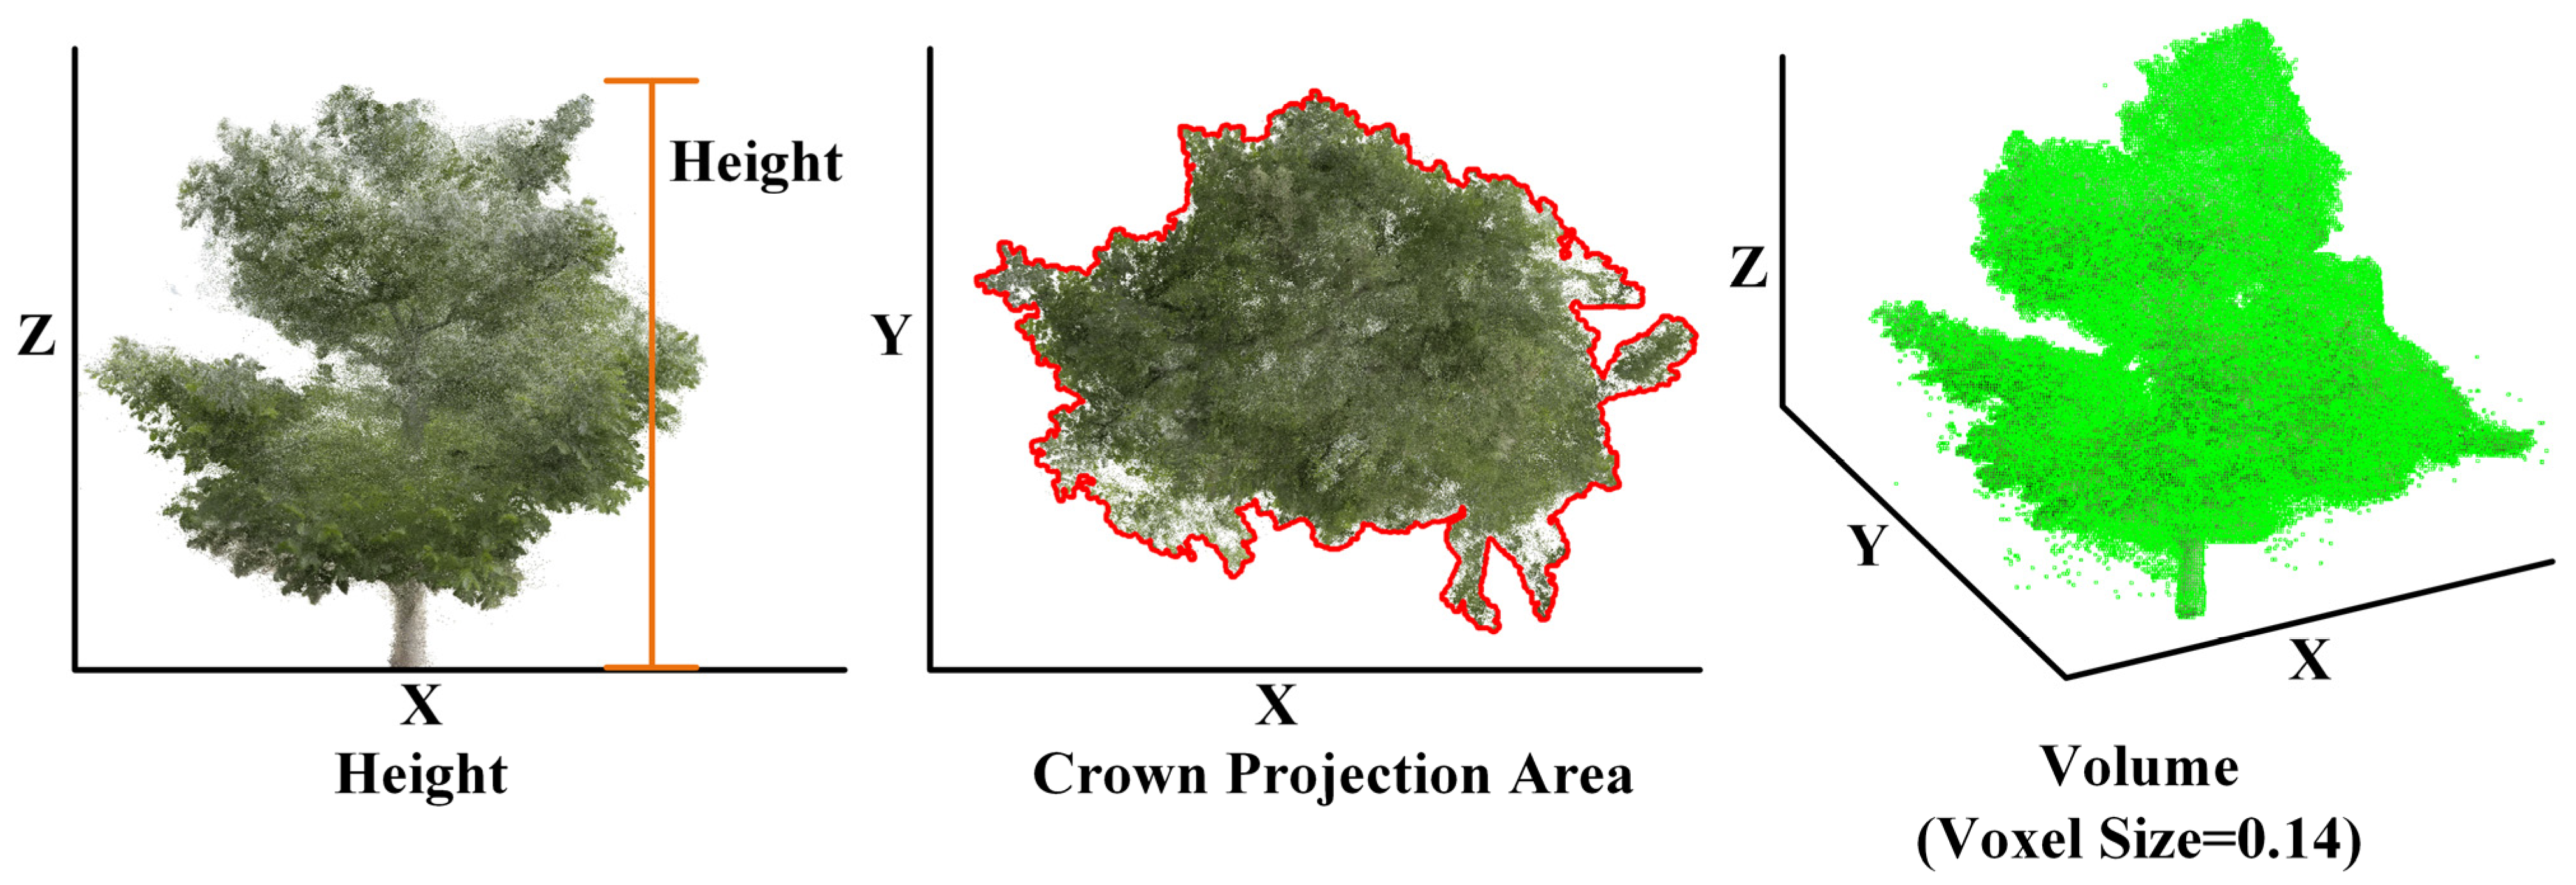
As shown in Figure 4, by iterating over the Z coordinate values of all of the points in the walnut tree point cloud, the tree height is calculated as the difference between the maximum and minimum Z coordinate values. The formula is as follows:
H = max Z 1 , Z 2 , , Z n m i n { Z 1 , Z 2 , , Z n }
where H represents the tree height and Z 1 , Z 2 , , Z n represent the Z coordinates of each point in the point cloud.
Next, the walnut tree point cloud is projected onto the X O Y plane, and the convex hull area of the projection is calculated. The convex hull is the smallest convex polygon that encloses the projection of the point cloud, which gives the canopy projection area of the walnut tree. The formula is as follows:
A = 1 2 i = 1 n 1 X i Y i + 1 X i + 1 Y i + X n Y 1 X 1 Y n
where A represents the canopy projection area and ( X i , Y i ) are the vertices of the convex hull.
The walnut tree volume is estimated using the voxel grid method. First, the walnut tree point cloud data are converted into a voxel grid, where the 3D space is divided into small cubes. Then, the volume of each voxel is calculated. Finally, the total volume of all voxels is summed up as the estimated volume of the walnut tree. The formula is as follows:
V = N v o x e l × d 3
where V represents the tree volume, N voxel represents the number of voxels, and d represents the side length of each voxel.

2.5. Yield Modeling and Evaluation Based on Walnut Tree Morphological Features

Using the walnut tree height, canopy projection area, and tree volume obtained in Section 2.4 as the core morphological parameters, we constructed a walnut yield prediction model using statistical models and machine learning methods. Through systematic feature analysis and model selection strategies, a quantitative relationship model between walnut tree morphological features and yield was established.
First, Pearson correlation analysis was performed on the collected walnut tree morphological feature data. This step aims to preliminarily assess the strength and direction of the linear relationship between these independent variables and the dependent variable. The calculation formula is as follows:
r = i = 1 n ( M i M ¯ ) ( N i N ¯ ) i = 1 n ( M i M ¯ ) 2 i = 1 n ( N i N ¯ ) 2
where r represents the Pearson correlation coefficient, M i and N i represent the observed values of variables M and N , respectively, M ¯ and N ¯ are the mean values of variables M and N , respectively, and n is the total number of observations.
The range of the Pearson correlation coefficient is from −1 to 1. When r is close to 1, it indicates a strong positive linear relationship between the two variables; when r is close to −1, it indicates a strong negative linear relationship; and when r is close to 0, it suggests that there is no significant linear relationship between the two variables. By calculating the Pearson correlation coefficient, the morphological features that are significantly correlated with walnut yield can be identified, providing a theoretical basis for subsequent model selection and construction.
Based on the Pearson analysis results, this study compares four modeling methods with different mathematical mechanisms. These methods were selected because of their excellent performance in handling linear relationships and complex datasets and providing high-precision predictions.
Multiple linear regression (MLR) is a basic statistical modeling technique used to explore the linear relationships between multiple independent variables and the dependent variable. This method assumes that the variables have a linear relationship and finds the optimal fit line using the least squares method. Random forest regression (RFR), as an ensemble learning method, improves prediction accuracy and controls overfitting by constructing multiple decision trees and aggregating their results. This method excels in handling datasets with many features and complex interactions. Support vector regression (SVR) is a supervised learning model primarily used for classification, but it can also be adjusted for regression tasks. It makes predictions by finding a hyperplane that maximizes the margin between different categories. Extreme Gradient Boosting (XGBoost) is an efficient gradient boosting framework designed for speed and performance. It iteratively builds decision trees to minimize the loss function, thus optimizing the prediction results. Each method has its unique advantages and suitable scenarios, and thus, they are used comprehensively to explore which method provides a more thorough understanding of the relationship between walnut yield and tree geometric features.
This study collected 492 sets of walnut tree morphological features and yield data, which were split into training and test sets using stratified sampling with a 7:3 ratio. To scientifically and systematically evaluate the effectiveness and accuracy of the constructed models, multiple evaluation metrics were used, including the coefficient of determination (R2), mean absolute error (MAE), mean absolute percentage error (MAPE), and root mean square error (RMSE). These metrics reflect the model’s predictive ability from different perspectives.

3. Results

The PC experimental platform used in this study is configured as follows: CPU: 13th Gen Intel(R) Core(TM) i9-13900K, sourced from Intel Corporation, Santa Clara, CA, USA; GPU: NVIDIA GeForce RTX 4090, sourced from NVIDIA Corporation, Santa Clara, CA, USA; VRAM: 24GB, Operating System: Ubuntu 20.04.6 LTS. The environment for COLMAP and Nerfstudio was deployed on the PC to reconstruct the walnut orchard point cloud model. Additionally, the PointNet++ environment was set up for semantic segmentation of the walnut orchard point cloud model. A Python 3.8 environment with libraries including numpy, scipy, open3d, matplotlib, and scikit-image was deployed for calculating walnut tree morphological features. The dataset of 492 sets of walnut tree morphological features and yield data was split into training and test sets using stratified sampling with a 7:3 ratio.

3.1. Walnut Orchard Point Cloud Model Acquisition

The walnut orchard point cloud model reconstructed using Nerfstudio [31] is shown in Figure 5. The final point cloud model contains millions of points and clearly represents the macrostructure and data parameters of the walnut orchard, such as tree canopy, terrain, tree height, and tree spacing. The scale information of the walnut orchard point cloud model was restored using the photogrammetry control markers laid out in Figure 2, and the model’s scale accuracy was evaluated. After calculations, the walnut orchard point cloud model achieved centimeter-level accuracy, with the average absolute errors in the vertical, horizontal, and 3D directions being 63 mm, 25 mm, and 71 mm, respectively. The point cloud model of individual walnut trees shows clear outlines and effectively reconstructs the tree canopy structure.

3.2. Semantic Segmentation of the Walnut Tree Point Cloud Model

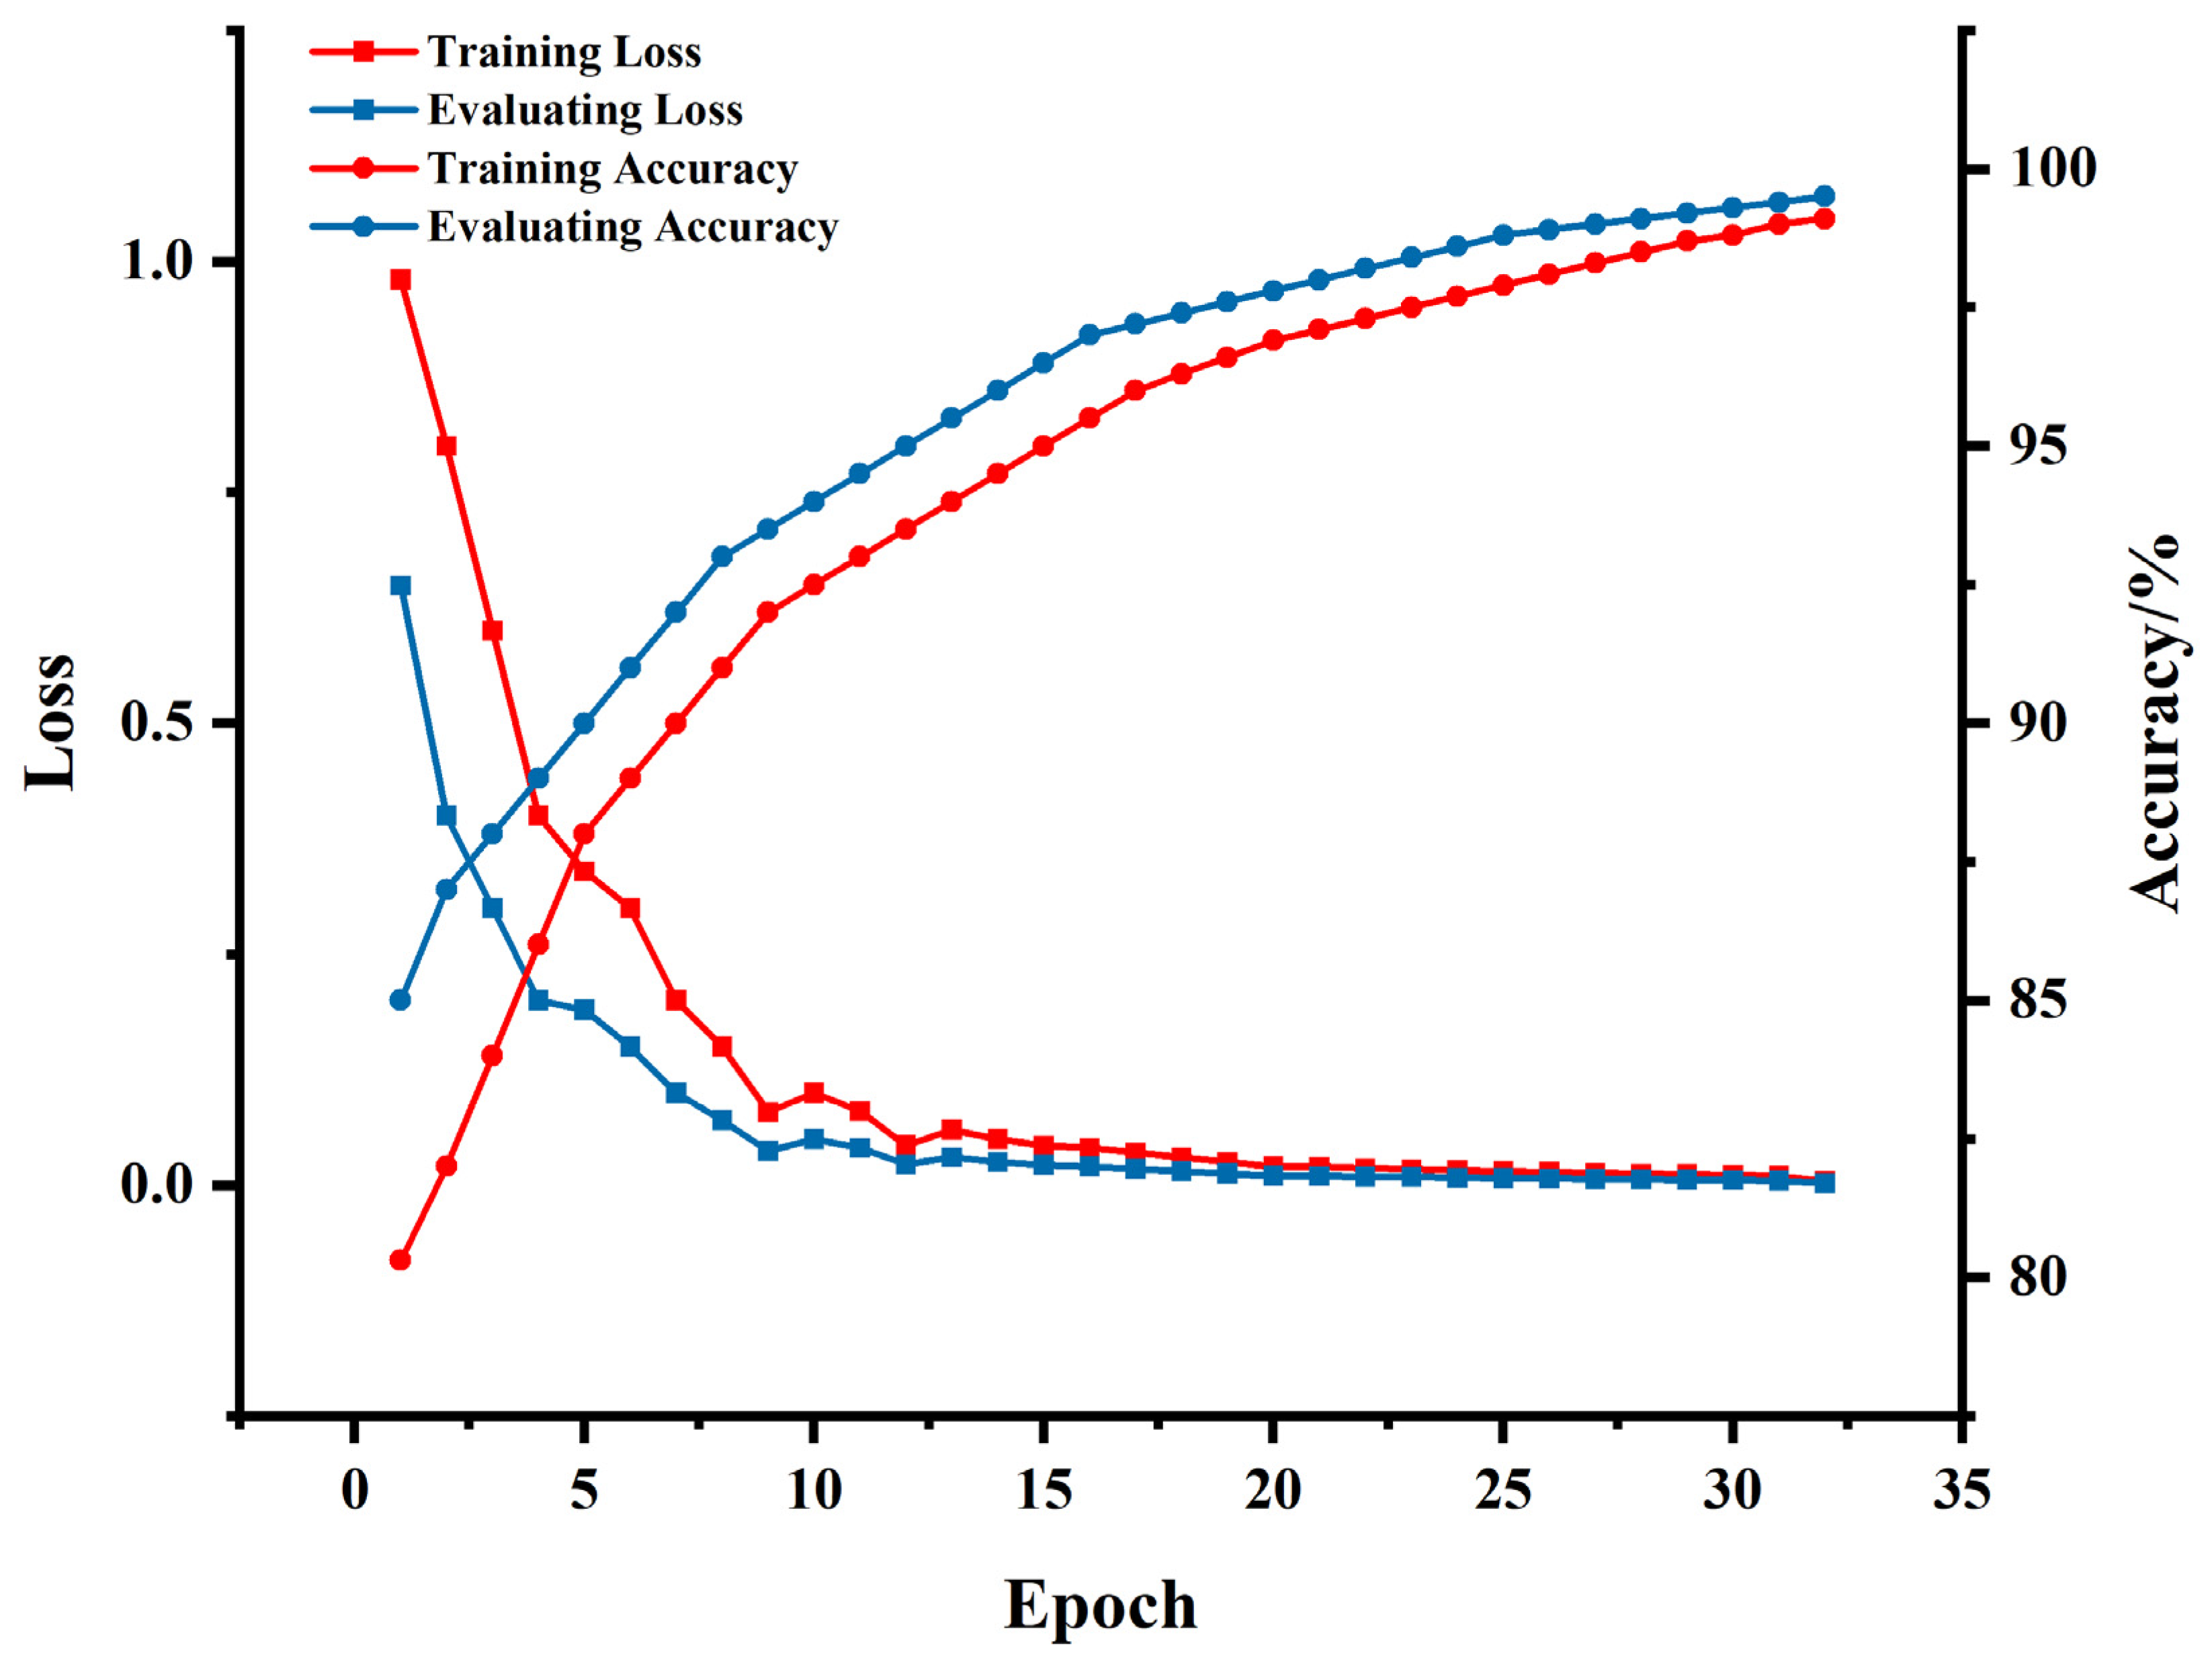
Since the goal of this study is to segment walnut trees from the walnut orchard point cloud data, a single label, “walnut tree”, was assigned, making the model focus on identifying and segmenting this single class. The dataset contains 14,398 training samples and 6410 test samples. The model was trained for 32 epochs using the Adam optimizer with a batch size of 128 and an initial learning rate of 0.001. The training and testing results are shown in Figure 6.
During training, the model exhibited excellent convergence and generalization capabilities. The training loss decreased from 0.9802 ± 0.032 to 0.0042 ± 0.0003, indicating good convergence. Meanwhile, the evaluation loss decreased from 0.6489 ± 0.021 to 0.0019 ± 0.0002, demonstrating that the model performed equally well on the validation set, verifying its good generalization ability. The model achieved an accuracy of 99.1% ± 0.3% on the training set and 99.5% ± 0.2% on the validation set (5-fold cross-validation).
The PointNet++ based walnut orchard point cloud semantic segmentation model demonstrated excellent segmentation precision. Quantitative evaluation showed that the IoU for individual walnut tree segmentation reached 98.7% ± 0.5%. For the single-class segmentation task of the walnut orchard point cloud model, the model performed exceptionally well.

3.3. Distribution of Morphological Features of Individual Walnut Trees

The distribution of walnut tree morphological features in the orchard is shown in Figure 7 and Table 1. The tree height, canopy projection area, and tree volume all exhibit an approximately normal distribution. The range of tree height observations is from 2.23 to 8.56 m, with a median of 5.97 m (IQR = 1.56 m, Q1 = 5.12 m, Q3 = 6.68 m) and an arithmetic mean of 5.87 ± 1.11 m. The range of canopy projection area observations is from 3.63 to 28.60 m2, with a median of 14.15 m2 (IQR = 6.34 m2, Q1 = 11.15 m2, Q3 = 17.49 m2) and an arithmetic mean of 14.44 ± 4.89 m2. The range of tree volume observations is from 4.42 to 57.15 m3, with a median of 22.66 m3 (IQR = 16.71 m3, Q1 = 15.71 m3, Q3 = 32.42 m3) and an arithmetic mean of 24.61 ± 11.73 m3.

3.4. Walnut Tree Yield Model Construction

The results of Pearson correlation analysis are shown in Figure 8. There is a significant linear correlation between the walnut tree morphological parameters and the individual yield (p ≤ 0.01). Specifically, tree volume (V) has a correlation coefficient of 0.86 with yield (L), showing a very strong positive correlation (| r | ≥ 0.8). The canopy projection area (A) follows with a correlation coefficient of 0.70, indicating a strong positive correlation (0.6 ≤ | r | < 0.8). The tree height (H) shows a weaker correlation, with a coefficient of 0.60, but still has a statistically significant moderate positive correlation (0.4 ≤ | r | < 0.6). This gradient relationship suggests that tree volume, which reflects the tree’s ability to capture sunlight and store nutrients in three-dimensional space, has a stronger relationship with yield than the vertical dimension alone.
To predict walnut tree yield, this study used four methods: MLR, SVR, RFR, and XGBoost. These methods were applied to 344 sets of data to build prediction models between walnut tree morphological parameters and individual yield, and the models were evaluated using an additional 148 sets of data. The prediction results of different methods are shown in Figure 9 and Table 2. The results indicate that RF performed the best, with the lowest MAE (2.04 kg), MAPE (17.24%), and RMSE (2.81 kg), and the highest R2 (0.83). XGBoost followed with MAE (2.10 kg) and R2 (0.82). Traditional MLR with MAE (2.79 kg), R2 (0.72) and SVM with MAE (3.09 kg), R2 (0.68) performed relatively weaker. These results suggest that RF is highly effective at capturing the nonlinear relationship between walnut tree morphology and yield, providing a reliable tool for precision agriculture.

4. Discussion

4.1. Advantages and Limitations of Walnut Orchard 3D Point Cloud Modeling

This study achieved centimeter-level accuracy in walnut orchard 3D point cloud reconstruction using the Nerfstudio framework, significantly improving automation and data accuracy compared to traditional manual measurement methods. The accuracy of this method surpasses traditional drone photogrammetry [35,36,37], providing a high-fidelity geometric foundation for individual walnut tree segmentation. However, in complex environmental conditions, the reconstruction quality is easily affected by external factors such as lighting fluctuations, weather changes, and canopy density. Although the PointNet++ model demonstrated excellent performance in single-class segmentation with an IoU of 98.7%, its performance is still limited by point cloud density and scene complexity. In densely planted areas, the occlusion effect caused by overlapping canopies reduces segmentation completeness [38]. Additionally, the high computational resource demand for large-scale orchard data processing remains a technical bottleneck.

4.2. Physiological Mechanisms of Walnut Tree Morphological Features Affecting Yield

In this study, we found that tree volume had a significantly higher correlation ( r = 0.86) with yield than traditional 2D parameters such as canopy projection area ( r = 0.70) and tree height ( r = 0.60), highlighting the critical role of 3D space occupation in walnut photosynthetic product accumulation. From a plant physiology perspective, tree volume not only reflects the canopy leaf area index [39] but also implies the efficiency of the vascular system’s transport and storage capacity. Compared to 2D indicators, it more comprehensively represents the global balance of carbon assimilation and allocation. In contrast, tree height, as a single vertical dimension, does not exhibit the same strong correlation with yield, demonstrating the advantage of 3D space occupation in predicting crop yield. Figure 10 shows the low yield, high yield, and average yield of walnut trees and their tree morphological characteristic parameters and also presents the comparison between the yield predicted by the random forest model based on these parameters and the actual yield. The results validate the biological rationale of using 3D morphological parameters in yield prediction [28], offering a new dimension for fruit tree phenotypic research.

4.3. Comparison of Yield Prediction by Different Methods

The random forest model outperformed traditional linear regression in prediction accuracy [40], with its advantage lying in its ability to effectively capture the nonlinear interactions between tree morphology and yield, especially the synergistic effect of tree volume and canopy [30]. Although XGBoost performed similarly to RF, its sensitivity to hyperparameters may limit its generalization ability in heterogeneous orchard environments. The current model’s limitation lies in the exclusion of environmental covariates such as soil and climate, and theoretical barriers in representing root absorption ability through canopy point clouds. Future work could involve incorporating multi-spectral point cloud data and quantifying intermediate variables like leaf nitrogen content and photosynthetically active radiation to overcome the performance limitations of pure morphological models.
In existing research on walnut yield prediction, Dehghani et al. [7] proposed a model based on tree trunk cross-sectional area, tree characteristics, and environmental factors, which was validated with an R2 of 0.75. However, the prediction accuracy of this model is lower than that of this study (R2 = 0.83). Brauer et al. [8] found a significant positive correlation between the diameter of black walnut trees and their yield, meaning that a larger tree diameter generally results in higher yield. This is consistent with the findings of this study, which show that walnut tree morphological parameters (such as tree height, crown projection area, and tree volume) are positively correlated with yield, with tree volume having the most significant effect. Žalac et al. [9] found that higher tree density leads to higher walnut yield per unit area, but no specific walnut yield prediction method was proposed.
When compared to other agricultural yield prediction studies, Rahman et al. [18] used remote sensing technology combined with an artificial neural network to predict mango orchard fruit yield by analyzing vegetation indices. The highest accuracy achieved was R2 = 0.91 in different orchards and seasons. However, this study only relied on vegetation indices and crown area data, lacking tree structural information such as tree height and volume, and required multiple error evaluation metrics (such as MAE and MAPE) for a comprehensive performance assessment. Fass et al. [16] used a handheld hyperspectral camera combined with machine learning models to predict tomato quality non-destructively, achieving effective predictions for tomato weight (R2 = 0.94). However, this study only applies to harvested tomatoes and cannot predict plant yield. Additionally, it relies on handheld devices, which are less efficient and complex to operate and costly for large-scale applications, limiting its widespread use. Chen et al. [26] used a Faster R-CNN model based on high-resolution aerial imagery to detect and count strawberry flowers and fruits, pointing out that some flowers obstructed by leaves could not be accurately detected, which might affect the final count accuracy. Furthermore, this study focused on specific strawberry varieties under certain conditions (2 m and 3 m shooting height), and its results may not be directly applicable to other crops or strawberry fields under different environmental conditions, limiting the model’s generalization and application range. Maimaitijiang et al. [27] used drone multisensor data fusion and deep learning methods for soybean yield prediction, achieving the highest prediction accuracy (R2 = 0.72) with the DNN-F2 model under various input features. However, the prediction accuracy of this method is lower than that of this study (R2 = 0.83). Chen et al. [28] used drone multisource remote sensing data to extract the morphological and spectral features of apple trees and combined them with ensemble learning models to predict the yield of individual apple trees. The model achieved an R2 of 0.813 on the validation set and 0.758 on the test set, with prediction accuracy lower than this study (R2 = 0.83). Ge et al. [41] used a multi-feature fusion and support vector machine method for apple tree organ classification and yield estimation. However, this method relied on ground-based image data collection, which is less efficient in large-scale or complex terrain orchards and may not provide a comprehensive view of the entire orchard. Lu et al. [42] used a random forest algorithm combined with RGB images and point cloud data obtained from a low-cost drone system to estimate wheat above-ground biomass, achieving an R2 of 0.78. However, this method’s prediction accuracy is lower than that of this study (R2 = 0.83). This study directly associates tree morphological features with yield, making it more suitable for fruit trees and other crops where individual tree characteristics significantly influence yield, while the wheat biomass study focused more on crop growth monitoring and may not be directly applicable to tree or fruit yield prediction.

5. Conclusions

This study proposes a method for predicting walnut yield based on walnut orchard point cloud models. By reconstructing walnut orchard point clouds from UAV images and using point cloud semantic segmentation to extract individual walnut tree point cloud models, the morphological features of walnut trees were further calculated. Combined with statistical models and machine learning methods, a prediction model between walnut tree morphological features and yield was established, achieving prediction accuracy with an MAE of (2.04 kg), an MAPE of (17.24%), an RMSE of (2.81 kg), and an R2 of (0.83). This research has the potential to overcome the limitations of existing technologies, providing an efficient, accurate, and economically feasible solution for walnut yield prediction.
Despite the promising experimental results, there is still room for improvement. Future work could explore automated point cloud segmentation and feature extraction methods based on deep learning, further enhancing the model’s automation and robustness. Additionally, optimizing the model’s structure to adapt to different types of orchards and climate conditions will be a key direction for future research. Finally, incorporating more external environmental factors into the model to establish a multimodal prediction system will enable more precise and comprehensive walnut yield predictions.

Author Contributions

Conceptualization, H.C. and J.C.; methodology, H.C.; software, H.C.; validation, H.C. and J.C.; formal analysis, H.C., J.A., and Y.X.; investigation, H.C. and J.C.; resources, H.C. and J.C.; data curation, H.C. and Y.X.; writing—original draft preparation, H.C.; writing—review and editing, X.B., D.X., and W.L.; visualization, H.C. and J.A.; supervision, W.L.; project administration, W.L.; funding acquisition, W.L. All authors have read and agreed to the published version of the manuscript.

Funding

This work was funded by the National Key Research and Development Program of China, grant number 2018YFD0700601.

Institutional Review Board Statement

Not applicable.

Data Availability Statement

The raw data supporting the conclusions of this article will be made available by the authors upon request.

Conflicts of Interest

The authors declare no conflicts of interest.

References

  1. Nguyen, T.H.; Vu, D.C. A review on phytochemical composition and potential health-promoting properties of walnuts. Food Rev. Int. 2023, 39, 397–423. [Google Scholar] [CrossRef]
  2. Zhu, K.; Ma, J.; Cong, J.; Zhang, T.; Lei, H.; Xu, H.; Luo, Z.; Li, M. The road to reuse of walnut by-products: A comprehensive review of bioactive compounds, extraction and identification methods, biomedical and industrial applications. Trends Food Sci. Technol. 2024, 143, 104264. [Google Scholar] [CrossRef]
  3. Rébufa, C.; Artaud, J.; Le Dréau, Y. Walnut (Juglans regia L.) oil chemical composition depending on variety, locality, extraction process and storage conditions: A comprehensive review. J. Food Compos. Anal. 2022, 110, 104534. [Google Scholar] [CrossRef]
  4. Shigaeva, J.; Darr, D. On the socio-economic importance of natural and planted walnut (Juglans regia L.) forests in the Silk Road countries: A systematic review. For. Policy Econ. 2020, 118, 102233. [Google Scholar] [CrossRef]
  5. Gao, Y.; Hu, J.; Su, X.; Li, Q.; Su, C.; Li, Y.; Ma, G.; Zhang, S.; Yu, X. Extraction, chemical components, bioactive functions and adulteration identification of walnut oils: A review. Grain Oil Sci. Technol. 2024, 7, 30–41. [Google Scholar] [CrossRef]
  6. Shabbir, M.A.; Nawaz, M.F.; Tariq, T.; Khan, M.R.; Saeed, H.; Abdi, G.; Aadil, R.M. Astounding the synergistic interplay of walnuts in combating inflammation and oxidative damage. J. Funct. Foods 2024, 119, 106292. [Google Scholar] [CrossRef]
  7. Hassani, D.; Dastjerdi, R.; Soleimani, A.; Jaffaraghaei, M.; Rezaee, R.; Vahdati, K.; Dehghani, A.; Hadadnejhad, H.; Asefnokhostin, M.; Mozaffari, M.; et al. A model for estimation of the potential yield of walnut trees. Acta Hortic. 2014, 1050, 407–412. [Google Scholar] [CrossRef]
  8. Brauer, D.; Ares, A.; Reid, W.; Thomas, A.; Slusher, J.P. Nut-yield variations and yield–diameter relationships in open-canopy black walnut trees in southern USA. Agrofor. Syst. 2006, 67, 63–72. [Google Scholar] [CrossRef]
  9. Žalac, H.; Burgess, P.; Graves, A.; Giannitsopoulos, M.; Paponja, I.; Popović, B.; Ivezić, V. Modelling the yield and profitability of intercropped walnut systems in Croatia. Agrofor. Syst. 2021, 97, 279–290. [Google Scholar] [CrossRef]
  10. van Klompenburg, T.; Kassahun, A.; Catal, C. Crop yield prediction using machine learning: A systematic literature review. Comput. Electron. Agric. 2020, 177, 105709. [Google Scholar] [CrossRef]
  11. Chlingaryan, A.; Sukkarieh, S.; Whelan, B. Machine learning approaches for crop yield prediction and nitrogen status estimation in precision agriculture: A review. Comput. Electron. Agric. 2018, 151, 61–69. [Google Scholar]
  12. Paudel, D.; Boogaard, H.; de Wit, A.; Janssen, S.; Osinga, S.; Pylianidis, C.; Athanasiadis, I.N. Machine learning for large-scale crop yield forecasting. Agric. Syst. 2021, 187, 103016. [Google Scholar] [CrossRef]
  13. Farjon, G.; Huijun, L.; Edan, Y. Deep-learning-based counting methods, datasets, and applications in agriculture: A review. Precis. Agric. 2023, 24, 1683–1711. [Google Scholar] [CrossRef]
  14. Olson, D.; Anderson, J. Review on unmanned aerial vehicles, remote sensors, imagery processing, and their applications in agriculture. Agron. J. 2021, 113, 971–992. [Google Scholar] [CrossRef]
  15. Zamani-Noor, N.; Feistkorn, D. Monitoring growth status of winter oilseed rape by NDVI and NDYI derived from UAV-based Red–Green–Blue imagery. Agronomy 2022, 12, 2212. [Google Scholar] [CrossRef]
  16. Fass, E.; Shlomi, E.; Ziv, C.; Glickman, O.; Helman, D. Machine learning models based on hyperspectral imaging for pre-harvest tomato fruit quality monitoring. Comput. Electron. Agric. 2024, 229, 109788. [Google Scholar] [CrossRef]
  17. Chuquimarca, L.E.; Vintimilla, B.X.; Velastin, S.A. A review of external quality inspection for fruit grading using CNN models. Artif. Intell. Agric. 2024, 14, 1–20. [Google Scholar] [CrossRef]
  18. Rahman, M.M.; Robson, A.; Bristow, M. Exploring the potential of high resolution worldview-3 Imagery for estimating yield of mango. Remote. Sens. 2018, 10, 1866. [Google Scholar] [CrossRef]
  19. Jin, Z.; Azzari, G.; Lobell, D.B. Improving the accuracy of satellite-based high-resolution yield estimation: A test of multiple scalable approaches. Agric. For. Meteorol. 2017, 247, 207–220. [Google Scholar] [CrossRef]
  20. Ye, X.; Sakai, K.; Manago, M.; Asada, S.-I.; Sasao, A. Prediction of citrus yield from airborne hyperspectral imagery. Precis. Agric. 2007, 8, 111–125. [Google Scholar] [CrossRef]
  21. Aghighi, H.; Azadbakht, M.; Ashourloo, D.; Shahrabi, H.S.; Radiom, S. Machine learning regression techniques for the silage maize yield prediction using time-series images of Landsat 8 OLI. IEEE J. Sel. Top. Appl. Earth Obs. Remote Sens. 2018, 11, 4563–4577. [Google Scholar] [CrossRef]
  22. Kuwata, K.; Shibasaki, R. Estimating corn yield in the united states with modis evi and machine learning methods. ISPRS Ann. Photogramm. Remote Sens. Spat. Inf. Sci. 2016, 3, 131–136. [Google Scholar] [CrossRef]
  23. Hong, Y.; Ma, R.; Li, C.; Shao, C.; Huang, J.; Zeng, Y.; Chen, Y. Three-dimensional localization and mapping of multiagricultural scenes via hierarchically-coupled LiDAR-inertial odometry. Comput. Electron. Agric. 2024, 227, 109487. [Google Scholar] [CrossRef]
  24. Song, H.; Wen, W.; Wu, S.; Guo, X. Comprehensive review on 3D point cloud segmentation in plants. Artif. Intell. Agric. 2025, 15, 296–315. [Google Scholar] [CrossRef]
  25. He, L.; Fang, W.; Zhao, G.; Wu, Z.; Fu, L.; Li, R.; Majeed, Y.; Dhupia, J. Fruit yield prediction and estimation in orchards: A state-of-the-art comprehensive review for both direct and indirect methods. Comput. Electron. Agric. 2022, 195, 106812. [Google Scholar] [CrossRef]
  26. Chen, Y.; Lee, W.S.; Gan, H.; Peres, N.; Fraisse, C.; Zhang, Y.; He, Y. Strawberry yield prediction based on a deep neural network using high-resolution aerial orthoimages. Remote Sens. 2019, 11, 1584. [Google Scholar] [CrossRef]
  27. Maimaitijiang, M.; Sagan, V.; Sidike, P.; Hartling, S.; Esposito, F.; Fritschi, F.B. Soybean yield prediction from UAV using multimodal data fusion and deep learning. Remote Sens. Environ. 2020, 237, 111599. [Google Scholar] [CrossRef]
  28. Chen, R.; Zhang, C.; Xu, B.; Zhu, Y.; Zhao, F.; Han, S.; Yang, G.; Yang, H. Predicting individual apple tree yield using UAV multi-source remote sensing data and ensemble learning. Comput. Electron. Agric. 2022, 201, 107275. [Google Scholar] [CrossRef]
  29. Choudhury, M.R.; Das, S.; Christopher, J.; Apan, A.; Chapman, S.; Menzies, N.W.; Dang, Y.P. Improving biomass and grain yield prediction of wheat genotypes on sodic soil using integrated high-resolution multispectral, hyperspectral, 3D point cloud, and machine learning techniques. Remote. Sens. 2021, 13, 3482. [Google Scholar] [CrossRef]
  30. Tesfaye, A.A.; Osgood, D.; Aweke, B.G. Combining machine learning, space-time cloud restoration and phenology for farm-level wheat yield prediction. Artif. Intell. Agric. 2021, 5, 208–222. [Google Scholar] [CrossRef]
  31. Tancik, M.; Weber, E.; Ng, E.; Li, R.; Yi, B.; Wang, T.; Kristoffersen, A.; Austin, J.; Salahi, K.; Ahuja, A.; et al. Nerfstudio: A modular framework for neural radiance field development. In Proceedings of the SIGGRAPH ′23: Special Interest Group on Computer Graphics and Interactive Techniques Conference, Los Angeles, CA, USA, 6–10 August 2023; pp. 1–12. [Google Scholar]
  32. Schonberger, J.L.; Frahm, J.-M. Structure-from-motion revisited. In Proceedings of the IEEE Conference on Computer Vision and Pattern Recognition, Las Vegas, NV, USA, 27 June–2 July 2016; pp. 4104–4113. [Google Scholar] [CrossRef]
  33. Qi, C.R.; Yi, L.; Su, H.; Guibas, L. Pointnet++: Deep hierarchical feature learning on point sets in a metric space. Adv. Neural Inf. Process. Syst. 2017, 30. [Google Scholar] [CrossRef]
  34. Qi, C.R.; Su, H.; Mo, K.; Guibas, L.J. Pointnet: Deep learning on point sets for 3d classification and segmentation. In Proceedings of the IEEE Conference on Computer Vision and Pattern Recognition, Honolulu, HI, USA, 21–26 July 2017; pp. 652–660. [Google Scholar] [CrossRef]
  35. Van der Sluijs, J.; Saiet, E.; Fraser, R.; Kokelj, S.V.; Bakelaar, C. Validation of beyond visual-line-of-sight drone photogrammetry for terrain and canopy height applications. Remote Sens. Appl. Soc. Environ. 2024, 35, 101266. [Google Scholar] [CrossRef]
  36. Valluvan, A.B.; Raj, R.; Pingale, R.; Jagarlapudi, A. Canopy height estimation using drone-based RGB images. Smart Agric. Technol. 2023, 4, 100145. [Google Scholar] [CrossRef]
  37. Rayamajhi, A.; Jahanifar, H.; Mahmud, S. Measuring ornamental tree canopy attributes for precision spraying using drone technology and self-supervised segmentation. Comput. Electron. Agric. 2024, 225, 109359. [Google Scholar] [CrossRef]
  38. Su, J.; Zhu, X.; Li, S.; Chen, W.-H. AI meets UAVs: A survey on AI empowered UAV perception systems for precision agriculture. Neurocomputing 2023, 518, 242–270. [Google Scholar] [CrossRef]
  39. Gavilán-Acuna, G.; Coops, N.C.; Tompalski, P.; Mena-Quijada, P.; Varhola, A.; Roeser, D.; Olmedo, G.F. Characterizing annual leaf area index changes and volume growth using ALS and satellite data in forest plantations. Sci. Remote Sens. 2024, 10, 100159. [Google Scholar] [CrossRef]
  40. Trentin, C.; Ampatzidis, Y.; Lacerda, C.; Shiratsuchi, L. Tree crop yield estimation and prediction using remote sensing and machine learning: A systematic review. Smart Agric. Technol. 2024, 9, 100556. [Google Scholar] [CrossRef]
  41. Ge, L.; Zou, K.; Zhou, H.; Yu, X.; Tan, Y.; Zhang, C.; Li, W. Three dimensional apple tree organs classification and yield estimation algorithm based on multi-features fusion and support vector machine. Inf. Process. Agric. 2022, 9, 431–442. [Google Scholar] [CrossRef]
  42. Lu, N.; Zhou, J.; Han, Z.; Li, D.; Cao, Q.; Yao, X.; Tian, Y.; Zhu, Y.; Cao, W.; Cheng, T. Improved estimation of aboveground biomass in wheat from RGB imagery and point cloud data acquired with a low-cost unmanned aerial vehicle system. Plant Methods 2019, 15, 1–16. [Google Scholar] [CrossRef]
Figure 1. Red circles indicate walnuts at maturity.
Agriculture 15 00775 g001
Figure 2. (a) UAV and experimental area terrain information; (b) photogrammetry control markers; (c) harvest machine; (d) yield measurement of individual walnut trees; (e) yield distribution of individual walnut trees.
Agriculture 15 00775 g002
Figure 3. Walnut orchard point cloud model reconstruction process.
Agriculture 15 00775 g003
Figure 4. Walnut tree morphological feature calculation.
Agriculture 15 00775 g004
Figure 5. Reconstruction results of point cloud model of walnut orchard and single walnut tree.
Agriculture 15 00775 g005
Figure 6. Walnut orchard point cloud semantic segmentation model evaluation metrics and epoch relationship curve.
Agriculture 15 00775 g006
Figure 7. Distribution of morphological features of individual walnut trees.
Agriculture 15 00775 g007
Figure 8. Correlation between walnut tree morphological parameters and yield. H, A, V, and L represent the tree height, crown projection area, volume, and yield of walnut, respectively. ** p ≤ 0.01.
Agriculture 15 00775 g008
Figure 9. (ad) represent the cross-validation scatter plots of MLR, SVR, RFR and XGBoost methods to predict the yield and actual yield of a single walnut plant, respectively. The red dotted line represents the ideal case where the predicted value equals the actual value.
Agriculture 15 00775 g009
Figure 10. The characteristic parameters of walnut trees with low yield, high yield, and average yield and the comparison of yield predicted by the random forest model with actual yield. H, A, V, and L represent the tree height, crown projection area, volume, and yield of walnut, respectively.
Agriculture 15 00775 g010
Table 1. Distribution results of morphological features of individual walnut trees.
Tree FeatureMin.Max.MedianIQRQ1Q3MeanSD
H (m)2.238.565.971.565.126.685.871.11
A (m2)3.6328.6014.156.3411.1517.4914.444.89
V (m3)4.4257.1522.6616.7115.7132.4224.6111.73
H: tree height; A: canopy projection area; V: tree volume; IQR: interquartile range; Q1: first quartile; Q3: third quartile; SD: standard deviation.
Table 2. Walnut yield prediction results for different methods.
MethodMAE (kg)MAPE (%)RMSE (kg)R2
MLR2.7923.973.630.72
SVR3.0927.123.900.68
RFR2.0417.242.810.83
XGBoost2.1018.562.920.82
Disclaimer/Publisher’s Note: The statements, opinions and data contained in all publications are solely those of the individual author(s) and contributor(s) and not of MDPI and/or the editor(s). MDPI and/or the editor(s) disclaim responsibility for any injury to people or property resulting from any ideas, methods, instructions or products referred to in the content.