Abstract
In response to the challenge of low detection and positioning accuracy for safflower corollas during field operations, we propose a deep learning-based object detection and positioning algorithm called the Mobile Safflower Detection and Position Network (MSDP-Net). This approach is designed to overcome issues related to the small size of safflower corollas and their tendency to be occluded in complex agricultural environments. For object detection, we introduce an improved YOLO v5m model, referred to as C-YOLO v5m, which integrates a Convolutional Block Attention Module (CBAM) into both the backbone and neck networks. This modification enhances the model’s ability to focus on key features, resulting in increases in the precision, recall, and mean average precision of 4.98%, 4.3%, and 5.5%, respectively. For spatial positioning, we propose a mobile camera-based method in which a binocular camera is mounted on a translation stage, enabling horizontal movement that maintains optimal positioning accuracy and mitigates occlusion issues. Field experiments demonstrate that this mobile positioning method achieves a success rate of 93.79% with average deviations of less than 3 mm in the X, Y, and Z directions. Moreover, comparisons with five mainstream object detection algorithms reveal that MSDP-Net offers superior overall performance, making it highly suitable for safflower corolla detection. Finally, when applied to our self-developed safflower harvesting robot, 500 indoor trial tests achieved a harvest success rate of 90.20%, and field tests along a 15 m row confirmed a success rate above 90%, thereby validating the effectiveness of the proposed methods.
1. Introduction
Safflower is a globally significant specialty economic crop. The global planting area of safflower is 8 × 10⁵ hm2, with a yield of 6.5 × 10⁵ tons [1]. According to data from the Food and Agriculture Organization of the United Nations, China is one of the major consumers of safflower, with both its planting area and yield ranking among the top in the world [2]. The growth stages of safflower are very unique. It undergoes three separate flowering phases, with varying amounts of flowers produced in each phase. The first phase accounts for approximately 60% of the total yield, while the second and third phases each contribute about 20%. The flowering interval between each phase is around 4 to 5 days [3]. Additionally, if the safflower flowers are not harvested promptly after blooming, they will quickly enter the wilting stage within 2 to 3 days, resulting in a decrease in the quality of the flower filaments [4]. The multi-phase flowering characteristic of safflower means it cannot be harvested in one go using machinery, as is the case with traditional economic crops. Therefore, safflower harvesting is still largely dependent on manual labor, which significantly affects harvesting efficiency. As a result, the development and application of safflower harvesting robots is an urgent necessity [5,6].
The safflower corolla object detection and position system, as the “eyes” of the harvesting robot, directly affects the overall performance of the robot system. Currently, most object detection methods for flowers rely on traditional techniques, which involve using the flower’s color and shape information to manually extract image features for flower image segmentation [7,8,9,10,11]. With the rapid development of deep learning technologies, deep learning-based object detection methods have been widely applied in the field of flower object detection. Deep learning-based object detection algorithms are mainly divided into two categories: two-stage and one-stage algorithms. The two-stage algorithms divide the detection task into two steps: first, generating candidate boxes, and then, recognizing and classifying the objects within the candidate boxes. Williams et al. [12] used a deep learning method and trained a model on a kiwi flower dataset using the Faster RCNN (Regions with Convolutional Neural Network Features) algorithm. The resulting model achieved an average accuracy of 85.3%. Dias et al. [13] used a flower object detection technique that is robust to clutter and changes in lighting conditions, adjusting a deep convolutional neural network. The trained model achieved both accuracy and recall rates higher than 90.0%. Farjon et al. [14] utilized an improved Faster R-CNN model with enhanced anchor boxes for detecting apple flowers, achieving an average detection accuracy of 68%. Gogul et al. [15] developed a flower recognition system based on a CNN and transfer learning, reaching a Rank-1 accuracy of 82.32% on their flower dataset. Zhao et al. [16] introduced a cascaded CNN-based detection method for the tomato flowering phase, achieving an accuracy of 76.67% in a greenhouse setting. Xia et al. [17] proposed a Faster R-CNN classification detection model with attention and multiscale feature fusion. The accuracy of detecting hydroponic kale buds with different maturity levels could be maintained above 90%. One-stage detection algorithms combine the detection tasks into a single process, directly providing the object detection boxes. The main examples of this are the SSD series and YOLO series algorithms. Tian et al. [18] employed the SSD (Single-Shot Multibox Detector) deep learning method, training with the flower datasets VOC2007 and VOC2012 published by Oxford University. The average accuracy for the former was 83.6%, and for the latter, it was 87.0%, with the ability to detect multiple target flowers. Zhao et al. [19] replaced the convolution blocks in the backbone network of YOLOv5s with the convolution blocks from the RepVGG block structure to improve the feature representation ability of YOLOv5s through a multi-branch structure, further improving the accuracy and robustness of detection. The results showed that the average accuracy of the improved CR-YOLOv5s was as high as 93.9%.
The above studies demonstrate the application of deep learning-based object detection methods in plant flowers and provide a reference for safflower corolla object detection. However, compared to the flowers in the aforementioned studies, the safflower corolla is very small in size, irregular in shape, and densely distributed, which creates significant challenges for the detection task. Additionally, a major issue with the methods mentioned above when applied in field environments is the poor anti-glare performance of image acquisition equipment. Direct sunlight, cloud cover, or changes in time of day can all affect the accuracy and efficiency of object detection. Furthermore, these methods do not account for occlusion and interference from surrounding objects in the field environment. The safflower corolla has many unique characteristics in object detection tasks, and practical operations face the following challenges: First, the safflower corolla is small and densely distributed, and most object detection models perform poorly when handling small-sized objects [20,21]. Second, the field environment is highly complex, with safflower plants growing in a disordered and dense manner, causing the corolla to be occluded by branches and leaves, leading to missed detections. Third, due to limitations in field lighting conditions, the imaging quality of safflower corolla images may be affected, leading to false detections.
To address the aforementioned issues, we propose an object detection and spatial positioning algorithm for safflower corolla—MSDP-Net—which consists of two components: object detection and spatial positioning. In the object detection phase, we optimized the YOLO v5m model by inserting a CBAM (Convolutional Block Attention Module) into both the backbone network and neck network of YOLO v5m. This adaptive adjustment of the input feature maps enhances the model’s detection performance and generalization ability. In the spatial positioning phase, we propose a dynamic perspective adjustment-based occlusion mitigation method. By mounting a binocular camera on a ball screw translation table and enabling horizontal movement to adjust the recognition angle, we can capture corolla images from different angles. Changing the viewpoint reduces plant occlusion of the corolla, thus improving the accuracy of spatial positioning. The main contributions of this study are as follows:
- (1)
- We propose and optimize a YOLO v5m-based object detection model to improve the detection accuracy of safflower corollas in complex field environments, thereby addressing challenges such as densely planted safflowers, small corollas, and occlusion.
- (2)
- We also introduce a dynamic viewpoint adjustment technique, which adjusts the perspective during image acquisition to reduce the occlusion of safflower corollas by plant branches and leaves, thereby enhancing the reliability of object detection and the accuracy of spatial positioning.
- (3)
- The MSDP-Net algorithm and dynamic viewpoint adjustment method are integrated into our self-developed safflower corolla harvesting robot system. Laboratory and field tests validate the effectiveness, stability, and efficiency of the proposed methods in real-world applications.
2. Materials and Methods
2.1. Safflower Corolla Color Analysis
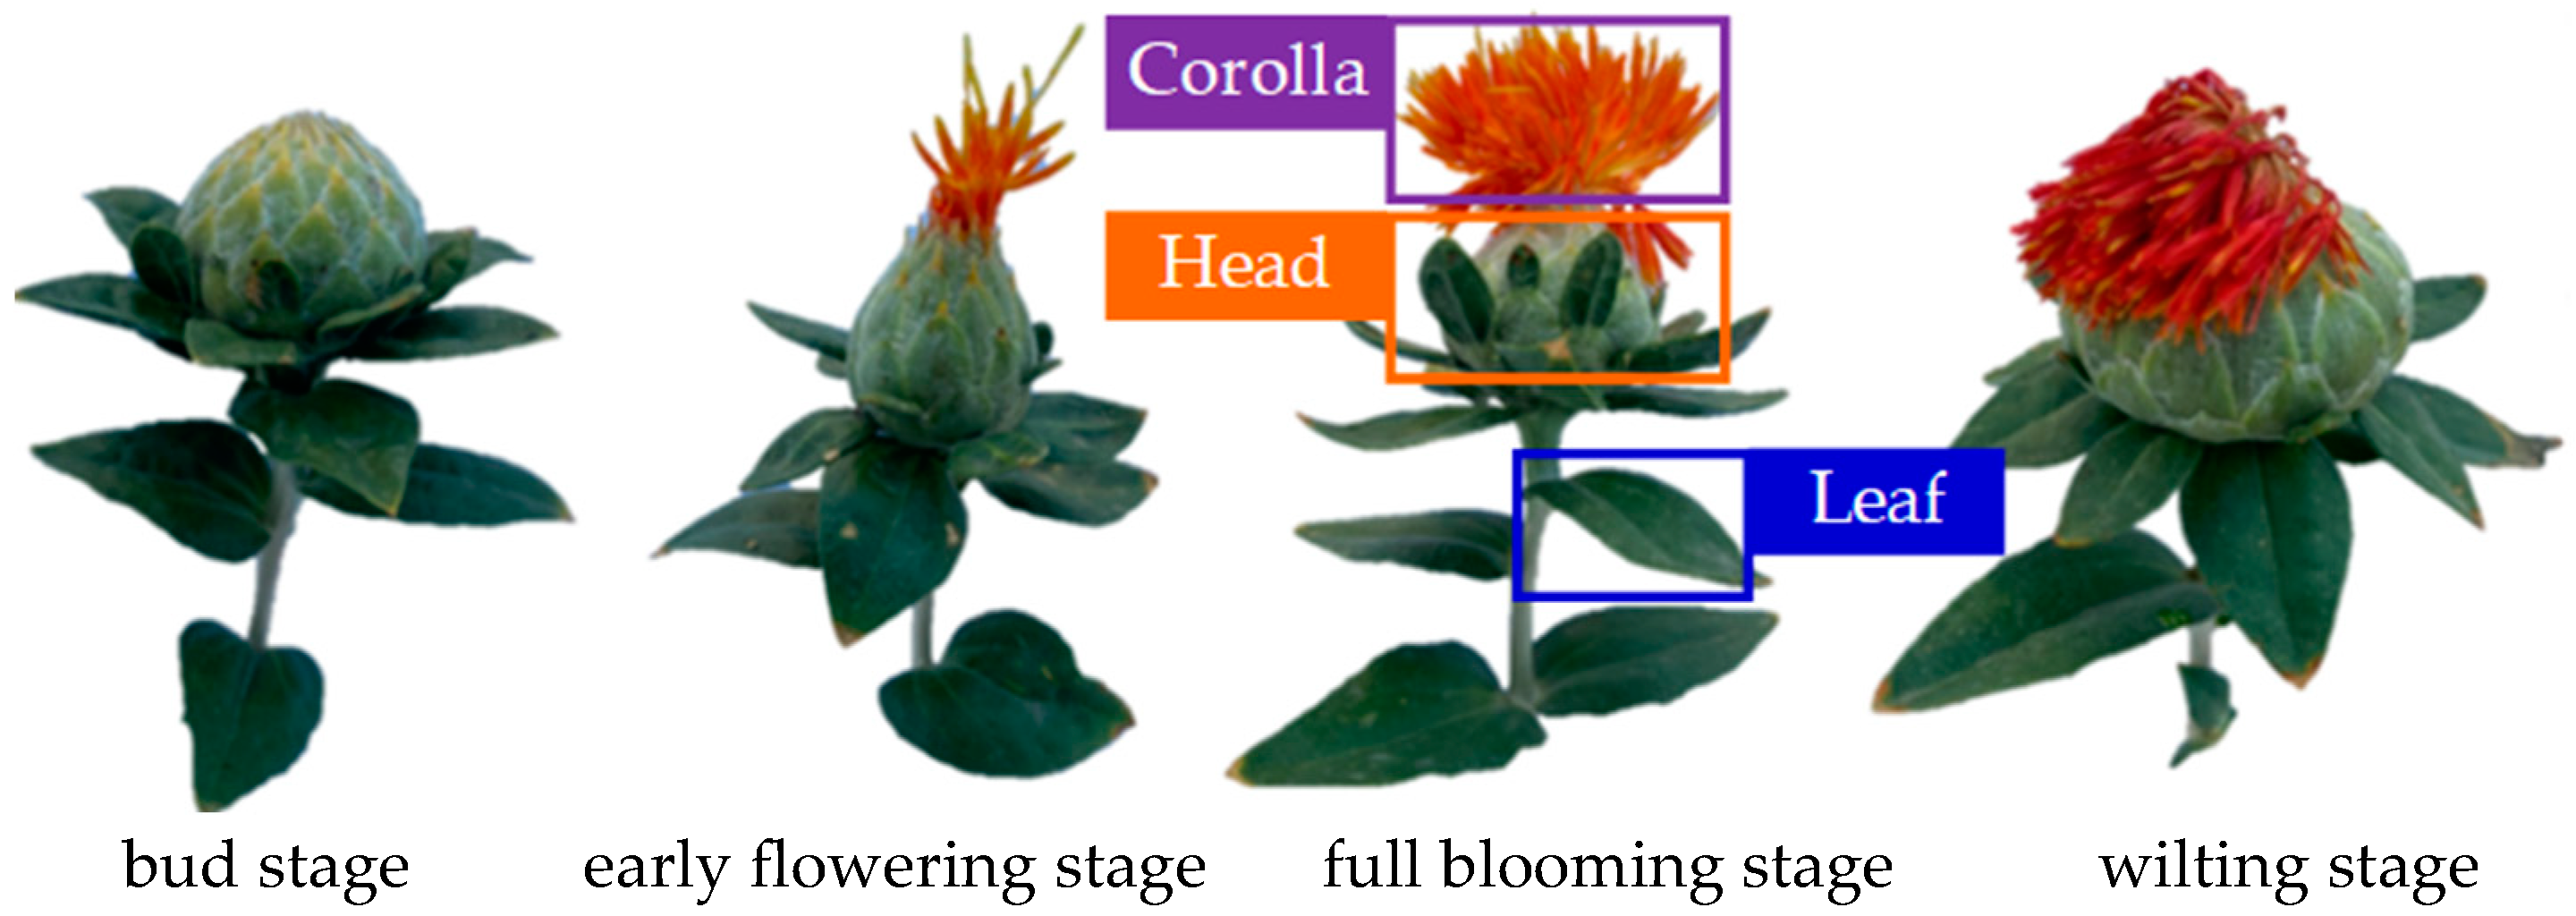
Related scholars divide the safflower growth period into four stages—bud stage, early flowering stage, full blooming stage, and wilting stage [22]—as shown in Figure 1. The corolla color varies significantly across different flowering periods. Taking the “Jihong No. 1” variety of safflower as an example, the corolla in the early flowering stage is yellowish and relatively light in color. After a period of growth, the corolla color deepens during the full blooming stage, becoming more orange-red in color, and the corolla diameter increases, becoming more plump. After further growth, the safflower enters the wilting stage, and the corolla color deepens even more, approaching dark red. As shown in Figure 1, the corolla is very small during the early flowering stage. Harvesting at this stage would result in limited yield. In the wilting stage, the safflower corolla has already withered, and the boundary between the corolla and the flower head is unclear, making it difficult for the harvesting robotic arm to pick it. Therefore, the full blooming stage is the optimal period for safflower corolla harvesting, meeting both the robot’s harvesting conditions and economic benefits.
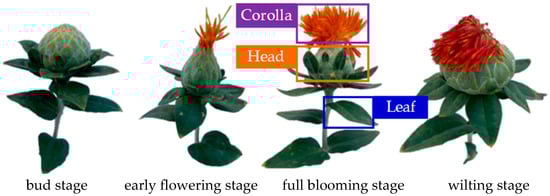
Figure 1.
Safflower corolla in different flowering stages.
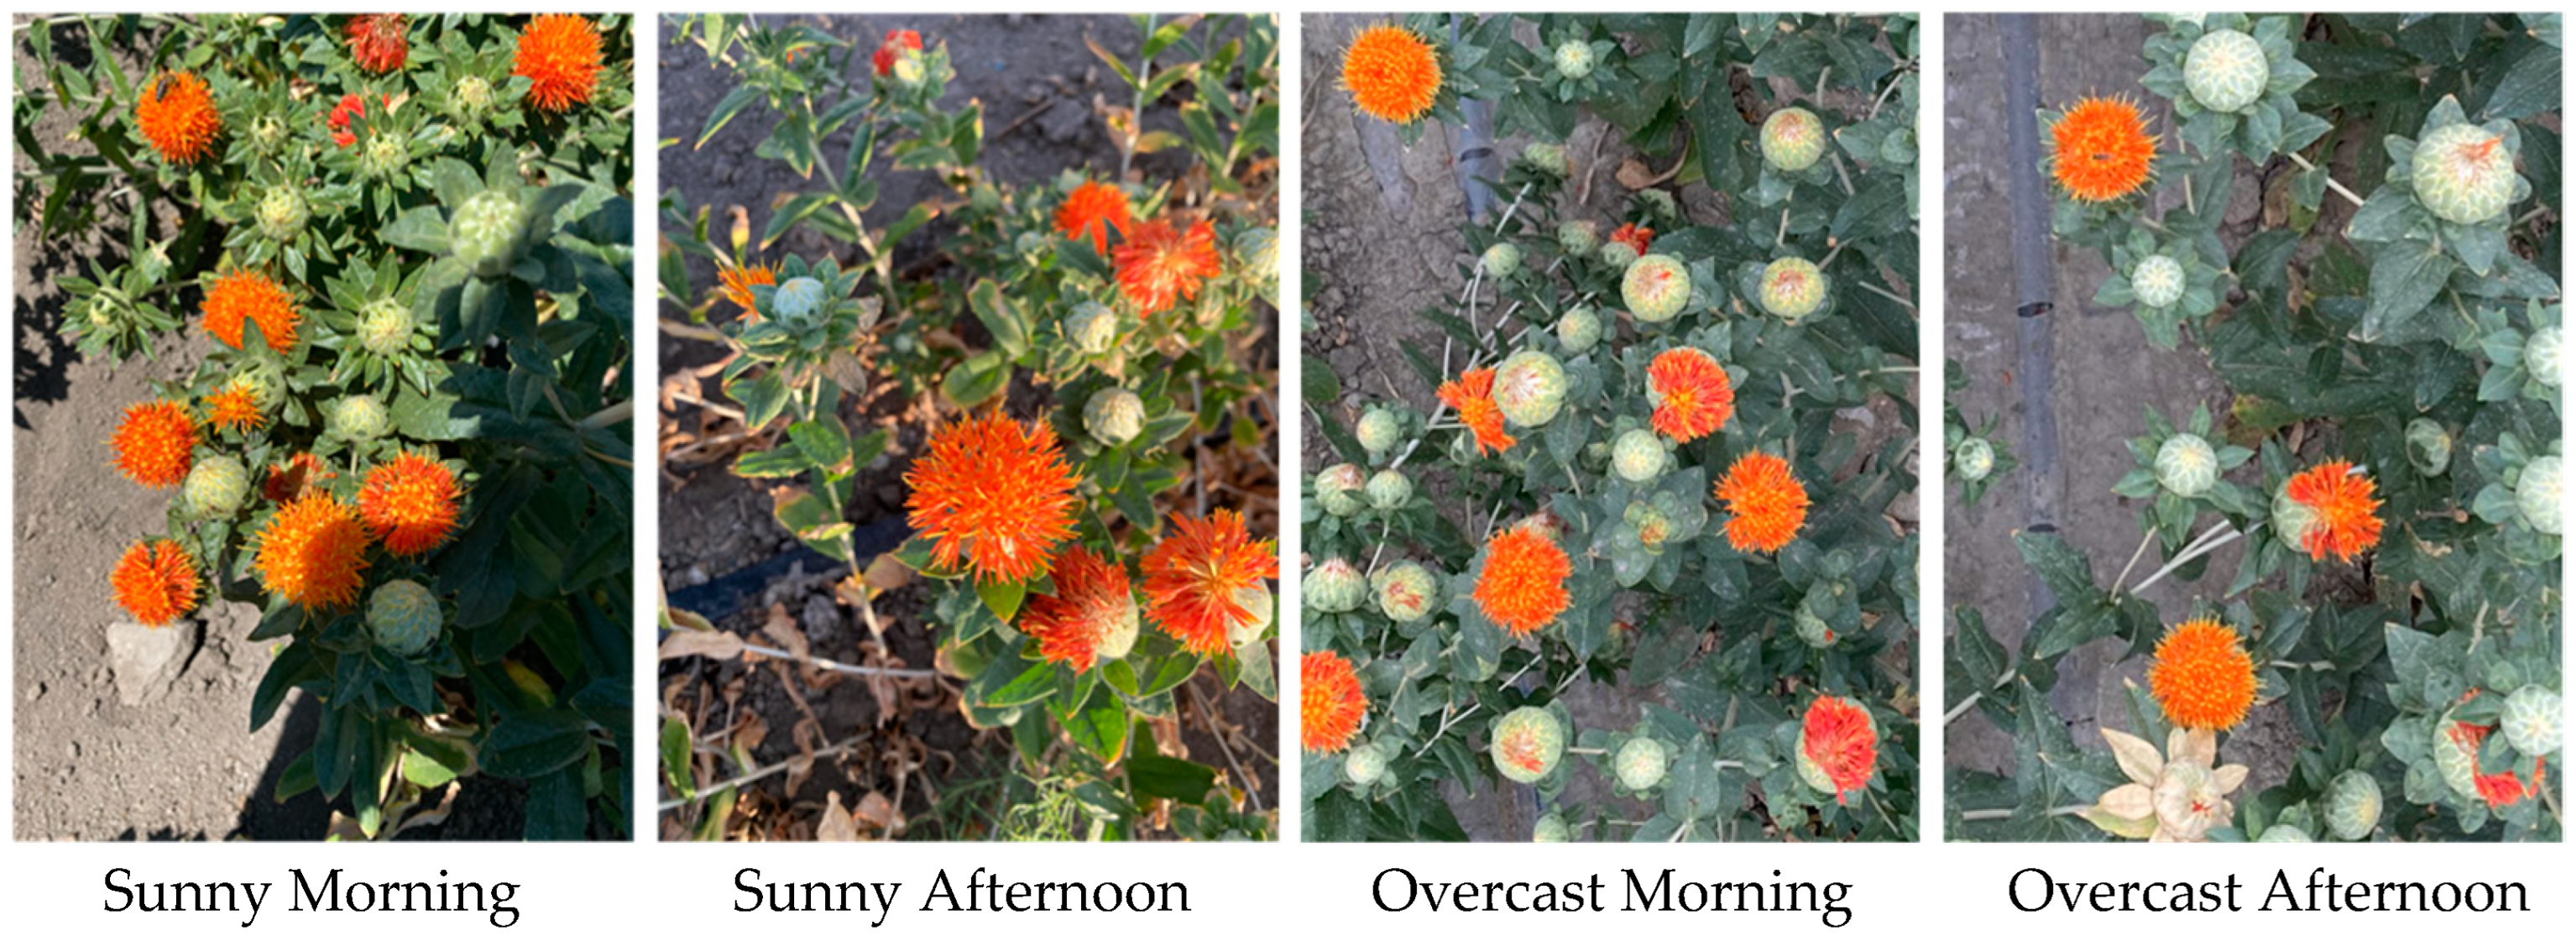
Additionally, in the safflower plantation, under natural lighting, the safflower corolla exhibits different color characteristics at different times of the day and under different weather conditions, as shown in Figure 2.
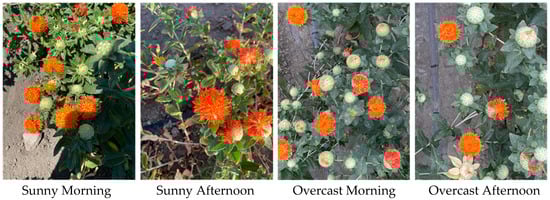
Figure 2.
Safflower images in different weather and time periods.
The results of the safflower corolla color analysis show that the corolla characteristics vary with flowering stage, time of day, and weather conditions. To enhance the generalization ability of the safflower corolla detection model, a comprehensive data collection method was adopted to ensure that the corolla color reflects the response to different environmental factors. This approach not only enriched the data dimensions but also provided a solid sample foundation for subsequent model training.
2.2. Dataset Construction
The image collection site is located at the safflower plantation base in Jimsar County, Xinjiang Province. The ZED2 camera (Stereolabs, San Francisco, CA, USA) was selected for image capture. It has a maximum resolution of 1920 × 1080 pixels, a depth measurement range of 0.2–15 m, a horizontal field of view of 110°, and a vertical field of view of 70°, with a maximum frame rate of 200 frames per second. Additionally, the camera is equipped with an internal nine-axis inertial measurement unit (IMU), environmental temperature sensor, magnetometer, and barometer, which provide more accurate scene analysis and spatial positioning, meeting the requirements for safflower corolla image collection quality. Images were captured at angles between 0° and 60° relative to the ground along the camera’s optical axis. Different weather conditions and time periods were selected, with image collection occurring once every hour from 6 a.m. to 8 p.m. on both sunny and overcast days, yielding a total of 3200 images.
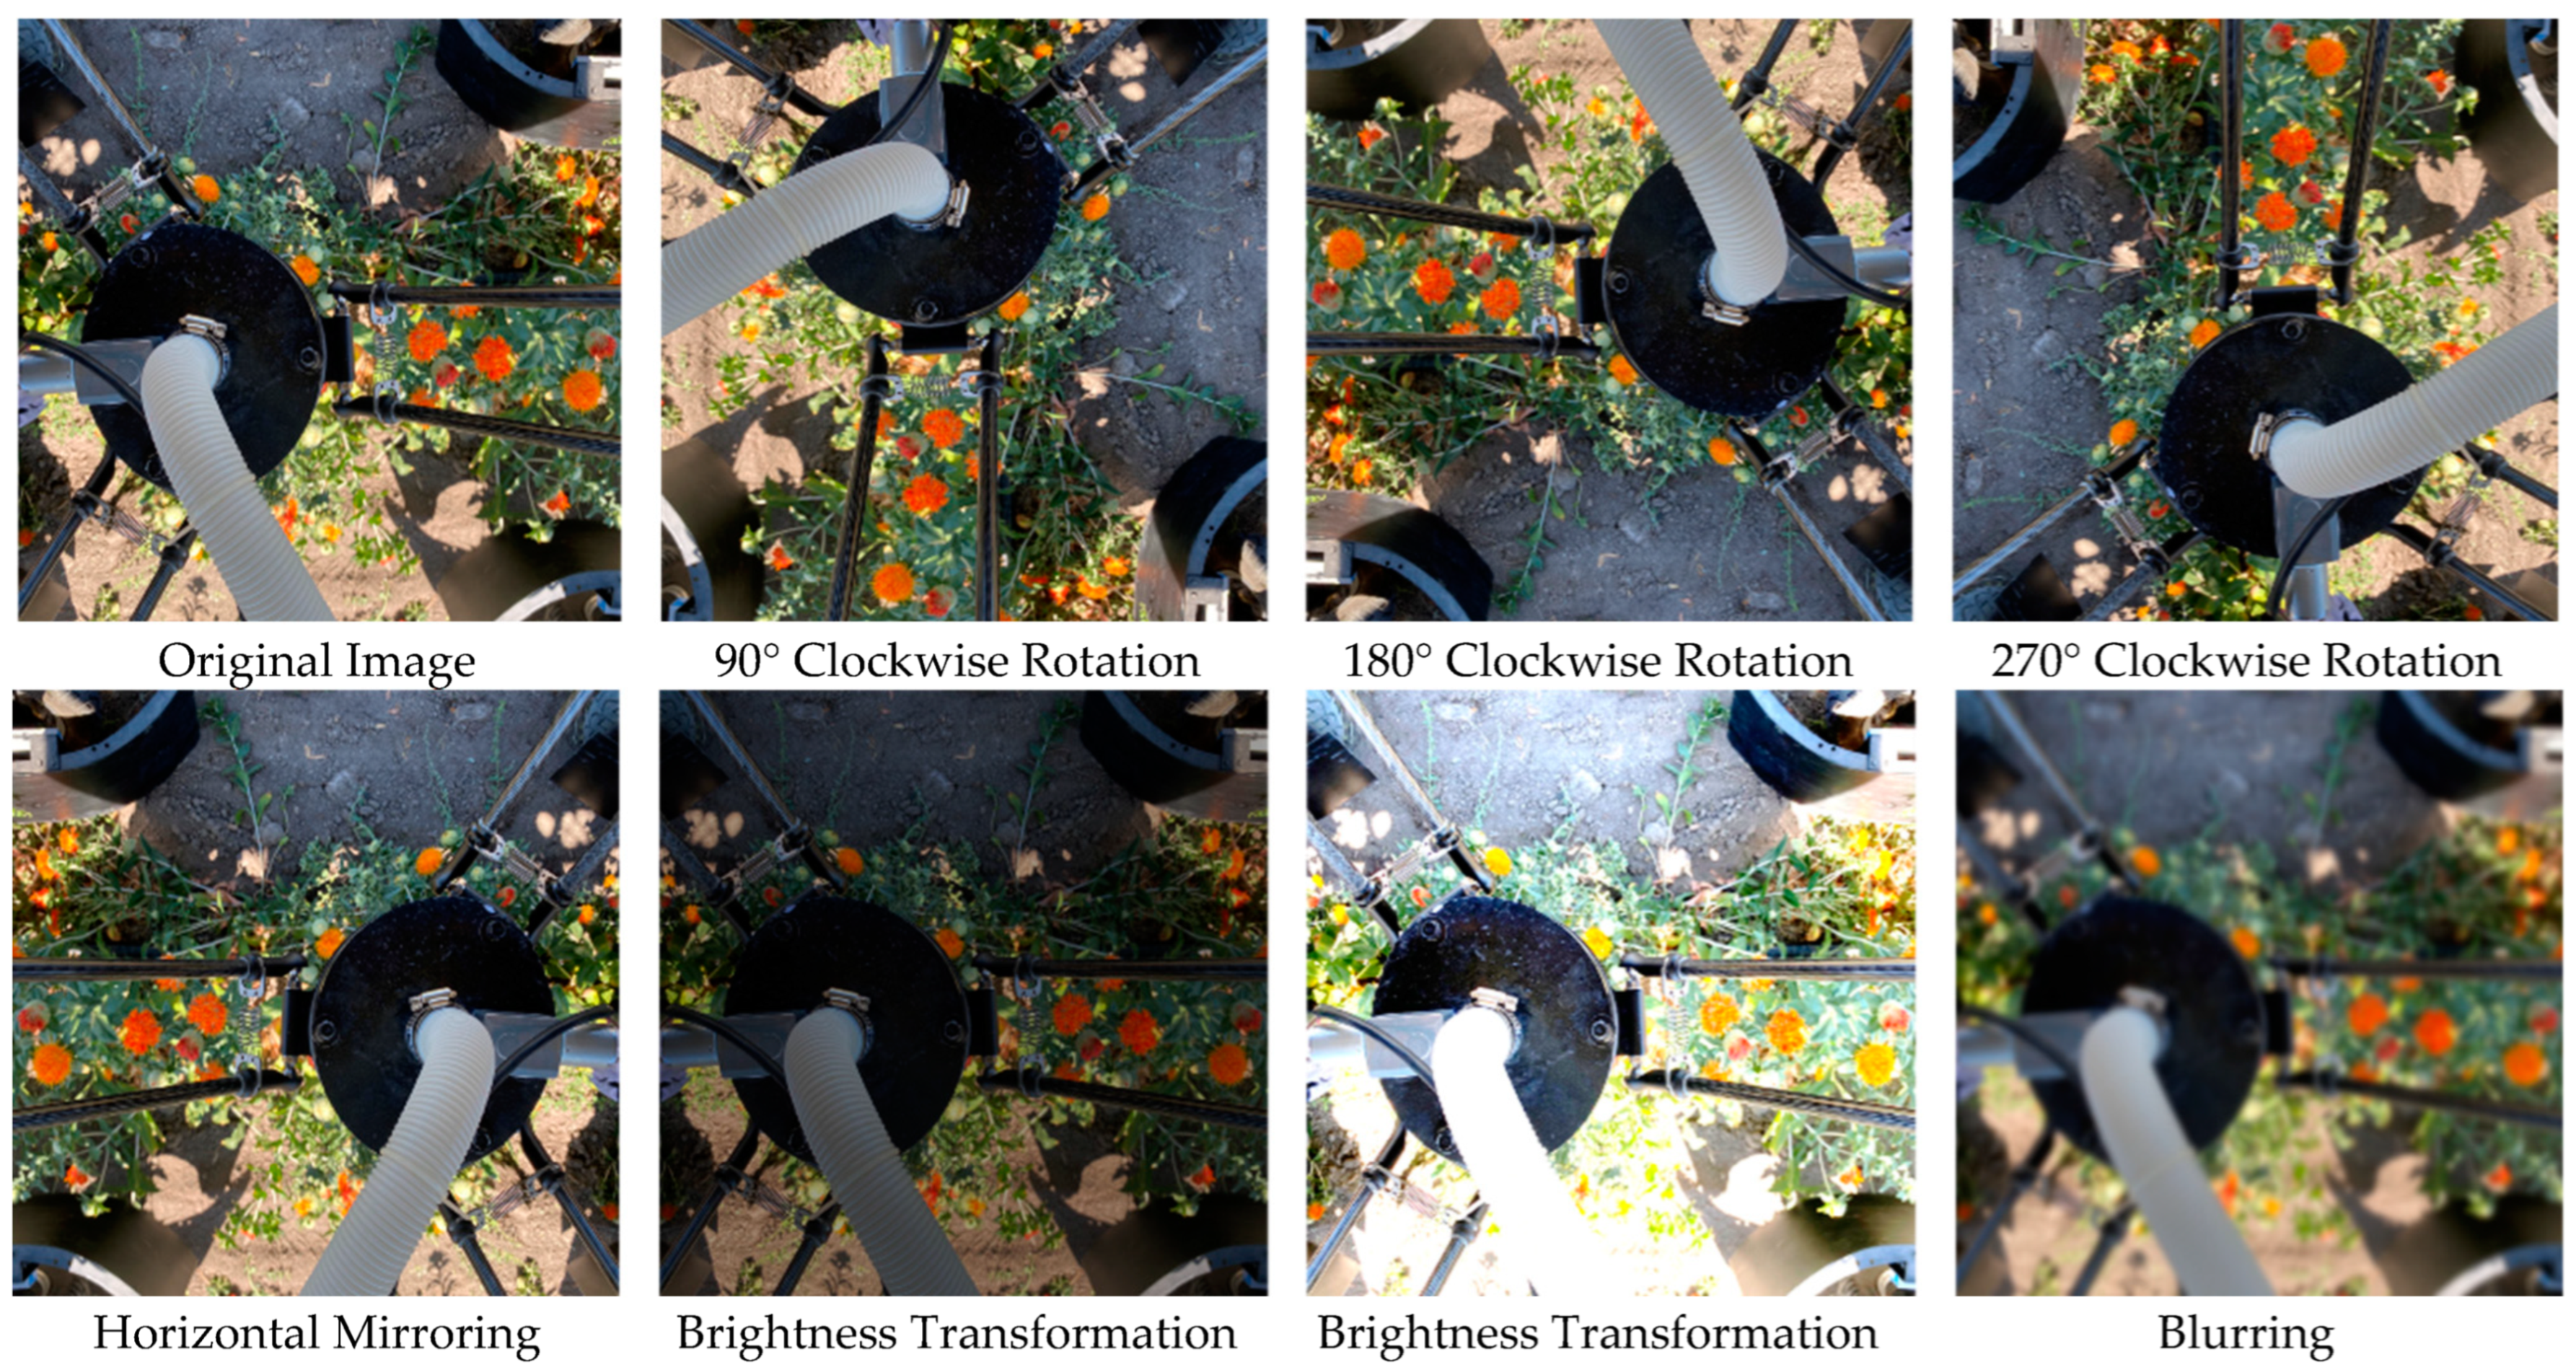
To increase the diversity of the experimental dataset and better replicate the real planting environment, this study enhances safflower corolla images using image processing techniques: affine transformations are used to simulate changes in the camera’s position and viewing angles; brightness adjustments reflect changes in sunlight; random noise is added to account for the unavoidable noise introduced during field image collection; and random cropping is applied to increase the sample size. These image processing methods were then randomly combined to simulate the complex field environment, expanding the image dataset to 6400 images, as shown in Figure 3.
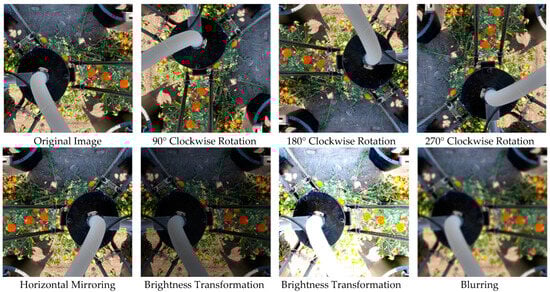
Figure 3.
Dataset augmentation.
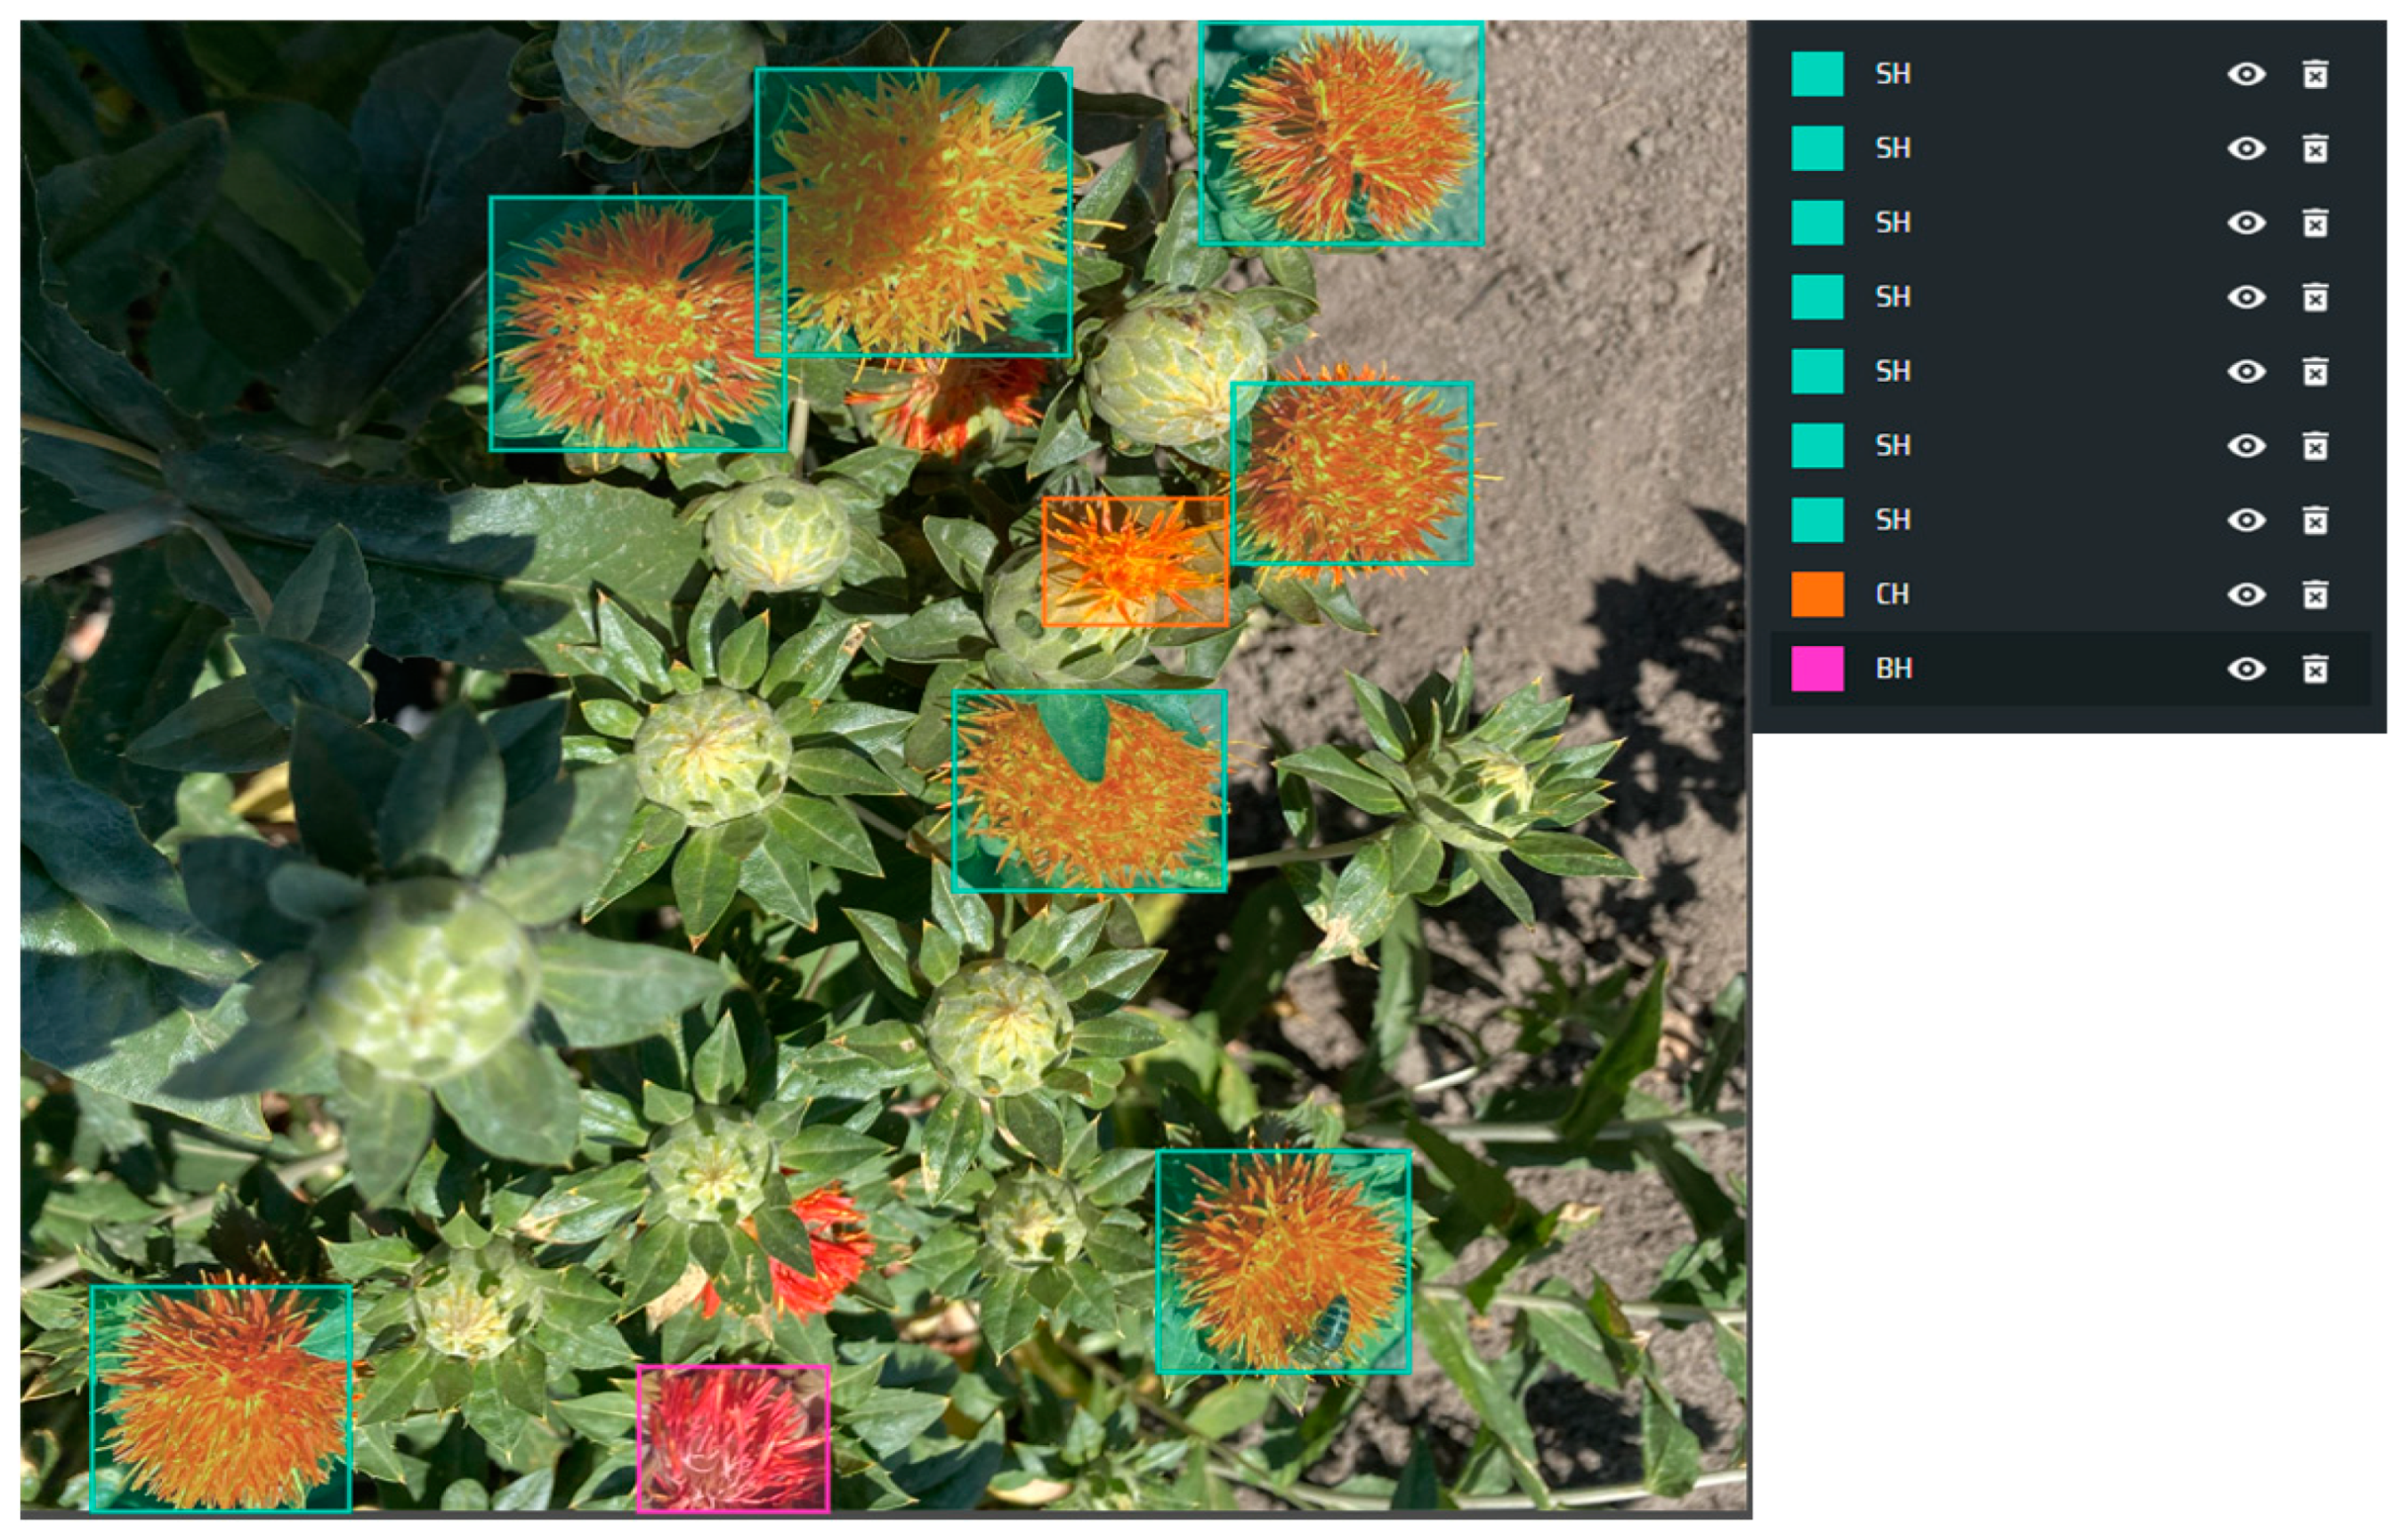
The Make Sense [23] tool was used to label the safflower corolla images by manually drawing the boundaries of the corolla and categorizing them. The early flowering stage is labeled as CH; the full blooming stage is labeled as SH; the wilting stage is labeled as BH, as shown in Figure 4. Samples with small pixel areas or unclear images were not labeled to avoid overfitting of the neural network. Due to the complexity of the field environment, which may cause occlusion of the corolla by branches and leaves, images where more than 90% of the corolla is occluded were also not labeled. The 6400 safflower images were then randomly divided into training, validation, and test sets at a ratio of 7:2:1, resulting in 4480 training images, 1280 validation images, and 640 test images.

Figure 4.
Safflower corolla dataset labels.
2.3. Safflower Corolla Object Detection
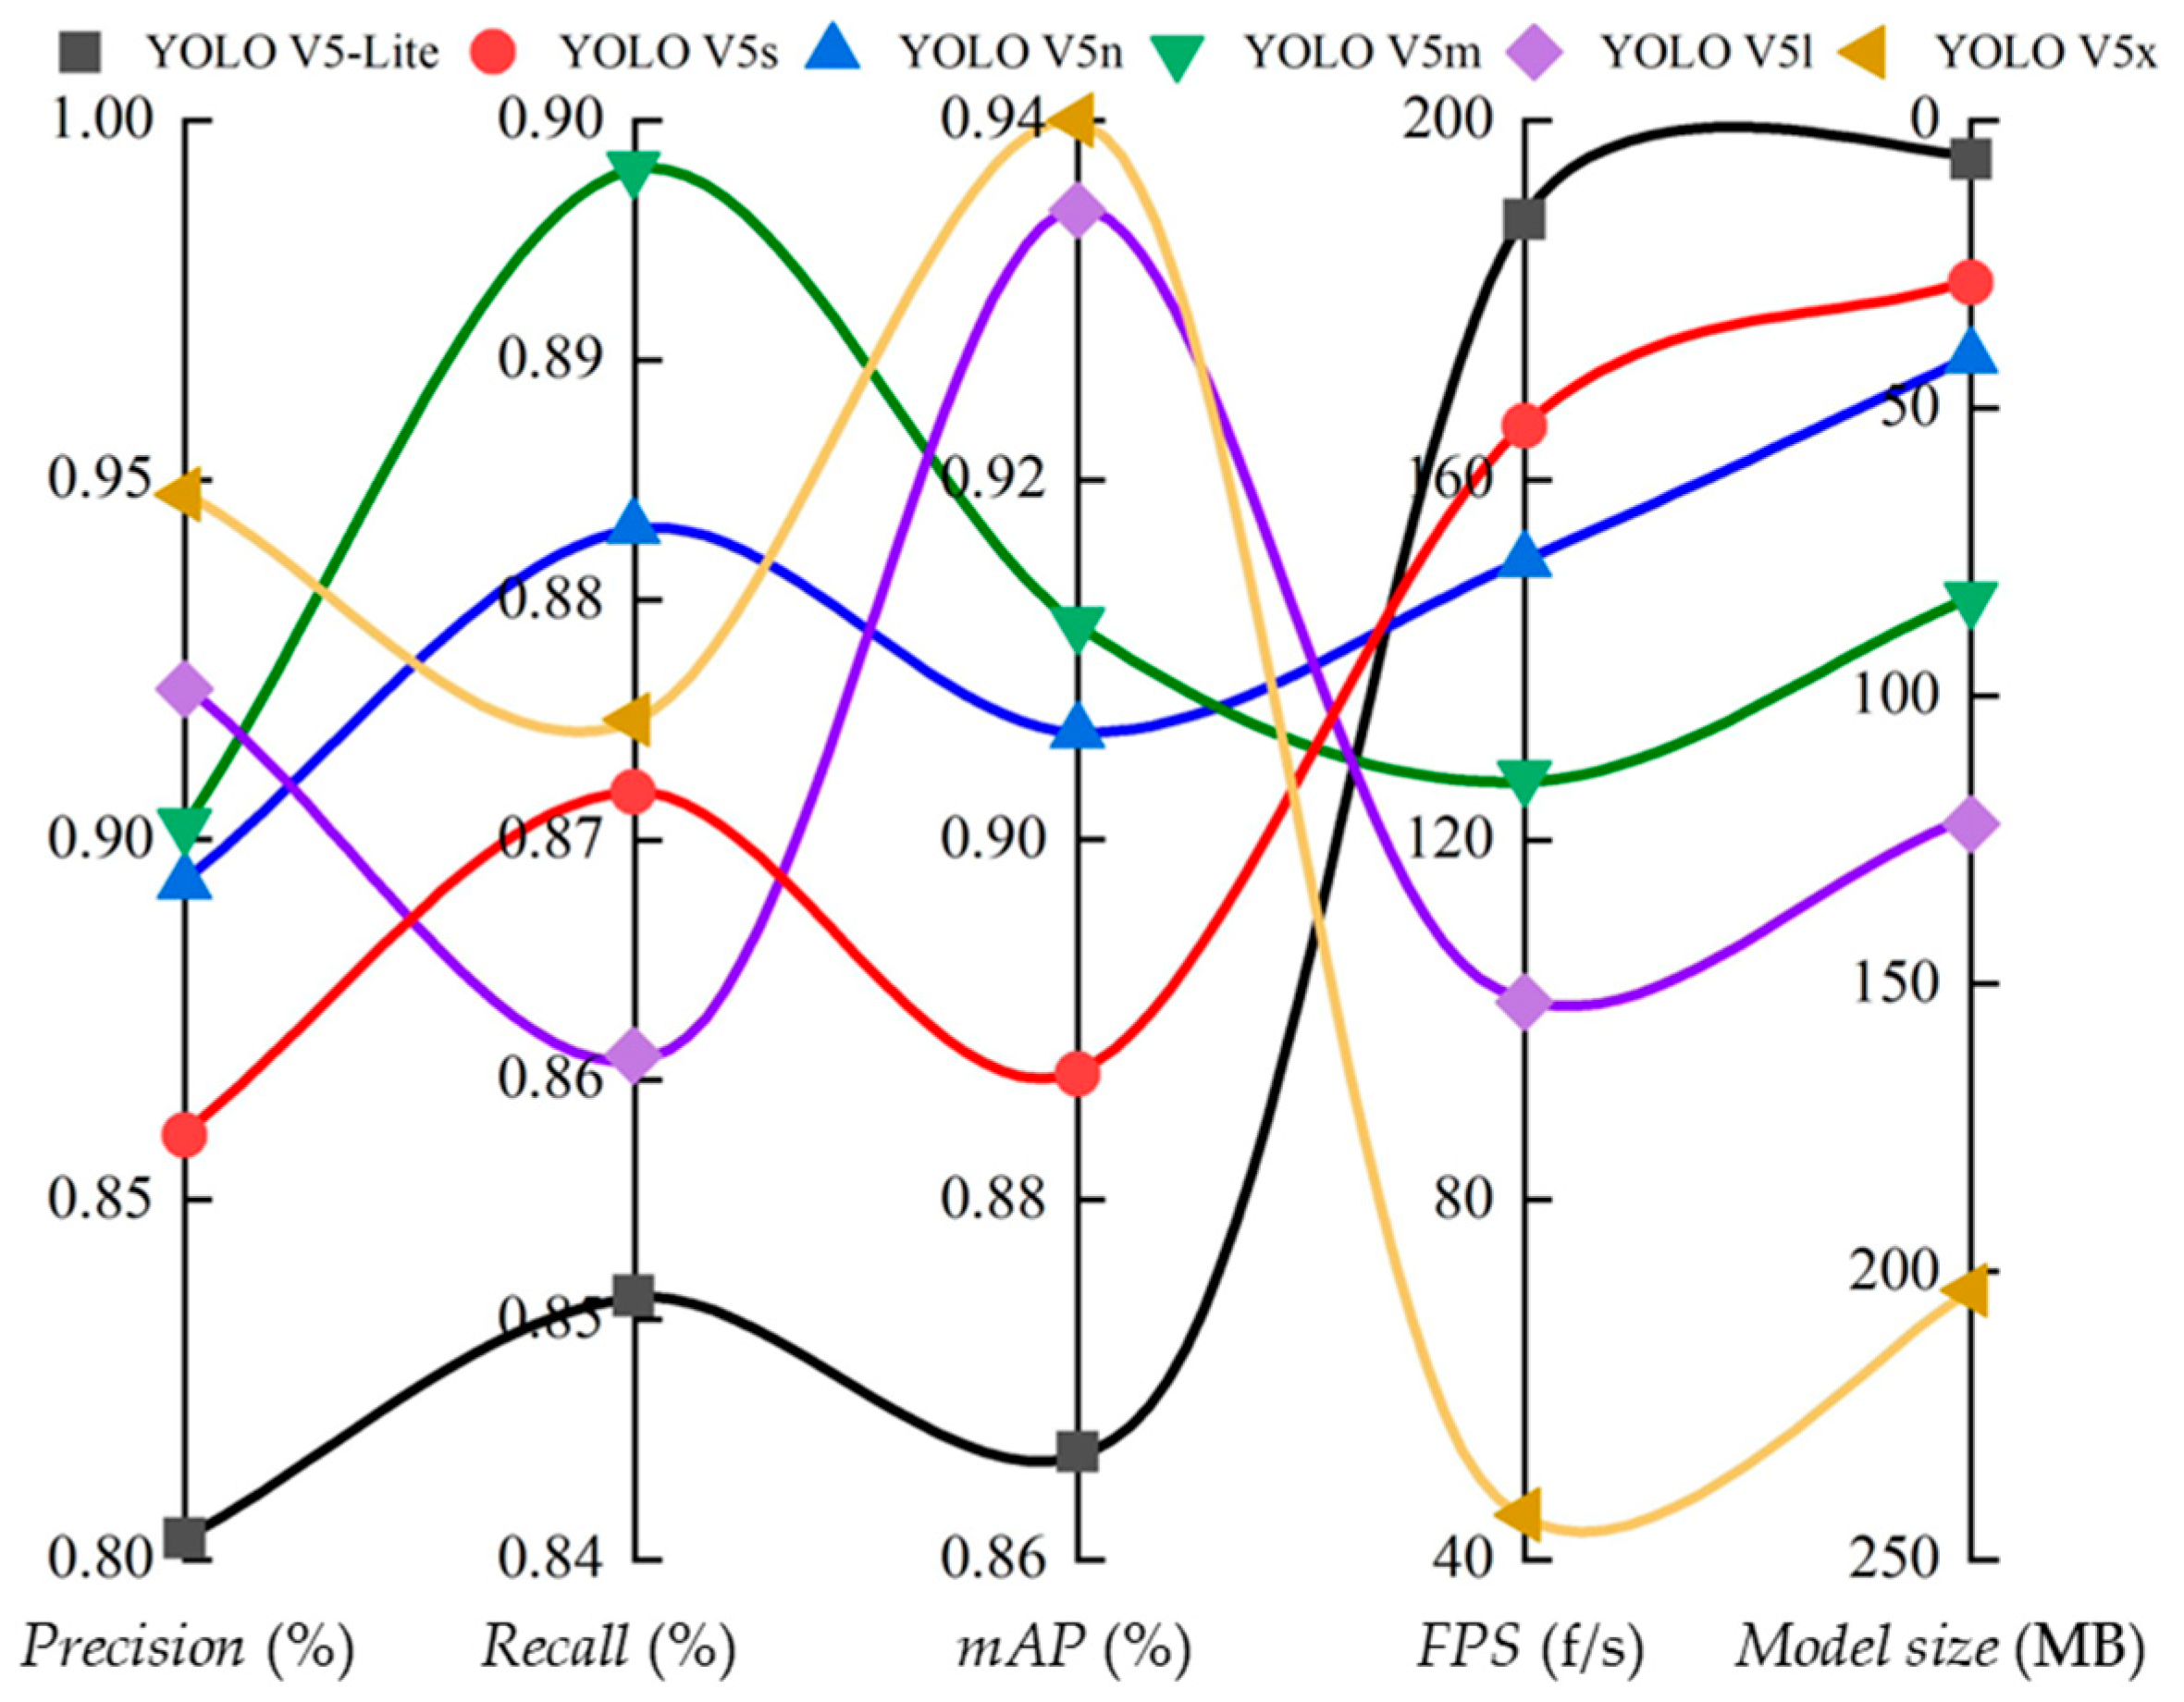
This study uses the YOLO v5 [24] algorithm for safflower corolla object detection. First, the six scale models [25] of YOLO v5—YOLO v5-Lite, YOLO v5s, YOLO v5n, YOLO v5m, YOLO v5l, and YOLO v5x—were trained using the established safflower image dataset. The main performance metrics for evaluating the models include precision (P), recall (R), mean average precision (mAP), frames per second (FPS), and model size. The accuracy and recall rates were calculated using Table 1 and Equations (1) and (2):
where TP is the number of true positives, FP is the number of false positives, NP is the number of missed detections, APi is the average precision for a single class, and mAP is the mean average precision. The comparison results of various metrics for the six different scale models are shown in Figure 5.

Table 1.
Confusion matrix.

Figure 5.
Comparison of metrics for different scale models.
To accurately evaluate the performance of the six models mentioned above, the metrics for each model are first normalized to eliminate dimensional differences between different measurements. During normalization, the Min–Max normalization method [26] is used to map each metric to a range between 0 and 1. Next, based on the practical application scenarios and research objectives, the following weights are assigned to each metric: WPrecision = 0.2; WRecall = 0.3; WmAP = 0.2; WFPS = 0.2; and WModel size = −0.1 (negative weight, as smaller models have an advantage in practical applications). Finally, the weighted score for each model is calculated using Equation (4) based on the above weight distribution:
where Pw is the comprehensive weighted score of the model; min is the minimum value in the set of metrics; and max is the maximum value in the set of metrics. The comprehensive weighted score results for the six scale models of YOLO v5 are shown in Table 2.
Table 2.
The comprehensive weighted scores of the 6 models.
As shown in Table 2, YOLO v5m ranks first in the comprehensive weighted score among the six models. Therefore, compared to the other five models, YOLO v5m has a greater advantage in safflower corolla object detection.
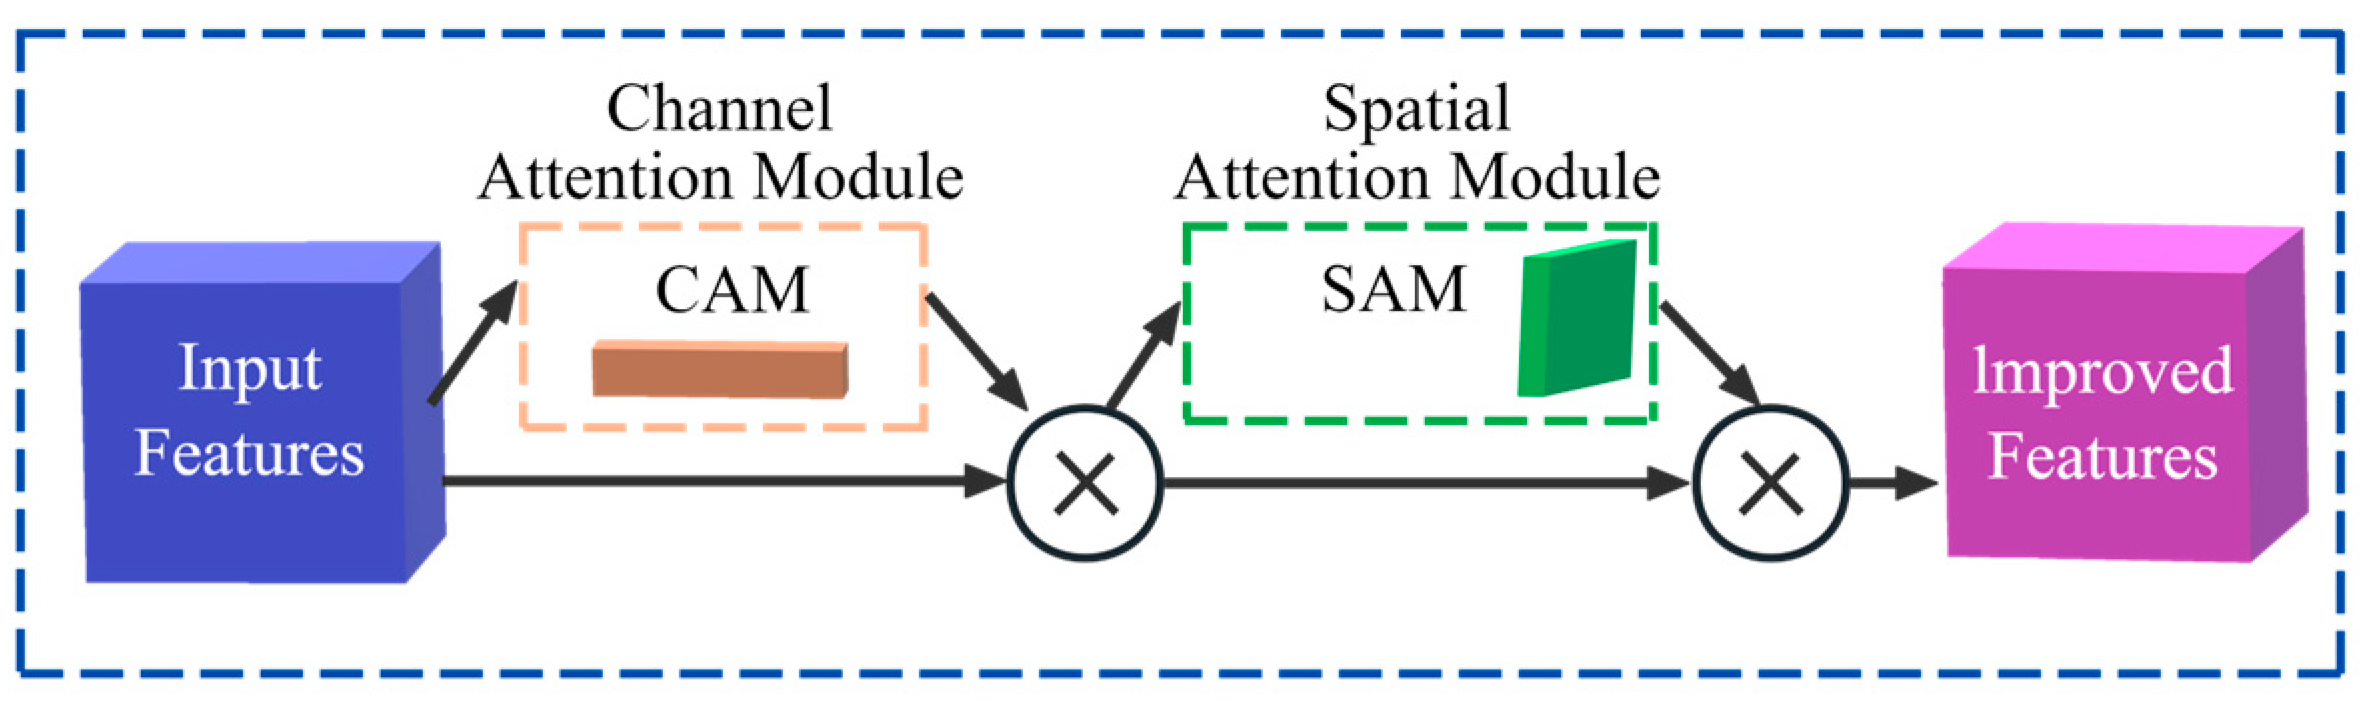
To further improve the detection accuracy of safflower corolla, the Convolutional Block Attention Module (CBAM) [27,28] was introduced into the YOLO v5m model. The CBAM module adaptively adjusts the input feature maps, thereby enhancing the network’s performance and generalization ability [29]. The CBAM module consists of two parts: the Channel Attention Module (CAM) and the Spatial Attention Module (SAM). The structural diagram is shown in Figure 6.

Figure 6.
CBAM structure.
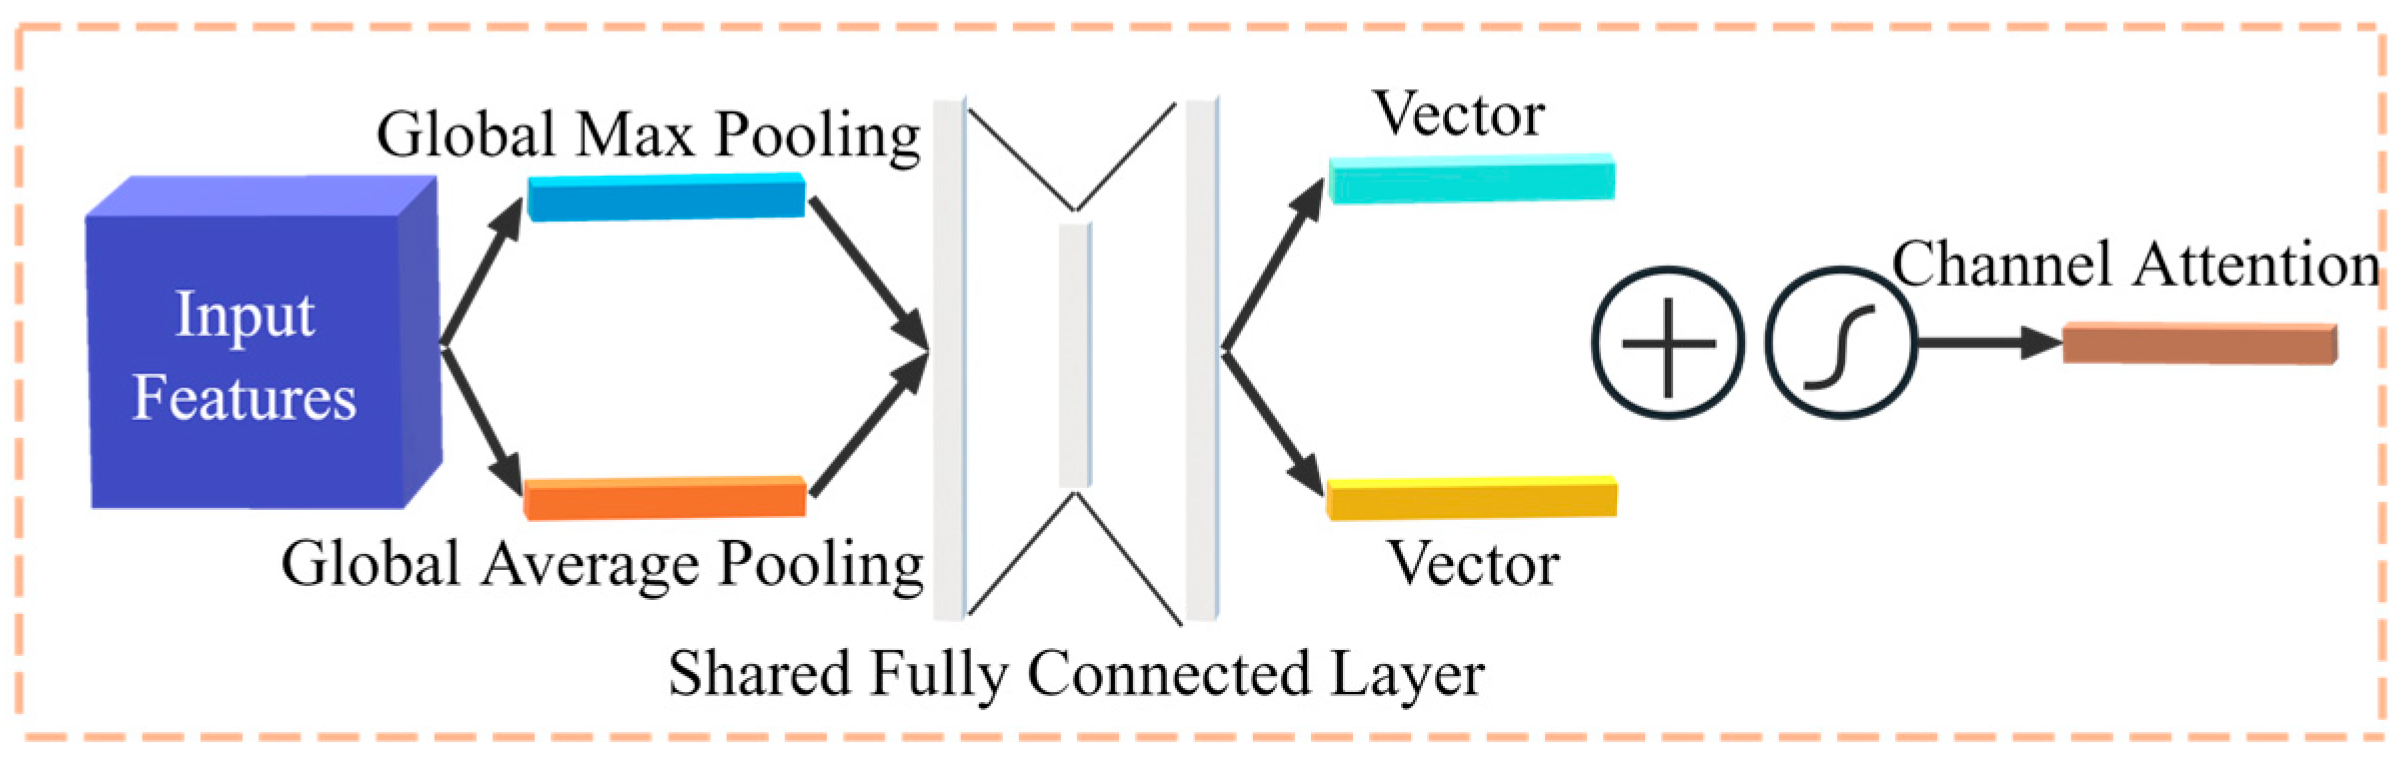
The main function of the Channel Attention Module is to extract important features from the image by utilizing the relationships between channels, thereby better distinguishing different targets. This module first performs global average pooling and global maximum pooling on the output of the convolutional layer to obtain the global feature map of each channel. The results are then input into two fully connected layers to learn the weight of each channel. Finally, the weights are applied to the feature map of each channel, resulting in the weighted feature map, as shown in Figure 7.

Figure 7.
Channel Attention Module structure.
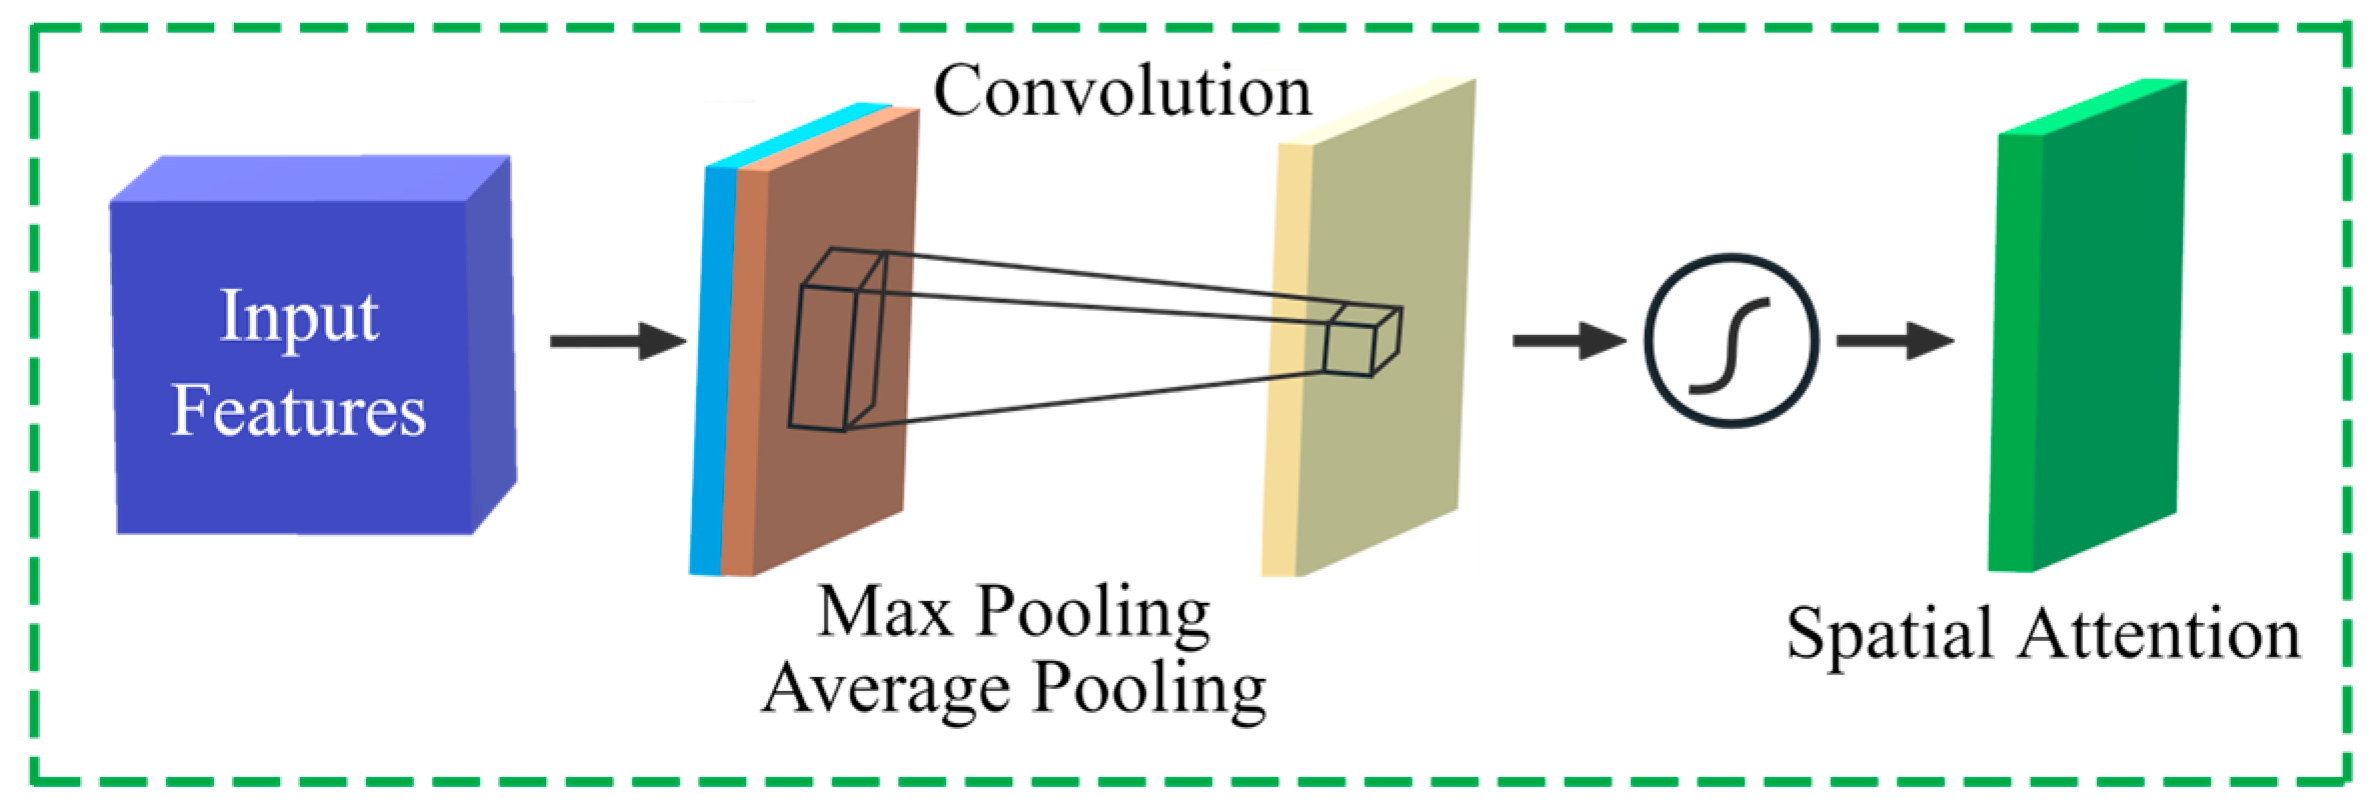
The main function of the Spatial Attention Module is to extract important features from the image by utilizing the relationships between spatial locations. The implementation of this module is similar to the Channel Attention Module, but in the fully connected layer, the weights of each spatial location are learned. Finally, the weights are applied to the channels at each spatial location, resulting in the weighted feature map, as shown in Figure 8.
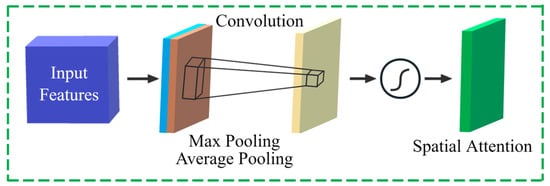
Figure 8.
Spatial Attention Module structure.
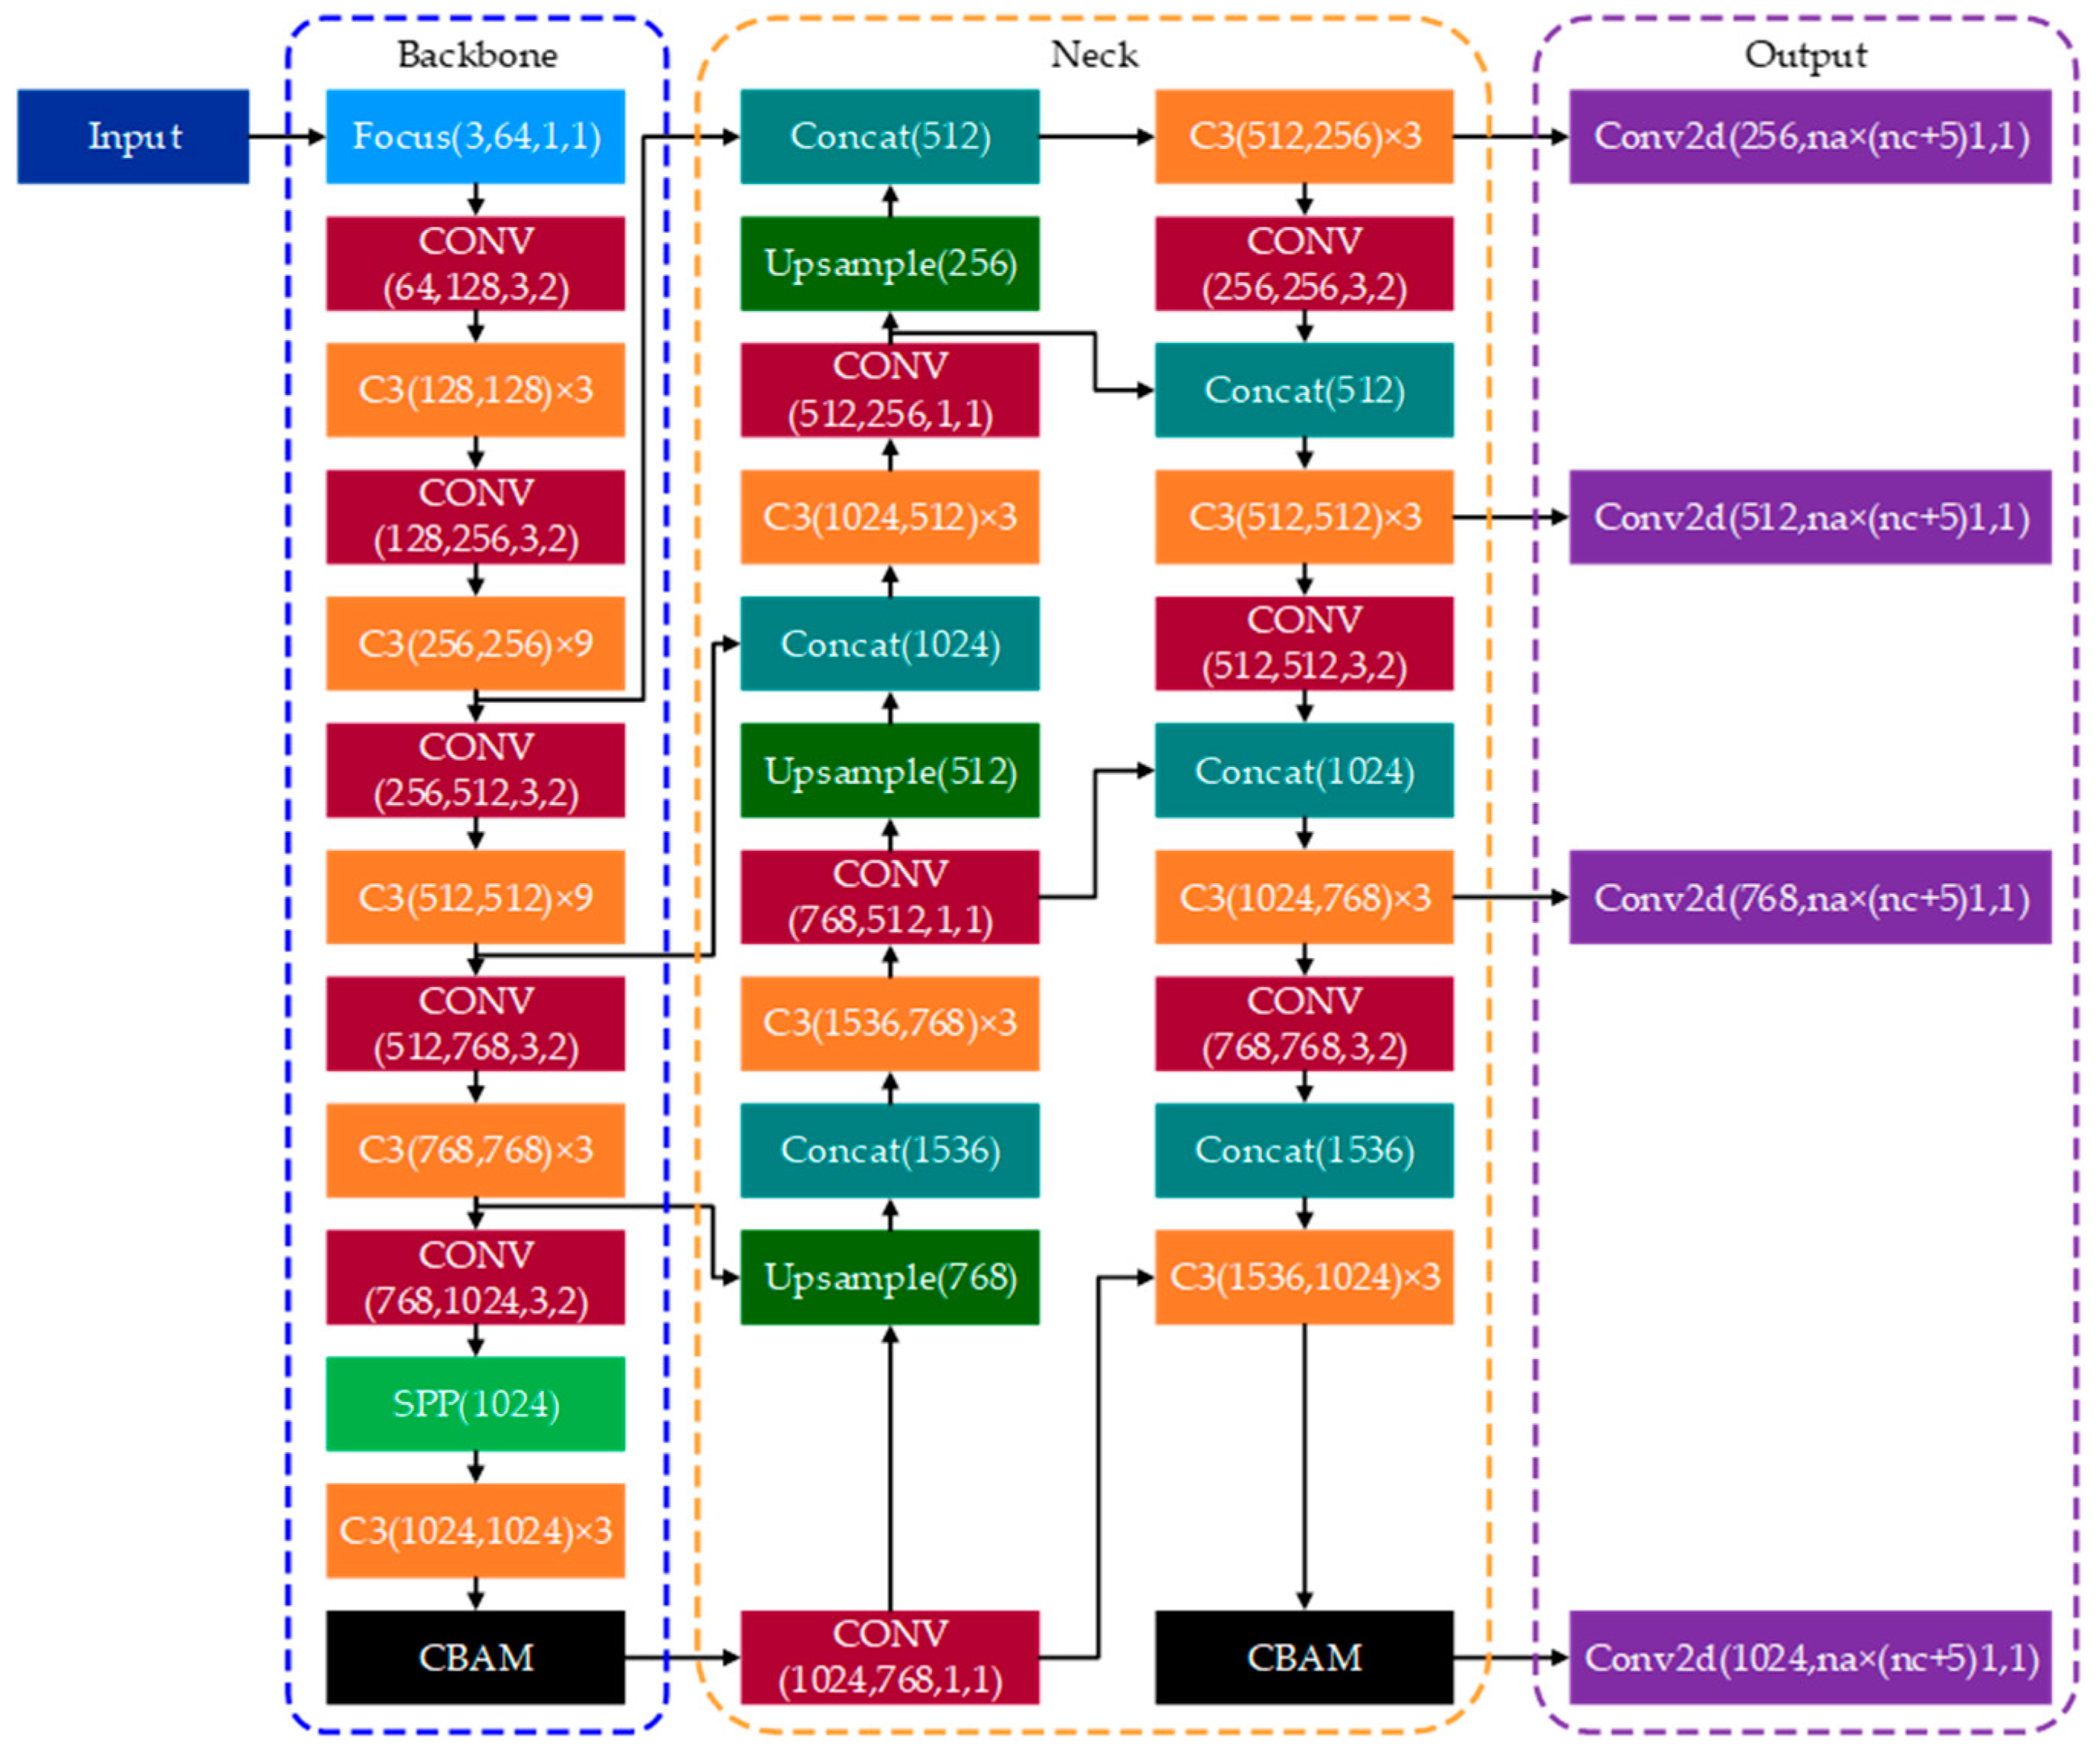
The CBAM module is inserted between the last convolutional layer of the backbone network and the first convolutional layer of the neck network, as well as after the last convolutional layer of the neck network. These placements are intended to enhance the representational capability of the feature maps and improve the discriminative ability of the output feature maps. The structure of the improved network, C-YOLO v5m, is shown in Figure 9.

Figure 9.
C-YOLO v5m network architecture.
2.4. Safflower Corolla Spatial Positioning
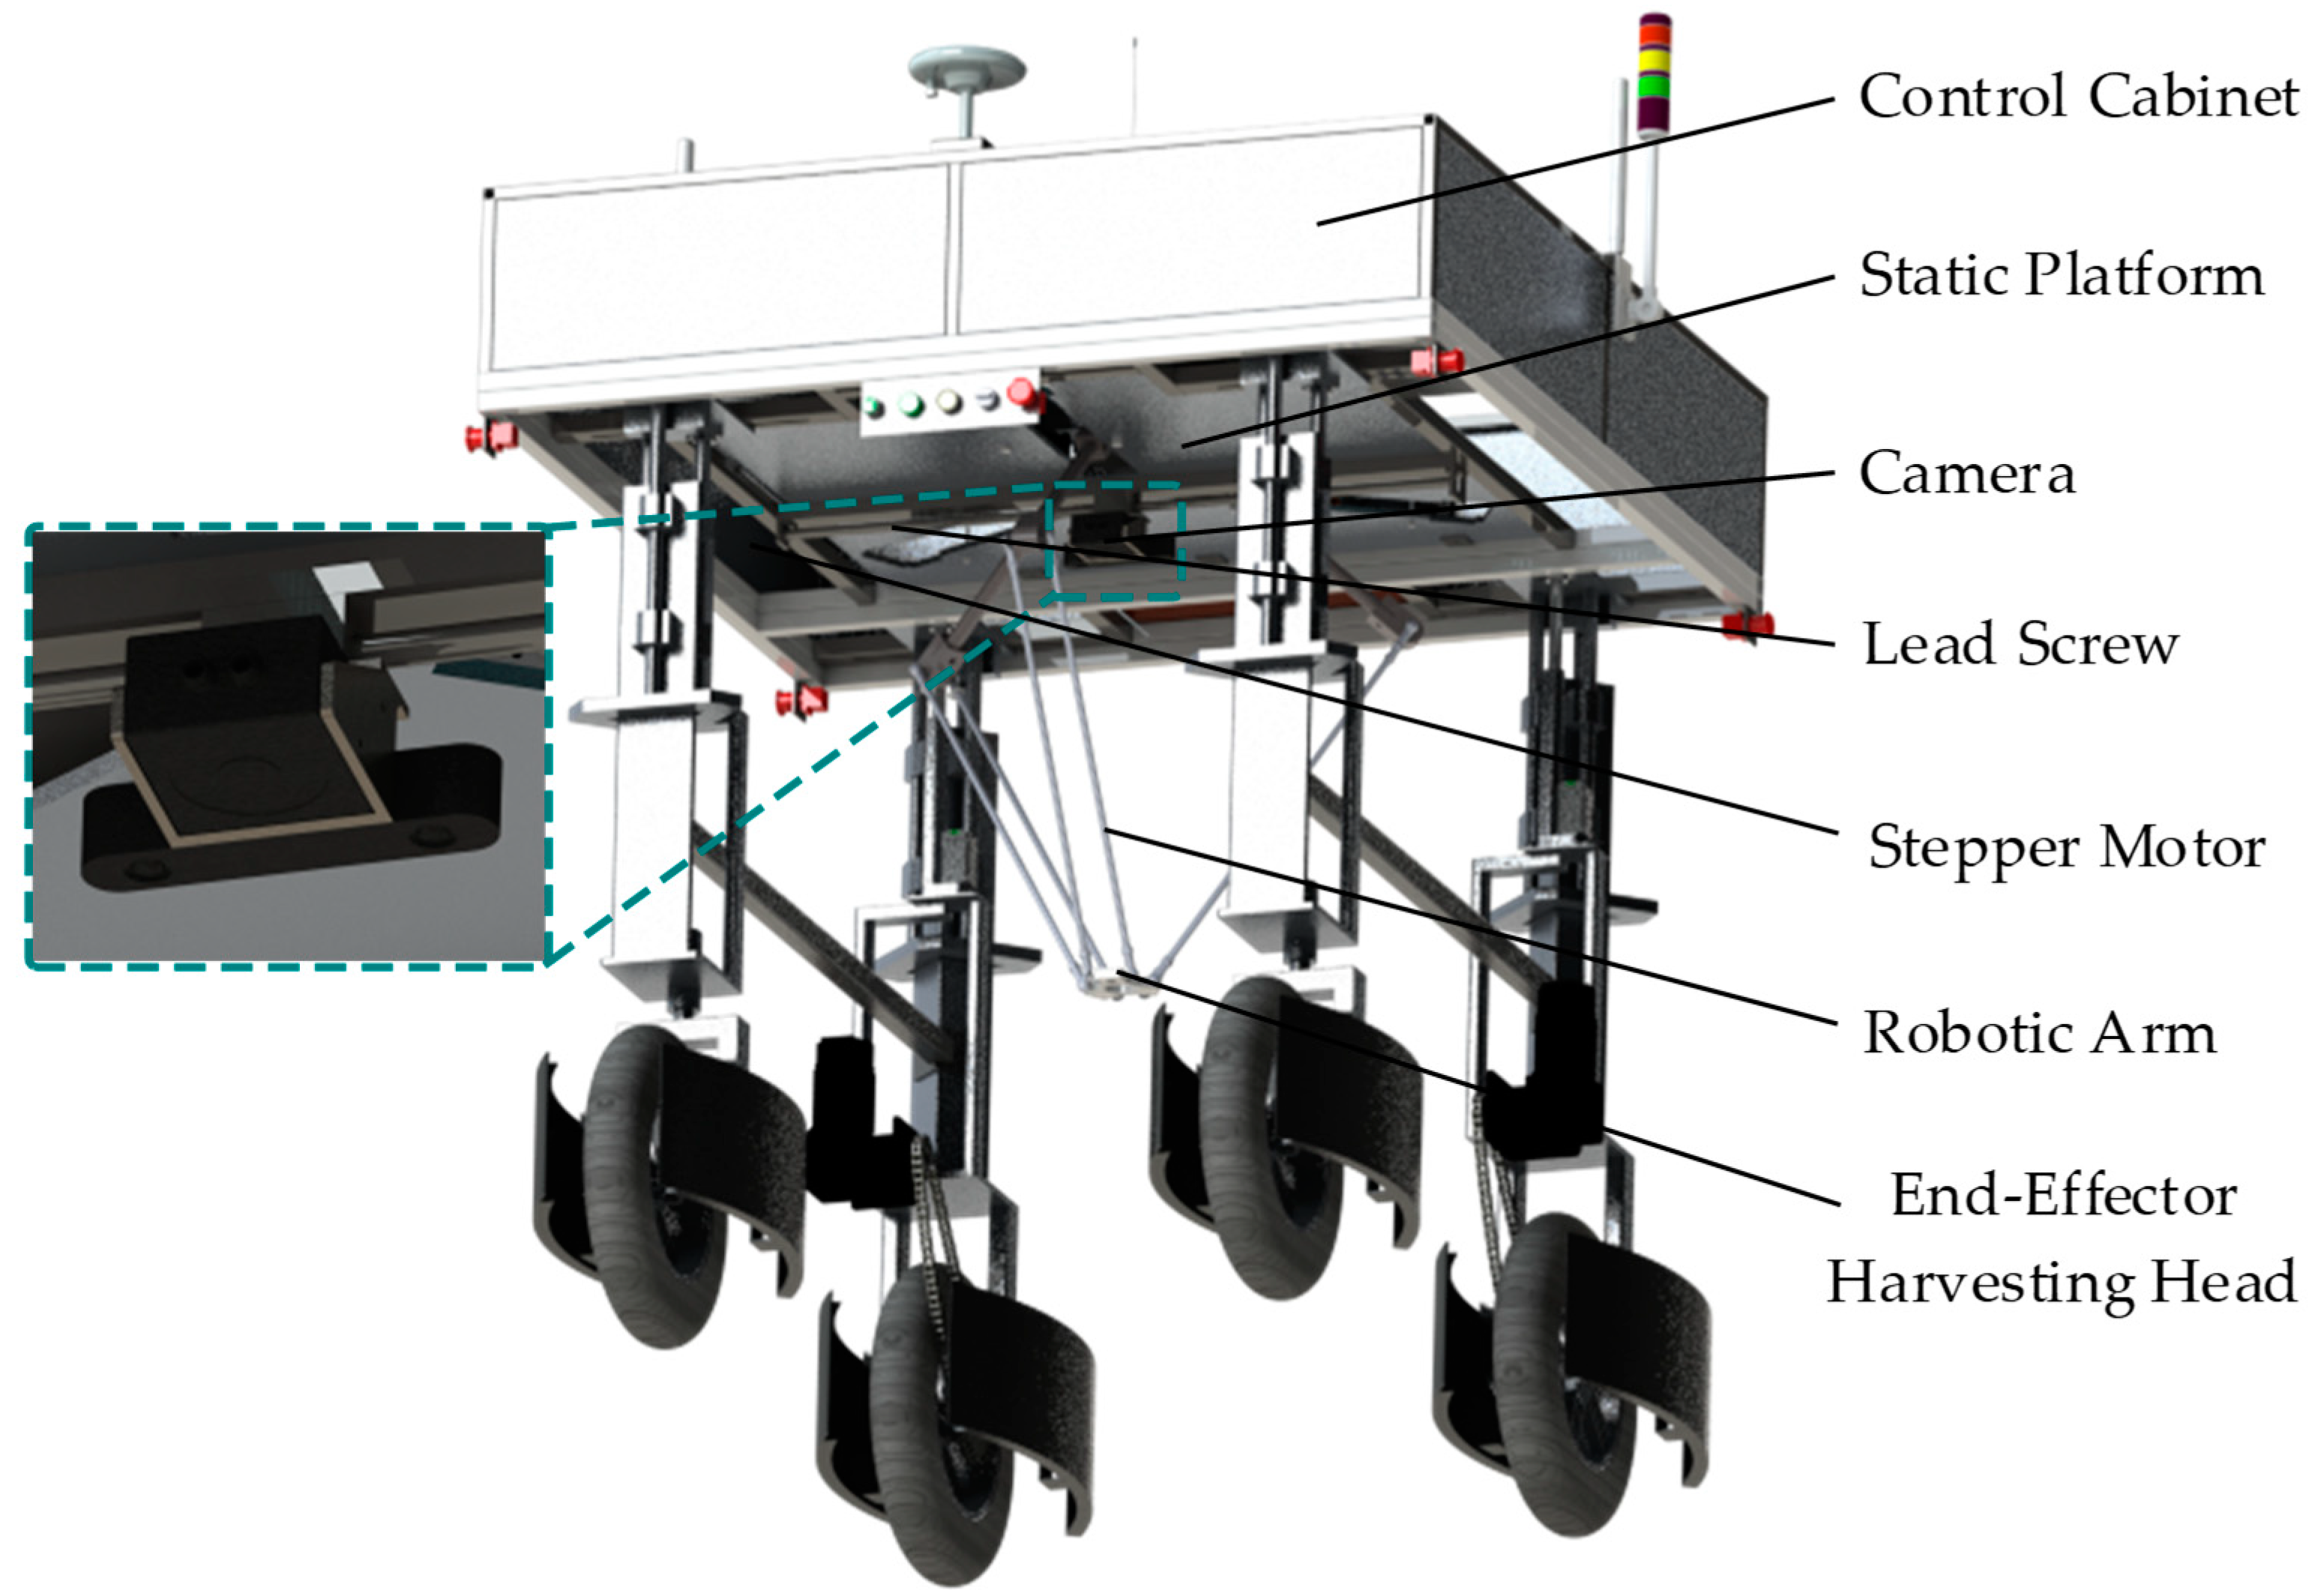
This study uses binocular vision technology for safflower corolla spatial positioning, with the ZED2 binocular camera produced by Stereolabs being selected. The installation diagram of the safflower harvesting robot vision system is shown in Figure 10.
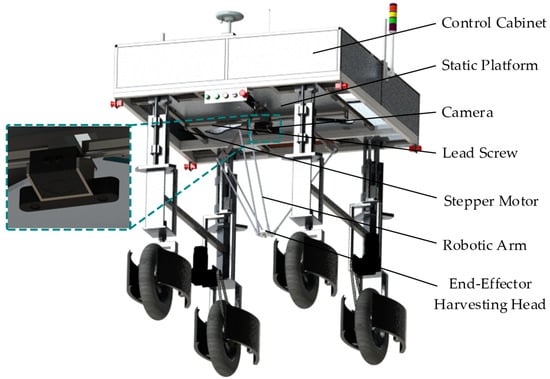
Figure 10.
Safflower harvesting robot vision system.
To address the potential occlusion issues during object detection, this study proposes a safflower corolla occlusion mitigation and positioning technology based on dynamic viewpoint adjustment. By mounting a binocular camera on the ball screw translation table, it allows horizontal left–right movement, which can minimize occlusion between the machine components, safflower plants, and the corolla during the object detection process, as shown in Figure 11.
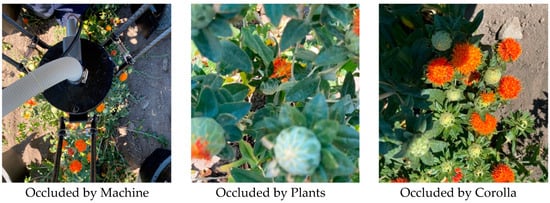
Figure 11.
Safflower corolla occlusion.
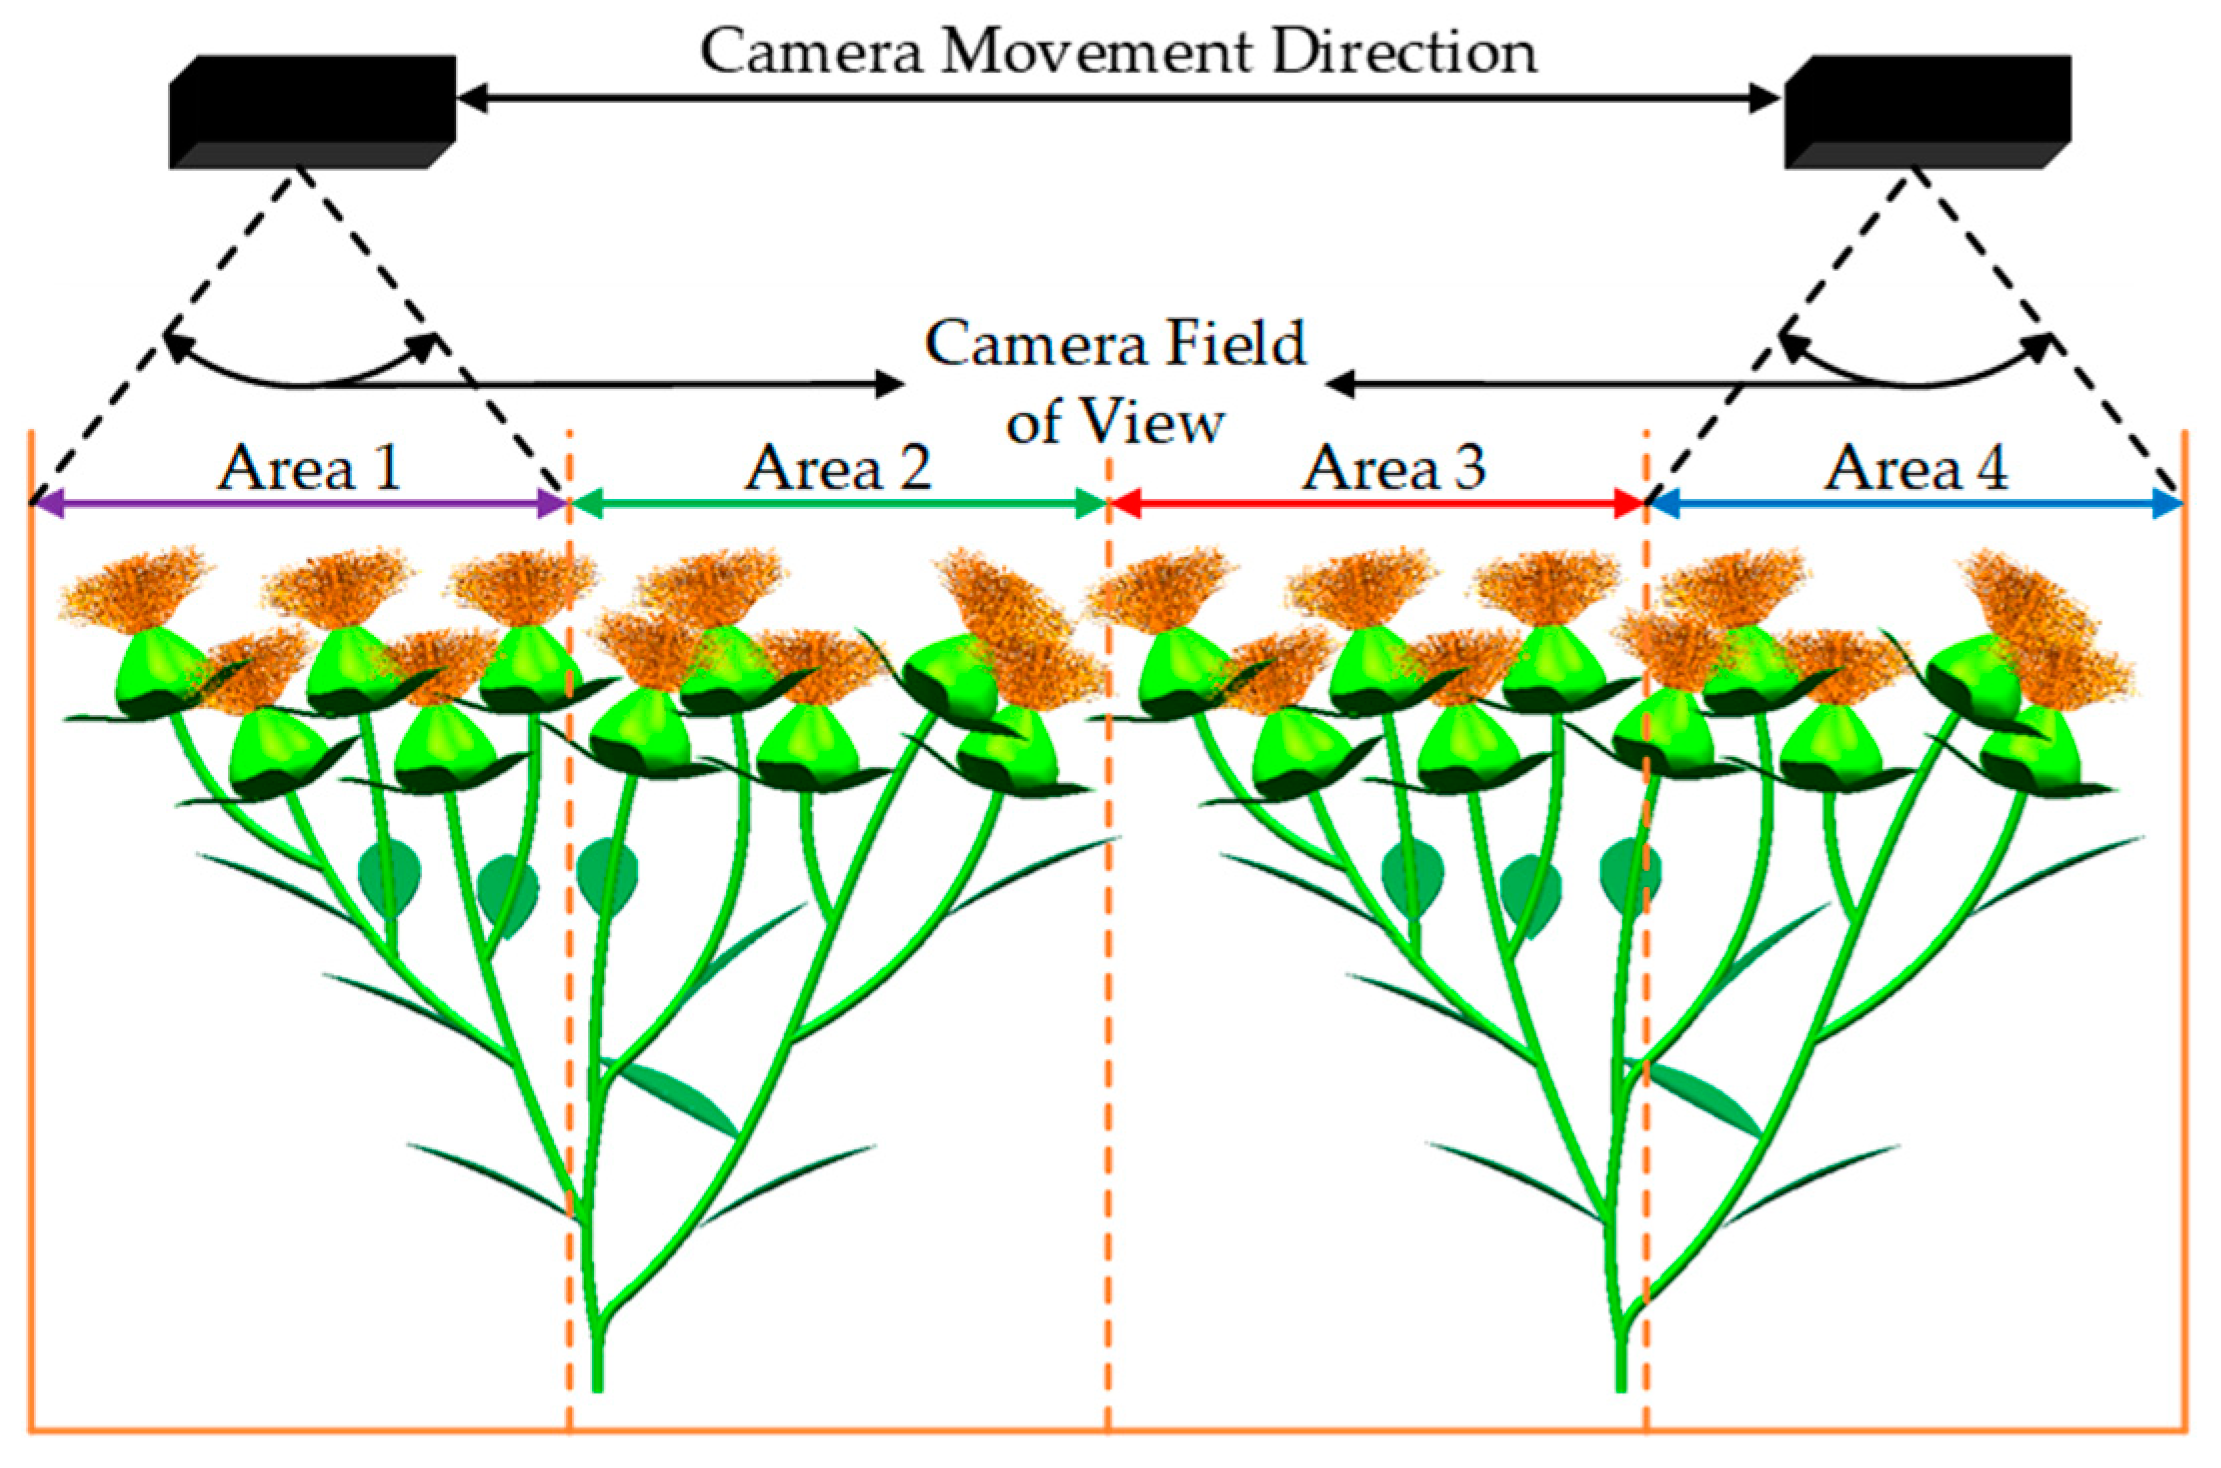
The working principle is as follows: After the system is powered on, the robot moves to the work area, and the object detection and positioning system is reset, entering the standby state. Once the operation begins, the system checks whether there are any safflower corollas in the current detection area. If there are none, the translation table drives the binocular camera to move to the next detection area, and the system performs the check again. The movement of the binocular camera is shown in Figure 12.
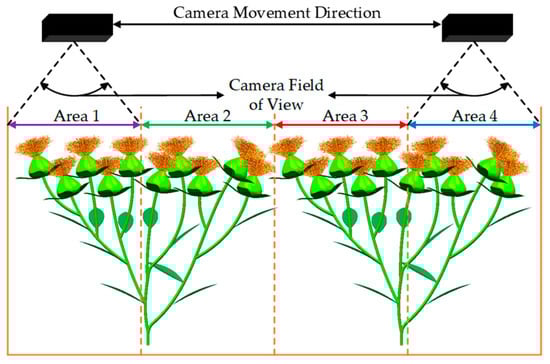
Figure 12.
Dynamic viewpoint adjustment principle.
If a safflower corolla is detected, the center coordinates (X, Y) of the 2D detection bounding box are input into the depth perception Stereo Vision algorithm [30] of the ZED2 binocular camera to obtain the depth value Z of the 2D bounding box center. The 3D spatial coordinates (X, Y, Z) of the safflower corolla are then transmitted via the CAN bus to the robot’s harvesting robotic arm controller, completing the harvesting task in this detection area. After completing the harvesting work in all four detection areas, the robot moves forward to the next work area and repeats the above steps.
In safflower corolla spatial positioning, coordinate transformation is a very important task. In this study, three transformations are required: from the pixel coordinate system to the camera coordinate system (intrinsic calibration), from the camera coordinate system to the robotic arm coordinate system (extrinsic calibration), and real-time coordinate transformation under dynamic viewpoints.
The transformation relationship from the image pixel coordinate system to the camera coordinate system is obtained by calibrating the binocular camera’s intrinsic parameters. The intrinsic parameters of the binocular camera are calibrated using the Zhang Zhengyou calibration method [31], with the calibration results shown in Table 3.
Table 3.
Intrinsic parameters of ZED2 stereo camera.
The intrinsic parameter matrix of the binocular camera obtained is then substituted into Equation (5) to derive the transformation relationship from the image pixel coordinate system to the camera coordinate system:
where (u, v) are the coordinates in the pixel coordinate system; fx and fy are the effective focal lengths; (u0, v0) are the pixel coordinates of the image center; and (X, Y, Z) are the coordinates in the camera coordinate system.
In addition, to make the obtained image coordinates more accurate, distortion caused by lens imaging and installation errors needs to be corrected using Equations (6) and (7):
where (X, Y) are the coordinates before calibration; (Xc, Yc) are the coordinates after calibration; k1, k2, k3 are the radial distortion coefficients; and p1, p2 are the tangential distortion coefficients.
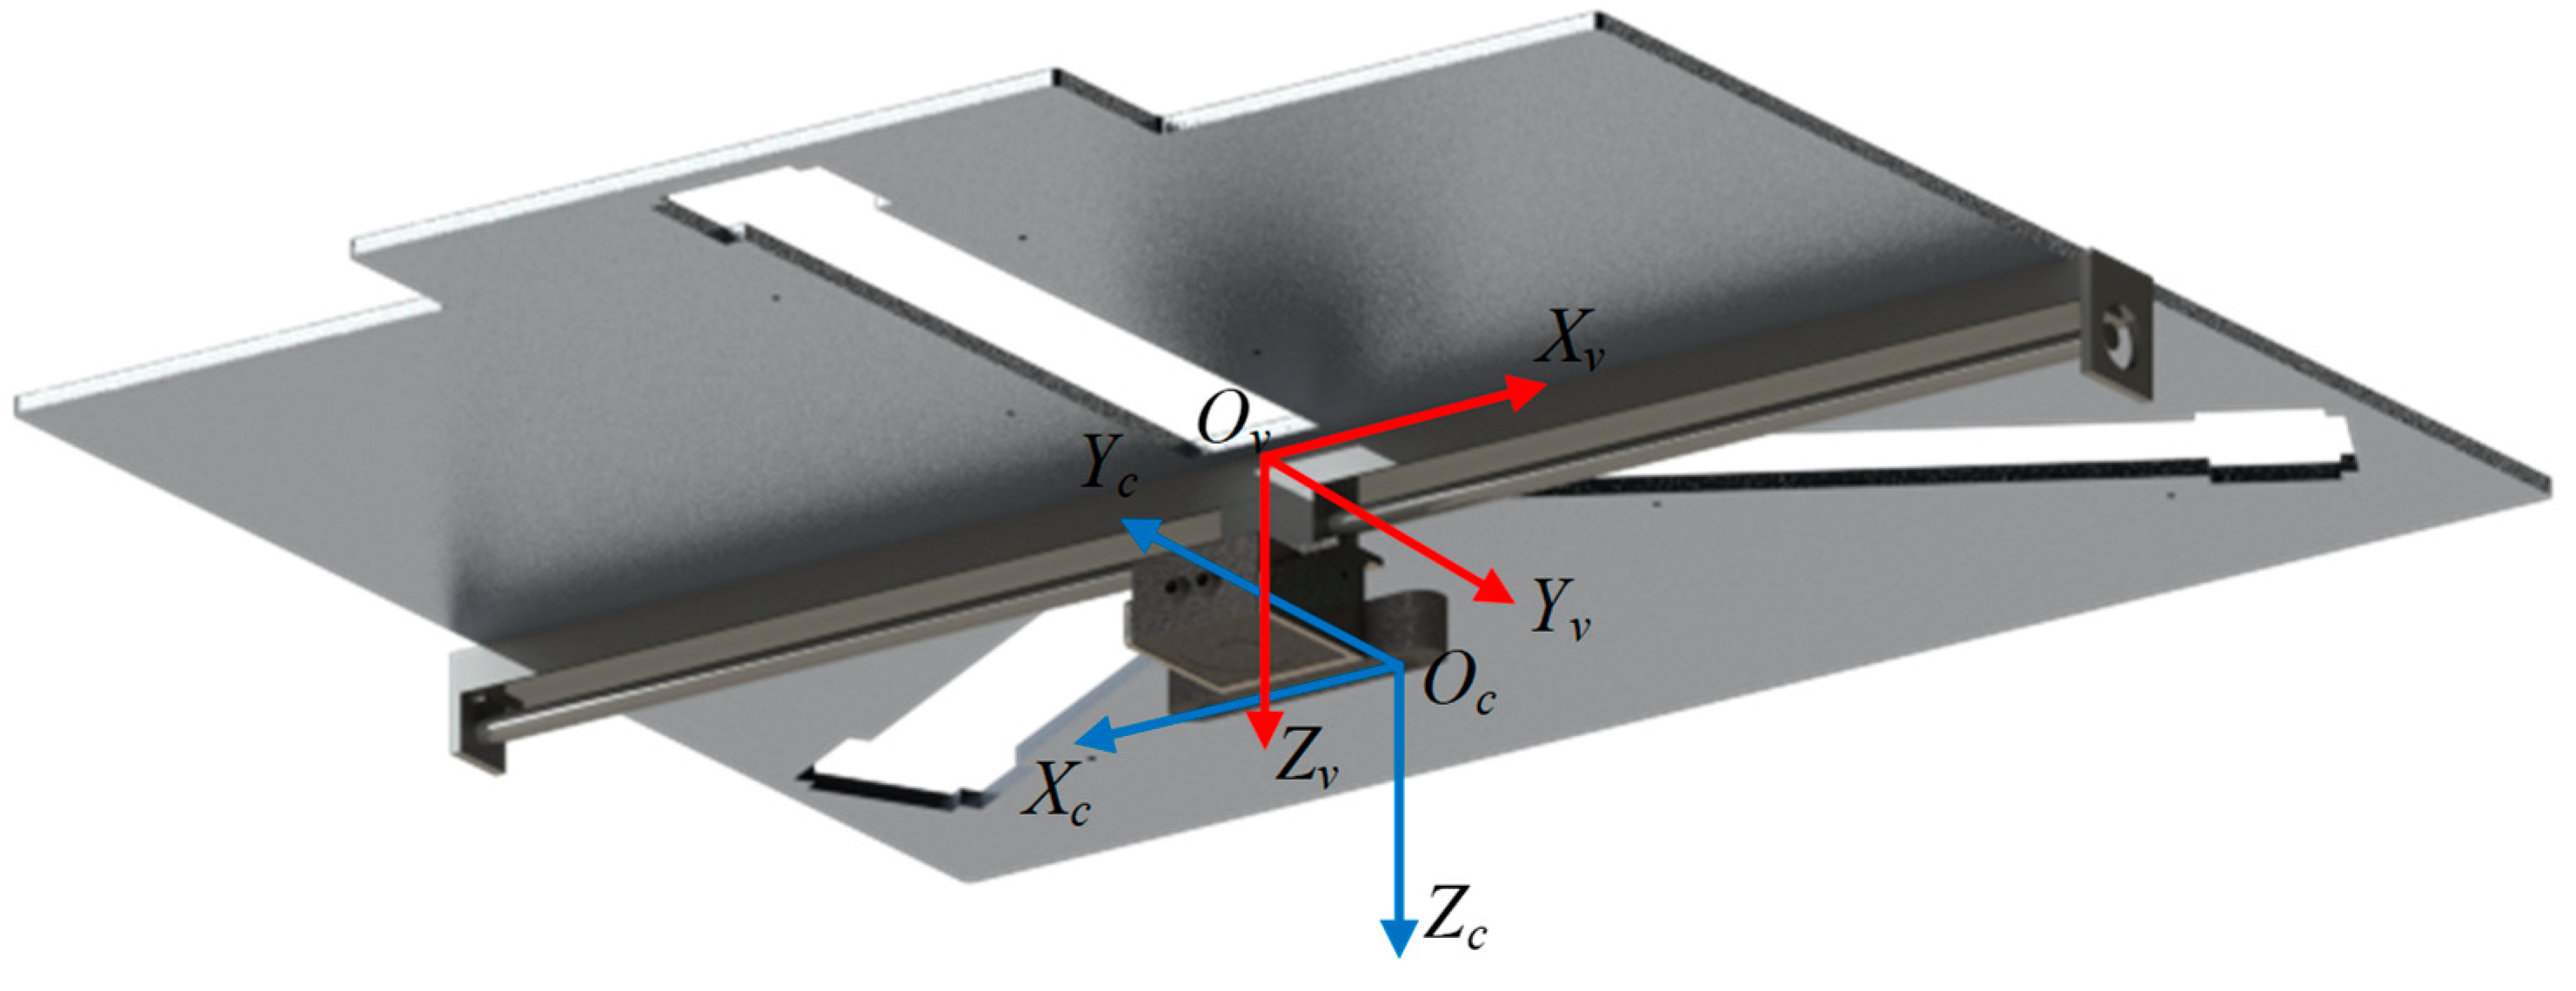
Calibrating the binocular camera’s extrinsic parameters allows for the transformation relationship from the camera coordinate system to the robotic arm coordinate system. The binocular camera coordinate system is defined such that its origin is at the optical center of the left camera (Oc), with the Z-axis pointing directly forward from the camera, the X-axis parallel to the baseline pointing toward the right lens, and the left thumb pointing along the Z-axis. The X-axis rotates 90° along the four-finger direction to define the positive direction of the Y-axis. The robotic arm coordinate system is defined such that its origin is at the center of the robotic arm’s static platform (Ov), with the Z-axis pointing vertically downward, the Y-axis parallel to the ground pointing in the robot’s forward direction, and the X-axis parallel to the ground pointing toward the robot’s right side, as shown in Figure 13. The transformation from the camera coordinate system to the robotic arm coordinate system is represented by a 3 × 3 rotation matrix R, which describes the angles α, θ, and β of rotation around the X-, Y-, and Z-axes, respectively. The translation distances Δx, Δy, and Δz from the camera coordinate system’s origin to the robotic arm’s origin along the X-, Y-, and Z-axes are represented by a 3 × 1 translation vector T. The mathematical model for the transformation from the camera coordinate system to the robotic arm coordinate system is shown in Equation (8). By substituting the relevant parameters into Equations (8) and (9) is obtained, where θ = 180°.
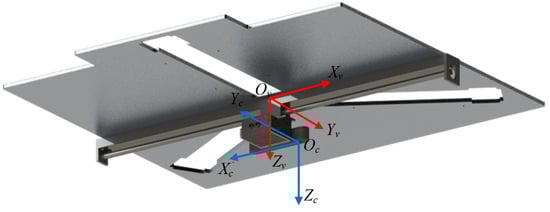
Figure 13.
Coordinate system diagram.
Here, (Xv, Yv, Zv) are the coordinates in the robotic arm coordinate system; (Xc, Yc, Zc) are the coordinates in the camera coordinate system; and θ is the angle of rotation of the camera coordinate system around the Yc-axis.
The coordinate transformation during the camera’s movement is calculated by reading the pulse count from the stepper motor controller during operation, which determines the camera’s movement distance and completes the coordinate transformation during the movement and positioning process. In this study, the stepper motor controller driving the ball screw is an Arduino UNO microcontroller. The stepper motor is a 57-series two-phase stepper motor with a step angle of 1.8°. The stepper motor driver is a Pfied TB6600. The ball screw has a lead (Ph) of 4 mm and a total length of 1070 mm, with a distance of 1000 mm between the left and right limit switches. By substituting the relevant parameters into Equation (10), the camera’s movement distance can be obtained:
where l is the camera’s movement distance, N is the pulse count, and Ph is the lead of the ball screw.
The translation vector deviation of the camera’s origin Oc along the Xc -axis is || = 500 − l. By substituting || into Equation (8), Equation (11) can be obtained.
Through the above steps, the final 3D coordinates of the safflower corolla are obtained. By integrating the safflower corolla object detection algorithm and the safflower corolla spatial positioning algorithm, the MSDP-Net algorithm is developed. This algorithm can detect safflower corollas from complex backgrounds, obtain their 2D detection bounding boxes, and perform spatial positioning of the detected safflower corollas. After coordinate transformation, it outputs the 3D spatial coordinates of the safflower corolla.
3. Experiments
The MSDP-Net algorithm is applied to the control system of the self-developed safflower harvesting robot to perform safflower corolla object detection and spatial positioning. The robotic arm is then controlled based on the positioning information to complete the harvesting task.
3.1. Experimental Environment and Parameter Settings
The hardware environment for model training uses a CPU of 13th Gen Intel(R) Core(TM) i9-13900KF@3.00GHz (Intel, Santa Clara, CA, USA), a GPU of NVIDIA GeForce RTX 4090 24 GB (NVIDIA, Santa Clara, CA, USA), and Kingston DDR5 5600MHz memory (16 GB × 4) (Kingston, Fountain Valley, CA, USA). The operating system is Windows 11, and the network training framework is Pytorch, with parallel computing platform CUDA 11.1 and the CUDA Deep Neural Network library cuDNN v8.0.5. The training is set for 300 epochs, with a batch size of 16 and input image dimensions of 640 × 480. Validation is performed every 50 epochs, recording the precision, recall, and mean average precision. The learning rate and optimizer parameters are adjusted based on the performance on the validation set. Model checkpoints are saved every 100 epochs to ensure that training can be resumed in case of interruption. During the training process, a staged training strategy is employed. In the pre-training phase, the pre-trained YOLO v5m model is used for initial training, and the learning rate and optimizer parameters are adjusted. In the fine-tuning phase, the improved MSDP-Net model is used, incorporating dynamic viewpoint adjustment technology to further optimize the model’s detection performance. In the final phase, comprehensive evaluation is conducted by validating the model using the test set.
The experiments were conducted from 3 July to 10 July 2024, at the safflower plantation base in Jimsar County, Xinjiang Province. The experimental field had a ridge width of 1 m, a row spacing of 0.5 m, and safflower plant heights ranging from 350 mm to 750 mm.
3.2. Performance Comparison Before and After Optimization
Accuracy, recall, mean average precision, frames per second, and model size are used as the performance metrics for evaluating the object detection model. Under the same conditions, experiments were conducted to compare the performance of the YOLO v5m model before and after optimization. Both models were used to detect safflower corolla images from the validation set. The detection results are shown in Figure 14, and the experimental results are presented in Table 4.
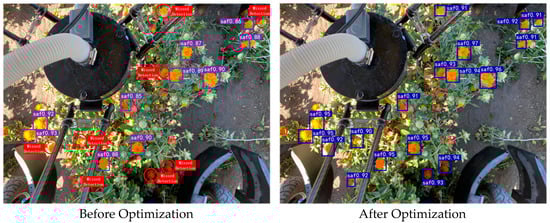
Figure 14.
Comparison of object detection performance before and after optimization.
Table 4.
Various indicators of the model before and after optimization.
As shown in Table 4, the optimized YOLO v5m model demonstrates improvements in the accuracy, recall, and mean average precision to varying degrees. The accuracy increased from 90.22% to 95.20%, a 4.98 percentage point improvement; recall increased from 89.81% to 94.11%, a 4.3 percentage point improvement; and the mean average precision increased from 91.23% to 96.73%, a 5.5 percentage point improvement. The frames per second remained unchanged, and the model size slightly increased. Overall, introducing the CBAM module into the YOLO v5m network effectively improved the model’s performance, reduced missed detections, and enhanced the robustness of the object detection algorithm.
3.3. Spatial Positioning Performance Testing
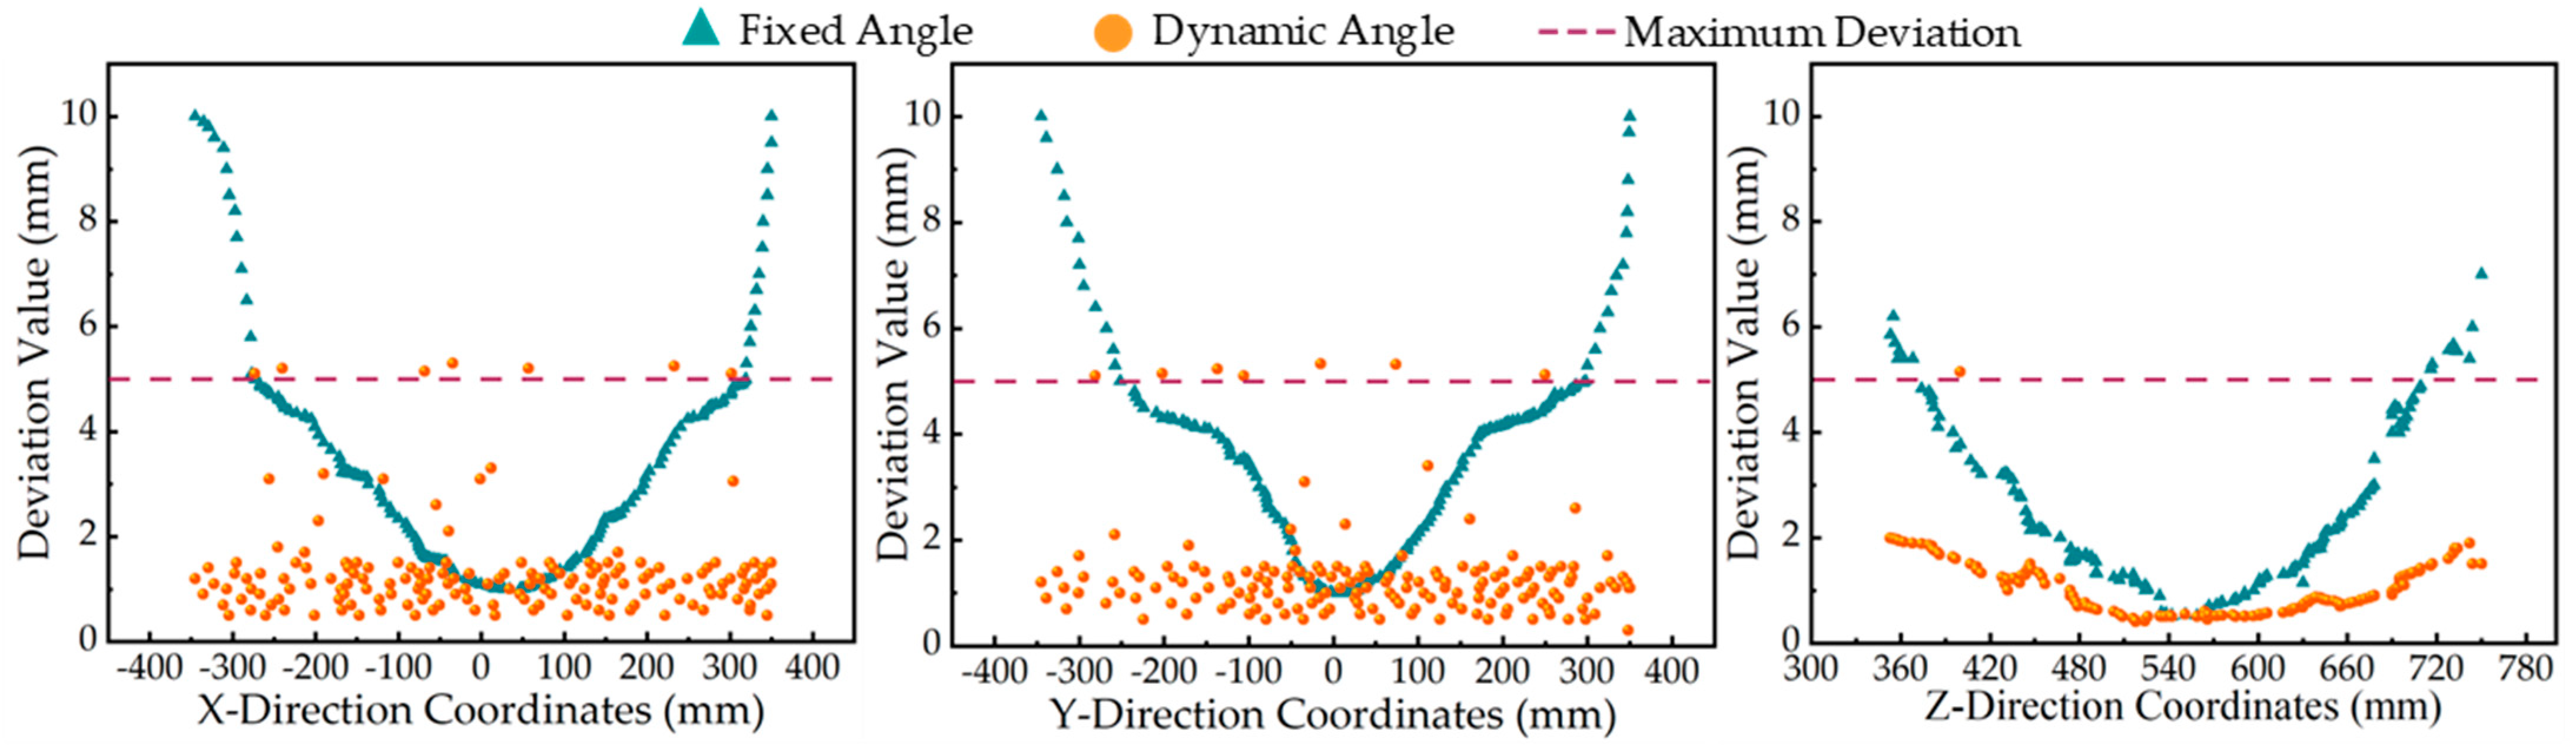
To validate the performance of safflower corolla spatial positioning, 161 safflower corollas in the full blooming stage were randomly selected from a 3 m long ridge. Spatial positioning of the 161 corollas in the region was performed using both fixed-angle and moving-angle positioning methods. A five-line laser level and the DAN-10-150 (Dimetix AG, Widnau, Canton of St. Gallen, Switzerland)laser distance meter with an accuracy of ±0.5 mm were used to measure the true coordinates of each corolla. The output coordinates obtained from the spatial positioning algorithm were compared with the true coordinates. If the deviation in any direction (X, Y, or Z) between the output and true coordinates exceeded 5 mm, the positioning of that corolla was considered a failure. The experimental results are shown in Table 5, and the deviation distributions in the X, Y, and Z directions for the two positioning methods are illustrated in Figure 15.
Table 5.
Position experiment results.
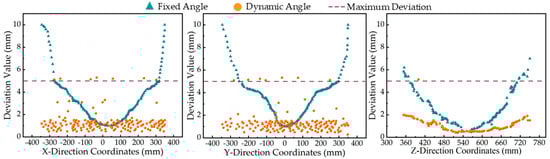
Figure 15.
Deviations in the X, Y, and Z directions for two different position methods.
As shown in Figure 15, the maximum deviation allowed for the robot harvesting condition is 5 mm. If the deviation in any direction (X, Y, or Z) exceeds 5 mm, the robot’s harvesting will fail. Due to the effect of the camera lens imaging, the fixed-camera positioning method only achieves high accuracy in the center of the image, with the accuracy decreasing as it moves toward the edges, resulting in a larger deviation between the output and true coordinates. On the other hand, the moving-camera positioning method effectively overcomes this limitation. It maintains optimal accuracy at any position in the image, and the average deviation between the output coordinates and true coordinates in the X, Y, and Z directions is less than 3 mm, meeting the precision requirements for the harvesting robot.
3.4. Harvesting Experiment
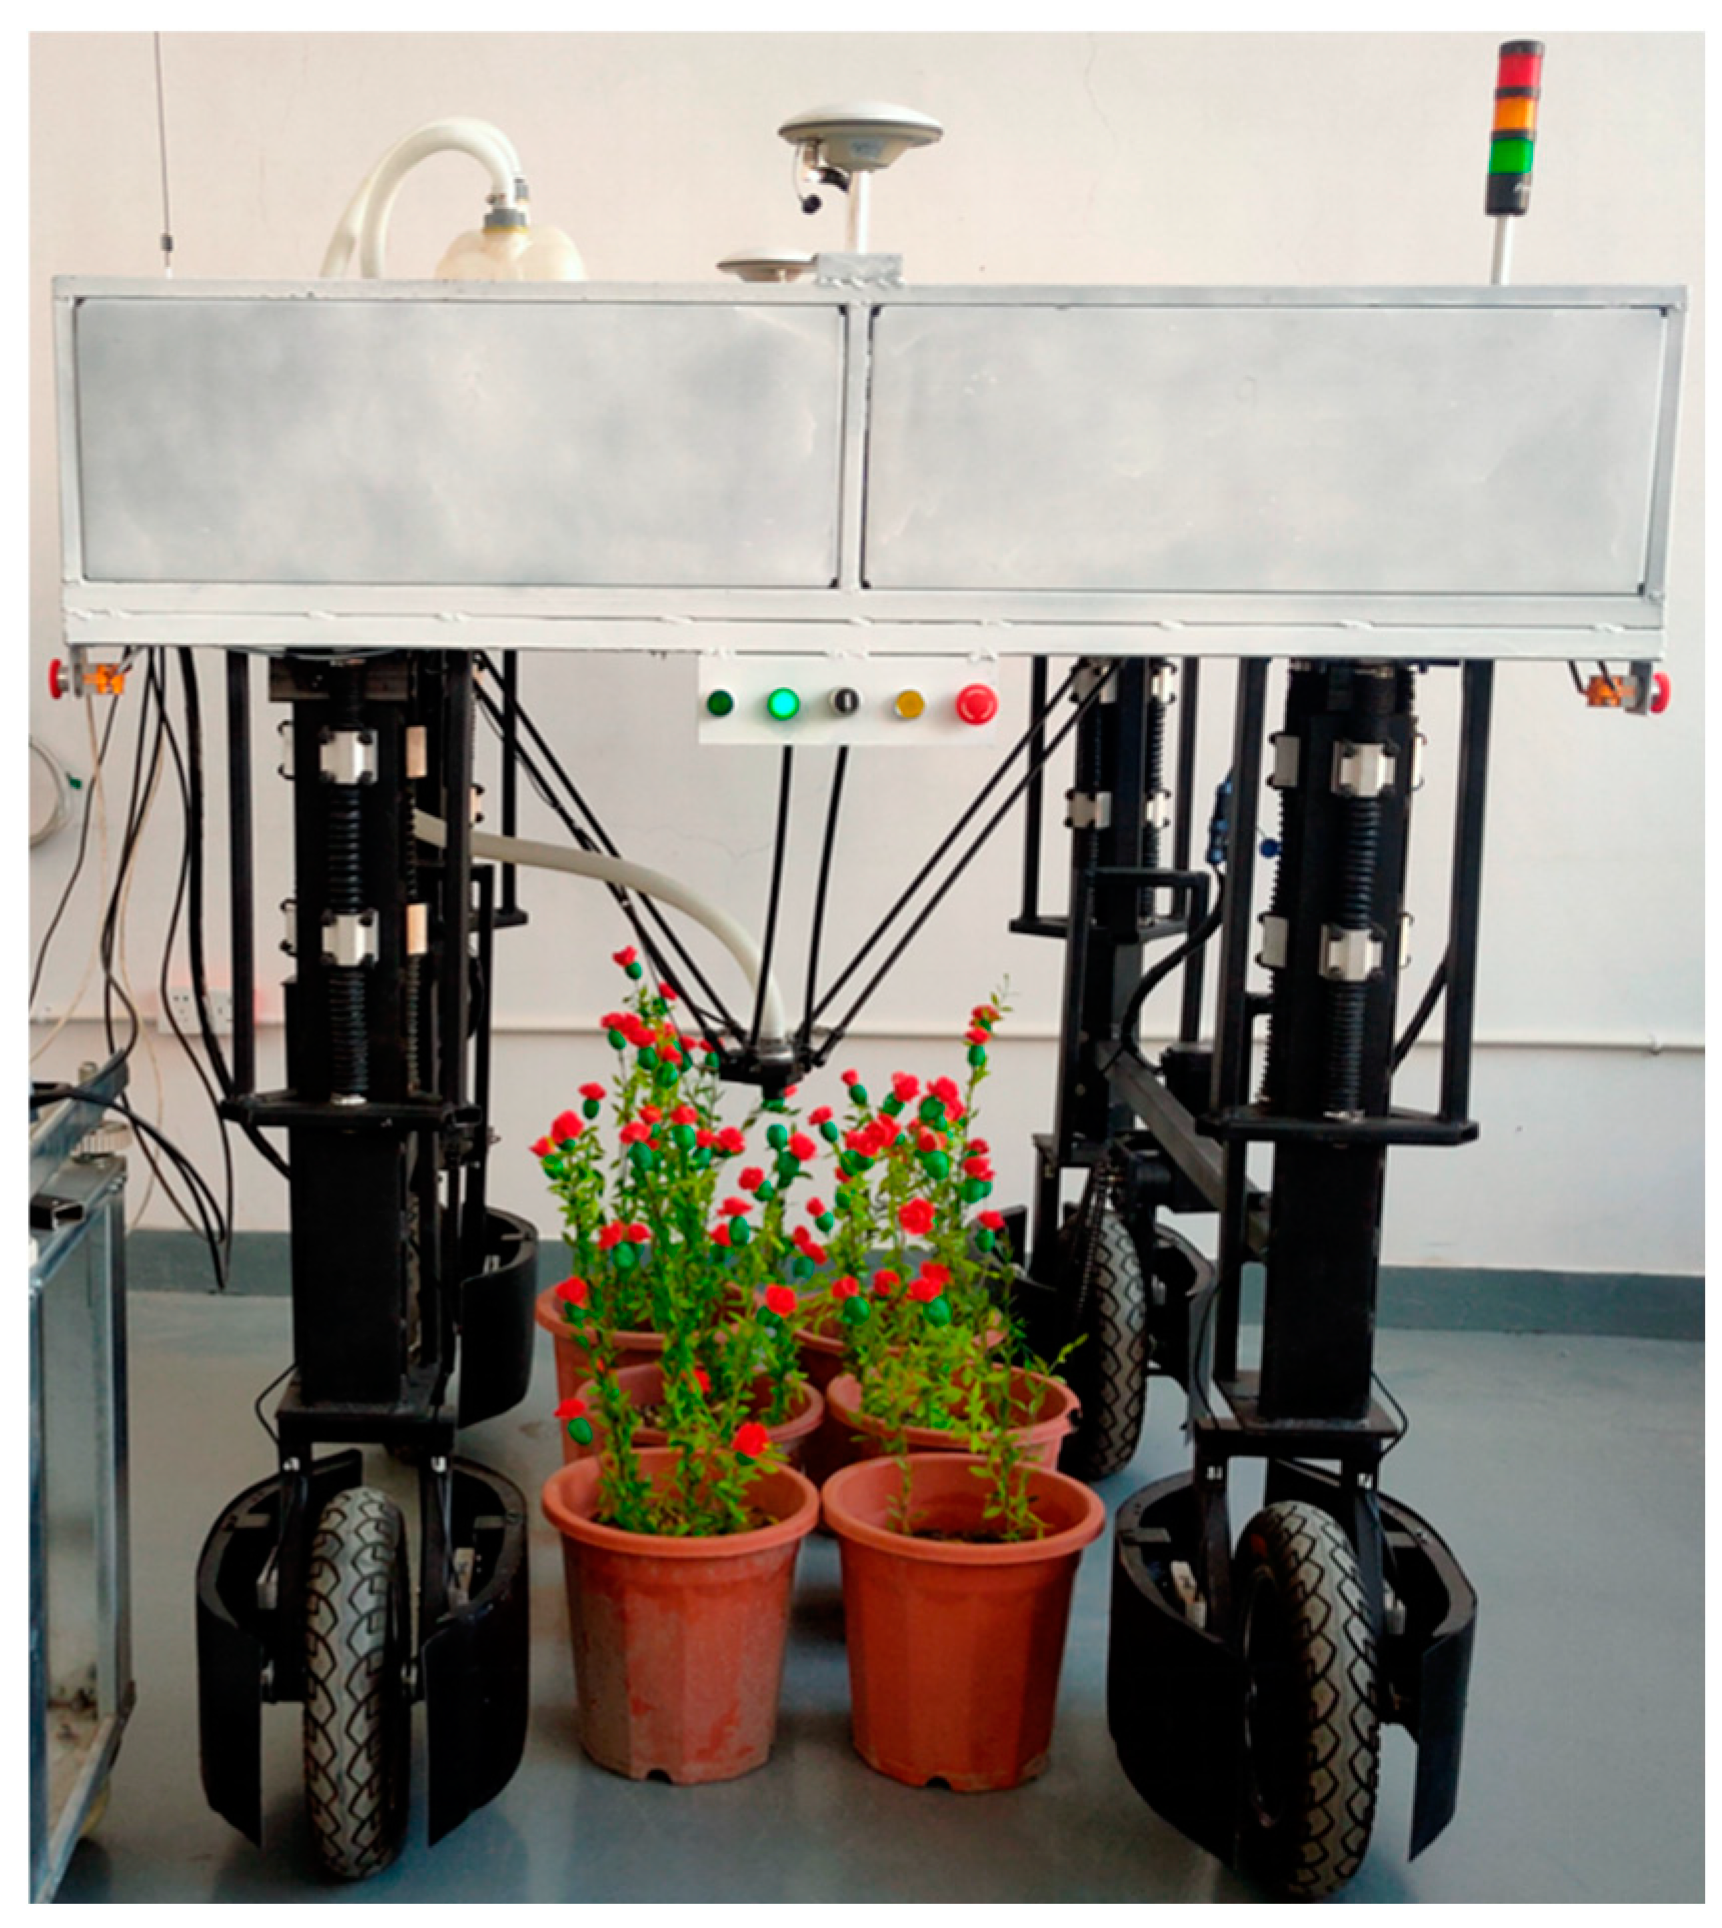
The proposed MSDP-Net algorithm and the mobile detection and positioning method were applied to the self-developed safflower harvesting robot. Pot-grown safflowers were harvested in a laboratory environment. The laboratory operation scene is shown in Figure 16, and the experimental results are presented in Table 6.

Figure 16.
Laboratory work scene.
Table 6.
Harvesting experiment results.
As shown in Table 6, in 500 harvesting experiments, 451 safflower corollas were successfully harvested, 49 were missed, resulting in a harvest success rate of 90.20%.
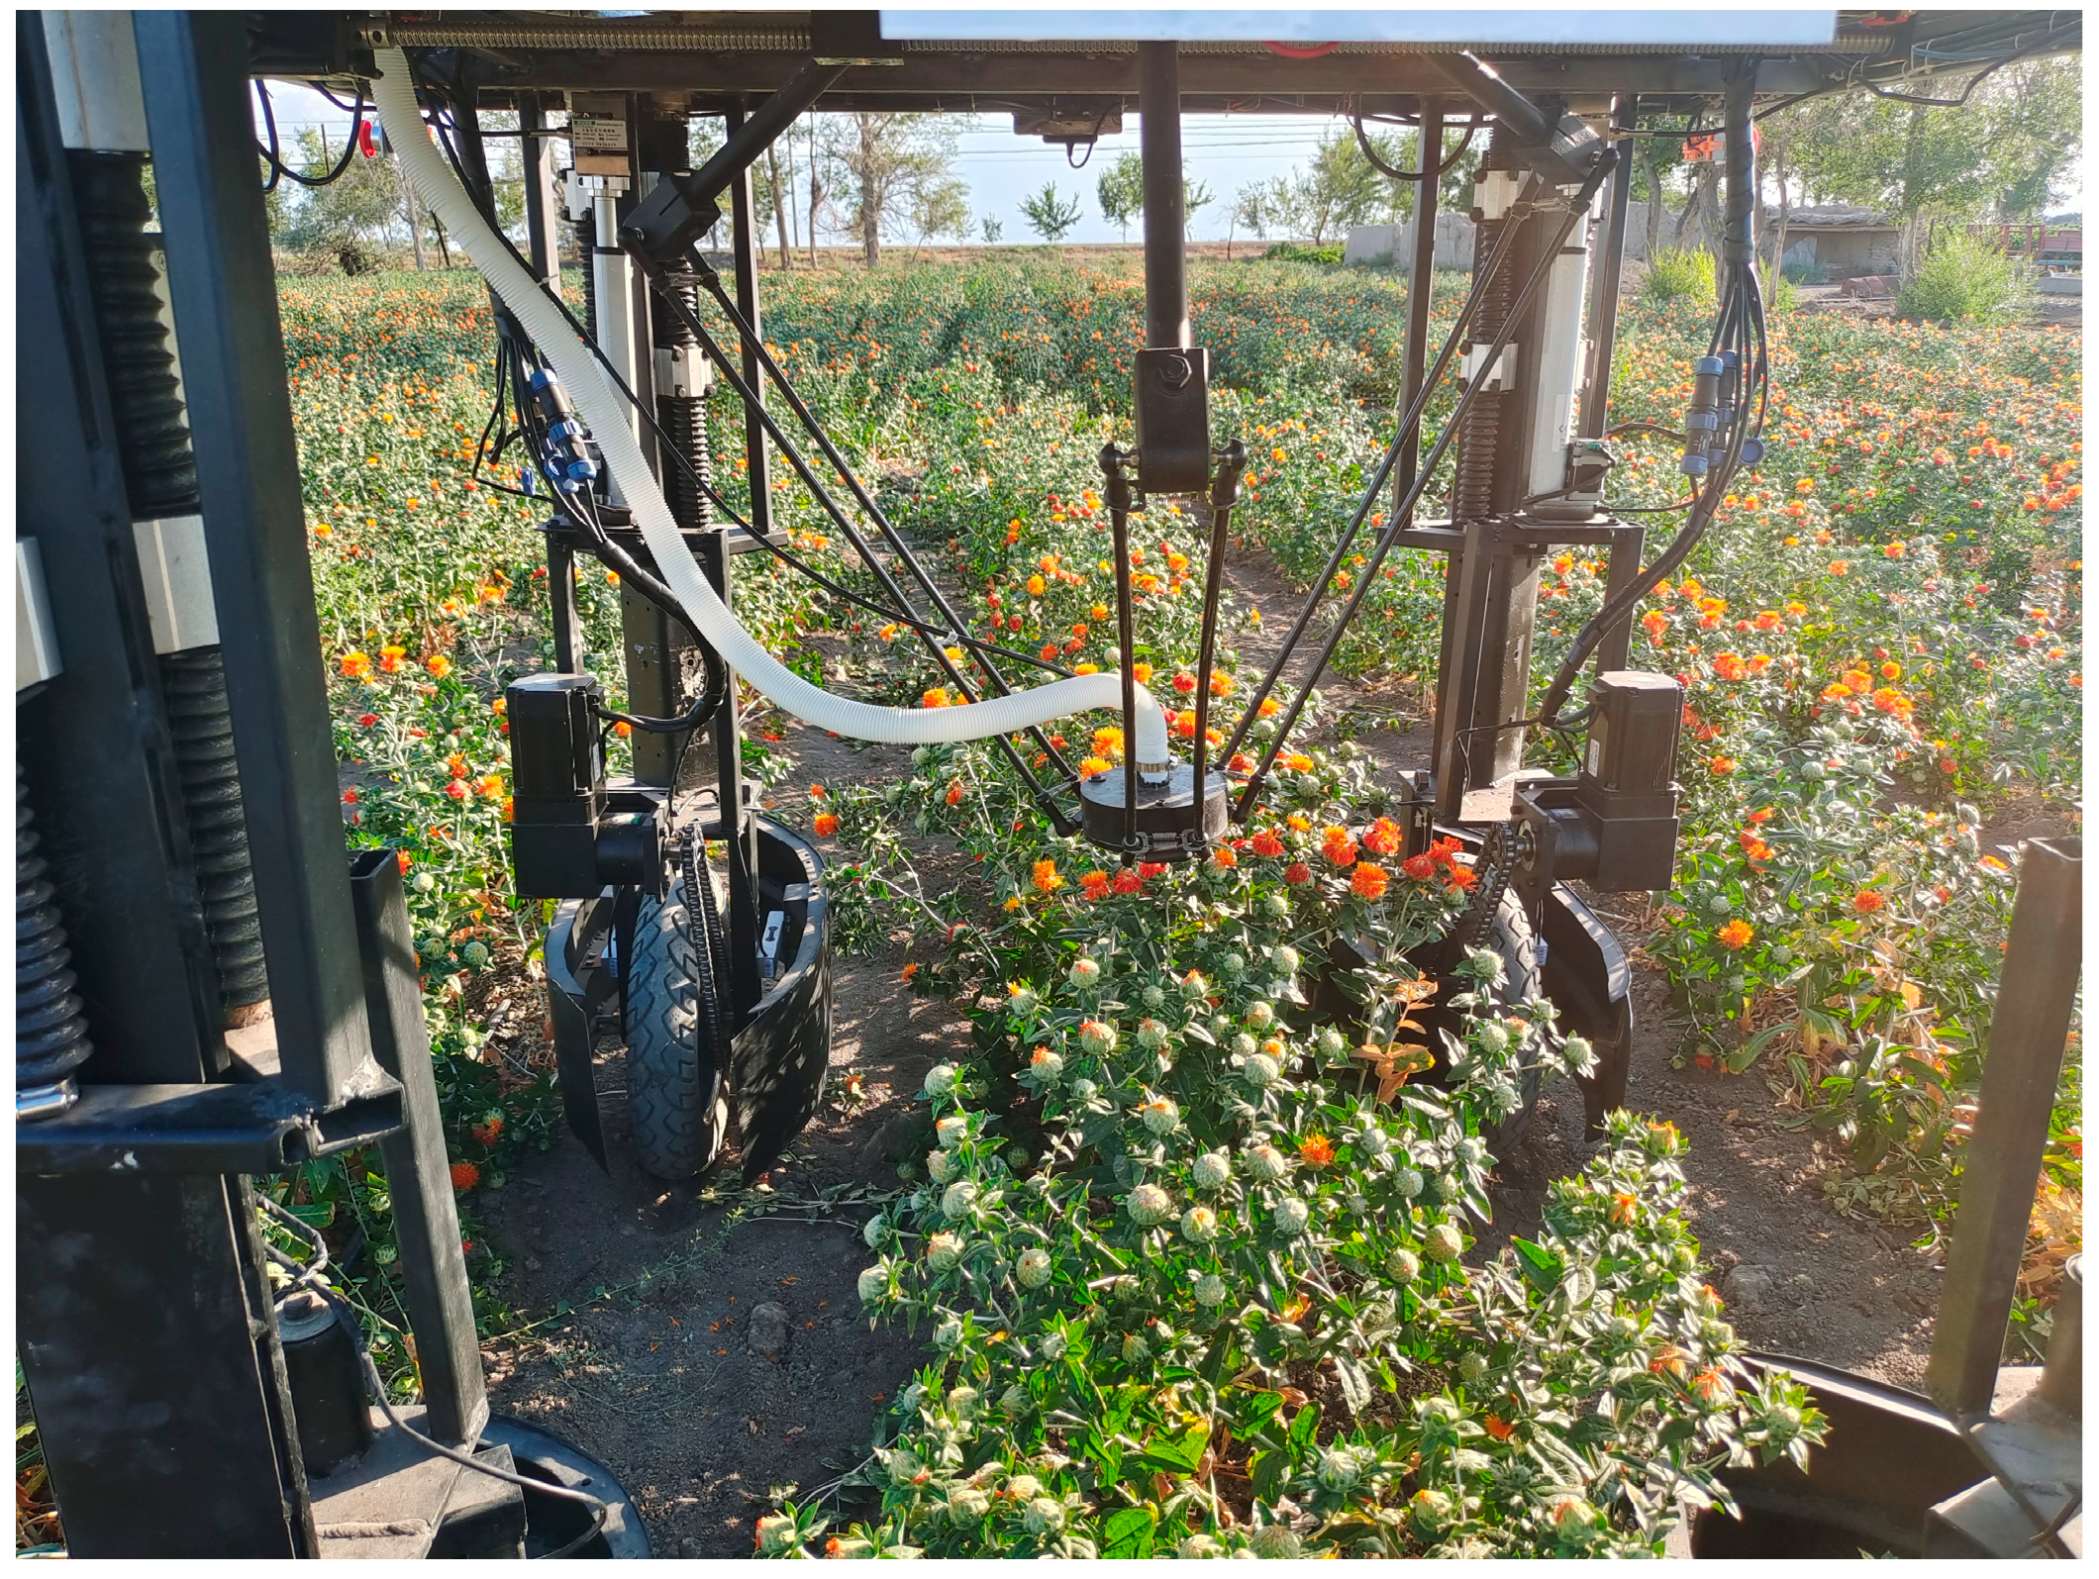
To test the harvesting performance of the robot in a real environment, a safflower row was randomly selected from the safflower plantation, and harvesting experiments were conducted over a 15 m long ridge. The field harvesting test results indicate that the harvest success rate for safflower corollas in the full blooming stage was greater than 90%. The field operation scene is shown in Figure 17.

Figure 17.
Field work scene.
Based on the analysis, the main causes of missed detection in the field are as follows: (1) Some safflower corollas are located at the lowest level of the plants, and the overly dense upper layers of safflower plants block the robotic arm from reaching them. (2) When wind blows, it causes the safflower plants to move uncontrollably, making it difficult to accurately locate the corolla positions.
4. Discussion
The MSDP-Net algorithm proposed in this study, combining the improved YOLO v5m model and dynamic viewpoint adjustment method, significantly enhances the detection accuracy and spatial positioning accuracy of hidden corollas in complex agricultural environments. Experimental results show that compared to the YOLO v5m model, the accuracy, recall, and mean average precision (mAP) have improved by 4.98%, 4.3%, and 5.5%, respectively, validating the effective improvement in detection accuracy brought by the CBAM module.
To highlight the superiority of the MSDP-Net algorithm, the performances of five classic object detection algorithms—Faster R-CNN, YOLO v3, YOLO v4, YOLO v6, and YOLO v7—were tested under the same conditions and compared with the MSDP-Net algorithm. The results are shown in Table 7.
Table 7.
Performance comparison of classic object detection algorithms.
As shown in Table 7, MSDP-Net outperforms five other classic object detection algorithms in multiple aspects, including accuracy, recall, mean average precision (mAP), frames per second (FPS), and model size. Firstly, MSDP-Net achieves an accuracy of 95.20%, which is higher than that of Faster R-CNN (82.60%), YOLOv3 (89.22%), YOLOv4 (89.67%), YOLOv6 (91.31%), and YOLOv7 (91.77%), demonstrating its stronger detection capability in complex environments. Secondly, MSDP-Net has a recall rate of 94.11%, significantly higher than the other algorithms, particularly Faster R-CNN (78.81%) and YOLOv3 (86.49%), indicating its advantage in reducing false negatives. Furthermore, MSDP-Net achieves a mean average precision (mAP) of 96.73%, notably higher than YOLOv7 (92.33%) and other algorithms, proving its superior overall performance in detection tasks. MSDP-Net also achieves a frame rate of 127 FPS, surpassing all other algorithms, especially Faster R-CNN (21 FPS) and YOLOv3 (57 FPS), with a slight improvement over YOLOv7 (88 FPS), ensuring its advantage in real-time detection. Additionally, the model size of MSDP-Net is 83.72 MB, which is smaller than that of YOLOv3 (102.31 MB) and YOLOv4 (95.67 MB), making it more suitable for deployment on resource-constrained devices. Compared to the other five classic object detection algorithms, the proposed MSDP-Net algorithm achieves higher detection accuracy, faster detection speed, and smaller memory usage, demonstrating excellent detection performance that meets the requirements of the harvesting robot. The detection results of the models are shown in Figure 18.
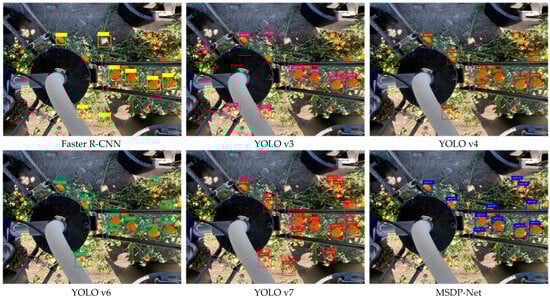
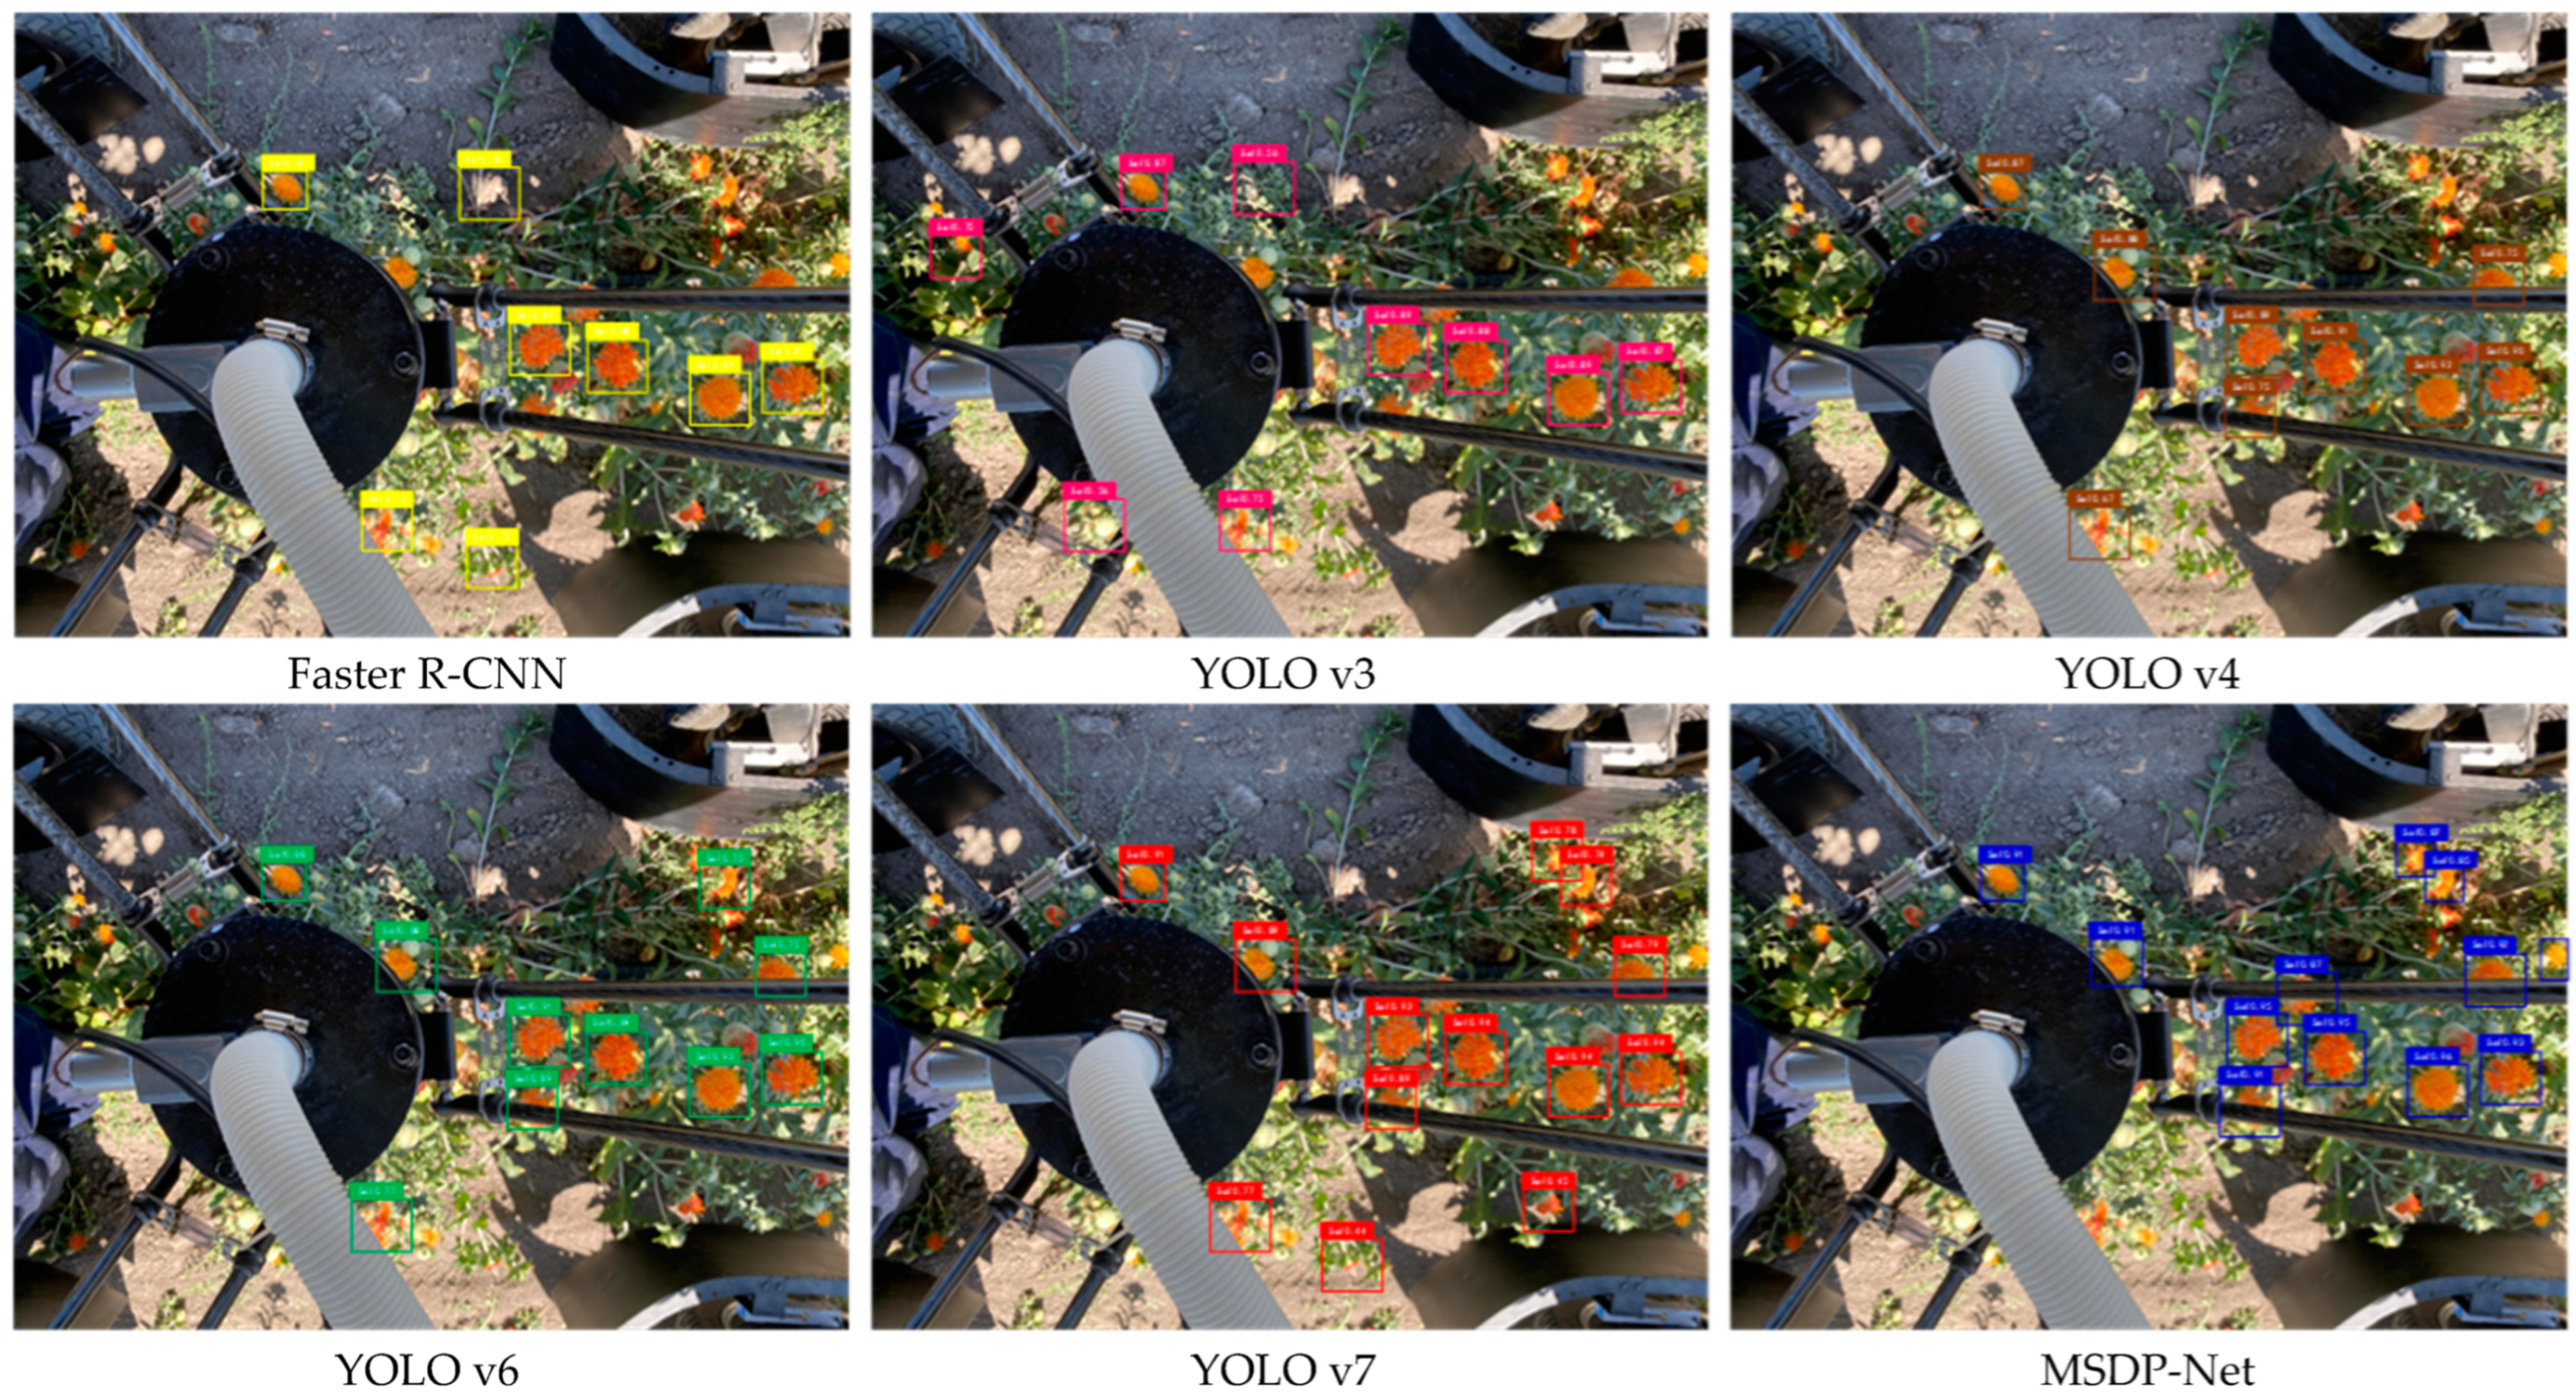
Figure 18.
Detection performances of different models.
Based on the detection results of the six models on the same validation set, Faster R-CNN, YOLO v3, and YOLO v4 all exhibit varying degrees of missed detections. In extreme lighting conditions, especially in images with severe light spot interference, Faster R-CNN and YOLO v3 tend to misclassify the light spots as safflower corollas. While YOLO v6 and YOLO v7 have fewer cases of missed and misdetections, their ability to distinguish between corollas at different stages of maturity, particularly during the blooming and wilting stages, is relatively poor. This could negatively impact the precision of subsequent robotic harvesting. In contrast, the proposed MSDP-Net effectively addresses these issues. It not only reduces the occurrence of missed and misdetections but also demonstrates superior performance in distinguishing safflower corollas at different stages of maturity.
Compared with existing classic object detection algorithms, MSDP-Net demonstrates clear advantages in detection accuracy, recall, and computational speed. Especially in complex field environments, MSDP-Net can effectively reduce the impact of corolla occlusion and lighting variations, thereby improving the accuracy of object detection.
Compared to existing safflower corolla detection algorithms, the MSDP-Net proposed in this study demonstrates excellent performance. Compared to YOLO-SaFi, proposed by Chen 2023. [19], MSDP-Net improves accuracy by 4.3%, recall by 9.6%, and mAP by 4.83%. When compared to WED-YOLO, proposed by Zhang 2025. [32], MSDP-Net increases accuracy, recall, and mAP by 2.05%, 7.4%, and 1.7%, respectively. Compared to YOLOv5s-MCD, proposed by Chen 2024. [33], MSDP-Net improves accuracy, recall, and mAP by 4.98%, 4.3%, and 5.5%, respectively. In addition, MSDP-Net maintains a good balance in terms of FPS and model size, ensuring efficient real-time detection capabilities. Overall, by optimizing the YOLOv5m architecture and incorporating the Convolutional Block Attention Module (CBAM), MSDP-Net significantly enhances the precision and robustness of small-object detection, making it especially suitable for automated object detection tasks in complex agricultural environments.
5. Conclusions
This study proposes the MSDP-Net algorithm, based on the improved YOLO v5m model and dynamic viewpoint adjustment technology, for the precise detection and spatial positioning of safflower corollas. Experimental results demonstrate that MSDP-Net exhibits significant performance advantages in complex agricultural environments, effectively addressing the accuracy limitations and occlusion issues faced with traditional object detection methods in small corolla detection. In particular, in field environments, MSDP-Net achieves a detection accuracy and positioning accuracy of 95.20% and 93.79%, respectively, with an application success rate exceeding 90% in harvesting robots, validating its feasibility and effectiveness in real-world scenarios.
Despite the promising experimental results, there are still certain limitations, such as performance fluctuations under strong light and dynamic conditions, as well as issues with the model’s adaptability to diverse plant environments. Future research can explore the following directions: (1) optimizing the model’s computational efficiency to meet the real-time harvesting requirements; (2) further enhancing the algorithm’s adaptability to extreme environmental conditions, such as by integrating additional sensor information or employing advanced deep learning techniques to handle occlusion in complex scenarios; and (3) considering the application of this method to the harvesting tasks of other crops, such as edible roses, which are similar to safflowers in terms of growth at the top and similar color and appearance features, to verify its versatility in broader agricultural environments.
Author Contributions
Conceptualization, H.G. and H.C.; investigation, T.W.; resources, H.G. and H.C.; writing—original draft preparation, H.C.; writing—review and editing, H.G. and T.W.; supervision, H.G. and T.W.; project administration, H.G. and H.C.; funding acquisition, H.G. and T.W. All authors have read and agreed to the published version of the manuscript.
Funding
This research was funded by the Natural Science Foundation of Xinjiang Uygur Autonomous Region (2022D01A117).
Institutional Review Board Statement
Not applicable.
Data Availability Statement
The raw data supporting the conclusions of this article will be made available by the authors on request.
Conflicts of Interest
The authors declare no conflicts of interest.
References
- Zhang, H.; Ge, Y.; Sun, C.; Zeng, H.; Liu, N. Picking Path Planning Method of Dual Rollers Type Safflower Picking Robot Based on Improved Ant Colony Algorithm. Processes 2022, 10, 1213. [Google Scholar] [CrossRef]
- Guo, H.; Luo, D.; Gao, G.; Wu, T.; Diao, H. Design and experiment of a safflower picking robot based on a parallel manipulator. Eng. Agric. 2022, 42, e20210129. [Google Scholar] [CrossRef]
- Xing, Z.; Zhang, Z.; Shi, R.; Guo, Q.; Zeng, C. Filament-necking localization method via combining improved PSO with rotated rectangle algorithm for safflower-picking robots. Comput. Electron. Agric. 2023, 215, 108464. [Google Scholar] [CrossRef]
- Zhang, Z.; Shi, R.; Xing, Z.; Guo, Q.; Zeng, C. Improved Faster Region-Based Convolutional Neural Networks (R-CNN) Model Based on Split Attention for the Detection of Safflower Filaments in Natural Environments. Agronomy 2023, 13, 2596. [Google Scholar] [CrossRef]
- de Oliveira Neto, S.S.; Zeffa, D.M.; Freiria, G.H.; Zoz, T.; da Silva, C.J.; Zanotto, M.D.; Sobrinho, R.L.; Alamri, S.A.; Okla, M.K.; AbdElgawad, H. Adaptability and Stability of Safflower Genotypes for Oil Production. Plants 2022, 11, 708. [Google Scholar] [CrossRef]
- Guo, H.; Qiu, Z.; Gao, G.; Wu, T.; Chen, H.; Wang, X. Safflower Picking Trajectory Planning Strategy Based on an Ant Colony Genetic Fusion Algorithm. Agriculture 2024, 14, 622. [Google Scholar] [CrossRef]
- Thorp, K.R.; Dierig, D.A. Color image segmentation approach to monitor flowering in lesquerella. Ind. Crops Prod. 2011, 34, 1150–1159. [Google Scholar] [CrossRef]
- Li, C.; Song, Z.; Wang, Y.; Zhang, Y. Research on bud counting of cut lily flowers based on machine vision. Multimed. Tools Appl. 2023, 82, 2709–2730. [Google Scholar] [CrossRef]
- Guru, D.S.; Kumar, Y.H.S.; Manjunath, S. Textural features in flower classification. Math. Comput. Model. 2011, 54, 1030–1036. [Google Scholar] [CrossRef]
- Peng, X.; Jia, H.; Lang, C. Modified dragonfly algorithm based multilevel thresholding method for color images segmentation. Math. Biosci. Eng. 2019, 16, 6467–6511. [Google Scholar] [CrossRef]
- Hocevar, M.; Sirok, B.; Godesa, T.; Stopar, M. Flowering estimation in apple orchards by image analysis. Precis. Agric. 2014, 15, 466–478. [Google Scholar] [CrossRef]
- Williams, H.; Nejati, M.; Hussein, S.; Penhall, N.; Lim, J.Y.; Jones, M.H.; Bell, J.; Ahn, H.S.; Bradley, S.; Schaare, P.; et al. Autonomous pollination of individual kiwifruit flowers: Toward a robotic kiwifruit pollinator. J. Field Robot. 2020, 37, 246–262. [Google Scholar] [CrossRef]
- Dias, P.A.; Tabb, A.; Medeiros, H. Apple flower detection using deep convolutional networks. Comput. Ind. 2018, 99, 17–28. [Google Scholar] [CrossRef]
- Farjon, G.; Krikeb, O.; Bar Hiller, A.; Alchanatis, V. Detection and counting of flowers on apple trees for better chemical thinning decisions. Precis. Agric. 2020, 21, 503–521. [Google Scholar] [CrossRef]
- Gogul, I.; Kumar, V.S. Flower species recognition system using convolution neural networks and transfer learning. In Proceedings of the 2017 Fourth International Conference on Signal Processing, Communication and Networking (ICSCN), Chennai, India, 16–18 March 2017; pp. 1–6. [Google Scholar] [CrossRef]
- Zhao, C.J.; Wen, C.W.; Lin, S.; Guo, W.Z.; Long, J.H. Tomato florescence recognition and detection method based on cascaded neural network. Trans. Chin. Soc. Agric. Eng. 2020, 36, 143–152. [Google Scholar] [CrossRef]
- Xia, H.M.; Zhao, K.D.; Jiang, L.H.; Liu, Y.J.; Zhen, W.B. Flower bud detection model for hydroponic Chinese kale based on the fusion of attention mechanism and multi-scale feature. Trans. Chin. Soc. Agric. Eng. 2021, 37, 161–168. [Google Scholar] [CrossRef]
- Tian, M.; Chen, H.; Wang, Q. Detection and Recognition of Flower Image Based on SSD network in Video Stream. J. Phys. Conf. Ser. 2019, 1237, 032045. [Google Scholar] [CrossRef]
- Zhao, W.; Wu, D.; Zheng, X. Detection of Chrysanthemums Inflorescence Based on Improved CR-YOLOv5s Algorithm. Sensors 2023, 23, 4234. [Google Scholar] [CrossRef]
- Liu, J.; Yang, S.; Tian, L.; Guo, W.; Zhou, B.; Jia, J.; Ling, H. Multi-Component Fusion Network for Small Object Detection in Remote Sensing Images. IEEE Access 2019, 7, 128339–128352. [Google Scholar] [CrossRef]
- Nhat-Duy, N.; Tien Van, D.; Thanh Duc, N.; Duy-Dinh, L. An Evaluation of Deep Learning Methods for Small Object Detection. J. Electr. Comput. Eng. 2020, 2020, 3189691. [Google Scholar] [CrossRef]
- Renau-Morata, B.; Nebauer, S.G.; Garcia-Carpintero, V.; Canizares, J.; Gomez Minguet, E.; de los Mozos, M.; Molina, R.V. Flower induction and development in saffron: Timing and hormone signalling pathways. Ind. Crops Prod. 2021, 164, 113370. [Google Scholar] [CrossRef]
- Bi, Q.; Wang, M.; Huang, Y.; Lai, M.; Liu, Z.; Bi, X. Ship Collision Avoidance Navigation Signal Recognition via Vision Sensing and Machine Forecasting. IEEE Trans. Intell. Transp. Syst. 2023, 24, 11743–11755. [Google Scholar] [CrossRef]
- Mathew, M.P.; Mahesh, T.Y. Leaf-based disease detection in bell pepper plant using YOLO v5. Signal Image Video Process. 2022, 16, 841–847. [Google Scholar] [CrossRef]
- Wang, Z.; Jin, L.; Wang, S.; Xu, H. Apple stem/calyx real-time recognition using YOLO-v5 algorithm for fruit automatic loading system. Postharvest Biol. Technol. 2022, 185, 111808. [Google Scholar] [CrossRef]
- Ma, H.; Huang, W.; Dong, Y.; Liu, L.; Guo, A. Using UAV-Based Hyperspectral Imagery to Detect Winter Wheat Fusarium Head Blight. Remote Sens. 2021, 13, 3024. [Google Scholar] [CrossRef]
- Woo, S.; Park, J.; Lee, J.-Y.; So Kweon, I. CBAM: Convolutional Block Attention Module. arXiv 2018, arXiv:1807.06521. [Google Scholar]
- Yang, B.; Gao, Z.; Gao, Y.; Zhu, Y. Rapid Detection and Counting of Wheat Ears in the Field Using YOLOv4 with Attention Module. Agronomy 2021, 11, 1202. [Google Scholar] [CrossRef]
- Wang, Q.; Cheng, M.; Huang, S.; Cai, Z.; Zhang, J.; Yuan, H. A deep learning approach incorporating YOLO v5 and attention mechanisms for field real-time detection of the invasive weed Solanum rostratum Dunal seedlings. Comput. Electron. Agric. 2022, 199, 107194. [Google Scholar] [CrossRef]
- Chen, Z.; Li, X.; Wang, L.; Shi, Y.; Sun, Z.; Sun, W. An Object Detection and Localization Method Based on Improved YOLOv5 for the Teleoperated Robot. Appl. Sci. 2022, 12, 11441. [Google Scholar] [CrossRef]
- Li, Y. A calibration method of computer vision system based on dual attention mechanism. Image Vis. Comput. 2020, 103, 104039. [Google Scholar] [CrossRef]
- Zhang, Z.; Wang, Y.; Xu, P.; Shi, R.; Xing, Z.; Li, J. WED-YOLO: A Detection Model for Safflower Under Complex Unstructured Environment. Agriculture 2025, 15, 205. [Google Scholar] [CrossRef]
- Chen, B.; Ding, F.; Ma, B.; Liu, X.; Ning, S. Research on the Detection Method of Safflower Filaments in Natural Environment Based on Improved YOLOv5s. IEEE Access 2024, 12, 126244–126257. [Google Scholar] [CrossRef]


Disclaimer/Publisher’s Note: The statements, opinions and data contained in all publications are solely those of the individual author(s) and contributor(s) and not of MDPI and/or the editor(s). MDPI and/or the editor(s) disclaim responsibility for any injury to people or property resulting from any ideas, methods, instructions or products referred to in the content. |
© 2025 by the authors. Licensee MDPI, Basel, Switzerland. This article is an open access article distributed under the terms and conditions of the Creative Commons Attribution (CC BY) license (https://creativecommons.org/licenses/by/4.0/).