Using Satellites to Monitor Soil Texture in Typical Black Soil Areas and Assess Its Impact on Crop Growth


Abstract
:1. Introduction
2. Materials and Methods
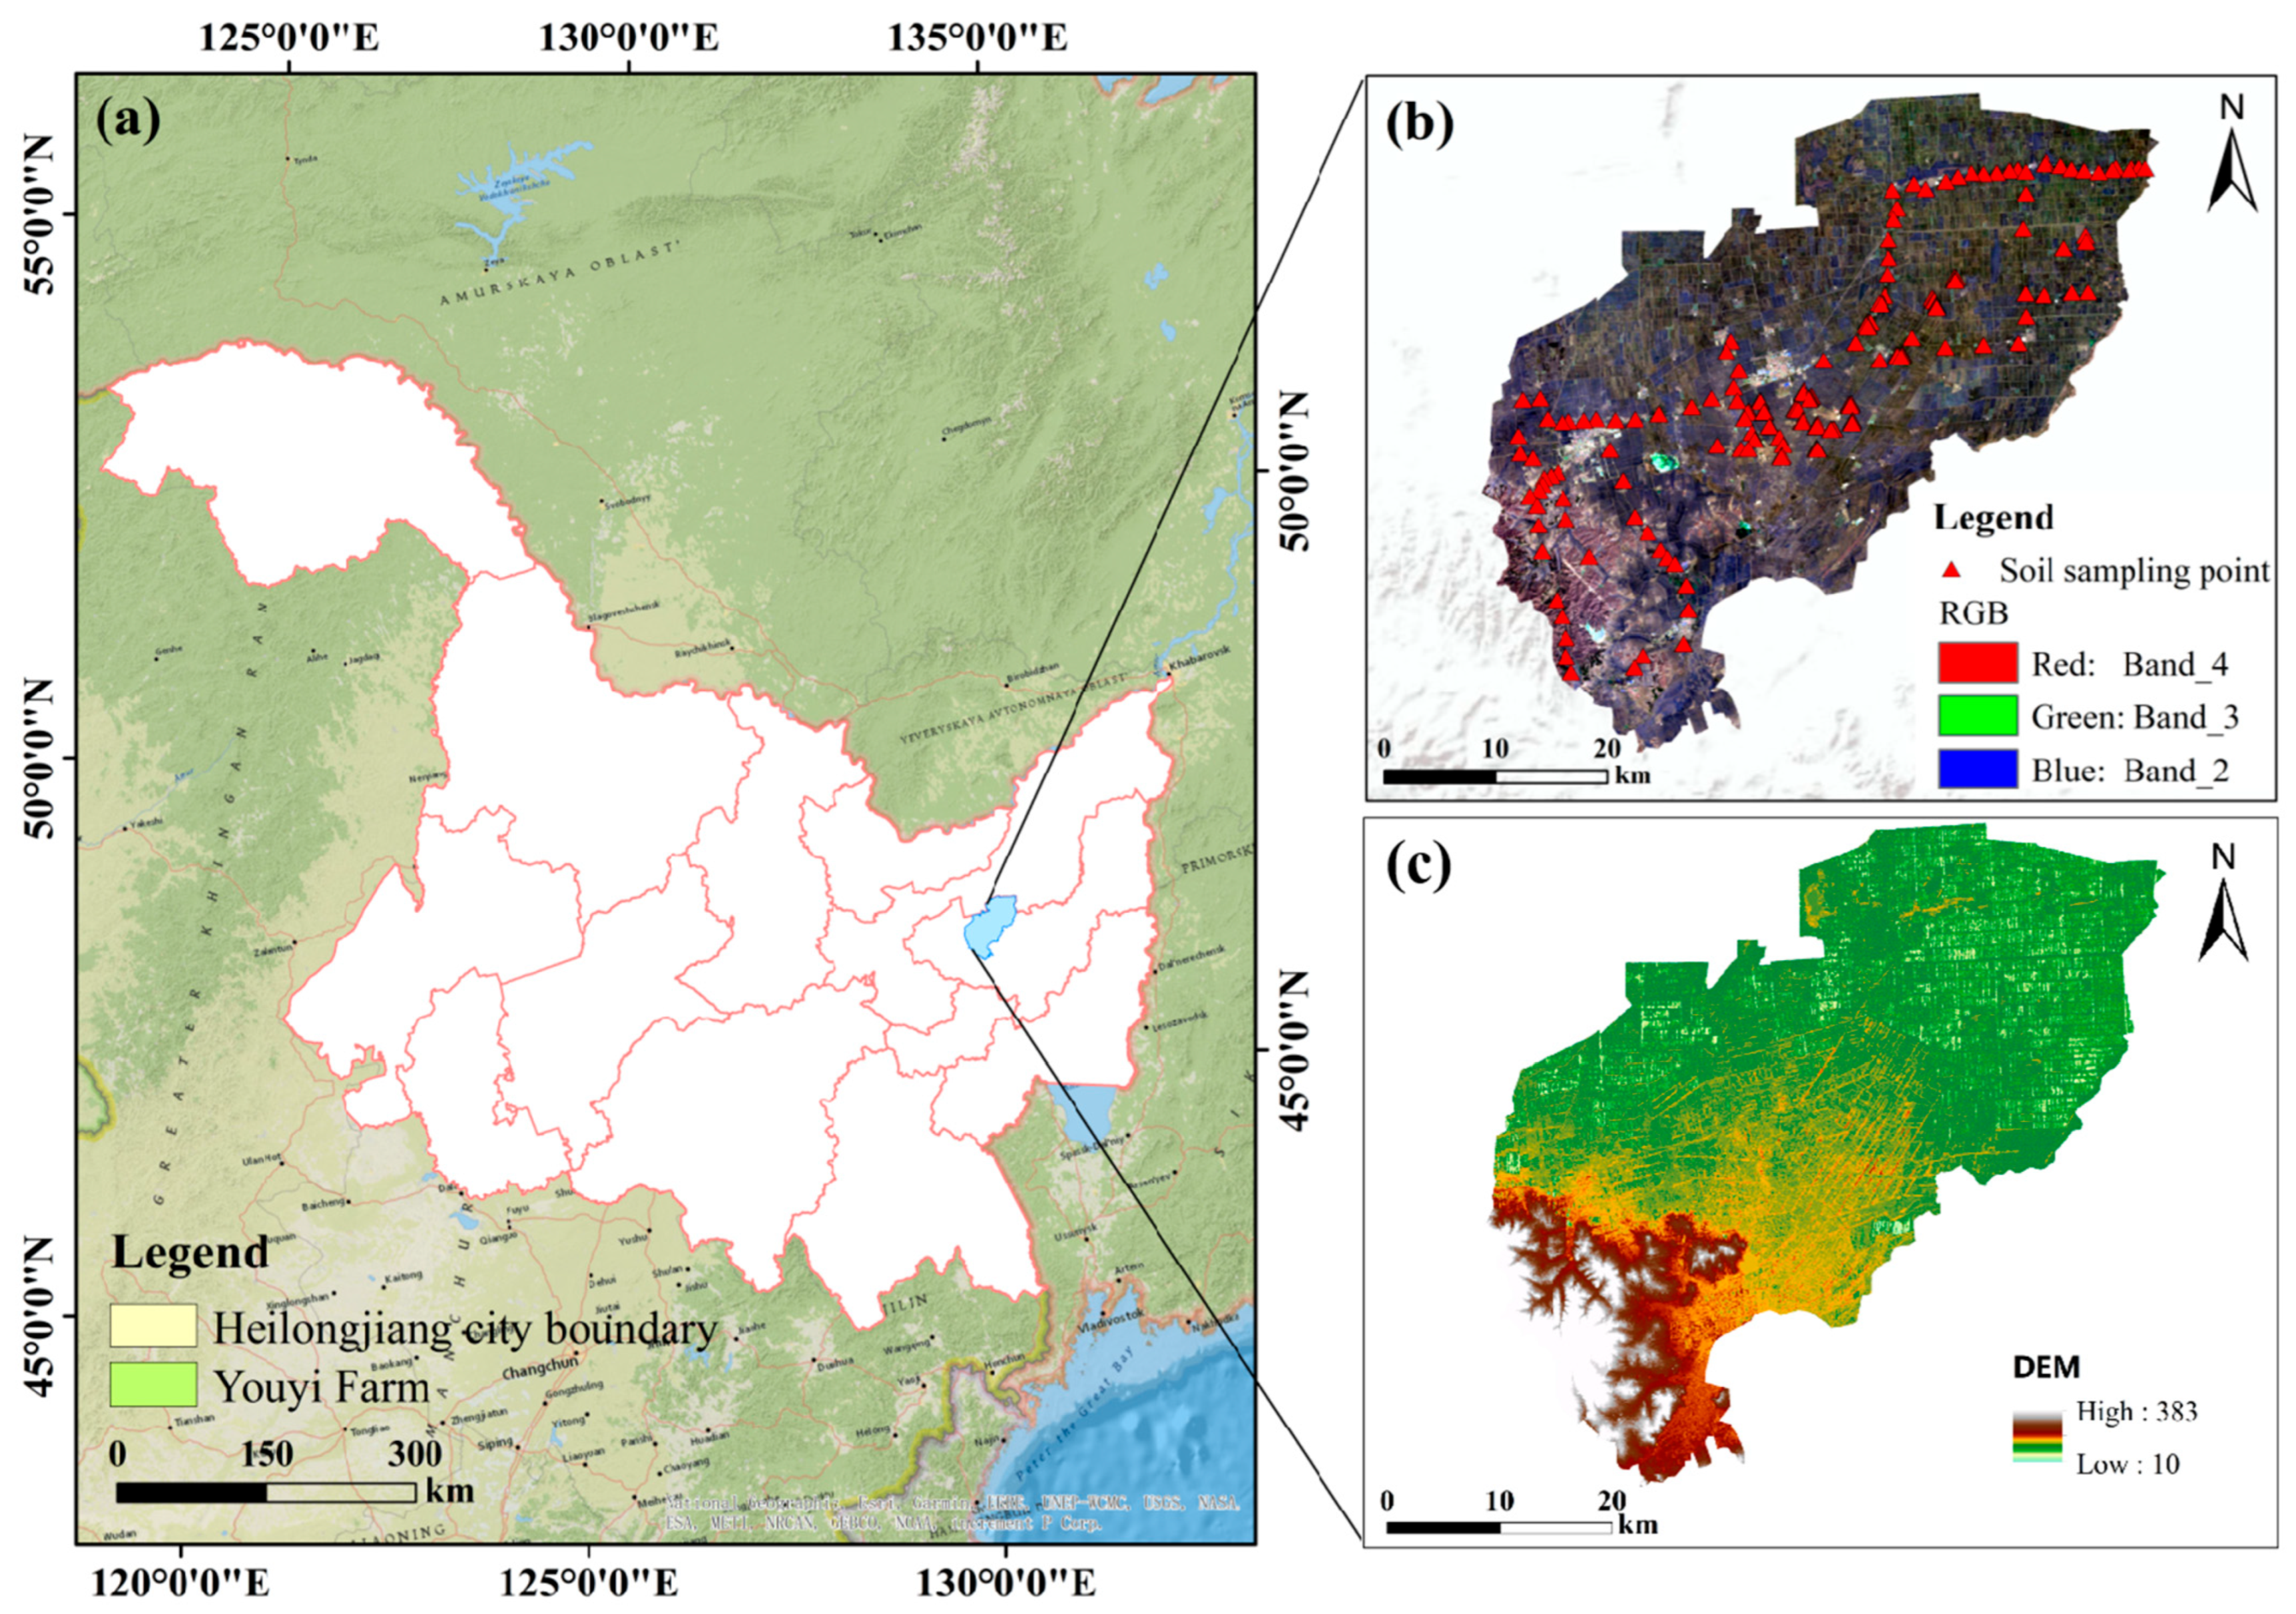
2.1. Study Area
2.2. Data Acquisition and Processing
2.2.1. Sample Point Data Acquisition
2.2.2. Image Acquisition and Treatment
2.2.3. Environmental Covariate Acquisition and Treatment
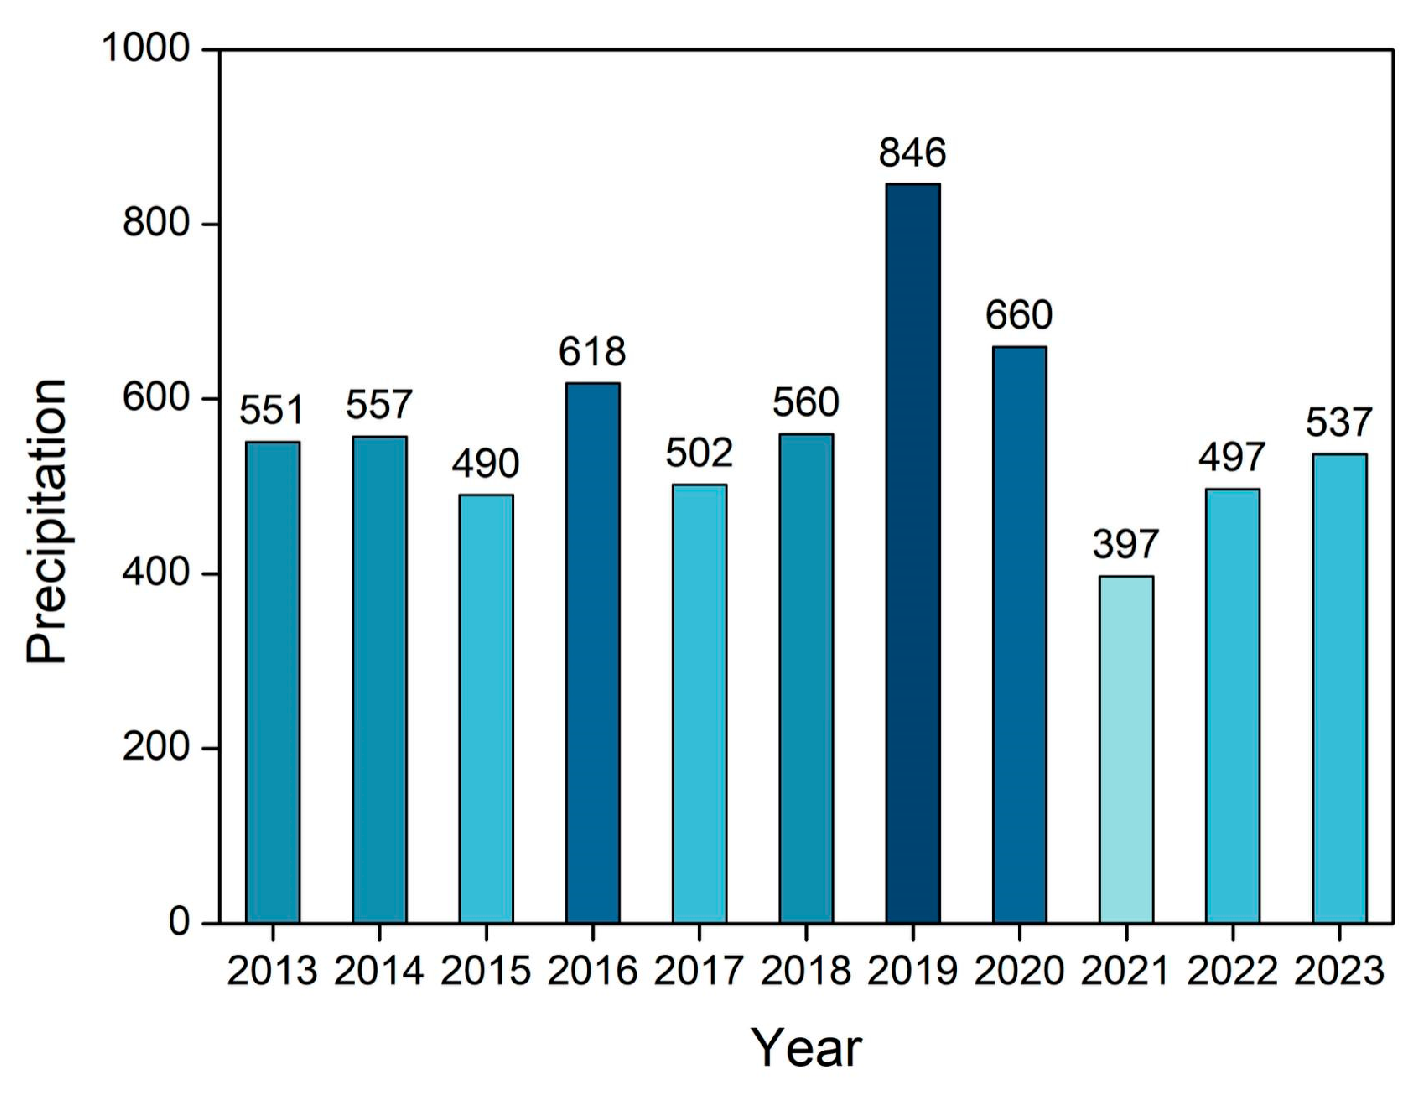
- Multiyear average precipitation (PRE): Precipitation plays a direct role in determining soil moisture levels, which subsequently impacts the transformation, movement, leaching, and accumulation of minerals, organic matter, and their byproducts within the soil [25]. This research utilizes the “total_precipitation” variable from the “ERA5 Monthly Aggregates” dataset available in Google Earth Engine (GEE) to compute the monthly average precipitation for the study area from 1979 to 2020, which serves as the multiyear average precipitation index.
- Multiyear average temperature (AT): Air temperature influences soil temperature and a wide range of physical, chemical, and biological processes. Moreover, variations in temperature lead to changes in soil properties and behavior [26]. In this research, the “mean_2m_air_temperature” variable from the “ERA5 Monthly Aggregates” dataset available in Google Earth Engine (GEE) is employed to compute the monthly average temperature for the study area from 1979 to 2020, which serves as the multiyear average temperature index.
- Elevation (DEM): Elevation indirectly influences soil properties by driving the redistribution of matter and energy in mountainous regions. As temperature, precipitation, and humidity vary with altitude, distinct climate and vegetation zones emerge, leading to pronounced vertical stratification in soil composition and physicochemical characteristics [27]. In this study, the “Elevation” dataset from the “NASADEM: NASA NASADEM Digital Elevation 30 m” collection, accessible through Google Earth Engine (GEE), is employed as the elevation input for the study area.
- Slope (SL): In steep terrains, limited infiltration and intense erosion hinder the accumulation of soil organic matter. Conversely, flat areas with slow water flow, reduced hydraulic erosion, and minimal loss of topsoil and nutrients provide more favorable conditions for organic matter accumulation [28]. The research employs the “Elevation” dataset from the “NASADEM: NASA” collection available in Google Earth Engine (GEE) to derive the “Slope” parameter, which serves as the slope input for the study area.
2.3. Prediction Model
2.4. Extraction of Crop Growth Status
2.5. Correlation Analysis
2.6. Analysis of the Influence of Soil Moisture Content on the Prediction Accuracy of Soil Texture
3. Results
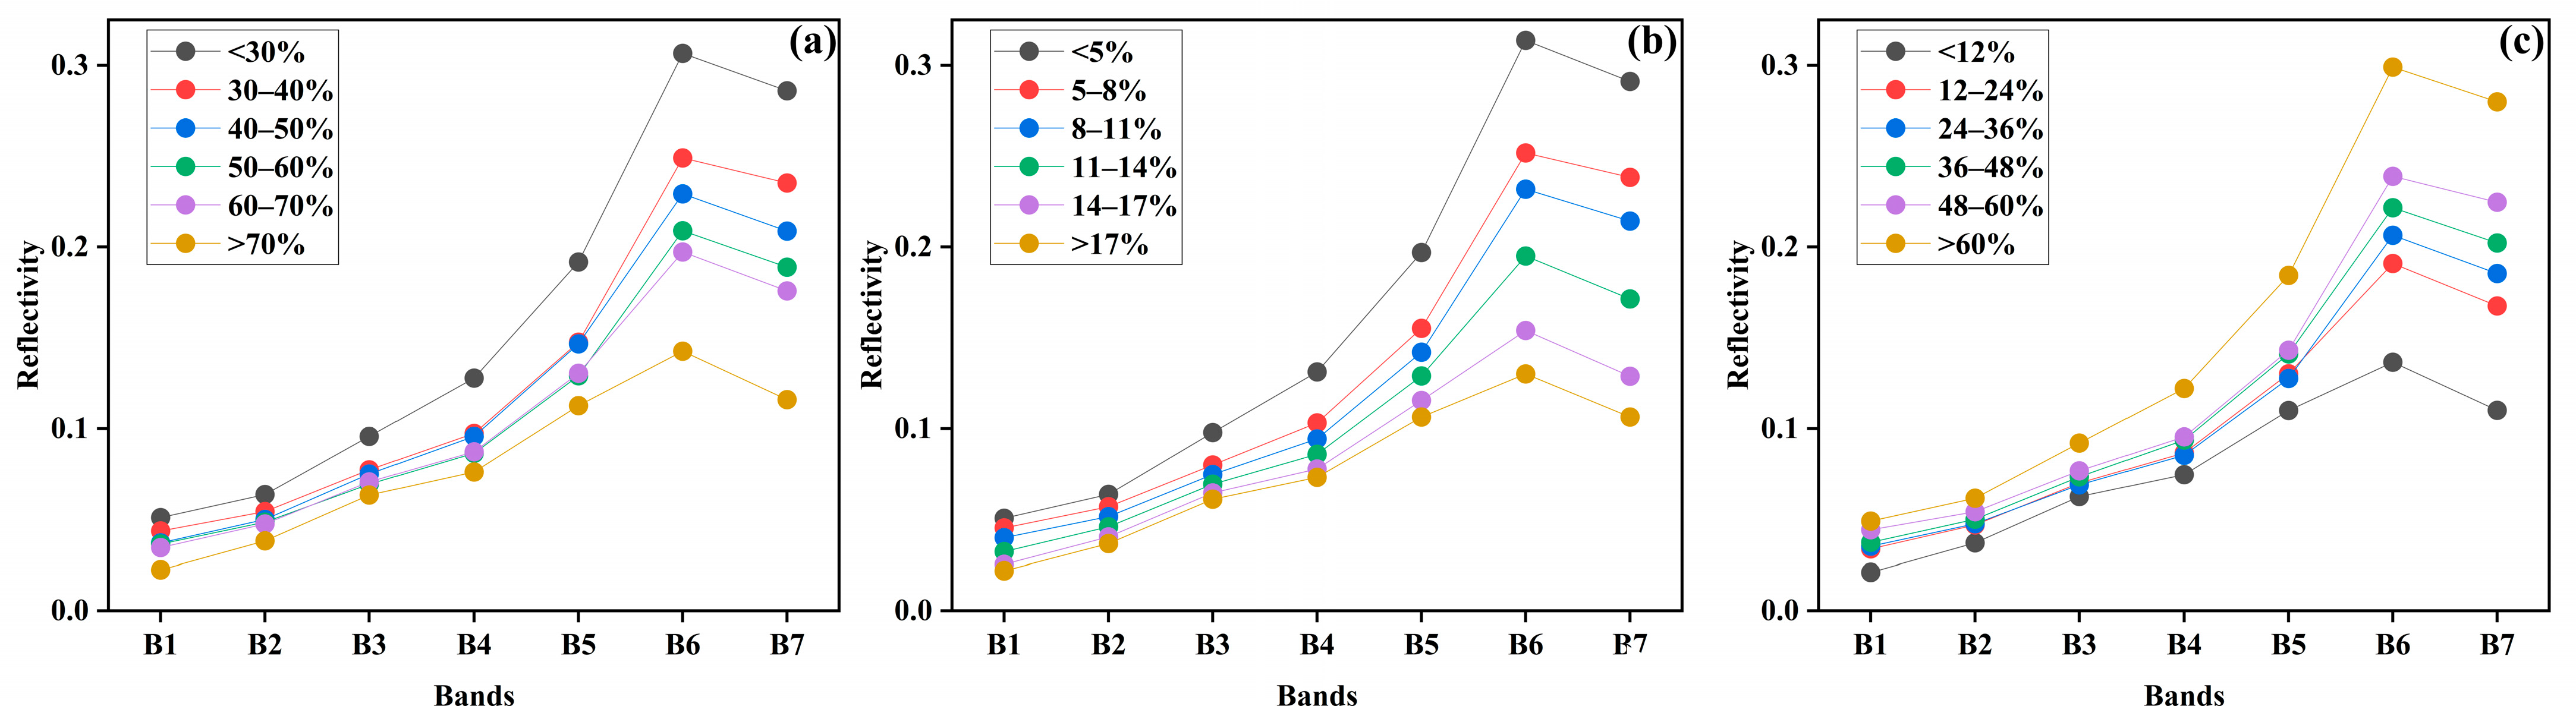
3.1. Analysis of the Soil Reflection Spectral Characteristics
3.2. Optimal Temporal Window for Soil Texture Prediction
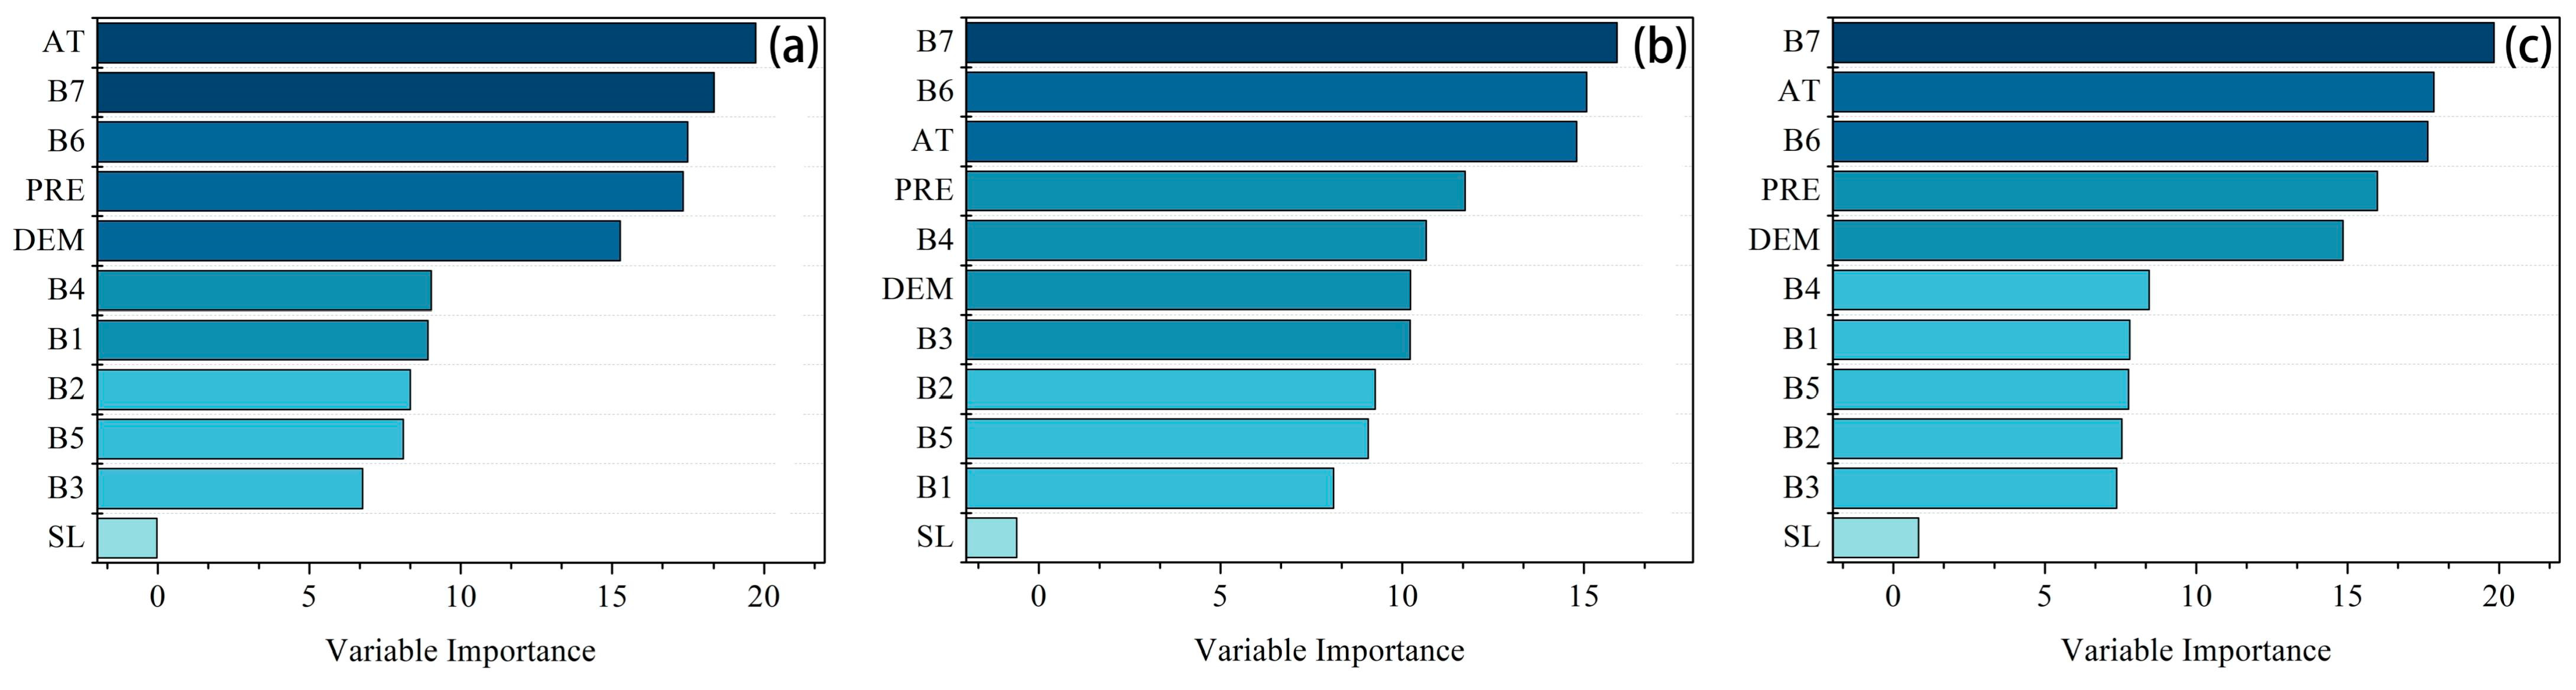
3.3. Impact of Environmental Covariates on Soil Texture Prediction Accuracy
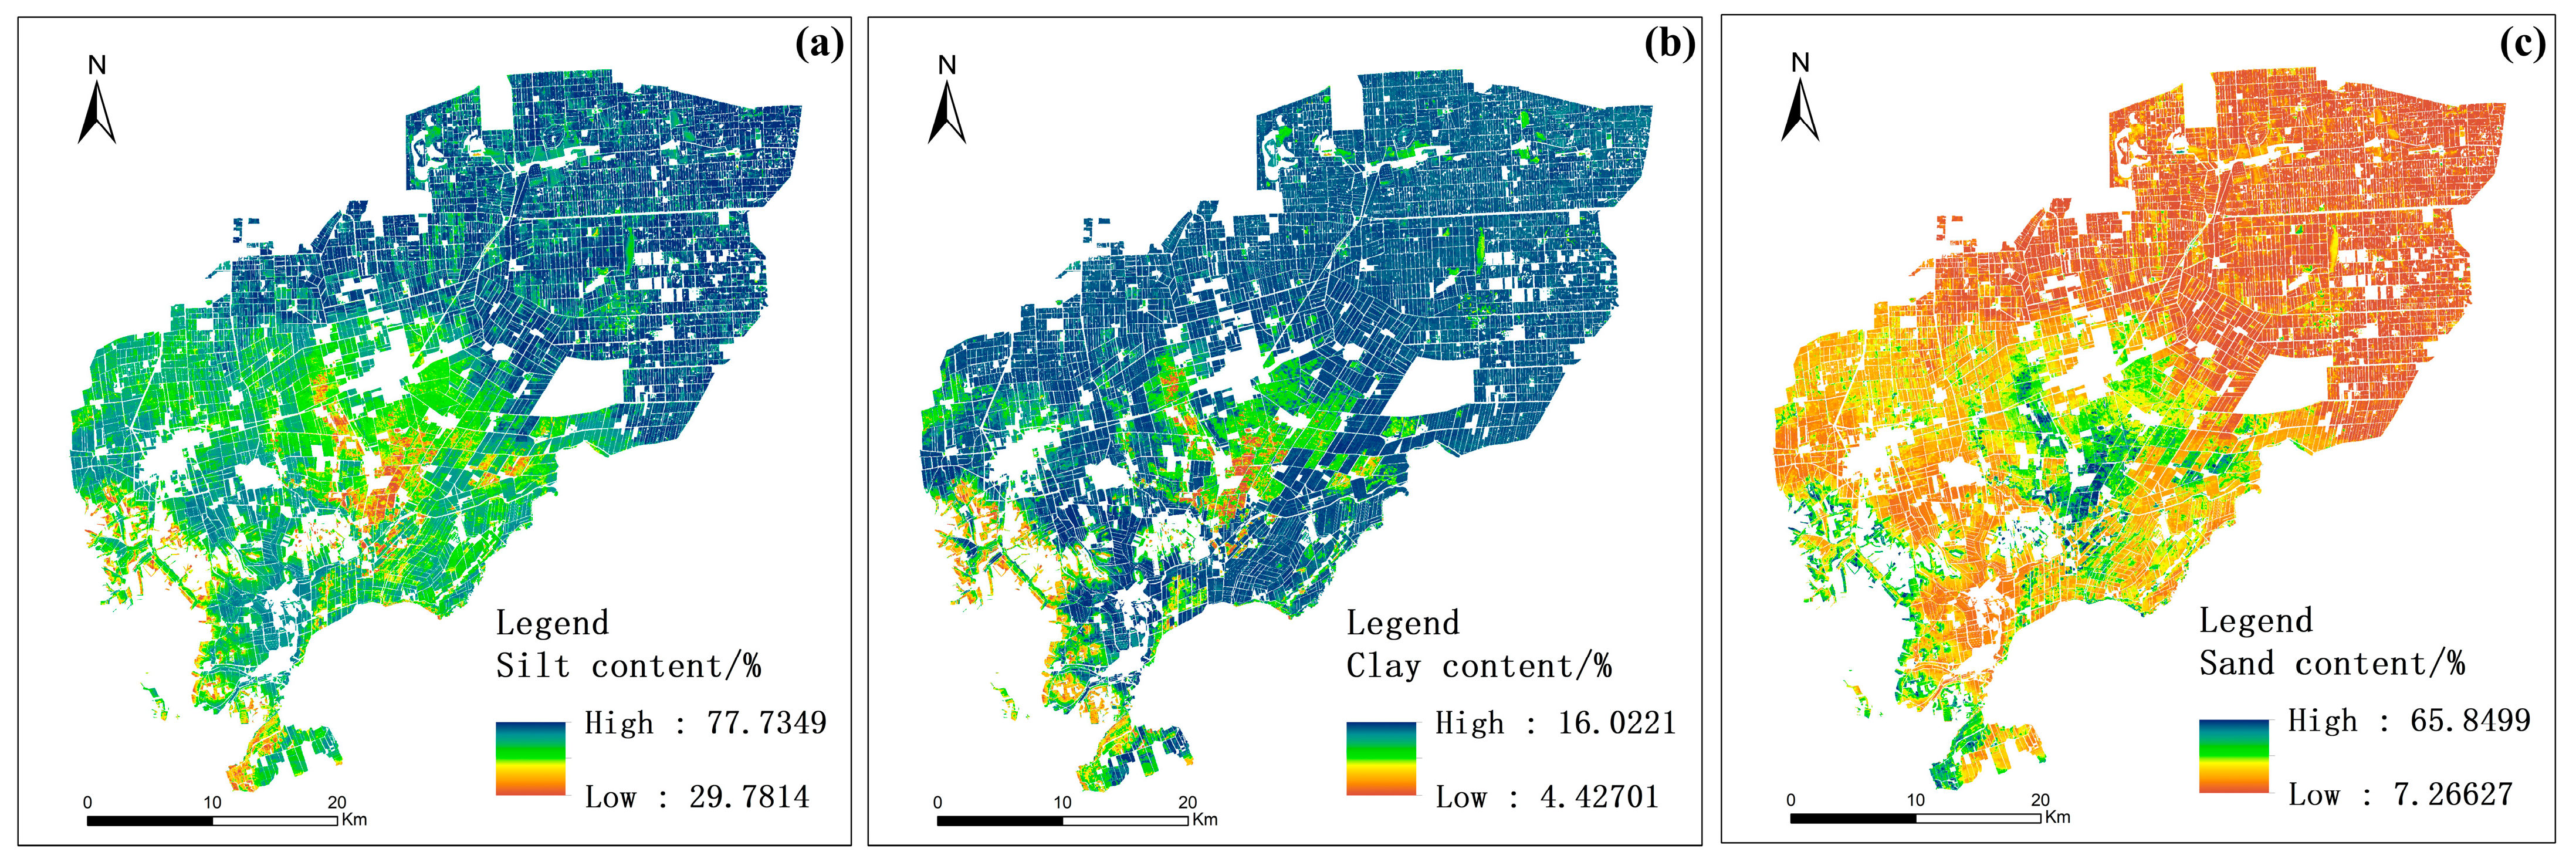
3.4. Spatial Distribution Map of Soil Texture
3.5. Analysis of the Impact of Soil Texture on Crop Growth
4. Discussion
4.1. Effect of Imaging Time on the Soil Texture Mapping Accuracy
4.2. Role of Environmental Covariates in Soil Texture Prediction
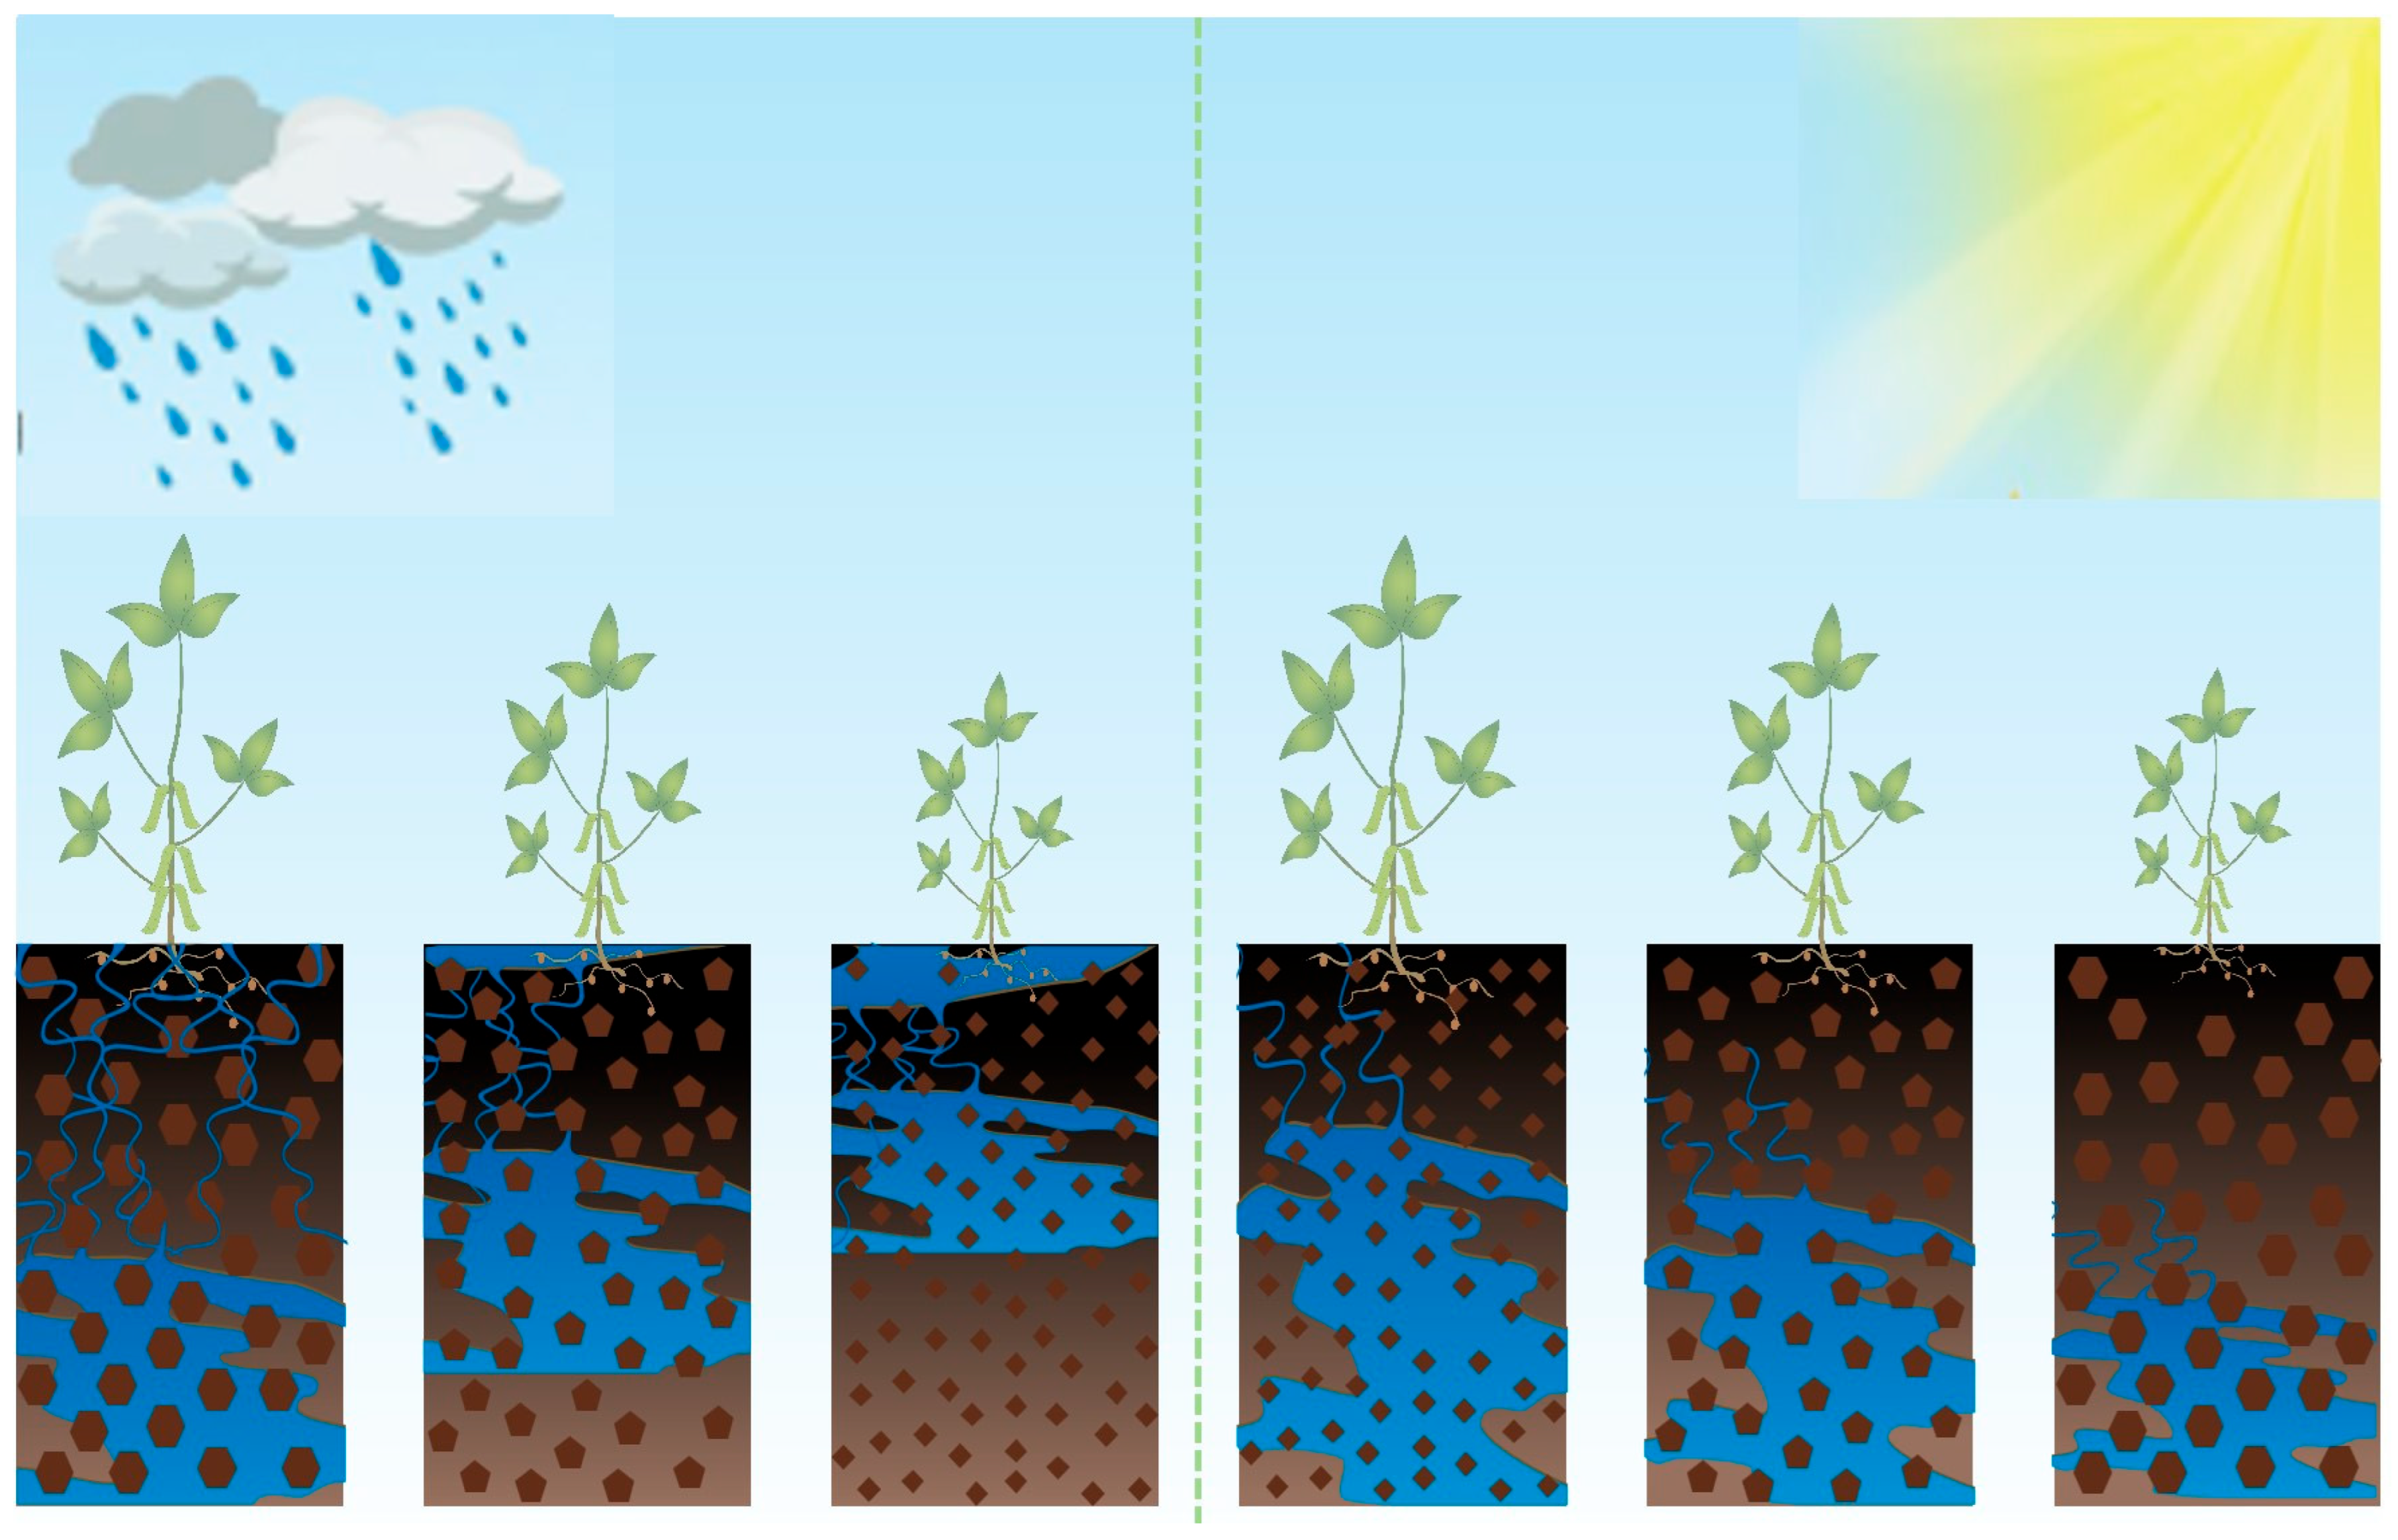
4.3. Response of Soil Texture to Different Crop Growth Conditions
4.4. Limitations and Future Research
5. Conclusions
Author Contributions
Funding
Data Availability Statement
Acknowledgments
Conflicts of Interest
Abbreviations
| RMSE | root mean square error |
| WAP | water-absorbing polymers |
| PSD | particle size distribution |
| RF | random forest |
| NDVI | normalized difference vegetation index |
| LSWI | land surface water index |
| MTL | multi-task learning |
References
- Wang, X.; Yu, D.; Wang, C.; Pan, Y.; Pan, J.; Shi, X. Variations in Cropland Soil Organic Carbon Fractions in the Black Soil Region of China. Soil Tillage Res. 2018, 184, 93–99. [Google Scholar] [CrossRef]
- Wang, H.; Yang, S.; Wang, Y.; Gu, Z.; Xiong, S.; Huang, X.; Sun, M.; Zhang, S.; Guo, L.; Cui, J.; et al. Rates and Causes of Black Soil Erosion in Northeast China. Catena 2022, 214, 106250. [Google Scholar] [CrossRef]
- Duan, X.; Xie, Y.; Ou, T.; Lu, H. Effects of Soil Erosion on Long-Term Soil Productivity in the Black Soil Region of Northeastern China. Catena 2011, 87, 268–275. [Google Scholar] [CrossRef]
- Liu, F.; Zhang, G.-L.; Song, X.; Li, D.; Zhao, Y.; Yang, J.; Wu, H.; Yang, F. High-Resolution and Three-Dimensional Mapping of Soil Texture of China. Geoderma 2020, 361, 114061. [Google Scholar] [CrossRef]
- Ma, S.; Wang, L.-J.; Wang, H.-Y.; Zhao, Y.-G.; Jiang, J. Impacts of Land Use/Land Cover and Soil Property Changes on Soil Erosion in the Black Soil Region, China. J. Environ. Manag. 2023, 328, 117024. [Google Scholar] [CrossRef]
- Saha, A.; Rattan, B.; Sekharan, S.; Manna, U. Quantifying the Interactive Effect of Water Absorbing Polymer (WAP)-Soil Texture on Plant Available Water Content and Irrigation Frequency. Geoderma 2020, 368, 114310. [Google Scholar] [CrossRef]
- Sullivan, D.G.; Shaw, J.N.; Rickman, D. IKONOS Imagery to Estimate Surface Soil Property Variability in Two Alabama Physiographies. Soil Sci. Soc. Amer. J. 2005, 69, 1789–1798. [Google Scholar] [CrossRef]
- Angelopoulou, T.; Tziolas, N.; Balafoutis, A.; Zalidis, G.; Bochtis, D. Remote Sensing Techniques for Soil Organic Carbon Estimation: A Review. Remote Sens. 2019, 11, 676. [Google Scholar] [CrossRef]
- Gomez, C.; Lagacherie, P.; Coulouma, G. Regional Predictions of Eight Common Soil Properties and Their Spatial Structures from Hyperspectral Vis–NIR Data. Geoderma 2012, 189–190, 176–185. [Google Scholar] [CrossRef]
- Bahrami, A.; Danesh, M.; Bahrami, M. Studying Sand Component of Soil Texture Using the Spectroscopic Method. Infrared Phys. Technol. 2022, 122, 104056. [Google Scholar] [CrossRef]
- Yudina, A.V.; Fomin, D.S.; Valdes-Korovkin, I.A.; Churilin, N.A.; Aleksandrova, M.S.; Golovleva, Y.A.; Phillipov, N.V.; Kovda, I.V.; Dymov, A.A.; Milanovskiy, E.Y. The Ways to Develop Soil Textural Classification for Laser Diffraction Method. Eurasian Soil Sci. 2020, 53, 1579–1595. [Google Scholar] [CrossRef]
- Swetha, R.K.; Bende, P.; Singh, K.; Gorthi, S.; Biswas, A.; Li, B.; Weindorf, D.C.; Chakraborty, S. Predicting Soil Texture from Smartphone-Captured Digital Images and an Application. Geoderma 2020, 376, 114562. [Google Scholar] [CrossRef]
- Chagas, C.D.S.; De Carvalho Junior, W.; Bhering, S.B.; Calderano Filho, B. Spatial Prediction of Soil Surface Texture in a Semiarid Region Using Random Forest and Multiple Linear Regressions. Catena 2016, 139, 232–240. [Google Scholar] [CrossRef]
- Ließ, M.; Glaser, B.; Huwe, B. Uncertainty in the Spatial Prediction of Soil Texture. Geoderma 2012, 170, 70–79. [Google Scholar] [CrossRef]
- Vaudour, E.; Baghdadi, N.; Gilliot, J.M. Mapping Tillage Operations over a Peri-Urban Region Using Combined SPOT4 and ASAR/ENVISAT Images. Int. J. Appl. Earth Obs. Geoinf. 2014, 28, 43–59. [Google Scholar] [CrossRef]
- Shahriari, M.; Delbari, M.; Afrasiab, P.; Pahlavan-Rad, M.R. Predicting Regional Spatial Distribution of Soil Texture in Floodplains Using Remote Sensing Data: A Case of Southeastern Iran. Catena 2019, 182, 104149. [Google Scholar] [CrossRef]
- Zhao, C.X.; Jia, L.H.; Wang, Y.F.; Wang, M.L.; McGiffen, M.E., Jr. Effects of Different Soil Texture on Peanut Growth and Development. Commun. Soil Sci. Plant Anal. 2015, 46, 2249–2257. [Google Scholar] [CrossRef]
- Wang, R.; Li, P.; Li, Z.; Yu, K.; Han, J.; Zhu, Y.; Su, Y. Effects of Gully Head Height and Soil Texture on Gully Headcut Erosion in the Loess Plateau of China. Catena 2021, 207, 105674. [Google Scholar] [CrossRef]
- Demattê, J.A.M.; Galdos, M.V.; Guimarães, R.V.; Genú, A.M.; Nanni, M.R.; Zullo, J., Jr. Quantification of Tropical Soil Attributes from ETM+/LANDSAT-7 Data. Int. J. Remote Sens. 2007, 28, 3813–3829. [Google Scholar] [CrossRef]
- Taghizadeh-Mehrjardi, R.; Emadi, M.; Cherati, A.; Heung, B.; Mosavi, A.; Scholten, T. Bio-Inspired Hybridization of Artificial Neural Networks: An Application for Mapping the Spatial Distribution of Soil Texture Fractions. Remote Sens. 2021, 13, 1025. [Google Scholar] [CrossRef]
- Greifeneder, F.; Notarnicola, C.; Wagner, W. A Machine Learning-Based Approach for Surface Soil Moisture Estimations with Google Earth Engine. Remote Sens. 2021, 13, 2099. [Google Scholar] [CrossRef]
- Meng, X.; Bao, Y.; Wang, Y.; Zhang, X.; Liu, H. An Advanced Soil Organic Carbon Content Prediction Model via Fused Temporal-Spatial-Spectral (TSS) Information Based on Machine Learning and Deep Learning Algorithms. Remote Sens. Environ. 2022, 280, 113166. [Google Scholar] [CrossRef]
- Wang, D.; Wang, Z.; Zhang, J.; Zhou, B.; Lv, T.; Li, W. Effects of Soil Texture on Soil Leaching and Cotton (Gossypium hirsutum L.) Growth under Combined Irrigation and Drainage. Water 2021, 13, 3614. [Google Scholar] [CrossRef]
- Mello, F.A.O.; Demattê, J.A.M.; Rizzo, R.; Mello, D.C.D.; Poppiel, R.R.; Silvero, N.E.Q.; Safanelli, J.L.; Bellinaso, H.; Bonfatti, B.R.; Gomez, A.M.R.; et al. Complex Hydrological Knowledge to Support Digital Soil Mapping. Geoderma 2022, 409, 115638. [Google Scholar] [CrossRef]
- Cheng, Y.; Li, P.; Xu, G.; Li, Z.; Wang, T.; Cheng, S.; Zhang, H.; Ma, T. The Effect of Soil Water Content and Erodibility on Losses of Available Nitrogen and Phosphorus in Simulated Freeze-Thaw Conditions. Catena 2018, 166, 21–33. [Google Scholar] [CrossRef]
- Luo, C.; Zhang, W.; Zhang, X.; Liu, H. Mapping of Soil Organic Matter in a Typical Black Soil Area Using Landsat-8 Synthetic Images at Different Time Periods. Catena 2023, 231, 107336. [Google Scholar] [CrossRef]
- Djukic, I.; Zehetner, F.; Tatzber, M.; Gerzabek, M.H. Soil Organic-matter Stocks and Characteristics along an Alpine Elevation Gradient. Z. Pflanzenernähr. Bodenk. 2010, 173, 30–38. [Google Scholar] [CrossRef]
- Woods, L.E.; Schuman, G.E. Cultivation and Slope Position Effects on Soil Organic Matter. Soil Sci. Soc. Amer. J. 1988, 52, 1371–1376. [Google Scholar] [CrossRef]
- Luo, C.; Zhang, W.; Zhang, X.; Liu, H. Mapping the Soil Organic Matter Content in a Typical Black-Soil Area Using Optical Data, Radar Data and Environmental Covariates. Soil Tillage Res. 2024, 235, 105912. [Google Scholar] [CrossRef]
- Miller, D.L.; Alonzo, M.; Meerdink, S.K.; Allen, M.A.; Tague, C.L.; Roberts, D.A.; McFadden, J.P. Seasonal and Interannual Drought Responses of Vegetation in a California Urbanized Area Measured Using Complementary Remote Sensing Indices. ISPRS J. Photogramm. Remote Sens. 2022, 183, 178–195. [Google Scholar] [CrossRef]
- Chen, Y.; Hu, J.; Cai, Z.; Yang, J.; Zhou, W.; Hu, Q.; Wang, C.; You, L.; Xu, B. A Phenology-Based Vegetation Index for Improving Ratoon Rice Mapping Using Harmonized Landsat and Sentinel-2 Data. J. Integr. Agric. 2024, 23, 1164–1178. [Google Scholar] [CrossRef]
- Xiao, J.; Shen, Y.; Tateishi, R.; Bayaer, W. Development of Topsoil Grain Size Index for Monitoring Desertification in Arid Land Using Remote Sensing. Int. J. Remote Sens. 2006, 27, 2411–2422. [Google Scholar] [CrossRef]
- Conforti, M.; Matteucci, G.; Buttafuoco, G. Using Laboratory Vis-NIR Spectroscopy for Monitoring Some Forest Soil Properties. J. Soils Sediments 2018, 18, 1009–1019. [Google Scholar] [CrossRef]
- Wang, Y.; Zang, S.; Tian, Y. Mapping Paddy Rice with the Random Forest Algorithm Using MODIS and SMAP Time Series. Chaos Solitons Fractals 2020, 140, 110116. [Google Scholar] [CrossRef]
- Swain, S.R.; Chakraborty, P.; Panigrahi, N.; Vasava, H.B.; Reddy, N.N.; Roy, S.; Majeed, I.; Das, B.S. Estimation of Soil Texture Using Sentinel-2 Multispectral Imaging Data: An Ensemble Modeling Approach. Soil Tillage Res. 2021, 213, 105134. [Google Scholar] [CrossRef]
- Luo, C.; Zhang, X.; Meng, X.; Zhu, H.; Ni, C.; Chen, M.; Liu, H. Regional Mapping of Soil Organic Matter Content Using Multitemporal Synthetic Landsat 8 Images in Google Earth Engine. Catena 2022, 209, 105842. [Google Scholar] [CrossRef]
- Coblinski, J.A.; Giasson, É.; Demattê, J.A.M.; Dotto, A.C.; Costa, J.J.F.; Vašát, R. Prediction of Soil Texture Classes through Different Wavelength Regions of Reflectance Spectroscopy at Various Soil Depths. Catena 2020, 189, 104485. [Google Scholar] [CrossRef]
- Magid, J.; Kjñrgaard, C.; Gorissen, A.; Kuikman, P.J. Drying and Rewetting of a Loamy Sand Soil Did Not Increase the Turnover of Native Organic Matter, but Retarded the Decomposition of Added 14 g-Labelled Plant Material. Soil Biol. Biochem. 1999, 31, 595–602. [Google Scholar] [CrossRef]
- Wang, L.; Shi, Z.H. Size Selectivity of Eroded Sediment Associated with Soil Texture on Steep Slopes. Soil Sci. Soc. Amer. J. 2015, 79, 917–929. [Google Scholar] [CrossRef]
- Zhou, W.; Wang, T.; Fu, Y.; Yang, Z.; Liu, Q.; Yan, F.; Chen, Y.; Tao, Y.; Ren, W. Differences in Rice Productivity and Growth Attributes Under Different Paddy-Upland Cropping Systems. Int. J. Plant Prod. 2022, 16, 299–312. [Google Scholar] [CrossRef]
- Karimov, A.K.; Šimůnek, J.; Hanjra, M.A.; Avliyakulov, M.; Forkutsa, I. Effects of the Shallow Water Table on Water Use of Winter Wheat and Ecosystem Health: Implications for Unlocking the Potential of Groundwater in the Fergana Valley (Central Asia). Agric. Water Manag. 2014, 131, 57–69. [Google Scholar] [CrossRef]
- Zhai, Z.; Chen, F.; Yu, H.; Hu, J.; Zhou, X.; Xu, H. PS-MTL-LUCAS: A Partially Shared Multi-Task Learning Model for Simultaneously Predicting Multiple Soil Properties. Ecol. Inform. 2024, 82, 102784. [Google Scholar] [CrossRef]
- Wang, S.; Guan, K.; Zhang, C.; Lee, D.; Margenot, A.J.; Ge, Y.; Peng, J.; Zhou, W.; Zhou, Q.; Huang, Y. Using Soil Library Hyperspectral Reflectance and Machine Learning to Predict Soil Organic Carbon: Assessing Potential of Airborne and Spaceborne Optical Soil Sensing. Remote Sens. Environ. 2022, 271, 112914. [Google Scholar] [CrossRef]
- Uehleke, R.; Petrick, M.; Hüttel, S. Evaluations of Agri-Environmental Schemes Based on Observational Farm Data: The Importance of Covariate Selection. Land Use Policy 2022, 114, 105950. [Google Scholar] [CrossRef]


| Class | Attribute | Description | Unit |
|---|---|---|---|
| Climate | PRE | Precipitation | mm |
| AT | Average Temperature | ° | |
| Terrain | DEM | Digital Elevation Model | m |
| SL | Slope | Degree | |
| Remote Sensing | Band1 | Coastal/Aerosol | Reflectance factor |
| Band2 | Blue | Reflectance factor | |
| Band3 | Green | Reflectance factor | |
| Band4 | Red | Reflectance factor | |
| Band5 | Near Infrared | Reflectance factor | |
| Band6 | Short Wave Infrared−1 | Reflectance factor | |
| Band7 | Short Wave Infrared−2 | Reflectance factor |
| Month | Silt | Clay | Sand | |||
|---|---|---|---|---|---|---|
| R2 | RMSE (%) | R2 | RMSE (%) | R2 | RMSE (%) | |
| April | 0.73 | 2.55 | 0.60 | 0.74 | 0.73 | 3.09 |
| May | 0.62 | 3.01 | 0.65 | 0.70 | 0.67 | 3.45 |
| June | 0.51 | 3.43 | 0.54 | 0.79 | 0.50 | 4.23 |
| Combination | Silt | Clay | Sand | |||
|---|---|---|---|---|---|---|
| R2 | RMSE(%) | R2 | RMSE(%) | R2 | RMSE(%) | |
| Remote Sensing | 0.73 | 2.55 | 0.65 | 0.70 | 0.73 | 3.09 |
| Climate | 0.87 | 1.78 | 0.68 | 0.67 | 0.85 | 2.28 |
| Terrain | 0.83 | 2.04 | 0.69 | 0.66 | 0.82 | 2.52 |
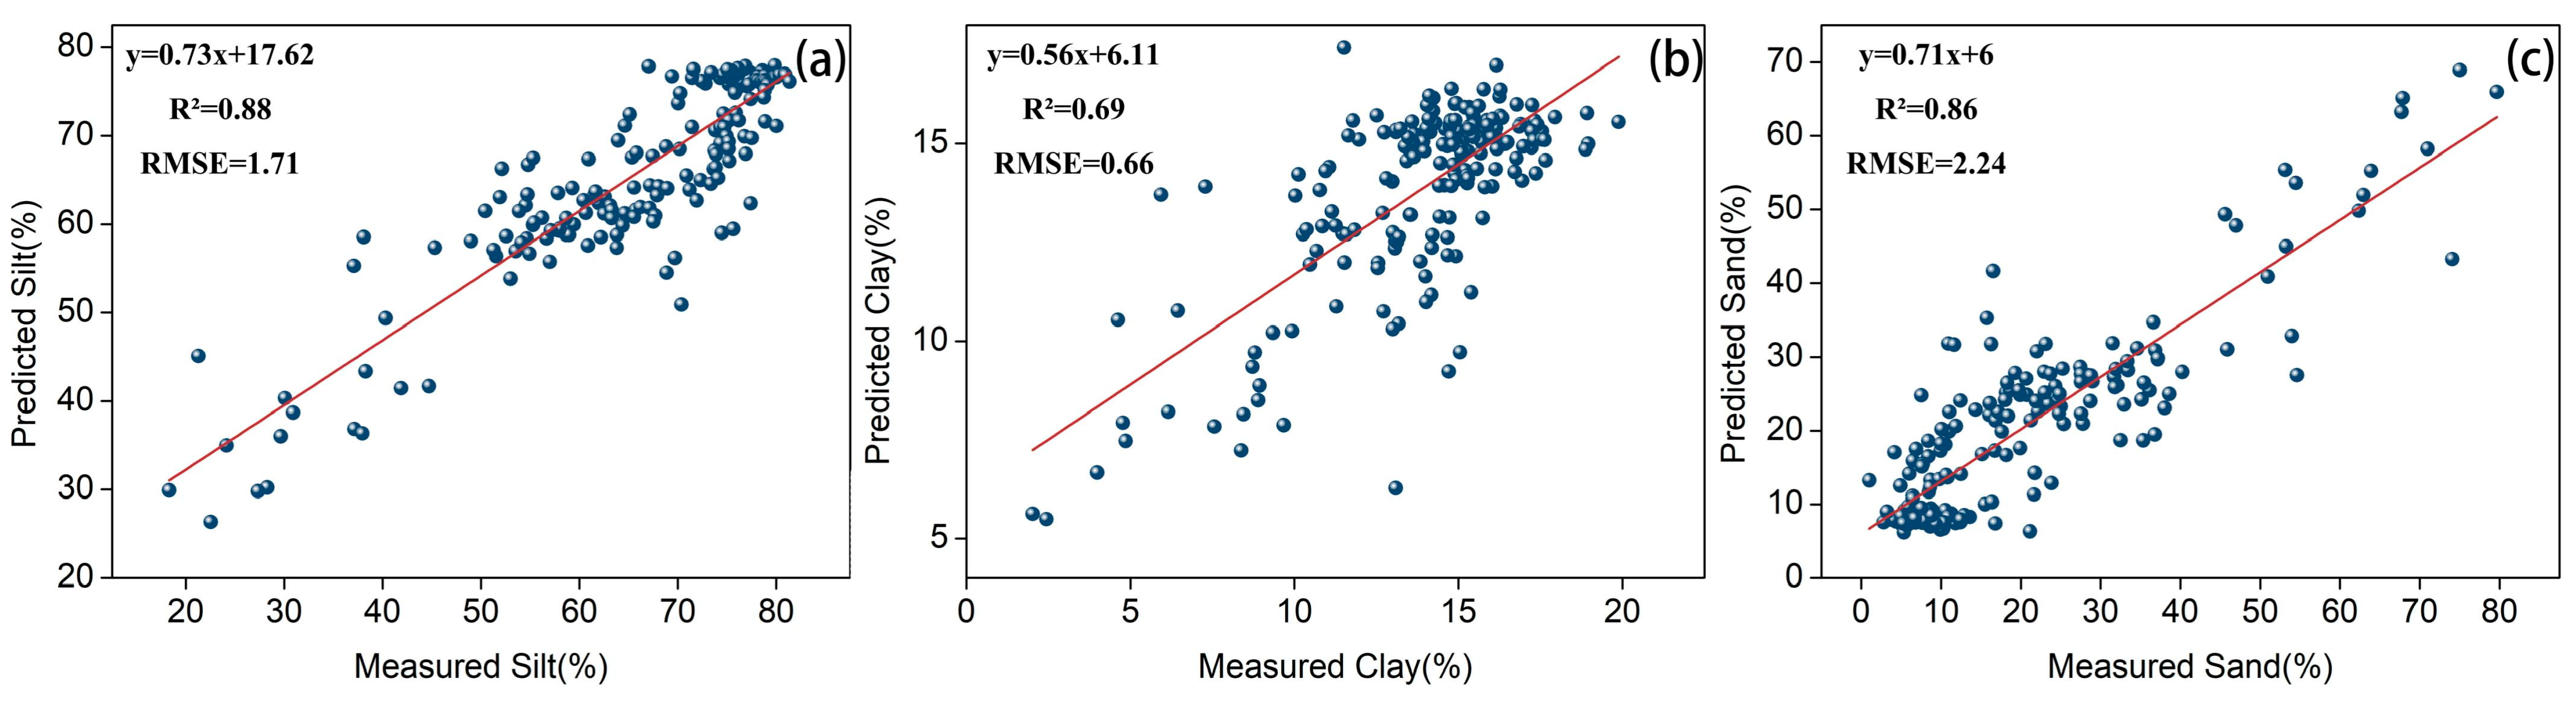
| RS + Climate + Terrain | 0.88 | 1.71 | 0.68 | 0.66 | 0.86 | 2.24 |
| Year | Crop | Silt | Clay | Sand |
|---|---|---|---|---|
| 2019 | soya | −0.607 | −0.505 | 0.579 |
| rice | 0.361 | −0.304 | −0.354 | |
| corn | −0.455 | −0.434 | 0.454 | |
| 2020 | soya | −0.647 | −0.525 | 0.613 |
| rice | 0.337 | 0.47 | 0.324 | |
| corn | −0.548 | −0.498 | 0.54 | |
| 2021 | soya | −0.394 | −0.45 | 0.32 |
| rice | 0.354 | 0.453 | 0.348 | |
| corn | 0.632 | 0.628 | −0.632 |
Disclaimer/Publisher’s Note: The statements, opinions and data contained in all publications are solely those of the individual author(s) and contributor(s) and not of MDPI and/or the editor(s). MDPI and/or the editor(s) disclaim responsibility for any injury to people or property resulting from any ideas, methods, instructions or products referred to in the content. |
© 2025 by the authors. Licensee MDPI, Basel, Switzerland. This article is an open access article distributed under the terms and conditions of the Creative Commons Attribution (CC BY) license (https://creativecommons.org/licenses/by/4.0/).
Share and Cite
Gao, L.; Zhang, Y.; Zang, D.; Yang, Q.; Liu, H.; Luo, C. Using Satellites to Monitor Soil Texture in Typical Black Soil Areas and Assess Its Impact on Crop Growth. Agriculture 2025, 15, 912. https://doi.org/10.3390/agriculture15090912
Gao L, Zhang Y, Zang D, Yang Q, Liu H, Luo C. Using Satellites to Monitor Soil Texture in Typical Black Soil Areas and Assess Its Impact on Crop Growth. Agriculture. 2025; 15(9):912. https://doi.org/10.3390/agriculture15090912
Chicago/Turabian StyleGao, Liren, Yuhong Zhang, Deqiang Zang, Qian Yang, Huanjun Liu, and Chong Luo. 2025. "Using Satellites to Monitor Soil Texture in Typical Black Soil Areas and Assess Its Impact on Crop Growth" Agriculture 15, no. 9: 912. https://doi.org/10.3390/agriculture15090912
APA StyleGao, L., Zhang, Y., Zang, D., Yang, Q., Liu, H., & Luo, C. (2025). Using Satellites to Monitor Soil Texture in Typical Black Soil Areas and Assess Its Impact on Crop Growth. Agriculture, 15(9), 912. https://doi.org/10.3390/agriculture15090912