Abstract
Soil environmental protection has become a pressing issue for sustainable development. This study collected 153 topsoil samples from a typical agricultural area to evaluate the contamination characteristics of heavy metal(loid)s (HMs), identify their potential sources, and assess the associated ecological and human health risks. The results showed that the mean concentration of HMs was in the order of Zn > Cr > Ni > Pb > Cu > As > Cd > Hg; all HMs were below their background levels, except Cd. The geo-accumulation index (Igeo) and improved Nemerow index (INI) revealed that the overall pollution level was considered as no or slight contamination, while HMs posed low ecological risk according to the ecological hazard factor (Ei) and potential ecological risk index (PERI). In addition, three main sources were identified through the positive matrix factorization (PMF) model: natural source (48.2%; contributed As, Ni, Cu, Pb, and Zn), coal burning and waste disposal (24%; contributed Hg and Cd), and agricultural activities (27.8%; contributed Cr). The human health risk (HHR) assessment model and Monte Carlo simulation were applied to evaluate human health risks, and the results suggested that children faced higher health risks than adults, with 45.83% of samples exceeding the non-carcinogenic acceptable limit. As and Cr were the main contributors to non-carcinogenic and carcinogenic risks, respectively. The findings contributed to the local environmental management and sustainable development of agriculture.
1. Introduction
The soil environment is vital for human survival and sustainable development [1,2,3]. However, soil environmental problems have become a significant issue worldwide due to intense human activities, especially agricultural activities [4,5]. Agricultural processes, including excessive use of fertilizers and pesticides, have accelerated soil degradation, leading to the enrichment of heavy metals (HMs) in the soil. According to previous studies, agricultural soils in many regions are increasingly contaminated with heavy metal(loid)s like Pb, Cd, As, and Hg, which not only deteriorate soil quality but also pose significant health risks [6,7]. The crops containing a high concentration of HMs pose severe hazards to human health, such as cancer, kidney damage, and neurological disorders, and thus make source identification and contamination risk assessments a priority for environmental protection and sustainable agricultural development.
Assessing contamination risk and source identification of soil HMs provide theoretical support for environmental protection policies [8,9]. Several environmental and ecological indicators like the enrichment factor (EF) and geo-accumulation index (Igeo) could be used to measure soil heavy metal contamination and potential ecological risk [10,11,12]. Additionally, various approaches including multivariate statistical analysis, chemical mass balance (CMB), and the positive matrix factorization (PMF) model, are applied for the source apportionment of soil HMs [13,14,15]. The PMF model is widely recognized for providing quantitative source contributions and yielding accurate results [16,17].
The HMs in soil pose a potential threat to human health due to their toxicity, and this needs to be evaluated quantitatively [18]. Excessive intake of HMs will cause severe health issues, including kidney and nerve damage from Pb and Hg and cancer from Cd and As [19]. According to the USEPA, soil HMs pose non-carcinogenic and carcinogenic risks through various exposure pathways (ingestion, inhalation, and dermal contact) [20]. However, deterministic approaches from existing heavy metal levels and exposure parameters might neglect some factors and lead to uncertainty. The Monte Carlo simulation, based on health risk assessment models, provides probabilistic results, complementing deterministic assessments [21].
The study area is located in a typical agricultural area and is a part of the famous Tianfu granary. Agricultural soil in this area may face the abnormal accumulation and potential pollution risk of HMs due to the long-term application of fertilizers and pesticides, restricting the sustainable development of green agriculture. Therefore, it is necessary to estimate their characteristics of content and spatial distribution, ascertain their main sources, and assess ecological and health risks in the study area. In addition, previous research revealed that the topsoil tends to be more exposed to anthropogenic impacts, and thus enriched in HMs, than deep soil [22,23]. Although recent studies have assessed HM pollution in agricultural soils, few have addressed quantitative source identification or conducted a comprehensive risk assessment. Furthermore, probabilistic approaches could provide a more reliable result with a small dataset [24,25]. Therefore, this study integrated multiple approaches including the PMF model, potential ecological risk index, and Monte Carlo simulation to trace the source and evaluate corresponding risks of the HMs in the topsoil of the study area. The study mainly consists of the following objectives: (1) to evaluate the exceeding level and ecological risk of HMs in the topsoil of the study area using multiple environmental indices; (2) to quantitatively identify the sources of HMs in the soil using the PMF model; (3) to assess the health risks caused by HMs by combining deterministic health risks with the Monte Carlo simulation. The outcomes are expected to provide a scientific basis for local soil pollution prevention and management, and contribute to the sustainable development of agriculture.
2. Materials and Methods
2.1. Study Area
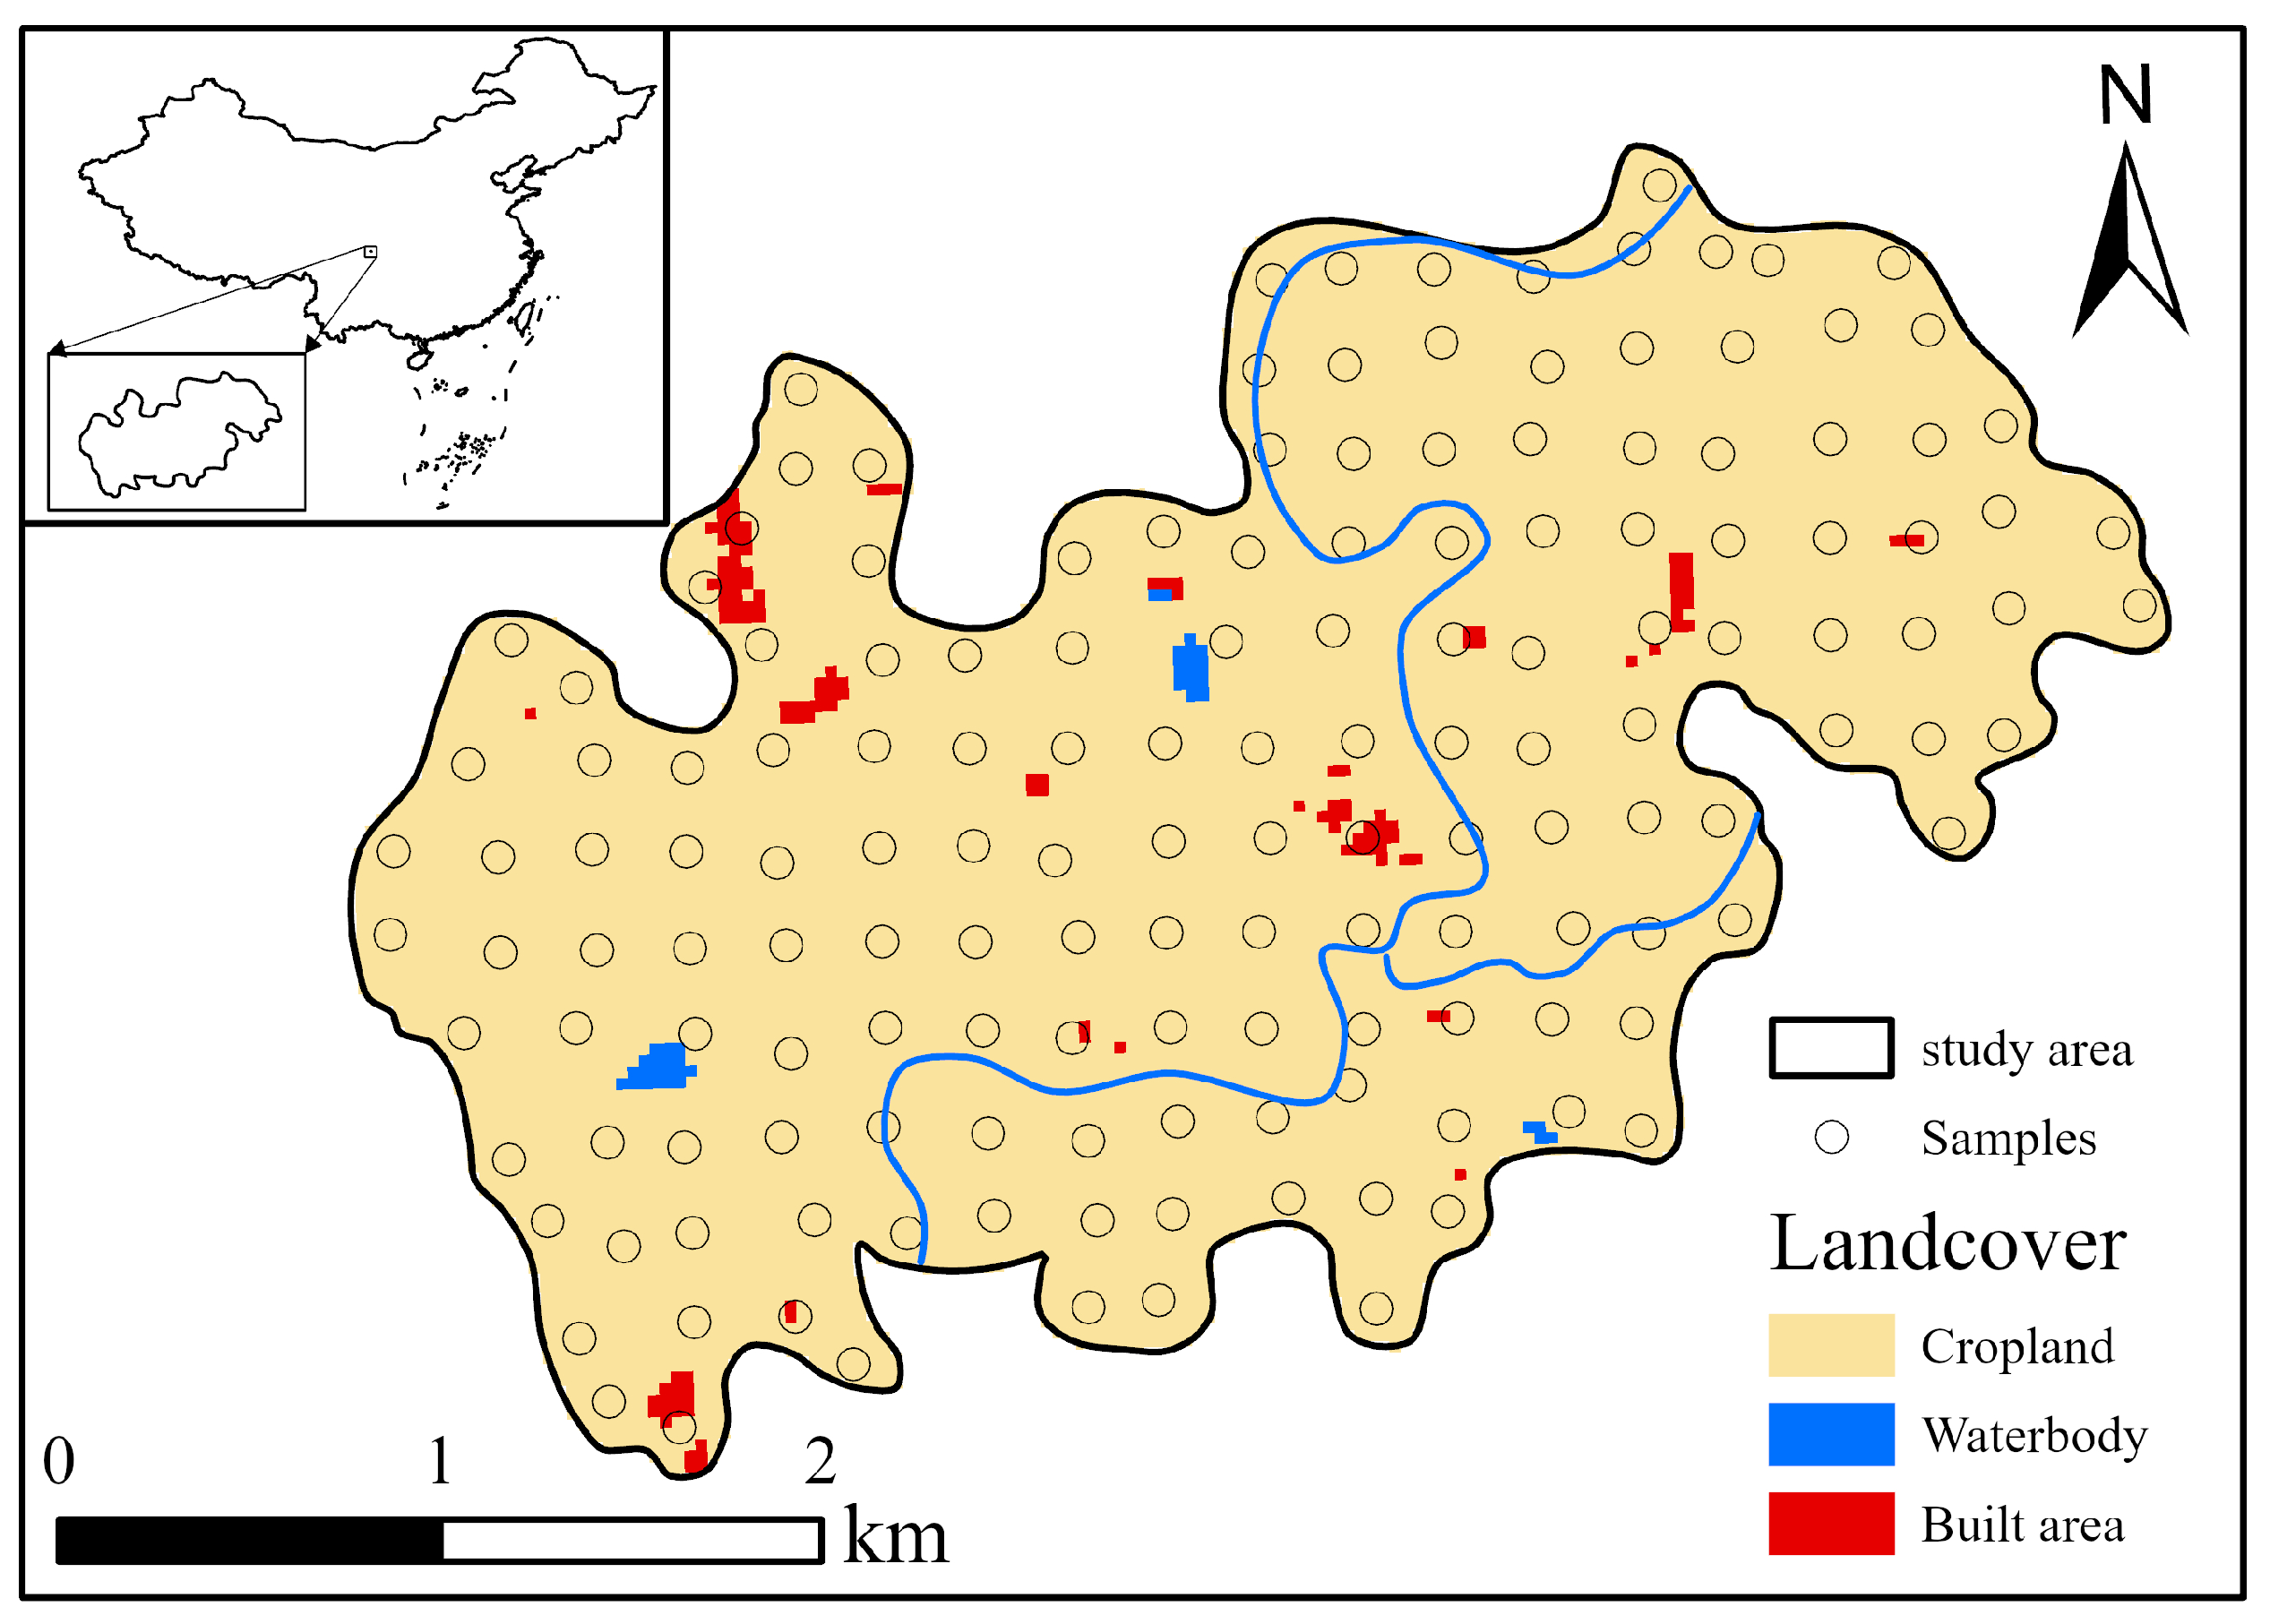
The study area is situated in southwestern China. It spans approximately 9 km2, with coordinates ranging from 104°34′7″ to 104°37′8″ E and 30°47′15″ to 30°49′6″ N. The area experiences a subtropical monsoon climate. Situated in the central Sichuan Basin, the area features a flat landscape characterized by low hills and plains. The Qingxi River, flowing from northeast to southwest, is the primary waterway. The area’s mineral resources are predominantly sedimentary non-metallic minerals, such as construction sand and gravel deposits, with ore types including quartz, chert, quartzite, granite, and limestone. As a typical agricultural zone, the land cover is mostly cropland, accounting for over 98% of the total area (Figure 1). Geologically, the exposed strata consist of Upper Pleistocene sediments from the Quaternary period, while the lithology is mainly sandstone, conglomerate, and mudstone. The soil types are primarily moist subtropical yellow and purplish soils of the Sichuan Basin, enriched with calcium, phosphorus, and potassium.

Figure 1.
Location and land-cover map of the study area with sample location.
2.2. Sample Collecting and Testing
Based on the ‘Specification of Land Quality Geochemical Evaluation (1:50,000)’ [26], a total of 153 topsoil samples were collected from the top 0–20 cm layer of soil, at a density of 16 samples per km2 using the grid sampling approach in the study area, during May to June, 2022. All samples were sealed in pollution-free polyethylene plastic bags after removing weeds, gravel, and organic debris, ensuring each sample weighed over 1 kg. Soil samples were preserved and sent to the laboratory in a clean and low-temperature (4 °C) environment; then were dried under natural ventilation and room temperature conditions and filtered using a 100 mesh (0.15 mm) sieve. Finally, the samples obtained were encapsulated and 200 g of each were taken for digestion (HCl and HNO3, 30 min) and tested.
The experiments were conducted in the Sichuan Experimental Testing Research Center of Natural Resources. The soil pH was tested using potentiometry (ECT 300T, Beiyutech, Shanghai, China); Cr, Cu, Ni, and Zn were determined by inductively coupled plasma optical emission spectrometer (iCAP-7400, Thermo Fisher, Waltham, MA, USA); Cd and Pb were determined by inductively coupled plasma-mass spectrometry (PlasmaMS 300, NCS, Beijing, China); As and Hg were determined by atomic fluorescence spectrometry (AFS-8500, Haiguang, Beijing, China). The detection limits of each PTE are shown in Table S1.
To ensure the accuracy and precision of the measurements, all soil samples were analyzed in triplicate, and the average concentration was calculated. Chinese national standard substances (GBW07558) were added during the testing process to calibrate the instruments, and the results revealed relative standard deviation (RSD) lower than 5%. For quality assurance and control, 5 duplicate samples were set, and the relative deviation was lower than 10%. In addition, 20% parallel samples were inserted during the analytical process, with a relative deviation of 3.45% and a pass rate of 98.21%.
2.3. Pollution and Ecological Risk Assessment
2.3.1. Geo-Accumulation Index
The contamination level of HMs in topsoil was estimated based on the geo-accumulation index (Igeo) and the improved Nemerow index (INI), which could be calculated using the following equations [27]:
where Ci represents the HM concentration in the topsoil (mg/kg); Bi indicates the HM soil background level of the study area (mg/kg) [28]; Igeoave and Igeomax are the mean and maximum values of Igeo, respectively. The classifications of Igeo and INI are listed in Table S2.
2.3.2. Potential Ecological Risk Index
The potential ecological risk index (PERI) could be applied to evaluate the ecological risk posed by HMs in topsoil, and it is calculated as follows [29]:
where Ei is the potential ecological hazard factor of each HM; Ci and Bi are the concentration and background levels of HMs in topsoil (mg/kg); and Ti is the toxicity coefficient (As = 10, Cd = 30, Cr = 2, Hg = 40, Pb = 5, Cu = 5, Ni = 5, and Zn = 1) of each HM [30]. The PERI can be classified into four levels from low to high (Table S2).
2.4. Positive Matrix Factorization Model
The positive matrix factorization (PMF) model is widely conducted in source apportionment, quantifying contributions to soil HMs [31]. It decomposes the original concentration matrix Xij into the source contribution matrix gik, source profile matrix fki, and residual error matrix eij (Equation (5)). The original matrix is optimized using uncertainty weighting through iterative computation to obtain optimal gik and fki matrices, thus minimizing the objective function Q (Equation (6)):
where p, n, and m are the number of factors, samples, and HMs, respectively; and σij is the uncertainty of the j-th element in the i-th samples, which is calculated as follows:
where MDL is the method detection limit, xij is the HM concentration, and EF is the error fraction.
2.5. Human Health Risk Assessment
2.5.1. Human Health Risk Assessment Model
The impacts of HMs on human health were evaluated using the human health risk (HHR) assessment model [32]. Non-carcinogenic risk and carcinogenic risk were evaluated through ingestion, inhalation, and dermal exposure, with individuals divided into children and adults. The calculation is outlined below:
where the THI and TCR are the total non-carcinogenic and carcinogenic risks, respectively, while HQi and CRi are the non-carcinogenic and carcinogenic risks of each HM. RfD and SF are the reference dose and slope factor of HMs, respectively (Table S3). ADIing, ADIinh, and ADIder are the average daily intakes of HMs through three ways, which can be calculated as follows:
The reference values for these exposure parameters used in the health risk calculation can be found in Table S4. In addition, a THI or HQ higher than 1.0 is considered an unacceptable non-carcinogenic health risk, while a TCR or CR above 10−4 represents an unacceptable carcinogenic risk.
2.5.2. Monte Carlo Simulation
The probabilistic health risks are assessed by the Monte Carlo simulation based on the HHR model [33]. Initially, a hypothesis test was conducted to identify the optimal distributions for each HM concentration. Secondly, the distribution of exposure parameters was defined, with their distribution types listed in Table S5. Finally, the simulation was run by setting the number of random seeds to 100 and simulating 10,000 times.
3. Results
3.1. General Characteristics of HMs in Topsoil
The concentration characteristics of HMs are presented in Table 1. The pH values varied from 5.300 to 8.680, with a mean value of 7.519, indicating a soil environment that is slightly alkaline. Furthermore, the HM contents (mg/kg) were as follows: As (2.102–22.299), Cd (0.064–0.505), Cr (38.368–82.097), Hg (0.020–0.195), Pb (6.192–41.567), Cu (8.256–34.145), Ni (7.526–55.589), and Zn (24.650–125.926), with the mean values of all HMs lower than their background levels. The coefficient of variation (CV) is used to quantify the relative dispersion of data and can indirectly reflect the impact of anthropogenic activities on natural systems. The CV of Hg concentrations was 0.388 (> 0.36), which reached the high variability, suggesting that it may be influenced by abnormal factors. However, the study area is small with unitary strata and lacks minerals. Therefore, this abnormal perturbation was considered as related to anthropogenic activities. In addition, As, Cd, Cu, Ni, Pb, and Zn exhibited moderate variability (0.36 > CV > 0.16), and Cr showed low variability (CV < 0.16).

Table 1.
Statistical result of HM concentrations in topsoil (unit: mg/kg).
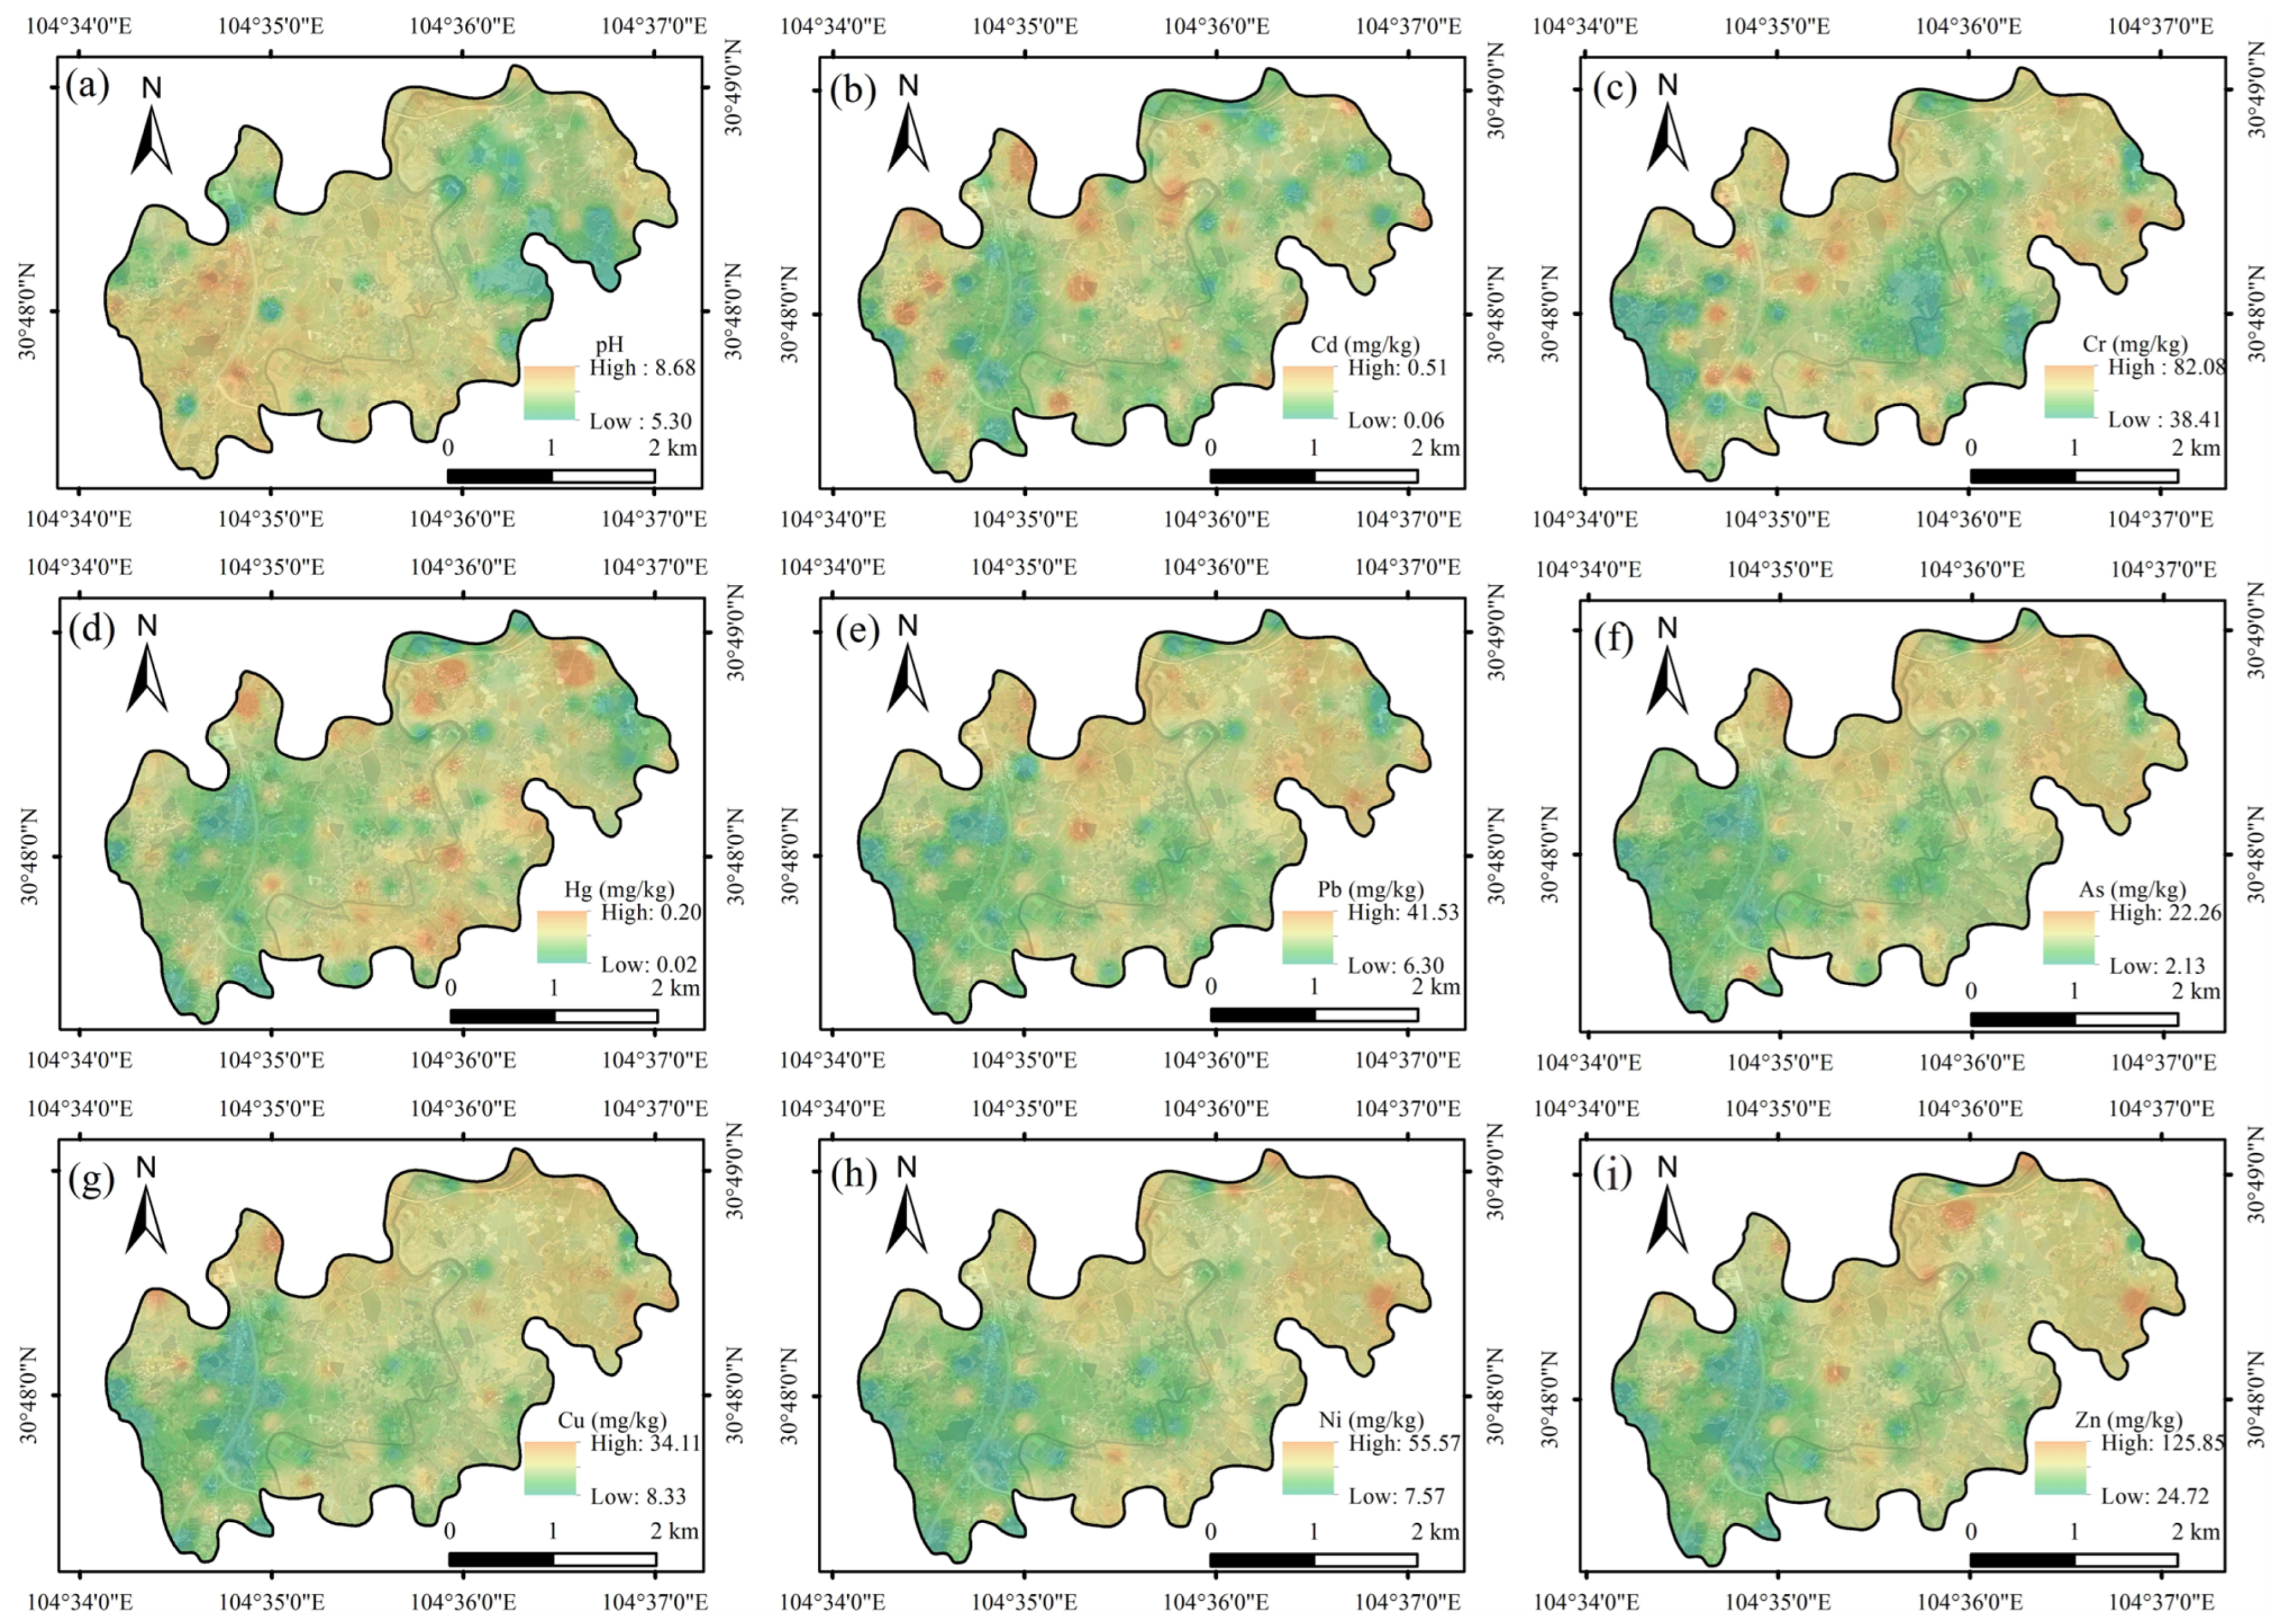
As illustrated in Figure 2, the pH values are evenly distributed throughout the study area, with high values observed in the southwest part. In contrast, the high concentration of HMs was predominantly distributed in the northeastern part, except for Cd. Cu, Ni, Zn, and Pb had similar distributions, suggesting their potential common source. Additionally, the high values of Cd and Hg were distributed in a point-like pattern, indicating that they were possibly influenced by localized contamination.
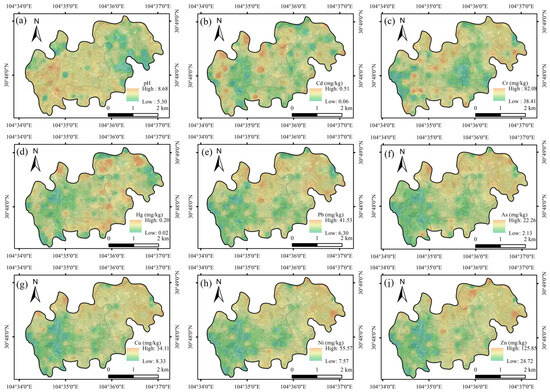
Figure 2.
Spatial distribution of HM concentration in topsoil. (a) pH; (b) Cd; (c) Cr; (d) Hg; (e) Pb; (f) As; (g) Cu; (h) Ni; (i) Zn.
3.2. Contamination Risk Assessment
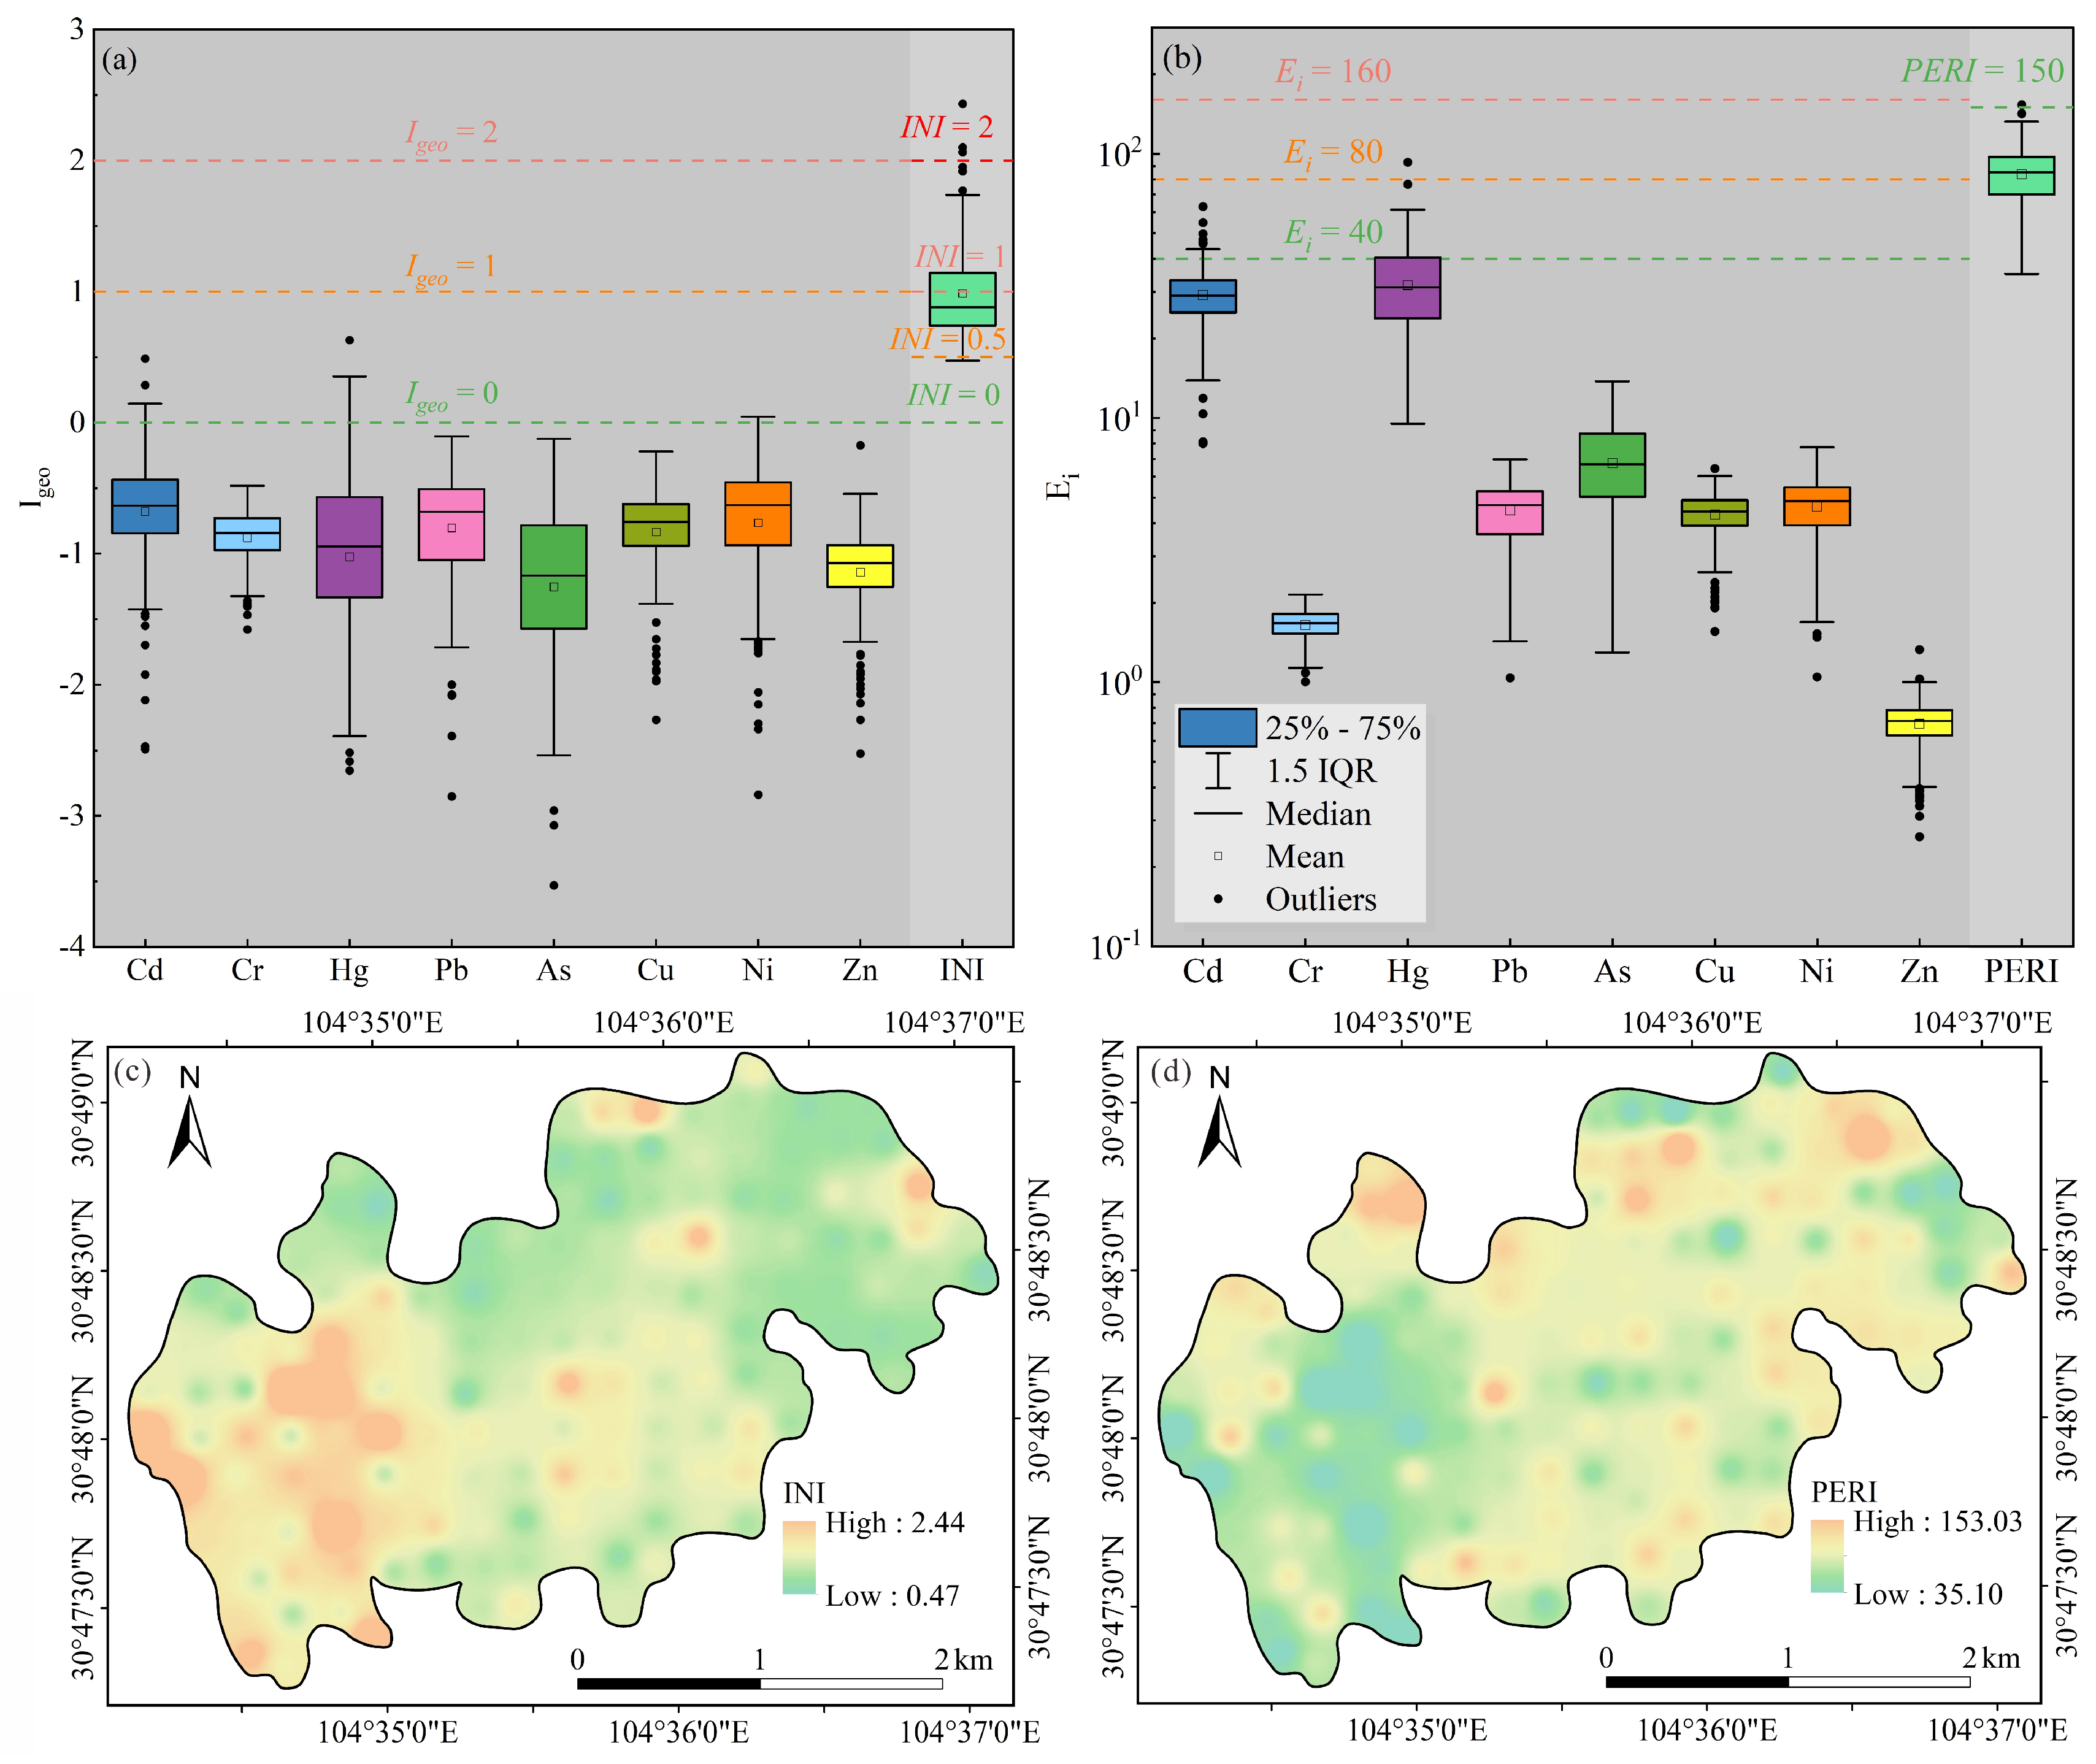
The Igeo and INI were utilized to estimate the pollution level of HMs, and the results are listed in Table S6. As shown in Figure 3a, the average values of Igeo for HMs were ranked as follows: Cd (−0.68) > Ni (−0.76) > Pb (−0.80) > Cu (−0.84) > Cr (−0.88) > Hg (−1.02) > Zn (−1.14) > As (−1.25). With the exception of Cd, Hg, and Ni, the Igeo for all HMs was below 0, indicating that they had no anomalous accumulation in the study area. In addition, only 3.57%, 1.79%, and 0.60% of the samples reached 0–1 for Cd, Hg, and Ni, which was considered as slight contamination. The INI of HMs varied from 0.47 to 2.43, with a mean value of 0.99. The INI values of 62.50% samples were within 0–1, suggesting that the overall level of HM contamination in the topsoil of the study area was either no or slight contamination. Additionally, 35.71% of samples had slight to moderate contamination. Furthermore, samples with higher contamination levels were concentrated in the southwestern part of the study area (Figure 3c).
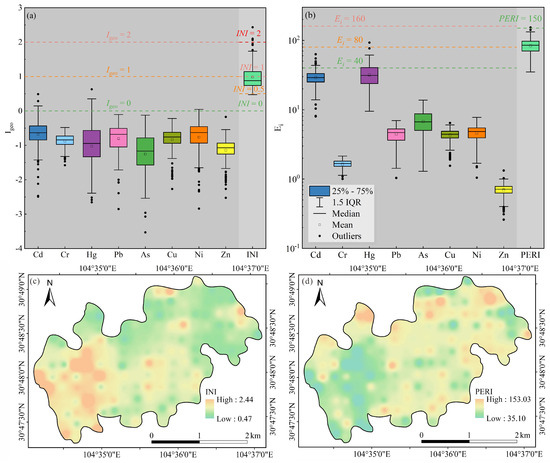
Figure 3.
The box plots of (a) the Igeo and INI, (b) the Ei and PERI; the spatial distribution of (c) the INI, and (d) the PERI.
The Ei and PERI reveal the potential ecological effects posed by the HM concentration. The mean values of Ei for HMs were in the order of Hg (31.91) > Cd (29.26) > As (6.74) > Ni (4.62) > Pb (4.46) > Cu (4.31) > Cr (1.65) > Zn (0.70). The Ei for all HMs was below 40 except Cd and Hg (Figure 3b), indicating their low ecological risks. Furthermore, the PERI was in the range of 35.10–153.03, with an average value of 83.65. A total of 99.40% of samples were considered as low ecological risk and 0.60% as moderate risk (Table S7). The high values were mainly concentrated in the northern part of the study area and distributed in a point-like pattern (Figure 3d).
4. Discussion
4.1. Source Apportionment of HMs
The Pearson correlation analysis was conducted to estimate the promotion and inhibition of HMs, aiming to reveal the potential common sources for various HMs. The results showed that As, Cu, Ni, Pb, and Zn had significantly positive correlations (>0.66), indicating they probably share the same source or influence each other positively. Additionally, Cr, Cd, and Hg were moderately correlated with other HMs, suggesting that they potentially have multiple sources (Figure 4).
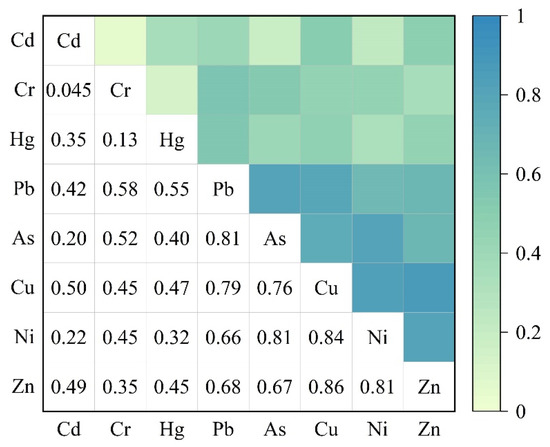
Figure 4.
The correlation analysis of HMs.
The PMF model was applied to further clarify and quantify the source contribution of soil HMs. The Q value remained stable when the factor number was set to 3 after the model had run 20 times, and the residuals for various HMs ranged from −3 to +3. Except for Cd (0.60), Hg (0.63), and Zn (0.74), the fitted r2 values were between 0.83 and 0.85 for the other HMs. These results demonstrated that the model was reasonable for source apportionment in this study.
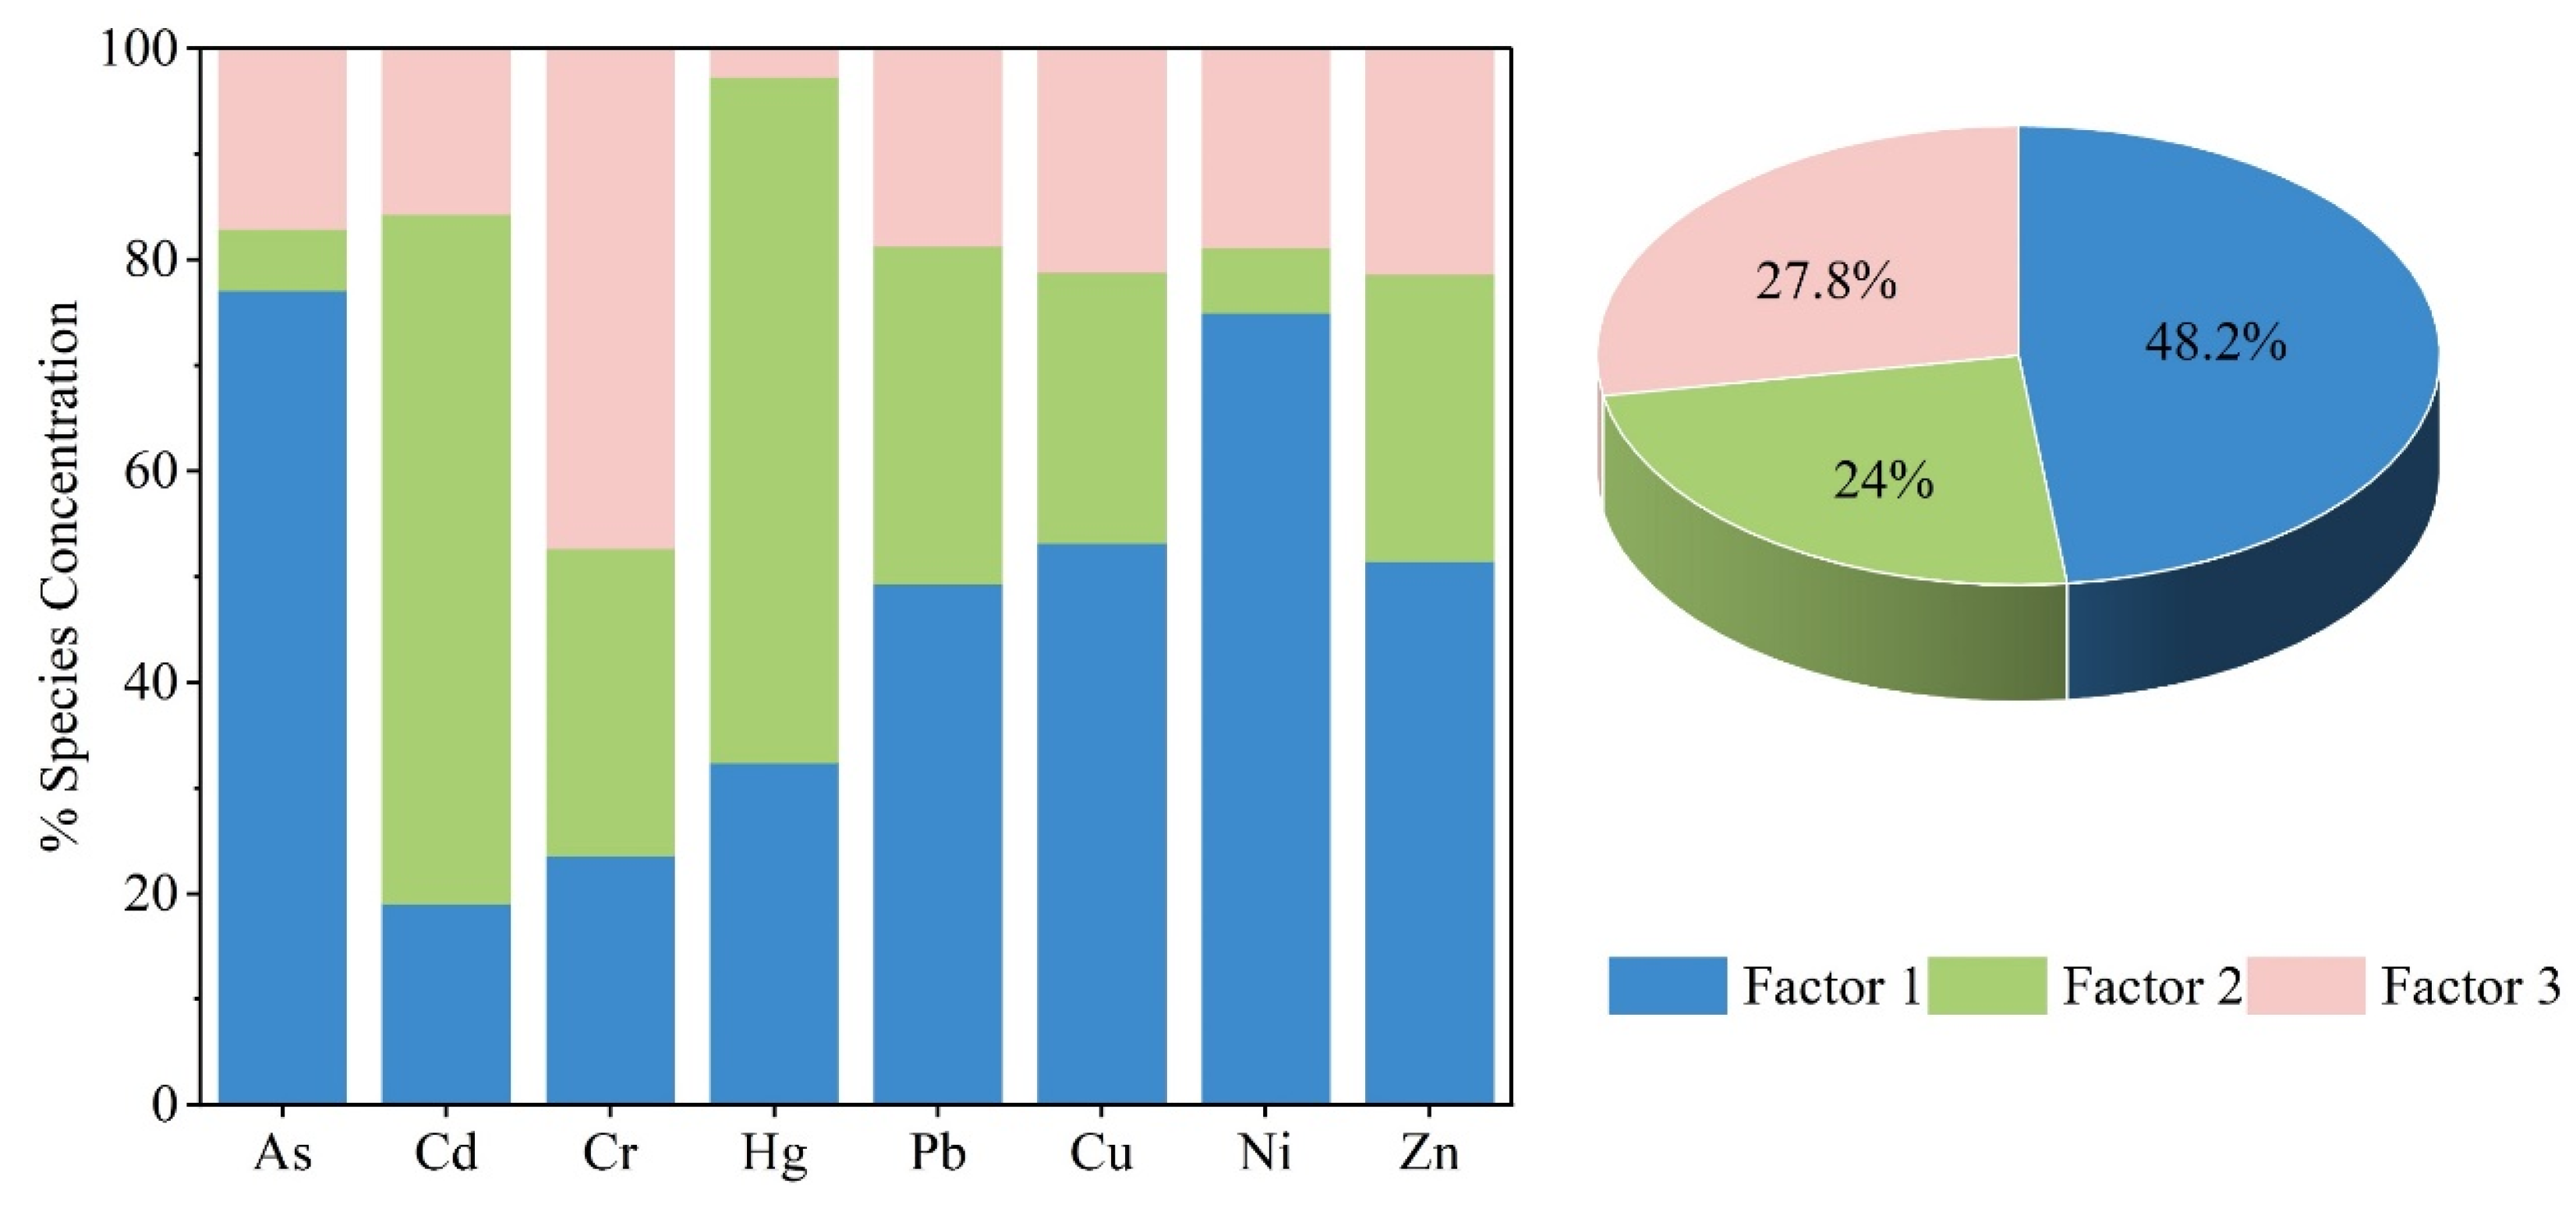
As shown in Figure 5, Factor 1 contributed 48.2% of the HMs, with higher loadings for As (77.16%), Pb (49.35%), Cu (53.24%), Ni (75.03%), and Zn (51.52%). Their average concentrations were all lower than the soil background levels (Table 1), while the contamination risk assessment showed that these elements were not significantly influenced by anthropogenic factors. Previous studies have confirmed that these elements are associated with soil parent materials [34,35,36,37]. Therefore, Factor 1 was considered a natural source.

Figure 5.
The source apportionment and percentage for HMs.
Factor 2, contributing 24.0%, was dominated by Cd (65.30%) and Hg (64.92%). The mean content of Cd exceeded the background level, and Hg had the highest CV, while the Igeo revealed that Cd had anomalous accumulation, indicating that Cd and Hg were influenced by human activities. Cd and Hg are commonly observed in industrial discharge, such as in metal processing activities [38,39]. In addition, several studies have shown that Cd and Hg derive from incineration (burning of refuse, coal, and biomass fuel) [40,41]. The study area is a typical agricultural area with no heavy industrial production. Coal burning is an important heating approach and waste disposal is extensive, mainly incineration and landfill. Therefore, these materials indicate that Factor 2 was associated with coal burning or waste disposal.
Factor 3, contributing 27.8%, was characterized by Cr (47.27%), followed by Cu, Pb, Zn, and Ni. These HMs have a certain correlation and are widely distributed in the study area, while the contamination and risk assessment suggested their low pollution and ecological risks. This indicates that they should originate from a wide range of activities within the area rather than specific pollution. In addition, previous studies revealed that Cr, Cu, and Pb originate from agricultural activities [42,43,44], and the use of pesticides and fertilizers in the extensive and long-term agricultural activities in the area provide a potential input pathway for them. Therefore, Factor 3 was considered as the agricultural source.
The source apportionment of HMs could provide reasonable pointers for the management of the local soil environment. For example, taking corresponding measures to address the possible sources of different HMs can effectively reduce their inputs and potential ecological risks, which can contribute to soil environmental governance and sustainable agricultural development in this area.
4.2. Health Risks Assessment of HMs
4.2.1. Deterministic Health Risk Assessment by the HHR Model
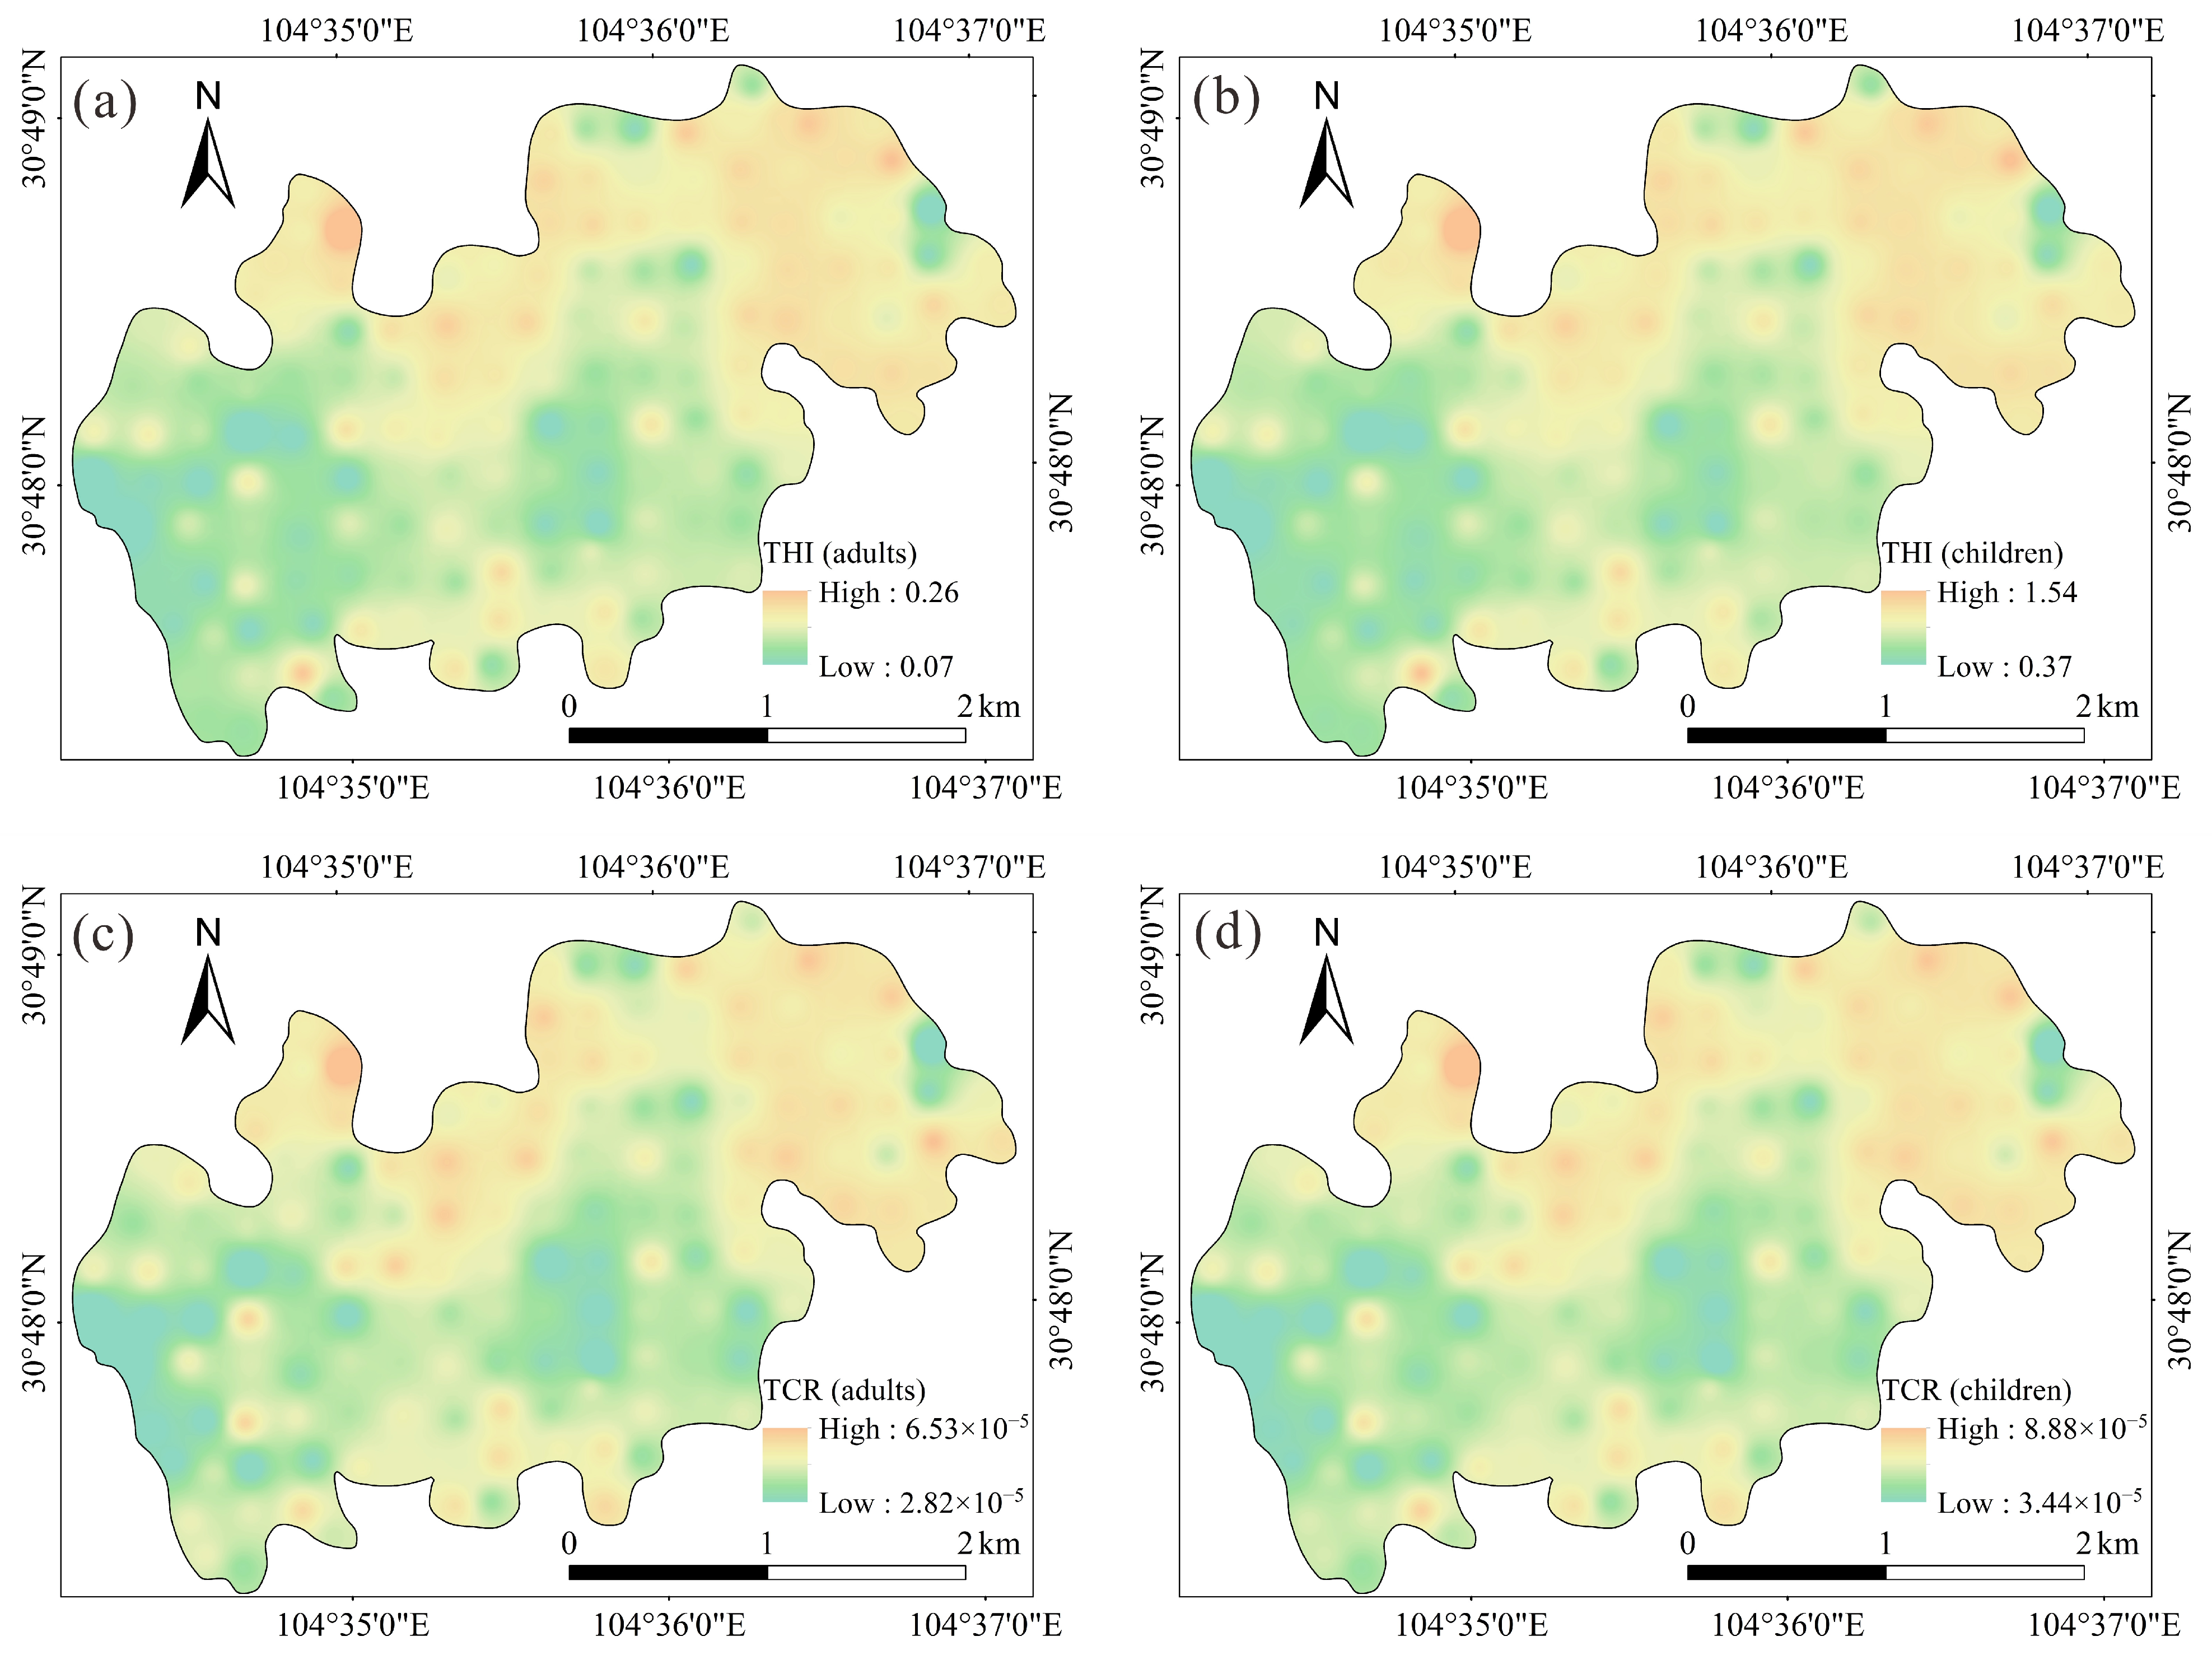
The deterministic health risks of HMs were evaluated using the HHR model, and the results are listed in Table 2. The non-carcinogenic risks of individual HMs were all within acceptable limits for both children and adults. In addition, the total non-carcinogenic health risk (THI) to children and adults were in the range of 0.38–1.53 and 0.08–0.26, with mean values of 0.95 and 0.17, respectively; 45.83% of samples showed the THI to children exceeding 1.0. The average values of carcinogenic health risk followed the order of Cr > As > Cd > Pb, with the total carcinogenic health risk (TCR) lower than the acceptable limit (10−4) for both children and adults. This suggests that HMs in topsoil pose a potential non-carcinogenic health risk to children and an acceptable carcinogenic health risk to children and adults. Furthermore, ingestion is the most important route leading to health risks (Table S8), followed by inhalation and dermal contact, which is also consistent with similar studies [45,46,47]. Notably, children faced higher non-carcinogenic and carcinogenic health risks than adults, which is associated with the behavioral and physiological differences between the groups [48].
Table 2.
Assessment results of human health risks of HMs.
The spatial distribution of health risks for children and adults is depicted in Figure 6. It revealed that soil from the northern and northeastern parts posed higher health risks. These areas are also the main zones of settlement in the study area, and anthropogenic activities such as domestic waste disposal are potential sources of HMs in topsoil, which require stronger regulation and more rational measures to control.
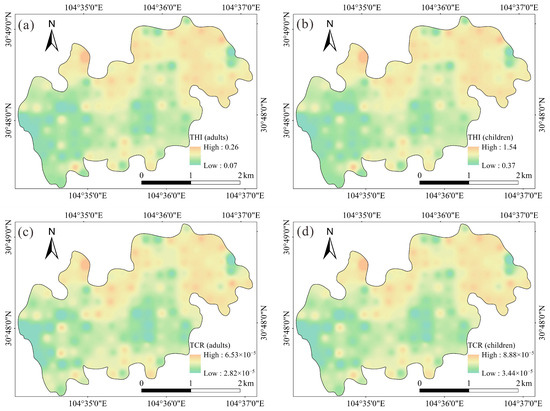
Figure 6.
Spatial distribution of deterministic health risks of HMs in topsoil. (a) The THI for the children; (b) the THI for adults; (c) the TCR for children; (d) the TCR for adults.
4.2.2. Probabilistic Health Risk Assessment by Monte Carlo Simulation
The deterministic evaluation was based on limited samples and reference values of exposure, the results of which do not represent the real situation well and ignore individual differences in exposure parameters. Therefore, this study employed the Monte Carlo simulation to provide a more comprehensive insight into the health risk assessment.
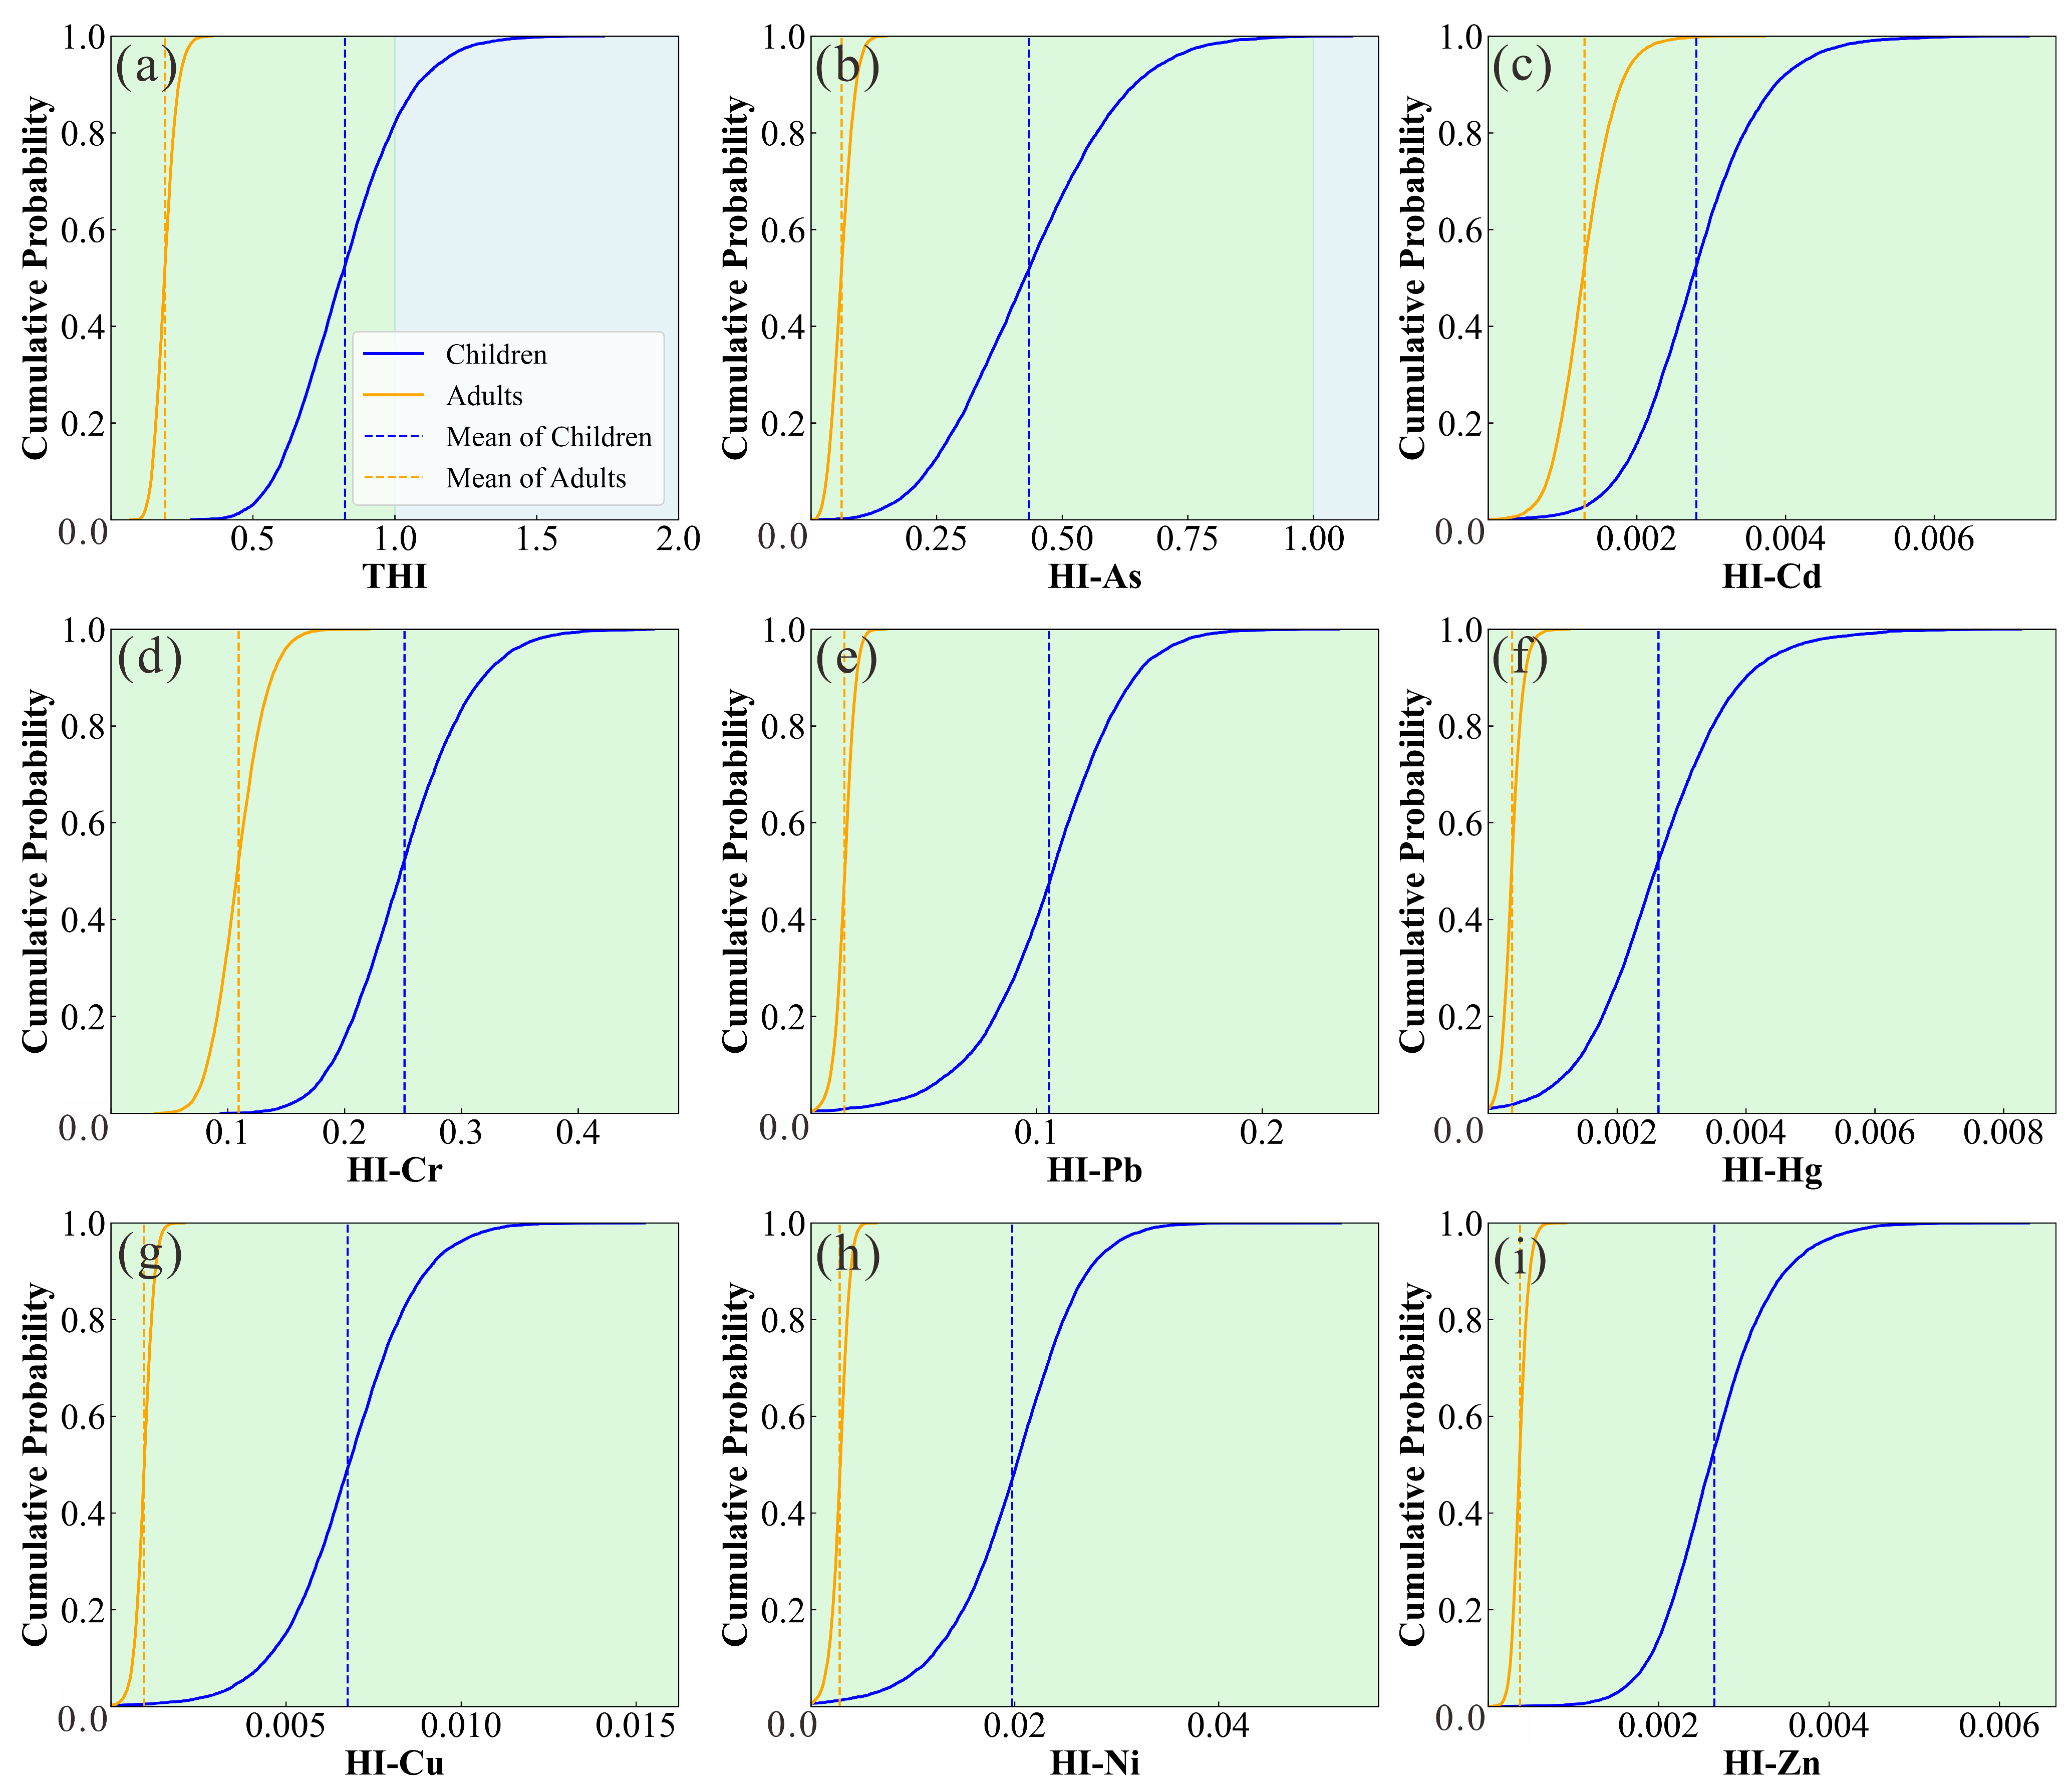
The THI varied from 0.36 to 1.88 and from 0.05 to 0.54 for children and adults, with mean values of 0.94 and 0.30, respectively. As shown in Figure 7, the THI of adults remained at a low level, while the THI of children exceeded 1.0, starting from the 63.63th percentile. Additionally, the non-carcinogenic health hazard index (HI) values of HMs followed the order: As > Cr > Pb > Ni > Cu > Cd > Hg > Zn, consistent with the deterministic results. Furthermore, the TCR were in the range of 2.21 × 10⁻⁵–1.17 × 10⁻⁴ (mean value = 6.10 × 10⁻⁵) and 2.12 × 10⁻⁵–7.80 × 10⁻⁵ (mean value = 4.72 × 10⁻⁵) for children and adults, with 0.38% of samples showing unacceptable carcinogenic risk to children. Cr contributed the most to the TCR, followed by As (Figure 8). Notably, although some values may exceed acceptable limits, this does not necessarily imply an immediate or imminent risk to the population. Furthermore, a proportion of samples exceeded the threshold, but this does not mean that all individuals are exposed to those levels. The results of the health risk assessment only represent the potential threat to humans posed by these substances under defined conditions, thus providing a reference for environmental management and strategy implementation, and does not denote the actual situation in the study area.
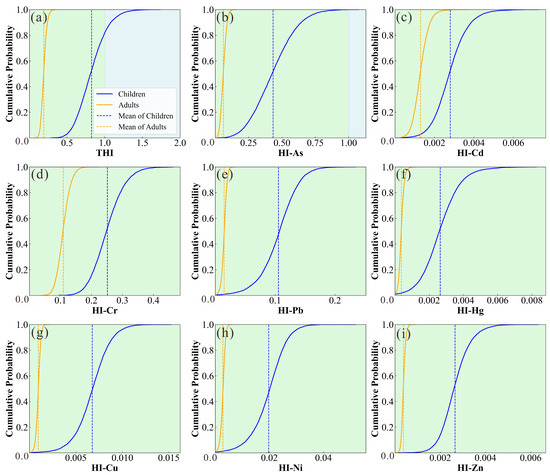
Figure 7.
Probabilistic non-carcinogenic health risk assessment of HMs. (a) THI; (b) HI of As; (c) HI of Cd; (d) HI of Cr; (e) HI of Pb; (f) HI of Hg; (g) HI of Cu; (h) HI of Ni; (i) HI of Zn.
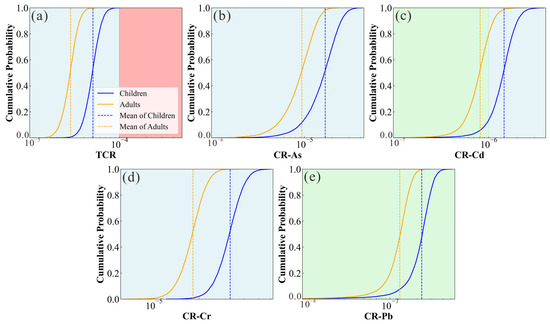
Figure 8.
Probabilistic carcinogenic health risk assessment of HMs. (a) TCR, (b) CR of As; (c) CR of Cd; (d) CR of Cr; (e) CR of Pb.
In general, the results of the probabilistic assessment were generally consistent with the deterministic evaluation, but the former provided broader insights into the health risk evaluation [49]. The Monte Carlo simulation not only confirms the rationality of the human health risk (HHR) assessment model but also provides more references for soil health risk assessment.
4.3. Comparison with Similar Studies Worldwide
The HMs in the soil have been increasingly attracting research attention in the agricultural area. Therefore, we selected several similar research studies to compare with the findings of this study. Firstly, this study showed low HM content and pollution levels in agricultural soil, aligning with studies in Thailand and Vietnam [50,51], which have the same geological conditions (sandstone). These areas are less affected by external factors except for agricultural activities, and soil parent materials and natural processes are usually the main sources of HMs in soil. However, agricultural soil near the mining area often shows high HM concentration and pollution levels, and a considerable part of the soil HM is derived from mineral-related processes. For example, studies from Guizhou, Hunan, and the Tibetan Plateau suggest that Pb-Zn mines and Cu mines near the study area make the level of Pb, Zn, and Cu in the soil seriously exceed the standard and can contribute to significant potential ecological risks [52,53,54]. In addition, the HMs in the agricultural soil of developed urban areas are also influenced significantly by industrial activities [55]. Studies from Japan and England revealed that these HMs are associated with livestock manures [56,57]. Notably, most of these studies suggest that Cd and Hg, often originating from anthropogenic activities, are the main contributors to ecological risk, which may be related to their higher toxic coefficient [58,59]. Therefore, it is necessary to take corresponding measures to reduce their inputs for achieving sustainable agricultural development. Furthermore, As poses the most significant effect on human health, some novel methods like machine learning could effectively predict HM content and pollution level [60].
In general, HM in agricultural soil is usually closely related to the parent material, but it needs to be analyzed in combination with background information and field investigation for specific areas. Moreover, analysis using some advanced methods could make this research more interesting.
5. Conclusions
The study employed various methods to analyze the characteristics of HMs, identify their potential sources, and assess the ecological and health risks of topsoil collected from a typical agricultural region. The primary conclusions were as follows:
- (1)
- The mean concentration order of HMs was in the order of Zn > Cr > Ni > Pb > Cu > As > Cd > Hg, with only Cd exceeding its background values. Hg had the highest variability, and most HMs exhibited higher levels in the northeastern part of the study area.
- (2)
- The average contamination level of HMs was ranked as follows: Cd > Ni > Pb > Cu > Cr > Hg > Zn > As. Only 3.57%, 1.79%, and 0.60% of Cd, Hg, and Ni in the samples reached slight contamination, and the INI suggests an overall slight contamination (62.50% of samples were within 0–1). In addition, the HMs showed low ecological risk (mean value = 83.65; 99.40% samples considered as low risk).
- (3)
- Three sources (natural source, coal burning or waste disposal, and agricultural activities) contributed 48.2%, 24%, and 27.8% of HMs, respectively. Whereas the natural source mainly contributed As, Pb, Cu, Ni, and Zn. Cd and Hg were associated with coal burning or waste disposal. In addition, agricultural activities also provided various HMs, especially Cr, followed by Cu, Pb, and Ni.
- (4)
- Both the total non-carcinogenic and carcinogenic risks for adults were lower than unacceptable limits; children faced higher health risks, and nearly half of the samples (45.83%) showed a non-carcinogenic risk for children greater than 1. As and Cr contributed the most to non-carcinogenic and carcinogenic risks, respectively.
Despite the low contamination level and ecological risk of HMs, it is necessary to take precautionary measures to avoid elevating or expanding pollution. For example, emissions such as garbage in the study area should be treated in an environmentally sound manner and prevented from landfill or burning; the use of pesticides and fertilizers should be regulated in agricultural activities to reduce HM inputs. In addition, protective measures for vulnerable populations, especially children, are necessary to reduce human health risks. In the long term, strengthening publicity and education to improve the public health of the masses and establish environmental protection awareness is the key to eliminating soil pollution and the sustainable development of agriculture in this area.
Supplementary Materials
The following supporting information can be downloaded at: https://www.mdpi.com/article/10.3390/agriculture15090913/s1, Table S1: Classification of the heavy metal contamination risk assessment indices; Table S2: Reference dose and slope factors of different exposure pathways. Table S3: Exposure parameters for health risk calculation. Table S4: Distributions for each parameter in the Monte Carlo simulation. Table S5: Distributions for each parameter in the Monte Carlo simulation. Table S6: Calculation result of the geo-cumulative index for soil HMs. Table S7: Calculation result of the ecological hazard factor and PERI for soil HMs. Table S8: The contribution of each pathway to human health risk assessment. References [61,62,63,64,65] are cited in the Supplementary Materials.
Author Contributions
Conceptualization, Y.Z. and B.W.; Data curation, D.W.; Formal analysis, S.Y.; Investigation, H.L., M.L. and Y.W. (Yangshuang Wang); Methodology, D.W.; Project administration, Y.W. (Ying Wang); Resources, B.W.; Software, D.W. and S.Y.; Supervision, Y.Z. and B.W.; Writing—original draft, D.W.; Writing—review and editing, B.W. All authors have read and agreed to the published version of the manuscript.
Funding
This research was funded by the Sichuan Science and Technology Program (2025YFHZ0269, 2025ZNSFSC0307), and Scientific Program of Yibin City (SWJTU2021020007, SWJTU2021020008, YBSCXY2023020006, YBSCXY2023020007).
Data Availability Statement
The data presented in this study are available upon request from the corresponding author.
Conflicts of Interest
The authors declare no conflicts of interest.
References
- Agyeman, P.C.; John, K.; Kebonye, N.M.; Ofori, S.; Borůvka, L.; Vašát, R.; Kočárek, M. Ecological risk source distribution, uncertainty analysis, and application of geographically weighted regression cokriging for prediction of potentially toxic elements in agricultural soils. Process Saf. Environ. Prot. 2022, 164, 729–746. [Google Scholar] [CrossRef]
- Wan, M.; Qu, M.; Hu, W.; Li, W.; Zhang, C.; Cheng, H.; Huang, B. Estimation of soil pH using PXRF spectrometry and Vis-NIR spectroscopy for rapid environmental risk assessment of soil heavy metals. Process Saf. Environ. Prot. 2019, 132, 73–81. [Google Scholar] [CrossRef]
- Wei, M.; Pan, A.; Ma, R.; Wang, H. Distribution characteristics, source analysis and health risk assessment of heavy metals in farmland soil in Shiquan County, Shaanxi Province. Process Saf. Environ. Prot. 2023, 171, 225–237. [Google Scholar] [CrossRef]
- Chinnannan, K.; Somagattu, P.; Yammanuru, H.; Reddy, U.K.; Nimmakayala, P. Health risk assessment of heavy metals in soil and vegetables from major agricultural sites of Ohio and West Virginia. Biocatal. Agric. Biotechnol. 2024, 57, 103108. [Google Scholar] [CrossRef]
- Gao, S.; Dong, Y.; Jia, Q.; Wu, S.; Bai, J.; Cui, C.; Li, Y.; Zou, P.; An, M.; Du, X.; et al. Hazards of toxic metal(loid)s: Exploring the ecological and health risk in soil–crops systems with long-term sewage sludge application. Sci. Total Environ. 2024, 948, 174988. [Google Scholar] [CrossRef]
- Ou, S.-P.; Liao, X.-L.; Huang, Z.-T.; Hu, Y.-C.; Cai, Z.; Chen, Z.-F. Bioaccessibility and health risk assessment of hydrophobic organic pollutants in soils from four typical industrial contaminated sites in China. J. Environ. Sci. 2025, 147, 282–293. [Google Scholar] [CrossRef]
- Bermudez, G.M.A.; Moreno, M.; Invernizzi, R.; Plá, R.; Pignata, M.L. Heavy metal pollution in topsoils near a cement plant: The role of organic matter and distance to the source to predict total and HCl-extracted heavy metal concentrations. Chemosphere 2010, 78, 375–381. [Google Scholar] [CrossRef]
- Zhou, Q.; Yang, S.; Sun, L.; Ye, J.; Sun, Y.; Qin, Q.; Xue, Y. Evaluating the protective capacity of soil heavy metals regulation limits on human health: A critical analysis concerning risk assessment—Importance of localization. J. Environ. Manag. 2024, 361, 121197. [Google Scholar] [CrossRef]
- Zhu, H.; Chen, Y.; Ruan, Z.; Wang, H.; Liu, D.; Zhao, M. Comprehensive characterization of volatile organic compounds in Chinese chemical industry park soils: Spatial variation, source identification, and health risk assessment. J. Environ. Sci. 2024, 155, 48–59. [Google Scholar] [CrossRef]
- Charzyński, P.; Plak, A.; Hanaka, A. Influence of the soil sealing on the geoaccumulation index of heavy metals and various pollution factors. Environ. Sci. Pollut. Res. 2017, 24, 4801–4811. [Google Scholar] [CrossRef]
- Liu, Z.; Du, Q.; Guan, Q.; Luo, H.; Shan, Y.; Shao, W. A Monte Carlo simulation-based health risk assessment of heavy metals in soils of an oasis agricultural region in northwest China. Sci. Total Environ. 2023, 857, 159543. [Google Scholar] [CrossRef]
- Mahvi, A.H.; Eslami, F.; Baghani, A.N.; Khanjani, N.; Yaghmaeian, K.; Mansoorian, H.J. Heavy metal pollution status in soil for different land activities by contamination indices and ecological risk assessment. Int. J. Environ. Sci. Technol. 2022, 19, 7599–7616. [Google Scholar] [CrossRef]
- Hou, D.; O’Connor, D.; Nathanail, P.; Tian, L.; Ma, Y. Integrated GIS and multivariate statistical analysis for regional scale assessment of heavy metal soil contamination: A critical review. Environ. Pollut. 2017, 231, 1188–1200. [Google Scholar] [CrossRef]
- Mi, Y.; Zhou, J.; Liu, M.; Liang, J.; Kou, L.; Xia, R.; Tian, R.; Zhou, J. Machine learning method for predicting cadmium concentrations in rice near an active copper smelter based on chemical mass balance. Chemosphere 2023, 319, 138028. [Google Scholar] [CrossRef]
- Saha, A.; Sen Gupta, B.; Patidar, S.; Hernández-Martínez, J.L.; Martín-Romero, F.; Meza-Figureueroa, D.; Martínez-Villegas, N. A comprehensive study of source apportionment, spatial distribution, and health risks assessment of heavy metal(loid)s in the surface soils of a semi-arid mining region in Matehuala, Mexico. Environ. Res. 2024, 260, 119619. [Google Scholar] [CrossRef]
- Zhang, Y.; Jiang, B.; Gao, Z.; Wang, M.; Feng, J.; Xia, L.; Liu, J. Health risk assessment of soil heavy metals in a typical mining town in north China based on Monte Carlo simulation coupled with Positive matrix factorization model. Environ. Res. 2024, 251, 118696. [Google Scholar] [CrossRef]
- Lei, M.; Li, K.; Guo, G.; Ju, T. Source-specific health risks apportionment of soil potential toxicity elements combining multiple receptor models with Monte Carlo simulation. Sci. Total Environ. 2022, 817, 152899. [Google Scholar] [CrossRef]
- Yu, J.; Liu, X.; Yang, B.; Li, X.; Wang, P.; Yuan, B.; Wang, M.; Liang, T.; Shi, P.; Li, R.; et al. Major influencing factors identification and probabilistic health risk assessment of soil potentially toxic elements pollution in coal and metal mines across China: A systematic review. Ecotoxicol. Environ. Saf. 2024, 274, 116231. [Google Scholar] [CrossRef]
- Liu, Z.; Zheng, T.; Chen, Q.; Chen, X.; Xie, Y.; Wang, Y.; Ren, M.; Gao, Z.-Q.; Lin, B.; Feng, X. Identification and health risk evaluation of soil contaminated by polycyclic aromatic hydrocarbons at shale gas extraction sites based on positive matrix factorization. Chemosphere 2024, 356, 141962. [Google Scholar] [CrossRef]
- USEPA. Exposure Factors Handbook: 2011 Edition; National Center for Environmental Assessment: Washington, DC, USA, 2011.
- Zhang, X.; Liu, H.; Li, X.; Zhang, Z.; Chen, Z.; Ren, D.; Zhang, S. Ecological and health risk assessments of heavy metals and their accumulation in a peanut-soil system. Environ. Res. 2024, 252, 118946. [Google Scholar] [CrossRef]
- Cai, L.-M.; Quan, K.; Wen, H.-H.; Luo, J.; Wang, S.; Chen, L.-G.; Song, H.; Wang, A. A comprehensive approach for quantifying source-specific ecological and health risks of potentially toxic elements in agricultural soil. Environ. Res. 2024, 263, 120163. [Google Scholar] [CrossRef]
- Zhang, T.; Wang, P.; Wang, M.; Liu, J.; Gong, L.; Xia, S. Spatial distribution, source identification, and risk assessment of heavy metals in riparian soils of the tibetan plateau. Environ. Res. 2023, 237, 116977. [Google Scholar] [CrossRef]
- Chart-Asa, C.; Gibson, J.M. Health impact assessment of traffic-related air pollution at the urban project scale: Influence of variability and uncertainty. Sci. Total Environ. 2015, 506–507, 409–421. [Google Scholar] [CrossRef]
- Kettler, S.; Kennedy, M.; McNamara, C.; Oberdörfer, R.; O’Mahony, C.; Schnabel, J.; Smith, B.; Sprong, C.; Faludi, R.; Tennant, D. Assessing and reporting uncertainties in dietary exposure analysis. Food Chem. Toxicol. 2015, 82, 79–95. [Google Scholar] [CrossRef]
- DZ/T 0295-2016; Specification of land Quality Geochemical Evaluation. Geological Publishing House: Beijing, China, 2016.
- Dong, Y.; Lu, H.; Lin, H. Comprehensive study on the spatial distribution of heavy metals and their environmental risks in high-sulfur coal gangue dumps in China. J. Environ. Sci. 2024, 136, 486–497. [Google Scholar] [CrossRef]
- Chen, J.; Wei, F.; Zheng, C.; Wu, Y.; Adriano, D.C. Background concentrations of elements in soils of China. Water Air Soil Pollut. 1991, 57–58, 699–712. [Google Scholar] [CrossRef]
- Hołtra, A.; Zamorska-Wojdyła, D. Application of individual and integrated pollution indices of trace elements to evaluate the noise barrier impact on the soil environment in Wrocław (Poland). Environ. Sci. Pollut. Res. 2023, 30, 26858–26873. [Google Scholar] [CrossRef]
- Hakanson, L. An ecological risk index for aquatic pollution control. A sedimentological approach. Water Res. 1980, 14, 975–1001. [Google Scholar] [CrossRef]
- Wei, D.; Yang, S.; Zou, L.; Torres-Martínez, J.A.; Zheng, Y.; Hu, Q.; Zhang, Y. Appraisal of potential toxic elements pollution, sources apportionment, and health risks in groundwater from a coastal area of SE China. J. Environ. Manag. 2025, 377, 124691. [Google Scholar] [CrossRef]
- USEPA. Risk Assessment Guidance for Superfund. Volume I: Human Health Evaluation Manual (Part A); Office of Emergency and Remedial Response U.S. Environmental Protection Agency: Washington, DC, USA, 1989.
- Yao, R.; Zhang, Y.; Yan, Y.; Wu, X.; Uddin, M.G.; Wei, D.; Huang, X.; Tang, L. Natural background level, source apportionment and health risk assessment of potentially toxic elements in multi-layer aquifers of arid area in Northwest China. J. Hazard. Mater. 2024, 479, 135663. [Google Scholar] [CrossRef]
- Acosta, J.A.; Martínez-Martínez, S.; Faz, A.; Arocena, J. Accumulations of major and trace elements in particle size fractions of soils on eight different parent materials. Geoderma 2011, 161, 30–42. [Google Scholar] [CrossRef]
- Alloway, B.J. (Ed.) Heavy Metals in Soils: Trace Metals and Metalloids in Soils and their Bioavailability, Environmental Pollution; Springer: Dordrecht, The Netherlands, 2013. [Google Scholar] [CrossRef]
- Peng, Y.; Yu, G.I. Assessment of heavy metal pollution on agricultural land in Chengdu city under different anthropogenic pressures based on APCS-MLR modelling. Ecol. Indic. 2024, 165, 112183. [Google Scholar] [CrossRef]
- Zhang, X.P.; Deng, W.; Yang, X.M. The background concentrations of 13 soil trace elements and their relationships to parent materials and vegetation in Xizang (Tibet), China. J. Asian Earth Sci. 2002, 21, 167–174. [Google Scholar] [CrossRef]
- Men, C.; Liu, R.; Xu, F.; Wang, Q.; Guo, L.; Shen, Z. Pollution characteristics, risk assessment, and source apportionment of heavy metals in road dust in Beijing, China. Sci. Total Environ. 2018, 612, 138–147. [Google Scholar] [CrossRef]
- Xie, L.; Li, P.; Mu, D. Spatial distribution, source apportionment and potential ecological risk assessment of trace metals in surface soils in the upstream region of the Guanzhong basin, China. Environ. Res. 2023, 234, 116527. [Google Scholar] [CrossRef]
- He, Y.; Wang, W.; Chen, Y.; Hua, J.; Deng, C.; Li, H. Source-sink response analysis of heavy metals and soil pollution assessment in non-ferrous metal industrial agglomeration areas based on decision unit. Sci. Total Environ. 2024, 906, 167437. [Google Scholar] [CrossRef]
- Proshad, R.; Kormoker, T.; Abdullah Al, M.; Islam, M.S.; Khadka, S.; Idris, A.M. Receptor model-based source apportionment and ecological risk of metals in sediments of an urban river in Bangladesh. J. Hazard. Mater. 2022, 423, 127030. [Google Scholar] [CrossRef]
- Dhal, B.; Thatoi, H.N.; Das, N.N.; Pandey, B.D. Chemical and microbial remediation of hexavalent chromium from contaminated soil and mining/metallurgical solid waste: A review. J. Hazard. Mater. 2013, 250–251, 272–291. [Google Scholar] [CrossRef]
- Mizan, A.; Mamun, M.A.H.; Islam, M.S. Metal contamination in soil and vegetables around Savar tannery area, Dhaka, Bangladesh: A preliminary study for risk assessment. Heliyon 2023, 9, e13856. [Google Scholar] [CrossRef]
- Srinivasa Gowd, S.; Ramakrishna Reddy, M.; Govil, P.K. Assessment of heavy metal contamination in soils at Jajmau (Kanpur) and Unnao industrial areas of the Ganga Plain, Uttar Pradesh, India. J. Hazard. Mater. 2010, 174, 113–121. [Google Scholar] [CrossRef]
- De Souza, R.E.; Fontes, M.P.F.; Tucci, C.A.F.; Lima, H.N.; Da Silva Ferreira, M. Health risk assessment and quality reference values of potentially toxic elements in soils of the Southwestern Amazonas State—Brazil. Sci. Total Environ. 2024, 912, 168937. [Google Scholar] [CrossRef]
- Xie, Z.; Liu, W.; Chen, S.; Yao, R.; Yang, C.; Zhang, X.; Li, J.; Wang, Y.; Zhang, Y. Machine learning approaches to identify hydrochemical processes and predict drinking water quality for groundwater environment in a metropolis. J. Hydrol. Reg. Stud. 2025, 58, 102227. [Google Scholar] [CrossRef]
- Tyagi, N.; Upadhyay, M.K.; Majumdar, A.; Pathak, S.K.; Giri, B.; Jaiswal, M.K.; Srivastava, S. An assessment of various potentially toxic elements and associated health risks in agricultural soil along the middle Gangetic basin, India. Chemosphere 2022, 300, 134433. [Google Scholar] [CrossRef]
- Guan, Q.; Wang, F.; Xu, C.; Pan, N.; Lin, J.; Zhao, R.; Yang, Y.; Luo, H. Source apportionment of heavy metals in agricultural soil based on PMF: A case study in Hexi Corridor, northwest China. Chemosphere 2018, 193, 189–197. [Google Scholar] [CrossRef]
- Zhang, Y.; Yan, Y.; Yao, R.; Wei, D.; Huang, X.; Luo, M.; Wei, C.; Chen, S.; Yang, C. Natural background levels, source apportionment and health risks of potentially toxic elements in groundwater of highly urbanized area. Sci. Total Environ. 2024, 935, 173276. [Google Scholar] [CrossRef]
- Inboonchuay, T.; Suddhiprakarn, A.; Kheoruenromne, I.; Anusontpornperm, S.; Gilkes, R.J. Amounts and associations of heavy metals in paddy soils of the khorat basin, Thailand. Geoderma Reg. 2016, 7, 120–131. [Google Scholar] [CrossRef]
- Tra, H.T.L.; Egashira, K. Status of heavy metals in agricultural soils of Vietnam. Soil Sci. Plant Nutr. 2001, 47, 419–422. [Google Scholar] [CrossRef]
- Wu, Z.; Li, H.; Lü, L.; Liang, G.; Wu, T.; Zhu, J. Distributions and risk assessment of heavy metals in solid waste in lead-zinc mining areas and across the soil, water body, sediment and agricultural product ecosystem in their surrounding areas. China Geol. 2024, 8, 92–106. [Google Scholar] [CrossRef]
- Dai, X.; Liang, J.; Shi, H.; Yan, T.; He, Z.; Li, L.; Hu, H. Health risk assessment of heavy metals based on source analysis and monte Carlo in the downstream basin of the Zishui. Environ. Res. 2024, 245, 117975. [Google Scholar] [CrossRef]
- Xiao, F.; Cui, X.; Zhao, Y.; Fu, J.; Yu, T.; Bu, D.; Zhang, Q. Concentration, spatial distribution, and source apportionment of heavy metals in agricultural soils from the Yarlung Zangbo river basin, Tibetan Plateau. Environ. Earth Sci. 2023, 82, 577. [Google Scholar] [CrossRef]
- Xia, F.; Zhao, Z.; Niu, X.; Wang, Z. Integrated pollution analysis, pollution area identification and source apportionment of heavy metal contamination in agricultural soil. J. Hazard. Mater. 2024, 465, 133215. [Google Scholar] [CrossRef] [PubMed]
- Nakagawa, K.; Imura, T.; Berndtsson, R. Distribution of heavy metals and related health risks through soil ingestion in rural areas of western Japan. Chemosphere 2022, 290, 133316. [Google Scholar] [CrossRef] [PubMed]
- Nicholson, F.A.; Smith, S.R.; Alloway, B.J.; Carlton-Smith, C.; Chambers, B.J. An inventory of heavy metals inputs to agricultural soils in England and Wales. Sci. Total Environ. 2003, 311, 205–219. [Google Scholar] [CrossRef]
- Ali, W.; Muhammad, S. Compositional data analysis of heavy metal contamination and eco-environmental risks in Himalayan agricultural soils, northern Pakistan. J. Geochem. Explor. 2023, 255, 107323. [Google Scholar] [CrossRef]
- Zhang, S.; Ye, H.; Zhang, A.; Ma, Y.; Liu, Q.; Shu, Q.; Cao, X. Pollution characteristics, sources, and health risk assessment of heavy metals in the surface soil of Lushan scenic area, Jiangxi province, China. Front. Environ. Sci. 2022, 10, 891092. [Google Scholar] [CrossRef]
- Wang, J.; Deng, Y.; Huang, Z.; Li, D.A.; Zhang, X. Identification of driving factors for heavy metals and polycyclic aromatic hydrocarbons pollution in agricultural soils using interpretable machine learning. Sci. Total Environ. 2025, 960, 178384. [Google Scholar] [CrossRef]
- HJ 25.3-2014; Technical Guidelines for Risk Assessment of Contaminated Sites. Ministry of Environmental Protection of the People’s Republic of China: Beijing, China, 2014. (In Chinese)
- Rahman, M.S.; Khan, M.D.H.; Jolly, Y.N.; Kabir, J.; Akter, S.; Salam, A. Assessing risk to human health for heavy metal contamination through street dust in the Southeast Asian Megacity: Dhaka, Bangladesh. Sci. Total Environ. 2019, 660, 1610–1622. [Google Scholar] [CrossRef]
- United States Environmental Protection Agency (US EPA). Soil Screening Guidance: Technical Background Document, 1996; Superfund US EPA: Slidell, LA, USA, 1996.
- United States Environmental Protection Agency (US EPA). Supplemental Guidance for Developing Soil Screening Levels for Superfund Sites; OSWER 9355.4-24; Office of Solid Waste and Emergency Response: Washington, DC, USA, 2001.
- Zhou, H.; Yue, X.; Chen, Y.; Liu, Y. Source-specific probabilistic contamination risk and health risk assessment of soil heavy metals in a typical ancient mining area. Sci. Total Environ. 2024, 906, 167772. [Google Scholar] [CrossRef]

Disclaimer/Publisher’s Note: The statements, opinions and data contained in all publications are solely those of the individual author(s) and contributor(s) and not of MDPI and/or the editor(s). MDPI and/or the editor(s) disclaim responsibility for any injury to people or property resulting from any ideas, methods, instructions or products referred to in the content. |
© 2025 by the authors. Licensee MDPI, Basel, Switzerland. This article is an open access article distributed under the terms and conditions of the Creative Commons Attribution (CC BY) license (https://creativecommons.org/licenses/by/4.0/).