Article

A Study on Mechanical Properties of Modified Soil–Cement Mixed with Ferronickel Slag Powder under Dry–Wet Cycles in Marine Environments

1
College of Engineering, Fujian Jiangxia University, Fuzhou 350108, China
2
Zijin School of Geology and Mining, Fuzhou University, Fuzhou 350108, China
3
Fujian Provincial Institute of Building Science and Technology Co., Ltd., Fuzhou 350108, China
*
Author to whom correspondence should be addressed.
J. Mar. Sci. Eng. 2023, 11(9), 1684; https://doi.org/10.3390/jmse11091684
Submission received: 21 July 2023 / Revised: 20 August 2023 / Accepted: 21 August 2023 / Published: 26 August 2023
(This article belongs to the Section Ocean Engineering)

Abstract

:
Soft soil foundations in marine environments are under coupling actions of seawater erosion and dry–wet cycles due to tides. Ferronickel slag is a solid waste produced in the smelting of ferronickel alloys. To recycle industrial solid waste and conserve energy, ferronickel slag is partially substituted for cement to solidify the soft soil foundations in marine environments. Unconfined compression tests were conducted for soil–cement mixed with ferronickel slag of various proportions to investigate its apparent erosion characteristics and mechanical characteristics under dry–wet cycles. In the tests, the corresponding numbers of cycles were set to 0, 6, 12, and 18. To further investigate the microscopic action mechanism of ferronickel slag on soil–cement, a nuclear magnetic resonance (NMR) device was utilized to analyze the microstructure of the soil–cement. According to the testing results, the unconfined compressive strength of soil–cement first increased and then decreased when the number of cycles of seawater erosion increased. With other conditions being the same, the addition of ferronickel slag can improve soil–cement strength, and changes in soil–cement strength were more significant than that with no ferronickel slag mixed. Moreover, the optimal amount of admixture was proved to be 45%. As the number of dry–wet cycles increased, the mass of soil–cement first increased and then decreased. With the same number of dry–wet cycles, soil–cement mixed with ferronickel slag had a smaller mass loss rate than that with no ferronickel slag added. After six dry–wet cycles, apparent erosion of soil–cement becomes increasingly serious, including the absence of edges and corners, deformation of surfaces, and even spalling and cracking. The NMR analysis revealed that dry–wet cycles can promote the evolution of small pores into larger ones within the soil–cement, thereby increasing the number of larger pores, leading to an increase in porosity, a decrease in the compactness of the soil–cement, and a reduction in strength.

1. Introduction

Compared to inland areas, soft soil foundations in coastal regions are often vulnerable to seawater erosion and dry–wet cycles caused by tides. The coupling effect of marine erosion and the dry–wet cycles can damage the interior structure of soil–cement and bring down its durability [1,2]. Therefore, the engineering properties of soft soil foundations are rather poor in coastal areas, and cement is needed for foundation reinforcement. However, plain soil–cement fails to meet relevant engineering demands in most cases [3,4]. In fact, a growing number of researchers have recognized the influence of dry–wet cycles on cement-reinforced soil projects. For example, Wang and Gao [4] probed into strength attenuation principles of soil–cement under actions of dry–wet cycles and identified hygroexpansion-induced deformation of clay aggregate in soil particles as a major reason for the declined strength of modified soil after dry–wet cycles. By investigating the influence of dry–wet cycles on the bearing strength of new solidified soil, Zheng et al. [5] found that when the number of dry–wet cycles exceeded four, water content variations and cracks facilitated the propagation and coalescence of micro-cracks, the occurrence of new cracks, and the gradually decreased bearing strength of specimens. According to the findings of Liang and Zeng [6], internal friction angles, cohesion, and unconfined compressive strength of solidified mud soil first increased and then decreased as the number of dry–wet cycles increased. Cuisinier [7] investigated the impacts of varying moisture contents on soil–cement. Xu et al. [8] explored the mechanical properties of fiber–cement-treated soil cured at low temperatures under dry–wet cycles.
In recent years, with increasing demands for environmental protection in various countries, many scholars have noticed that recycling and utilizing industrial waste for construction projects can not only meet or enhance engineering performance requirements but also reduce waste emissions, thereby protecting the environment. For example, Li et al. [9] partially replaced cement with ultra-fine silicon powder, proving that the unconfined compressive strength of cement-solidified soil increased as the mixing amount of ultra-fine silicon powder increased. Akinyemi [10] probed into the effect of long-term dry–wet cycles on the mechanical properties of carbon fiber reinforced concrete. Dennis et al. [11] added lignin and coal ash to modify soil mass and compared the strength, stiffness, and durability under actions of dry–wet and freezing–thawing cycles before and after soil modification, respectively. Kampala et al. [12] conducted compressive strength tests by incorporating calcium carbide slag and fly ash into silty clay and found that carbide-slag-solidified clay performed rather poorly in resistance to dry–wet cycles. However, an admixture of fly ash enhanced its dry–wet cycle resistance. Wu et al. [13] added steel slag powder to improve cement-solidified soil and further investigated the strength characteristics of the soil–cement. By adding ferronickel slag powder, Chen [14] studied the solidification mechanism of soil–cement mixed with ferronickel slag. Liu et al. [15] investigated the influence of an admixture of ferronickel slag on soil–cement properties, indicating that co-doping of ferronickel slag and mineral powder contributed to the improvement of the cement’s strength.
In recent years, China’s annual discharge of ferronickel slag has reached almost 40 million tons—approximately 20% of the total discharge of smelter slag waste. It has become China’s fourth-largest smelting waste after mineral waste residues, steel slag, and red mud [15,16,17]. Ferronickel slag powder obtained by grinding ferronickel slag has some advantages, such as its potential activity, low price, and cyclic utilization. Therefore, it has been gradually applied in cement production and synthetic materials. According to previous studies [18], the addition of ferronickel slag powder with a replacement ratio of 20% is beneficial for boosting soil–cement strength in marine environments. In this paper, cement is partially substituted by ferronickel slag powder to solidify soft soil foundations in coastal areas, exploring the mechanical properties of such soil under dry–wet cycles. The optimal replacement ratio of ferronickel slag powder is identified from its impact pattern on soil–cement. A slurry is prepared with the optimal proportions of ferronickel slag powder, mineral powder, cement, and water. Finally, infrastructure like road foundations located in marine environments are reinforced by grouting, which further improves the practical engineering application of ferronickel slag powder.
Obviously, if an equivalent substitution of cement by ferronickel slag powder can be fulfilled and the powder is also successfully mixed in cement-based materials, cement consumed in a project can be lowered for resource conservation. More importantly, recycled ferronickel slag powder can reduce construction costs due to its low price.

2. Experimental Preparations

2.1. Experimental Materials

The materials used in the experiment included silt soil, cement, ferronickel slag powder, mineral powder, and water.
Silt soil: The dark grey soil was collected from a foundation pit of a project in Gulou District, Fuzhou, Fujian Province. Its physicomechanical indexes are tabulated in Table 1.
Cement: The cement used in the experiments was ordinary Portland cement (brand: Lianshi; P.O 42.5) produced in Fujian, which complies with the Chinese standard “Common Portland Cements” GB/T 175. Its main performance indicators and chemical compositions are provided in Table 2 and Table 3.
Compound ferronickel slag powder: It was an admixture of blast furnace ferronickel slag powder and granulated blast furnace mineral powder, with a mass ratio of 2:1. According to the findings of a market survey and various relevant literature sources [19,20], the modified compound ferronickel slag powder is available in the market at a significantly lower price compared to ordinary Portland cement (half the price). This price difference clearly demonstrates the economic advantage of using the compound ferronickel slag powder. For convenience, we will refer to this powder as ferronickel slag powder hereinafter. The chemical compositions of the ferronickel slag powder can be found in Table 4.
Artificial seawater: The soil–cement mixture containing ferronickel slag powder was immersed in seawater, which was prepared following the guidelines outlined in ASTMD 1141-98. The composition of the seawater used is provided in Table 5. The seawater consisted of the first five inorganic salts listed in the table. To ensure the purity of the water used, fresh water was purified using a laboratory water purification device. Throughout the 28-day experimental period, there was no need to replace the artificial seawater during the curing process. A plastic water tank, chosen for its resistance to corrosion, was utilized to store the seawater and simulate marine conditions. The primary components of artificial seawater can be found in Table 5.

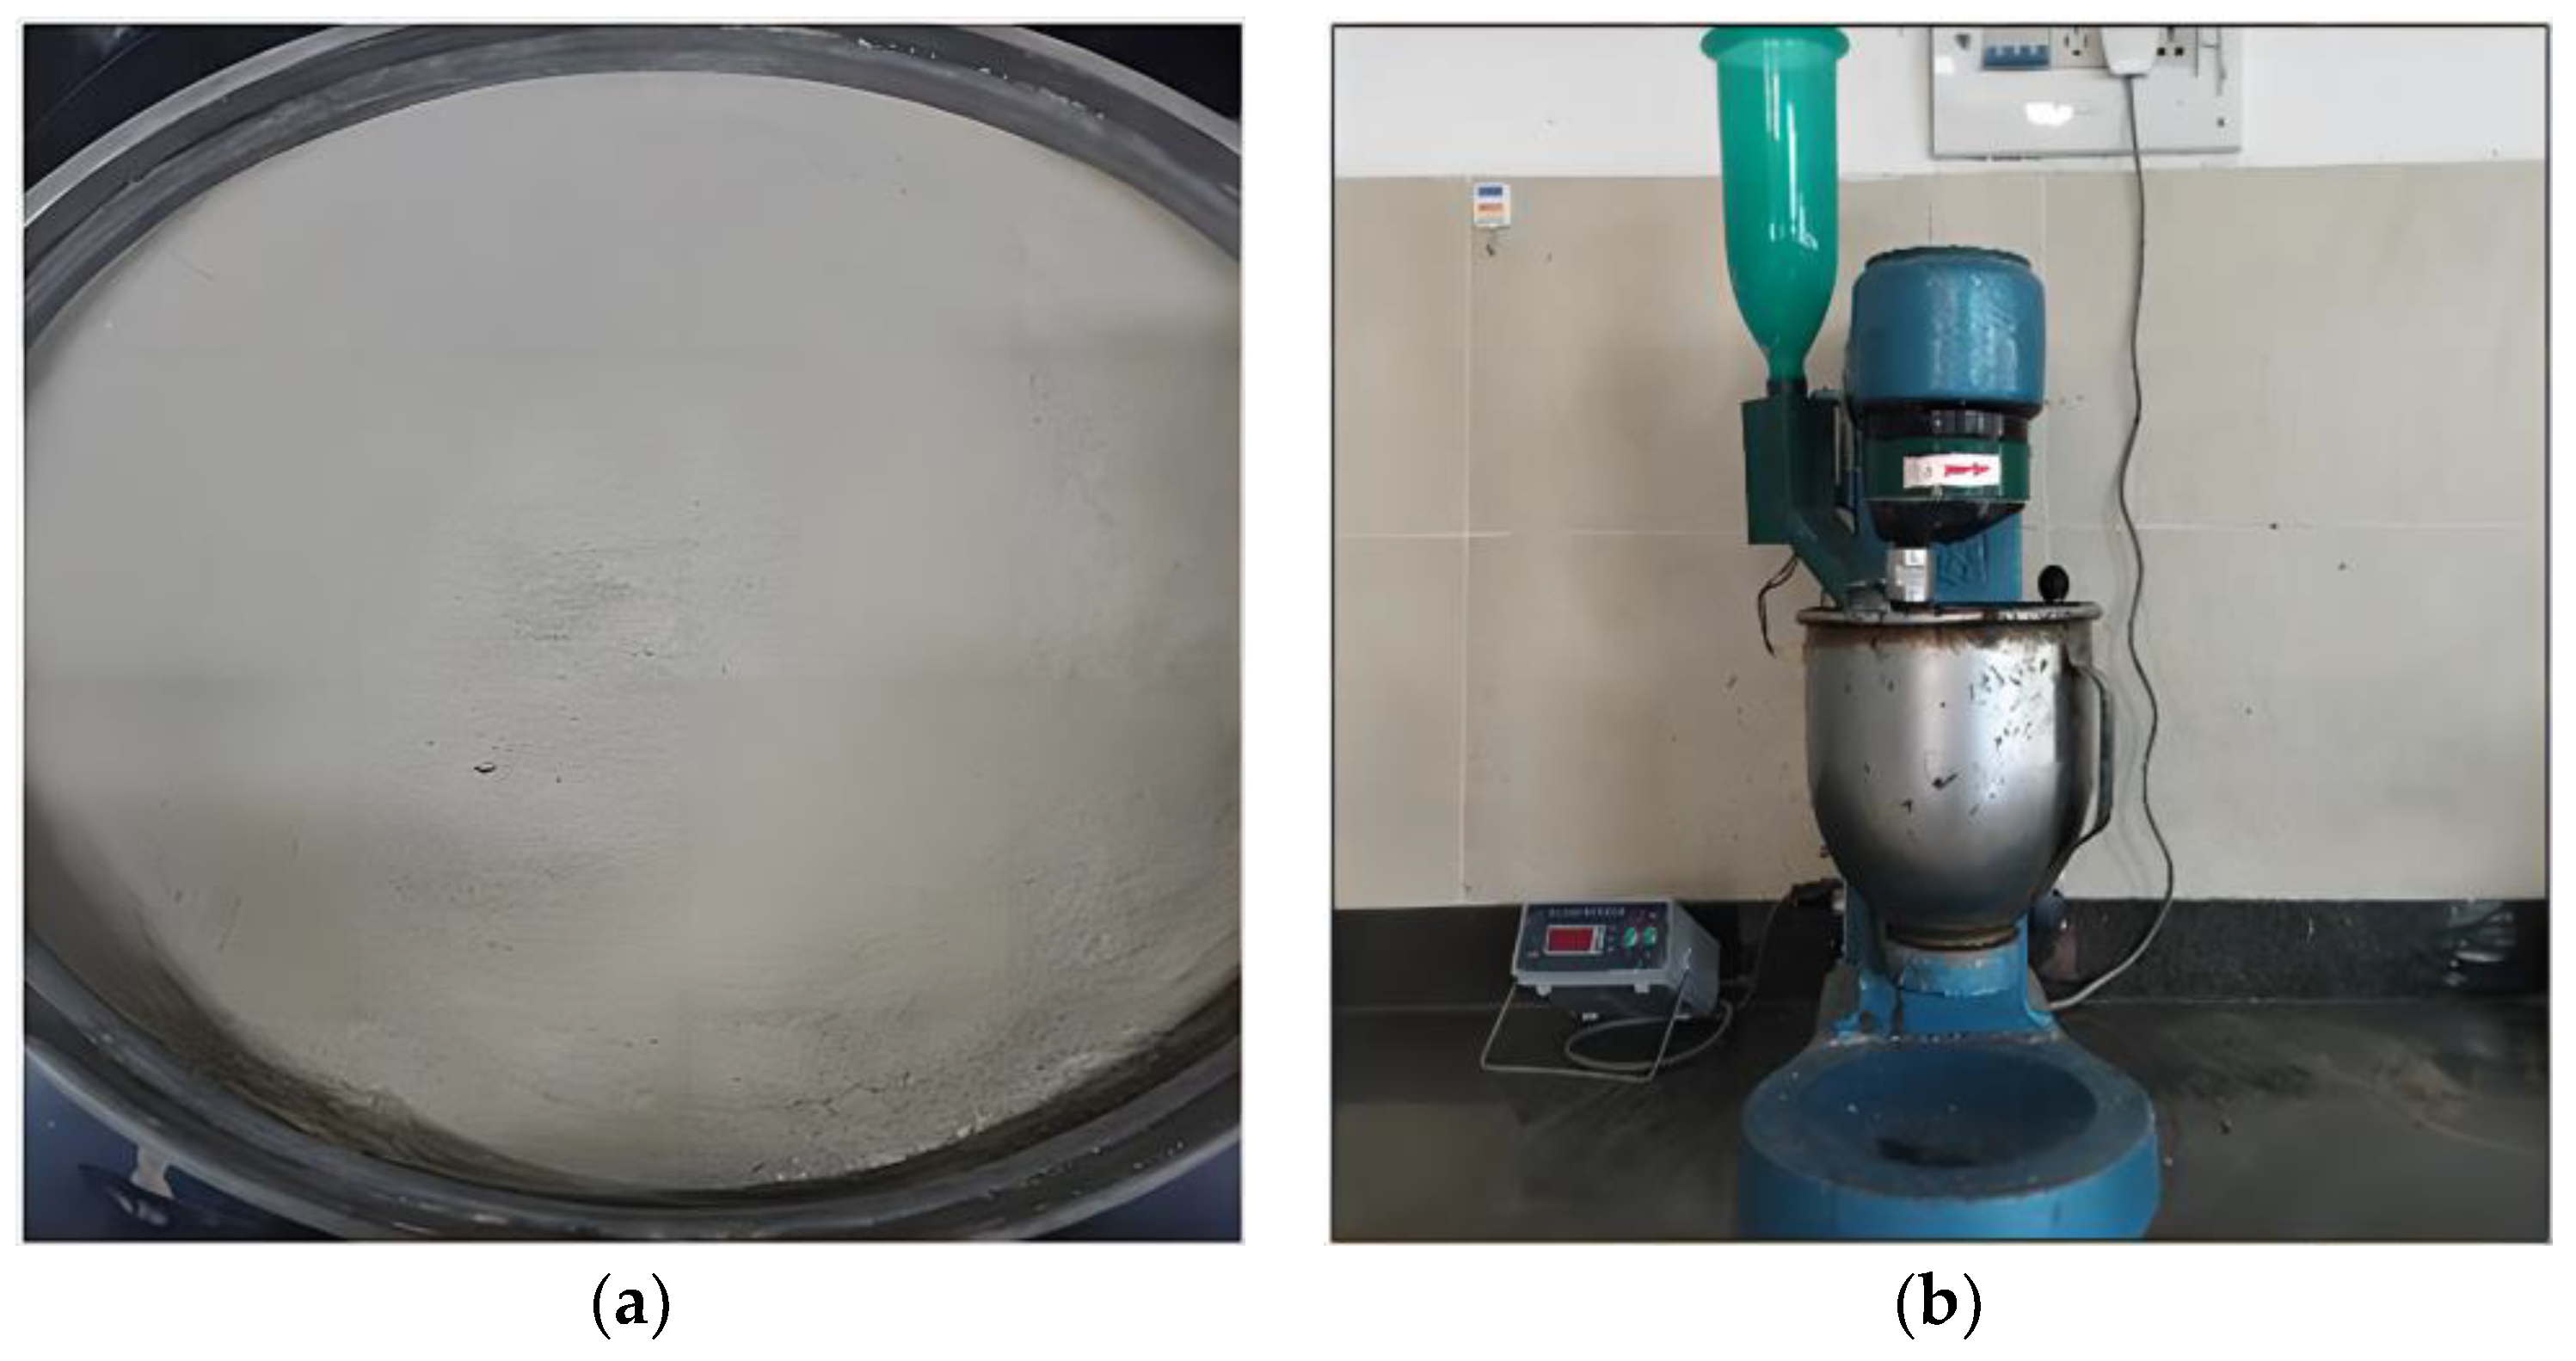
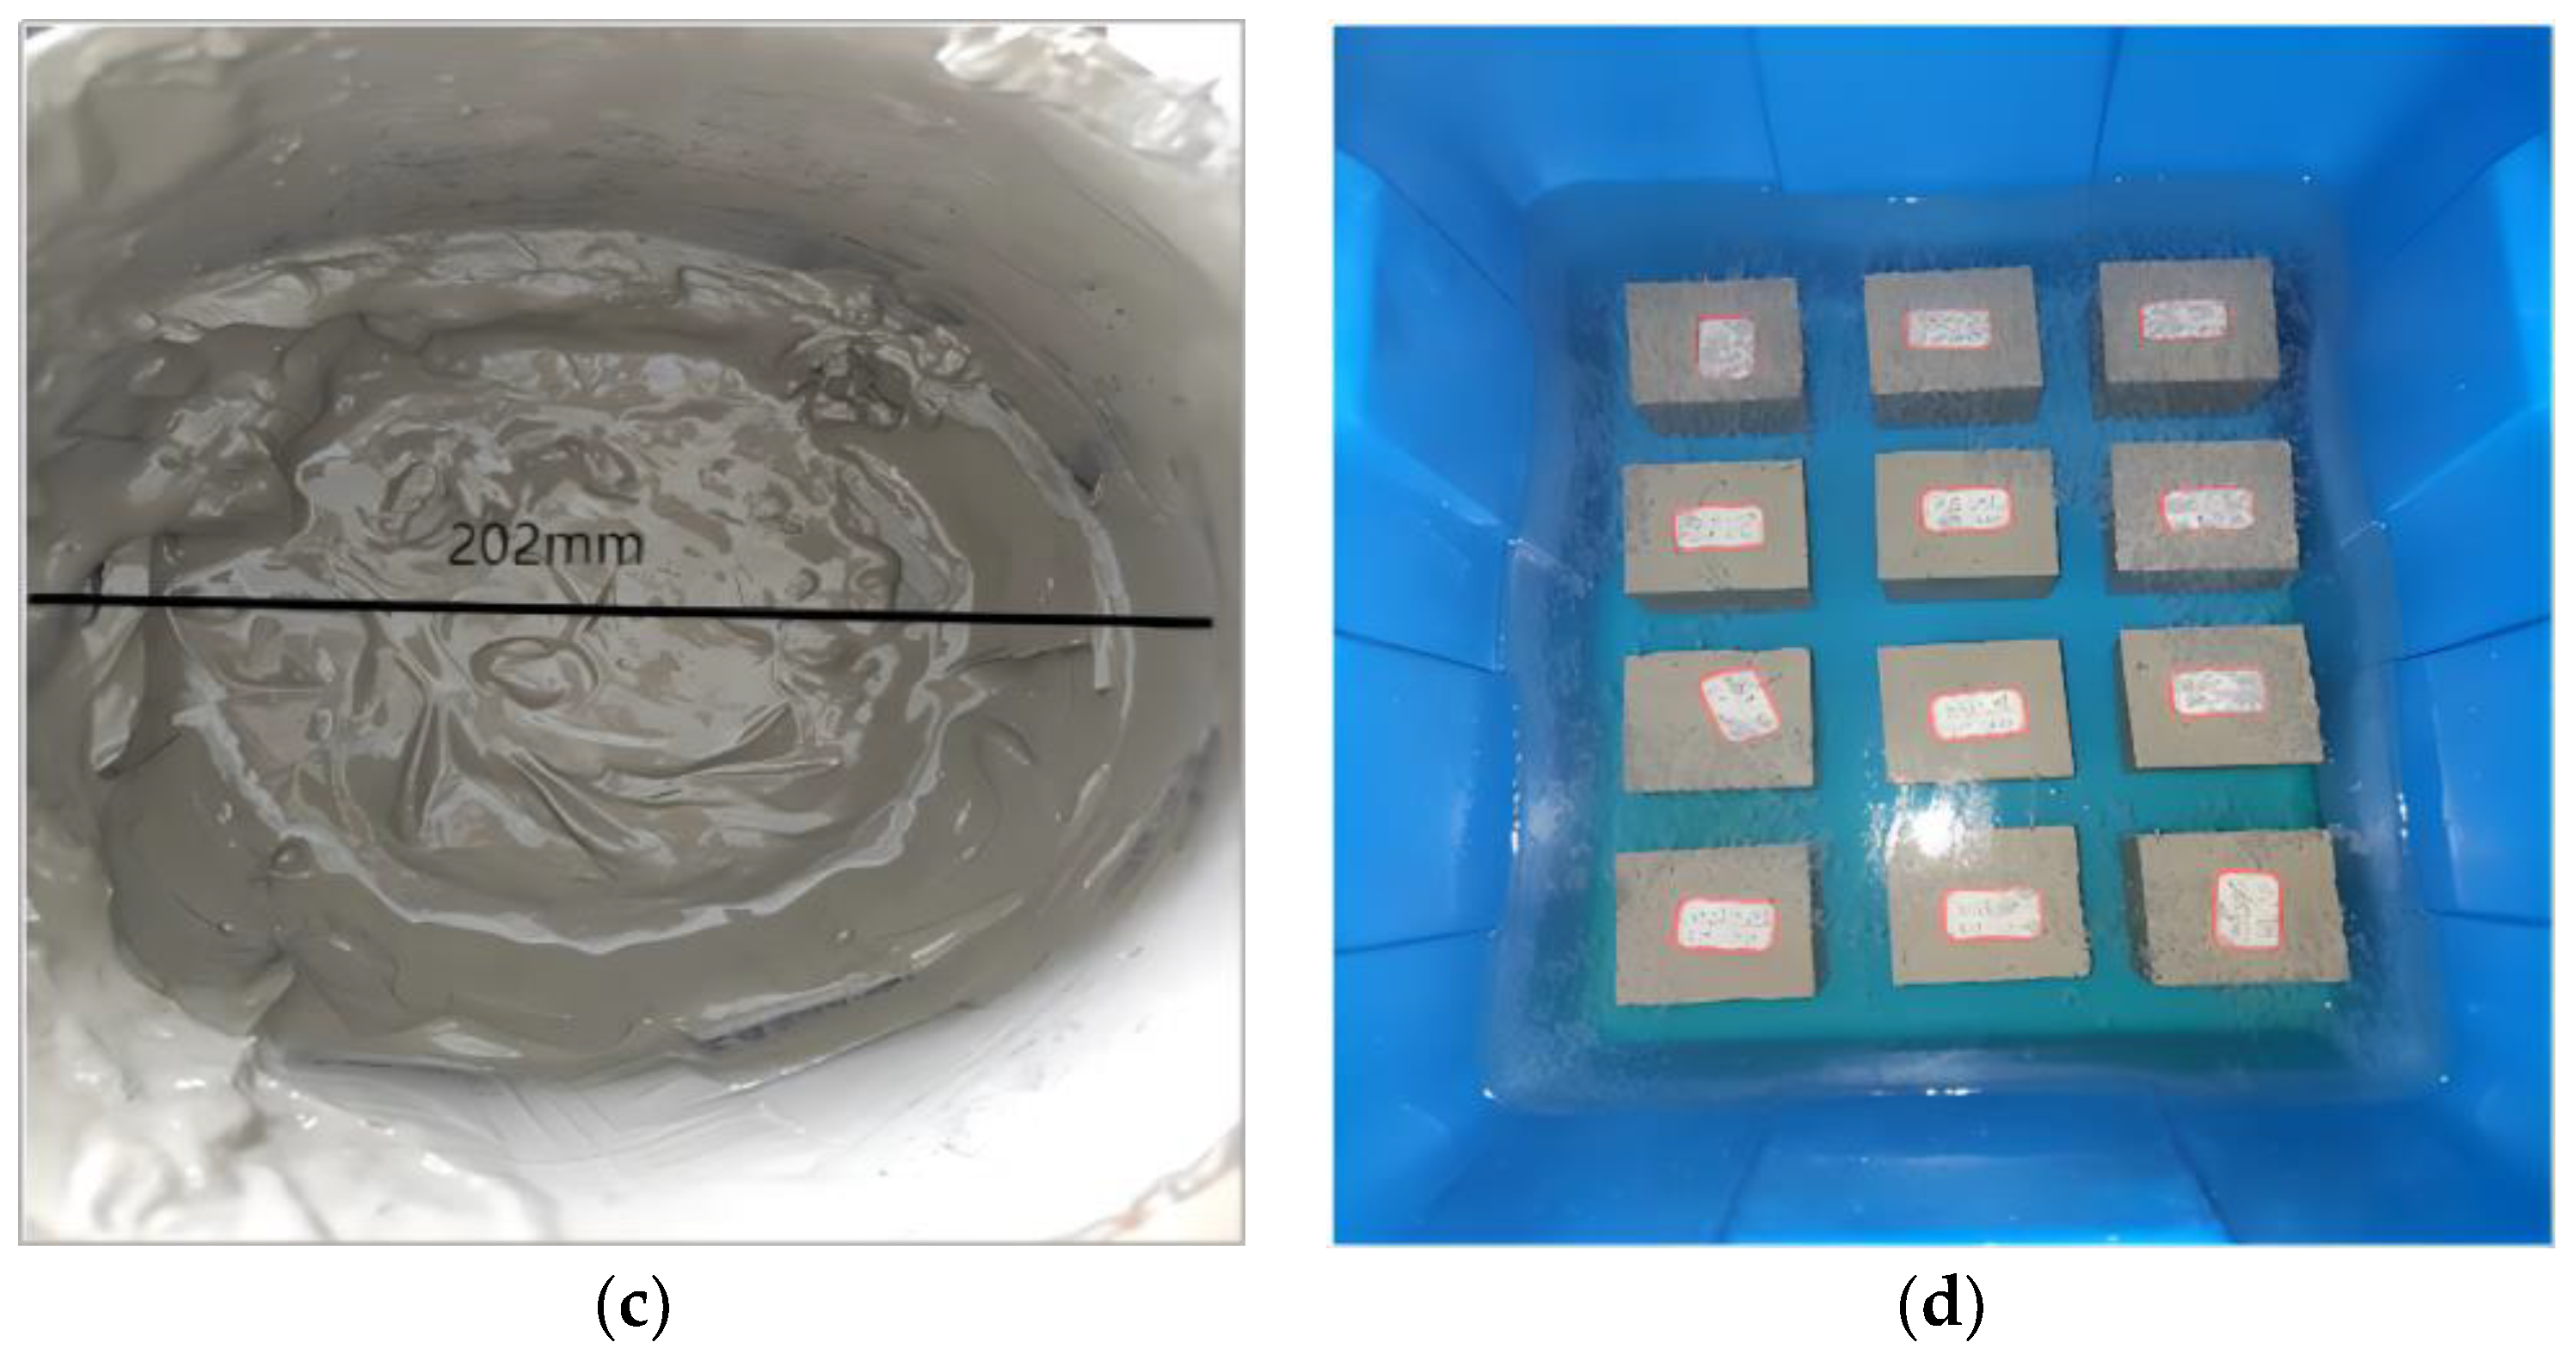
2.2. Sample Preparation

(1) Preparation of dry earth materials: The silt soil collected from the foundation pit was dried, ball-milled, and screened, thus producing dry earth materials that passed a 2 mm sieve (see Figure 1a). Earth materials larger than 2 mm were put in a sealable bag for the next ball milling.
(2) Preparation of wet earth materials: Wet earth materials were prepared with the moisture content the same as that of the in situ soil, which was 58.6%. More particularly, a certain amount of pure water and dry earth materials were uniformly stirred in a cement sand mixer, as depicted in Figure 1b. This stirring procedure was completed in two stages. At the interval of the two stages, those that could not be uniformly mixed at the bottom were manually processed for no less than 3 min.
(3) Preparation of soil–cement slurry: Proper amounts of pure water, soil–cement, and ferronickel slag powder were taken and weighed according to the mix proportion specified in the experimental scheme. They were then put in a paste mixer, where they were uniformly stirred for no less than 5 min to obtain the soil–cement slurry illustrated in Figure 1c.
(4) Demolding and curing of specimens: The triple mold containing the soil–cement was placed in a standard curing room (temperature: 20 ± 2 °C; relative humidity: >95%). In this room, curing in the mold lasted for 48 h, during which water drenching was prevented. Afterwards, the triple mold was dismantled. In line with the experimental scheme, after demolding, soil–cement specimens were separately put in freshwater curing chambers and seawater curing chambers, where they were soaked and cured throughout the designed experimental duration. The curing temperature of the specimen during water curing was set to 20 ± 1 °C, with an interval between specimens greater than 10 mm. Moreover, the water level was set 20 mm above specimen surfaces. Freshwater and seawater curing chambers, as depicted in Figure 1d, were stored in a standard curing room.

2.3. Experimental Scheme

To investigate the mechanical properties of ferronickel-slag-powder-modified soil–cement under the combined action of a marine environment and dry–wet cycles, soil–cement samples with different mix proportions (the replacement ratios of ferronickel slag powder to cement were set at 0%, 30%, 45%, and 60%). The specimens were 70.7 mm × 70.7 mm × 70.7 mm cubes, cured for 28 days in seawater in a standard curing room. Then, an automatic dry–wet cycle test machine (model CABR-LSB) was used for the seawater solution’s dry–wet cycles. The numbers of cycles were set at 0, 3, 6, 9, 12, 15, and 18. To account for dry and wet variations caused by diurnal temperature differences, one cycle was set as 24 h.
Cement soil, commonly utilized in the base layers of roads, is required to bear the vertical force of vehicle loads conveyed from the surface layer and to function as the load-bearing stratum of the pavement structure. Subsequent to the completion of various wet–dry cycles, unconfined compression tests were performed on the aforementioned samples. The purpose was to ascertain the effects of disparate wet–dry cycles on the strength of the samples. Three parallel experiments were set for each type of cycle number, with the final results being the average.
The specific test scheme is tabulated in Table 6, where the binder material mix ratio—referring to the literature [18]—was set at 15%. The binder materials refer to cement, ferronickel slag powder, and mineral powder.
To further explore the changes in pore structure and size at the micro level in soil–cement samples with different amounts of ferronickel slag powder, nuclear magnetic resonance (NMR) tests were conducted under the same conditions as the strength tests. The samples used the same test number. However, the specimen size was changed to a standard cylinder with a diameter of 50 mm and a height of 50 mm.

2.4. Experimental Procedure

2.4.1. Dry–Wet Cycle

The dry–wet cycle tests were carried out according to the “Standard for Test Methods of Long-term Performance and Durability of Ordinary Concrete” GB/T 50082 [21]. The test includes several stages:
  • Liquid inlet: The liquid inlet time was set to 15 min and the temperature to 25 °C.
  • Soaking: Soaking was conducted after the end of liquid inlet. The soaking time started from the specimen being placed in the solution, with the soaking period being set to 10 h at a temperature of 25 °C.
  • Drainage: Immediately after soaking, the liquid was drained, and the solution was emptied within 30 min before proceeding to the air-drying stage. The drainage time was 12 min, which is slightly shorter than the liquid inlet time, and the temperature was 25 °C.
  • Air drying: The time from the solution drainage to the air drying of the samples was 1 h. The general air-drying time was set to 30 min, as in this experiment, at 25 °C.
  • Heating and drying: Immediately after air drying, the heating temperature was set to 40 °C, and the heating time was completed within 30 min.
  • Drying and insulation: After the temperature rose to 40 °C, the temperature was maintained at around 40 °C, and the samples were dried for 12 h.
  • Cooling: Immediately after the drying process, the specimens were cooled at a temperature of 20 °C for 1 h.
The total time of each dry–wet cycle was approximately 24 h, and then the next cycle would automatically proceed. After the set number of dry–wet cycles was completed, the system automatically terminated. At this time, the samples could be taken out for the next stage of testing.

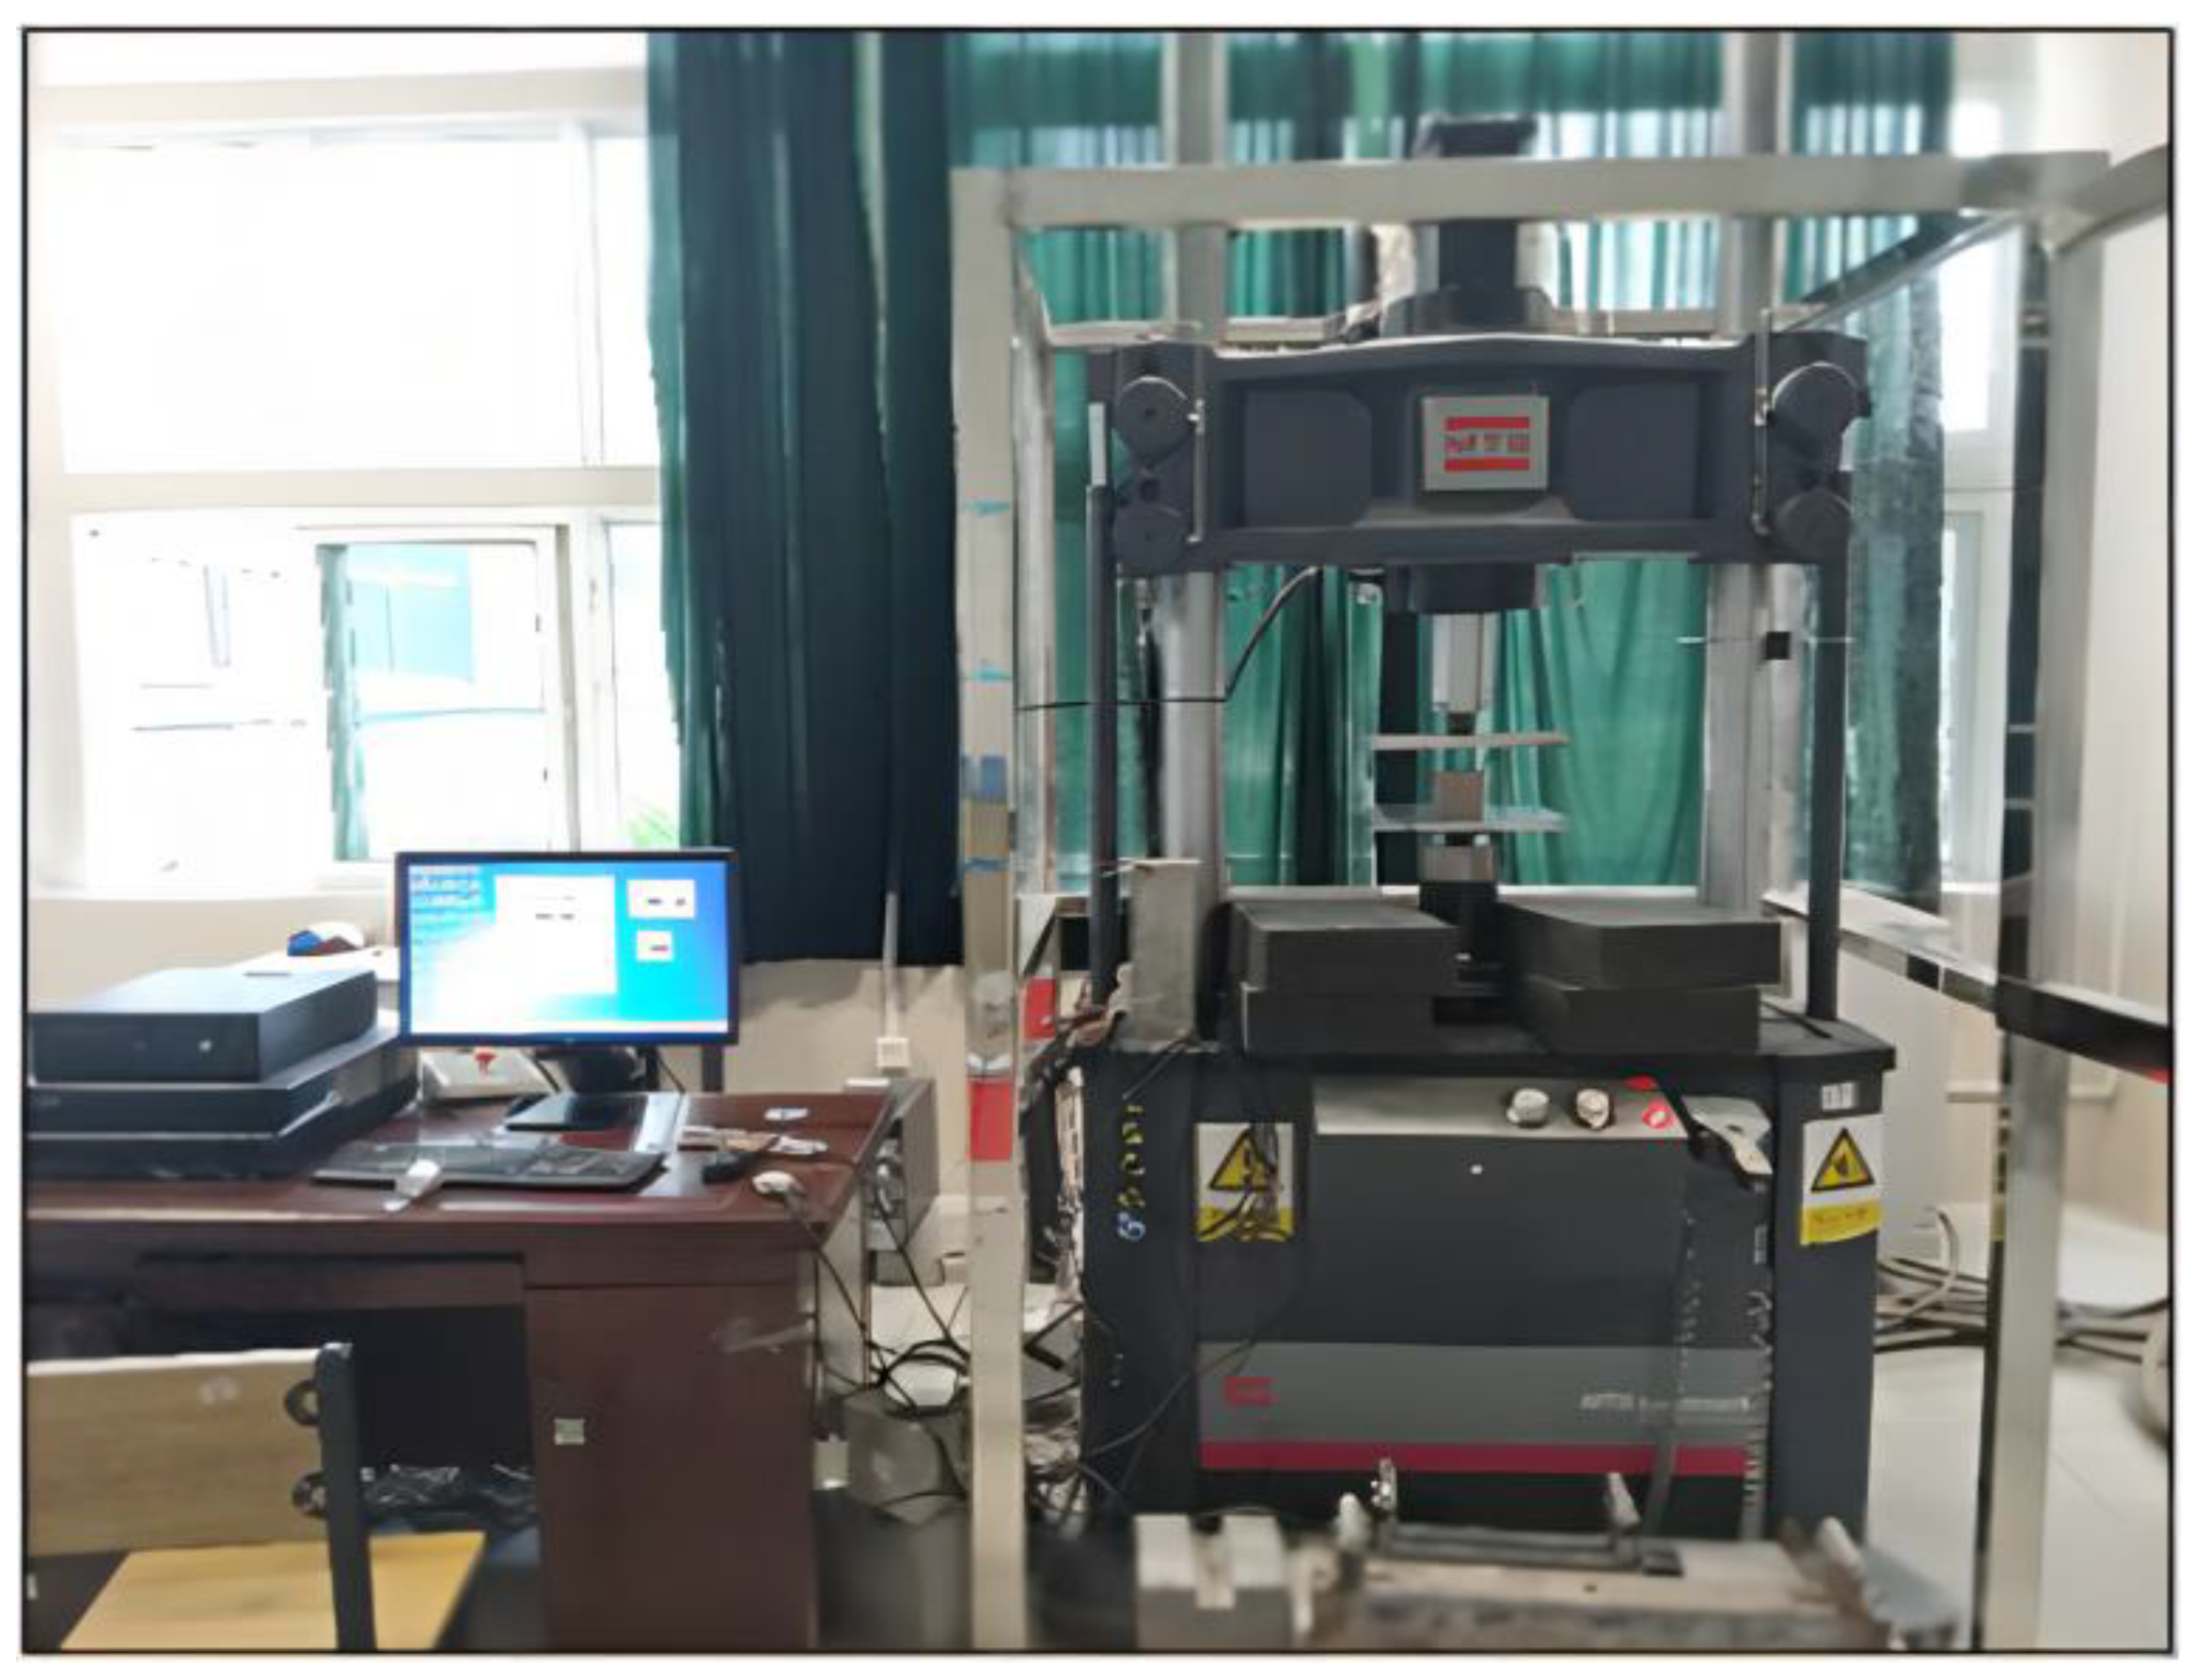
2.4.2. Unconfined Compression Test

The MTS Landmark 370.25 testing machine was utilized for this test, as shown in Figure 2.
The specific test steps are as follows:
  • The soil–cement specimens that have been cured from the water tank were taken out in the standard curing room, and the surface was wiped clean.
  • The specimen was immediately placed in the center of the test pressure table steel plate, and its geometric center was corrected.
  • Pressure at a uniform speed of 100 N/s up to 1000 N was applied and held for 60 s. We continued to apply the pressure at a uniform speed of 100 N/s until the specimen failed, and the test data were recorded.
  • After each test, the pressure table steel plate was cleaned to maintain its smooth and flat surface.
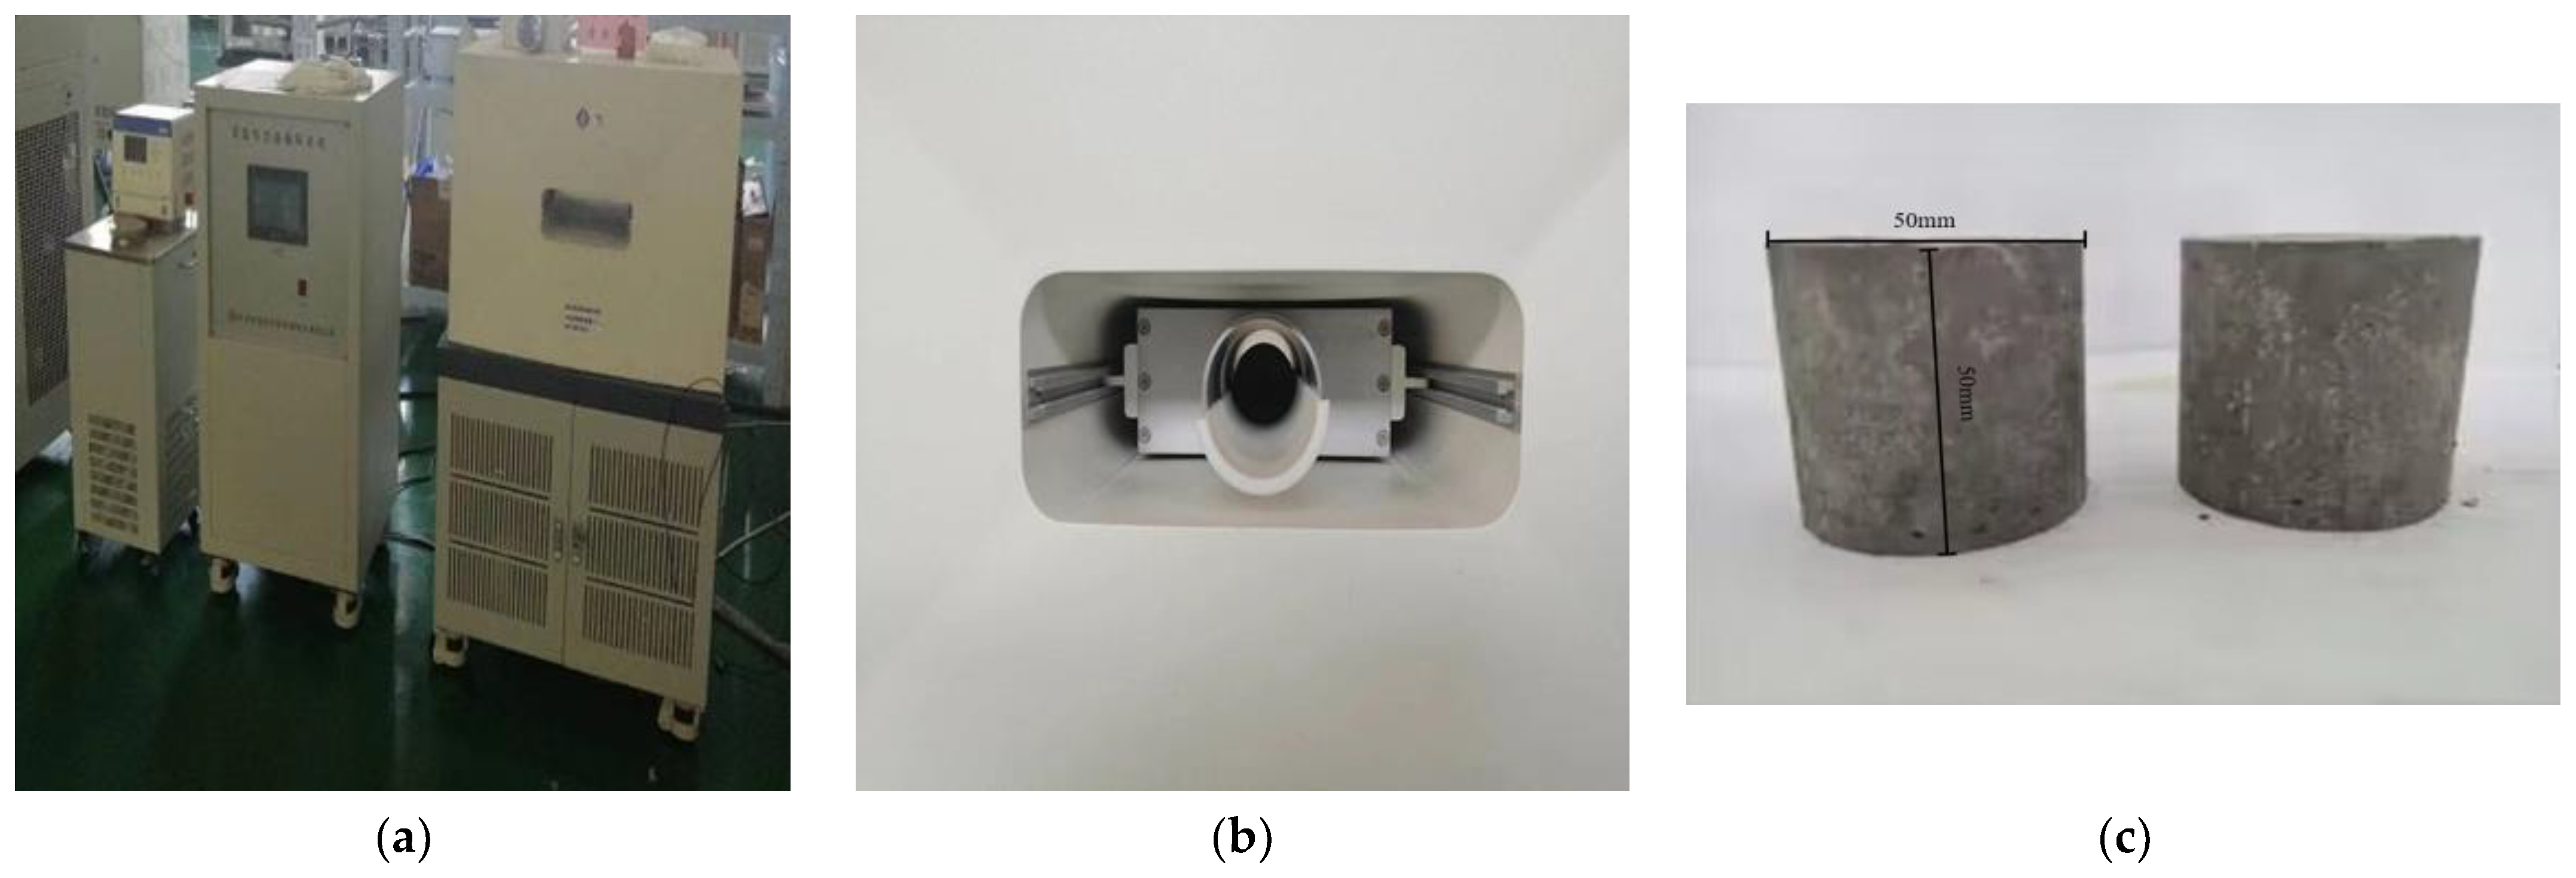
2.4.3. NWR Test

The MesoMR12-060H-I nuclear magnetic resonance analysis and imaging system, manufactured by Suzhou Newmai Analytical Instrument Co., Ltd, in China, was the device utilized. The NWR instrument was mainly composed of a permanent magnet, a sample tube, a radio frequency system, and a data acquisition and analysis system. The magnet strength was 0.55 T, and the effective test area of the sample tube was 60 mm in diameter and 100 mm in height. The equipment and samples are illustrated in Figure 3.
The specific test steps are as follows:
  • Firstly, all specimens were dried for 24 h. After the drying was completed, the signal amplitude test was performed on the dried specimens to obtain the baseline signal amplitude value of the dried specimens.
  • The specimens were subjected to negative pressure vacuum saturation treatment after drying. Since the strength of the soil–cement specimens of the silt material is small, saturation treatment is conducted under a negative pressure of −0.1 MPa for 24 h. After saturation, signal strength testing was performed to measure the signal amplitude value of the saturated specimen.
  • The difference between the saturated signal strength value of the test specimen and the baseline signal strength value of the specimen after drying was obtained, and then the T2 distribution curve and pore nuclear magnetic imaging were obtained through data inversion.

3. Experimental Results

3.1. Impacts of Dry–Wet Cycles on Physical Properties of Specimens

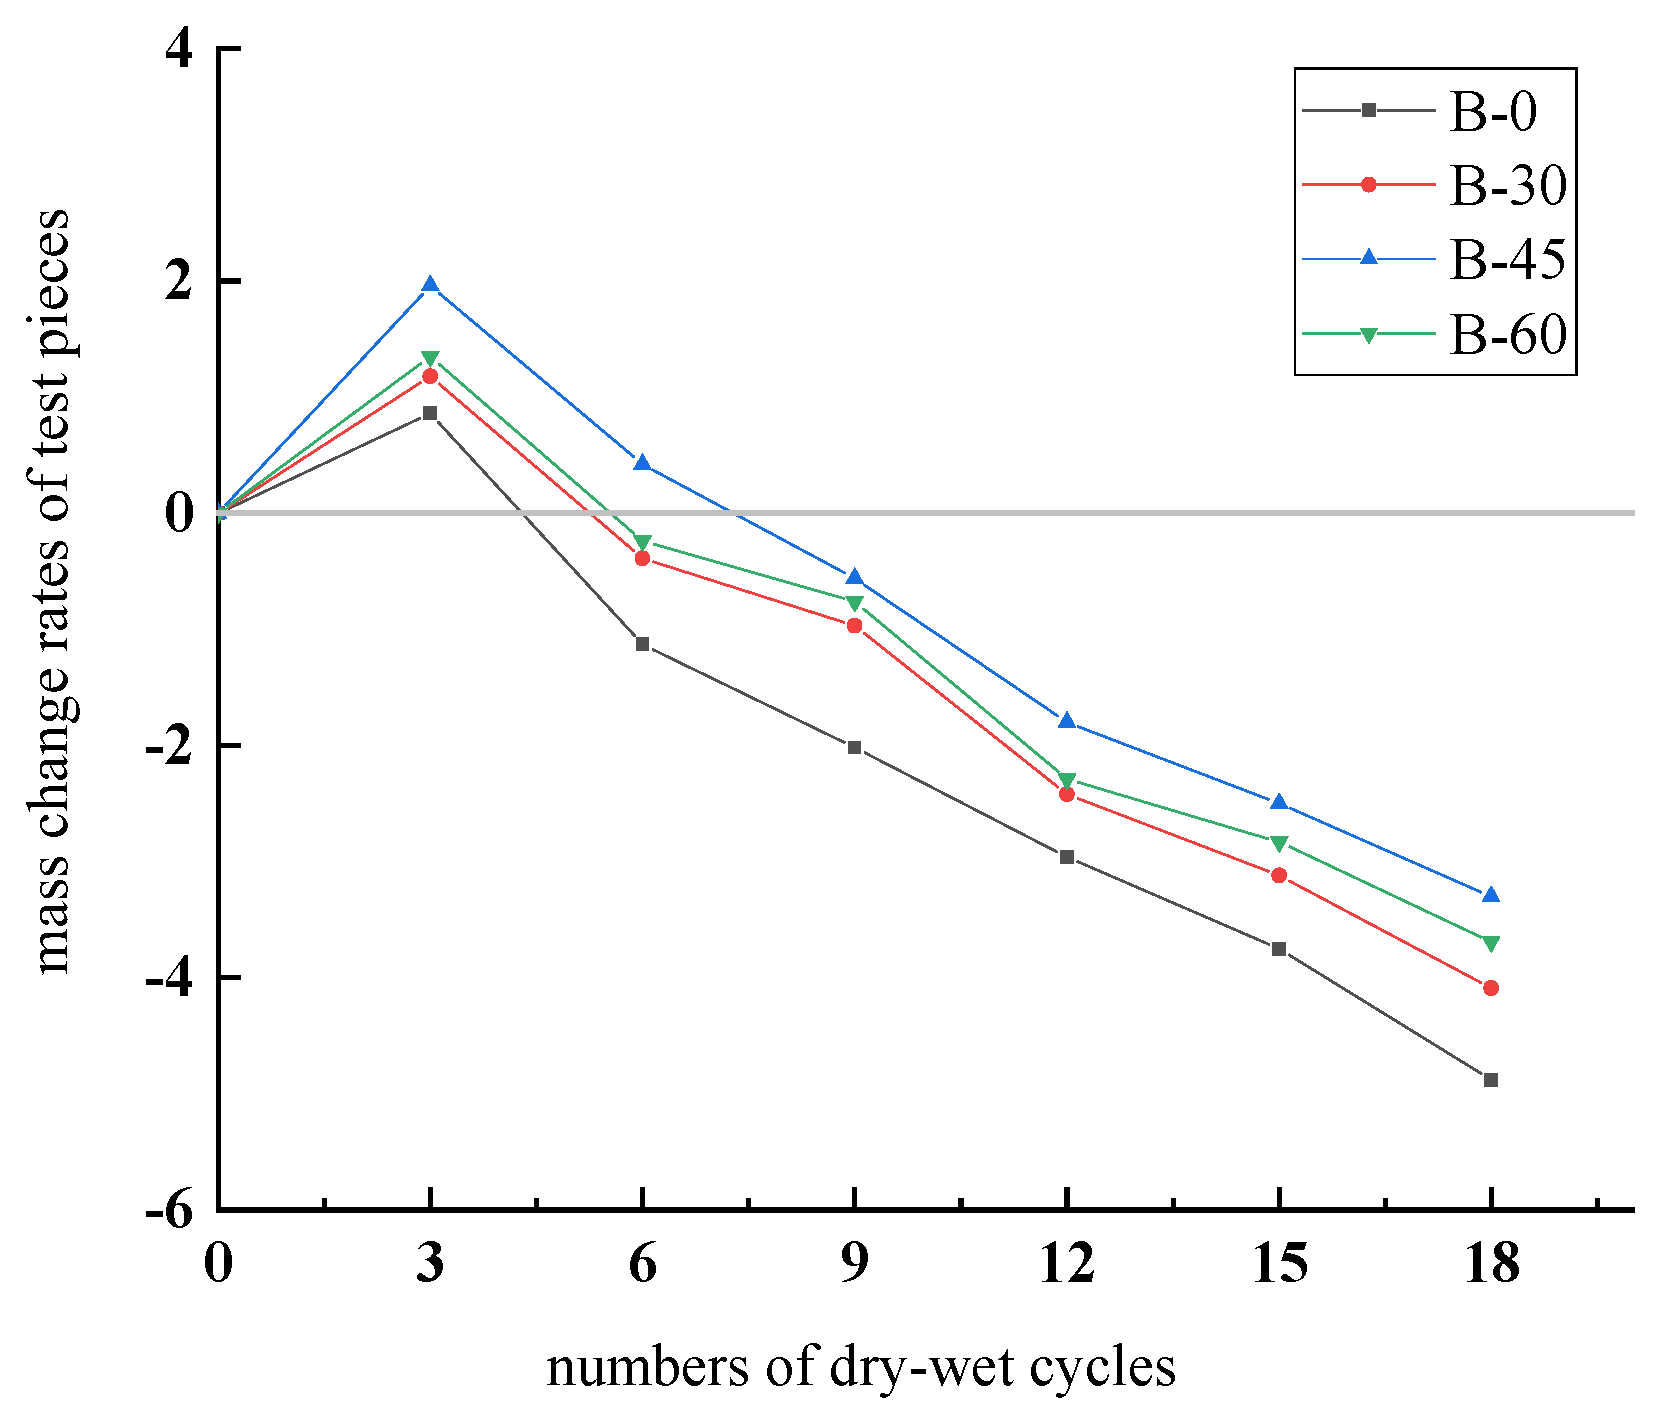
3.1.1. Mass Change Rate

The mass of specimens after the dry–wet cycle test is shown in Table 7, and the mass change rate, which is calculated from Equation (1), is shown in Table 8. Previous research [22] revealed that specimens are damaged by erosion when the mass loss rate of concrete specimens is greater than 5%. Accordingly, soil–cement specimens are deemed to be eroded in the event of |M| > 5%.
M = m a m a 0 m a 0
where ma refers to the mass of specimens after a wetting process, g, and ma0 refers to the mass of specimens after the curing duration, g.
Based on the experimental data displayed in Table 8, a diagram is produced to reveal mass change rates of soil–cement mixed with ferronickel slag powder under different numbers of dry−wet cycles, as shown in Figure 4.
As can be seen in Table 8 and Figure 4, the mass change rate of soil–cement firstly increases and then decreases as the number of dry–wet cycles increases. During the first three dry–wet cycles, the mass change rate of soil–cement increases. In this process, the minimum and maximum mass change rates are respectively observed from specimens B-0 and B-45. The mass change rate of B-60 is slightly smaller than that of B-45 but moderately greater than that of B-30. The reasons are as follows:
(1) The soil–cement specimens in the group of ferronickel slag were activated after a 28-day curing period and the control group had a hydration reaction rate higher than the baseline group. More C-S-H and C-A-H were produced; and (2) Cl and S O 4 2 in seawater reacted with C-S-H and C-A-H to produce Friedel’s salt, enabling the soil–cement’s mass to increase. Following the third dry–wet cycle, the mass change rates of specimens B-0, B-30, B-45, and B-60 all began to decline. To be specific, the mass change rate of B-45 remained above 0; comparatively, those of the remaining three groups were all below 0. As the dry–wet cycle tests proceed, the mass change rates of specimens become increasingly smaller, which means that their mass loss rates gradually increased.
Specimen surfaces were corroded, cracked, and peeled off under actions of repeated hygroexpansion, so C O 2 entered the soil–cement, which accelerated carbonization reactions. In this case, specimens were further degraded, and their masses gradually reduced. Moreover, the mass loss caused by surface spalling under actions of erosion was more dramatic than that produced by hydration reactions. The mass change rates of B-30, B-45, and B-60 all exceeded that of B-0; and the lowest mass loss rate was generated by B-45 for the following two reasons: (1) Specimen B-45 had the most intense hydration reaction that resulted in the most hydration products and (2) comparatively compact pore structures in B-45 weakened intrusion of corrosive ions and C O 2 into the soil–cement. It is therefore concluded that soil–cement mixed with ferronickel slag powder is superior to that mixed with cement only in their resistance to dry–wet cycles. Here, the optimal mixing rate of ferronickel slag powder is proved to be 45%.

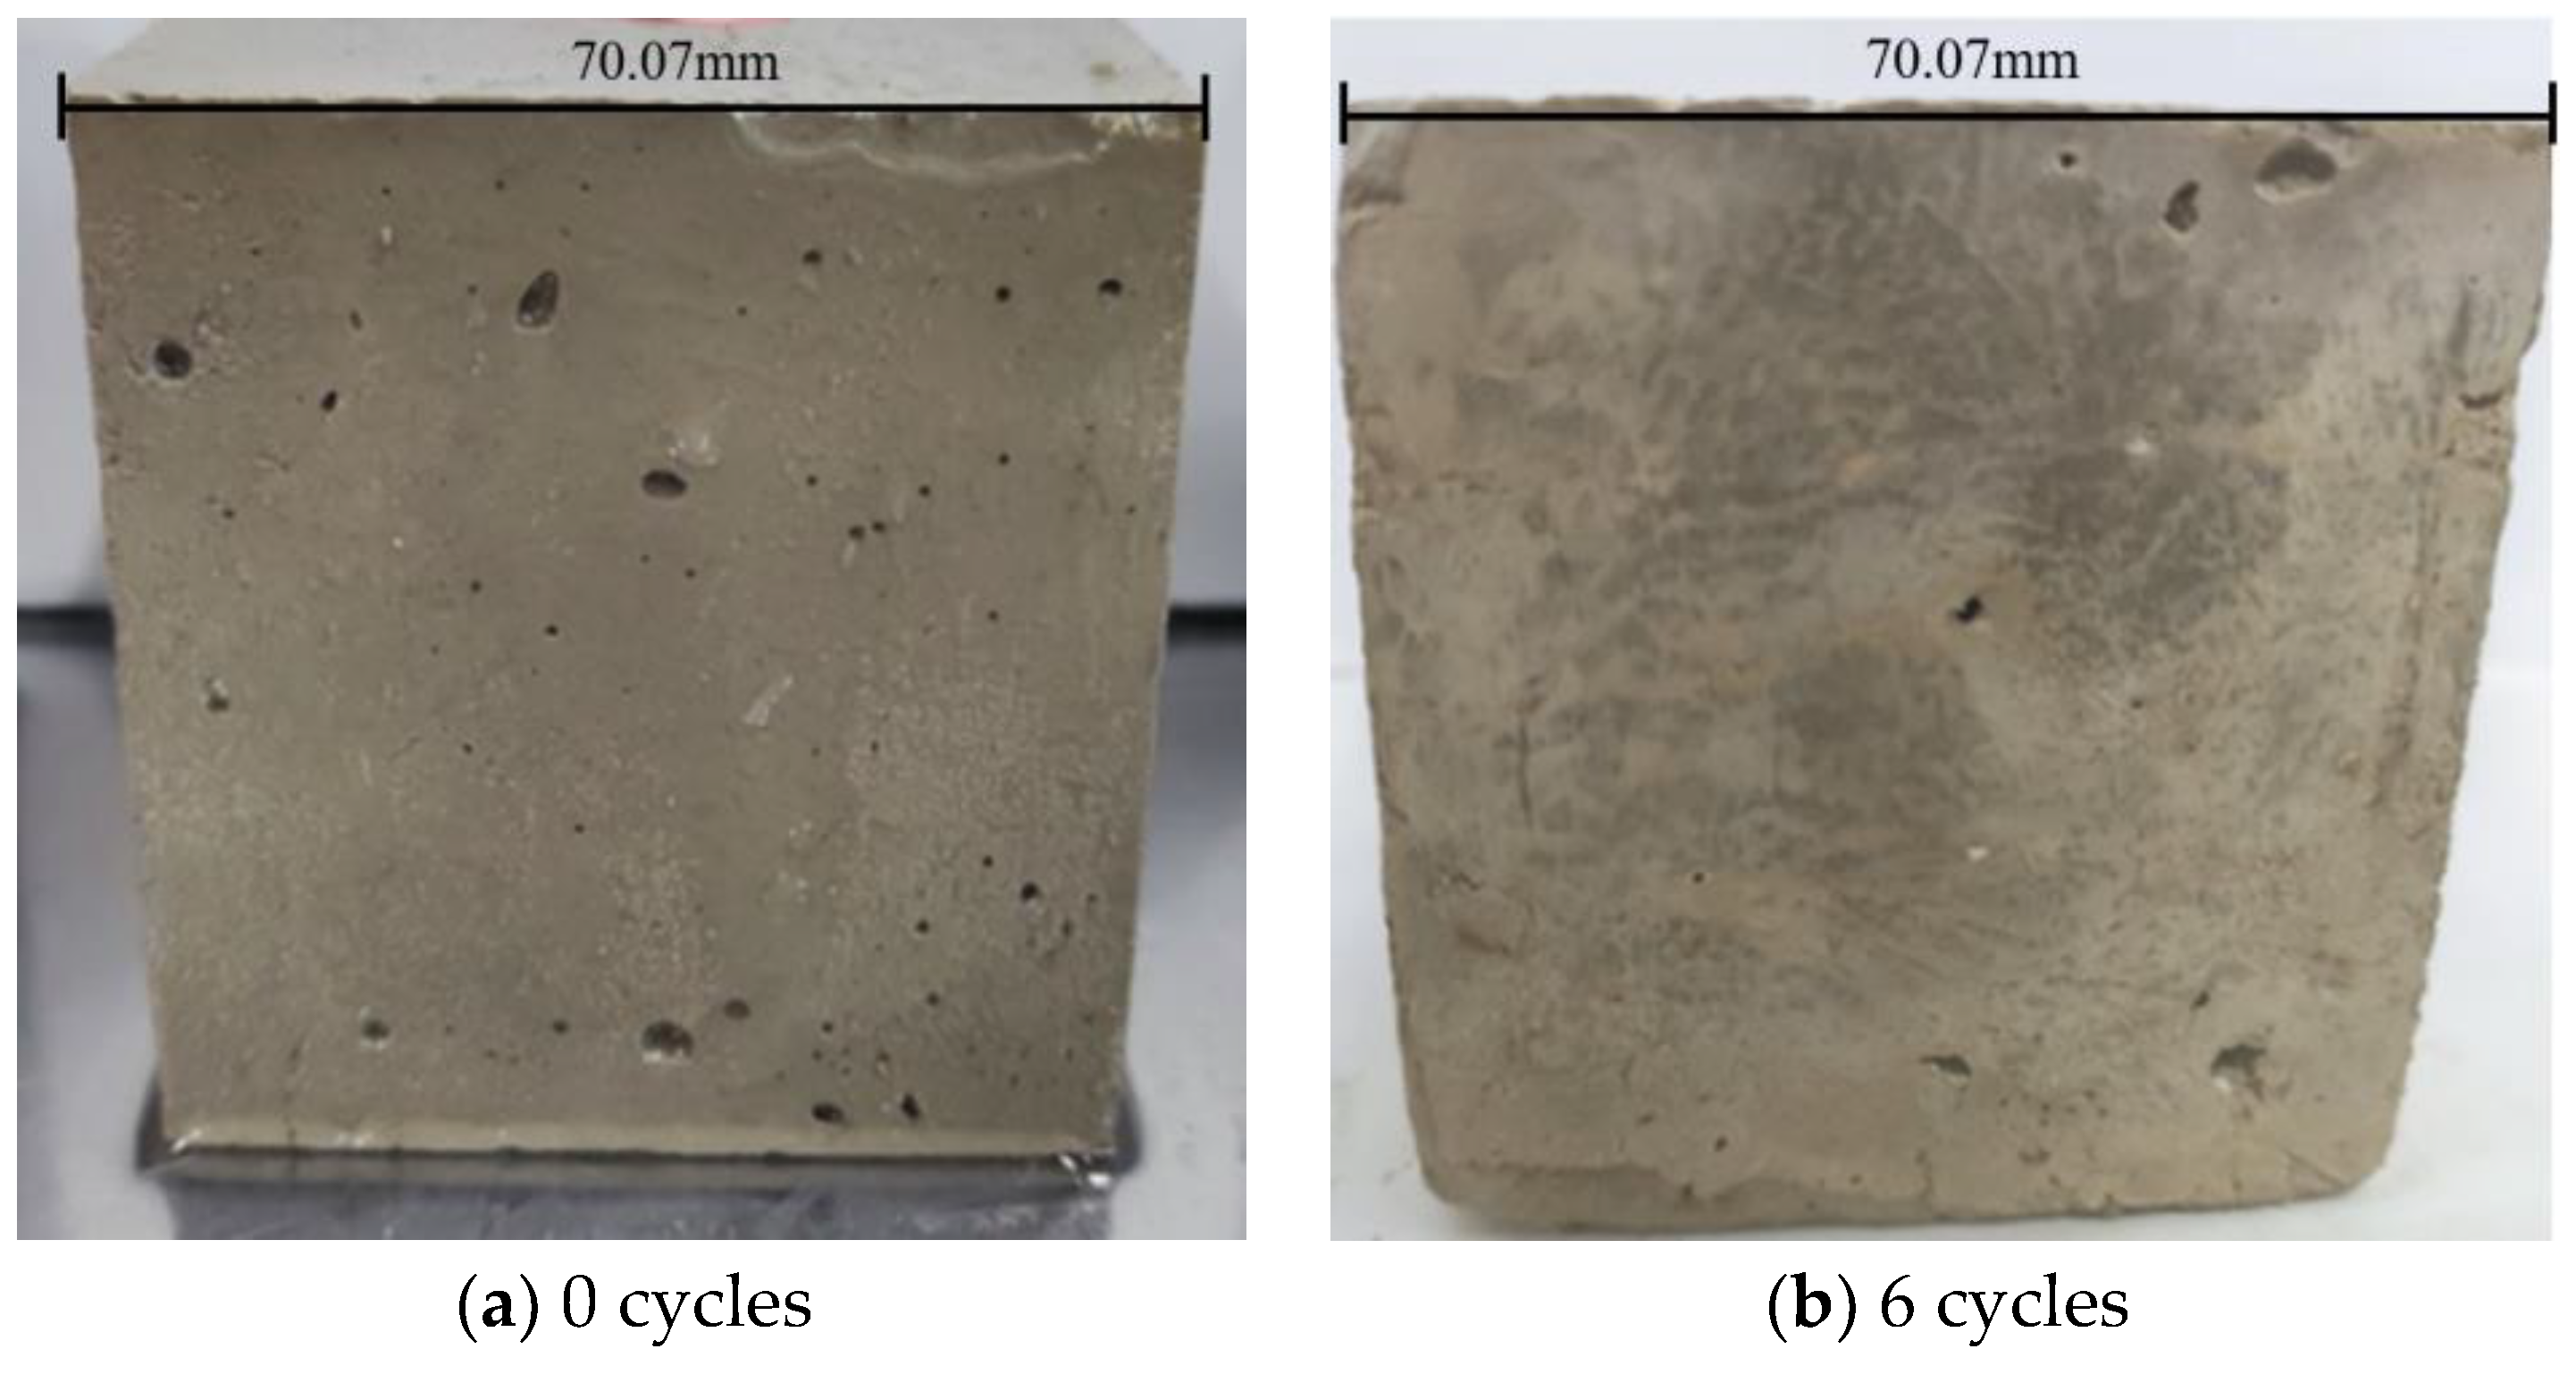
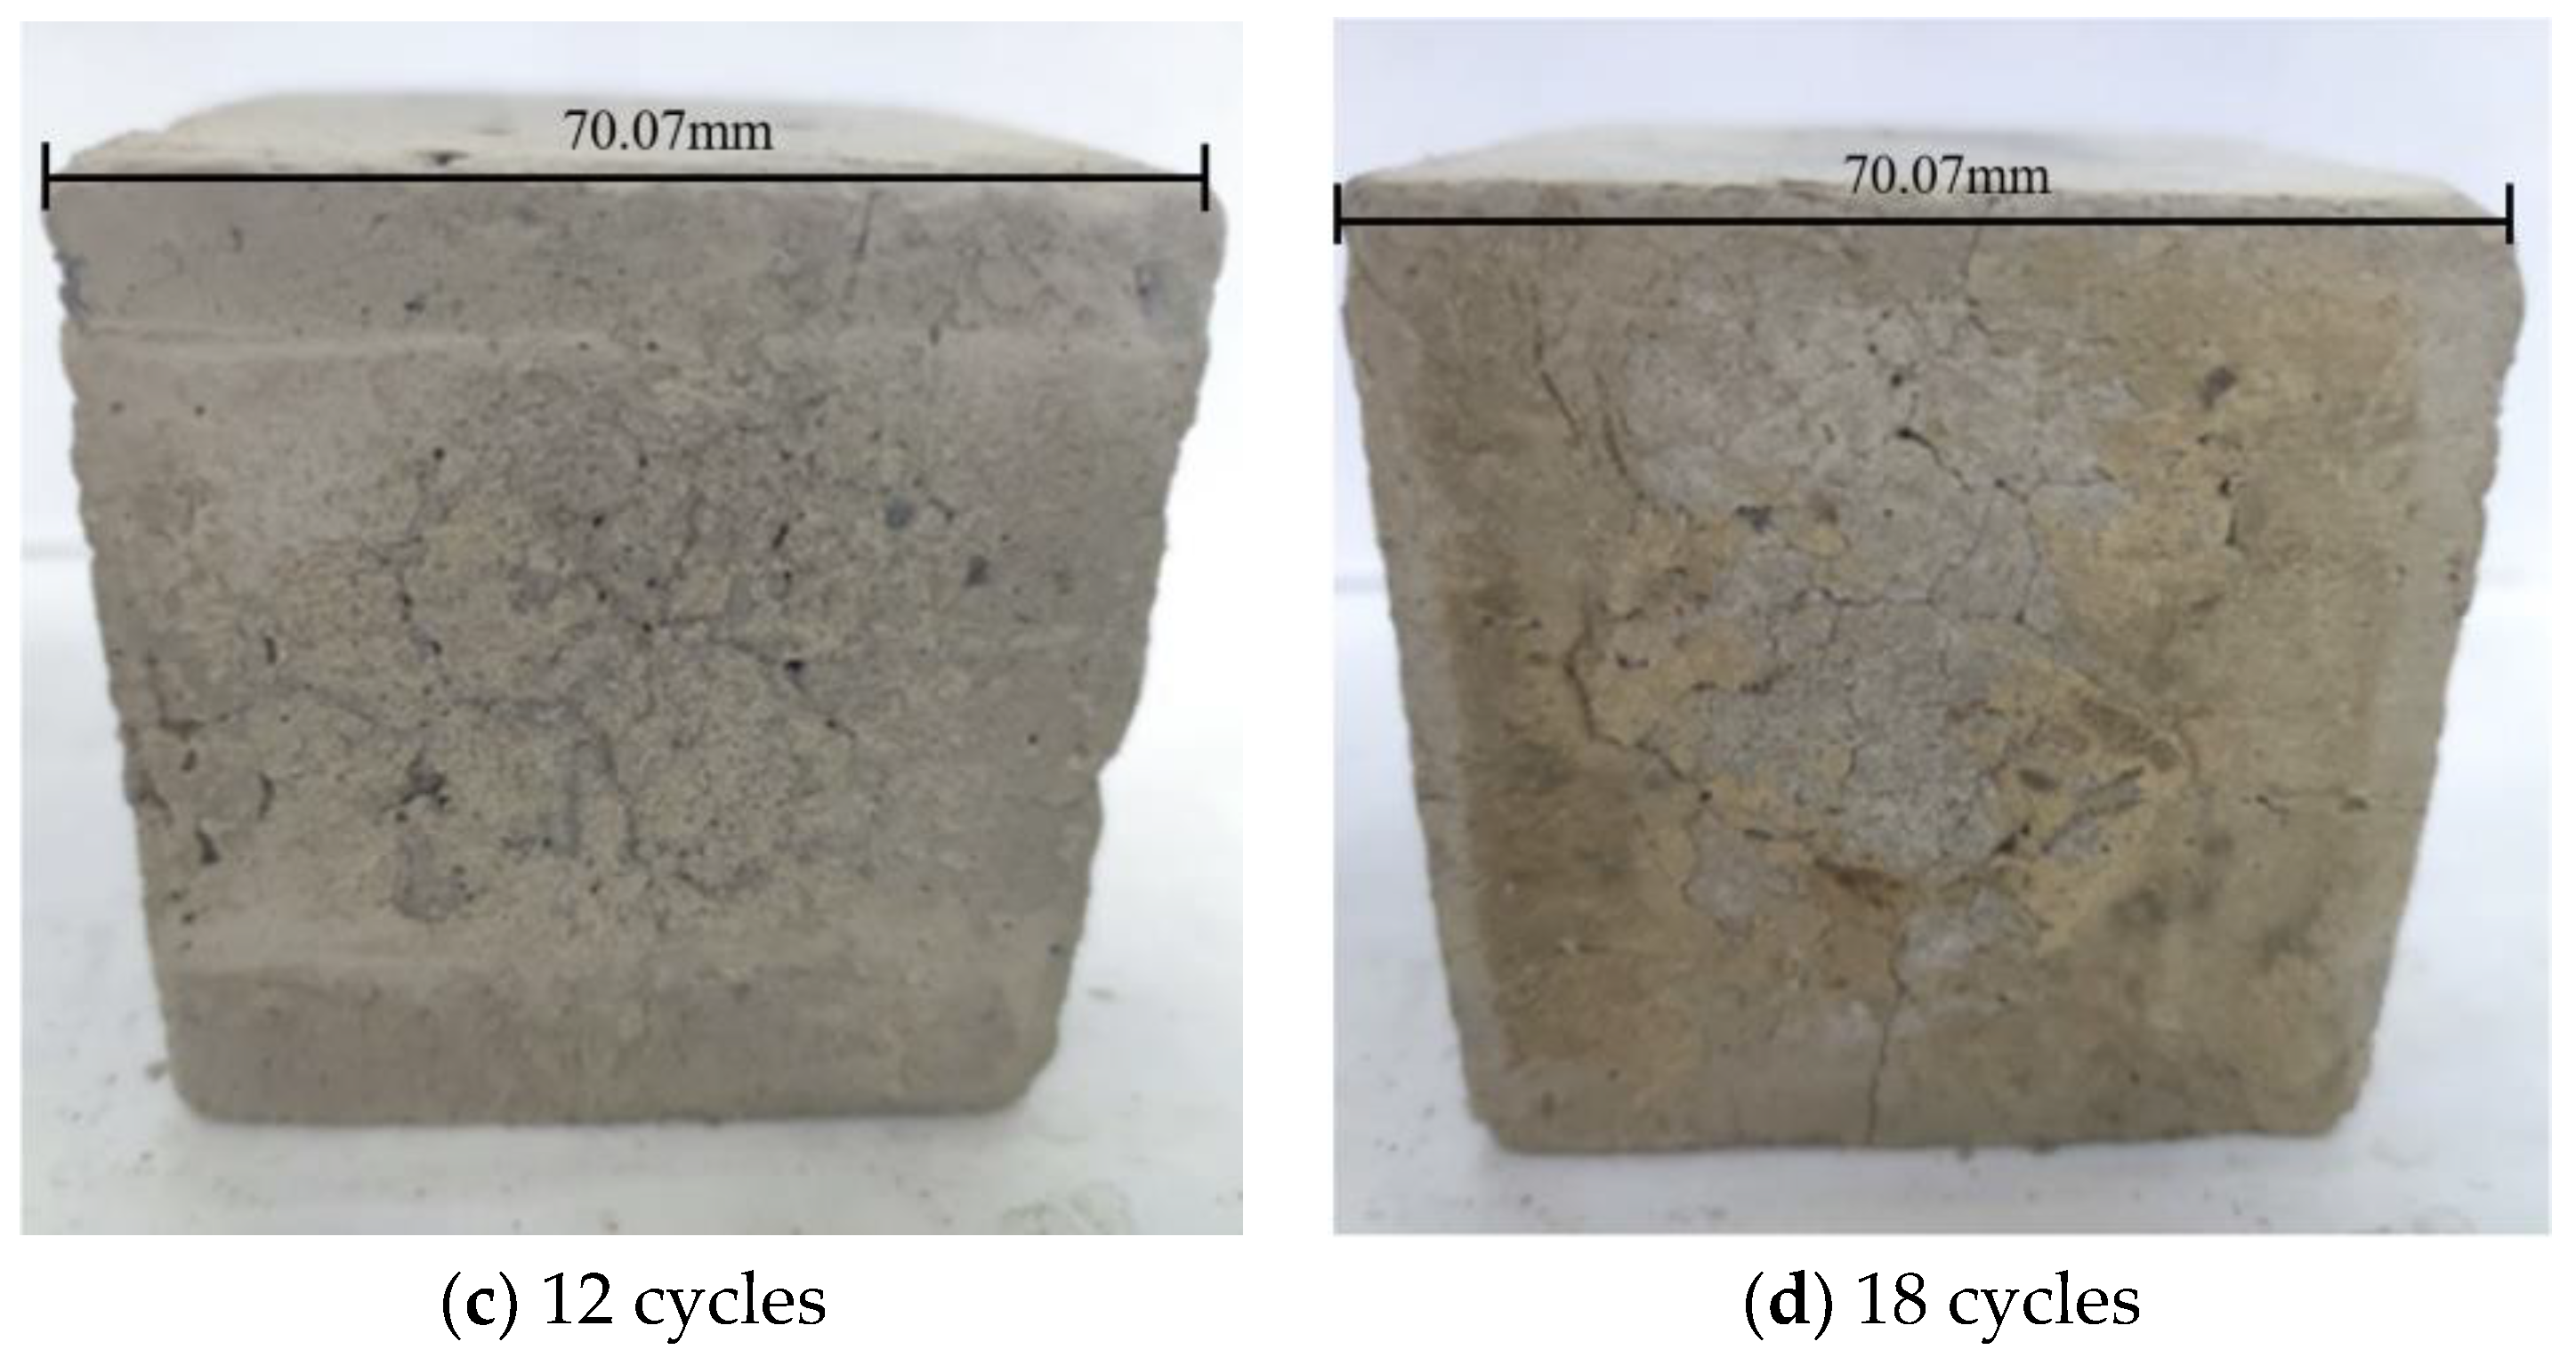
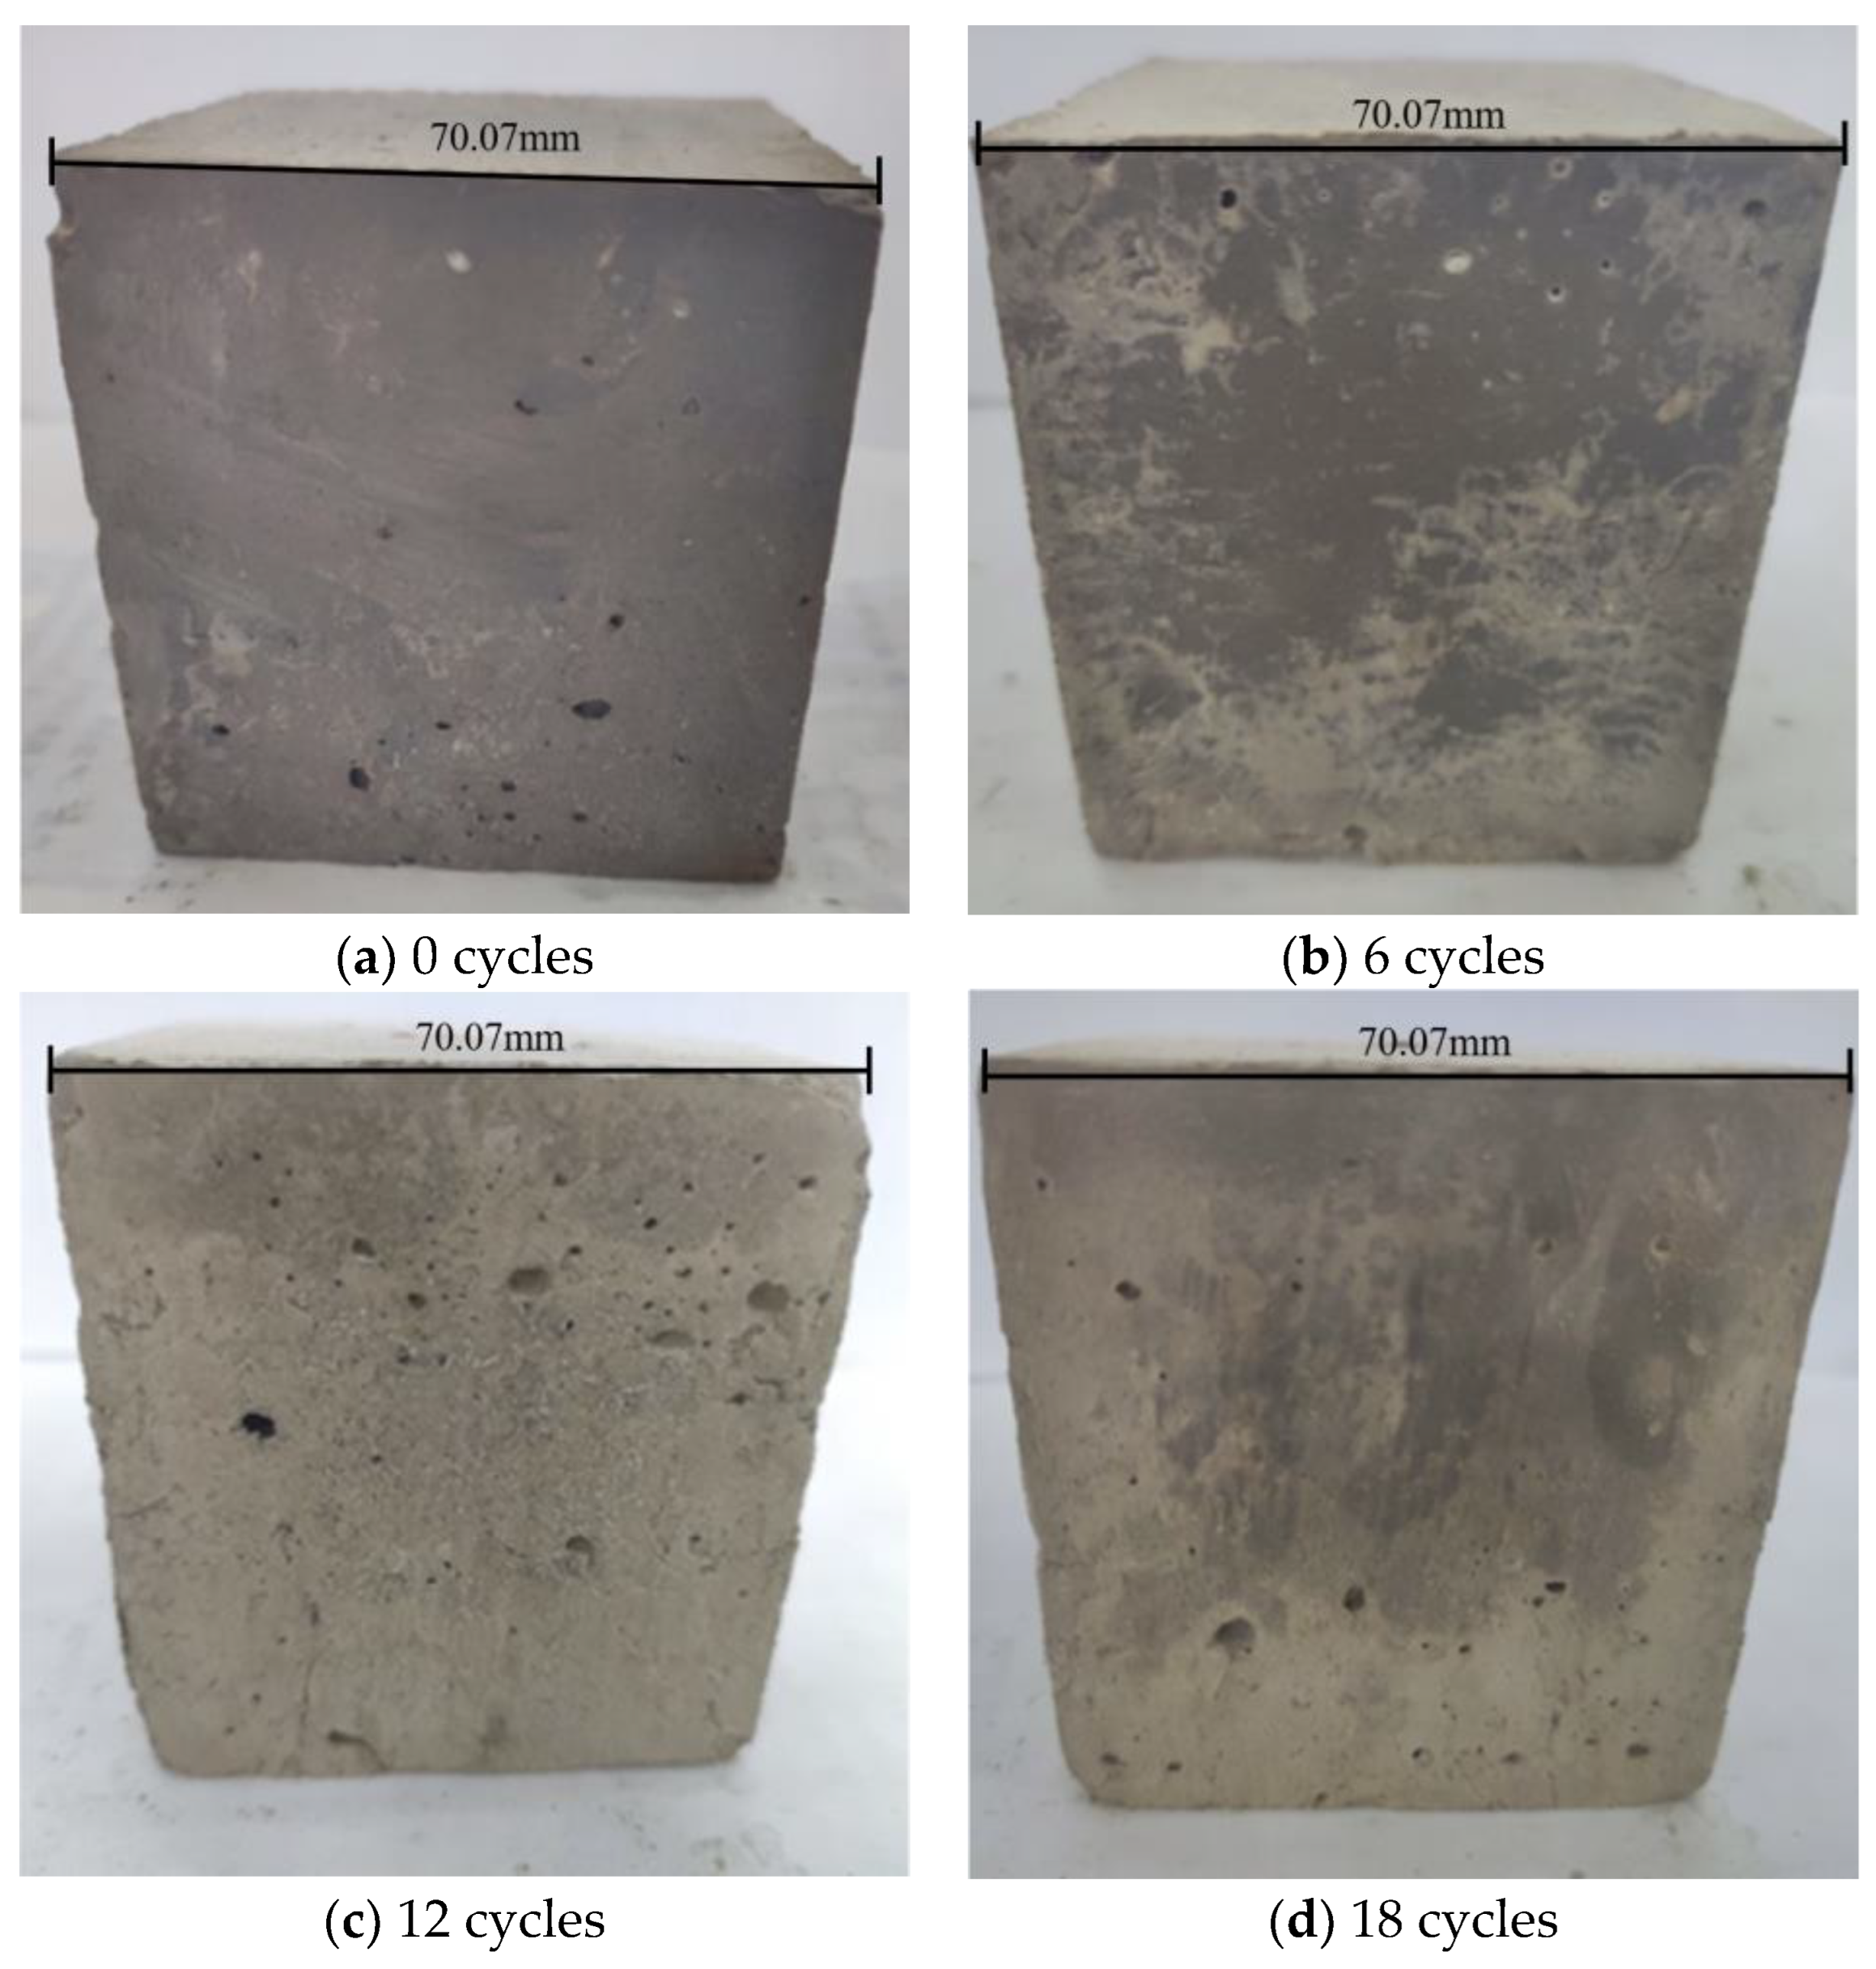
3.1.2. Apparent Erosion Characteristics

Under different numbers of dry–wet cycles, surfaces of soil–cement specimens mixed with ferronickel slag powder show different changes due to seawater erosion. Specimens in groups B-0 and B-45 were selected to undergo 0, 6, 12, and 18 dry–wet cycle(s), and their apparent erosion characteristics were further analyzed, as presented in Figure 5 and Figure 6.
As observed from Figure 5 and Figure 6, apparent erosion of soil–cement became increasingly serious after the sixth dry–wet cycle. In the early periods of dry–wet cycles, soil–cement surfaces may remain comparatively compact and level. However, their carbonization degrees were dramatically elevated in later periods, which was embodied in the absence of edges and corners as well as the emergence of sags and crests, spalling, cracking, and passivation on these surfaces. Under the actions of the same number of dry–wet cycles, the surfaces of specimens of B-45 were more level and compact than those of B-0. After the 18th cycle, only sags and crests were observed on the surfaces of B-45 specimens. No cracking or spalling as in B-0 were found. This is because when the curing of soil–cement mixed with ferronickel slag powder lasted for a period of 28 days, ferronickel slag powder not only served as micro-aggregate to fill in interior pores of soil–cement but also exerted an effect similar to pozzolanic reactions to produce more hydration products, which can wrap soil particles and turn them into an integral whole by means of hardening. In this way, the compactness and strength of soil–cement can be both improved, so the soil–cement was more capable of resisting carbonization and seawater erosion. Therefore, mixing soil–cement with ferronickel slag powder makes its resistance to dry–wet cycles stronger.

3.2. Impacts of Dry–Wet Cycles on Mechanical Properties of Specimens

3.2.1. Unconfined Compressive Strength

The unconfined compressive strength of soil–cement specimens mixed with ferronickel slag powder at 28 d of curing under different numbers of dry–wet cycles is shown in Figure 7. According to this figure, specimens B-45 and B-0 generated the highest and the lowest unconfined compressive strength respectively under the same number of dry–wet cycles. After the ninth cycle, the unconfined compressive strengths of groups B-0 and B-30 began to decline; in contrast, decreases in the unconfined compressive strength started after the 12th cycle in groups B-45 and B-60. This is because the potential activity of ferronickel slag powder in soil–cement was enabled at 28 d of the curing and began to apply an action similar to the pozzolanic effect. In this event, more hydration products can be produced, making soil particles cemented into an integral whole and their ability to resist erosion induced by dry–wet cycles boosted. As for B-45 and B-60, their unconfined compressive strength began to drop after more dry–wet cycles. Moreover, the compressive strength of B-60 was weaker than that of B-45 because a smaller amount of CH can be produced by the hydration reactions of soil–cement since equivalent substitution by ferronickel slag powder reached a certain limit and thus only partial ferronickel slag powder can be activated. As for the remaining ferronickel slag powder that cannot be activated, they only exerted a micro-aggregate effect instead of activity effects.

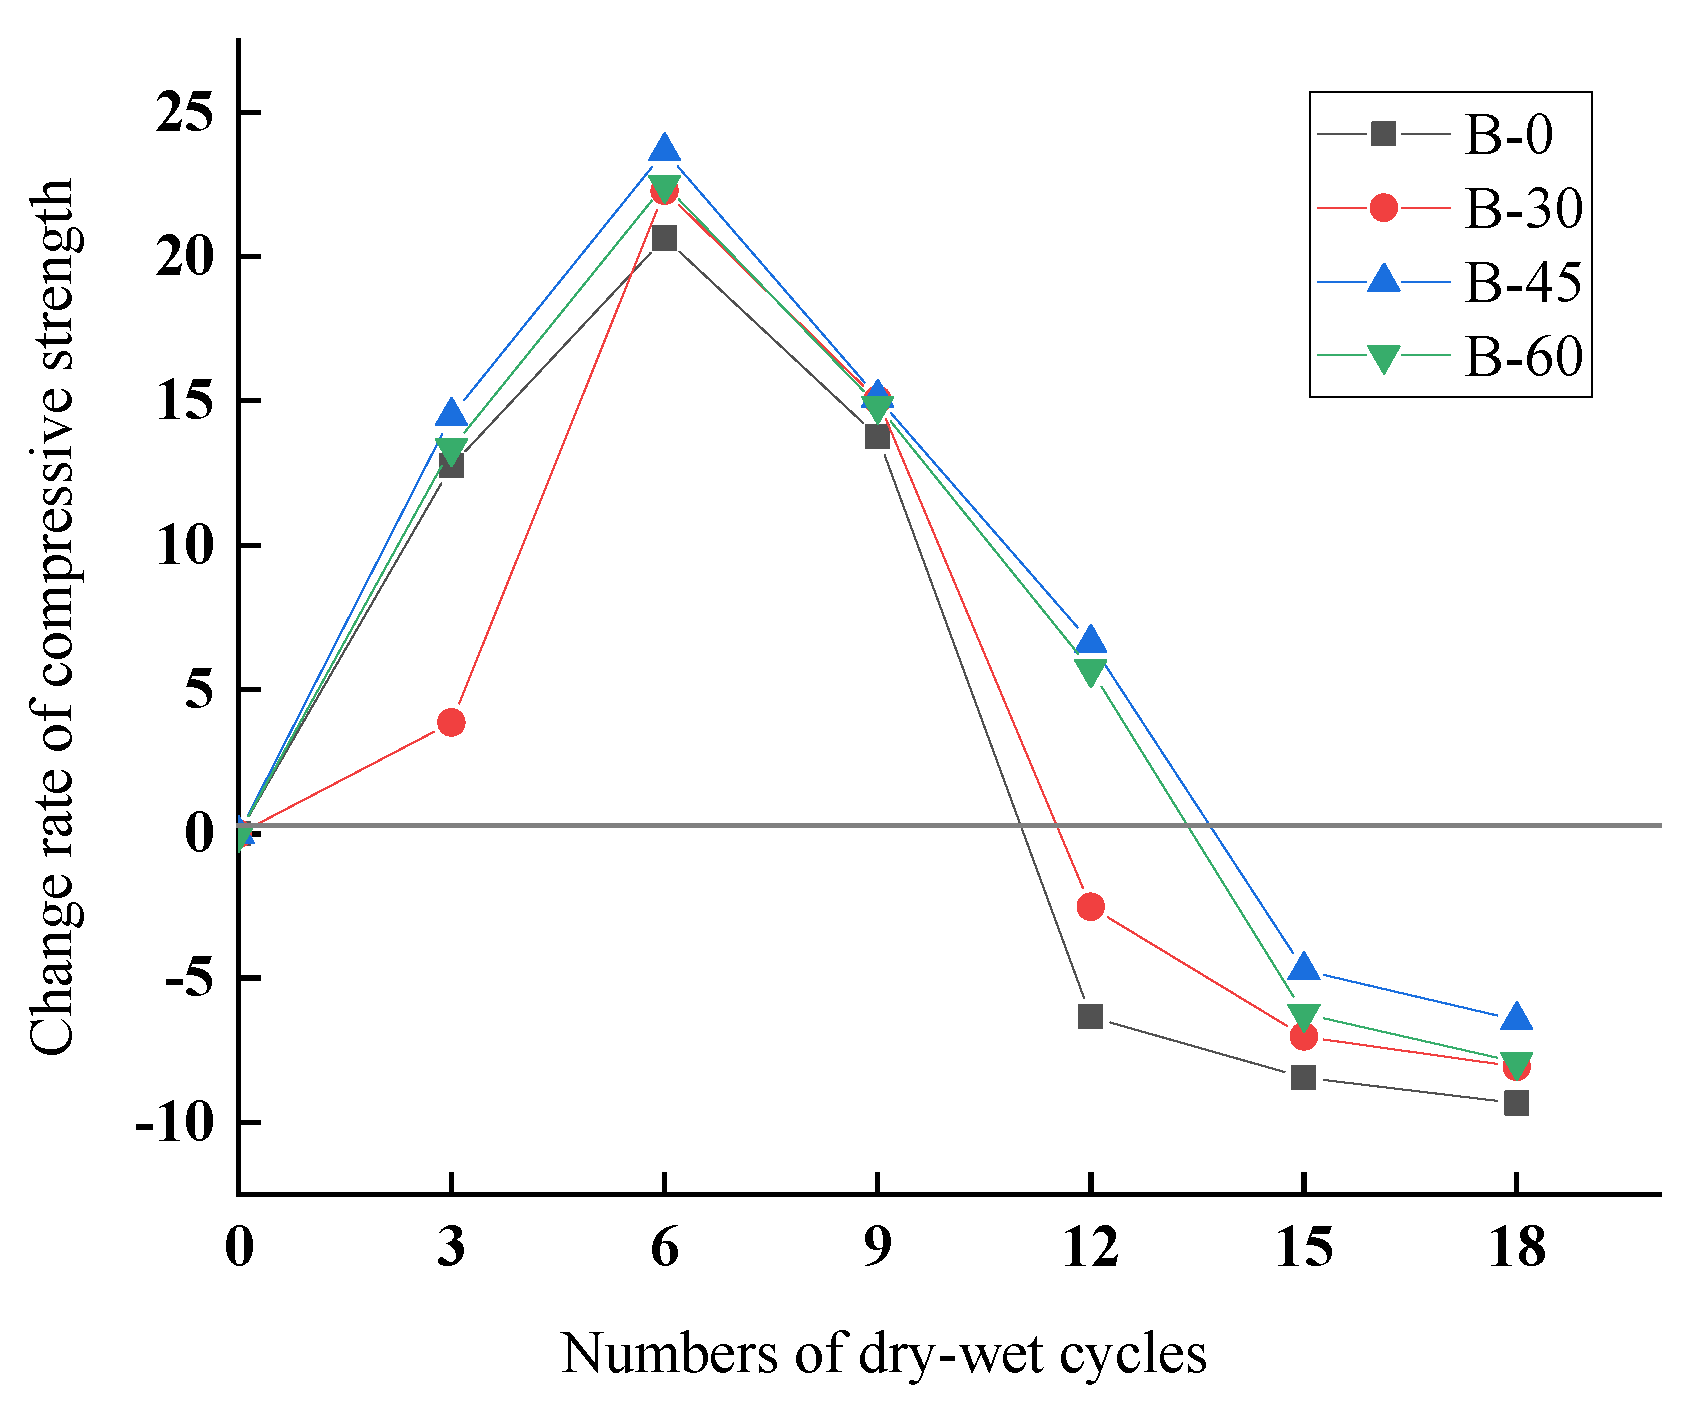
3.2.2. Compressive Strength Change Rates

The unconfined compressive strength of specimens experiencing 3, 6, 9, 12, 15, and 18 dry–wet cycles of seawater was compared with that under 0, 3, 6, 9, 12, and 15 cycles. In this way, compressive strength change rates denoted by σ r can be obtained for specimens with the number of dry–wet cycles increased, as calculated from Equation (2) below.
σ r = σ n + 3 σ n σ n
where σ r represents the strength change rate; σ n + 3   a n d   σ n denote the unconfined compressive strength of specimens; and N signifies the number of dry–wet cycles (n = 0, 3, 6, 9, 12, or 15).
Comparison results are shown in Figure 8. As the number of dry–wet cycles increased, the overall variation tendency of the soil–cement’s strength change rate remained basically consistent with that of its compressive strength. More specifically, the strength change rate of soil–cement first increased and then decreased, and in later periods of dry–wet cycles, the strength change rate decreased less drastically and eventually became negative. Strength change rates of B-0 and B-30 specimens were below 0 in the 15th cycle. In the whole process of dry–wet cycle testing, B-45 had the maximum strength change rate, and this rate was slightly higher than that of B-45 because the hydration reactions of cementing materials were comparatively active in early periods of the dry–wet cycle testing, thus producing more hydration products, forming stronger skeleton structures, and eventually improving the overall strength. In comparison to soil–cement with no ferronickel slag powder mixed, soil–cement mixed with a large amount of ferronickel slag powder had a greater strength change rate because the activity of ferronickel slag powder began to apply a more obvious effect after 28 days of curing, so more hydration products were obtained, and they filled in pores inside the soil–cement mixed with ferronickel slag powder. For this reason, the strength of soil–cement mixed with ferronickel slag powder can be elevated substantially.

3.3. NMR Test Analyses

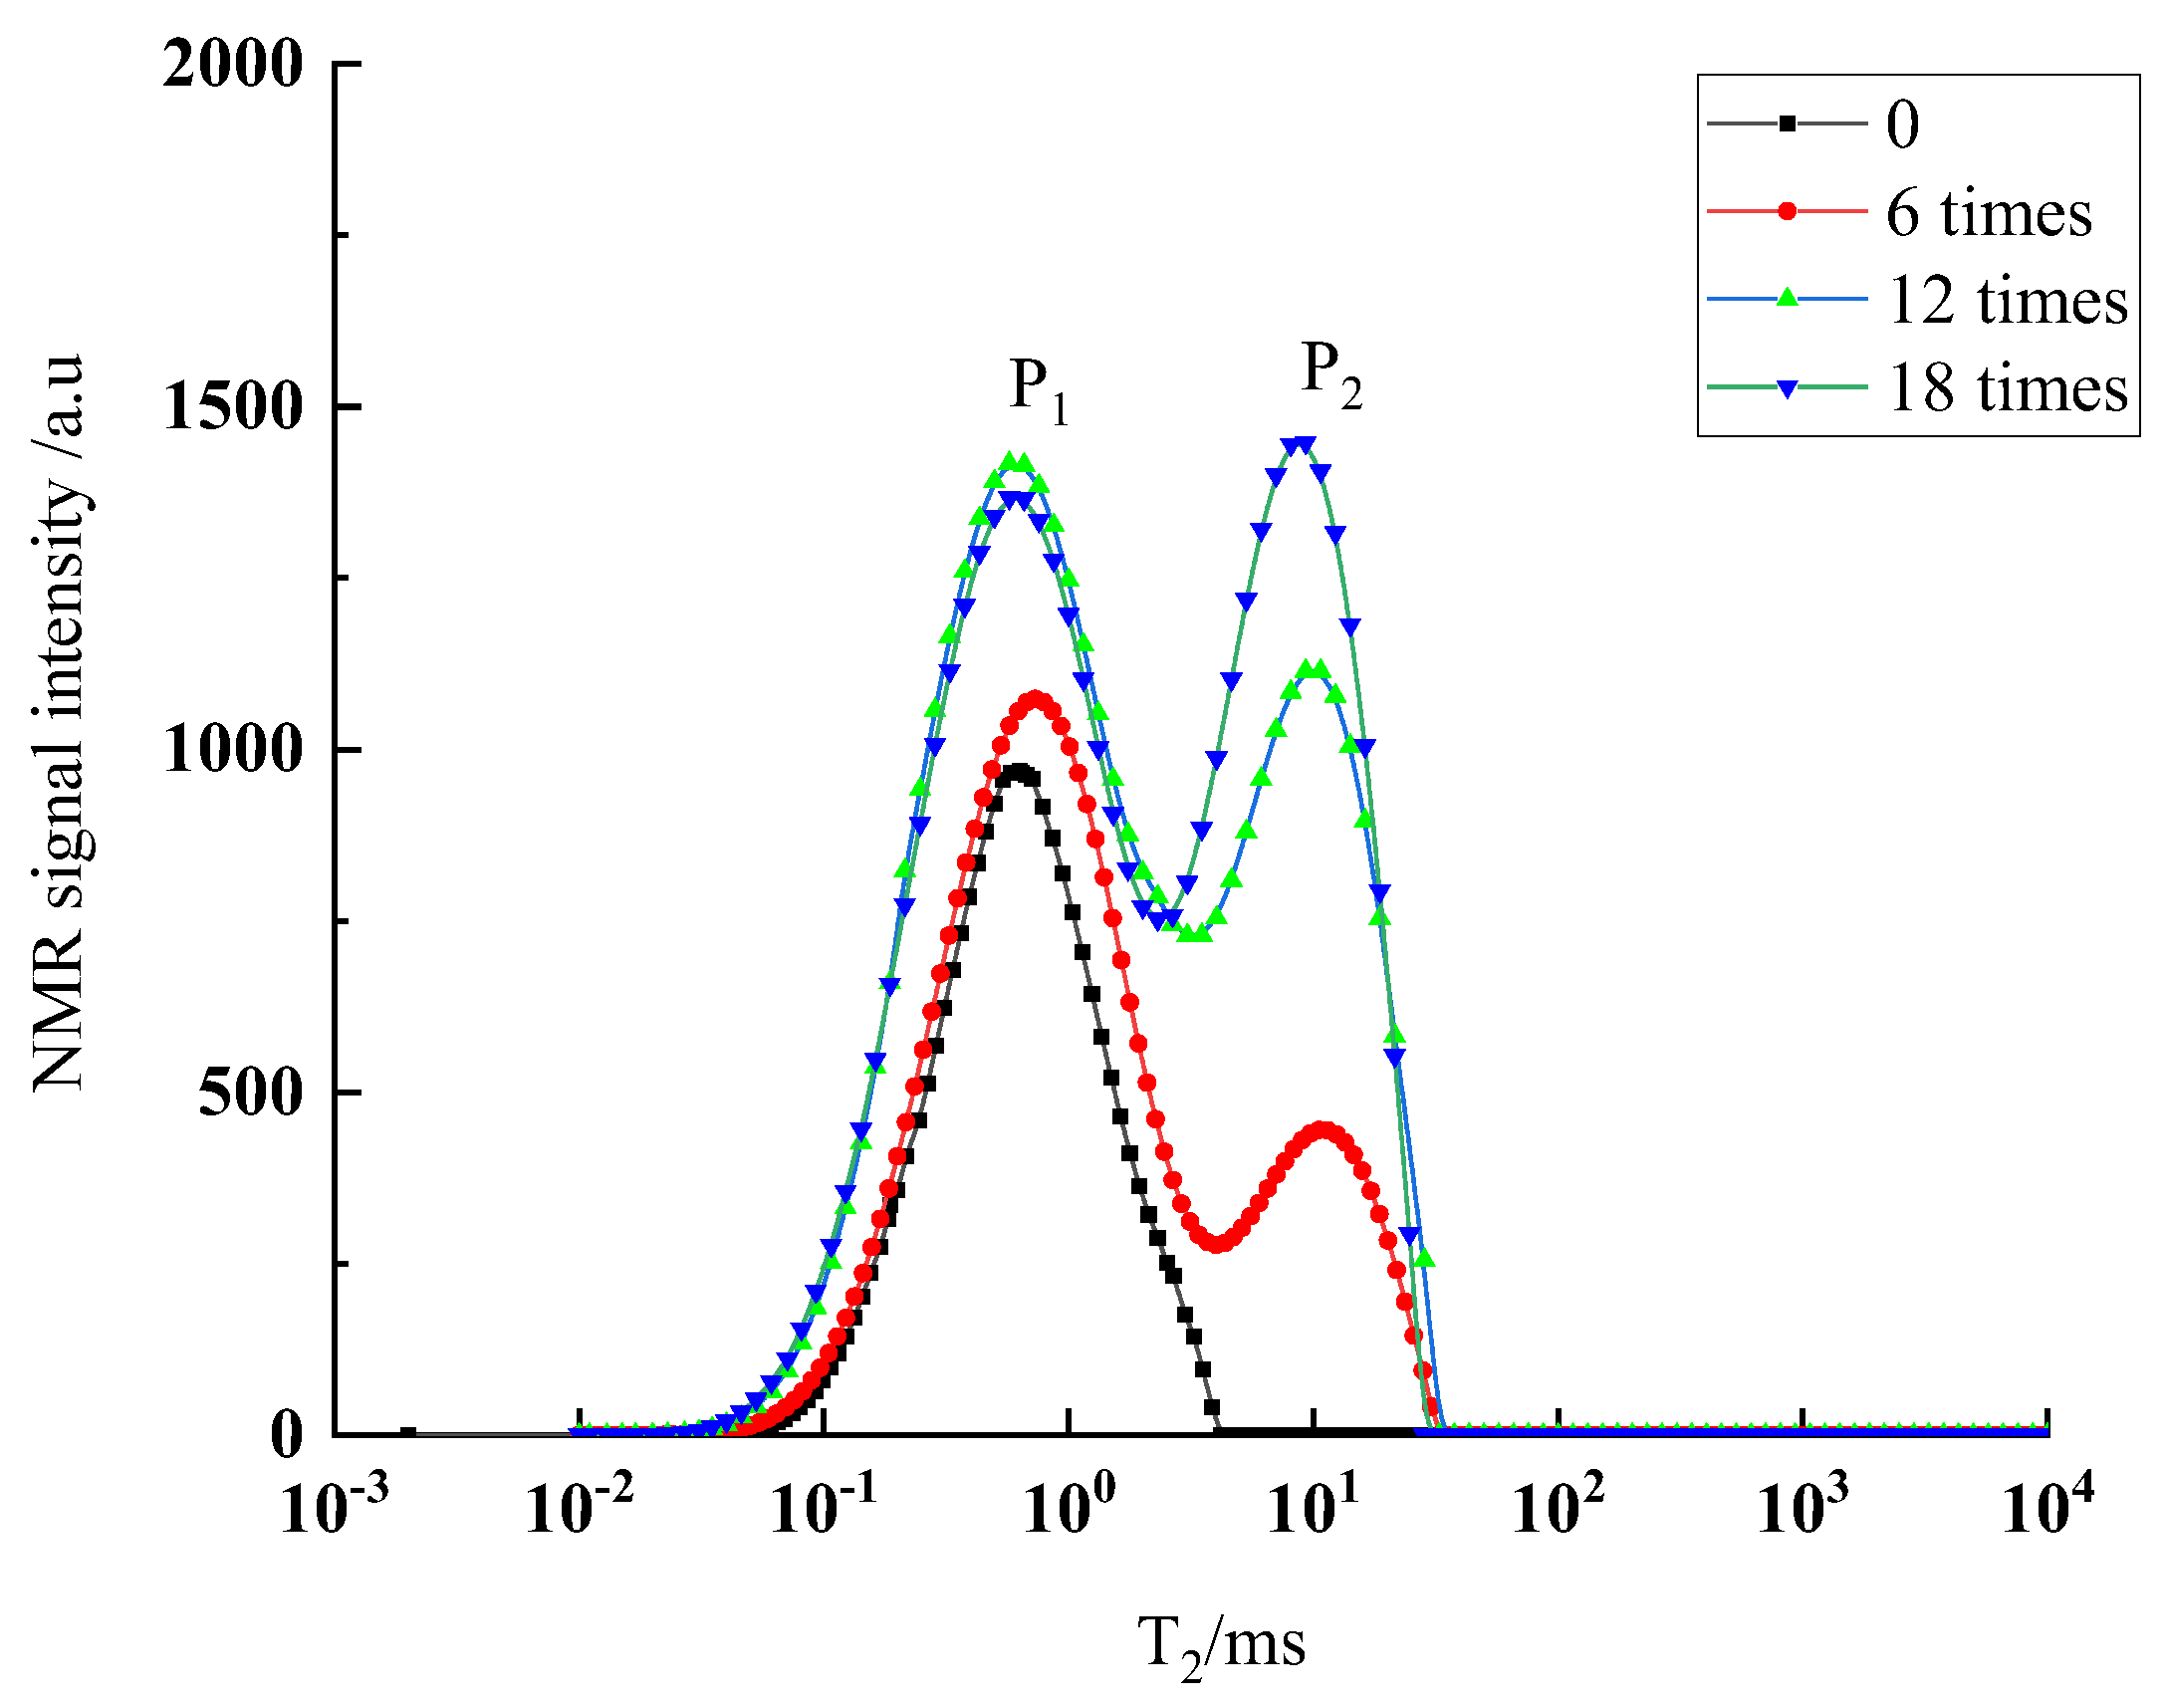
3.3.1. Analyses of Distribution Characteristics of T2 Curves

T2 curves are plotted in Figure 9 for soil–cement specimens that contain ferronickel slag powder with a mixing ratio of 45% and having experienced 0, 6, 12, and 18 dry–wet cycles, respectively. As the number of dry–wet cycles increases, those curves in a unimodal type are transformed into bimodal patterns on one hand, and on the other hand, the integral areas of peaks P1 and P2 are constantly expanded. In particular, the integral area of P2 shows a rather large variation range, and T2 values at the vertex of P1 and P2 lie in ranges of 0.63–0.86 ms and 9.87–10.12 ms, respectively. Clearly, the T2 value at the vertex of P2 is far greater than that of P1. This manifests as an increase in the number of dry–wet cycles being accompanied by increasing pores and the production of more macrovoids. Such variations can be more obvious in the integral area of peak P2, as shown in Figure 9.
As hydration reactions are dominated in the early periods of the dry–wet cycle testing, Friedel’s salt and AFt are produced in pores to fill in them. With an increase in the number of dry–wet cycles, the excessive Friedel’s salt and AFt produced crystallize and swell in those pores, so swelling stress and pore ruptures occur, micro-cracks are developed, and the number of pores goes up. CO2 in the air penetrates the soil–cement via these micro-cracks, which may further accelerate carbonization. In addition, seawater flows into these micro-cracks and thus dissolves soil particles that are not cemented. Under actions of repeated hygroexpansion, micro-cracks described above are constantly developed and connected and also subjected to unceasing holing. On this basis, it can be summarized that the number of pores inside the soil–cement continuously increases, and the pore diameter keeps enlarging when the number of dry–wet cycles rises. As a consequence, soil–cement becomes less compact, which further brings its strength down.

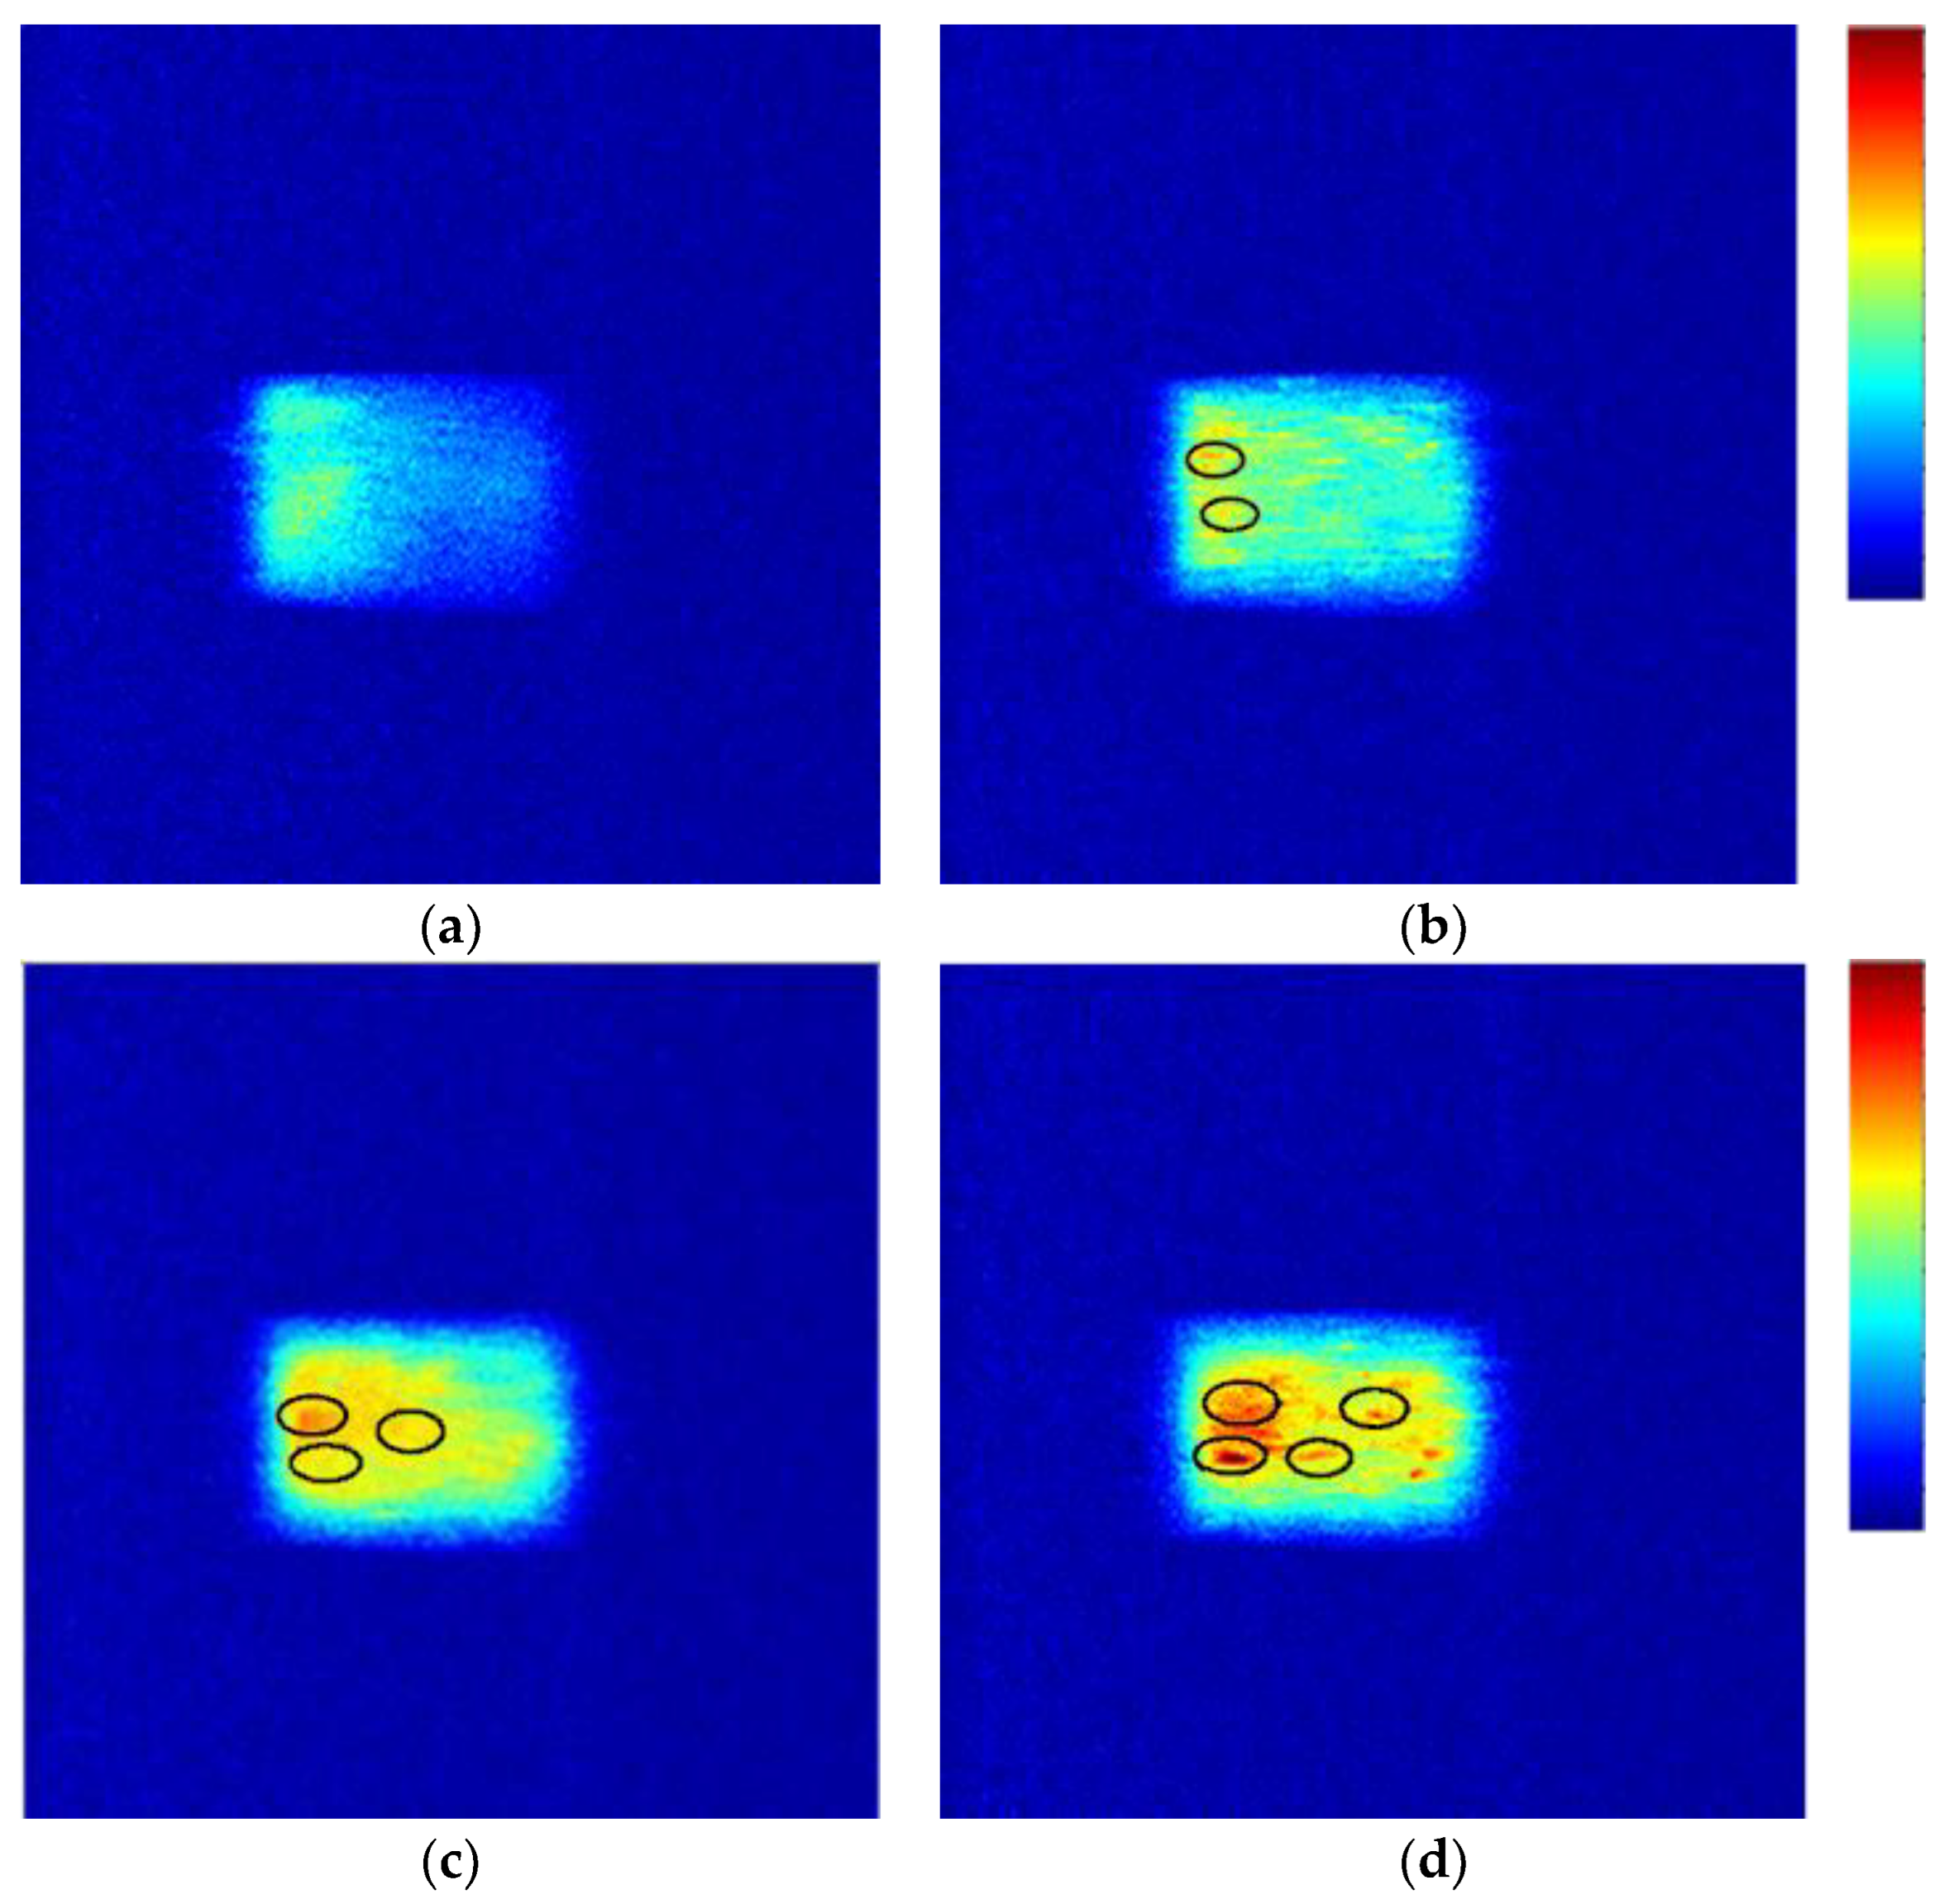
3.3.2. Imaging Analyses

For B-45 soil–cement specimens mixed with ferronickel slag powder, their porosity and NMR images after 0, 6, 12, and 18 dry–wet cycles are presented in Table 9 and Figure 10, respectively.
In Table 9 and Figure 10, it can be observed that the porosity of B-45 specimens rose from 43.48% to 60.08% as the number of dry–wet cycles increased. In this process, the porosity of these specimens became increasingly large, which was embodied in more pixel points and increasingly bright colors in pseudo-color images. When the number of dry–wet cycles was 0, there were only a small number of pixel points in those images and the color was rather dim. This indicated that distribution continuity of B-45 was preferable and that the interior of these specimens was both homogeneous and compact. After the sixth cycle, more pixel points appeared in the corresponding pseudo-color images; and agglomeration began to form. This reflects that small pores inside the soil–cement began to evolve into large pores due to the actions of dry–wet cycles. In this scenario, the number of large pores was comparatively low. After the 12th dry–wet cycle, the number of pixel points kept increasing in those images; and their colors became brighter as well. Additionally, the pixel points were distributed in an extremely non-uniform way and agglomeration occurred more frequently. According to these, small pores were proved to be gradually developed and connected under actions of dry–wet cycles, thus forming macrovoids, and their quantity also significantly increased. After the 18th cycle, agglomeration of pixel points became much more significant all over the interior of the soil–cement, and in terms of color brightness, extensive red dots were shown. The dramatically poor pixel uniformity indicated that a large number of large pores were developed inside the soil–cement, which facilitated the development of cracks. Through constant development and connection of these cracks, a failure surface was formed, which led to rather poor compactness of the soil–cement. Thus, it can be concluded that dry–wet cycles enable small pores inside the soil–cement to evolve into large pores and the number of such large pores to increase. In this context, cracks are developed. As seawater and CO2 enter these cracks and penetrate the interior of soil–cement, actions of dry–wet cycles can be more intense, and the corresponding porosity increases. Consequently, the compactness of soil–cement declines, as does its strength.

4. Conclusions

The influence of different ferronickel slag powder mixing ratios and various numbers of dry–wet cycles on compressive strength, mass change rates, and interior pore structures of soil–cement can be summarized as follows:
(1)
As shown by compressive strength curves of soil–cement mixed with ferronickel slag powder under different numbers of dry–wet cycles, with the increase in the number of dry–wet cycles, the unconfined compressive strength first increases and then decreases. Subjected to the same number of dry–wet cycles, mixing with ferronickel slag powder has the potential to improve the strength of soil–cement. Strength change rates of soil–cement mixed with ferronickel slag powder are above those of soil–cement with no ferronickel slag powder doped. Therefore, soil–cement containing ferronickel slag powder performs better in resisting the actions of dry–wet cycles than that with no such powder added. As proved by relevant experimental results, the optimal mixing ratio of ferronickel slag powder is 45%.
(2)
According to mass change rate curves of soil–cement mixed with ferronickel slag powder, the mass of soil–cement first increases and then decreases as the number of dry–wet cycles increases. Subjected to the same number of dry–wet cycles, soil–cement mixed with ferronickel slag powder has a mass loss lower rate than that with no such powder mixed. It is concluded that adding ferronickel slag powder in soil–cement is capable of improving its moisture stability and durability.
(3)
Through analyses on apparent erosion characteristics of dry–wet cycles, it turns out that apparent erosion on soil–cement surfaces becomes increasingly serious after the sixth dry–wet cycle, which is embodied in the absence of edges and corners, deformed surfaces, spalling and cracking, etc. Provided that the number of dry–wet cycles remains unchanged, apparent erosion degrees of soil–cement with ferronickel slag powder are below those with no such powder mixed. Moreover, soil–cement mixed with ferronickel slag powder features higher compactness interiorly, better integrity, and stronger resistance to erosion caused by dry–wet cycles.

Author Contributions

Conceptualization, F.C.; methodology, F.C. and H.W.; investigation, S.C., W.C., and H.W.; resources, J.Y.; writing—original draft preparation, F.C. and W.C.; writing—review and editing, S.C.; project administration, F.C. and S.C.; funding acquisition, F.C. and S.C. All authors have read and agreed to the published version of the manuscript.

Funding

This research was funded by Fujian University Industry University Research Joint Innovation Project (Grant No. 2022Y4002), and Natural Science Foundation of Fujian Province (Grant No. 2022J01963 and Grant No. 2022J01964).

Institutional Review Board Statement

Not applicable.

Informed Consent Statement

Not applicable.

Data Availability Statement

Access to the data will be considered by the authors upon request.

Conflicts of Interest

The authors declare no conflict of interest.

References

  1. Xiong, F.; Xing, H.; Li, H. Experimental study on the effects of multiple corrosive ion coexistence on soil-cement characteristics. Soils Found. 2019, 59, 398–406. [Google Scholar] [CrossRef]
  2. Pham, V.N.; Turner, B.; Huang, J.; Kelly, R. The long-term strength of soil-cement columns in coastal areas. Soils Found. 2017, 57, 645–654. [Google Scholar] [CrossRef]
  3. Li, N.; Zhao, W.Q.; Gu, J.H.; Zhao, S.W.; Wang, W.; Jiang, P. Study on mechanical properties of coastal soil-cement modified by fiber under dry-wet cycle. Yangtze River 2022, 53, 169–174. [Google Scholar]
  4. Wang, J.H.; Gao, Y.Q. Study on the strength degradation mechanism of cement-soils resulting from dry-wet cycles. China Railw. Sci. 2006, 05, 23–27. [Google Scholar]
  5. Zheng, J.; Yan, C.H.; Xia, W.J.; Zhang, Y.G.; Cui, D.W.; Zhou, X.; Zhang, R.; Chen, M.Z. Experimental study of influence of drying and wetting cycles on bearing capacity of improved soil by CMSC soil stabilized agent. Chin. J. Rock Mech. Eng. 2009, 28, 3051–3056. [Google Scholar]
  6. Liang, S.H.; Zeng, W.H. Experimental study on silt soil solidified by cement-fly ash mixture under dry-wet cycles in Nansha. Ind. Constr. 2018, 48, 83–86. [Google Scholar]
  7. Cuisinier, O.; Masrouri, F.; Mehenni, A. Alteration of the Hydromechanical Performances of a Stabilized Compacted Soil Exposed to Successive Wetting–Drying Cycles. J. Mater. Civ. Eng. 2020, 32. [Google Scholar] [CrossRef]
  8. Xu, L.N.; Deng, H.Y.; Niu, L.; Zheng, J.J.; Qian, Y.M. Experimental study on mechanical properties of fiber-reinforced cemented soil with the low temperature curing condition subjected to effect of salt and drying-wetting cycles. J. Civ. Environ. Eng. 2022, 44, 10–19. [Google Scholar]
  9. Li, Q.; Chen, J.; Shi, Q.; Zhao, S. Macroscopic and Microscopic Mechanisms of Cement-Stabilized Soft Clay Mixed with Seawater by Adding Ultrafine Silica Fume. Adv. Mater. Sci. Eng. 2014, 2014, 810652. [Google Scholar] [CrossRef]
  10. Akinyemi, B.A.; Omoniyi, T.E. Effect of experimental wet and dry cycles on bamboo fibre reinforced acrylic polymer modified cement composites. J. Mech. Behav. Mater. 2020, 29, 86–93. [Google Scholar] [CrossRef]
  11. Alazigha, D.; Vinod, J.S.; Indraratna, B.; Heitor, A. Potential Use of Lignosulfonate for Expansive Soil Stabilisation. Environ. Geotech. 2018, 6, 480–488. [Google Scholar] [CrossRef]
  12. Kampala, A.; Horpibulsuk, S.; Prongmanee, N.; Chinkulkijniwat, A. Influence of Wet-Dry Cycles on Compressive Strength of Calcium Carbide Residue–Fly Ash Stabilized Clay. J. Mater. Civ. Eng. 2013, 26, 633–643. [Google Scholar] [CrossRef]
  13. Wu, Y.K.; Shi, K.J.; Han, Y.; Han, T.; Yu, J.; Li, D. Experimental study on strength characteristics of expansive soil improved by steel slag powder and cement under dry-wet cycles. Iran. J. Sci. Technol. Trans. Civ. Eng. 2020, 45, 941–952. [Google Scholar] [CrossRef]
  14. Chen, J.H. Experimental study on solidification mechanism of nickel iron slag cement soil. J. Water Resour. Archit. Eng. 2020, 18, 122–127. [Google Scholar]
  15. Liu, F.; Chen, M.Z.; Li, F.Z.; Li, L.Q.; Wu, S.P.; Sang, Y. Effect of ground steel slag powder on cement properties. Mater. Res. Innov. 2015, 19, 150–153. [Google Scholar] [CrossRef]
  16. Ke, K.Z. Experimental Study on Early Age Strength of Nickel Iron Slag Powder Cement. J. Water Resour. Archit. Eng. 2018, 04, 192–195. [Google Scholar]
  17. Zhang, L.F.; Yang, L.; Fu, B.H.; Yue, Y. Research Progress on Carbonation Resistance of Alkali-Activated Slag Cement Concrete. Mater. Sci. Forum 2021, 1036, 347–357. [Google Scholar] [CrossRef]
  18. Chen, F.; Tong, S.H. Effect of Ferronickel Slag Powder on Strength of Soil in Marine Environment. Adv. Civ. Eng. 2020, 2020, 8856055. [Google Scholar] [CrossRef]
  19. Yang, Z.Q.; Gao, Q.; Wang, Y.Q.; Ni, W.; Chen, D.-x. Experimental study on new filling cementing material using water-hardening nickel slag tailings of Jinchuan Mine. Chin. J. Geotech. Eng. 2014, 36, 1498–1506. [Google Scholar]
  20. Shanmugasundar, G.; Krishnan, G.S.; Babu, L.G.; Kumar, S.; Makos, M. Investigation of Ferronickel Slag Powder for Marine Applications by Using MIP Method; IOP Publishing Ltd: Bristol, UK, 2022. [Google Scholar] [CrossRef]
  21. GB/T 50082-2009; Standard for Test Methods of Long-term Performance and Durability of Ordinary Concrete. China Architecture & Building Press: Beijing, China, 2009; pp. 36–37.
  22. Song, X.G.; Zhang, Z.M.; Chen, H.Y.; Guo, S.Z.; Dong, J.; Liu, J.L. Application of reinforced soil-cement mixed pile in strengthening existing heavy haul railway subgrade. Railw. Stand. Des. 2015, 59, 32–36. [Google Scholar]
Figure 1. Pictures of Sample preparation process: (a) Dry powdered clay; (b) Cement sand mixer; (c) Soil–cement slurry and (d) Curing of soil–cement.
Jmse 11 01684 g001aJmse 11 01684 g001b
Figure 2. MTS landmark 370.25 testing machine.
Jmse 11 01684 g002
Figure 3. (a) NMR test equipment, (b) the sample tube and (c) test samples.
Jmse 11 01684 g003
Figure 4. Curves of mass change rates of specimens under different numbers of dry−wet cycles.
Jmse 11 01684 g004
Figure 5. Apparent erosion of B-0 specimens under the actions of dry–wet cycles.
Jmse 11 01684 g005aJmse 11 01684 g005b
Figure 6. Apparent erosion of B-45 specimens under the actions of dry–wet cycles.
Jmse 11 01684 g006
Figure 7. Compressive strength curves of specimens subjected to different numbers of dry–wet cycles.
Jmse 11 01684 g007
Figure 8. Compressive strength change rates of specimens subjected to different numbers of dry−wet cycles.
Jmse 11 01684 g008
Figure 9. T2 curves of B−45 specimens under different dry−wet cycles.
Jmse 11 01684 g009
Figure 10. Pseudo-color NMR images of B-45 specimens subjected to (a) 0 cycle, (b) 6 cycles, (c) 12 cycles and (d) 18 cycles.
Jmse 11 01684 g010
Table 1. Physicomechanical indexes of silt soil.
Soil TypeMoisture Content w (%)Unit Weight r (kN/m3)Porosity e
-
Liquid Limit WL (%)Plastic Limit Wp (%)Plasticity Index IpLiquidity Index IL
Silt soil58.616.321.5334929.319.81.47
Table 2. Main performance indicators of cement.
ItemGB/T 175Measured Result
Specific surface area (m2·kg−1)≥300381
80 μm sieve residue (%)≤100.63
Standard consistency (%)/25.8
Loss on ignition (%)≤5.01.59
Initial setting time (min)≥45147
Final setting time (min)≤600212
Table 3. Chemical compositions of cement.
CompositionSO3MgOCaOSiO2Al2O3Fe2O3f-CaOOthersLOI
Mass percent (%)2.892.0562.5521.694.383.340.570.841.59
Note: LOI represents the loss on ignition.
Table 4. Chemical compositions of ferronickel slag powder.
Composition SiO2Al2O3CaOMgOTiO2MnOFe2O3SO3LOI
Ferronickel slag powder (%)35.8221.4629.229.460.780.571.330.162.43
Mineral powder (%)32.0016.8136.1210.590.930.92.290.140.16
Note: LOI represents the loss on ignition.
Table 5. Major components of artificial seawater.
CompositionNaClMgCl2Na2SO4CaCl2KClNaHCO3KBrH3BO3SrCl2
Concentration (g/L)24.535.204.091.160.700.200.100.030.03
Table 6. Dry–wet cycle test scheme.
Serial No.Binder Material Ratio (%)Water–Cement RatioReplacement Ratio (%)Curing ConditionNumber of Specimens
0 Cycle3 Cycles6 Cycles9 Cycles12 Cycles15 Cycles18 Cycles
B-0150.50Seawater3333333
B-3030Seawater3333333
B-4545Seawater3333333
B-6060Seawater3333333
Table 7. Mass of specimens subjected to different numbers of dry–wet cycles.
Serial No.Mass
0 Cycles
(g)
3 Cycles
(g)
6 Cycles
(g)
9 Cycles
(g)
12 Cycles
(g)
15 Cycles
(g)
18 Cycles
(g)
B-0582.93587.91576.31565.65571.13561.04554.45
B-30584.64591.54582.36578.97570.49566.60560.73
B-45585.72597.20588.18582.44575.18571.08566.39
B-60584.86592.76583.46580.42571.47568.31563.28
Table 8. Mass change rates of specimens subjected to different numbers of dry–wet cycles.
Serial No.Change Rate
0 Cycles
(%)
3 Cycles
(%)
6 Cycles
(%)
9 Cycles
(%)
12 Cycles
(%)
15 Cycles
(%)
18 Cycles
(%)
B-000.83−1.13−2.02−2.96−3.75−4.88
B-3001.88−0.39−0.97−2.42−3.12−4.09
B-4501.960.42−0.56−1.8−2.5−3.3
B-6001.35−0.24−0.76−2.29−2.83−3.69
Table 9. Porosity of B-45 soil–cement specimens subjected to different numbers of dry–wet cycles.
Number of Dry–Wet Cycles061218
Porosity (%)43.4848.7254.6160.08
Disclaimer/Publisher’s Note: The statements, opinions and data contained in all publications are solely those of the individual author(s) and contributor(s) and not of MDPI and/or the editor(s). MDPI and/or the editor(s) disclaim responsibility for any injury to people or property resulting from any ideas, methods, instructions or products referred to in the content.

