Abstract
A common retrofitting method for wind farms is the replacement of low-power turbines with high-power ones. The determination of the optimal replacement sequence for the purpose of maximizing revenue is a significant challenge. This paper employs a combination of FLORIS and a sequencing algorithm to simulate the power output resulting from the replacement of 1.5 MW small turbines with 5 MW large turbines. This study demonstrates that the optimal strategy for maximizing the overall power output is to replace the turbines in the first column. When the turbines situated in the first column have already undergone replacement or are unable to be replaced due to the characteristics of the terrain, it would be prudent to prioritize those in the final column. In the case of staggered arrangements, priority should be given to diagonal points that do not have turbines situated behind them. In the case of replacing the same number of large wind turbines, the preferred replacement option has a minimal impact on the power output of the existing small wind turbines, with an estimated reduction of 0.67%. This effectively enhances the economic efficiency of wind farm renovation.
1. Introduction
China’s wind power industry is currently undergoing a period of accelerated growth, with the country emerging as a prominent global market for wind power [1,2]. Wind power represents a form of clean energy, and the promotion of wind energy utilization for the comprehensive use of energy has a beneficial effect on the advancement of wind farms [3,4]. The growth of wind power is driven by two key factors: technological innovation and policy support. As these factors combine to facilitate continuous technological innovation, the installed capacity of wind power continues to expand [5]. However, the technology employed in the initial wind farms, which were constructed in the early years of wind power programs, is now outdated and the performance of the wind turbines is declining year by year. In response, the Chinese government has formulated the Measures for the Administration of Upgrading and Decommissioning of Wind Farms [6], which encourages the upgrading of wind farms that have been in operation on the grid for more than 15 years or whose capacity of a single turbine is less than 1.5 MW. Presently, the Chinese government is actively promoting the replacement of smaller wind farms with larger ones, and a number of such replacements have already been completed.
The studies of wind turbine wakes in large wind farms are based on a number of different approaches, including numerical weather prediction [7,8], big data analysis [1,9,10,11], wind tunnel experiments [12,13,14], point optimization [15,16] analysis of operational data [17,18,19,20] from real wind farms, and numerical simulations. In their study, Chamorro et al. [12] employed wind tunnel experiments to examine the behavior of wind turbines with varying hub heights and diameters. Their findings revealed the presence of significant turbulent mixing in the shear layer under experimental conditions. The literature [13] presents a study on the enhancement of power generation efficiency in vertical staggered row layout wind turbines through wind tunnel experimental measurements. Additionally, vertical-axis wind turbines have been demonstrated to exert a contributory influence on wake flow in wind farms [21,22,23]. The impact of a discrepancy in hub height on wind farm performance can be quantified through the utilization of optimization algorithms [24,25]. The deployment of vertically aligned wind turbines has the potential to enhance the overall power output of a wind farm.
For the optimization of large-scale wind farm arrangements, engineering wake simulation is a more advantageous methodology [8]. Flow Redirection and Induction in Steady State (FLORIS) is a tool developed by the National Renewable Energy Laboratory (NREL) for the modeling of steady-state wake characteristics in wind farms [26]. Maarten et al. [27] conducted a re-analysis of the Lillgrund wind farm using the FLORIS model, which revealed that the optimized yaw angle resulted in a 3.4% improvement in power output. Cioffi et al. [28] integrated the FLORIS model with Openfast software (V3.0) to facilitate comprehensive control of a wind farm wake, thereby enhancing the compatibility of the control system. Zhao et al. [29] conducted a study on dynamic wake management based on FLORIS, and the literature [30,31,32,33] also employed FLORIS to investigate closed-loop wake control.
This paper employs the FLORIS software (V4.0) to investigate the effects of replacing large wind turbines in wind farms during their modification. Section 2 presents the calculation model and examples of operational conditions. Section 3 discusses the impact of wind farm tailrace effects under different operational conditions, as analyzed using the FLORIS software. Finally, Section 4 summarizes the principal outcomes of the study.
2. Materials and Methods
2.1. FLORIS Overview
This paper employed the FLORIS wake flow simulation software to simulate and analyze the wake flow field of a wind farm. The software was developed by NREL and is widely used for the calculation of wind farm wake flows and power outputs. It can also be used to rapidly calculate wind turbine wake flows under steady-state conditions [34]. The input conditions necessary for the simulation can be classified into the following categories: the selection of the sub-model to be employed, the inlet conditions, the wind turbine model utilized, and the wind farm layout [35].
2.2. Case Setup
In this paper, a Gaussian wake model and a deflection model [28,33] were used to represent the velocity deficit and wake deflection, and for the wind turbine wake the sum of squares (SS) model [36] was used for the combination. Considering the additional changes in the flow field introduced by the ground during the operation of the wind turbine, the wake turbulence model proposed in [37] was used. It was also assumed that the wind farm inflow has a shear factor of 0.12 and a turbulence intensity of 0.06. In this paper, two models of wind turbines, NH1.5-MW and NREL5-MW, were taken as the research objects, and the differences in the total power output of the two wind turbines under various conditions of tandem arrangement were studied in depth; the data on the values of power coefficients and thrust coefficients of the two wind turbines under various wind speeds are shown in Equations (1) and (2) in detail [38], and the detailed parameters of the models are shown in Table 1.
where represents the variation in volume velocity; represents the reference velocity of the wind farm; represents the radius of the wake; and represent the dimensions of the spanwise and streamwise coordinates; = 0 at the hub of the wind turbine rotor; = 0 at the horizontal ground surface; represents the height of the wind turbine rotor; represents the distance downstream from the wind turbine; represents the amplitude of the velocity loss distribution; and represents the standard deviation of the velocity loss.

Table 1.
Wind turbine parameters.
The formula for the wake deflection can be expressed as follows:
where represents the standard deviation of the downstream movement of the velocity deficit; represents the wind turbine blade diameter; represents the linear evolution factor of standard deviation; represents the thrust coefficient of the wind turbine; and represents the angle of thrust of the wind turbine.
In order to analyze the wind turbine wake stream, the sum of squares freestream superposition model was employed. The equation for the wake superposition can be expressed as follows:
where represents each individual wind turbine wake stream, calculated up to the total number of wind turbines in ; represents the local average velocity; represents the local inflow velocity; ; and represents the velocity deficit.
In light of the supplementary alterations to the wind farm flow field brought about by ground roughness during the operation of wind turbines, the wake turbulence model put forth in the existing literature [39] was employed in this study. This model was employed to ascertain the supplementary uncertainty that arises during wind turbine operation. The wake turbulence intensity was derived from the thrust coefficients obtained in the near wake region, in addition to those obtained in the far wake region and the ambient turbulence. The equation can be expressed as follows:
where represents the wake turbulence intensity; represents the thrust coefficient induction factor; represents the regulation pair scale set at 0.12; represents the axial induction factor set at 0.8; represents the ambient turbulence intensity set at 0.06; represents the dependence factor on the downstream distance set at −0.32; and represents the discriminant of the wake region.
This paper examines the process of retrofitting and replacing wind turbines in wind farms, utilizing two models of wind turbines: the NH1.5-MW and the NREL5-MW. The parameters of these two models, representing different capacities, are presented in Table 1.
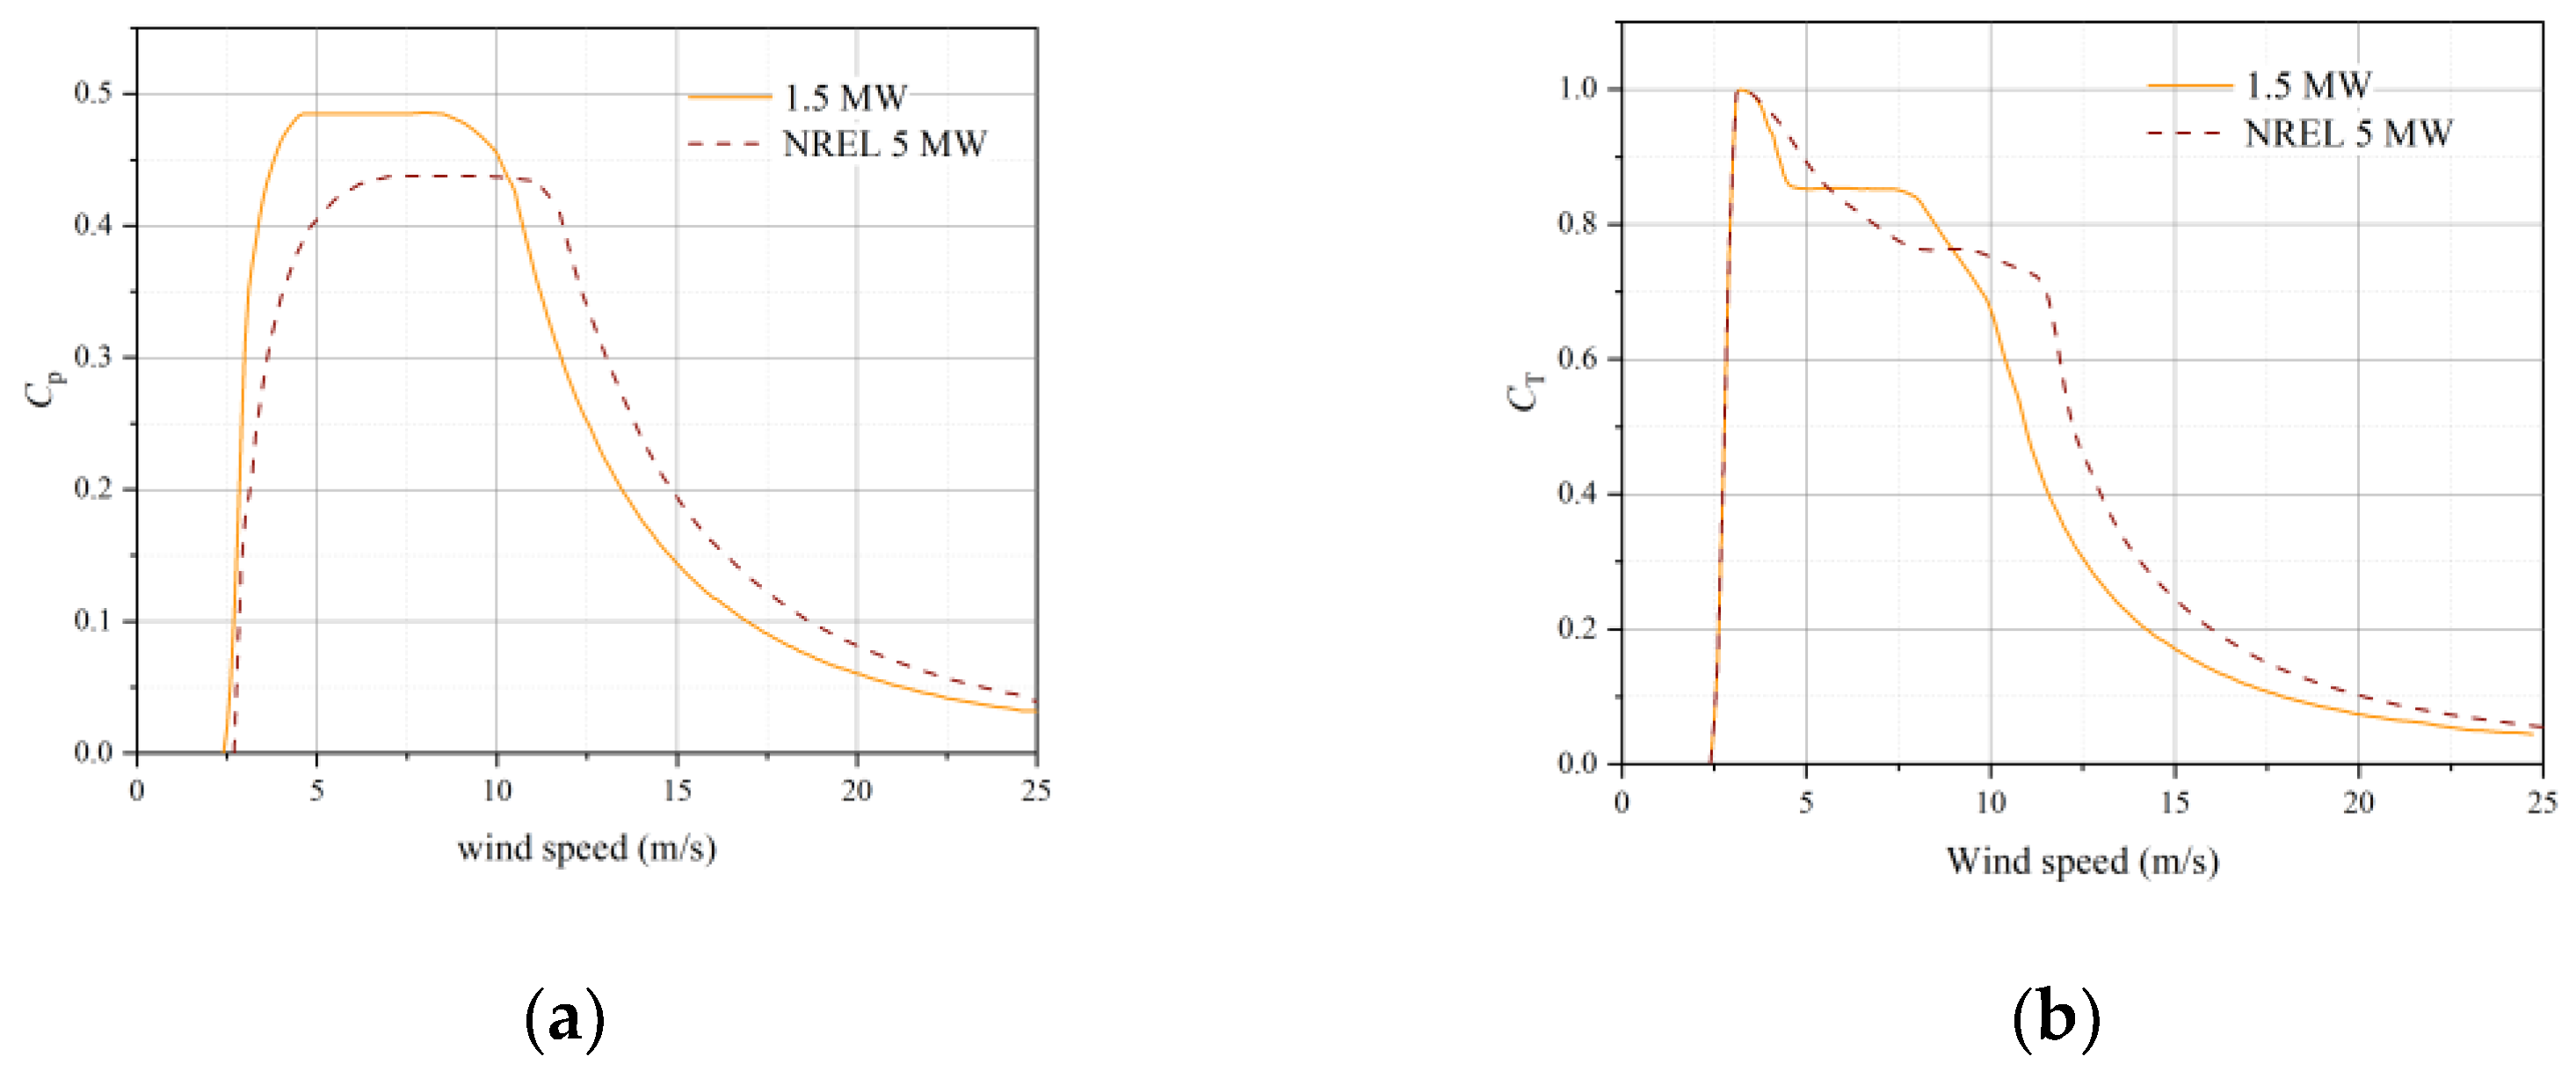
The power coefficient and thrust coefficient values entered into the FLORIS software for both wind turbine models at various wind speeds were derived from the rated power and thrust coefficients of the respective turbine models. These values are presented in Figure 1.
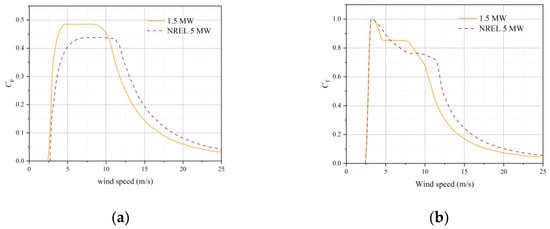
Figure 1.
The power and thrust coefficients of the 1.5 MW and 5 MW wind turbines in this study. (a) values of for two wind turbines; (b) values of for two wind turbines.
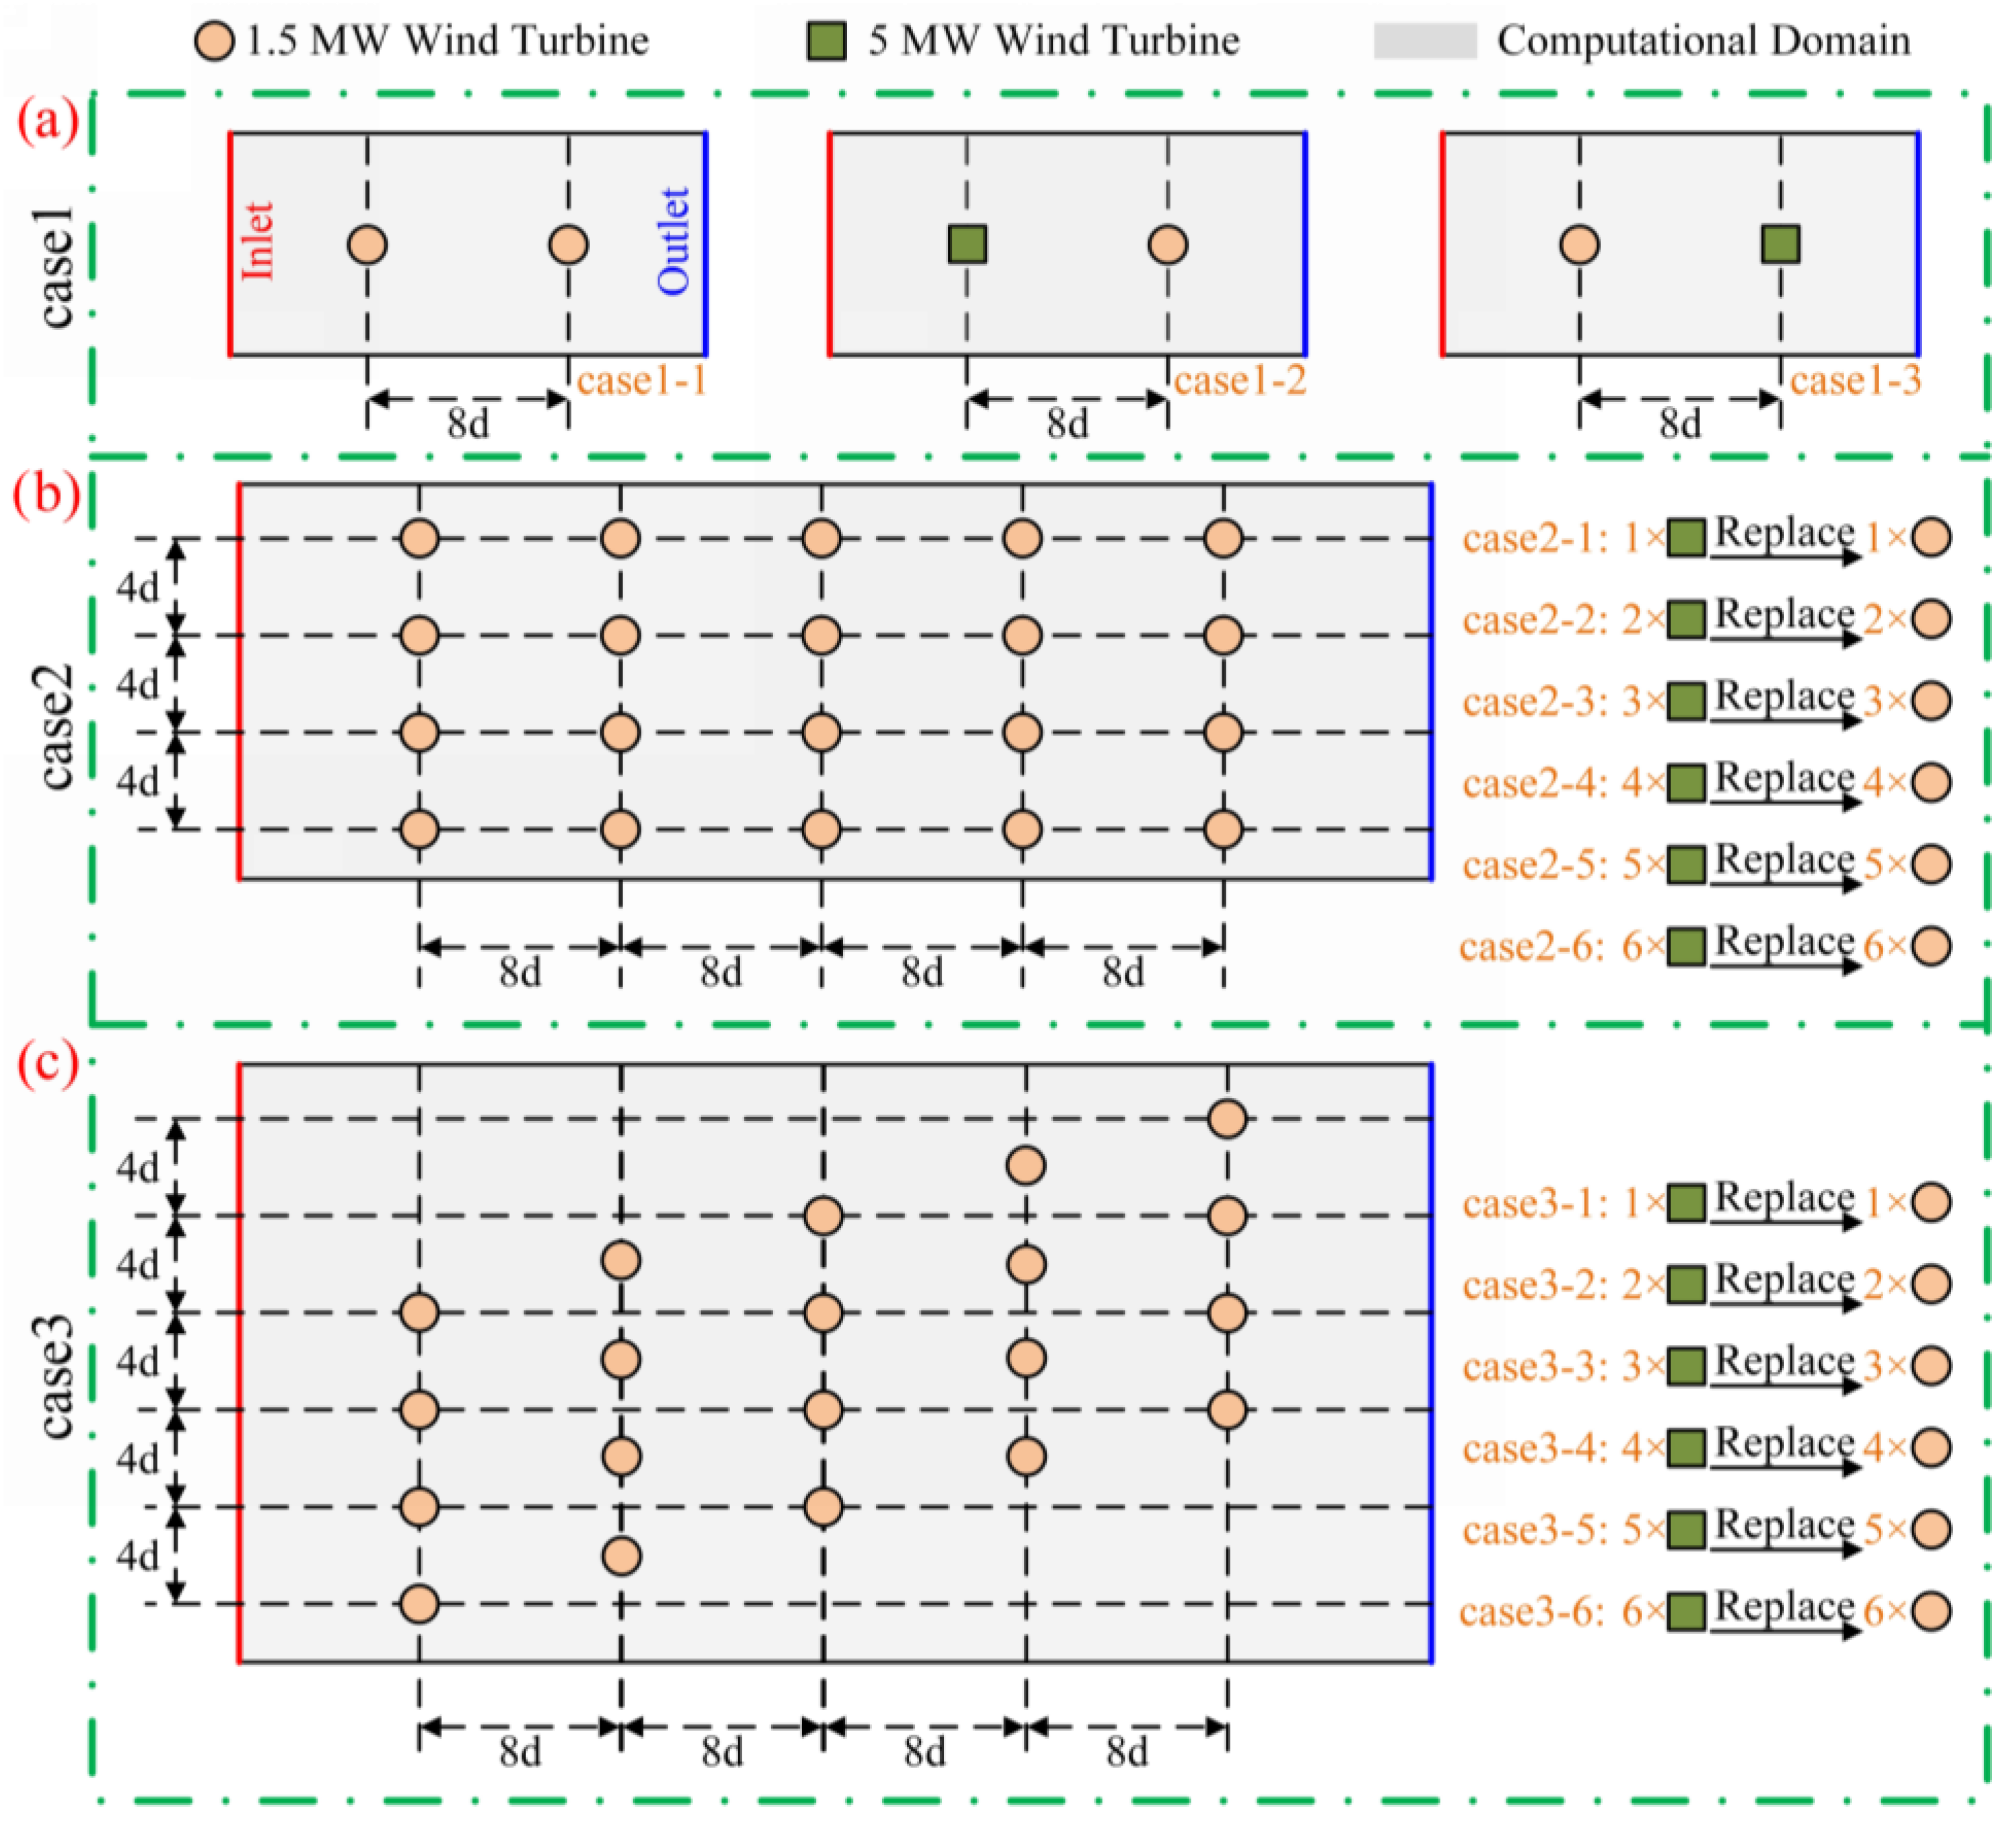
This paper presents a study investigating the replacement of small-capacity whole wind farm power outputs in wind turbines. The study employed two wind turbines arranged in accordance with the replacement configuration (Case 1), 20 wind turbines arranged in accordance with the replacement configuration (Case 2), and 20 sets of staggered replacement (Case 3) comprising three major working conditions. These conditions are representative of atmospheric boundary layer incoming conditions, with incoming wind speeds ranging from 4 to 16 m/s.
In order to examine the potential implications of varying configurations, three sub-cases were devised for Case 1. The first of these, Case 1-1, assumes the deployment of both upstream and downstream wind turbines of the NH1.5 MW variety. The second, Case 1-2, introduces a replacement for the upstream wind turbine in Case 1-1, namely an NREL 5 MW turbine situated at the original location. Finally, Case 1-3 contemplates a swap of the two wind turbines in Case 1-2, as illustrated in Figure 2a. In regard to Case 2, six sub-cases were devised, each corresponding to the replacement of one to six large wind turbines in a 4 × 5 wind farm. For example, Case 2-1 entails replacing one large wind turbine in a 4 × 5 wind farm with a parallel arrangement, as illustrated in Figure 2b. Case 3, on the other hand, involves a change in wind turbine arrangement from parallel to staggered, with all other settings remaining unaltered. This is depicted in Figure 2c.
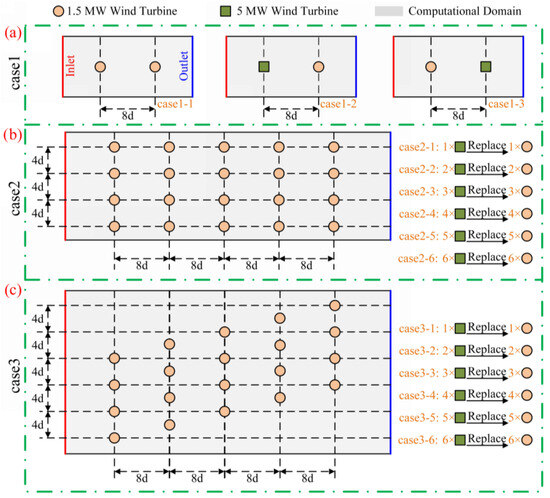
Figure 2.
The layout of Case1~Case3 in this study. (a) The layout of Case 1; (b) The layout of Case 2; (c) The layout of Case 3.
In Case 2 the horizontal spacing of the 4 × 5 wind farm is 8 d, and the vertical spacing is 4 d. This spacing configuration allows for a reduction in the impact of the wake between the small wind turbine units, facilitating a more accurate demonstration of the size of the wake impact of the in-situ replacement of large wind turbines, which can then be easily compared and analyzed. In Case 3, the vertical spacing of each column remains unchanged, and the spacing between the columns is 8 d. Additionally, each column is shifted upward by 2 d compared with the previous column, reflecting the staggered column arrangement.
A comprehensive calculation of the output power of each wind turbine in the case can be performed rapidly with the assistance of the accelerated simulation functionality of the FLORIS software. In order to conduct a comparative analysis, it is essential to enumerate all potential operational scenarios for each sub-case. Subsequently, the total wind farm output power for each case can be evaluated through the application of a sorting algorithm. Ultimately, this approach facilitates the identification of the optimal replacement point when replacing varying numbers of wind turbines. The total number of calculation conditions involved in each sub-case is illustrated in Equation (10).
where C represents the total number of replacement scenarios, n represents the number of wind turbines in the modeled wind farm, and k represents the number of units of large wind turbines replacing small wind turbines.
The calculated cumulative number of operations for different sub-working conditions is detailed in Table 2.
Table 2.
The cumulative number of sub-case operations.
3. Results
3.1. Impact of Whole-Farm Power Output
3.1.1. Output for Two Wind Turbines Lined up in a Parallel Row
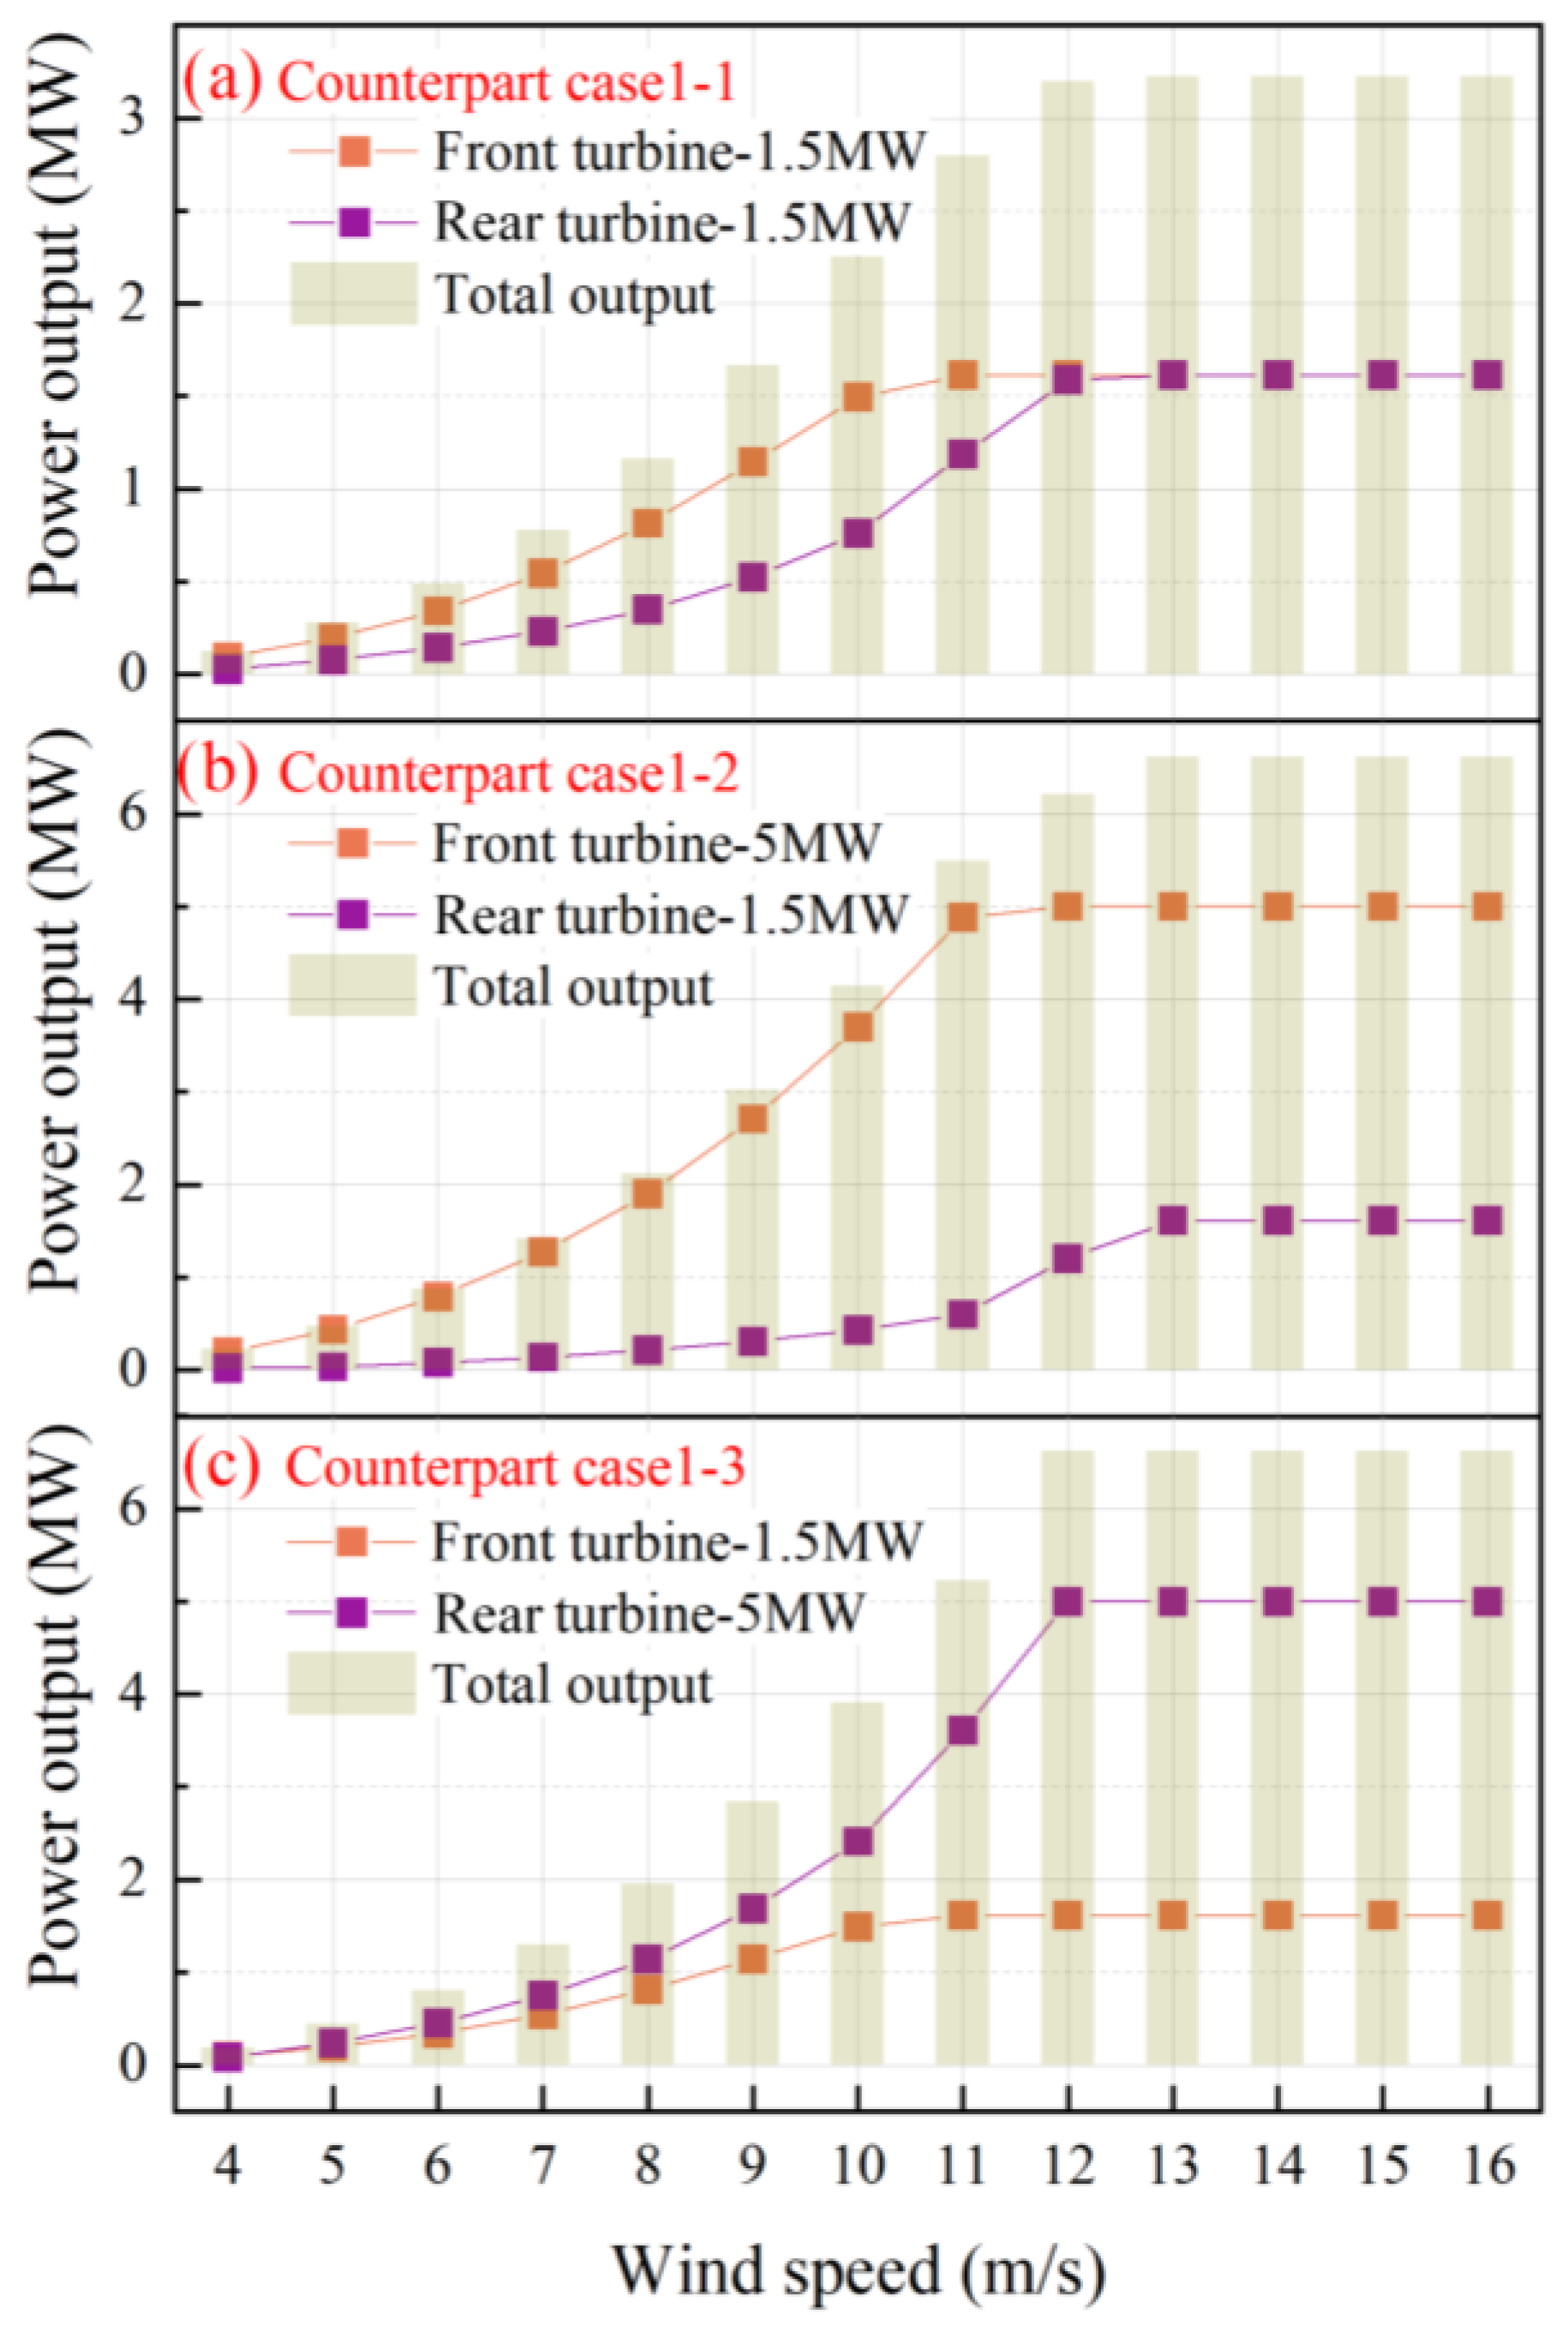
Prior to investigating the impact of substituting small wind turbines with large wind turbines on the aggregate power output of a wind farm, it is essential to first examine the influence of a small system comprising a single large wind turbine and a small wind turbine. Figure 3 illustrates the power output of a small system comprising two units when large wind turbines are replaced with small wind turbines.
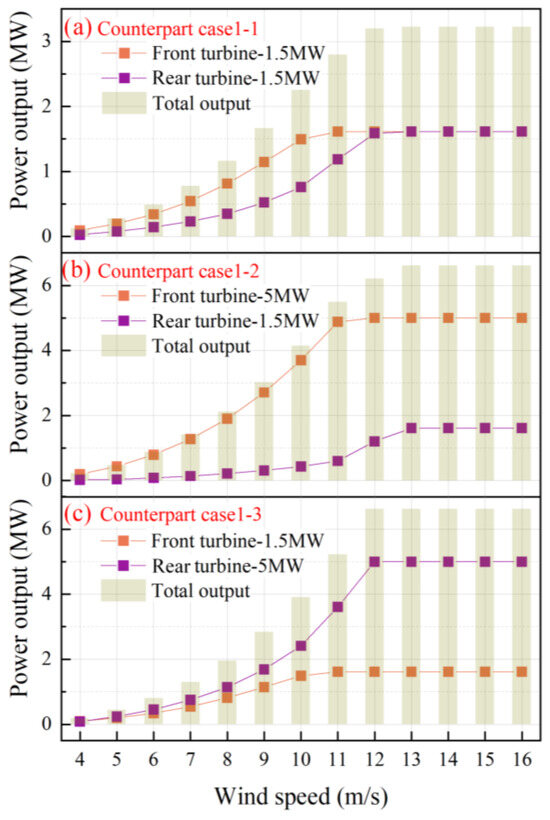
Figure 3.
System power output when replacing a single wind turbine.
Figure 3a provides clear evidence that, when the two units have the same capacity, the power output of the upstream wind turbine will be significantly higher than that of the downstream wind turbine at wind speeds of 4~11 m/s. This is due to the fact that as the wind passes through the operating wind turbine, it exerts a force on the turbine blades, causing them to rotate and thereby dissipating the energy they contain at a faster rate. This is due to the fact that as the wind passes through the operational turbine, it causes the turbine blades to rotate and perform work, which results in a faster dissipation of the energy they contain. Furthermore, the rotation of the wind turbine generates a substantial vortex structure in its wake, which diminishes the quality of the wind energy captured by the downstream turbine. Consequently, the downstream turbine exhibits a lower power output than the upstream turbine.
In the event of replacing the wind turbine with a larger one in a small system comprising two units, two sub-conditions are created. These are the installation of the larger unit before (Case 1-2) or after (Case 1-3) the smaller unit. As illustrated in Figure 3b,c, the distinct configurations will influence the operational performance of the small system comprising the two units. The installation of the larger fan in front of the smaller fan results in a slight increase in the total power output of the system, with an average increase of approximately 1.43% observed at wind speeds of 4 to 12 m/s. At wind speeds of 4 to 11 m/s, the improvement in the total power output of the two units is more pronounced when the large wind turbine is installed upstream than when the large wind turbine is installed downstream of the small wind turbine, with an improvement of approximately 6.70%.
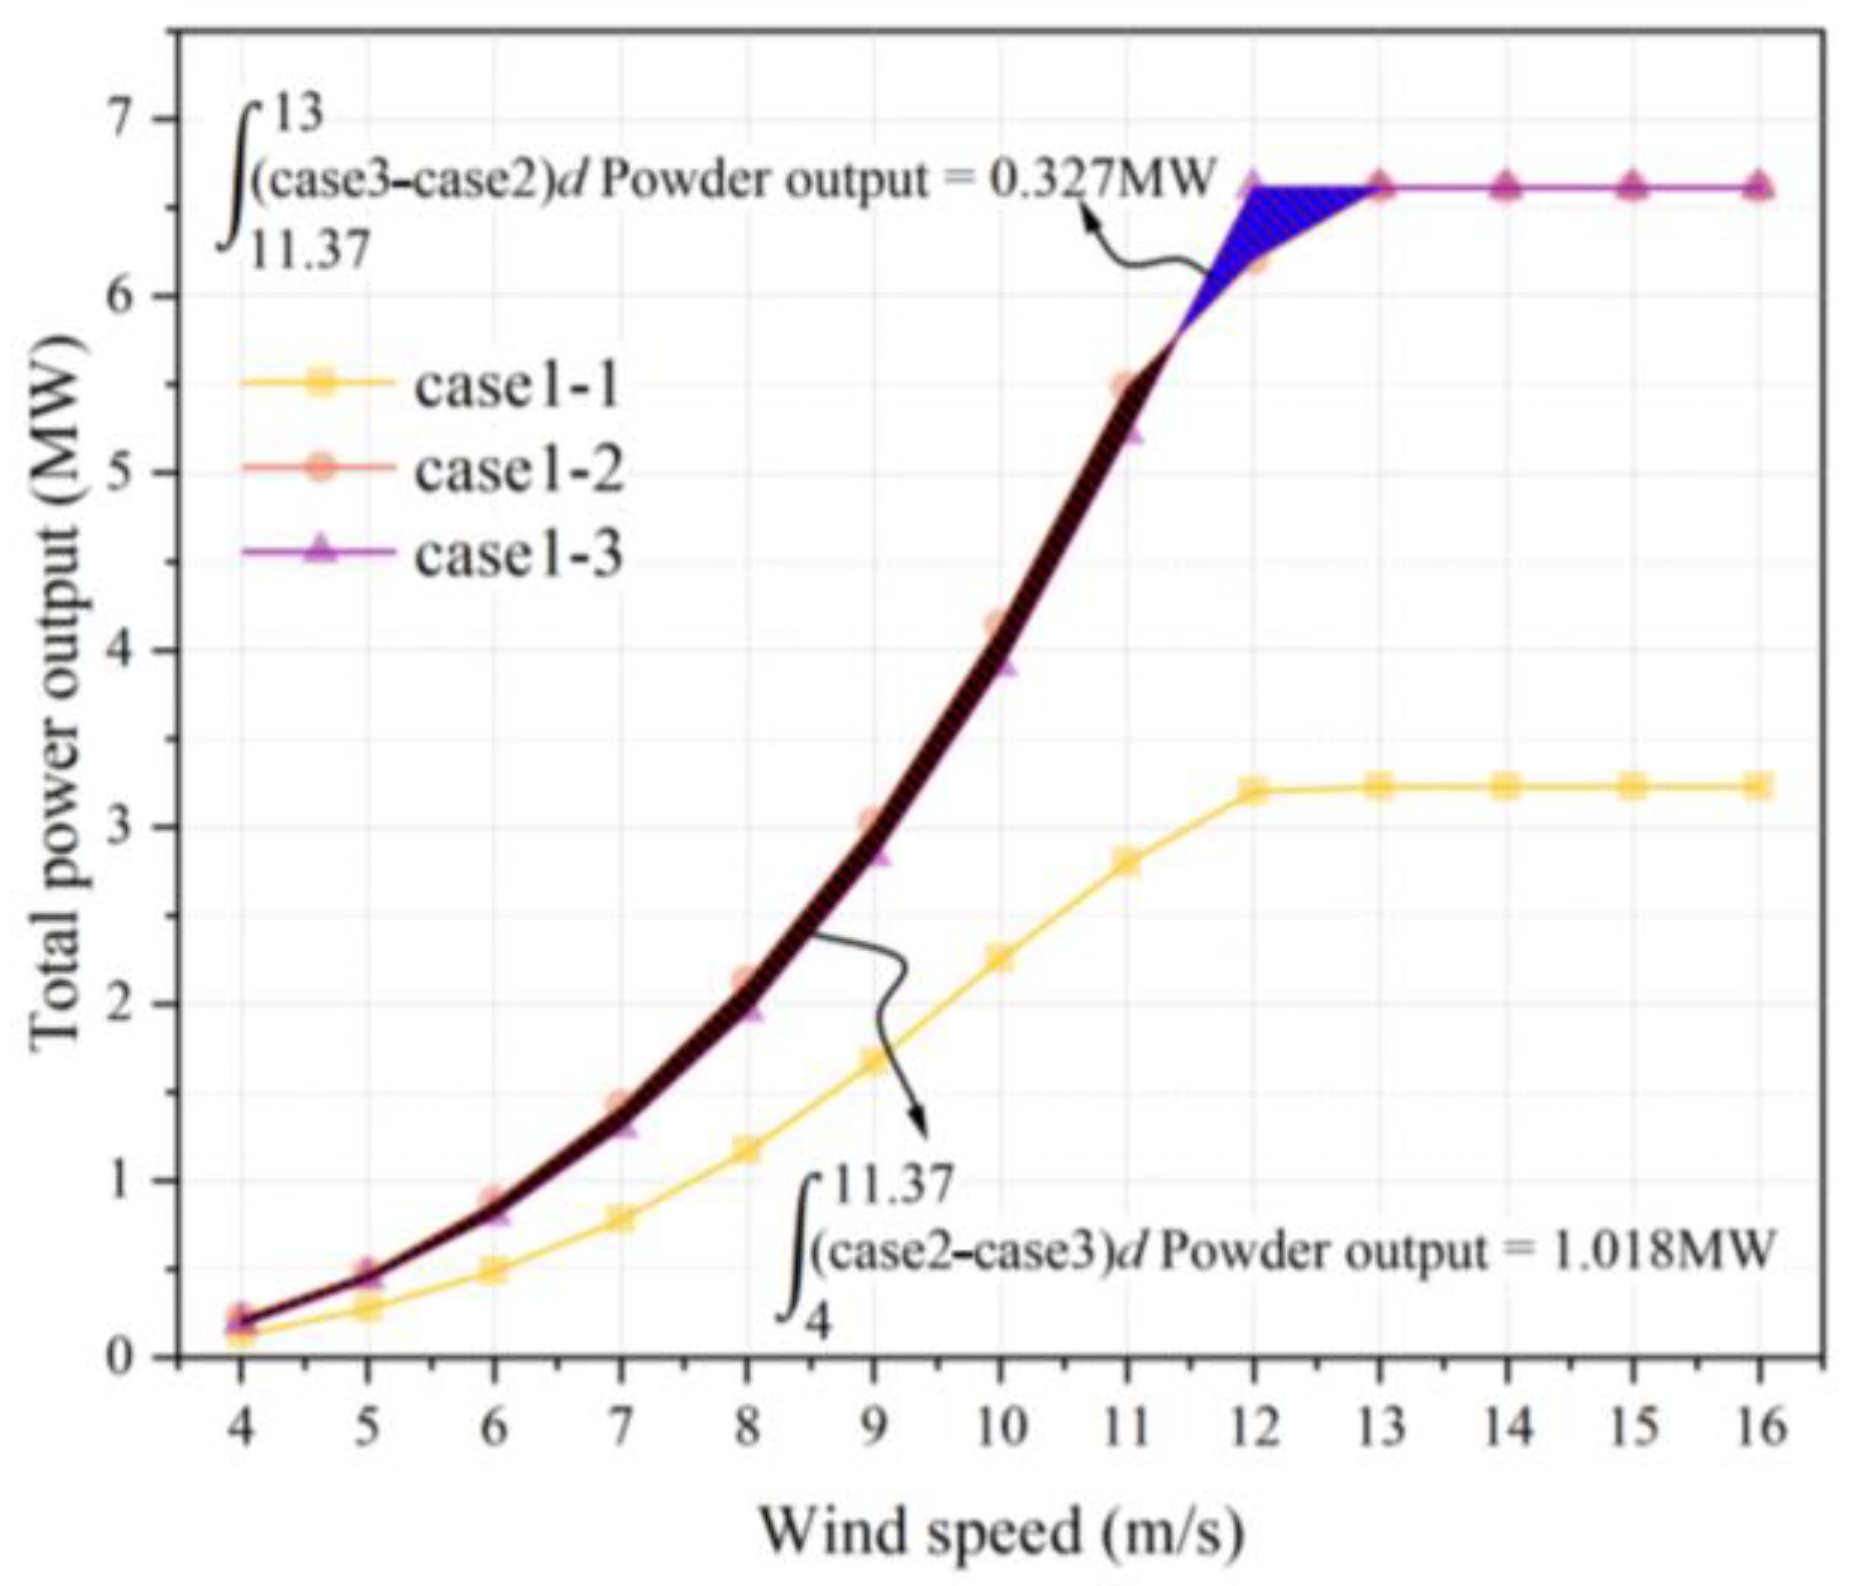
It can be observed that the two units are able to enter the full power state at a faster rate when the large wind turbine is installed downstream, given that the power output difference integral of the two installation methods at wind speeds between 4 and 13 m/s is calculated. It can be concluded that the optimal method for improving the power output of the entire wind farm is to install the large wind turbine upstream, as illustrated in Figure 4.
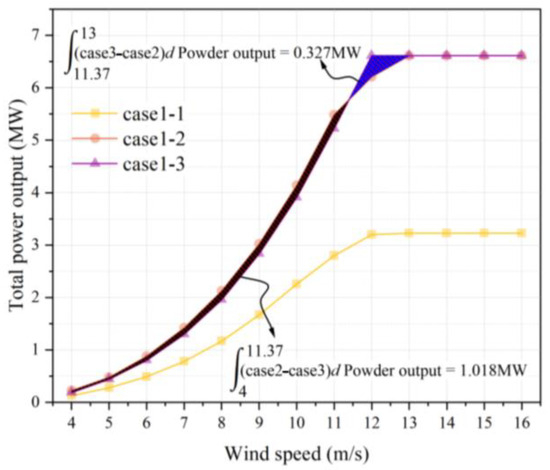
Figure 4.
Total power output of the two wind turbine systems under different conditions.
3.1.2. Output for Whole-Farm of Parallel Arrangement
In the context of a wind farm comprising turbines arranged in rows, it is essential to label the target location for turbine replacement in order to facilitate discussion. To this end, the ‘row number-column number’ method is employed to indicate the replacement location. To illustrate, if the small wind turbines situated in the second row and first column are to be substituted with larger wind turbines, the replacement location will be designated as ‘2-1’, and so forth.
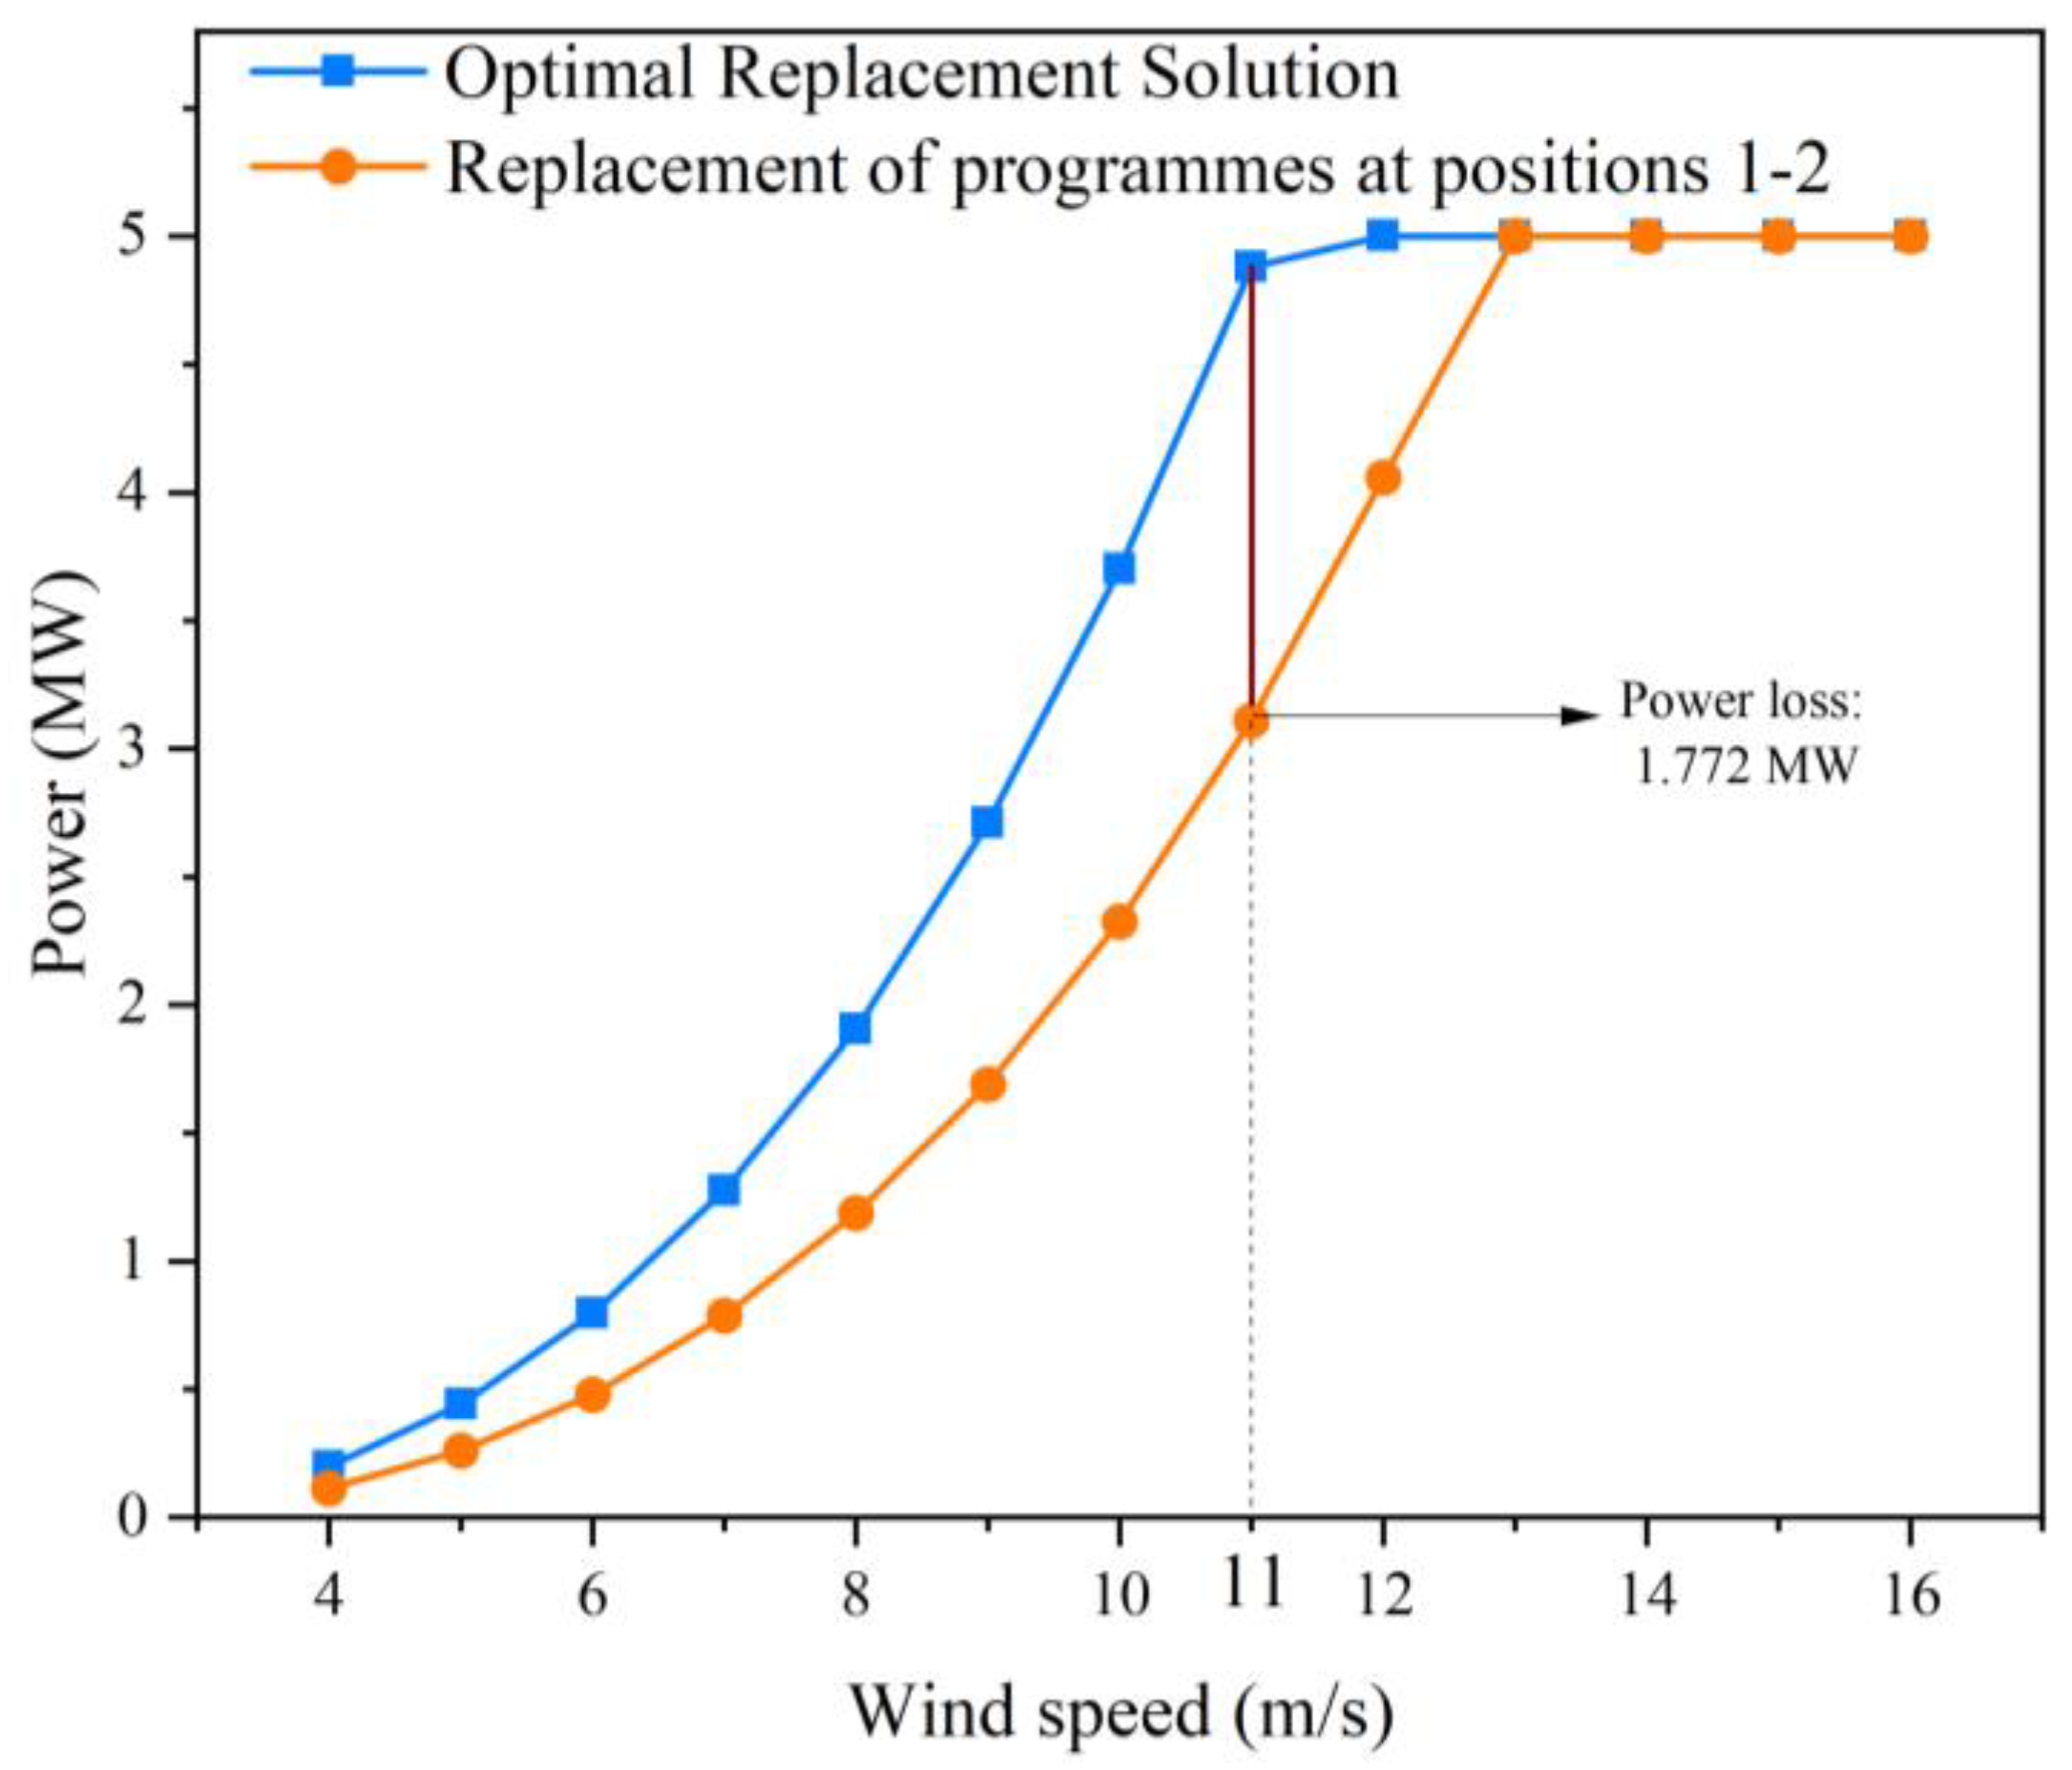
The replacement of a wind turbine can result in a significant change in output power, with the optimal replacement scheme potentially differing from the one in the middle of the wind farm by up to 1.772 MW. Additionally, there is a notable difference in the wind speed required for full power generation, with the optimal replacement scheme requiring 1.78 m/s more than the middle scheme. This is illustrated in Figure 5.
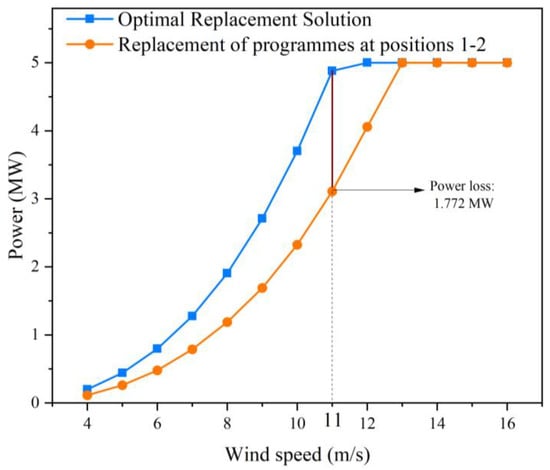
Figure 5.
A diagram of the difference in replacement power at different locations for a single unit.
By calculating the tail current and power output of the entire wind farm following the replacement of one to six large turbines, the optimal replacement method for maximizing the power output of the entire wind farm in a down-row arrangement under each replacement condition can be determined. This is illustrated in Figure 6.
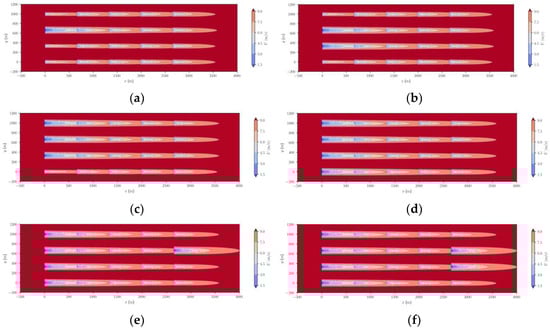
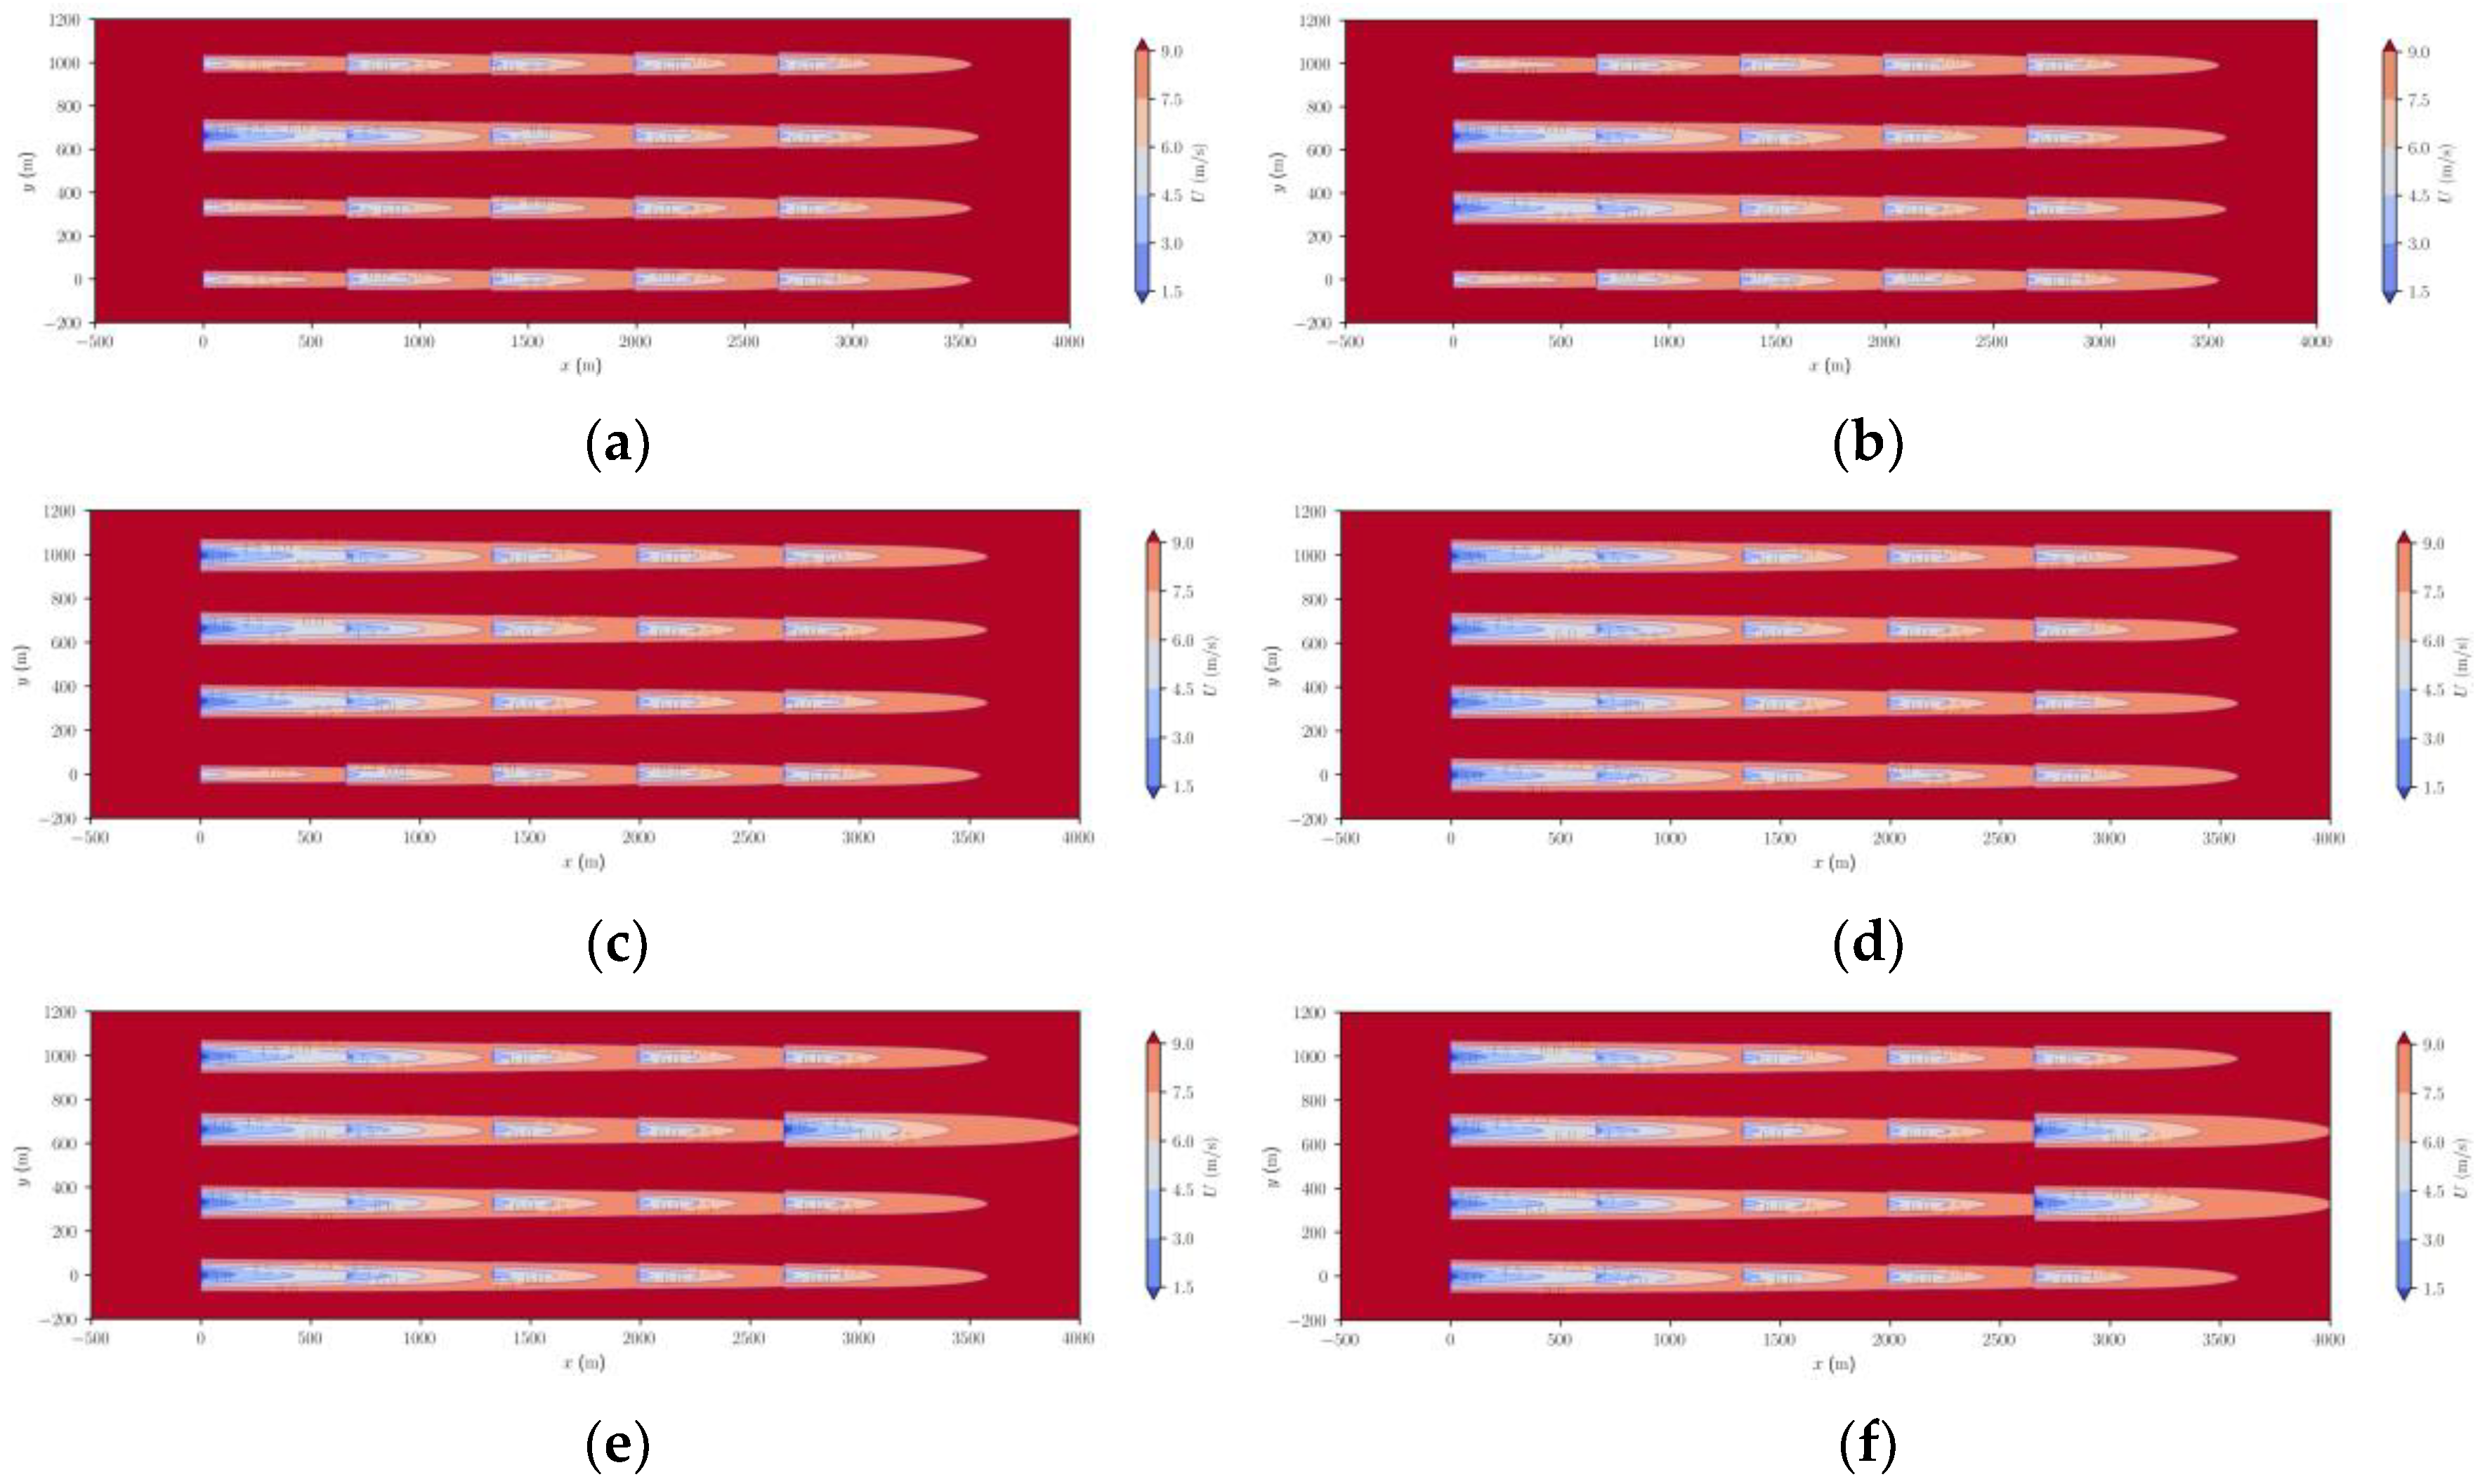
Figure 6.
A FLORIS evaluation of wake distribution corresponding to the maximum value of the whole wind farm power output for each condition in parallel rows arrangement. (a) Replace point: 2-1; (b) replace point: 2-1; 3-1; (c) replace point: 1-1; 2-1; 3-1; (d) replace point: 1-1; 2-1; 3-1; 4-1; (e) replace point: 1-1; 2-1; 2-2; 3-1; 4-1; and (f) replace point: 1-1; 2-1; 2-5; 3-1; 3-5; 4-1.
In the process of replacing large wind turbines with small wind turbines in the whole wind farm, when replacing one~four small wind turbines with large wind turbines, the replacement point that meets the maximum power output of the whole wind farm is always located in the first column of the whole wind farm. This result aligns with the analysis presented in Section 3.1, which suggests that installing large wind turbines upstream can enhance the power output of the entire wind farm. This phenomenon is in perfect agreement with the result analyzed in Section 3.1, which indicated that installing large wind turbines upstream is an effective method for increasing the power output of the entire wind farm. This is illustrated in Figure 6a–d.
It is also necessary to consider whether the wake stream of the large turbine in the first column of the field will affect the operation of the small turbines in the subsequent columns. A comparative analysis of Figure 6a–d reveals that the small wind turbines in the second column of the wind farm, situated adjacent to the large wind turbine, are significantly influenced by the latter’s tail current. In contrast, the small wind turbines in the third column exhibit minimal impact. The velocity distribution cloud diagram demonstrates that irrespective of whether a large wind turbine is positioned in front of the small wind turbines in the third column, the distribution of their tail current is identical to that observed in the absence of any influence from the large wind turbine. The velocity distribution is identical regardless of whether a large fan is positioned in front of the third row of small fans. Consequently, the impact of the turbine on the downstream small fans is confined to the rear of the column. This is attributed to the distance between the turbine’s front and back, allowing the turbine wake to fully develop and recover in the downstream 16 d. This reduces the influence on the remaining small fans at the rear of the turbine.
In the case of replacing five or six small turbines with larger turbines, in accordance with the aforementioned results, the optimal point for four of the five or six large turbine units replaced is located in the first column of the entire field. The optimal replacement points for the remaining one or two large turbines are selected in the last column of the entire field, as illustrated in Figure 6e,f. This is due to the fact that at 40 d, the wind field is sufficiently affected by the first column of turbines, the wake generated by the first column of turbines is fully recovered, and the installation of the remaining one or two turbines at this location allows for the maximization of the wind power captured by each turbine, thus maximizing the power output. Concurrently, the installation of the remaining one or two large turbines in the final row of the entire wind farm will prevent the wake generated by them from affecting the other small turbines (as there are no turbines positioned behind the large ones), thereby facilitating the maximization of the wind farm’s overall power output.
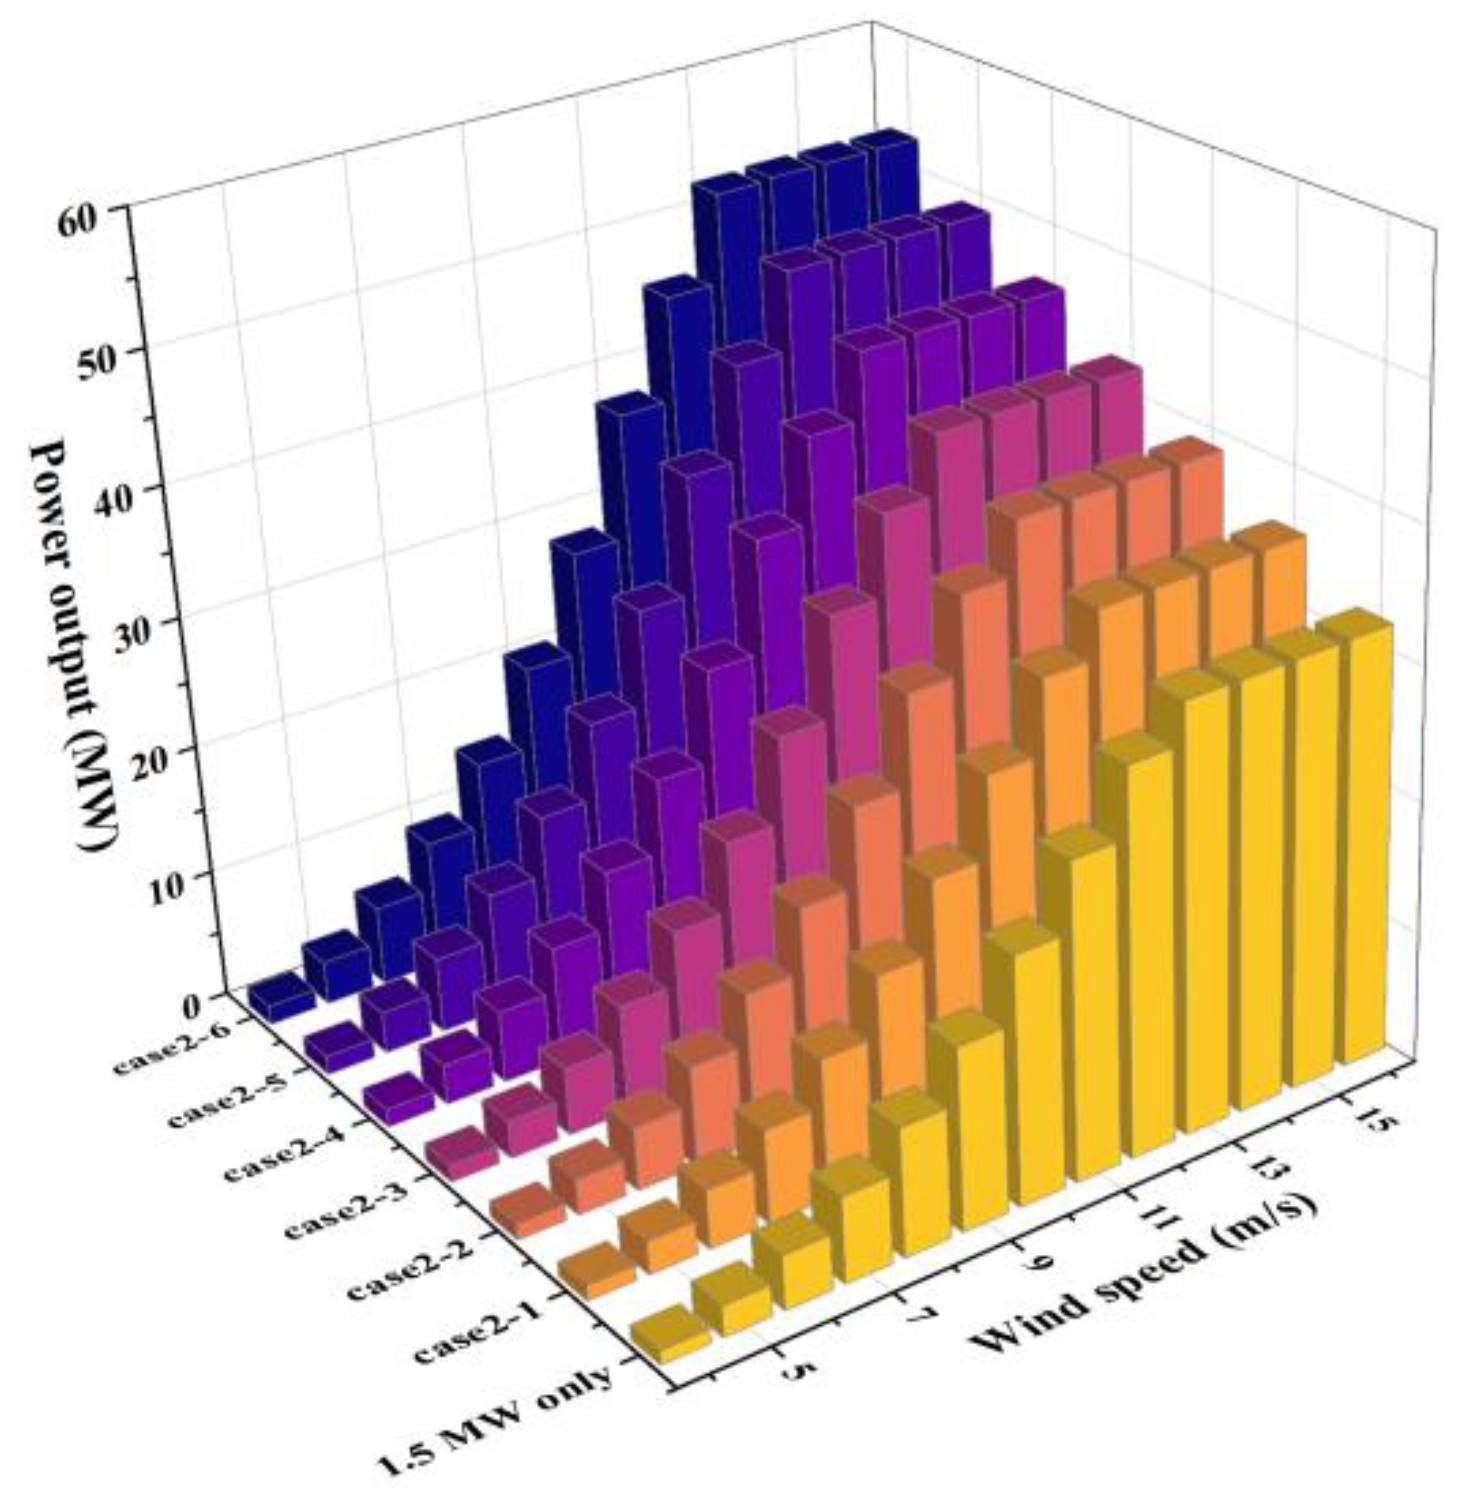
A comprehensive analysis of the replacement of one~six large turbines, based on the total power output of the wind farm, indicates that the replacement conditions can result in a greater total power output than that of the original wind farm (1.5 MW). Following the replacement of the large turbines, there will be no negative growth in the actual power output. For further details, please refer to Figure 7. In contrast, when the large turbines are replaced with small ones, the overall power output of the wind farm exhibits a regular and continuous increase. This overall increase is also statistically significant.

Figure 7.
The whole wind farm power output of the wind farm for each condition in parallel rows arrangement.
3.1.3. Output for Whole-Farm of Staggered Arrangement
In the case of the replacement of wind turbines in a staggered arrangement, the optimal replacement points for large wind turbines are also identified using the labeling method described in Section 3.2. By calculating the tail current and power output of the entire wind farm following the replacement of one to six large turbines, the replacement method that optimizes the power output of the entire wind farm in a staggered arrangement under each replacement condition is identified. This is illustrated in Figure 8.
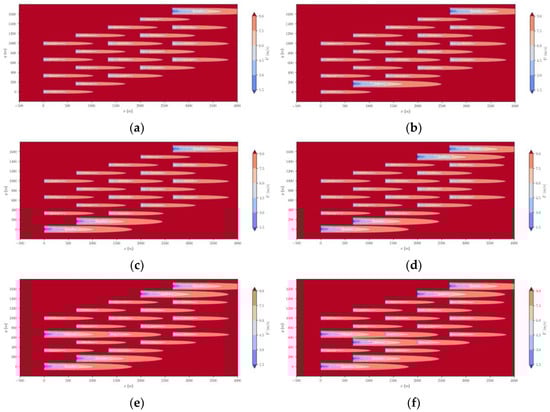
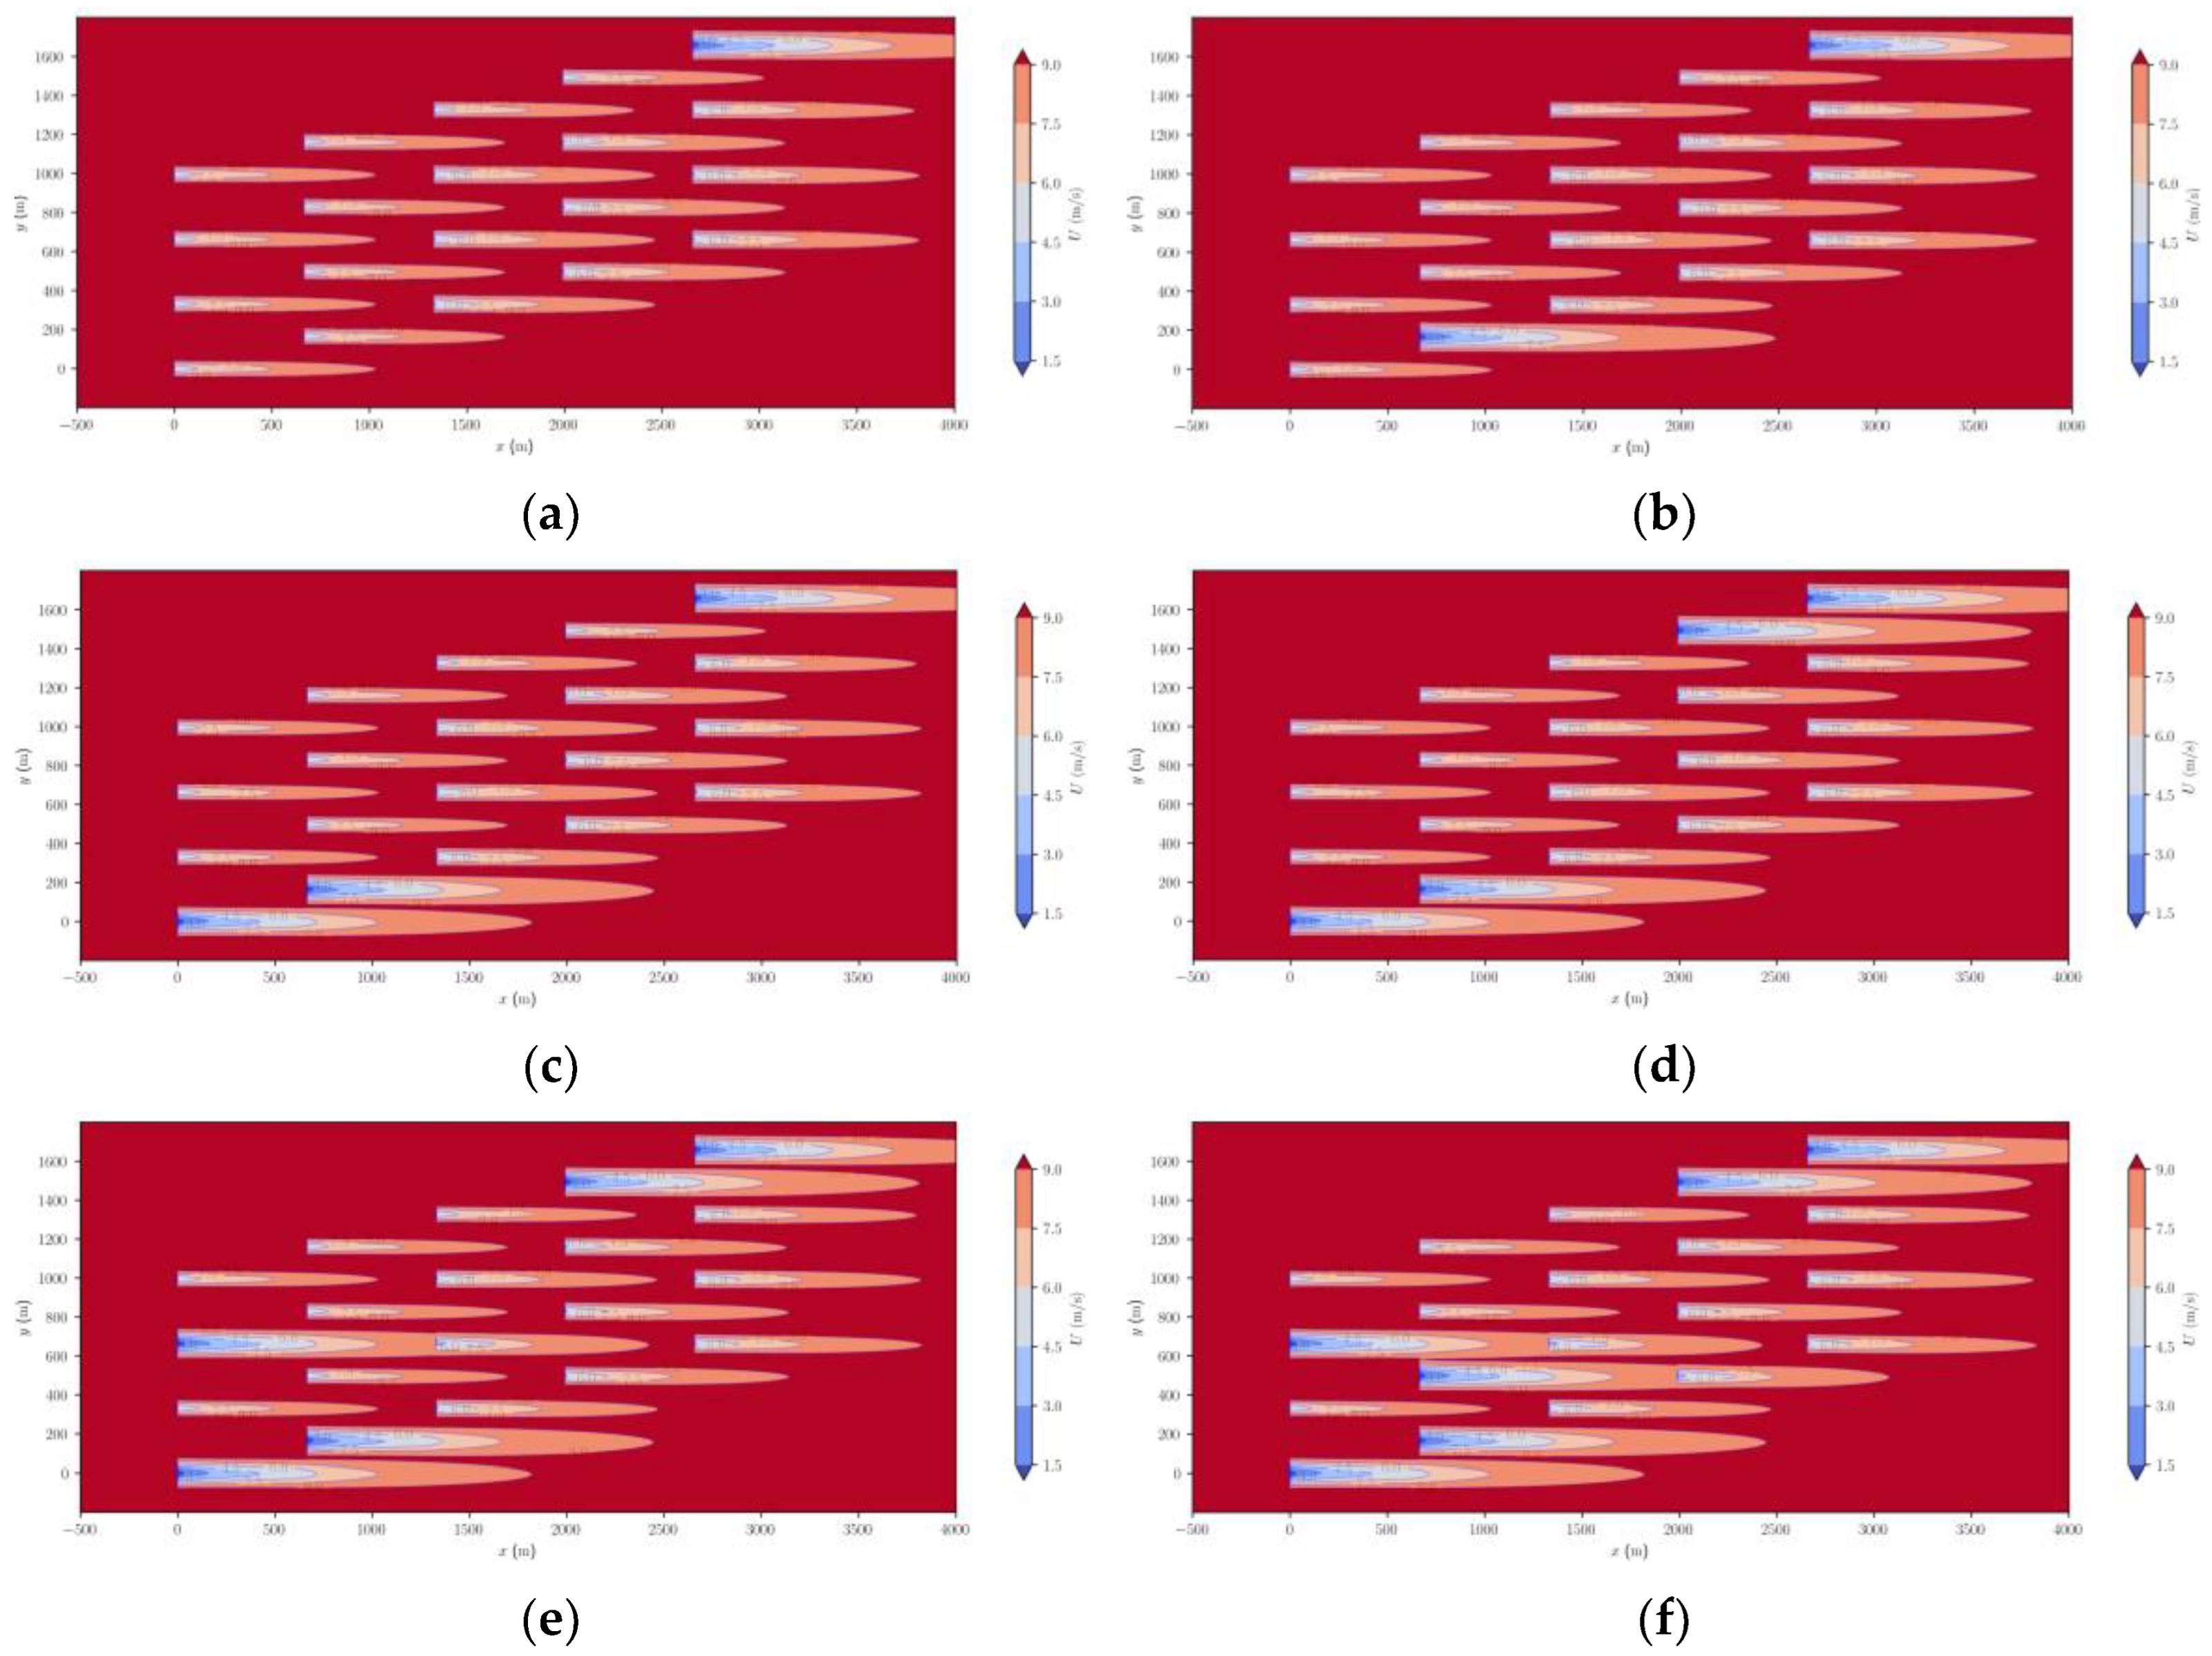
Figure 8.
A FLORIS evaluation of wake distribution corresponding to the maximum value of the whole wind farm power output for each condition in staggered rows arrangement. (a) Replace point: 1-5; (b) replace point: 1-5; 4-2; (c) replace point: 1-5; 4-1; 4-2; (d) replace point: 1-4; 1-5; 4-1; 4-2; (e) replace point: 1-1; 2-1; 2-2; 3-1; 4-1; and (f) replace point: 1-1; 1-4; 1-5; 2-1; 4-1; 4-2.
Upon examination of Figure 8a–d, it becomes evident that the optimal locations for replacing one to four small turbines with larger turbines are the lower left and upper right corners of the wind farm. This is because these locations facilitate the maximization of the power output of the entire wind farm. As illustrated in the figure, the replacement of small turbines in the lower left and upper right corners with larger turbines has the effect of eliminating wake currents that would otherwise affect other turbines in the wind farm. This is one of the advantages of the staggered arrangement of the wind farm, which is designed to ensure that all turbines are able to capture the best quality of wind energy. In essence, the methodology employed for the selection of large turbines to occupy the optimal locations appears to diverge from the prescribed approach delineated in Section 3.1. While the fifth column is initially prioritized, the upper right corner, despite not formally belonging to the first column, exhibits a flow field analogous to that of the first column. This is attributed to the absence of obstructing turbines in the immediate vicinity, effectively rendering it as if it were situated within the first column.
The aforementioned point can also be corroborated through an examination of Figure 8e,f. Upon replacing five or six small turbines with larger ones, four of the larger turbines are allocated to the wind farm in the lower-left and upper-right corners with the objective of maximizing the farm’s overall power output. The remaining large turbines, however, continue to adhere to the conclusions drawn in Section 3.2, namely, they are situated in the first column of the entire farm with the intention of maximizing the power output.
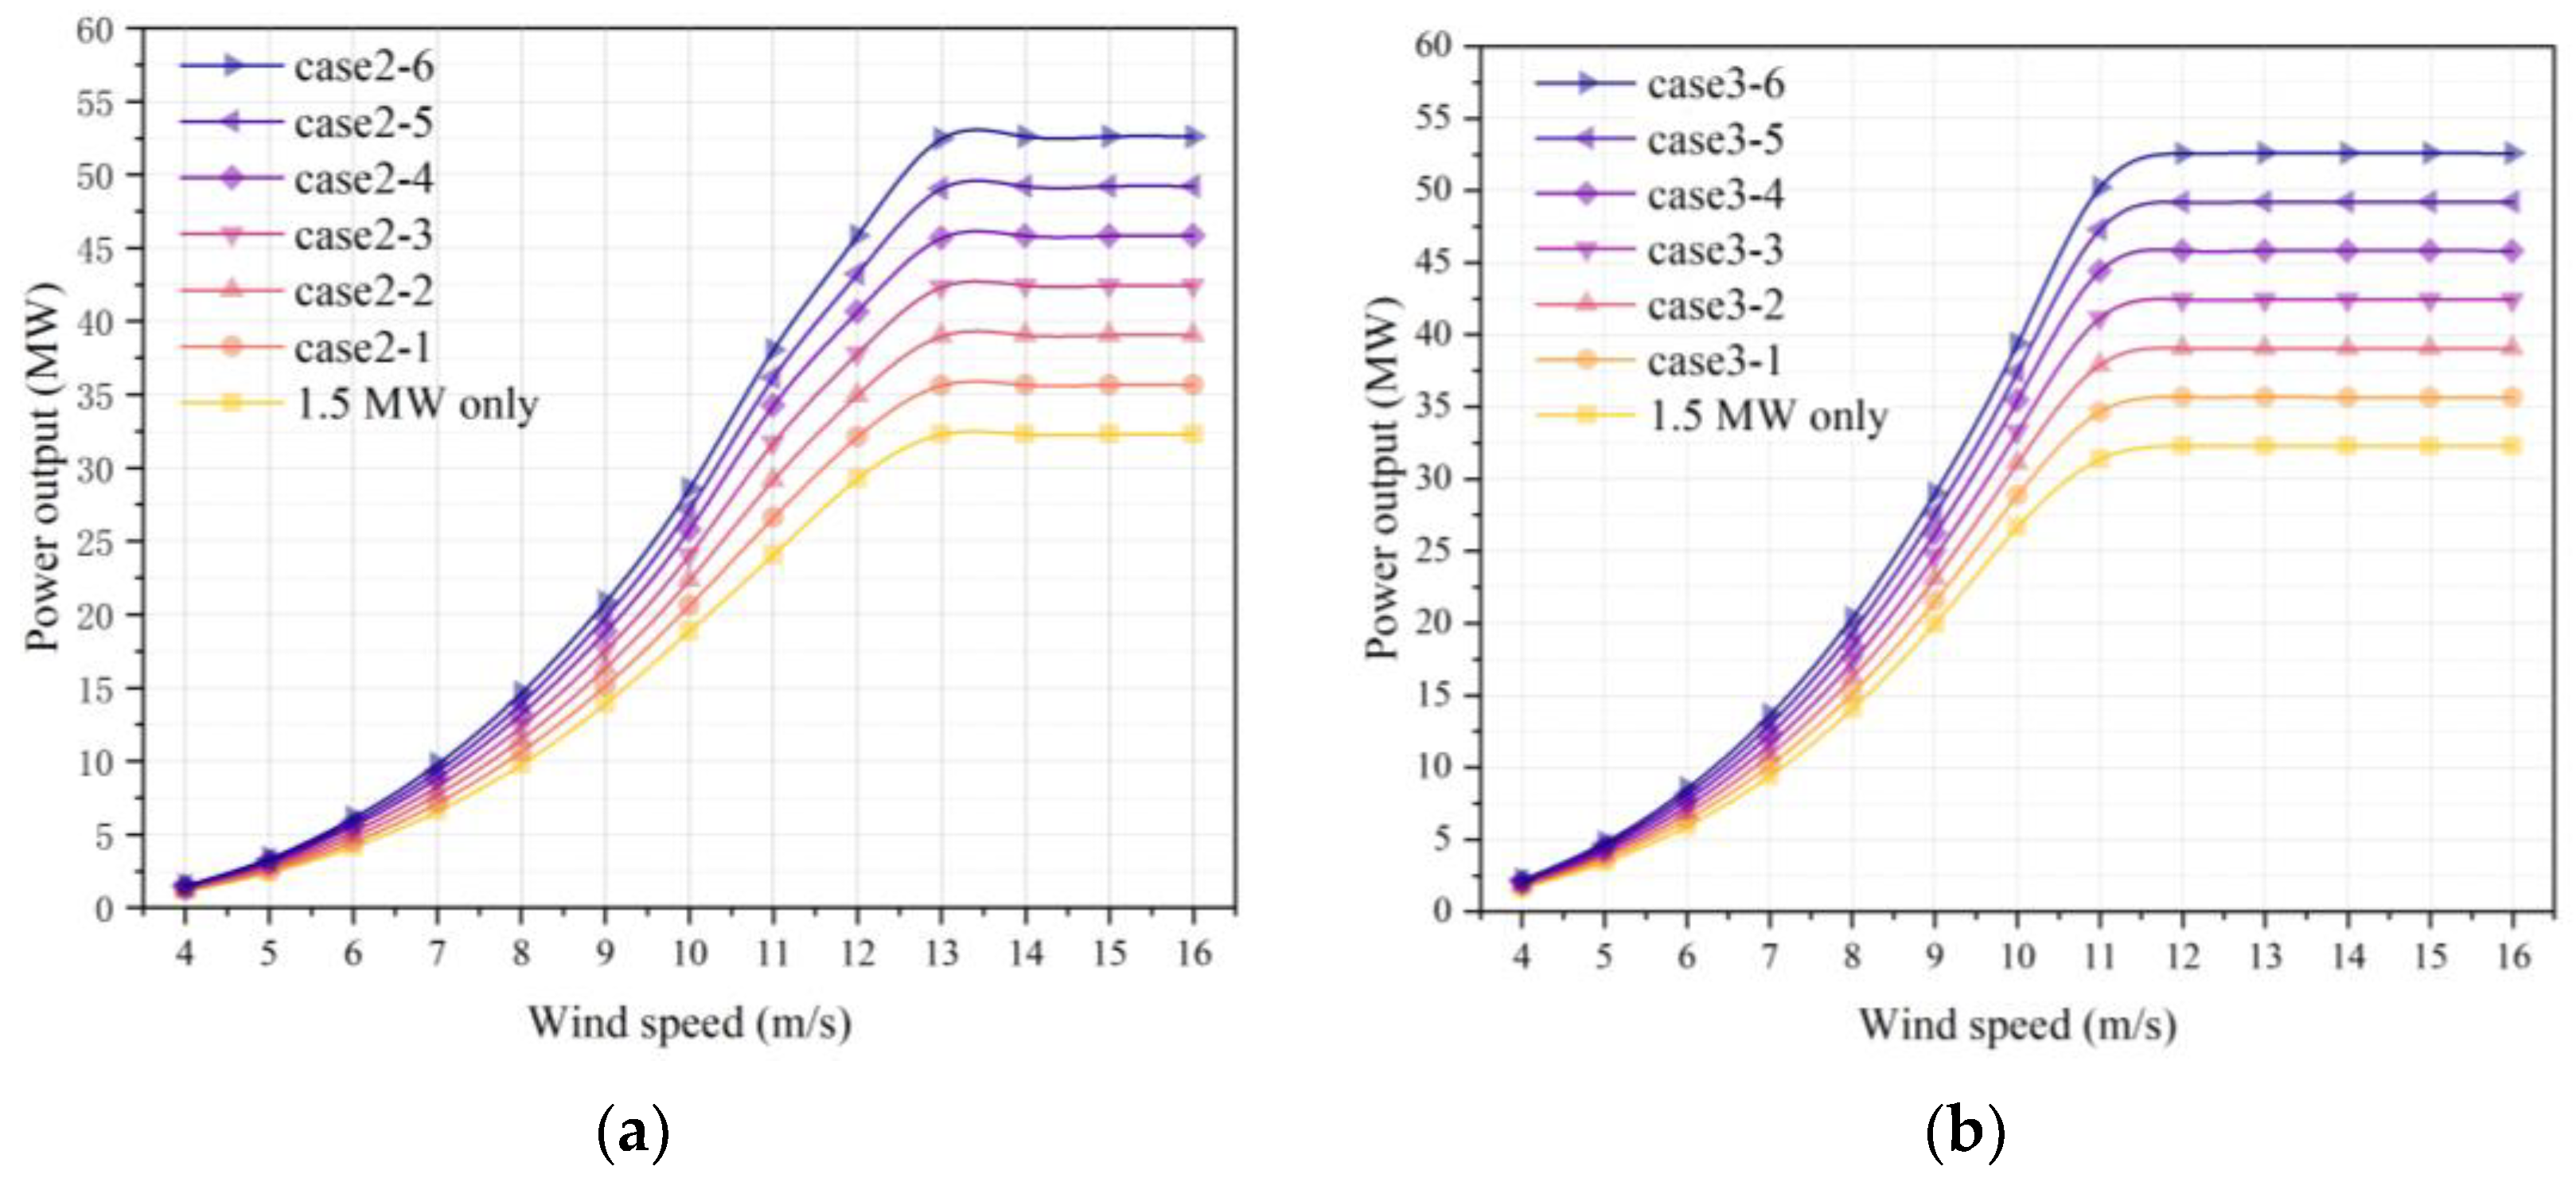
A comprehensive analysis of the replacement of 1~6 large turbines reveals that the change rule of the entire field power output when replacing large turbines with small ones in a staggered row configuration of wind farms is analogous to that observed in a down-row arrangement. Specifically, after replacing the large turbines, the typical output of the wind farms undergoes a notable alteration. Additionally, there is no indication of a decline in power generation, as illustrated in Figure 9.
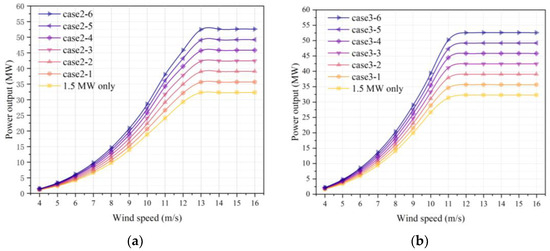
Figure 9.
A comparison of the effect of different conditions on the output of the wind farm for parallel and staggered arrangements. (a) The power output of Case 2; (b) the power output of Case 3.
3.1.4. Overall Analysis
In consideration of the aforementioned results, it can be concluded that the installation of larger wind turbines in place of smaller ones has the potential to enhance the overall field power output, regardless of whether the wind farm is arranged in a linear or staggered configuration. Additionally, the impact of this turbine replacement may vary depending on the specific row within the wind farm, as illustrated in Figure 9. The overall power output of a wind farm with staggered rows is more responsive to changes in wind speed. Therefore, when replacing smaller turbines with larger ones, it is essential to consider the original turbine locations within the wind farm to optimize the overall power output under complex point layouts. Consequently, when replacing smaller wind turbines with larger ones in operational wind farms, it is essential to consider the original wind turbine locations in a comprehensive manner to optimize the power output of the entire field under the complex point arrangement.
3.2. Impact of Wind Turbine Replacement on Its Downstream Turbines
In order to gain a deeper understanding of the influence of large wind turbines on the power output of smaller turbines, this section examines the impact of replacing smaller turbines with larger ones on the overall power output of wind farms. It considers the effect of installing larger turbines in rows and columns and investigates the underlying mechanisms by which this change affects the power output of the entire wind farm.
3.2.1. Output for Each Column of Parallel Arrangement
In examining the power output of the entire row of wind turbines following the replacement of smaller turbines with larger ones, the operational conditions corresponding to replacement point 2-1 in Section 3.1.2 are selected for individual analysis. The resulting power output of the entire row of wind turbines is illustrated in Figure 10.
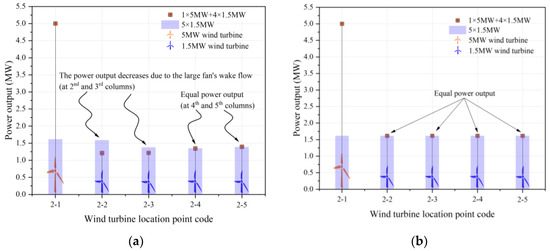
Figure 10.
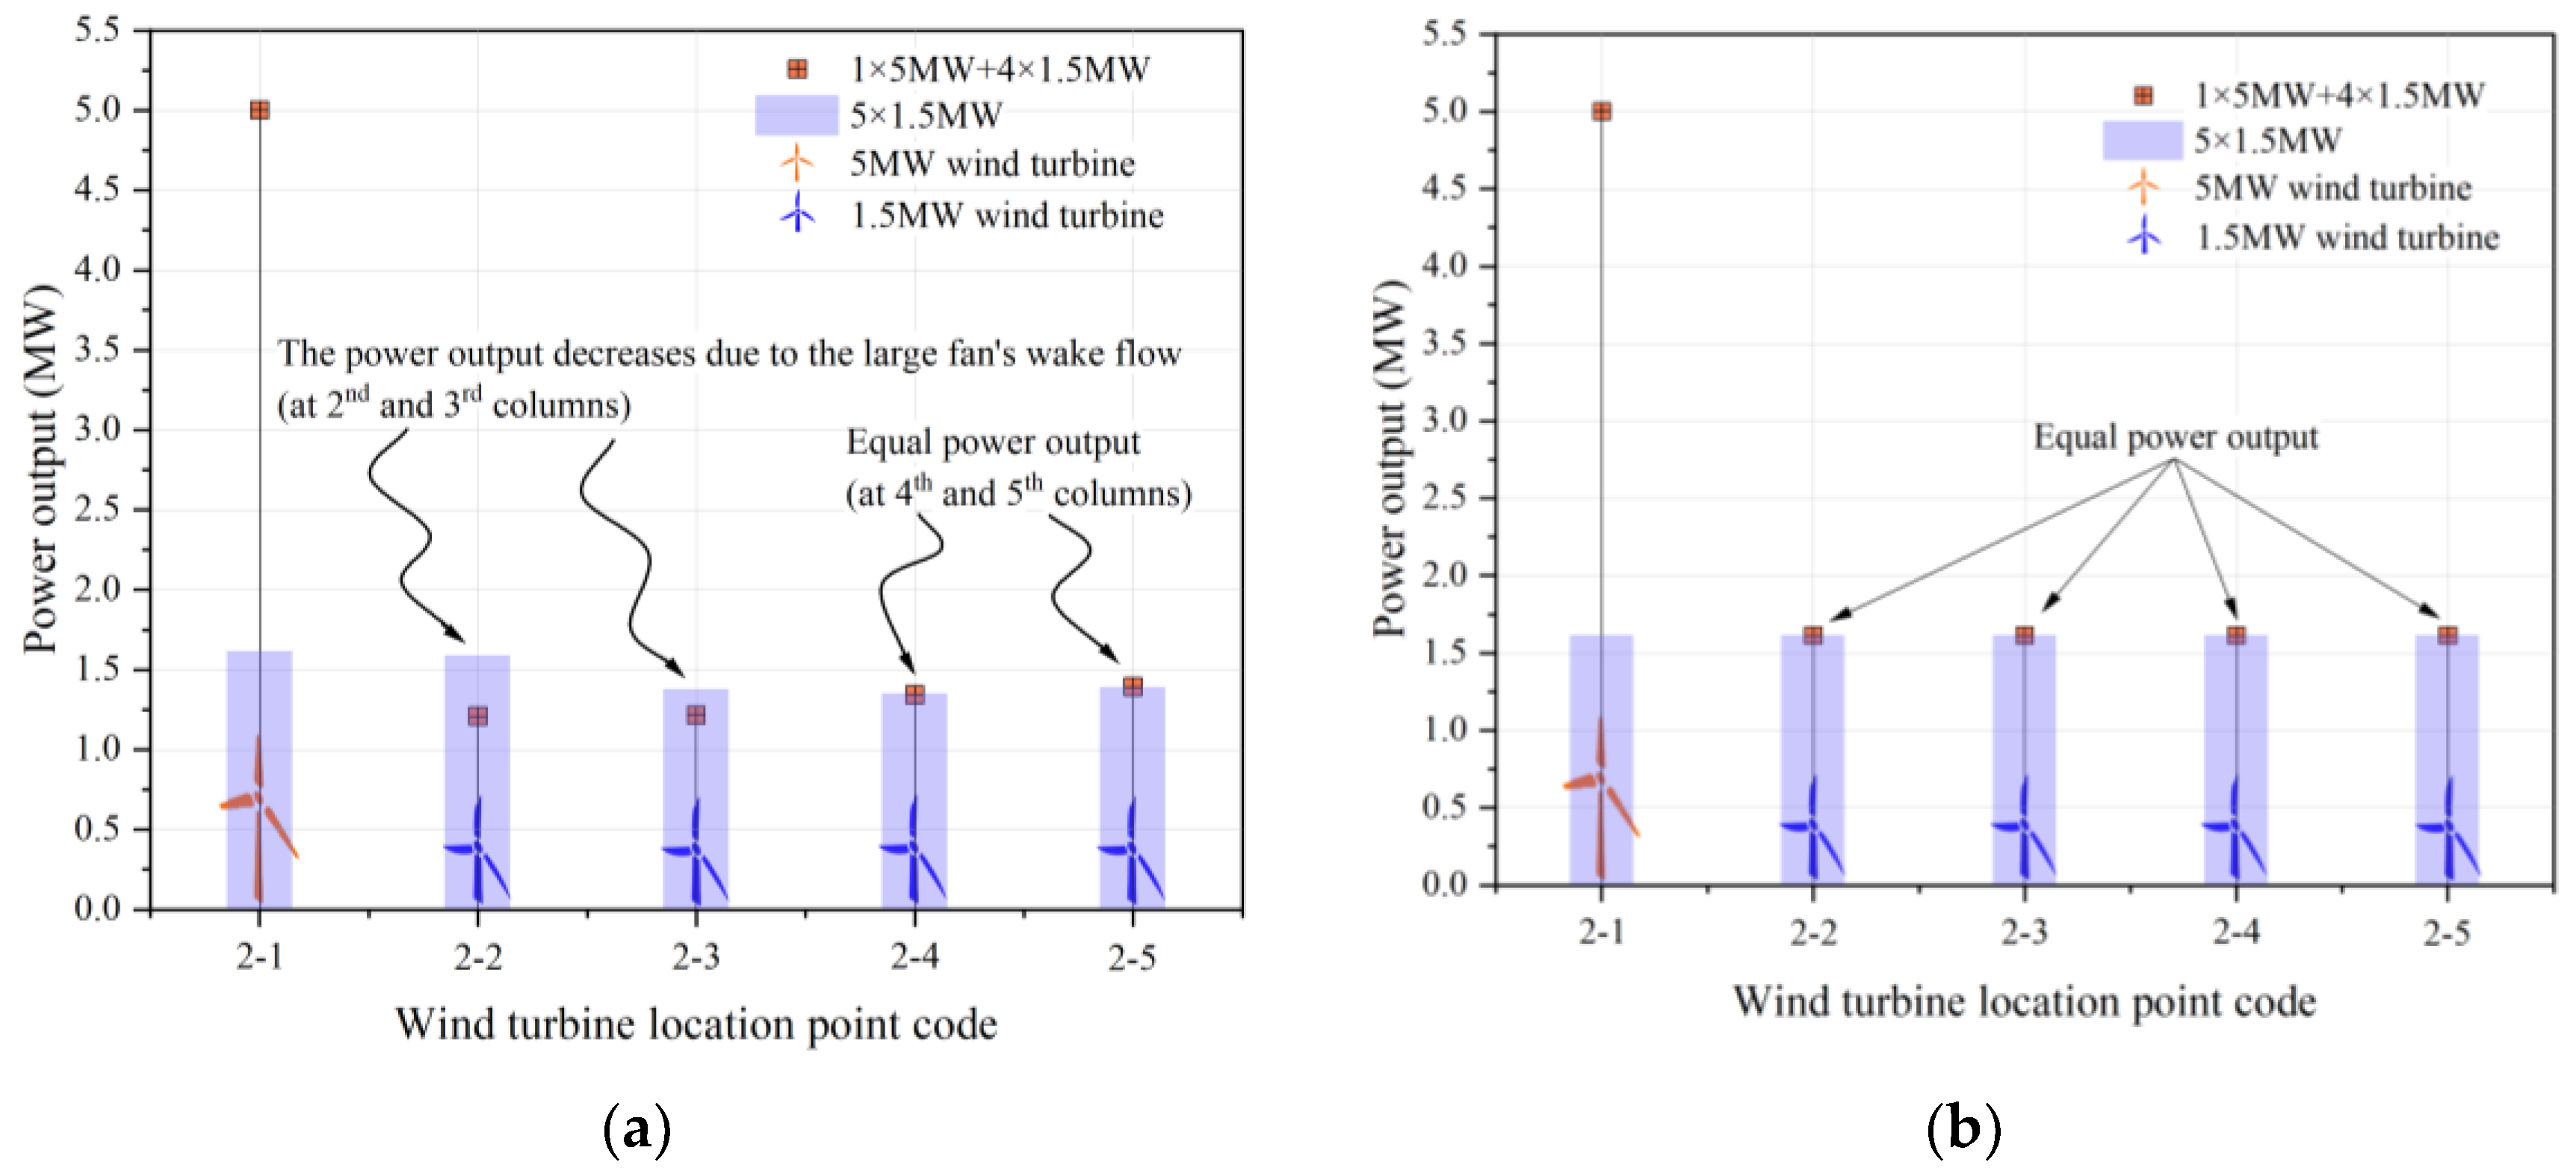
The power output of each unit after replacing the large turbines. (a) The power output at 12 m/s; (b) the power output at 16 m/s.
Similarly, when examining the aggregate power output of each row of wind turbines after the replacement of the smaller turbines with larger ones, a comparative analysis is conducted with respect to the six optimal operational conditions outlined in Section 3.1.2. The total power output of each row of wind turbines is presented in Figure 10.
At a wind speed of 12 m/s, the replacement of the upstream small fan with a large fan results in the downstream placement of one to two small fans being affected by the tail current of the upstream large fan. This leads to a notable reduction in their power outputs in comparison to the pre-replacement levels, as illustrated in Figure 10a. The power reduction caused by the upstream large turbine wake stream is mitigated as the downstream small turbines’ points gradually move away from the large turbine. For instance, the small turbine located at point 2-2 has a power reduction of approximately 0.377 MW (approximately 23.77% of the power generated by a 1.5 MW wind turbine at a wind speed of 12 m/s) due to the large turbine wake stream. Furthermore, the power output reduction gradually diminishes as the points move backward, as detailed in Table 3.
Table 3.
Power output of wind turbines in sequence wind farms after replacement by larger ones.
At a wind speed of 16 m/s, despite the wake of the large turbine at the front exerting an influence downstream due to the overall wind speed, this impact is not reflected in the limitation of the maximum power of the small turbine, as illustrated in Figure 10b. This is due to the fact that although the energy transported by the wind as it flows through the large turbine is diminished, it is still capable of driving the small turbine to operate at its maximum generating capacity.
It can be concluded that only at high wind speeds can the effect of the turbine wake on the power output of the small turbine be disregarded. Conversely, when the wind speed is slightly reduced, the effect of the turbine on the downstream small turbine remains significant. However, the power output of the wind turbines in the entire row increases following the addition of the large turbine. This is evidenced by the fact that the incremental power output of the large turbine after replacement is sufficient to compensate for the loss of power output of the small turbine.
Figure 11 illustrates that the replacement of the initial row of small turbines with larger turbines at varying wind speeds results in a reduction in the power output of the subsequent small turbines. However, this issue is progressively mitigated with the increase in wind speed. At medium and high wind speeds, the percentage of the small turbine’s loss of power in relation to its maximum generating power gradually decreases. Consequently, the sequence wind farm’s substitution of small turbines with larger turbines exhibits an obvious advantage at these wind speeds.
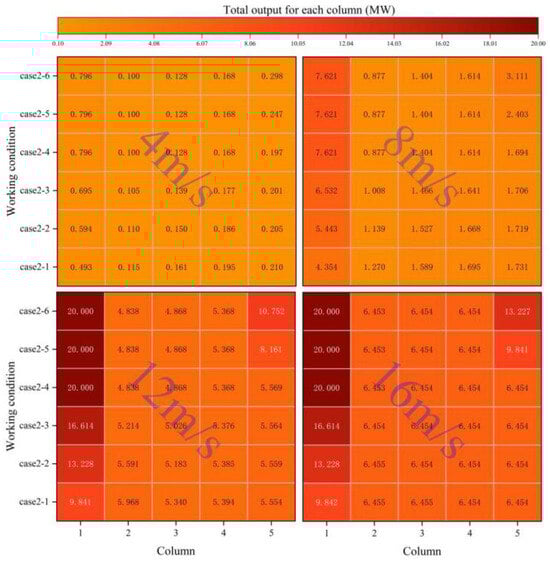
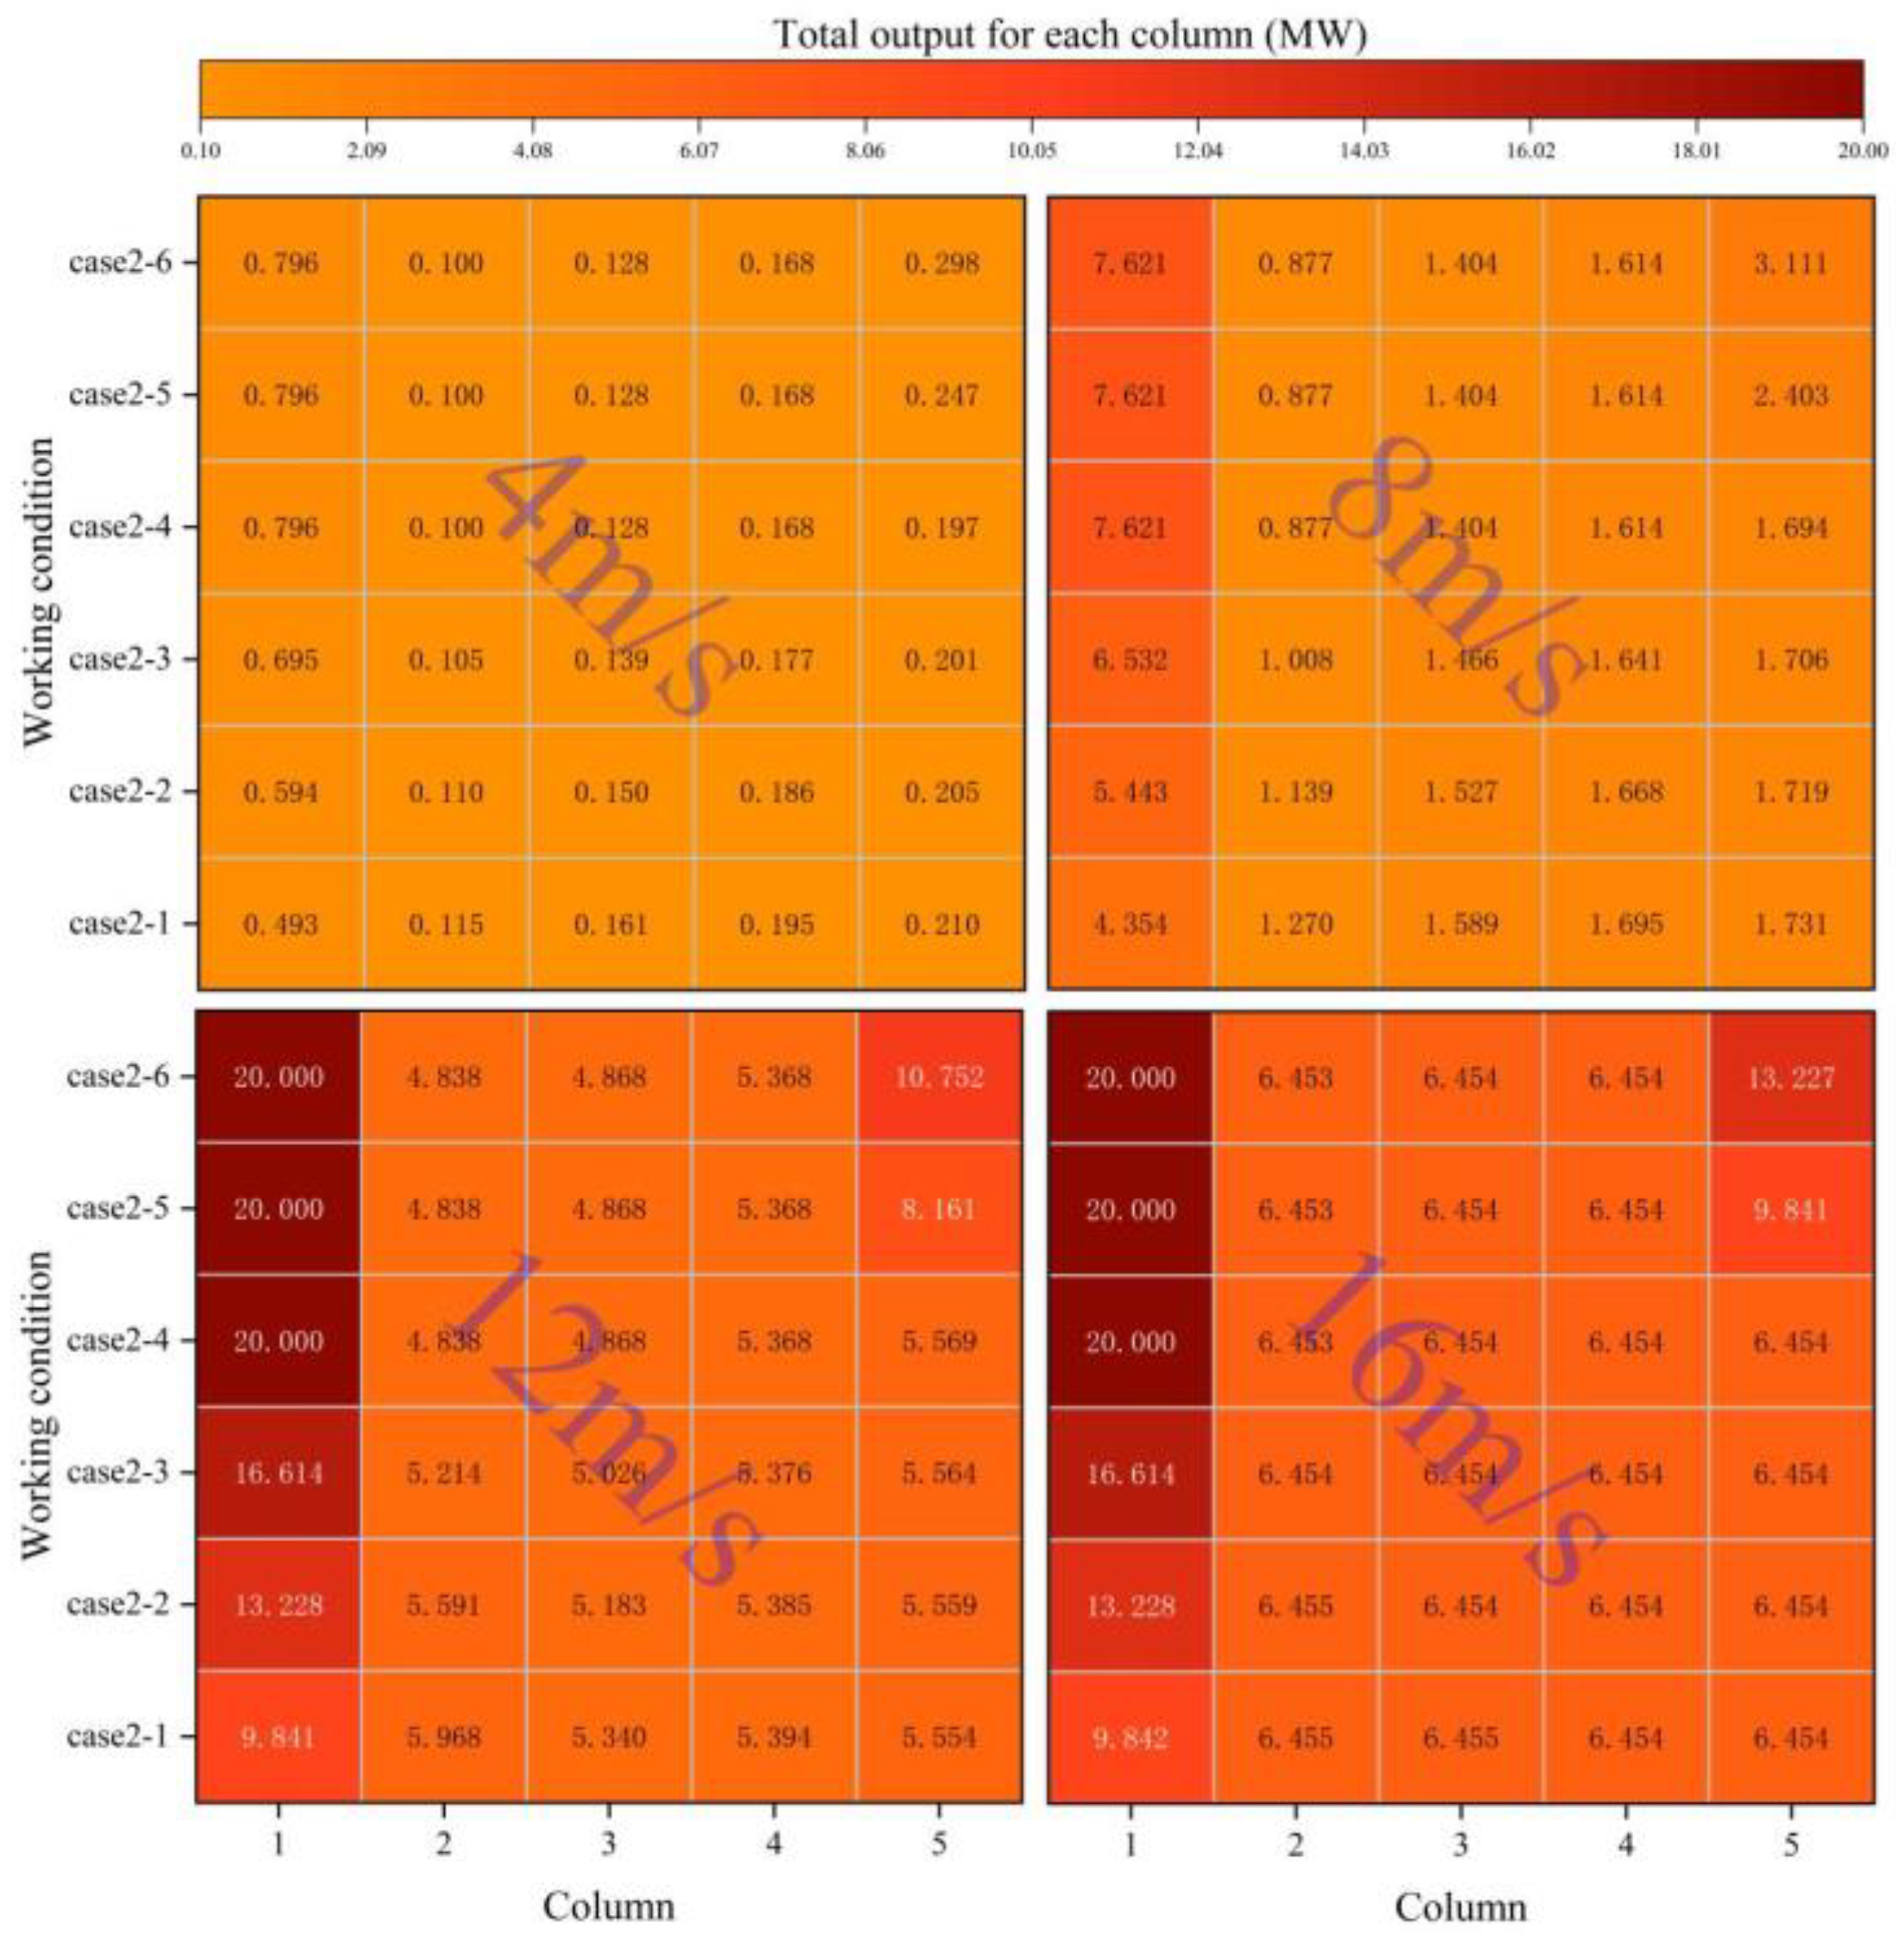
Figure 11.
The total power output of the whole train of wind turbines under different operating conditions.
3.2.2. Output for Each Turbine of Staggered Arrangement
In accordance with the staggered arrangement, the optimal locations for replacing one to four large wind turbines are situated in the two diagonal regions of the wind farm. This configuration ensures that the substitution of large for small replacements will not affect the power output of the other wind turbines. The following section will therefore concentrate on the impact of replacing five or six turbines on the overall power output.
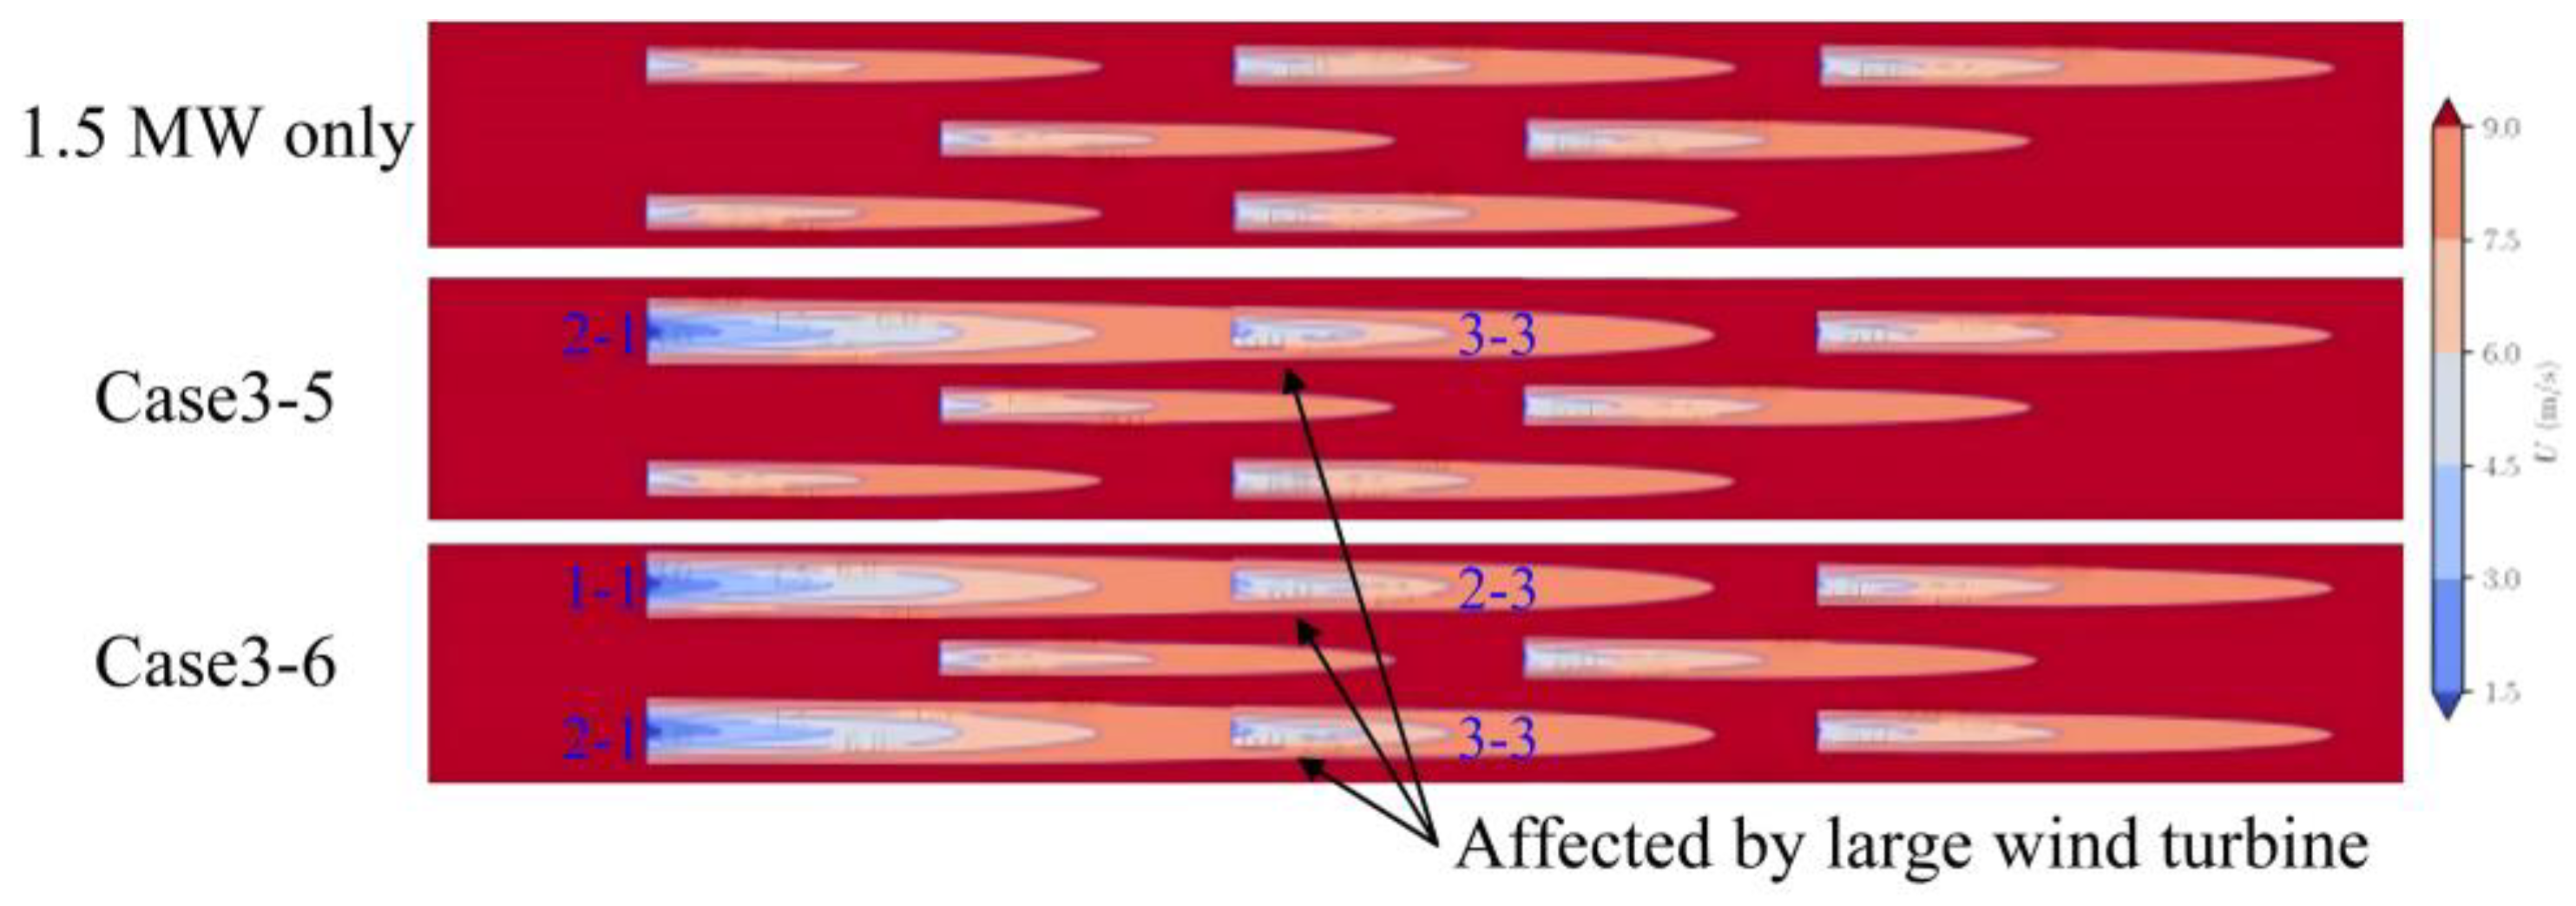
The replacement of a small fan will result in an alteration of the power output of the fan situated behind it, which is of a larger capacity. Due to the staggered row arrangement, the small fan with a reduced power output is often located in the next row and the last two columns of the row where the large fan is located (see Figure 12 for details). The power output of the small fan is reduced due to the influence of the large fan in the upstream direction. However, the inlet conditions of the small fan are the same under the same wind speed for both Case 3-5 and Case 3-6. Therefore, the power reduction of a single small fan has the same value (see Table 4 for details).
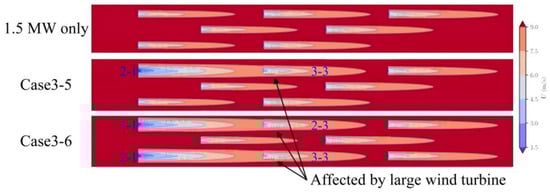
Figure 12.
The situation of the location of the affected small turbines.
Table 4.
Wind turbine power output after substitution of large for small replacements in staggered wind farms.
In a wind farm with a staggered row arrangement, the installation of a large turbine upstream has a lesser impact on the power output of a small turbine downstream, due to the significant increase in spacing between the two turbines. The wake stream of the large turbine recovers more effectively before entering the small turbine downstream. Similarly, the power output deficit of the small turbines is mitigated with the increase in the inlet wind speed of the wind farm. That is to say, as the wind speed increases, the wind energy captured by the small turbines also increases, reaching full power at 13 m/s despite the influence of the large turbines upstream of them.
4. Conclusions
This paper employed a simulation based on two types of wind farm rows, namely parallel and staggered rows, to identify optimal replacement points for large turbines and to analyze the power output of the entire wind farm. The simulation utilized the FLORIS software to assess the potential for increasing the wind farm capacity by substituting large turbines for smaller ones. The characteristics of the turbine wake flow under each optimal replacement condition were subjected to comprehensive analysis in the paper, and the mechanism of installing large turbines at each optimal replacement point for the optimization of the overall power output of the wind farm was revealed from the perspective of wind aerodynamics. This study provides guidance for existing wind farms seeking to optimize their overall power output by replacing small turbines with larger ones. It also offers a theoretical framework for the sequential selection of large turbines to replace small ones.
In light of the findings presented in this study, a number of significant conclusions and recommendations can be drawn:
- (1)
- The impact of different replacement schemes for wind turbines on output power is greater when the replacement wind turbine is situated in the middle of the original wind farm. This is due to the greater influence of the wake effect. Furthermore, the wake generated by the replacement wind turbine has a greater impact on the subsequent wind turbines. For example, replacing one wind turbine results in a reduction of 1.772 MW in output power compared to the optimal replacement scheme at a wind speed of 11 m/s. Furthermore, the discrepancy in power increases with the addition of replacement units. The implementation of an optimal replacement scheme can mitigate the impact of the tail current during the replacement process of a wind farm, thereby enhancing the economic viability of the wind farm.
- (2)
- In the event of a wind turbine requiring replacement, those situated in a straight row will be replaced in the direction of the incoming wind from the wind farm. The last row of the wind farm will then be considered as a replacement point for the large wind turbine. In the case of a wind farm comprising a series of staggered rows, priority shall be accorded to the installation of a large wind turbine in the diagonal area of the wind farm. Furthermore, no other wind turbines shall be situated behind the point corresponding to this diagonal area. Secondly, consideration shall be given to setting the point corresponding to the first column of the wind turbine of the entire wind farm as the replacement point for the large wind turbine.
- (3)
- In the actual situation, the arrangement of wind turbines in the wind farm does not necessarily follow the full row or the wrong row, or follow the above two methods of arranging the wind turbines. At this time, consideration should be given to the positioning of large wind turbines in order to achieve a comprehensive solution. This should be conducted in a way that brings the large wind turbines closer to the upstream of the wind farm, while simultaneously ensuring that the number of turbines behind them is kept to a minimum.
- (4)
- In light of the findings presented in this paper, the authors’ team also identified a potential solution to mitigate the impact of wake effects on small wind turbines downstream of replacement points. This can be achieved by lifting the hub center height of the large wind turbine, which may help to prevent a decrease in the power output. By reducing the overlap of the projected areas of the wind wheels of the small and large wind turbines in the direction of the incoming wind as much as possible, the overall power generation of the WTGs can be increased.
This paper investigated the in-situ replacement of retired wind turbines in wind farms. Other researchers have provided excellent insights into the study of retired wind turbines. For example, Wang et al. [40] conducted a comprehensive analysis of the retrofitting of old wind farms and designed a wind farm smart grid power generation post-evaluation platform based on the microservice framework and big data analysis technology. It offers technical assistance and enhancement strategies for the renovation of existing wind farms and the construction of new ones. While Sensi et al. [41] have conducted a high-power replacement of an operational wind farm in Italy, they have also analyzed various wind farm configurations and evaluated their output power and unit capacity. The viability of these configurations has been confirmed through on-site inspections.
Furthermore, the study of wake after wind turbine replacement in wind farms can also consider wind turbine yawing, wind turbine shutdowns, and numerous additional solutions to mitigate the impact of wind farm wake. These topics will be discussed in greater detail in subsequent papers.
Author Contributions
Conceptualization, W.T.; Data curation, L.L.; Formal analysis, X.Z.; Methodology, W.T.; Project administration, L.Z.; Supervision, L.Z.; Visualization, Y.Z.; Writing—original draft, J.W.; Writing—review and editing, F.W. All authors have read and agreed to the published version of the manuscript.
Funding
This research received no external funding.
Institutional Review Board Statement
Not applicable.
Informed Consent Statement
Not applicable.
Data Availability Statement
Some or all data, models, or codes that support the findings of this study are available from the corresponding author upon reasonable request.
Conflicts of Interest
Authors Wenxin Tian, Jiawei Wan and Xiuyong Zhao was employed by the company China Energy Science and Technology Research Institute Co., Ltd. The authors declare no conflicts of interest.
References
- Cao, J.; Nyborg, C.M.; Feng, J.; Hansen, K.S.; Bertagnolio, F.; Fischer, A.; Sørensen, T.; Shen, W.Z. A new multi-fidelity flow-acoustics simulation framework for wind farm application. Renew. Sustain. Energy Rev. 2022, 156, 111939. [Google Scholar] [CrossRef]
- Wang, Q.; Luo, K.; Wu, C.; Tan, J.; He, R.; Ye, S.; Fan, J. Inter-farm cluster interaction of the operational and planned offshore wind power base. J. Clean. Prod. 2023, 396, 136529. [Google Scholar] [CrossRef]
- Yan, R.; Wang, J.; Huo, S.; Qin, Y.; Zhang, J.; Tang, S.; Wang, Y.; Liu, Y.; Zhou, L. Flexibility improvement and stochastic multi-scenario hybrid optimization for an integrated energy system with high-proportion renewable energy. Energy 2023, 263, 125779. [Google Scholar] [CrossRef]
- Zhang, L.; Li, J.; Xu, X.; Liu, F.; Guo, Y.; Yang, Z.; Hu, T. High spatial granularity residential heating load forecast based on Dendrite net model. Energy 2023, 269, 126787. [Google Scholar] [CrossRef]
- Xu, X.; Hu, S.; Shi, P.; Shao, H.; Li, R.; Li, Z. Natural phase space reconstruction-based broad learning system for short-term wind speed prediction: Case studies of an offshore wind farm. Energy 2023, 262, 125342. [Google Scholar] [CrossRef]
- Notice of the National Energy Administration Prints Measures for the Management of Wind Farm Renovation, Upgrading and Decommissioning. Available online: https://www.gov.cn/gongbao/2023/issue_10626/202308/content_6897055.HTML (accessed on 5 June 2023).
- Wu, C.; Wang, Q.; Luo, K.; Fan, J. A coupled turbine-interaction wind farm parameterization in the Weather Research and Forecasting model. Energy Convers. Manag. 2023, 283, 116919. [Google Scholar] [CrossRef]
- Wang, Q.; Luo, K.; Wu, C.; Mu, Y.; Tan, J.; Fan, J. Diurnal impact of atmospheric stability on inter-farm wake and power generation efficiency at neighboring onshore wind farms in complex terrain. Energy Convers. Manag. 2022, 267, 115897. [Google Scholar] [CrossRef]
- Xu, X.; Hu, S.; Shao, H.; Shi, P.; Li, R.; Li, D. A spatio-temporal forecasting model using optimally weighted graph convolutional network and gated recurrent unit for wind speed of different sites distributed in an offshore wind farm. Energy 2023, 284, 128565. [Google Scholar] [CrossRef]
- Yang, M.; Guo, Y.; Huang, Y. Wind power ultra-short-term prediction method based on NWP wind speed correction and double clustering division of transitional weather process. Energy 2023, 282, 128947. [Google Scholar] [CrossRef]
- Xu, X.; Li, B.; Qiao, Z.; Shi, P.; Shao, H.; Li, R. Caputo-Fabrizio fractional order derivative stochastic resonance enhanced by ADOF and its application in fault diagnosis of wind turbine drivetrain. Renew. Energy 2023, 219, 119398. [Google Scholar] [CrossRef]
- Chamorro, L.P.; Tobin, N.; Arndt, R.; Sotiropoulos, F. Variable-sized wind turbines are a possibility for wind farm optimization. Wind Energy 2014, 17, 1483–1494. [Google Scholar] [CrossRef]
- Porté-Agel, F.; Wu, Y.T.; Chen, C.H. A numerical study of the effects of wind direction on turbine wakes and power losses in a large wind farm. Energies 2013, 6, 5297–5313. [Google Scholar] [CrossRef]
- Tian, W.; Ozbay, A.; Wang, X.D.; Hu, H. Experimental investigation on the wake interference among wind turbines sited in atmospheric boundary layer winds. Acta Mech. Sin. 2017, 33, 742–753. [Google Scholar] [CrossRef]
- Zhu, Y.; Guo, Y.; Hu, T.; Wu, C.; Zhang, L. Wind Farm Layout Optimization Based on Dynamic Opposite Learning-Enhanced Sparrow Search Algorithm. Int. J. Energy Res. 2024, 2024, 4322211. [Google Scholar] [CrossRef]
- Ma, Y.; Liu, Y.; Bai, X.; Guo, Y.; Yang, Z.; Wang, L.; Tao, T.; Zhang, L. Divide Merge: A Multi-Vessel Optimization Approach for Cooperative Operation and Maintenance Scheduling in Offshore Wind Farm. Renew. Energy 2024, 229, 120758. [Google Scholar] [CrossRef]
- Zhang, L.; Feng, Z.; Zhao, Y.; Xu, X.; Feng, J.; Ren, H.; Zhang, B.; Tian, W. Experimental study of wake evolution under vertical staggered arrangement of wind turbines of different sizes. J. Mar. Sci. Eng. 2024, 12, 434. [Google Scholar] [CrossRef]
- Zhang, L.; Feng, Z.; Pan, P.; Liang, J.; Tian, W.; Zhao, X.; Shen, K.; Zhang, P.; Chen, Y.; Song, C. Experimental study on the periodicity of wake flow of a vertical staggered wind turbine fleet. Ocean Eng. 2024, 309, 118471. [Google Scholar] [CrossRef]
- Shi, P.; Lin, S.; Song, D.; Xu, X.; Wu, J. TRNet: A trend and residual network utilizing novel hilly attention 1 mechanism for wind speed prediction in complex scenario. Energy 2024, 309, 133103. [Google Scholar] [CrossRef]
- Zhang, L.; Yang, Z.; Tian, S.; Li, W.; Chen, G. Front Deflector Effects on the Aerodynamic Characteristics of Horizontal Axis Wind Turbines: A Reynolds-Averaged Navier–Stokes Simulation Study. Energy Technol. 2024, 2400556. [Google Scholar] [CrossRef]
- Tong, G.; Li, Y.; Tagawa, K.; Feng, F. Effects of blade airfoil chord length and rotor diameter on aerodynamic performance of straight-bladed vertical axis wind turbines by numerical simulation. Energy 2023, 265, 126325. [Google Scholar] [CrossRef]
- Xie, S.; Archer, C.L.; Ghaisas, N.; Meneveau, C. Benefits of collocating vertical-axis and horizontal-axis wind turbines in large wind farms. Wind Energy 2017, 20, 45–62. [Google Scholar] [CrossRef]
- Chen, J.; Zhang, Y.; Xu, Z.; Li, C. Flow characteristics analysis and power comparison for two novel types of vertically staggered wind farms. Energy 2023, 263, 126141. [Google Scholar] [CrossRef]
- Chen, K.; Song, M.; Zhang, X.; Wang, S. Wind turbine layout optimization with multiple hub height wind turbines using greedy algorithm. Renew. Energy 2016, 96, 676–686. [Google Scholar] [CrossRef]
- Wang, L. Comparative study of wind turbine placement methods for flat wind farm layout optimization with irregular boundary. Appl. Sci. 2019, 9, 639. [Google Scholar] [CrossRef]
- Gebraad, P.M.; Teeuwisse, F.W.; Van Wingerden, J.W.; Fleming, P.A.; Ruben, S.D.; Marden, J.R.; Pao, L.Y. Wind plant power optimization through yaw control using a parametric model for wake effects—A CFD simulation study. Wind Energy 2016, 19, 95–114. [Google Scholar] [CrossRef]
- Van Beek, M.T.; Viré, A.; Andersen, S.J. Sensitivity and uncertainty of the FLORIS model applied on the Lillgrund wind farm. Energies 2021, 14, 1293. [Google Scholar]
- Cioffi, A.; Muscari, C.; Schito, P.; Zasso, A. A steady-state wind farm wake model implemented in OPENFAST. Energies 2020, 13, 6158. [Google Scholar] [CrossRef]
- Zhao, L.; Xue, L.; Li, Z.; Wang, J.; Yang, Z.; Xue, Y. Progress on offshore wind farm dynamic wake management for energy. J. Mar. Sci. Eng. 2022, 10, 1395. [Google Scholar] [CrossRef]
- Zhang, J.; Zhao, X. Quantification of parameter uncertainty in wind farm wake modeling. Energy 2020, 196, 117065. [Google Scholar] [CrossRef]
- Kütükçü, G.; Uzol, O. Monte Carlo simulations based hub height optimization using FLORIS for two interacting onshore wind farm. J. Renew. Sustain. Energy 2022, 14, 063304. [Google Scholar] [CrossRef]
- Sinner, M.; Simley, E.; King, J.; Fleming, P.; Pao, L.Y. Power increases using wind direction spatial filtering for wind farm control: Evaluation using FLORIS, modified for dynamic settings. J. Renew. Sustain. Energy 2021, 13, 023310. [Google Scholar] [CrossRef]
- Doekemeijer, B.M.; van der Hoek, D.; van Wingerden, J.W. Closed-loop model-based wind farm control using FLORIS under time-varying inflow conditions. Renew. Energy 2020, 156, 719–730. [Google Scholar] [CrossRef]
- Fleming, P.; Annoni, J.; Shah, J.J.; Wang, L.; Ananthan, S.; Zhang, Z.; Hutchings, K.; Wang, P.; Chen, W.; Chen, L. Field test of wake steering at an offshore wind farm. Wind Energy Sci. 2017, 2, 229–239. [Google Scholar] [CrossRef]
- Ramírez Castillo, S.A. Engineering Models Enhancement for Wind Farm Wake Simulation and Optimization. Master’s Thesis, ING-School of Industrial and Information Engineering, Milano, Italy, 2019. [Google Scholar]
- Qian, G.W.; Ishihara, T. Wind farm power maximization through wake steering with a new multiple wake model for prediction of turbulence intensity. Energy 2021, 220, 119680. [Google Scholar] [CrossRef]
- Bastankhah, M.; Porté-Agel, F. A New Analytical Model for Wind-Turbine Wakes. Renew. Energy 2014, 70, 116–123. [Google Scholar] [CrossRef]
- Niayifar, A.; Porté-Agel, F. A New Analytical Model for Wind Farm Power Prediction. J. Phys. Conf. Ser. IOP Publ. 2015, 625, 012039. [Google Scholar] [CrossRef]
- Crespo, A.; Herna, J. Turbulence Characteristics in Wind-turbine Wakes. J. Wind Eng. Ind. Aerodyn. 1996, 61, 71–85. [Google Scholar] [CrossRef]
- Wang, J.; Ouyang, R.; Wen, W.; Wan, X.; Wang, W.; Tolba, A.; Zhang, X. A post-evaluation system for smart grids based on microservice framework and big data analysis. Electronics 2023, 12, 1647. [Google Scholar] [CrossRef]
- Sensi, L.; Melani, P.; Venturi, A.; Giusti, M.; Mungo, G.; Tomassetti, V.; Bianchini, A. Re-Powering Italian Wind Farms: A Feasibility Study from Theory to Practice. J. Phys. Conf. Ser. IOP Publ. 2022, 2385, 012107. [Google Scholar] [CrossRef]
Disclaimer/Publisher’s Note: The statements, opinions and data contained in all publications are solely those of the individual author(s) and contributor(s) and not of MDPI and/or the editor(s). MDPI and/or the editor(s) disclaim responsibility for any injury to people or property resulting from any ideas, methods, instructions or products referred to in the content. |
© 2024 by the authors. Licensee MDPI, Basel, Switzerland. This article is an open access article distributed under the terms and conditions of the Creative Commons Attribution (CC BY) license (https://creativecommons.org/licenses/by/4.0/).