Article

Study on Hydroelastic Responses of Membrane-Type LNG Cargo Containment Structure under Impulsive Sloshing Loads of Different Media

1
Department of Naval Architecture and Ocean Engineering, Seoul National University, 1 Gwanak-Ro, Gwanak-Gu, Seoul 08826, Republic of Korea
2
Hyundai Maritime Research Institute, HD Hyundai Heavy Industries, 477 Bundangsuseo-ro, Bundang-Gu, Seongnam-si 13553, Republic of Korea
*
Author to whom correspondence should be addressed.
J. Mar. Sci. Eng. 2024, 12(10), 1794; https://doi.org/10.3390/jmse12101794
Submission received: 4 September 2024 / Revised: 27 September 2024 / Accepted: 30 September 2024 / Published: 9 October 2024

Abstract

:
Owing to the increasing g lobal demand for natural gas, the construction of liquefied natural gas (LNG) carriers has become a key trend in the shipbuilding market. In the design of membrane-type LNG carriers, a sloshing analysis is crucial for cargo containment systems (CCSs). In this study, structural responses due to impulsive sloshing loads were observed, including the effects of hydroelasticity and the test medium. To this end, the structural responses were first observed with and without hydroelastic coupling between the liquid and structure. When fluid–structure coupling is considered, a finite element analysis is performed for the integrated structure of the hull and CCS. This method was then applied to evaluate the capacity and safety of the inner hull structures of actual LNG vessels in cases where different sloshing pressures occurred owing to the different liquid–gas media. The structural capacity was evaluated using the utilization factor (UT). The results confirm that the effects of the hydroelasticity, density ratio, and phase transition of the experimental medium are essential for the evaluation of the structural responses of LNG CCSs.

1. Introduction

Recently, the International Maritime Organization (IMO) implemented various regulatory measures to reduce greenhouse gas (GHG) emissions by 50% compared to 2008 levels by 2050 [1]. Accordingly, shipping companies must consider carbon-neutral or zero-emission fuels and regulate nitrogen oxides (NOx) and sulfur oxides (SOx). In addition, shipyards must consider transitioning to alternative fuels such as hydrogen and ammonia to meet carbon neutrality goals [2].
Owing to the advantage of being able to construct a cargo hold using a hull structure, the cargo-loading capacity and price competitiveness of membrane-type tanks are higher than those of other tank types. However, the disadvantage of a membrane-type tank without internal structural components is the predominant issue of sloshing, which inevitably occurs during ship motion. The sloshing inside the tanks of actual LNG carriers exhibits highly chaotic behavior, which is affected by various complex physical phenomena and unpredictable randomness [3]. Nevertheless, it is necessary to define sloshing impact loads with more realistic behaviors and evaluate structural integrity using a quantitative methodology to ensure operational lifetime. Design sloshing loads can be obtained from a model test [4,5]. Several studies have been conducted on the density ratio [6,7], scaling method [8,9], and phase transition at the free surface to develop test methods by Maillard and Brosset [10] for simulating actual sloshing phenomena. Furthermore, machine learning based on large amounts of sloshing data has been used to predict sloshing impact loads [11].
In many previous experimental studies, a model test using air/water was performed, but a gas with different densities could be considered instead of air to replicate the density ratio of actual LNG and NG [12,13]. In addition, the scale effect of the experiment is another issue for practical purposes, and there are some existing model tests for different scales, for example, Kim et al. [14] and Karimi et al. [15,16]; however, the effect is not yet clear. For phase transitions related to sloshing, the maximum impact pressure and oscillations were investigated by Ancellin et al. [17] and Braeunig et al. [18] using computation. In addition, a fundamental experiment was conducted by Kim et al. [19] for the phase transition inside a gas pocket when sloshing impact pressure occurred. Recently, Lee et al. [20] introduced excellent experimental research for the variation of both sloshing impact pressure and rising time of peak pressure through the two-dimensional (2D) sloshing experiment with a NOVEC 7000 material, which has a boiling point of 34 °C.
Meanwhile, classification societies such as LR [21], BV [22], ABS [23], and DNV [24] have proposed their guidance by comparative and absolute approaches to the definition of hydrodynamic sloshing impact loads and the structural assessment of membrane-type CCSs. The comparative approach is straightforward, whereas the absolute approach involves many complicated hydrodynamic and structural analyses. In the structural analysis of the absolute approach, a dynamic transient analysis can be performed using the peak pressure and rising time of the design sloshing pressure [25,26], and the fluid–structure interactions (FSI) as an advanced technical approach can be considered to include hydroelasticity [27,28,29]. However, it should be mentioned that this approach has some limitations and challenges, such as numerical uncertainties and computation time. From a practical perspective, simplified modeling, such as using a triangular impulse response function [30], may be appropriate for the rapid evaluation of structural responses.
This study aimed to observe the dynamic structural responses, considering the hydroelasticity of the upper and lower structures of the LNG carrier. To this end, the hydrodynamic loads measured by Lee et al. [20] were used as inputs for the dynamic analysis. Although their sloshing model test was conducted using a rectangular tank with regular motion, not a three-dimensional LNG tank model, the evaluation of the upper and lower structures of actual LNG vessels can be carried out at a fundamental research level using the data of Lee et al. because the measured pressures include the effects of the density ratio and phase transition.
In this study, acoustic-structure-coupled modeling was proposed to account for the hydroelastic effects of the structure. Through this approach, the dynamic structural behavior under measured sloshing impact history was directly analyzed, and a comparative study of the overall responses and stress levels was conducted with and without liquid. Furthermore, the maximum stresses from each CCS component under the unit sloshing load were obtained using the triangular impulse superposition method (TISM) to define the dynamic structural capacity and dynamic amplification factor (DAF) according to the failure modes of the structure. Through these, the time-lagging phenomenon in the dynamic structural capacity, changes in response frequencies, and mode shapes caused by hydroelastic effects were identified in the CCS components and hull. Meanwhile, the sloshing assessment for the upper and lower hulls was carried out for different experimental media, that is, water–air, NOVEC 7000 at average temperature, and NOVEC 7000 at boiling temperature, and a comparative analysis was performed to observe the changes in the utilization factor due to hydroelastic effects and phase transition. This study is significant as it performs a dynamic structural assessment that accounts for the hydroelastic effects based on sloshing loads, which are closer to actual phenomena than the guidance currently provided by classification societies. From this perspective, this approach is deemed valid for absolute sloshing assessments and offers greater practicality.

2. Sloshing Experiment and Pressure Measurement

2.1. Model-Scale Experiment

The present study applied the sloshing impact pressure introduced by Lee et al. [20] as the load for the dynamic structural analysis. They conducted regular sloshing experiments for different liquid and gas materials, and the differences in the physical phenomena and dynamic pressure were discussed. Their tank model is a two-dimensional rectangular tank of 630.7 mm length (L), 446.7 mm height (H), and 78.7 mm width (B) as shown in Figure 1 [20]. The tank was securely mounted on a 6-DOF Stewart motion platform with a 1.5-ton excitation capacity within a 3% operating error [20].

2.2. Measured Impact Pressures

Detailed impact pressure data can be found in Lee [31], but new data for the cases of water and heavy gas are included in the present study. Figure 2 shows a comparison of the pressure signals during one hydrodynamic impact. Three important observations on the differences between water and air and NOVEC should be made: (1) the peak values, (2) the pressure decay pattern, and (3) the impact duration and rise time. That is, the pressures induced by the NOVEC have a dramatic reduction in the peak pressure, and the oscillation due to the gas pocket is not as high as that in the water–air case. Moreover, the decay time becomes much longer than the water–air case.
The average of the ten most considerable peak pressures and corresponding rise times with respect to the motion frequency for the 20% and 80% filling conditions are shown in Figure 3 and Figure 4, respectively. Compared to the previous research of Lee et al. [20], more pressure data were included in the water–heavy gas test for low-filling cases.
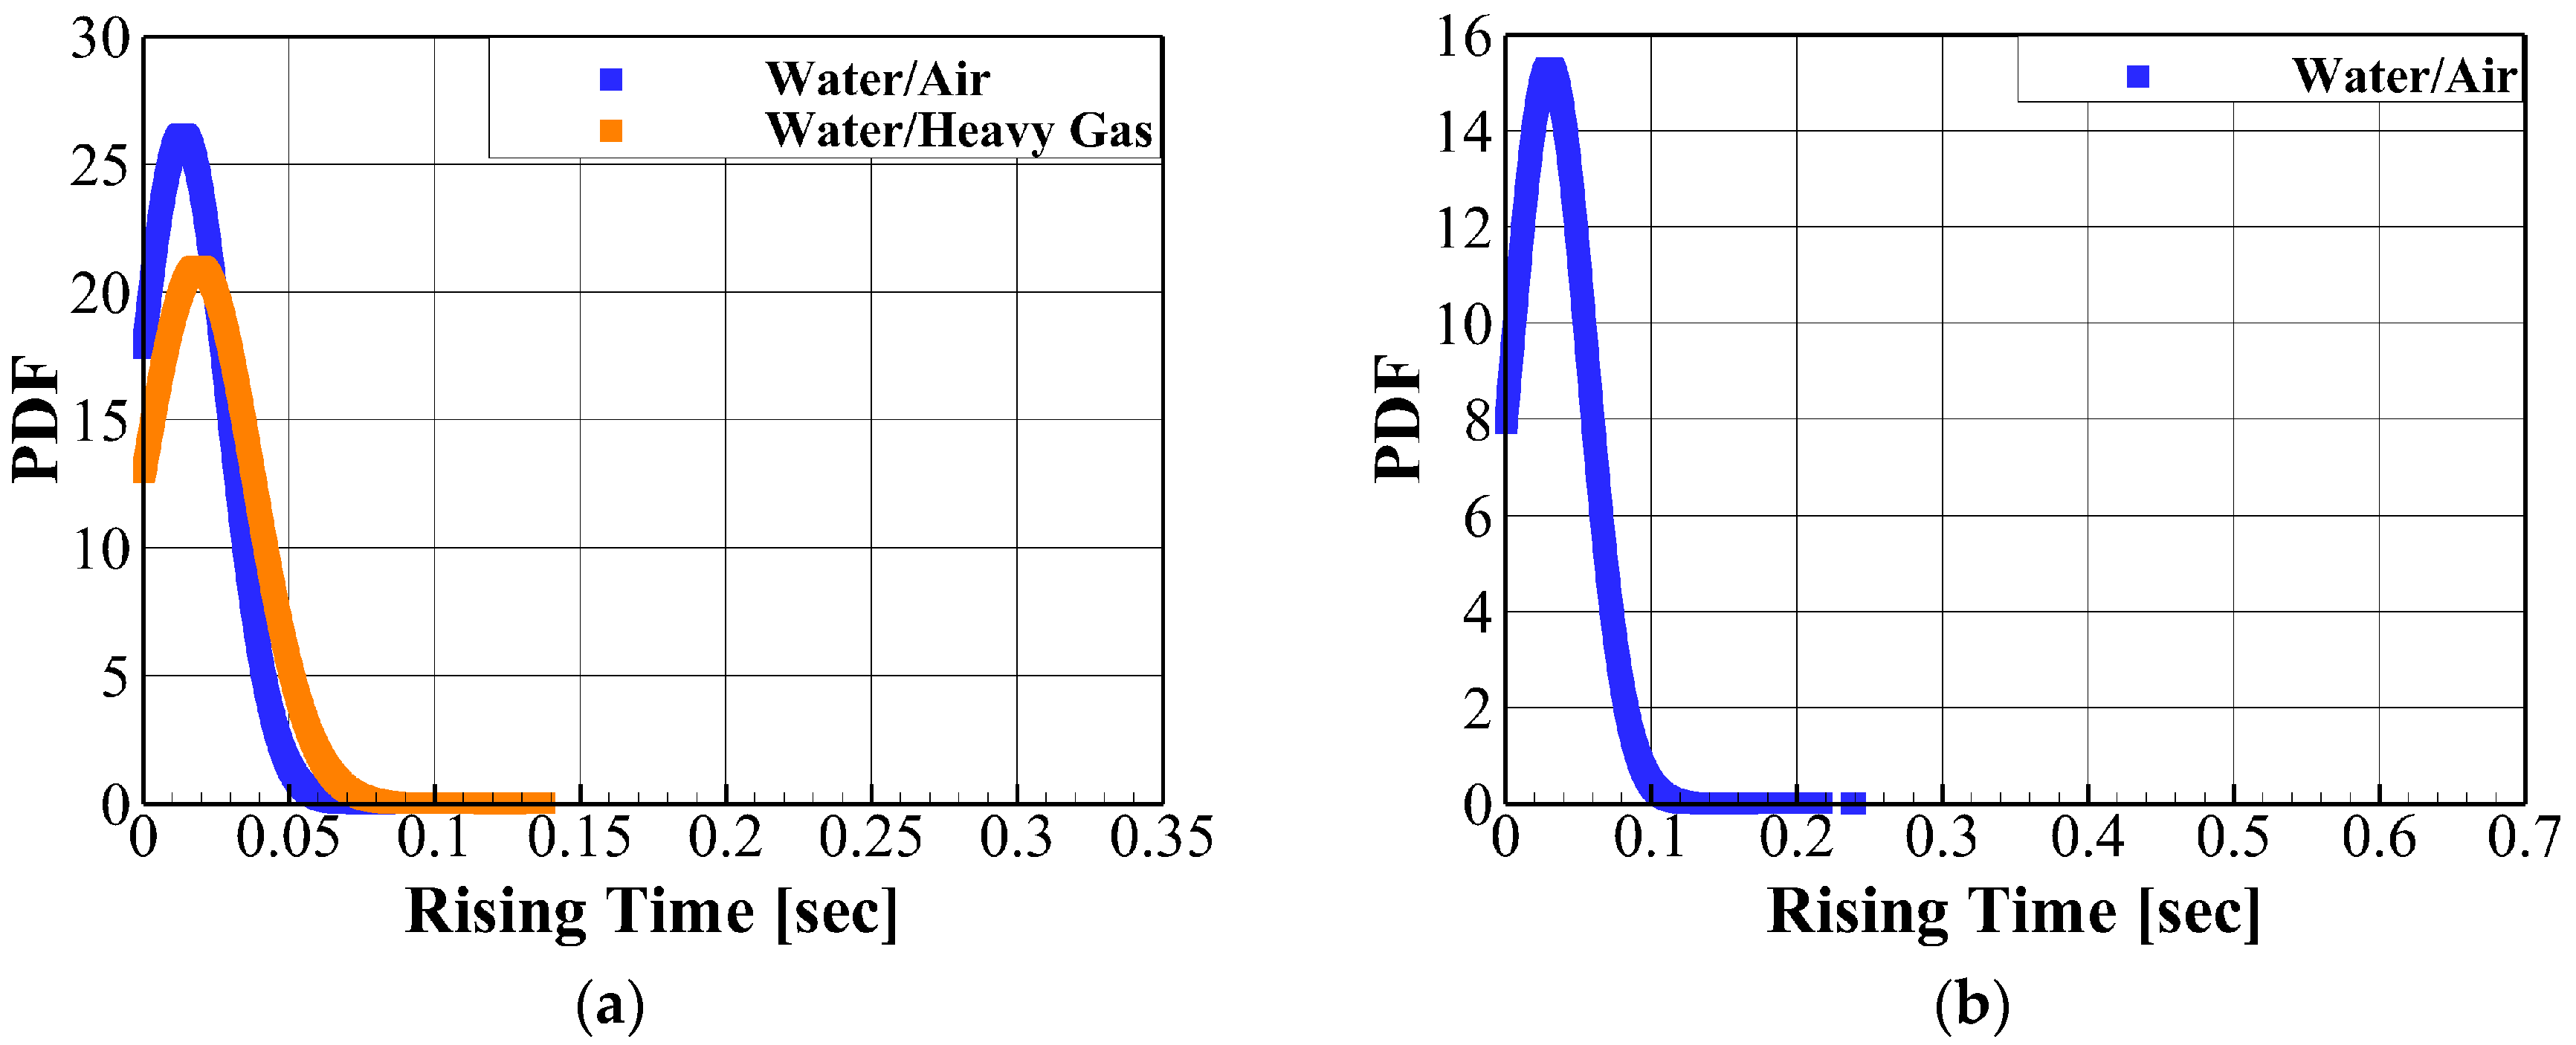
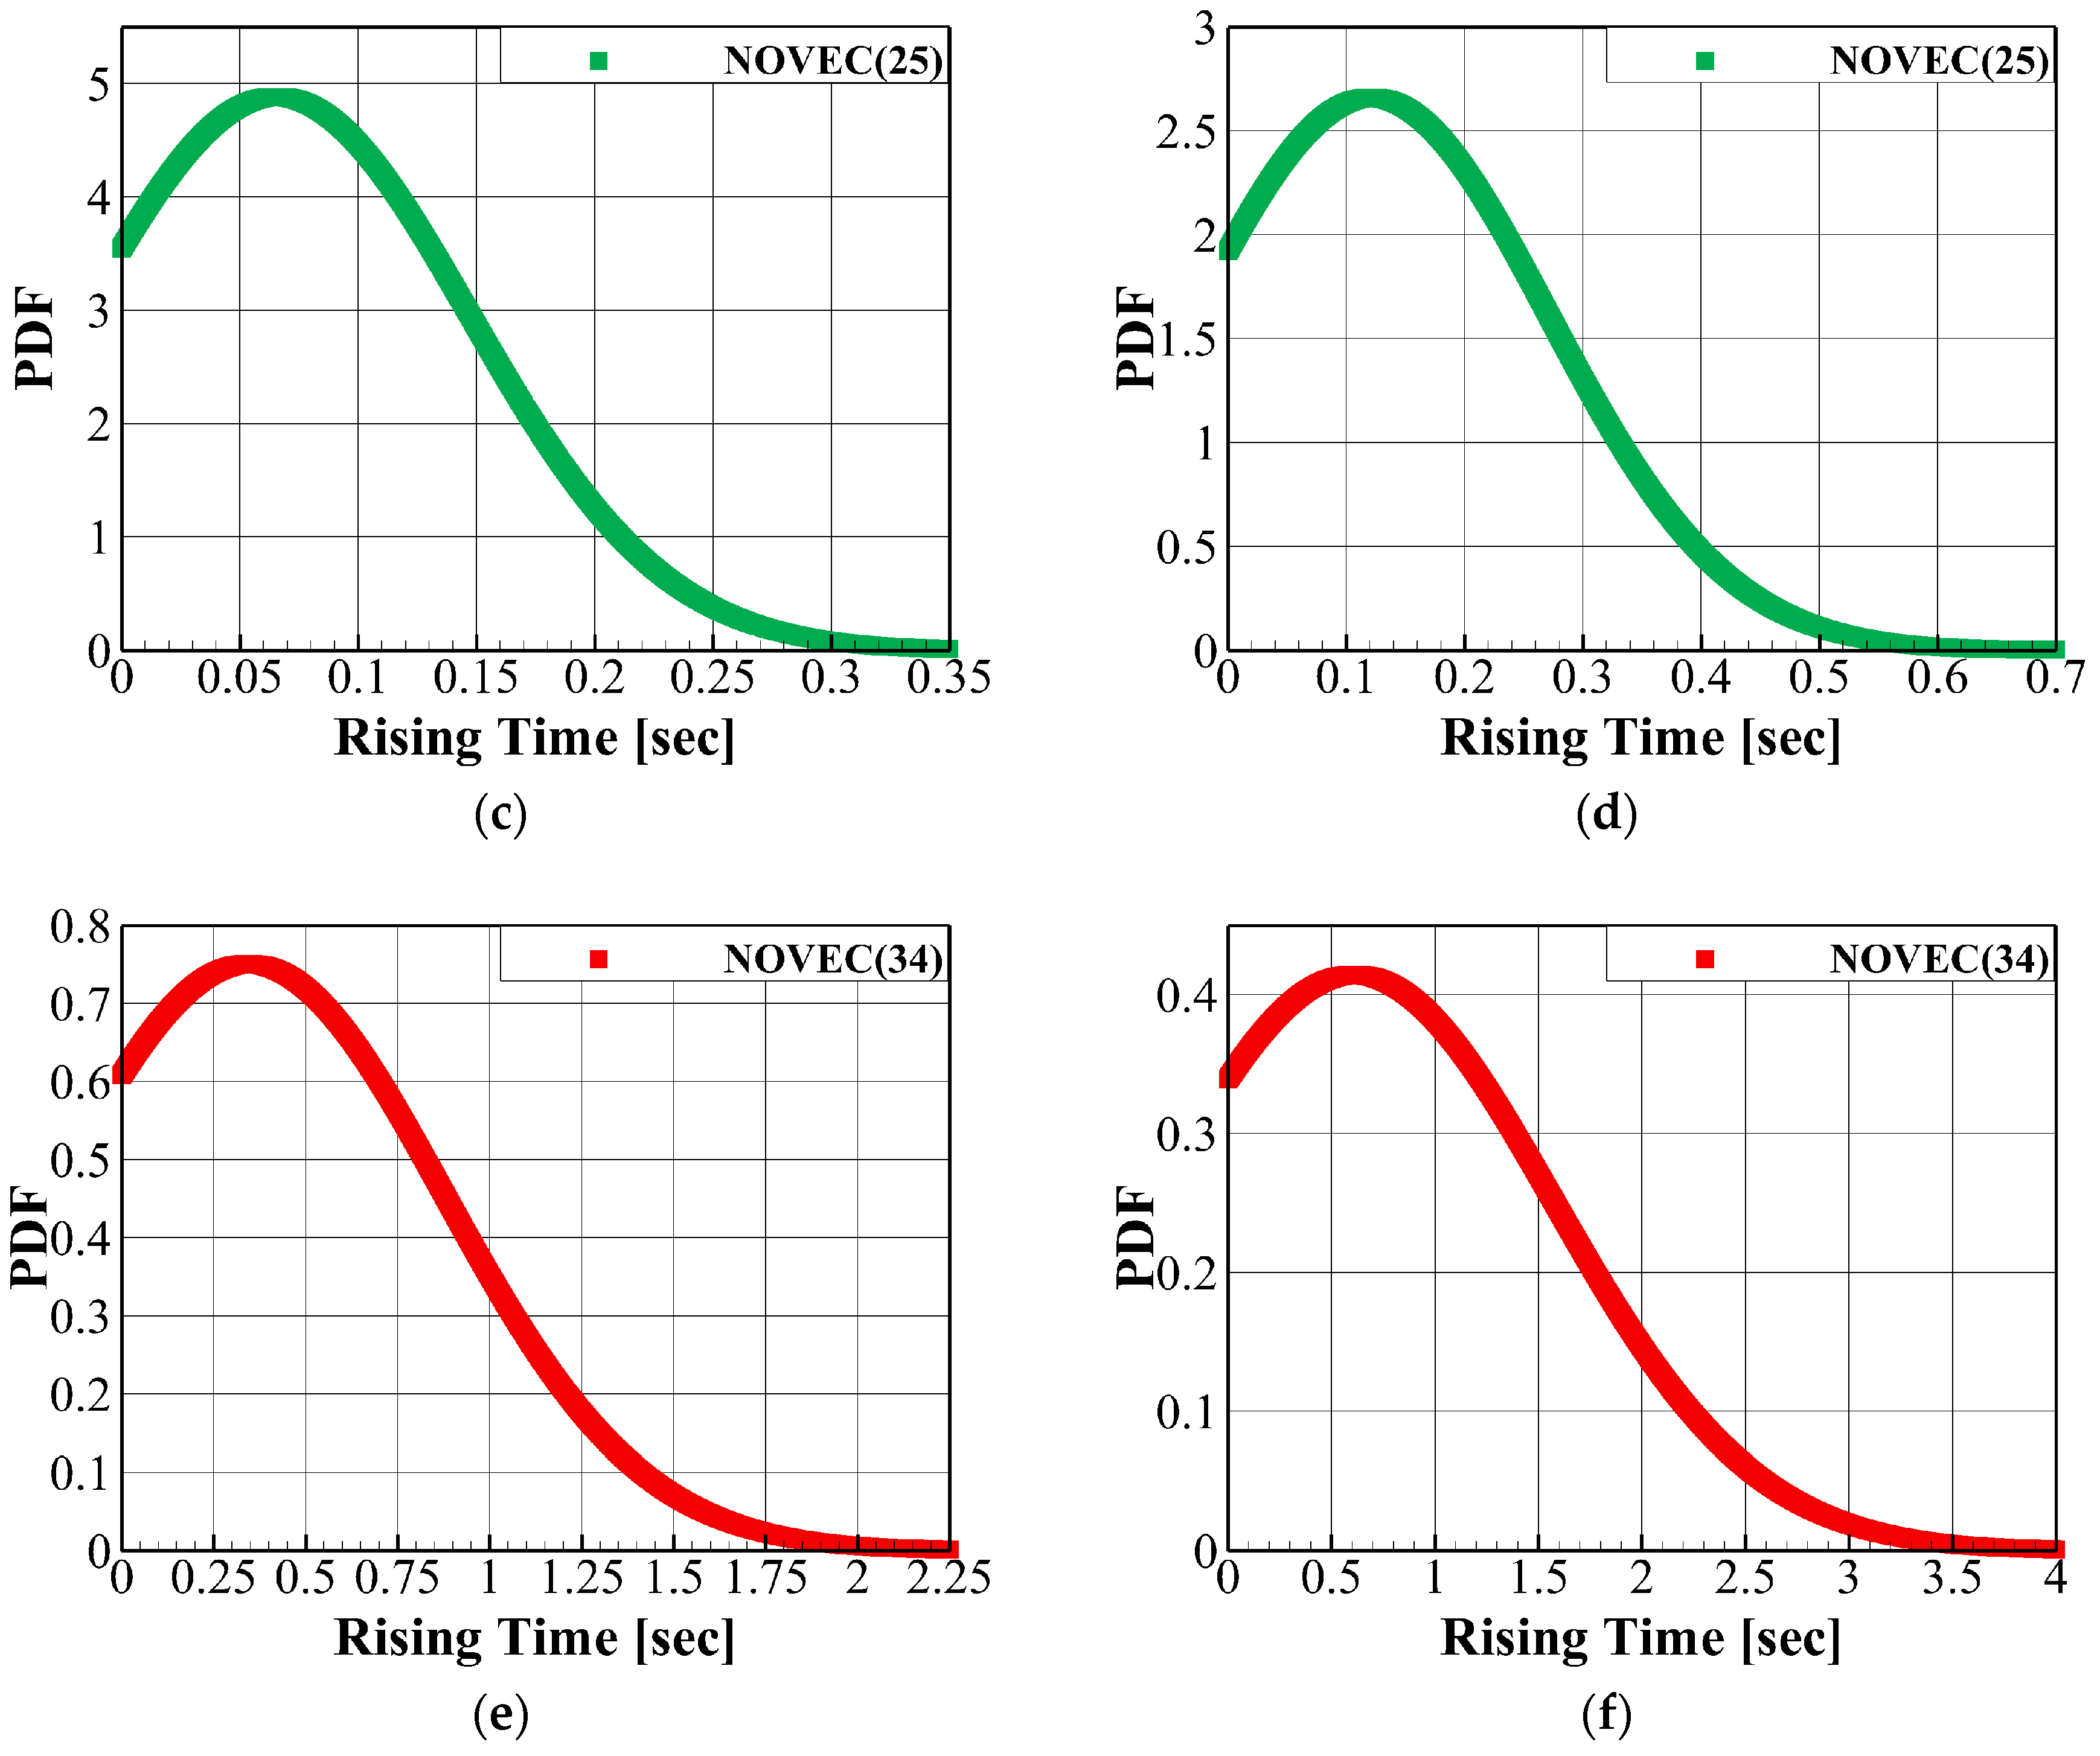
The probability density distributions of the rise times for each medium are shown in Figure 5. A normal probability distribution function was applied to the plots. These were the rise time distributions between 0.85 and 1.2 times of sloshing natural frequency, ω0. At low-fillings with water–air and water–heavy gas, the rise times of the impact increased slightly as the gas/liquid density ratio increased. In addition, the distributions of the rise times at the boiling point of NOVEC 7000 were the longest for both the 20% and 80% filling conditions.

3. Modeling of Hydroelasticity for LNG CCS Structure

3.1. LNG CCS and Hull FE Modeling

In this study, the Mark-III Flex CCS, well known as the Gaztransport & Technigaz (GTT) [32], was used to observe structural responses to sloshing loads. The general configuration of the CCS is shown in Figure 6, and total thickness of the CCS is 400 mm. The primary panel (1st RPUF (Reinforced Polyurethane Foam), Top plywood) had a thickness of 100 mm, whereas the secondary panel (2nd RPUF, Bottom plywood) had a thickness of 300 mm. In this study, the primary barrier was neglected to investigate the global behavior of the integrated structure with the hull and CCS rather than the localized responses of the corrugated membrane sheet.
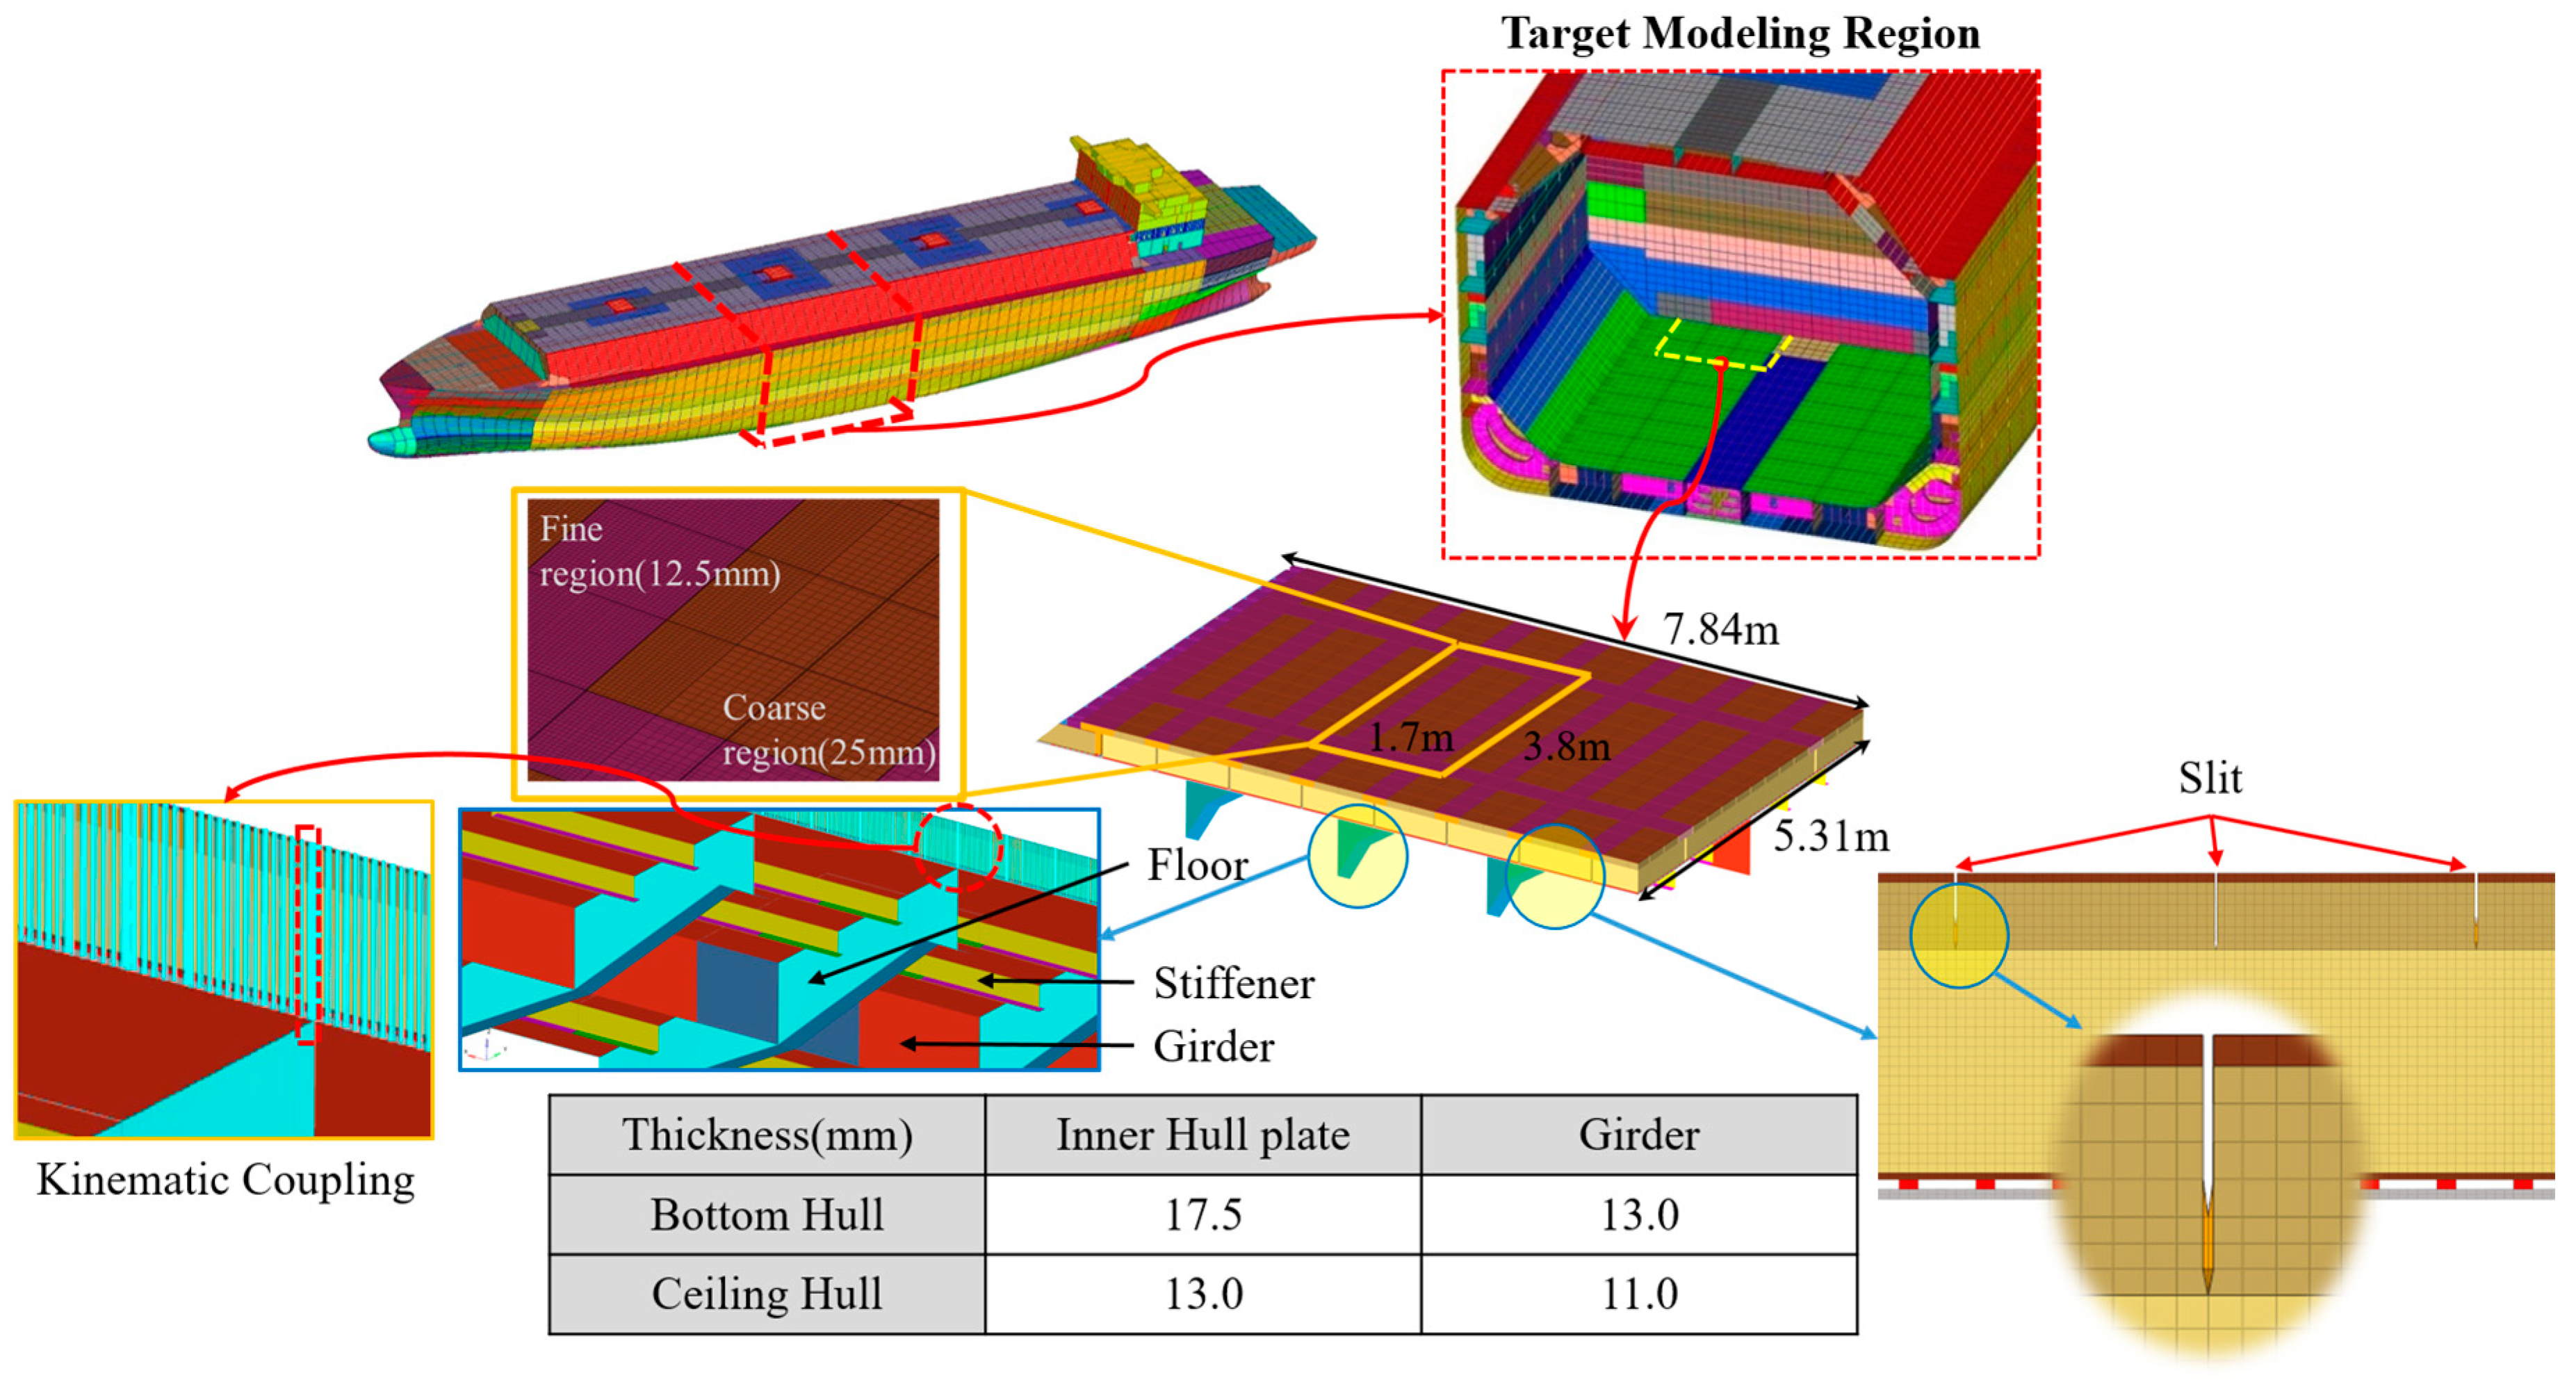
The present study applied the finite element method to calculate both the static and dynamic structural responses of the integrated structure model using the well-known software Abaqus/Standard and Explicit Solver [33]. The structure integrated with the CCS and hull for FE analysis is shown in Figure 7. The total number of elements was approximately 3.9 million, and the total number of degrees of freedom was 14 million, including the acoustic region.
The target modeling region is the location of maximum stress at the intersection after the bulkhead and inner bottom of the No. 2 tank in the full-ship structural analysis. The insulation system integrated the flat panels and the lower sections of the 90° panels into the model, in addition to incorporating the top bridge pad that connects the unit panels. The dimensions of the unit panel are approximately 1 m in width and 3 m in length. The top bridge panel was then installed on top of the secondary barrier. The CCS was then positioned at this location and divided into coarse and fine regions. To ensure computational efficiency and guarantee solution accuracy, the mesh size for the coarse region was set to approximately 25 mm, whereas the fine region was configured to half the size, i.e., about 12.5 mm. The coarse and fine regions were connected using surface-to-surface ties along the vertical interface to ensure continuity. In addition, the fine region was selected as the target area for sloshing assessment, and the dynamic maximum stresses were sorted in this region.
In this study, the intersection areas of the main girder, floor, and stiffeners for both the lower and upper regions of the LNG tank were selected for the assessment. The spacing between the floors placed on the inner hull plate was approximately 2100 mm, and the spacing between the stiffeners was approximately 850–900 mm. The inner hull plate was modeled with solid elements, and the shell elements were embedded in the middle layer of the solid mesh to match the degrees of freedom. To this end, the kinematic coupling was applied to connect the hull of the ship with the CCS as a constraint that ties the motion between a set of CCSs (referred to as the “slave nodes”) and a single point of the hull (the “master node”) in the 6 degrees of freedom. In the CCS, shell elements were used in the secondary barrier (Triplex) composed of composite materials, and other components, such as plywood, RPUF, and mastic, were modeled with solid elements. Since significant damage due to sloshing loads has not been reported for the top plywood (12 mm) compared to the bottom plywood (9 mm), a single-layer solid element was applied to the top plywood. In contrast, the bottom plywood was modeled using a four-layer solid element to evaluate bending and shear stresses. The mastic spacing was modeled as 100 mm on flat panels and 80 mm at the corners, with a thickness of 12.5 mm and a width of approximately 25 mm, using a two-layer solid element. The slit modeling, with a width of approximately 4 mm and a depth of about 70 mm of the unit panel, was applied to reflect the contraction behavior owing to the temperature gradient between the hull and CCS. The reduced integration element type was applied to the shell (S4R) and solid elements (C3D8R and AC3D8R) for static and dynamic explicit analyses.
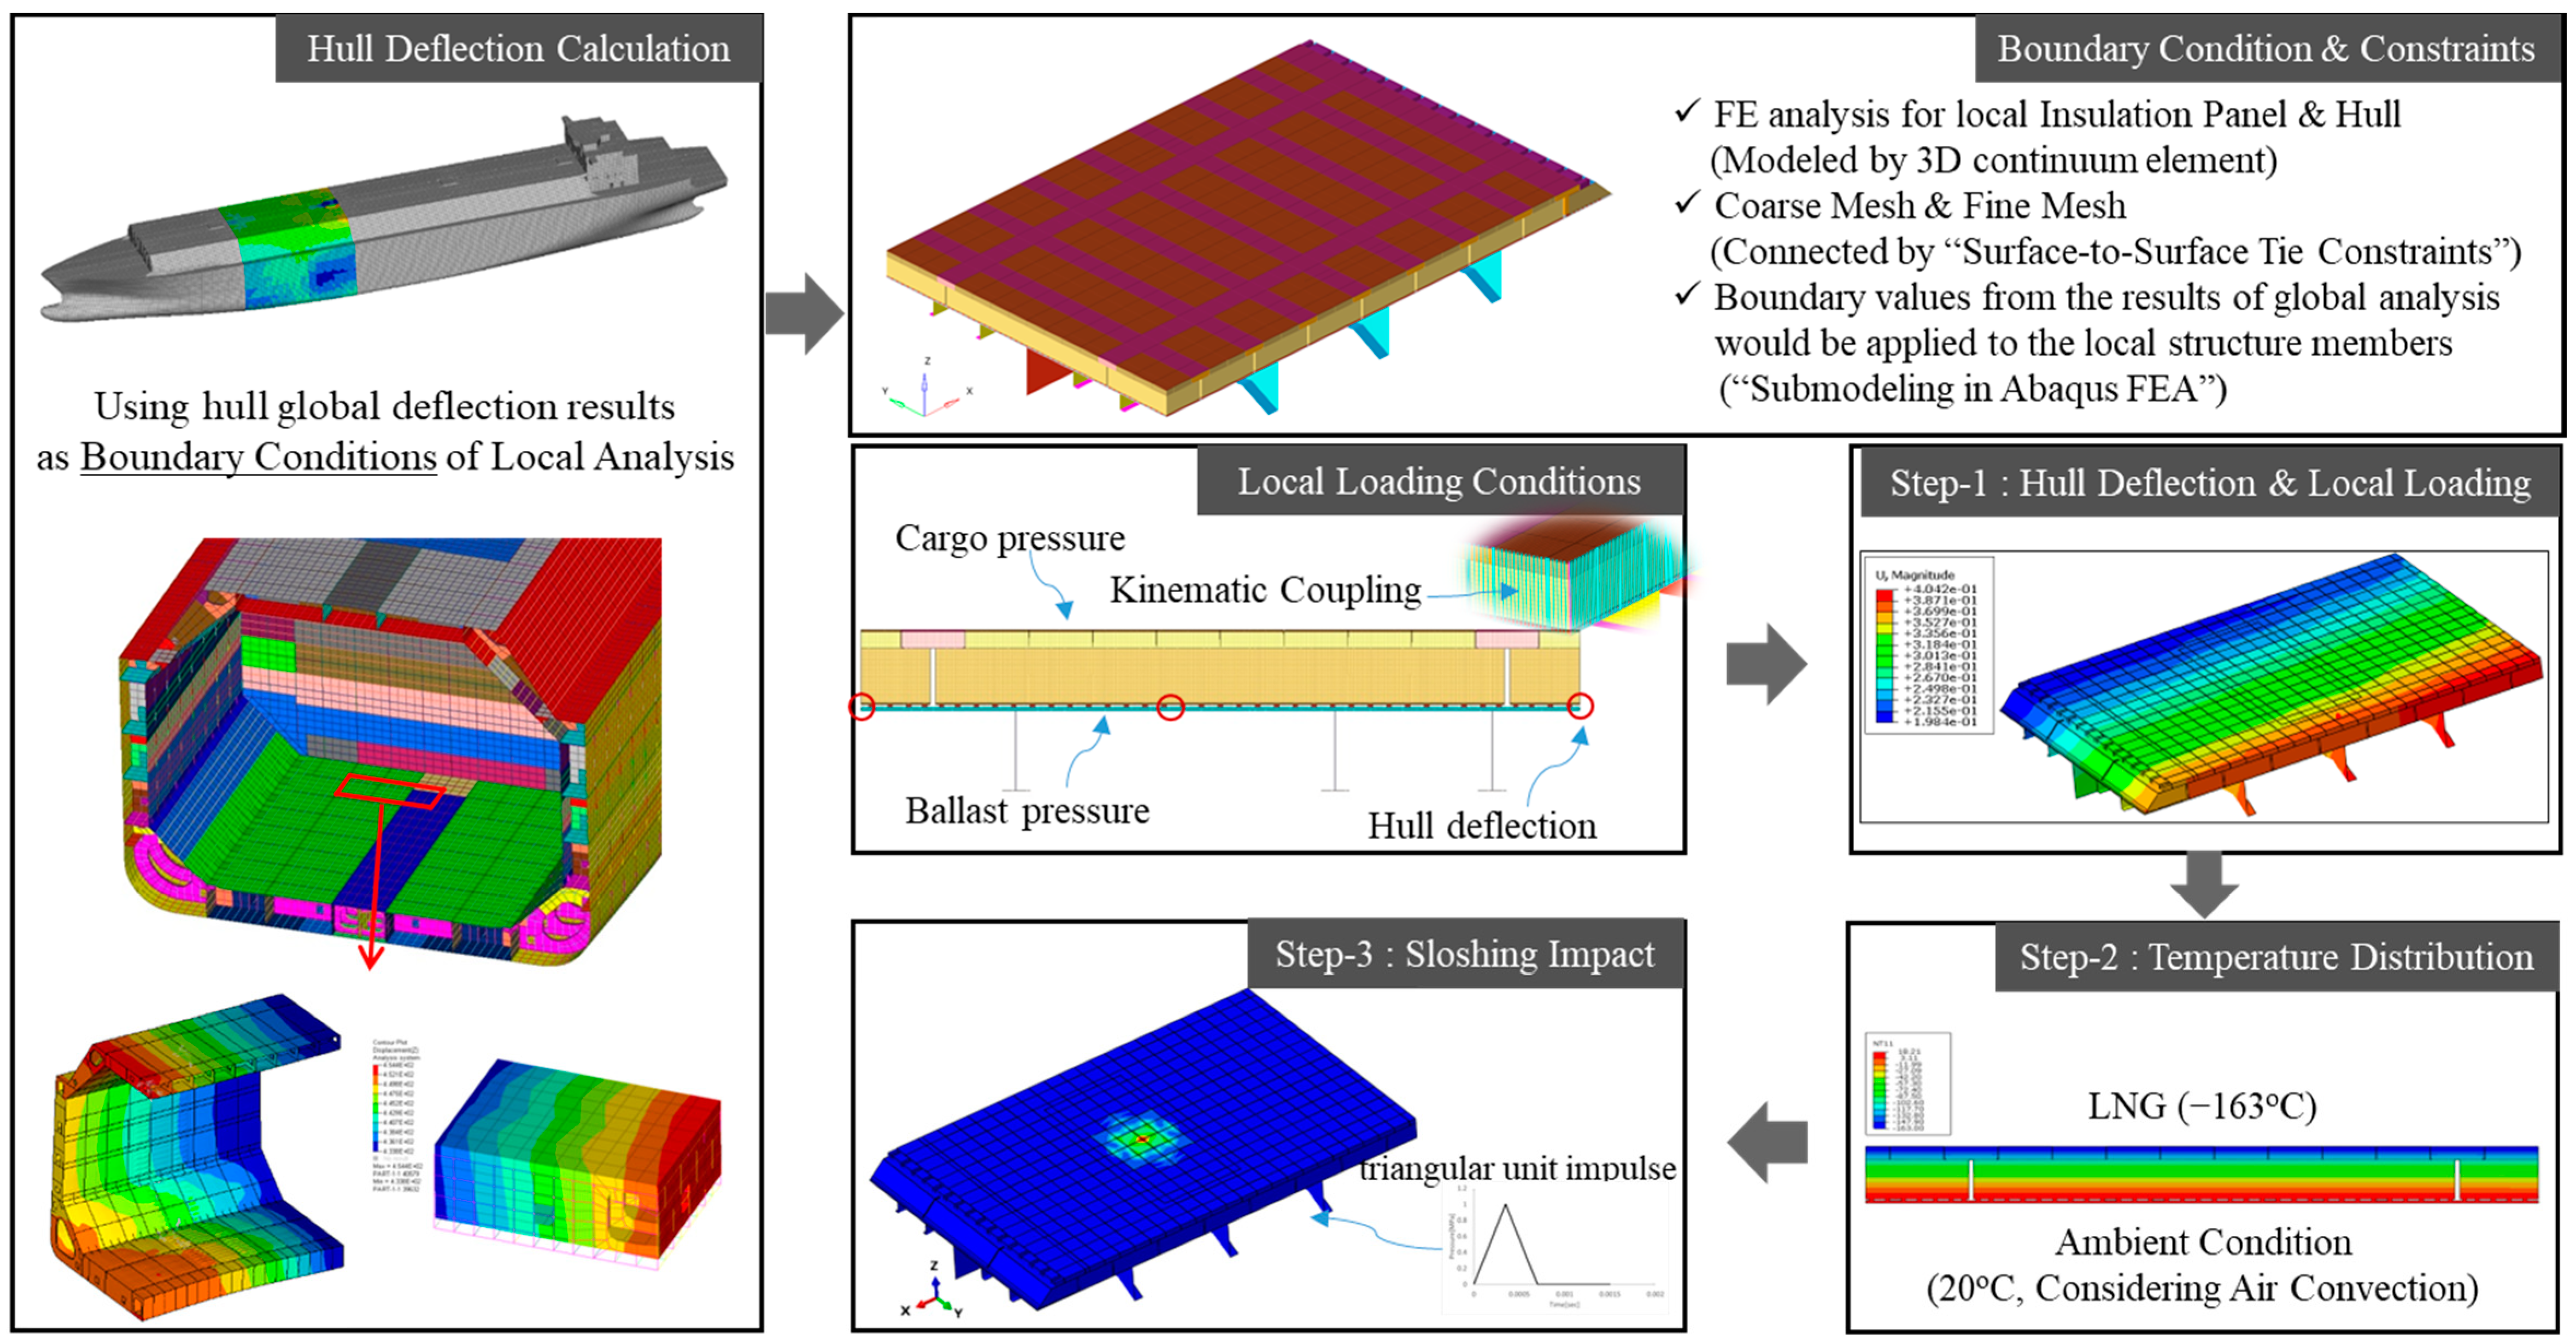
The overall analysis procedure for the boundary and load conditions Is Illustrated In Figure 8. In the analysis, the initial hull deformation and temperature distribution were incorporated as the initial stresses. Subsequently, dynamic analyses were conducted by considering the unit sloshing impact loads. The applied load area was defined as 500 mm × 500 mm, which is the full-scale size of the interval between the pressure sensors. In this process, the sub-modeling technique of Abaqus was applied to impose global–local boundary conditions. In the structural analysis of an entire ship, the analysis results of the most critical case, considering the global shear force, bending moment, and ballast/cargo pressure, were introduced into the local integrated model and applied as boundary conditions. The thermal distributions for the hull and CCS from the cryogenic −163 °C temperature at the inner tank to the ambient condition at the hull were obtained through heat transfer analysis, and those nodal temperature values were applied as the boundary conditions. Subsequently, thermal stress analysis was conducted for the integrated structure model.
Isotropic elasticity material properties were applied to the girder, floor, stiffeners, and mastic. Orthotropic elasticity was applied to plywood, RPUF, and secondary barriers. The direction of the local coordinate system for the orthotropic materials is the same as the global coordinate system. The material properties used in the analysis are listed in Table 1. The properties of the acoustic domains are listed in Table 2. The acoustic domain can be defined by deriving the speed of sound using the density and bulk modulus of the LNG at −163 °C [34].

3.2. Fluid–Structure Interaction in Coupled Analysis

After the sloshing impact inside the tank, the primary barrier remains exposed to LNG, which may affect the dynamic response of the insulation system. Therefore, the natural periods of the foam and the hull may increase, potentially leading to a relatively larger structural response. To this end, the hydroelastic analysis is based on the assumption that LNG is an acoustic medium, and the coupled acoustic-structure FE analysis is carried out for fluid–structure interaction using Abaqus. The acoustic elements in the Abaqus FEA software can be considered as the LNG fluid, and are applicable in dynamic structural analysis. The LNG fluid is assumed to be acoustic and regarded as small motions of compressible, adiabatic fluid [33]. All details are described in Abaqus [33]. In short, the following variation form is solved in the fluid domain:
V δ p 1 K f p ¨ + γ ρ K f p ˙ + 1 ρ δ p x p x d V S δ p T d S + S δ p γ ρ c p + γ ρ k + 1 c p ˙ + 1 k p ¨ d S + S δ p 1 c p ˙ + 1 α p d S S δ p n ¯ u ¯ ¨ d S + S δ p γ ρ c p + γ ρ k + 1 c p ˙ + 1 k p ¨ n ¯ u ¯ ¨ d S = 0 ,
where x, ρ, and p denote the spatial coordinates, fluid density, and pressure, respectively. n ¯ and u ¯ ¨ are the normal boundary and fluid acceleration vectors, respectively. In addition, γ ,   K f ,   k , and   c represents the volumetric drag (force per unit volume per velocity), bulk modulus of the fluid, and the spring and dashpot parameters, respectively.
For a structural interface, the behavior can be defined by the virtual work equation as follows:
V δ ε : σ d V + V α ρ s δ u ¯ u ¯ ˙ d V + V ρ s δ u ¯ u ¯ ¨ d V + S p δ u ¯ n ¯ d S S δ u ¯ τ ¯ d S = 0 ,
where δ ε is the strain variation compatible with δ u ¯ , δ u ¯ is the variational displacement vector, σ is the stress in the structure, α is the damping factor proportional to the mass as a part of the Rayleigh damping for the structure, ρ s is the density of the material, and τ ¯ is the surface traction applied to the structure. The variation problem of the coupled fields between the displacement u ¯ and pressure p can be solved using Equations (1) and (2), respectively. In this coupling, the nodes of each domain in the interface must have a continuity of kinematics, such as displacement and velocity. In addition, the pressure field using an acoustic element generates normal surface traction, and the acceleration of the structural element generates a forcing term at the fluid boundary. The exchange of nodal acceleration and pressure by the interactions between the fluid and structure is shown in Figure 9.
The limitation of this study is that it does not include a fully coupled fluid–structure interaction analysis that considers pressure load combinations across both the spatial and time domains. However, the hydroelastic effect in structural responses and relevant parametric studies considering LNG have been validated by dynamic finite element analysis of the coupled acoustic-structure model [28].
The load was applied to the interface between the acoustic and top plywood surfaces within the fluid domain, and a non-reflecting planar boundary condition was applied to the outer region of the acoustic domain, as shown in Figure 10. The height of the acoustic domain was approximately 1m, which is equivalent to the width of the CCS; this is a reasonable assumption that the fluid can be sufficiently filled on the CCS after the sloshing impacts. The dynamic structural responses may vary according to the height; however, it is meaningful to obtain significant results compared to those without an acoustic region.

3.3. Failure Modes

Defining the potential failure modes is crucial for evaluating the integrity of a structural system through finite element analysis or structural testing. Thus, it determines the ultimate strength capacity and contributes to establishing the acceptance criteria. The Mark-III Flex CCS is a foam-based containment system that is vulnerable to compression induced by sloshing loads, as well as bending and shearing loads near mastic supports. Moreover, after the sloshing impact loads on the CCS, the foam is exposed to compression and can generate tensile stresses by rebounding at the interface of different materials, such as the lower plywood and foam and the foam and the secondary barrier. It is the most critical failure mode (at foam crushing and lower plywood) and might be a central issue in the supporting structure, which has geometrical discontinuities. It is also necessary to evaluate the failure modes of the hull structure and stiffeners caused by the transmitted sloshing impact loads. Based on the considerations above, the locations of each failure mode are shown in Figure 11, and their definitions are provided in Table 3.

4. Analysis Results of Hydroelastic Structural Responses

The dynamic structural analyses were performed using the sloshing pressure history of each experiment with different test media from Figure 2. Symmetric boundary conditions of the structure were applied to focus primarily on the hydroelastic effect, while the initial hull deformation and temperature boundary were not considered.
The dynamic structural stress responses resulting from each impact pattern are shown in Figure 12 and Figure 13. The stress level and oscillations decreased in the order of the water–air, NOVEC 7000 at 25 °C, and NOVEC 7000 at 34 °C. The results showed that most stress values with the fluid region (AC) were much lower than those without the fluid region (WOAC). Moreover, the oscillatory responses without the fluid region were more significant than those with the fluid. It implies that the maximum stress value of the AC case was smaller than that of the WOAC, indicating that the dynamic behavior of the CCS was reduced by the interaction with the fluid region.

5. Results of Normal Mode Analysis

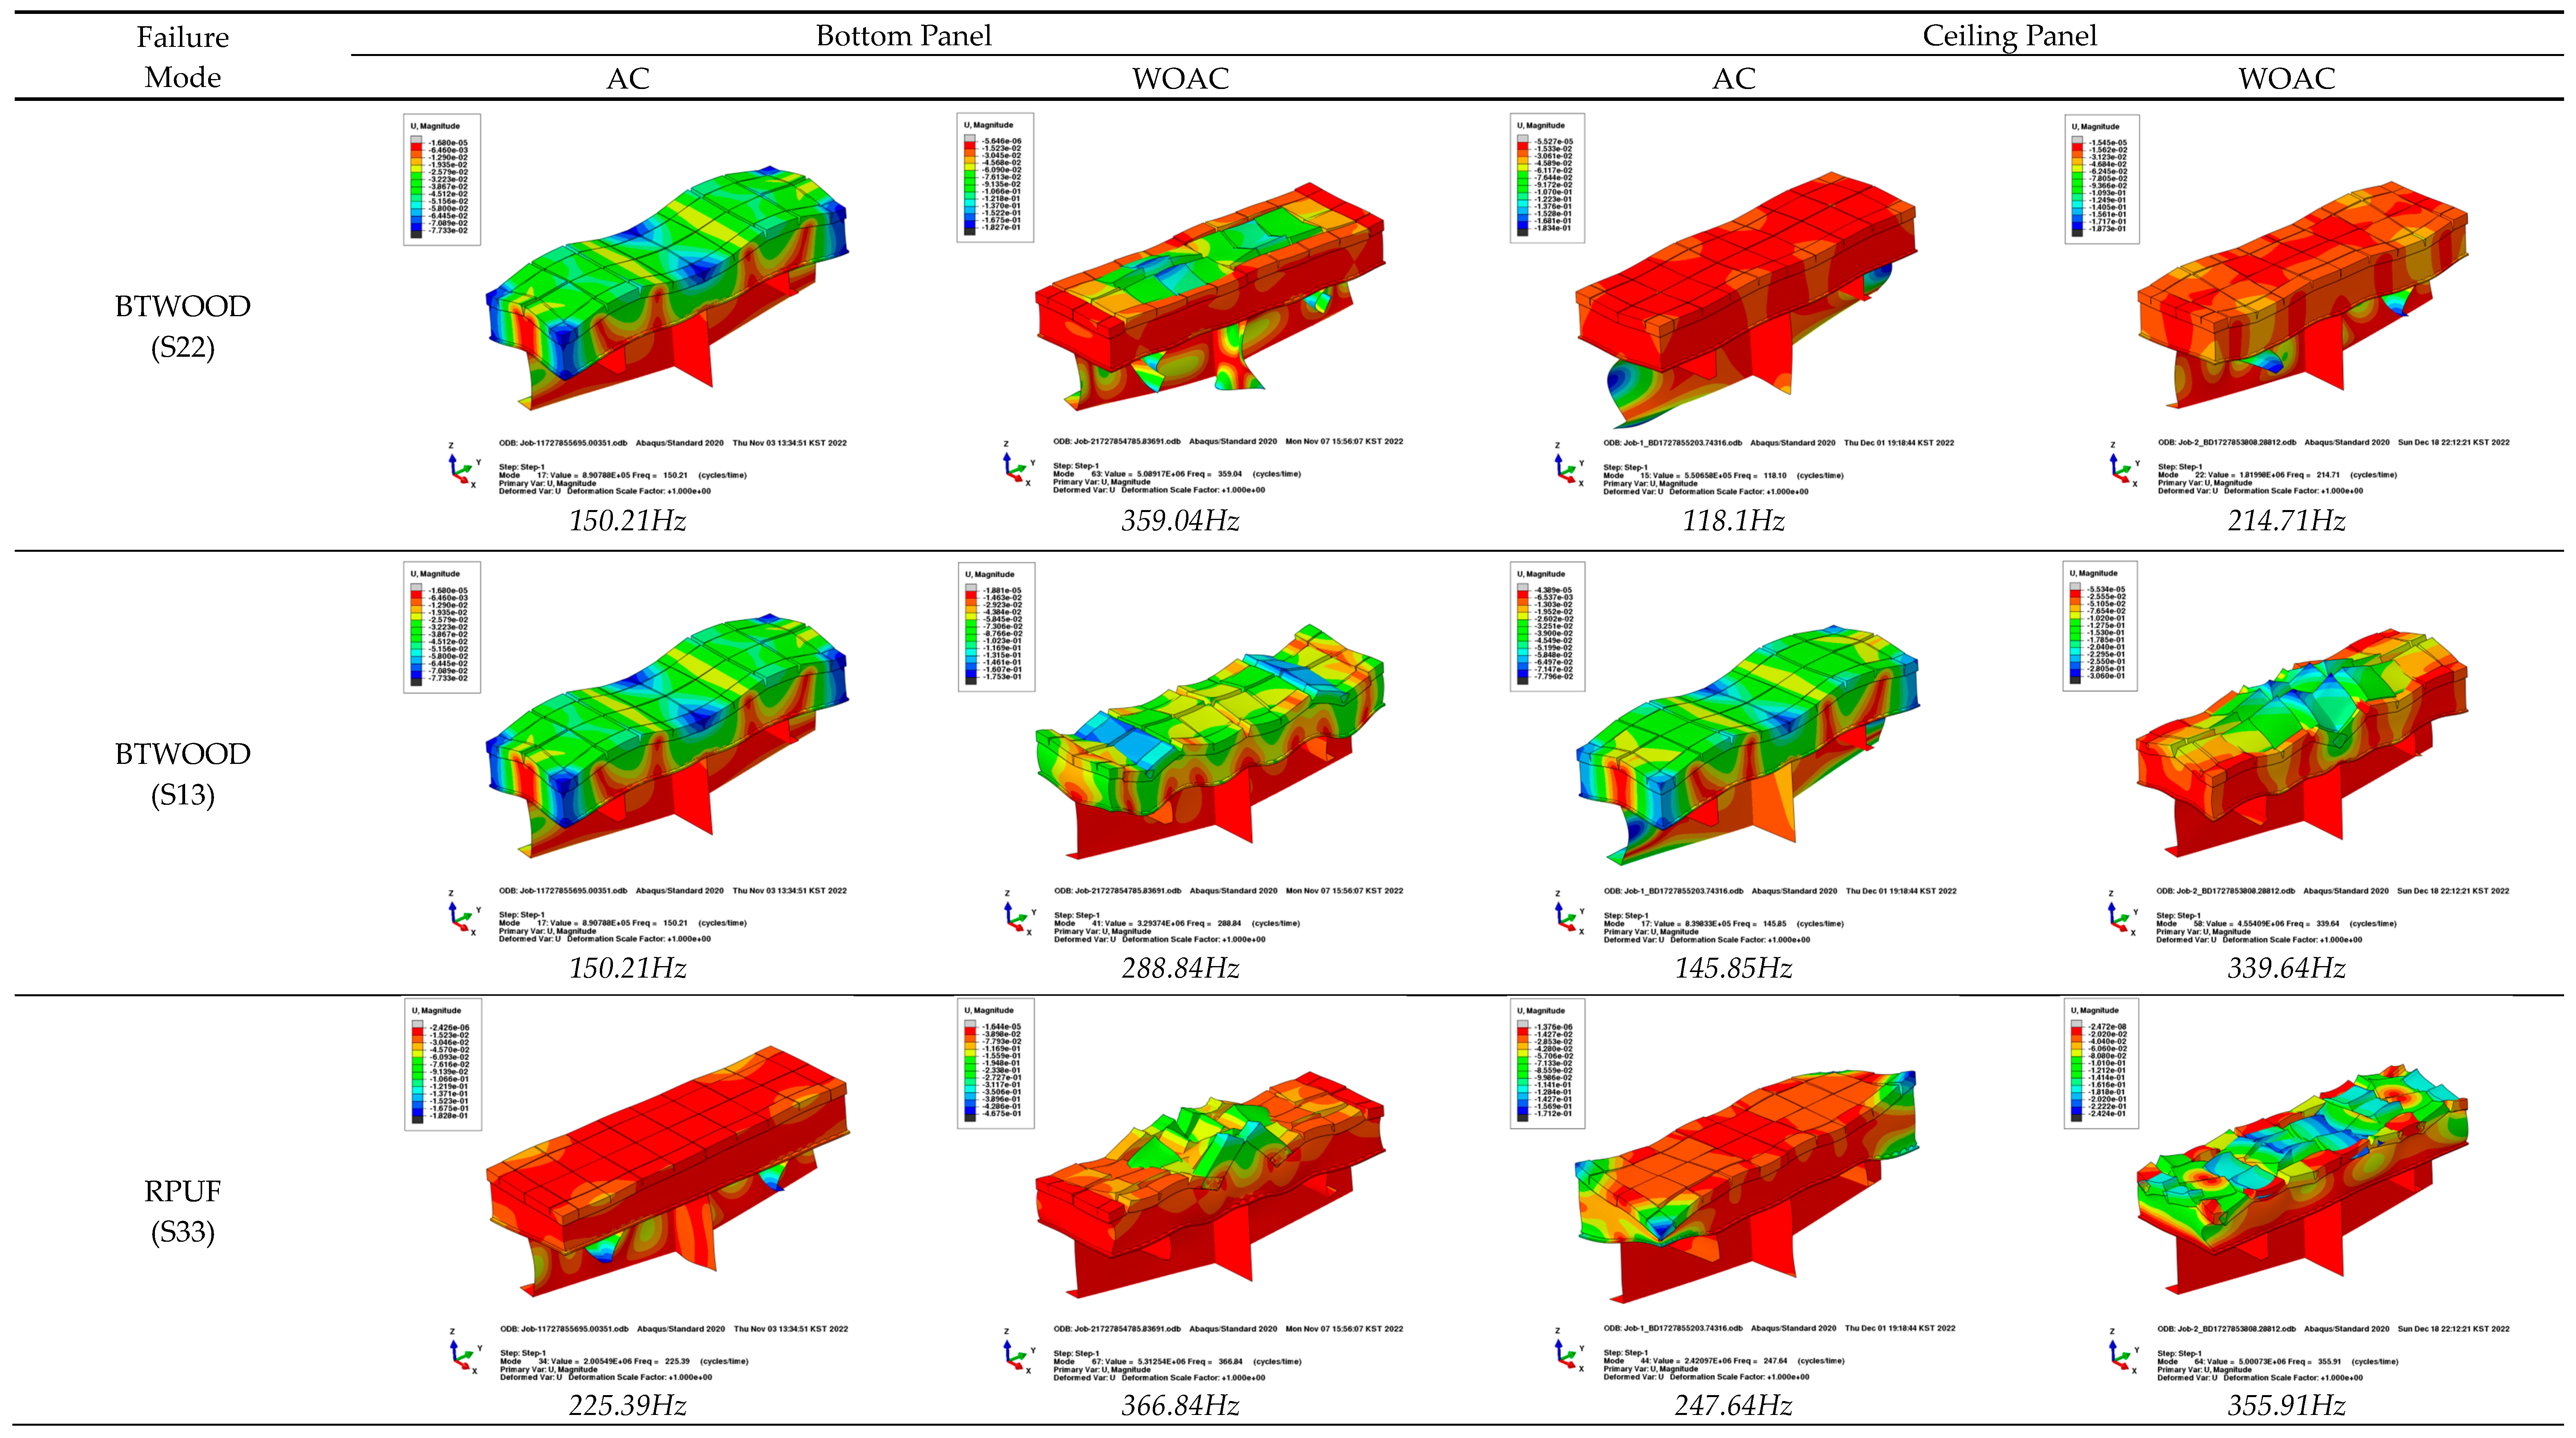
The normal mode analyses were conducted to obtain the natural frequency and mode shape for each upper and lower hull structure with and without AC conditions. The results are illustrated in Figure 14. For the evaluation of the inner bottom (here and after ‘bottom’) and inner deck (here and after ‘ceiling’) structures within the cargo tanks of the LNG carrier, two hull models are applied, as previously shown in Figure 7. Subsequently, these will be compared with the frequency results of the stress responses obtained from dynamic structural analysis, and the dominant mode shapes for each failure mode will be investigated.

6. Dynamic Structural Responses Using Impulse Superposition Method

6.1. Triangular Impulse Superposition Method (TISM)

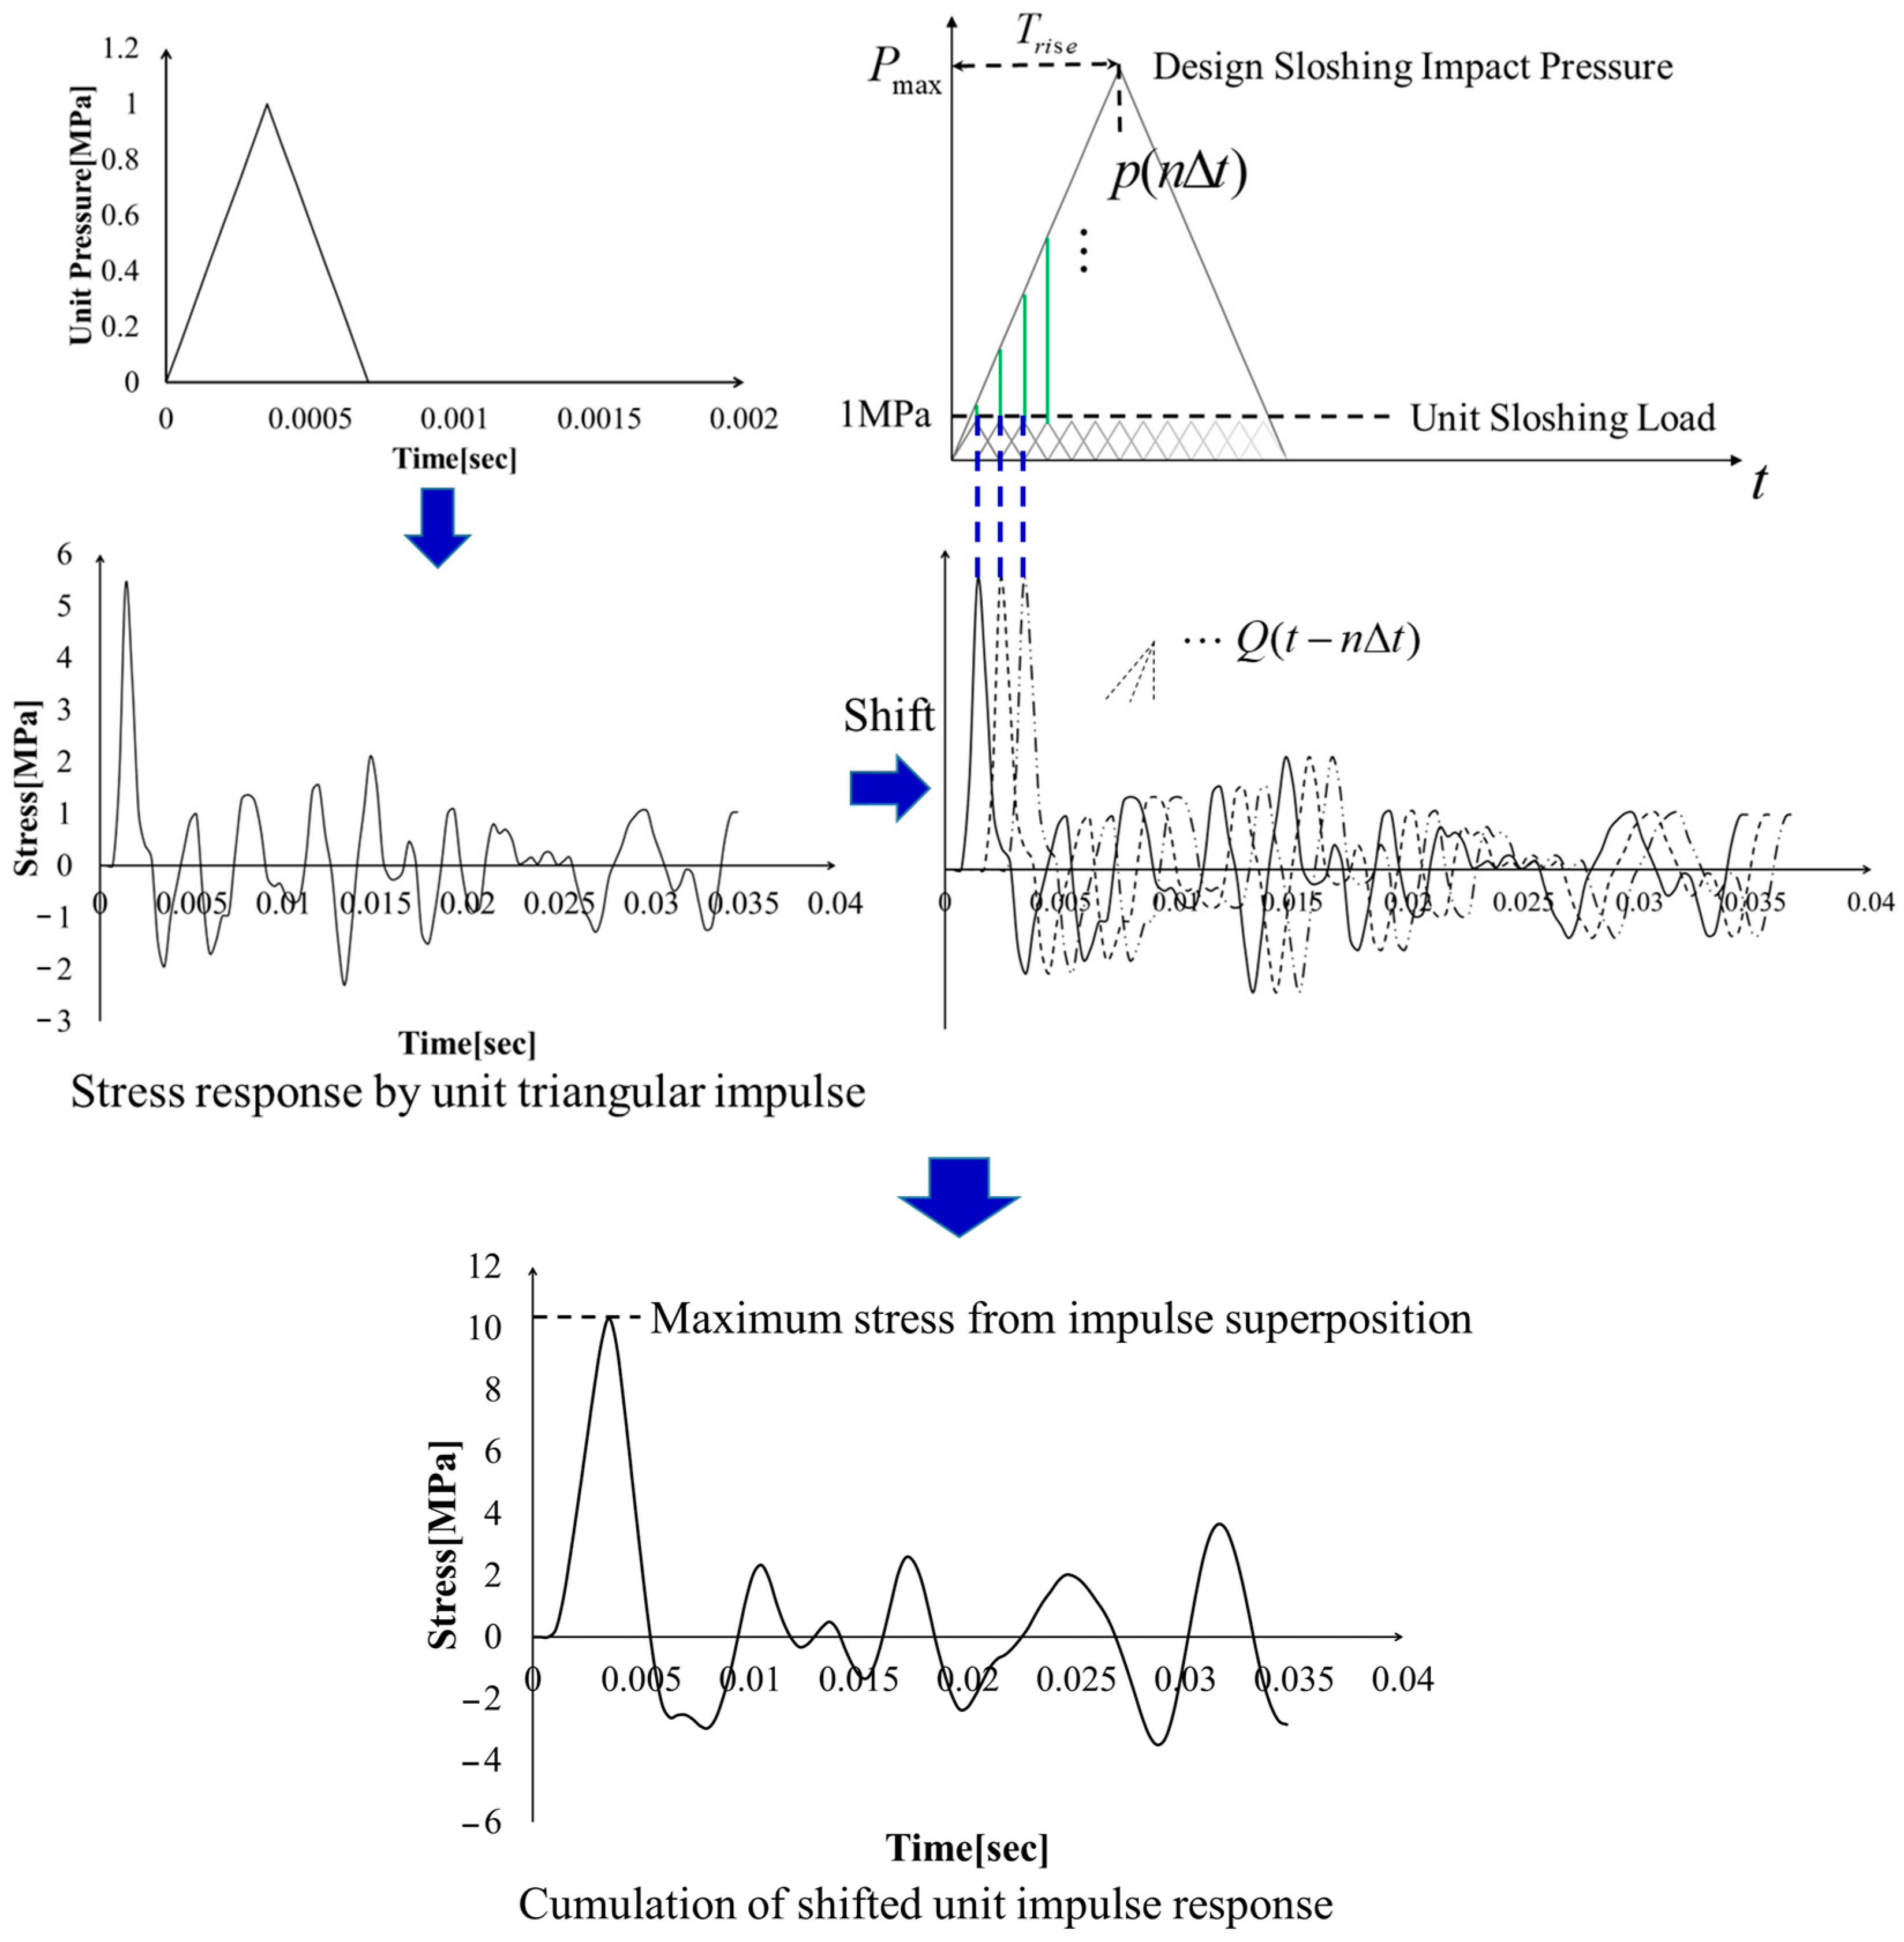
Based on the large number of load profiles defined in this manner, many structural analyses have been performed, and the entire process of postprocessing and evaluation is time-consuming. Therefore, this linear superposition approach is a powerful tool in the field of mechanical vibrations for analyzing the dynamic behavior of systems subjected to impulse inputs. This allows the determination of system responses without the need for complex mathematical calculations or numerous structural analyses. This method has been verified and widely used in many fields, and its efficiency and results have been recognized as valid [30,35].
The equation of motion for a single-degree-of-freedom (SDOF) linear structural system is represented by the following simple equation:
M u ¨ + C u ˙ + K u = p t ,
where M, C, K, and p t denote the mass, damping, stiffness, and external force, respectively. The stress responses of the triangular impulse are obtained from the solution of the linear system. The triangular impulse function applied in this study had a symmetric triangular shape with a short rise time. The magnitude and time history of the external forcing term are defined by the following functions, p t , given by the following:
      p m a x t T r i s e       f o r     t < T r i s e p t = p m a x T d u r a t i o n t ( T d u r a t i o n T r i s e )       f o r     T r i s e t < T d u r a t i o n 0                                       o t h e r w i s e .
In a linear structural system, the stress response σ t for any arbitrary external load p t can be expressed by the impulse response function using the following convolution formula:
σ t = p τ Q t τ d τ ,
where Q(t) denotes the stress response of the triangular impulse unit. The discretized convolution of Equation (6) can be defined as the sum of the individual responses at each time step as follows. The calculation procedure of this method is shown in Figure 15.
σ t = m = 0 n p m + 1 Δ t Q t m Δ t .
The rising time of the sloshing impact unit pressure used in the calculations was 0.35 ms, corresponding to the Froude-scale value at a pressure sensor sampling frequency of 20 kHz. This represents the minimum value required to predict the stress response accurately using the impulse superposition method.

6.2. Dynamic Structural Capacity of the CCS and Hull

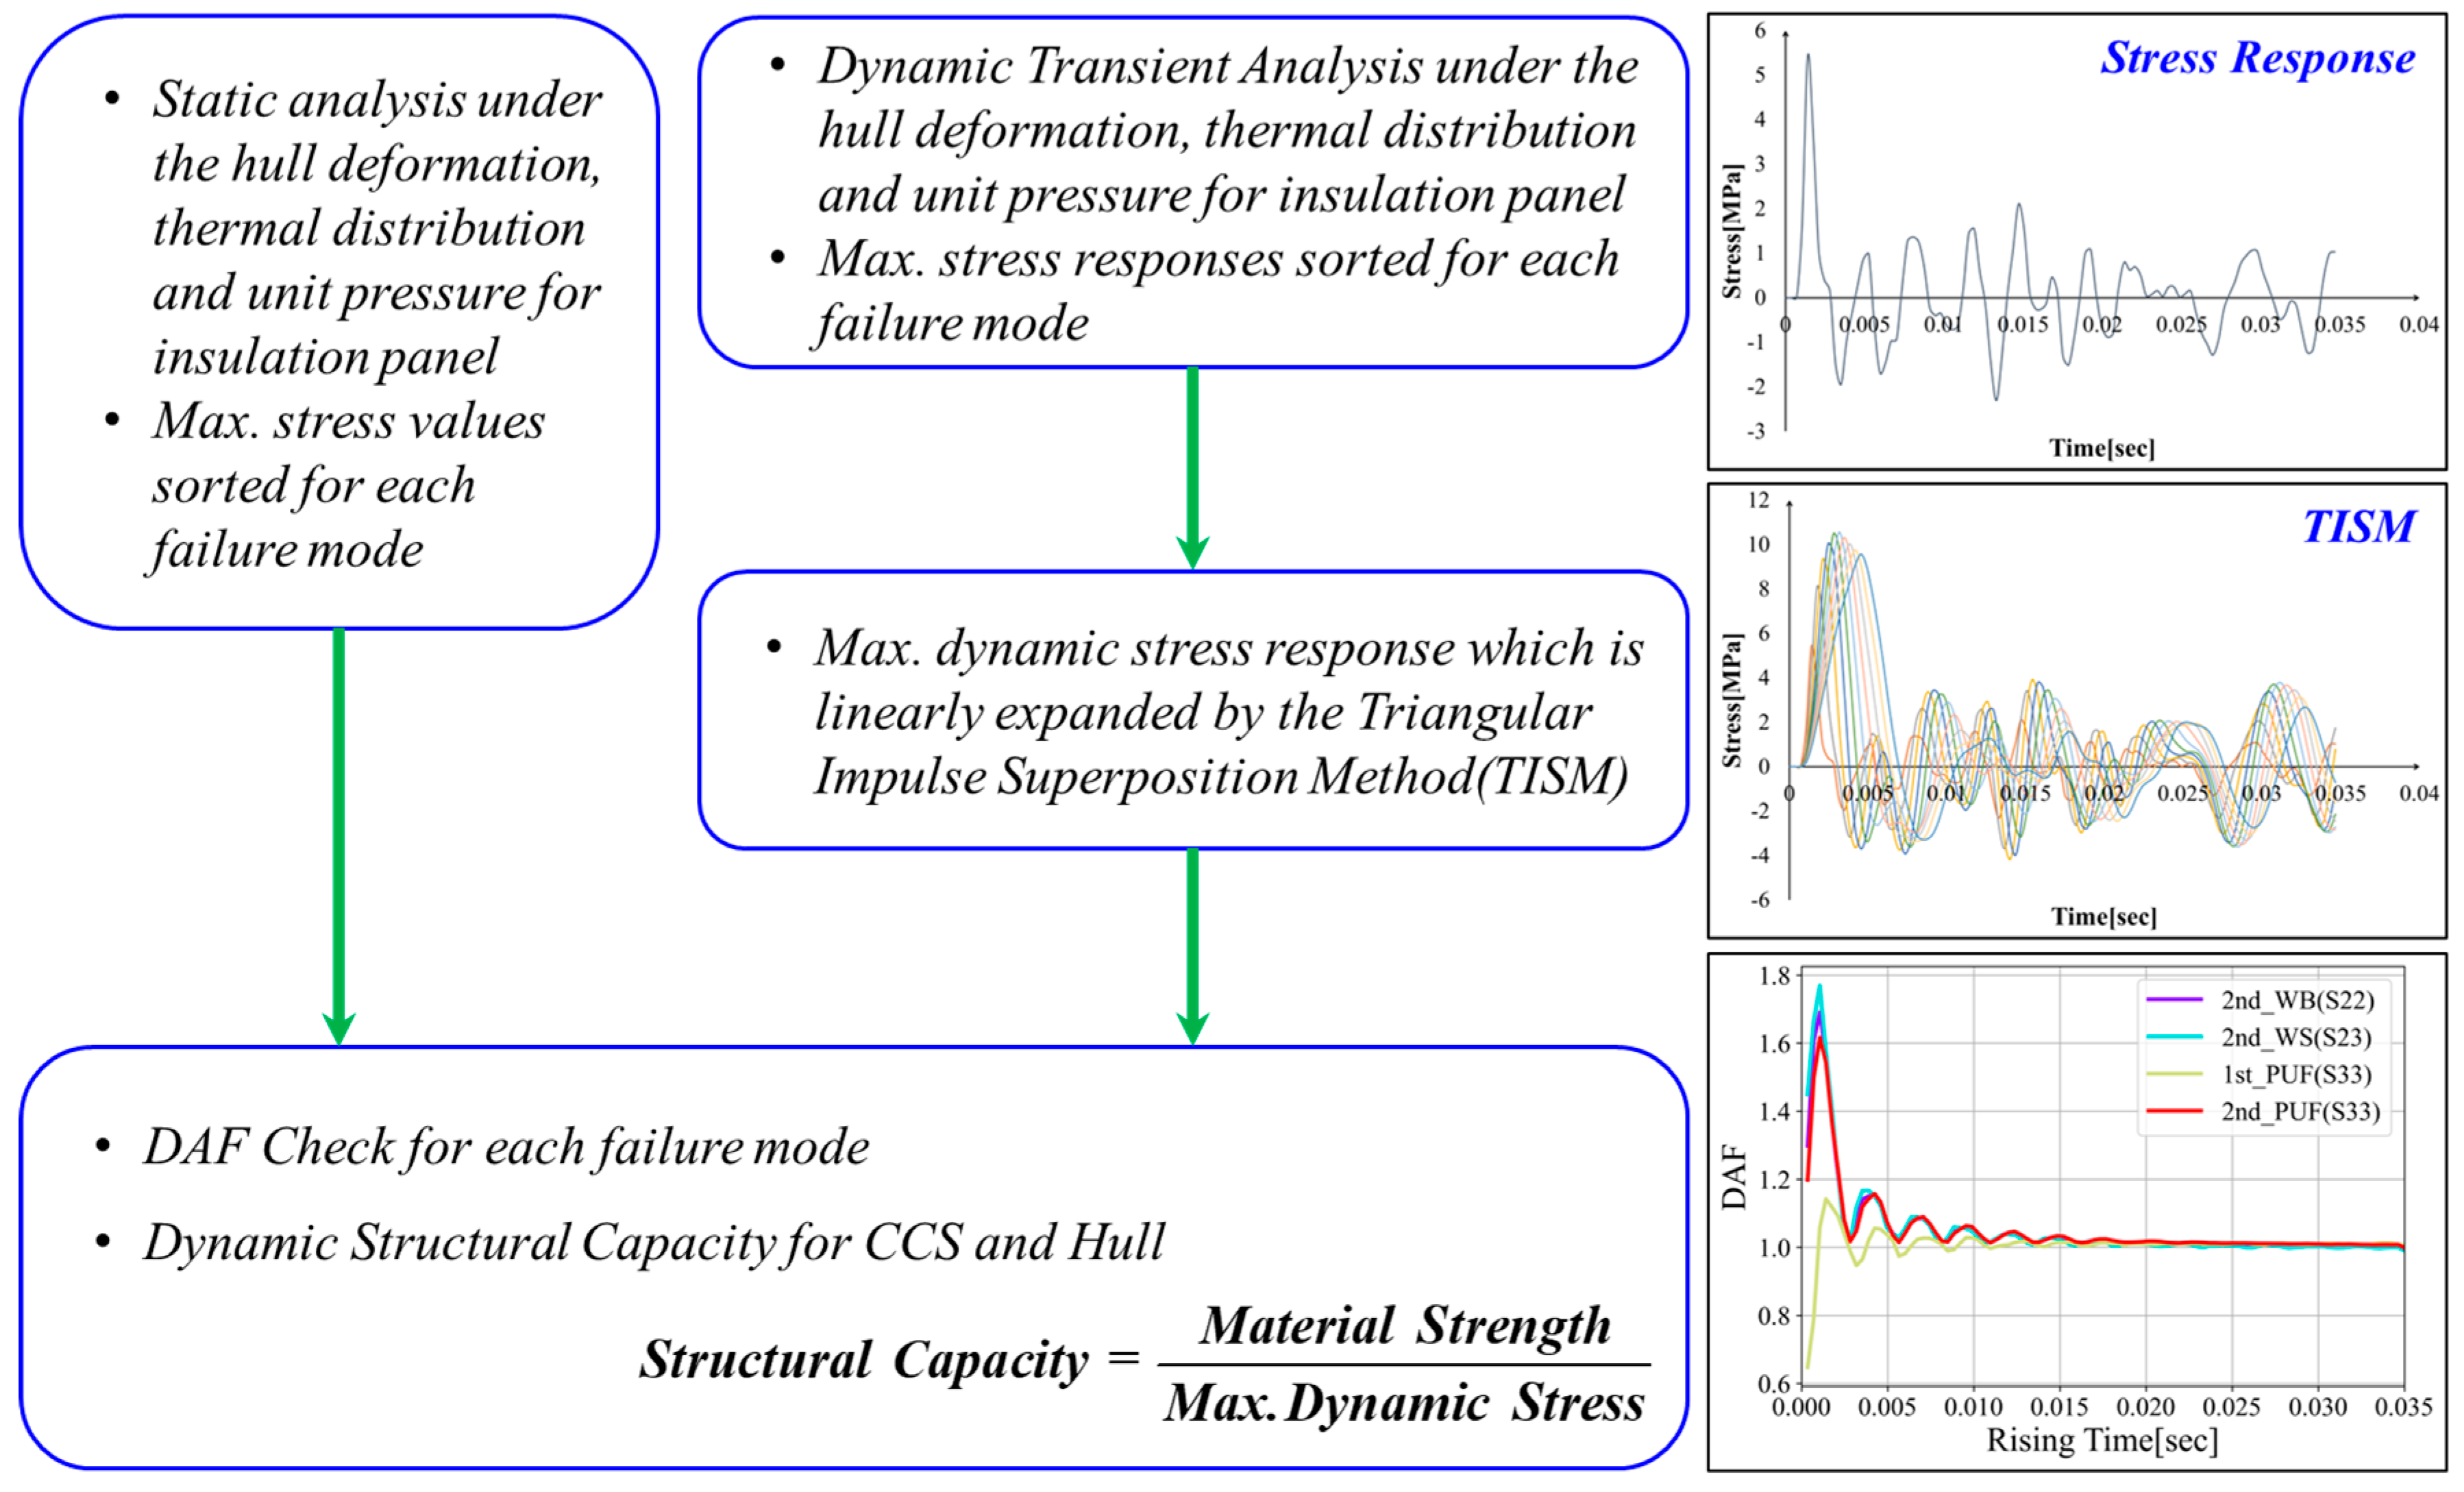
To define the limit state of the structure under sloshing loads, the dynamic structural capacity and amplification factors for the upper and lower hulls, as well as the CCS structure of a 174k-class LNG carrier, were defined. The procedure used to define the dynamic structural capacity and amplification factors is shown in Figure 16.
The location of the maximum stress in the CCS due to the unit impact load varied under the AC and WOAC conditions, as shown in Figure 17. In the case of the lower plywood, the locations of the maximum stresses for the bending and shear failure modes were similar. For the first RPUF, both the AC and WOAC conditions showed maximum stress values at the slit geometrical discontinuity, which can cause stress concentration. However, for the second RPUF, the maximum stress location differed for the AC and WOAC conditions. In the case of the WOAC, the maximum stress was observed immediately above the boundary of the insulation panel near the lower plywood.
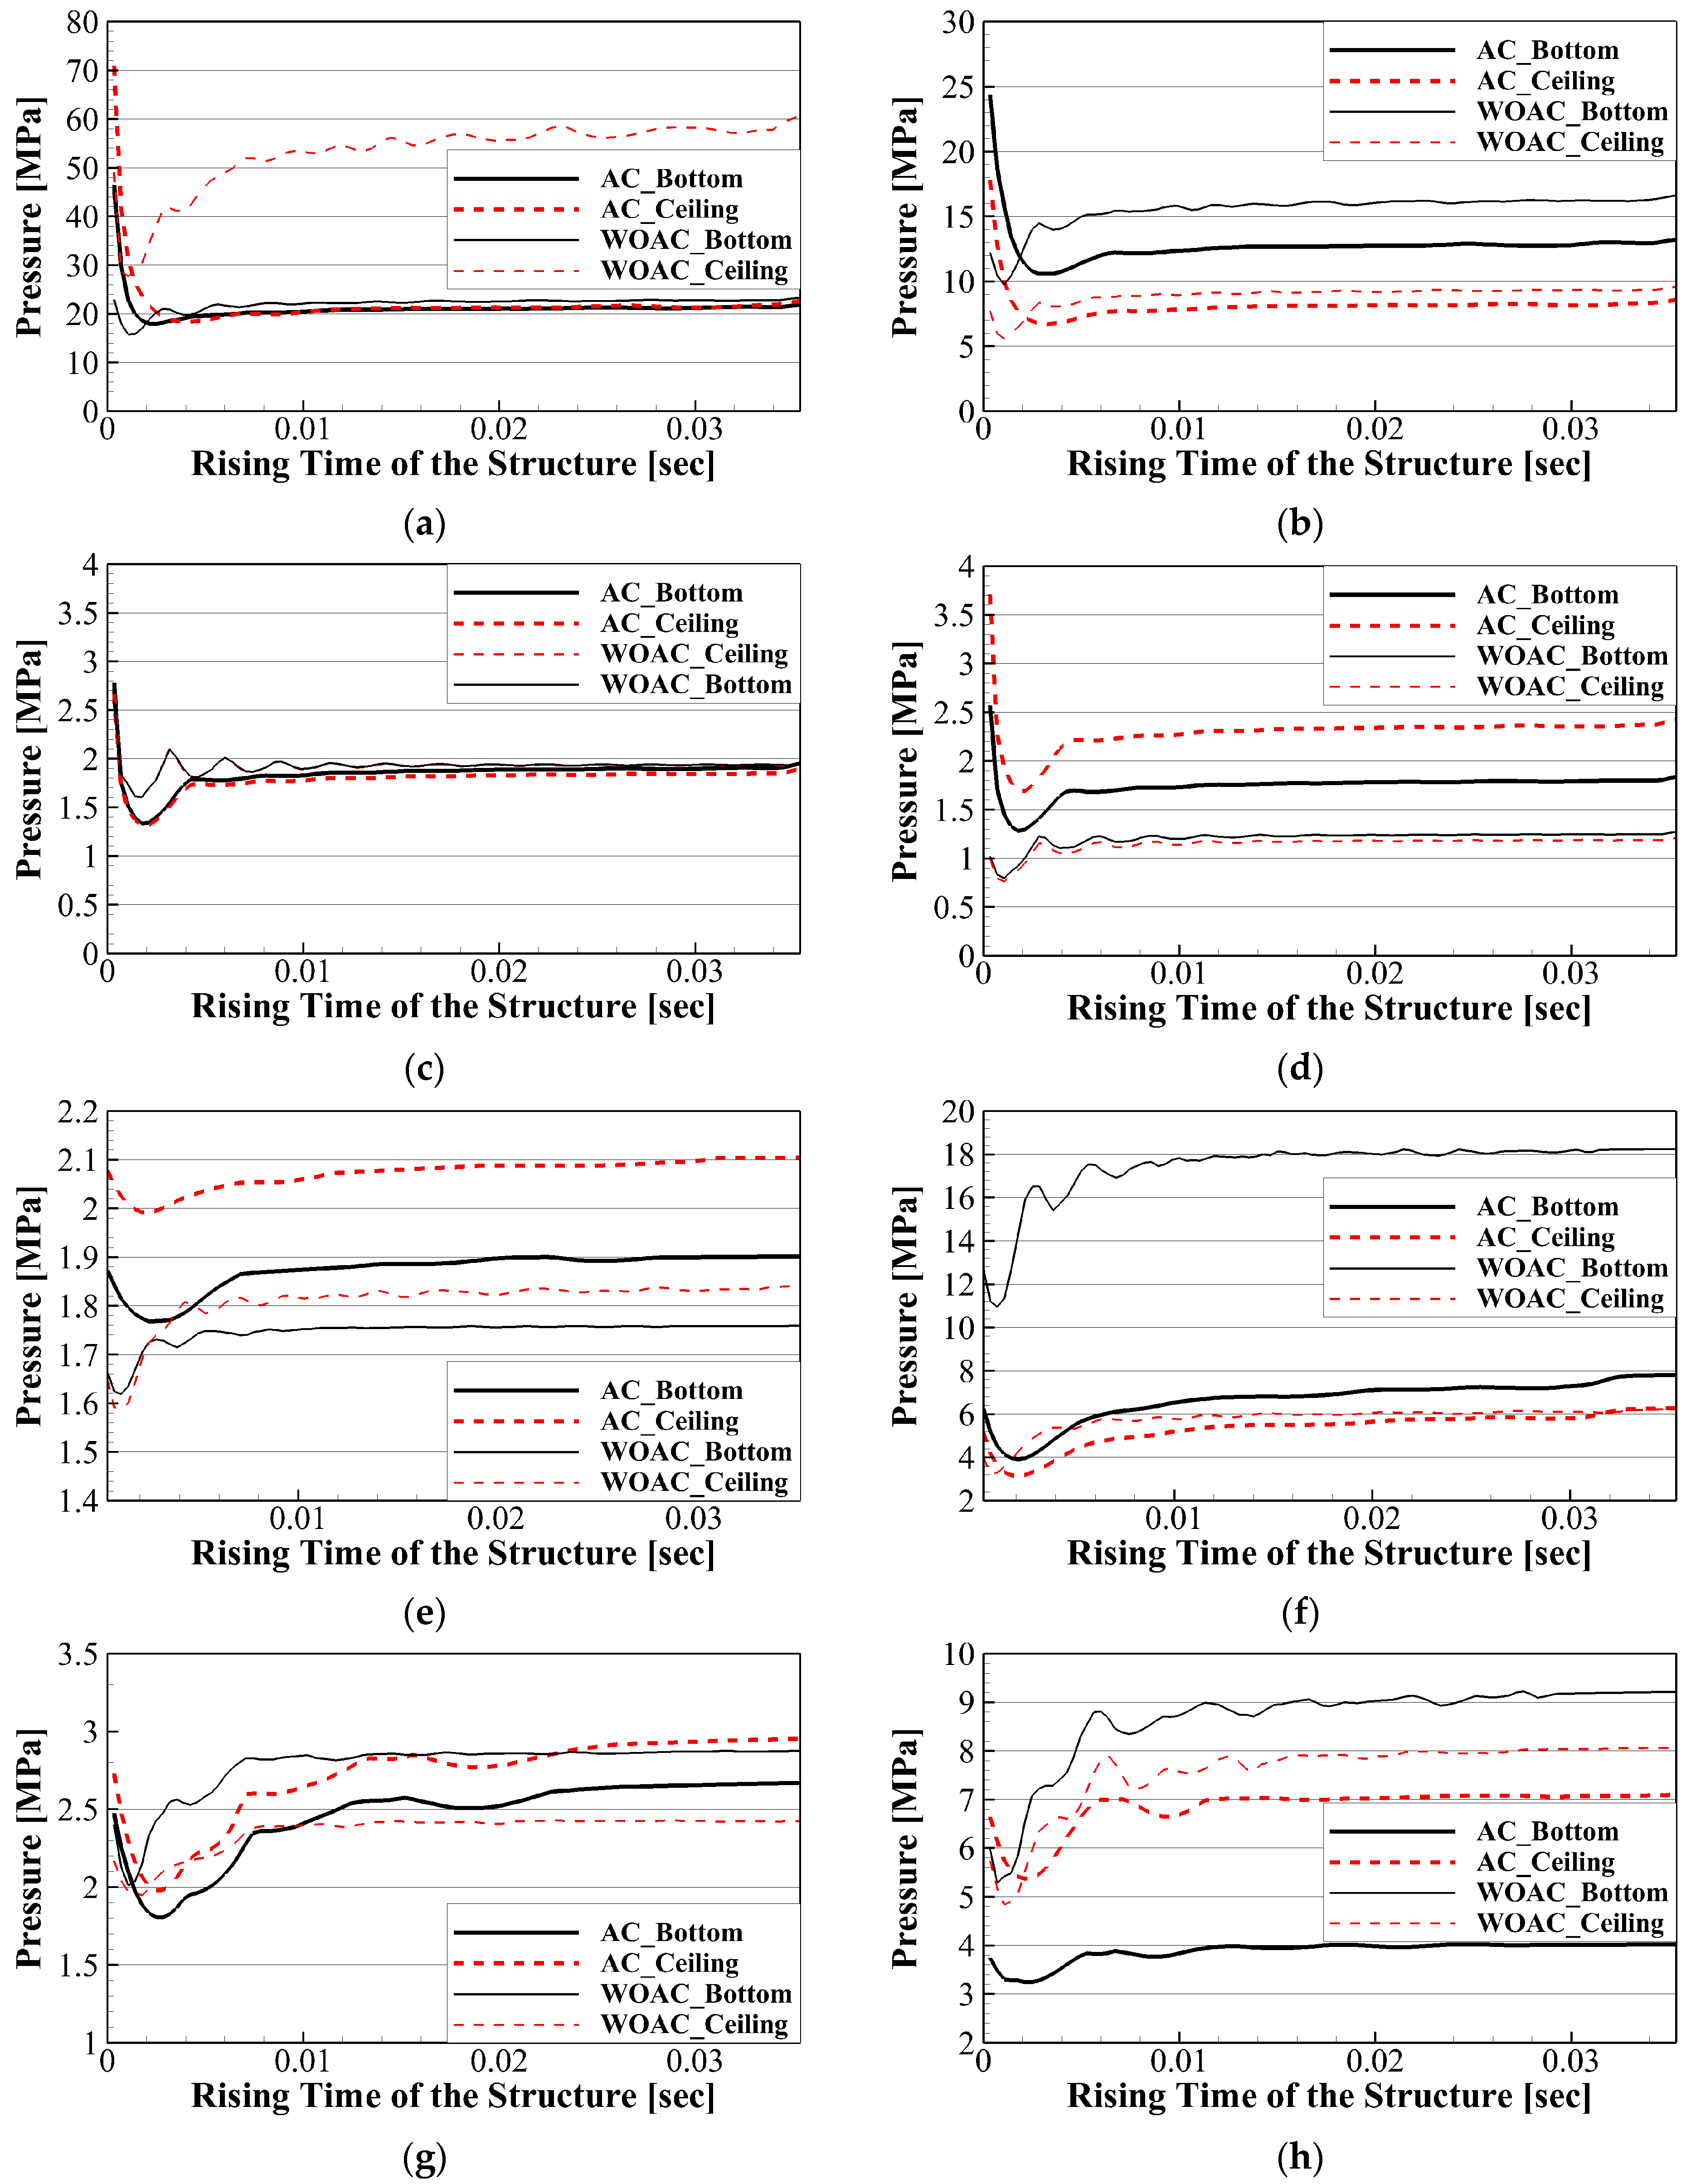
However, under the AC condition, the maximum stress location was near the upper boundary of the second barrier due to the interactions. The dynamic structural capacities of the structure, considering the failure modes, are shown in Figure 18. The y-axis of the graph is obtained by multiplying the maximum pressure of the triangular unit impulse by the dimensionless capacity.
The overall results showed that the rising time with the minimum structural capacity under the AC condition was delayed compared to that under the WOAC condition. This delay can be attributed to the fluid resistance caused by interactions, resulting in a time-lag phenomenon in the structural capacity. The time lag exhibited an increase of approximately 3 times in the bottom CCS and approximately 2.67 times in the hull. However, for the ceiling CCS, the time lag increased by up to 3.67 times and increased by approximately 3.5 times in the hull. The time lag results for each failure mode are listed in Table 4.
Under the AC condition, the dynamic structural capacity of the lower plywood bending and first RPUF crushing exhibited similar behaviors in both the ceiling and bottom structures. In contrast, under the WOAC condition, the first and second RPUF crushing modes exhibited similar time lags for both structures. This result indicated that the first RPUF crushing had a lower structural capacity under the AC condition owing to the interactions, which was consistent in both the bottom and ceiling structures. Conversely, for the second RPUF, the structural capacity was lower under WOAC conditions. This suggests that the first RPUF, which was closer to the fluid region, was more likely to be affected by the hydroelastic effect, resulting in a lower structural capacity than the second RPUF.
The results of the FFT analysis of the stress response under the AC and WOAC conditions for the ceiling and bottom structures are summarized in Table 5. Additionally, the natural frequencies obtained from the normal mode analysis can be confirmed to be similar to the frequencies obtained from the FFT of the dynamic stress response, and the corresponding mode shapes are previously shown in Figure 14. From the analysis, it was evident that, under the AC condition, the response frequencies were generally lower than those under the WOAC condition. Except for the RPUF, most modes exhibited frequencies below 200 Hz. At lower frequencies, the dominant modes were associated with the hull; as the frequency increased, they appeared at the CCS modes and combined modes of the hull and CCS. Under the AC conditions, the dominant mode was associated with the hull, whereas the overall CCS mode was associated with it. However, higher frequencies were observed in the WOAC condition and, as a result, the local CCS modes became dominant.

6.3. Dynamic Amplification Factor of CCS and Hull

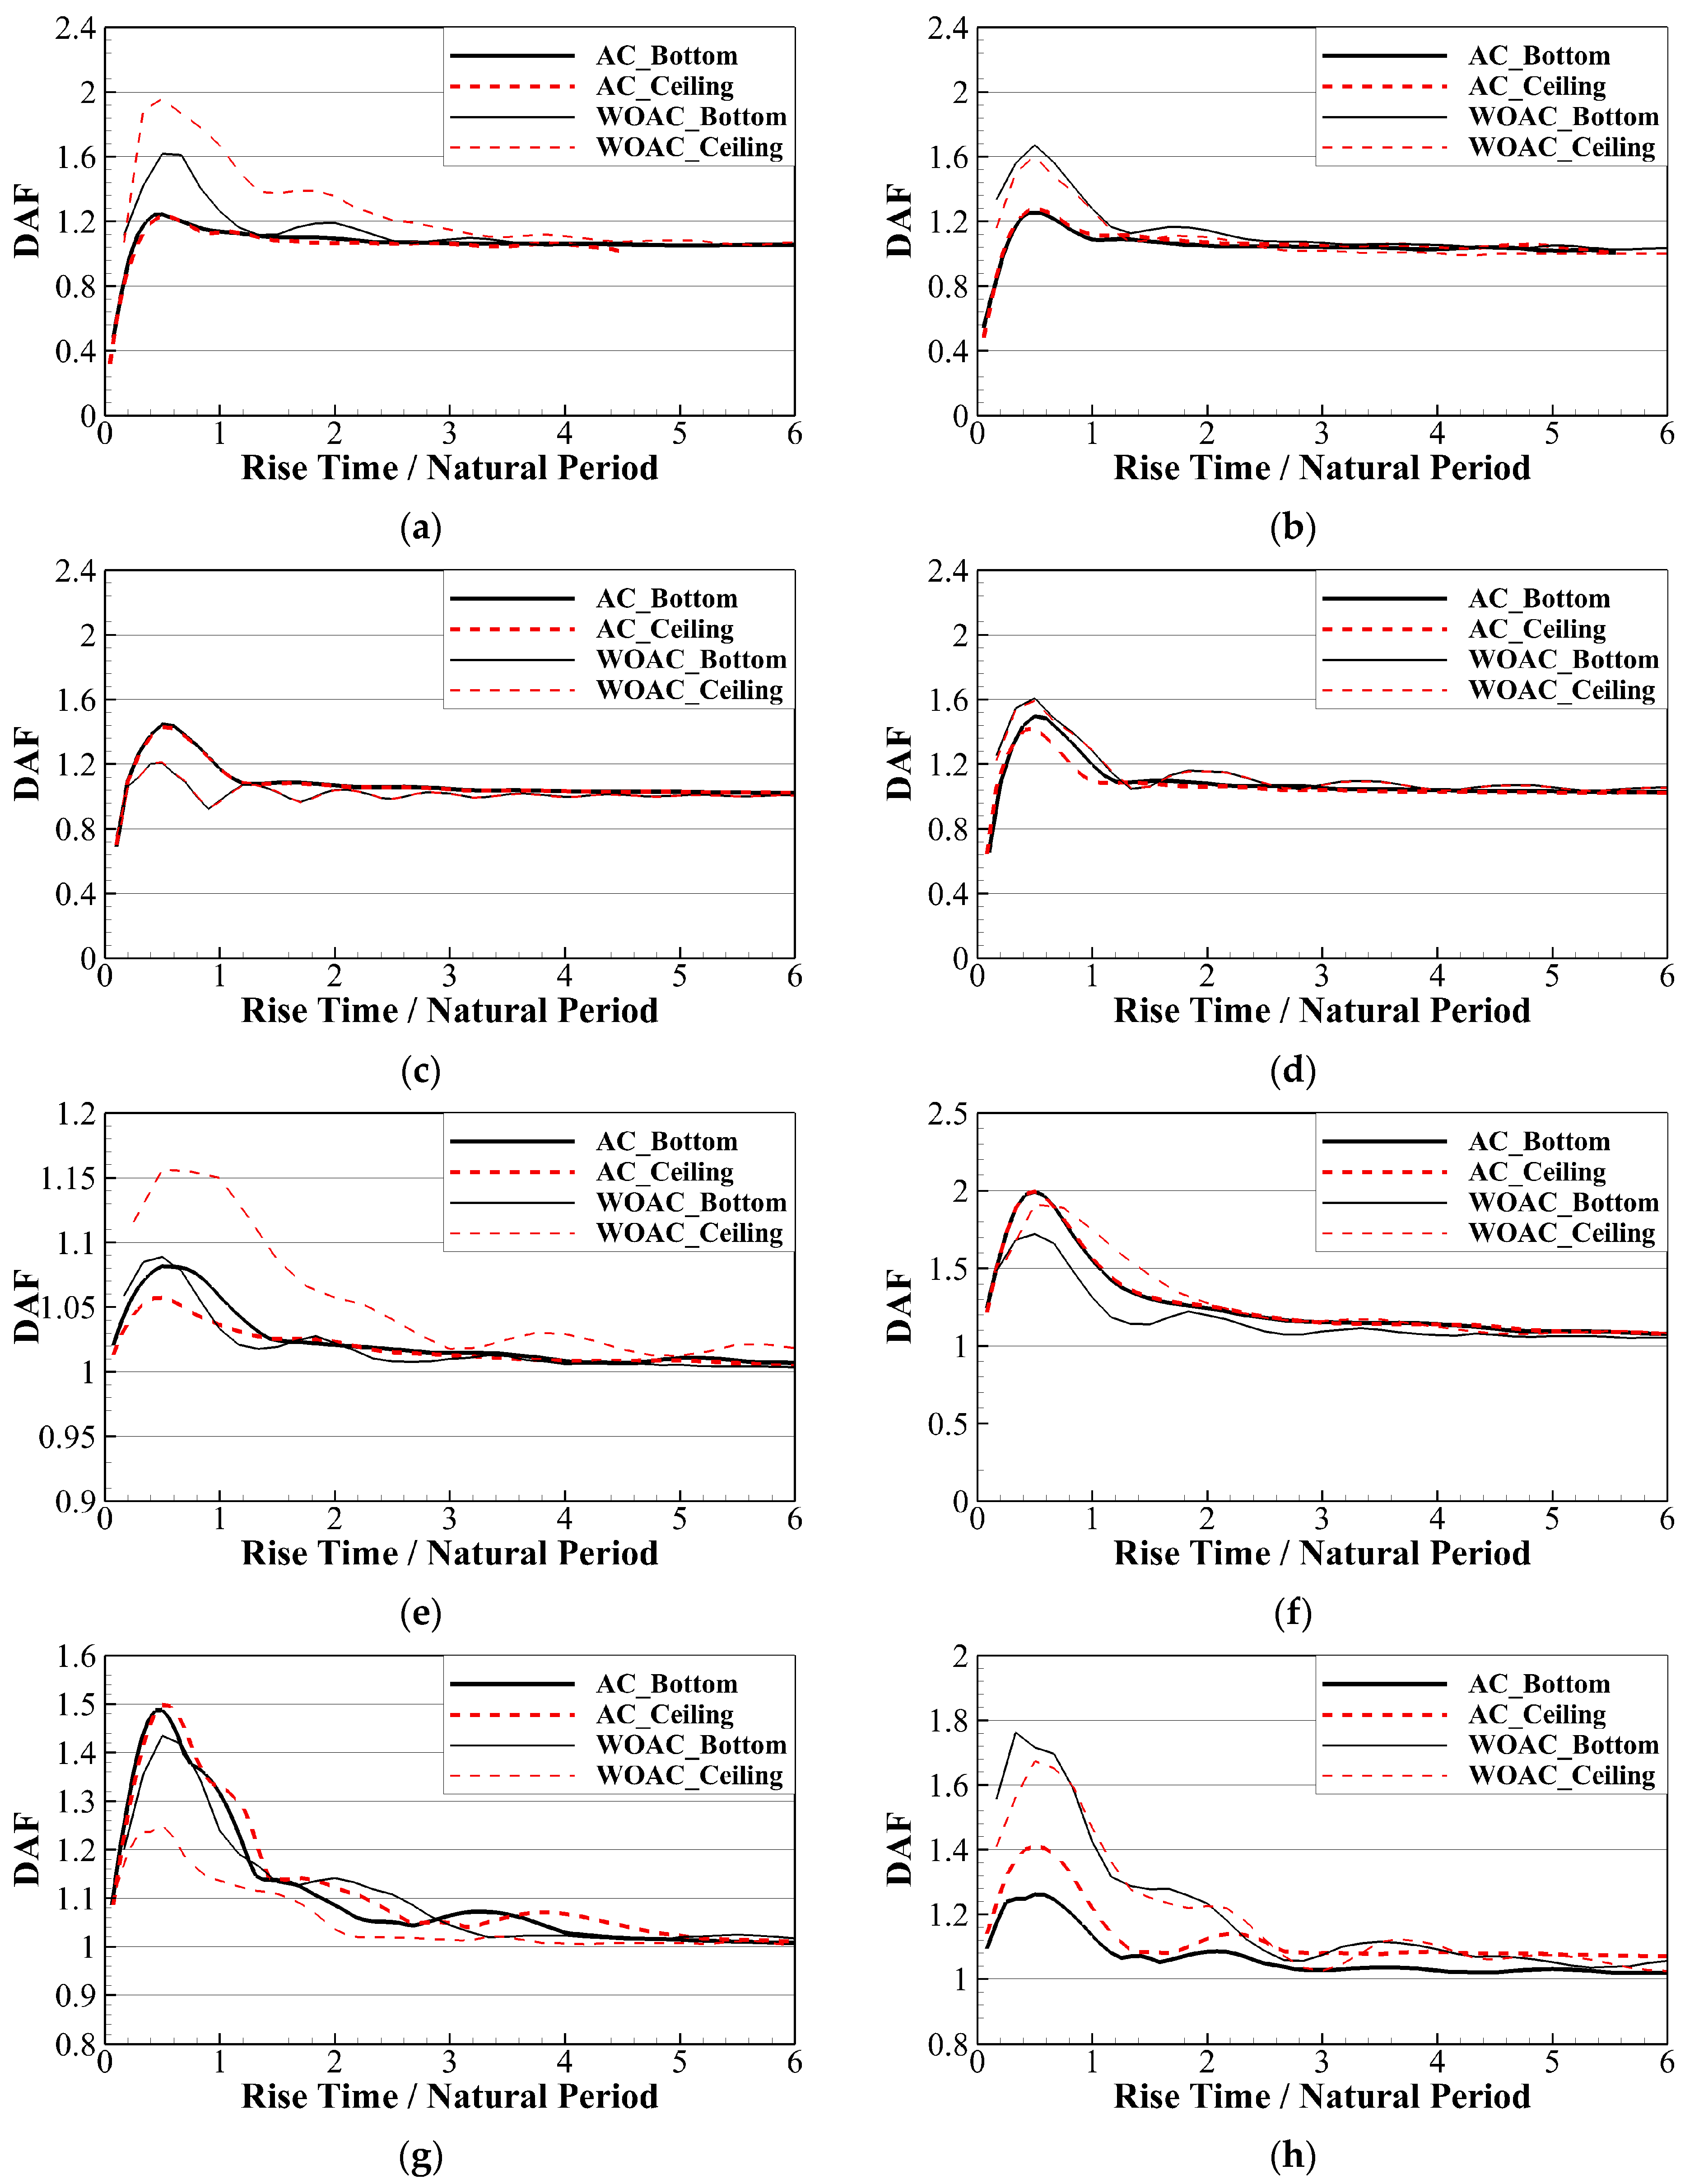
The dynamic amplification factor (DAF) can be defined based on the results obtained from static and dynamic analyses, and the DAF curves can be derived for each component, leading to different maximum values. The DAF curves for each failure mode under the AC and WOAC conditions for both the ceiling and bottom structures are shown in Figure 19, and the corresponding maximum DAF values are listed in Table 6.
From a structural dynamic perspective, the maximum values of the DAF are influenced by the type of applied load. Under the WOAC condition, the results for the CCS area indicated a tendency for the DAF value to increase in the lower plywood, which was the component farthest from the location where the load was applied. Furthermore, it was the most significant for the hull bending mode, indicating a higher likelihood of a dynamic stress increase owing to hydroelastic effects. In addition, the ceiling, where the hull was relatively thinner, also exhibited the highest DAF value.

7. Results of Sloshing Assessment

7.1. Conditions of Sloshing Assessment

In this study, a sloshing assessment was performed by comparing the structural analysis results of all the tests with different liquids and gases against the previously determined dynamic structural capacity. The analysis focused on the maximum impact pressure, the rising time of the maximum pressure, and the dynamic structural capacity. To conduct the evaluation, the UT values were calculated based on the results of 500 cycles of model testing and directly applied to the average values of the ten highest impact loads. Owing to a lack of data, heavy gas with water was not included in the high-filling cases. The frequency ratios of motion excitation applied in the sloshing assessment are summarized in Table 7.

7.2. Definition of the Utilization Factors

The design sloshing loads from the model test were extended to full scale using Froude scaling and compared with the dynamic structural capacity based on the triangular impulse superposition method. The scale between the model and full CCS is 1:50, and the time signal of the impulse pressure on the real scale becomes the following:
p t = p model t ρ real ρ model H real H model ,
where the subscript ‘model’ means the property in the model test and ‘real’ means the property in the real scale.
The utilization factor (UT) in Equation (8) is defined as the safety index of the final assessment, which is based on the ratio of the sloshing load to the dynamic structural capacity (Figure 20).
U T = Design Sloshing Loads Dynamic Structural Capacity

7.3. Utilization Factors with and without Fluid–Structure Interaction

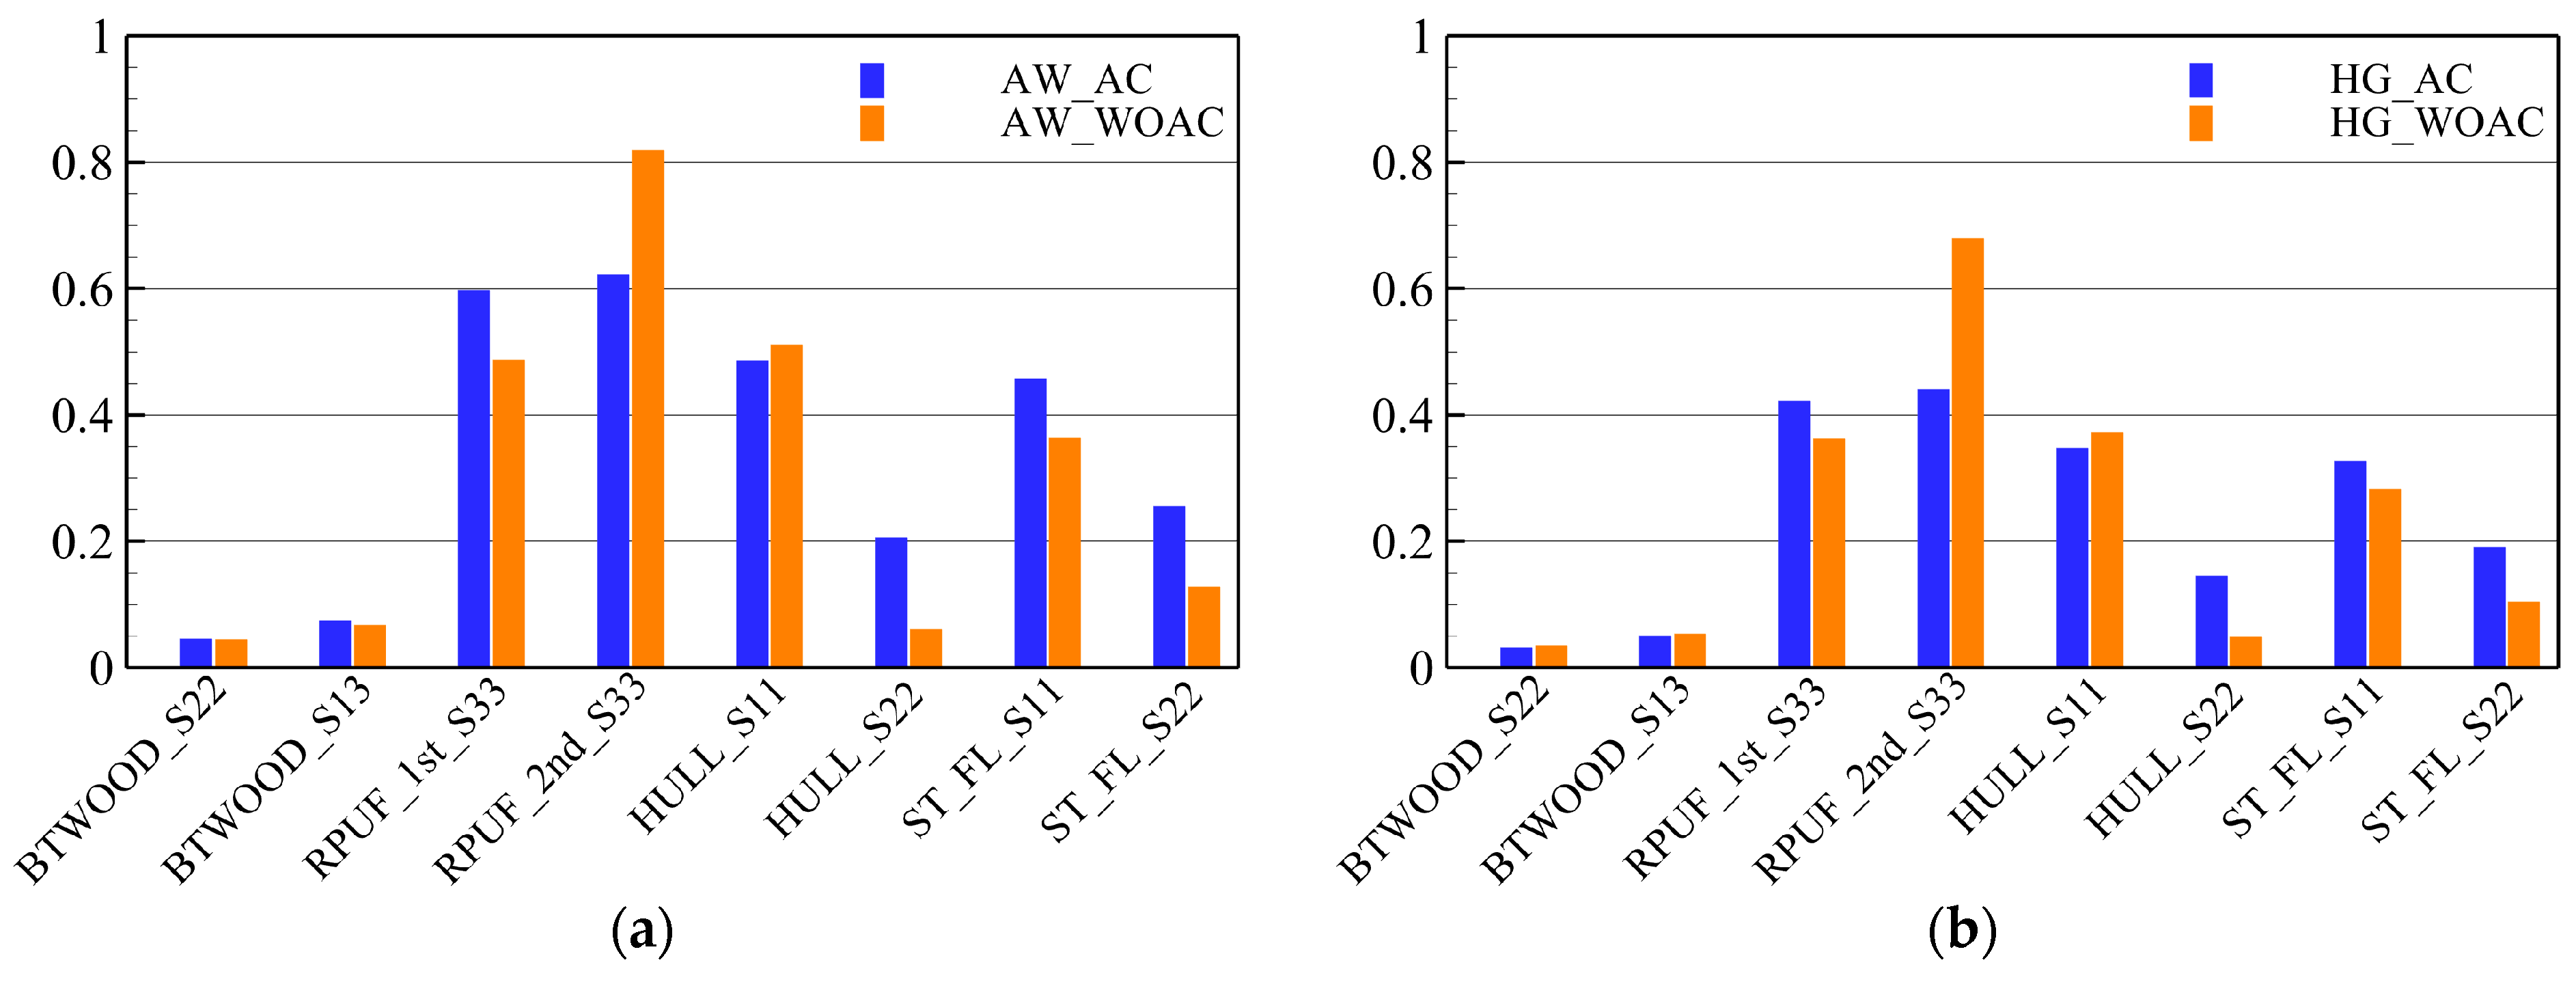
The UF values for the CCS and hull at the bottom are presented in Figure 21. Overall, the UT values were highest in the water and air case, followed by a decrease in the water and heavy gas, NOVEC at 25 °C, and NOVEC at 34 °C cases. The second RPUF crushing mode under WOAC conditions exhibited the lowest structural safety, resulting in a higher UT value. For both the first RPUF crushing and Hull_S22, the dynamic structural capacities were lower under AC conditions, leading to larger UT values.
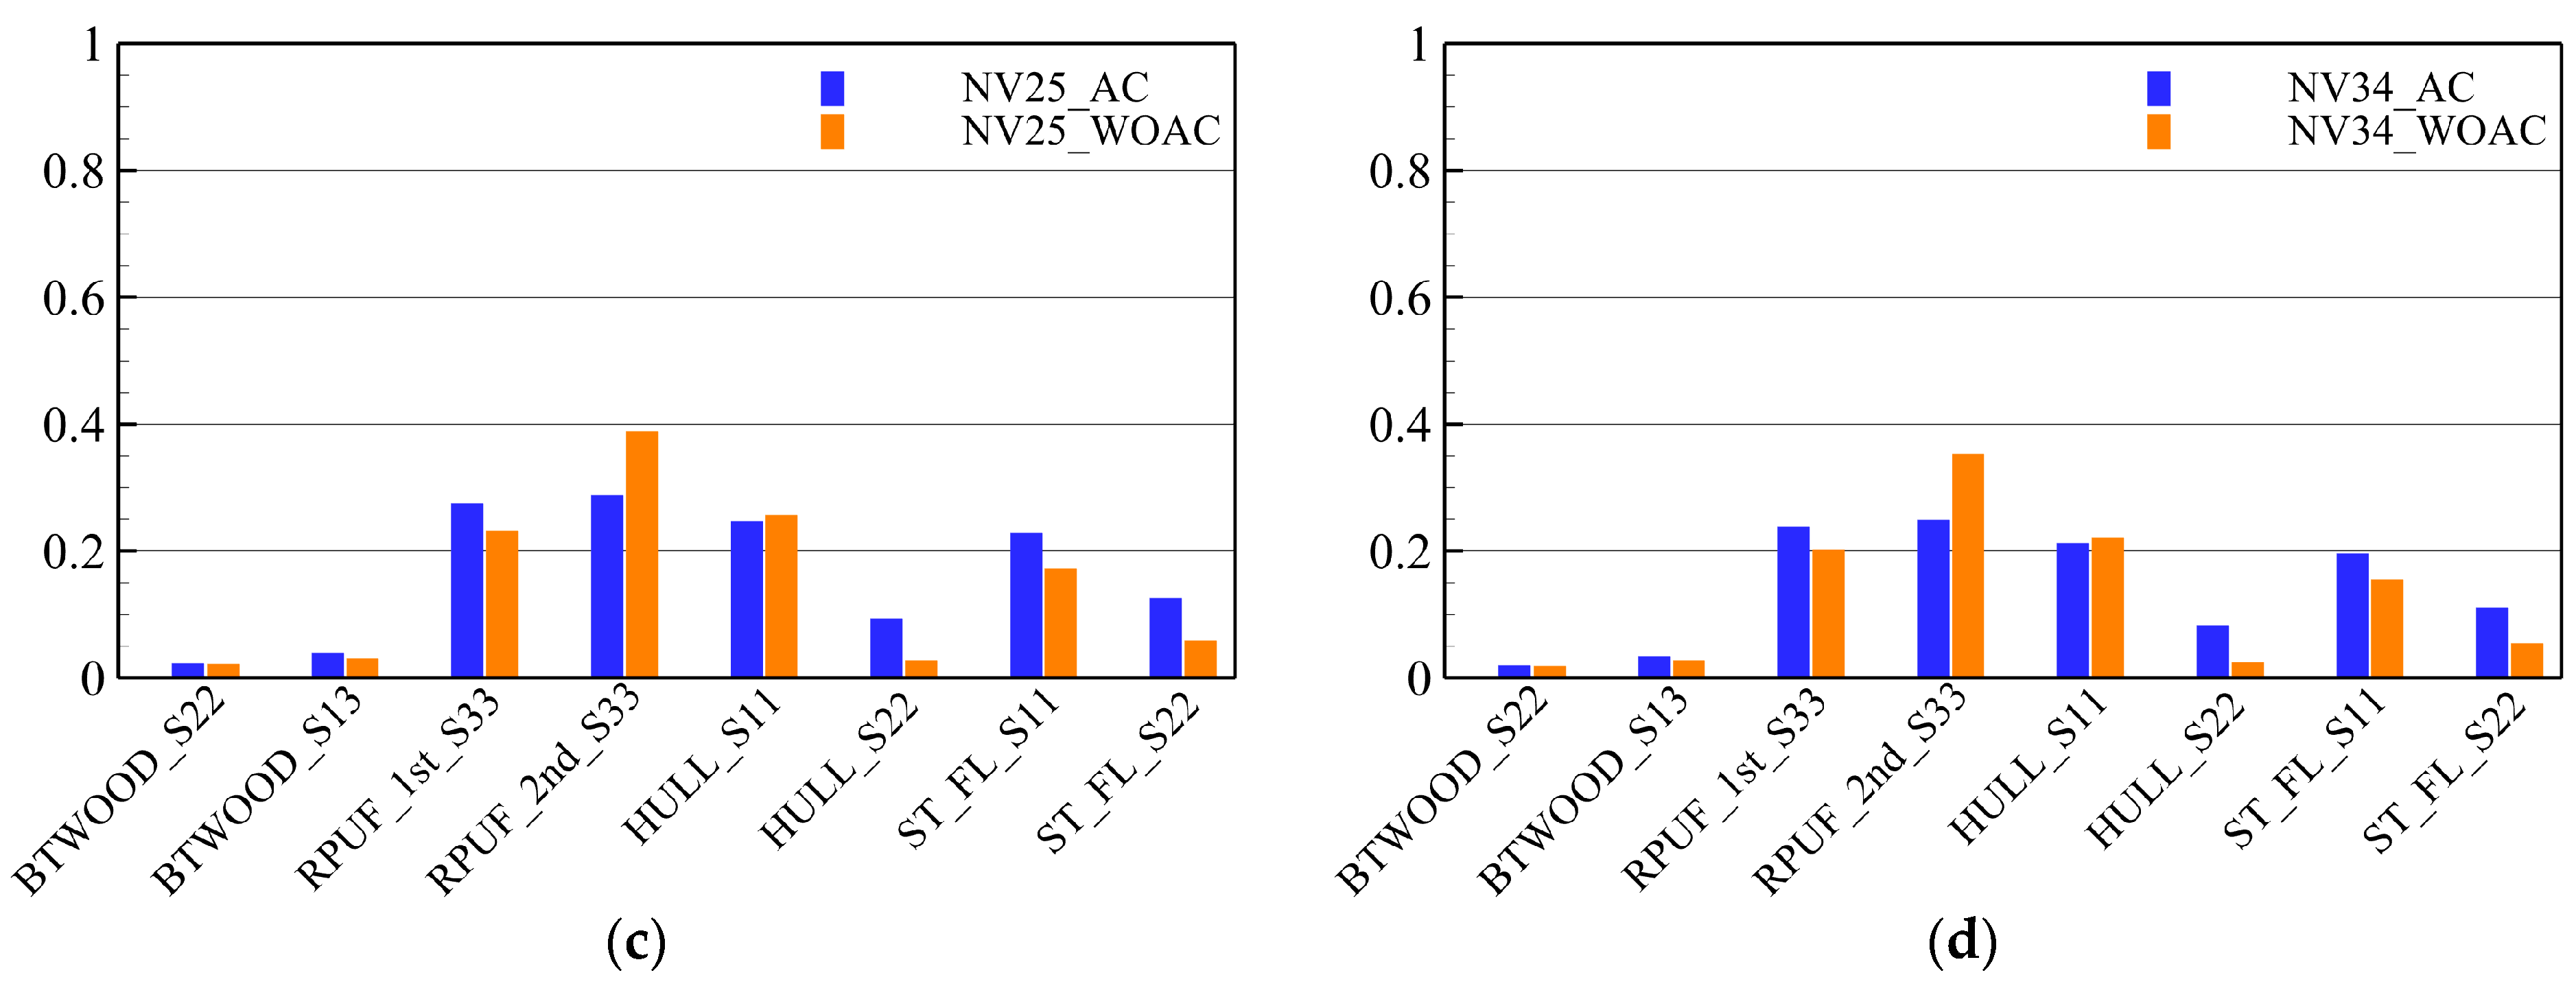
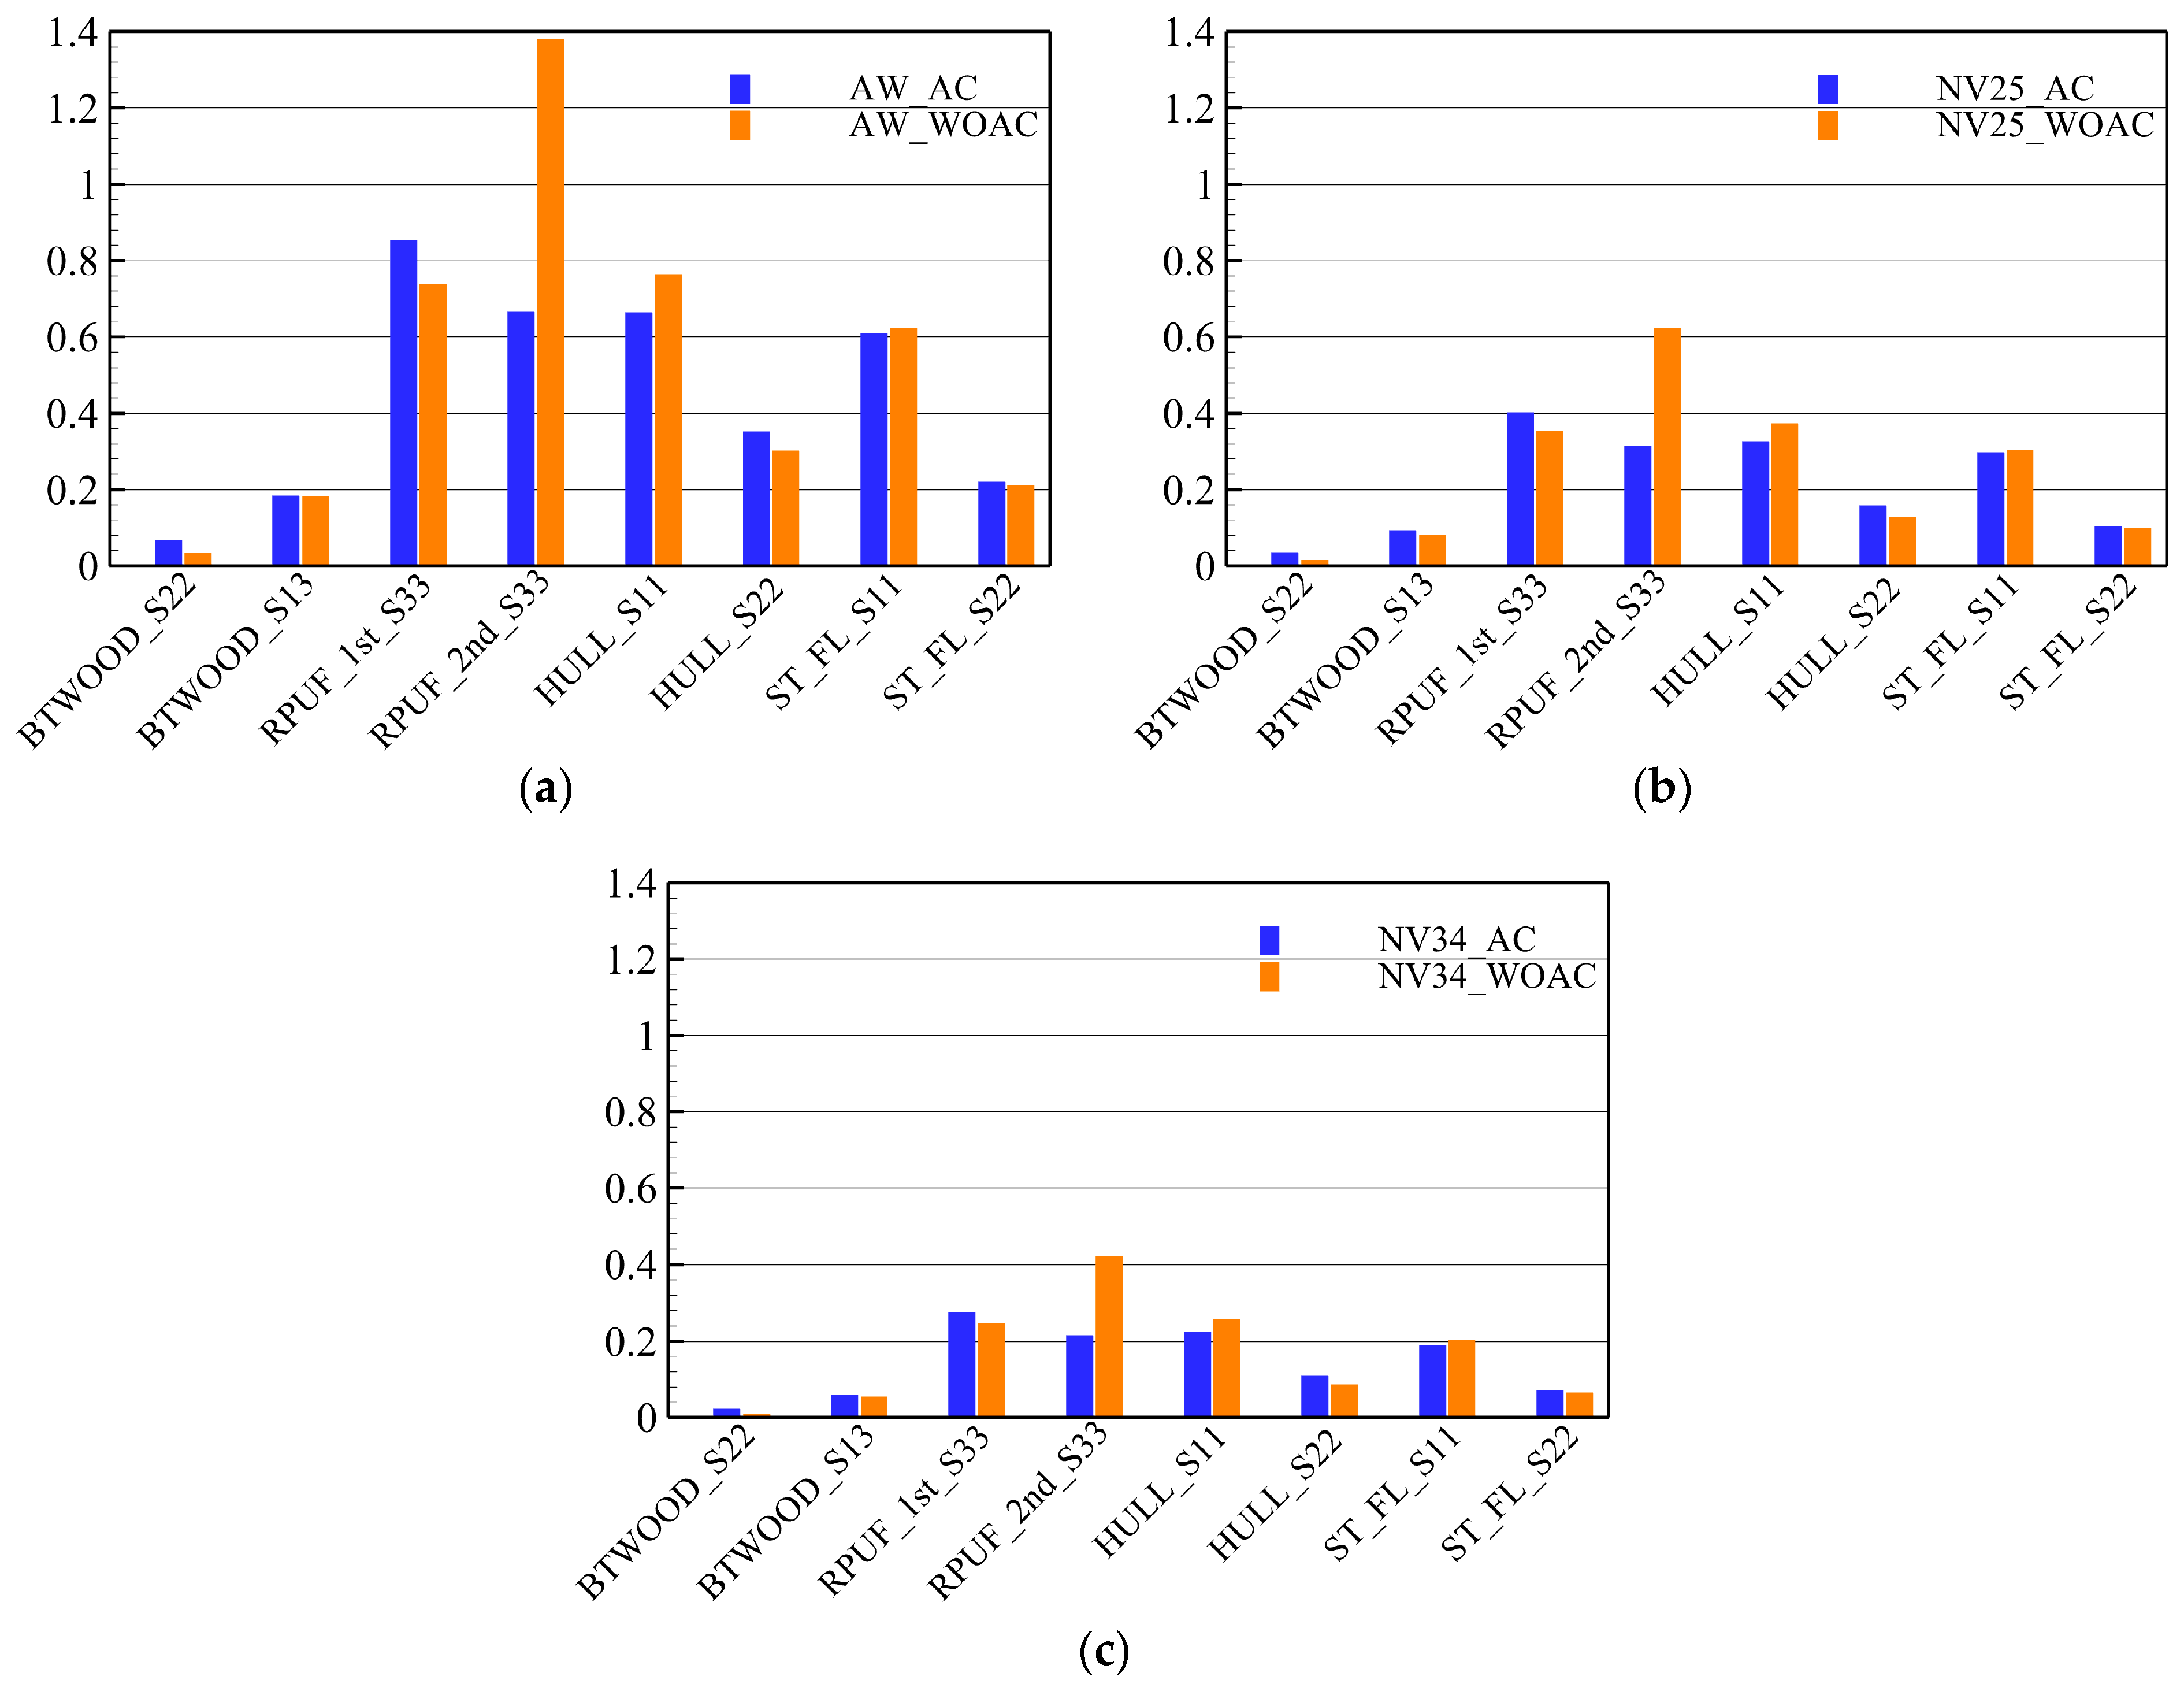
The UT values at the ceiling structure are presented in Figure 22. The overall UT values showed a decreasing trend similar to the bottom structure for water–air, NOVEC at 25 °C, and NOVEC at 34 °C. However, it should be noted that the UT values increased overall compared with those at the bottom. This increase can be attributed to the higher sloshing loads for each medium under high-filling conditions. Furthermore, the UT values increased in both the ceiling and bottom hull increase at BTWOOD_S13, first RPUF crushing, and Hull_S22 under AC conditions. Despite the differences in the locations of the maximum stresses and the relationship between the structural capacity and loads, the results indicate an increase in the UT value for the three failure modes owing to the hydroelastic effect. In addition, the higher UT values for Hull_S22 under the high-filling condition in the AC and WOAC conditions can be attributed to the lower scantling consideration of the ceiling hull structure compared with the bottom hull. The dynamic structural capacity delay due to the interaction with the fluid can expand the effects of increasing the rising time of the impulse, and this hydroelastic effect may increase UT values.

7.4. Consideration of the Lagging Rising Time

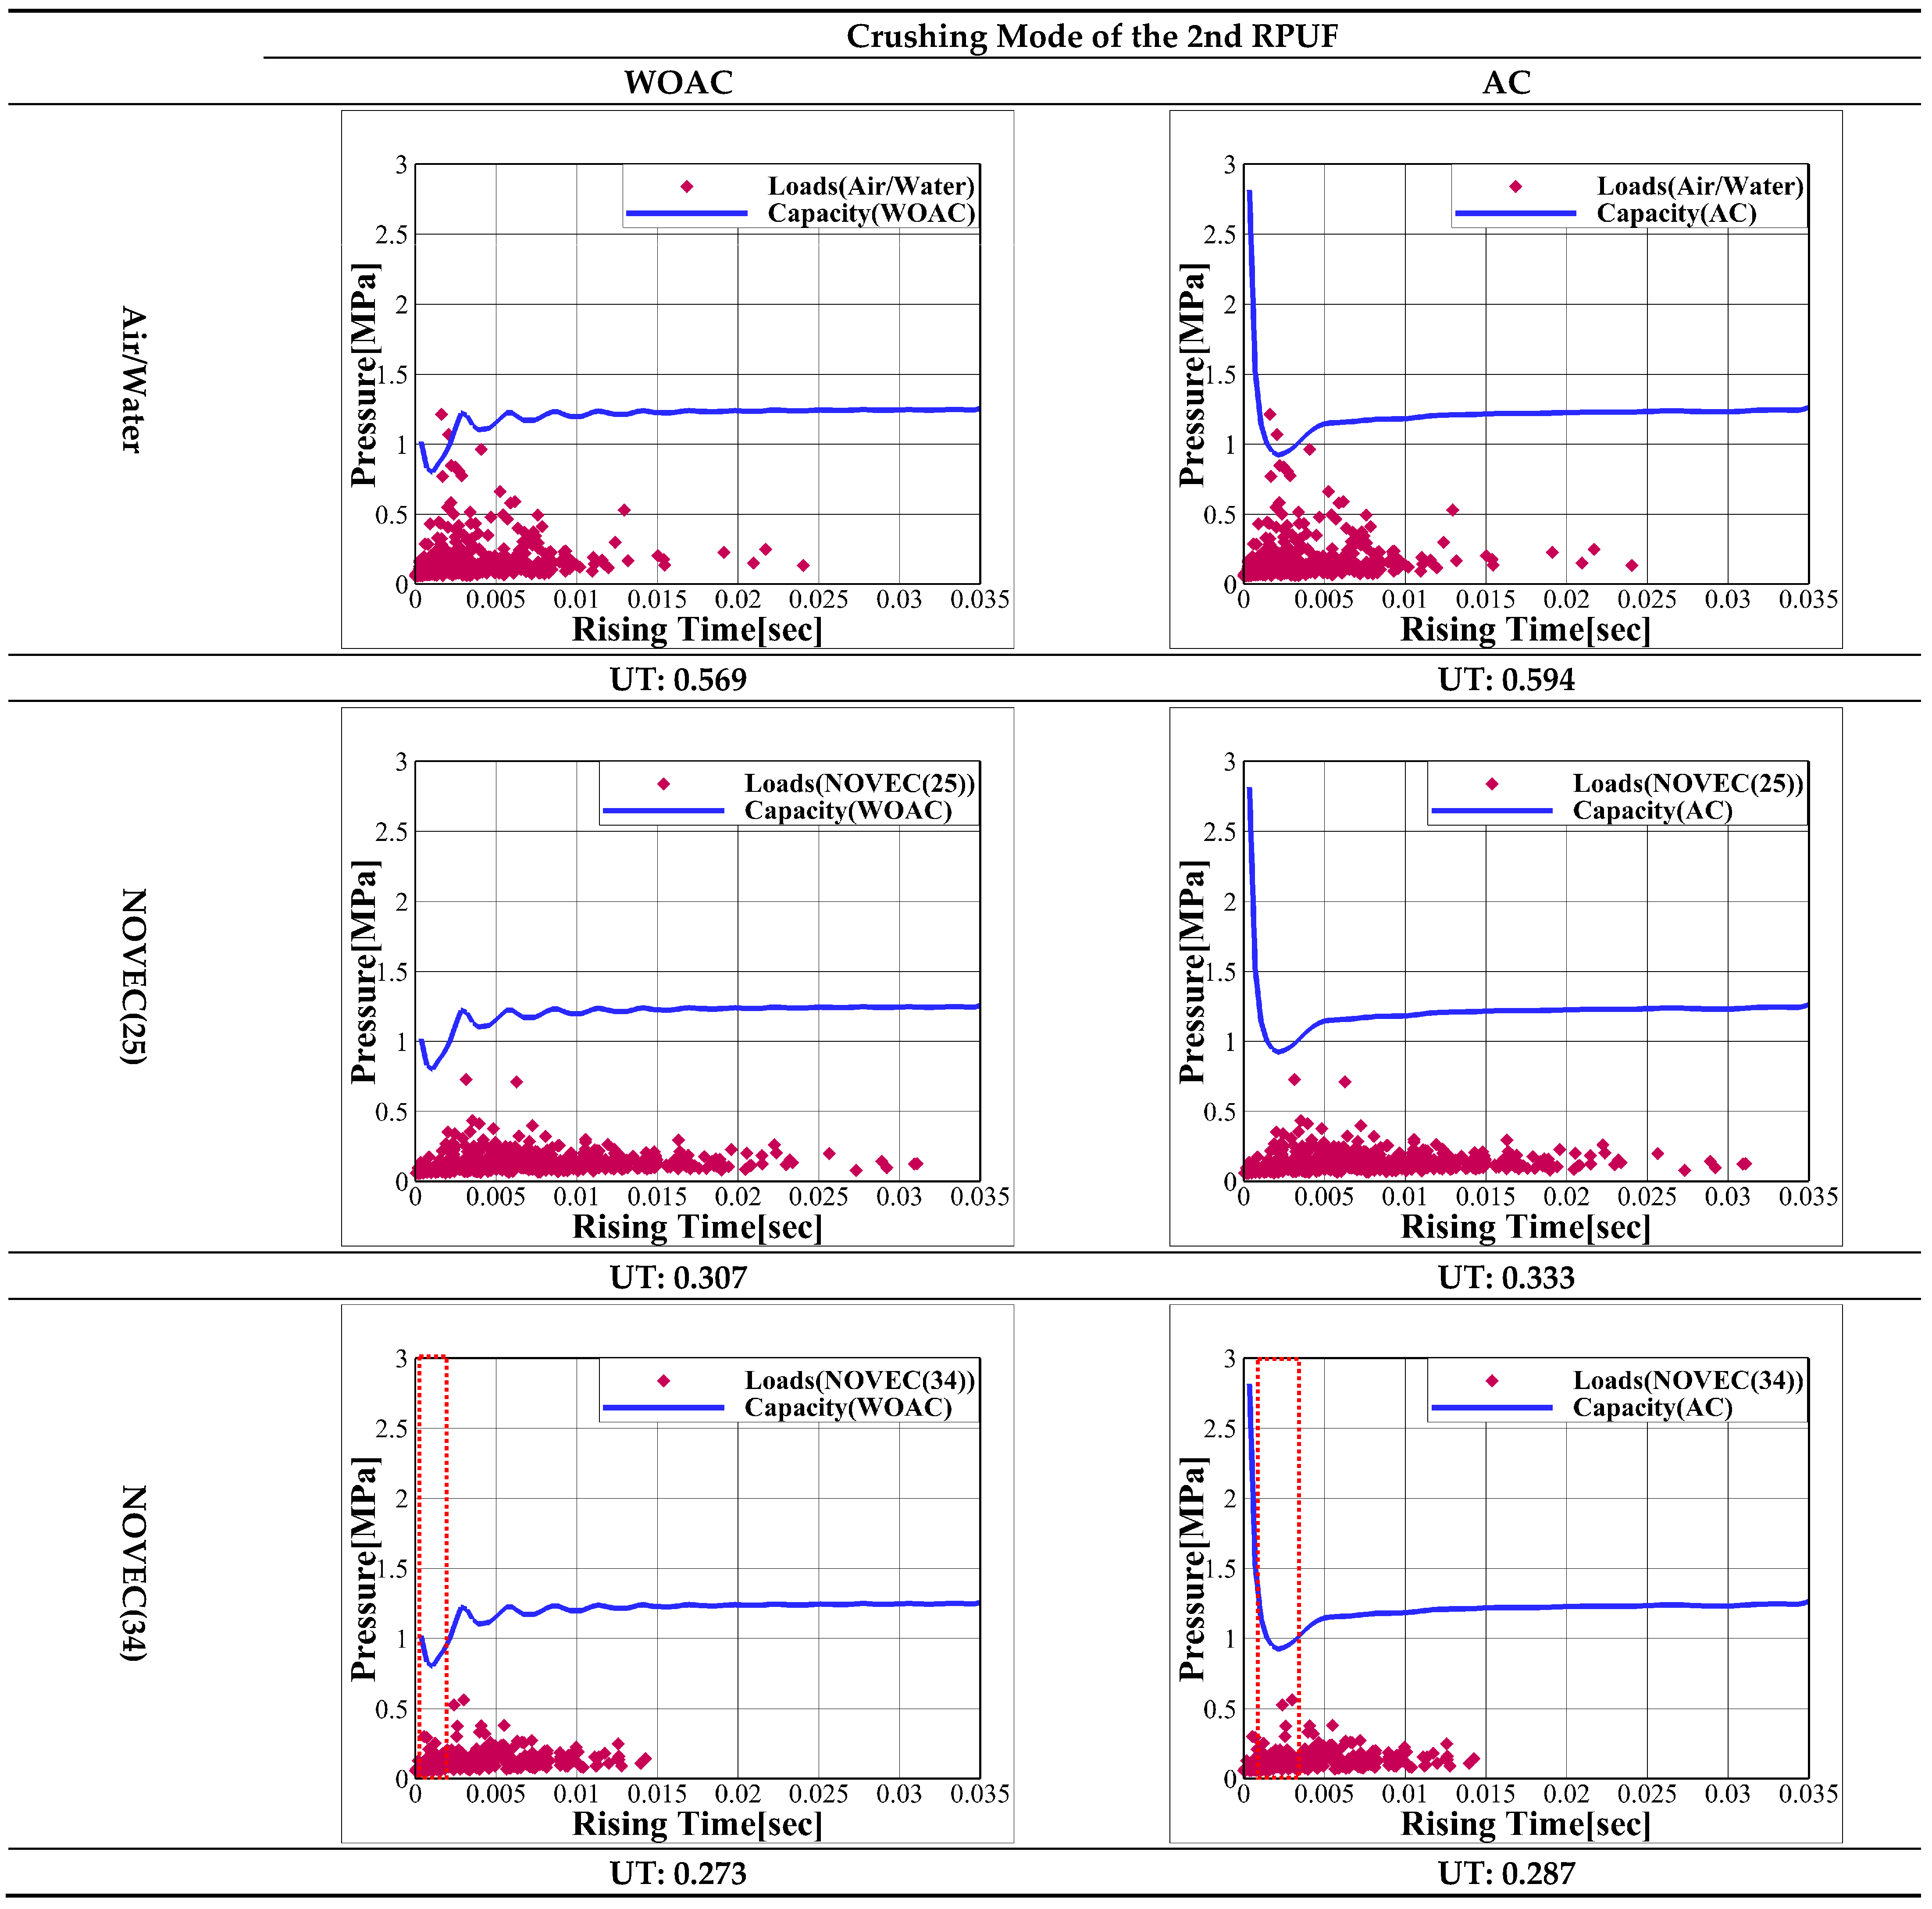
In the model tests, the sloshing impact load decreased, and the maximum rising time was delayed owing to the phase transition. To observe the influence of the delayed rising time and structural capacity, the dynamic structural capacity at the same location for each AC/WOAC condition was compared for the same loads of each medium using the UT values. Figure 23 shows the dynamic structural capacity and sloshing load distributions along with the UT values for the second RPUF crushing mode. As the minimum point of the dynamic structural capacity is delayed, the overlapping region with sloshing loads under the AC condition can be more significant than that under the WOAC condition and increase the UT values.
The results indicate that the UT value can increase if the minimum dynamic structural capacity and peak sloshing loads are sufficiently close. Moreover, even though the magnitude of the sloshing impact loads may decrease owing to the phase transition, there is potential for a slight increase in the UT values through a comparison between the increased distribution of the rising time and the delayed dynamic structural capacity.

7.5. Evaluations with Hydroelasticity and Phase Transition

The test results of the NOVEC at the boiling point exhibited a longer rising time distribution compared to the water–air results, and the rising time of the impact pressure was significantly longer under high-filling conditions. To address these issues, more research that considers a sufficient test duration and various cases is needed. However, the present analysis is expected to provide valuable observations of the physical phenomena associated with phase transitions and other fundamental issues, and a procedure is suggested to consider such effects.
The conventional approach adopts a highly conservative evaluation by comparing the water–air or water–heavy gas test results, which entail significant loads within a short rise time with the dynamic structural capacity under WOAC conditions. However, it is possible to obtain a substantial increase in the UT value by comparing the NOVEC test results and the delayed dynamic structural capacity in a similar rising time region, as shown in Figure 24. Therefore, this study revealed that, when comparing the sloshing loads due to the phase transition and the dynamic structural capacity accounting for hydroelasticity, a more realistic assessment is possible by considering not only the magnitude of impact loads but also the variation in rising time distribution.
From a sloshing assessment perspective, the absolute UT values may be relatively lower compared to the conventional approach, indicating a less conservative assessment. However, the observed increase in DAF in the foam and hull owing to hydroelastic effects implies the need to consider the nonlinear properties of the foam and the possibility of reinforcing the upper hull. Therefore, a more realistic sloshing assessment is possible; it is expected that these will ultimately be followed to predict the structural response more accurately considering actual phenomena.

7.6. Limitations and Future Research

In this study, the variation of both sloshing impact pressure and rising time of peak pressure was observed through the two-dimensional (2D) sloshing experiment with a NOVEC 7000 material, which has a boiling point of 34 °C. To overcome these limitations, it is necessary to analyze the impact pressures at the upper and lower corners, side walls, and chamfer regions of the tank based on the sloshing model test for the three-dimensional prismatic tank with irregular motion.
In this regard, the major future research can be summarized as follows:
  • It is necessary to concretize the definition of dynamic structural capacity that accounts for the nonlinearity of foam and to establish a corresponding absolute assessment methodology.
  • The sloshing assessment for special areas, such as corner panels, needs to be conducted using various footprints based on load combinations derived from pressure sensor data.
  • Given that the hull is significantly affected by hydroelastic effects, it is essential to establish guidelines for hull reinforcement by local sloshing impact pressures at the upper part of LNG carrier tanks.
  • The potential for extending this research appears substantial for vessels that require consideration of partial filling conditions, such as LNG fuel tanks, floating LNG (FLNG) units, and bunkering vessels.

8. Conclusions

This study introduced an analysis of structural responses under impulsive sloshing loads. To this end, the sloshing loads were extended from the pressures measured using different liquid and gas materials, and the dynamic structural responses at key locations of LNG CCS and hull structures were systematically observed. The values of the utilization factor were compared with and without hydroelastic effects and for different pressure patterns owing to different liquid–gas materials. Based on this study, the following conclusions were drawn:
  • In the sloshing model tests, the water–air combination provided the highest peak impact pressure. In contrast, the NOVEC test at the boiling point showed the lowest peak impact pressure, with a relatively longer rise time. Different pressure patterns induced different structural responses of the LNG CCS, significant dynamic responses with oscillations during the decay time for the water–air case, and relatively smaller and smoother structural responses in NOVEC 7000 at the boiling temperature.
  • As a result of fluid–structure interactions, a time lag phenomenon can be observed in the dynamic structural capacity curves. A significantly longer time lag occurred in the ceiling structure than in the bottom structure. Moreover, under AC conditions, stress responses were predominant in the low-frequency range (below 200 Hz) compared to the WOAC conditions. The dominant failure mode was observed in the lower plywood bending and shear failure modes of the structure components.
  • The DAF value under the WOAC condition increased at the furthest component from the point where the load was applied, and the maximum value was observed in the lower plywood bending mode. However, under AC conditions, the DAF in the RPUF increased compared to that in the lower plywood, and the maximum value was observed in the hull bending mode. In particular, DAF was most pronounced in the ceiling structure, where the hull was relatively thin. This indicates that when considering the hydroelastic effects, there can be an increase in the dynamic stress response in the foam material, and the dynamic stress response in the hull of the ceiling structure may be greater than that in the bottom structure.
  • The sloshing assessment results showed a decreasing trend in UT values in the following order: water–air, water–heavy gas, NOVEC at 25 °C, and NOVEC at boiling temperature. The UT values were significantly higher in the ceiling structure than in the bottom structure. This was because of the higher sloshing loads in the high-filling condition than in the low-filling condition. Moreover, it was observed that both the bottom and ceiling structural components, specifically BTWOOD_S13, 1st RPUF Crushing, and Hull_S22, experienced an increase in UT values owing to hydroelastic effects.
  • The structural responses were dependent on the distribution of structural capacity and sloshing loads over different rise times. Therefore, in the sloshing assessment, both the maximum sloshing impact pressure and distribution of rise times should be considered simultaneously. Furthermore, the delay in the dynamic structural responses due to hydroelasticity and phase transition can change the UT values.
  • The significant dynamic structural responses observed in the water–air test indicate the limitations of the absolute assessment; therefore, a more realistic sloshing assessment considering the phase transition and hydroelastic effects is needed, rather than relying on conventional conservative approaches. More research is needed, but the method applied in this study can be efficient for practical sloshing assessment of LNG CCSs at the present stage.

Author Contributions

Methodology, coupled and formal FE analysis, writing—original draft preparation, C.-J.P.; model test, analysis for test results and physics, J.-K.L.; supervision, resources, writing—review and editing, Y.K. All authors have read and agreed to the published version of the manuscript.

Funding

This study was supported by the Lloyd’s Register Foundation (LRF)-Funded Research Center (LRFC) at Seoul National University, South Korea (grant number GA100050). Their support is greatly appreciated. Administrative support from the Institute of Engineering Research (IoER) and the Research Institute of Marine System Engineering (RIMSE) is also acknowledged.

Data Availability Statement

The original contributions presented in the study are included in the article material, further inquiries can be directed to the corresponding author/s.

Conflicts of Interest

Authors C.-J.P. and J.-K.L. were employed by the company HD Hyundai Heavy Industries Co., Ltd. The remaining authors declare that the research was conducted in the absence of any commercial or financial relationships that could be construed as a potential conflict of interest.

Abbreviation

ACAcoustic field
CCSCargo Containment System
BTWOOD_S22Stress component of Bottom plywood in the y-direction
BTWOOD_S13Stress component of Bottom plywood in the xz plane
DAFDynamic Amplification Factor
FEFinite Element
FEAFinite Element Analysis
FFTFast Fourier Transform
FSIFluid Structure Interactions
GHGGreenhouse Gas
HULL_S11Stress component of Hull plate in the x-direction
HULL_S22Stress component of Hull plate in the y-direction
IMOInternational Maritime Organization
LNGLiquefied Natural Gas
NGNatural Gas
NOxNitrogen Oxides
RPUFReinforced Polyurethane Foam
RPUF_1st_S33Stress component of 1st RPUF in the z-direction
RPUF_2nd_S33Stress component of 2nd RPUF in the z-direction
SOxSulfur Oxides
ST_FL_S11Stress component of flange at stiffener in the x-direction
ST_FL_S22Stress component of flange at stiffener in the y-direction
TISMTriangular Impulse Superposition Method
UTUtilization factor
WOACWithout Acoustic filed

References

  1. Joung, T.H.; Kang, S.G.; Lee, J.K.; Ahn, J. The IMO initial strategy for reducing Greenhouse Gas (GHG) emissions, and its follow-up actions towards 2050. J. Int. Marit. Saf. Environ. Aff. Shipp. 2020, 4, 1–7. [Google Scholar] [CrossRef]
  2. Al-Aboosi, F.Y.; El-Halwagi, M.M.; Moore, M.; Nielsen, R.B. Renewable ammonia as an alternative fuel for the shipping industry. Curr. Opin. Chem. Eng. 2021, 31, 100670. [Google Scholar] [CrossRef]
  3. Faltinsen, O.M.; Timokha, A.N. Sloshing; Cambridge University Press: New York, NY, USA, 2009. [Google Scholar]
  4. Gavory, T.; De Seze, P.E. Sloshing in membrane LNG carriers and its consequences from a designer’s perspective. In Proceedings of the ISOPE International Ocean and Polar Engineering Conference, ISOPE, Osaka, Japan, 21−26 July 2009; p. ISOPE-I-09-041. [Google Scholar]
  5. Malenica, S.; Diebold, L.; Kwon, S.H.; Cho, D.-S. Sloshing assessment of the LNG floating units with membrane type containment system where we are? Mar. Struct. 2017, 56, 99–116. [Google Scholar] [CrossRef]
  6. Ahn, Y.; Kim, S.-Y.; Kim, K.-H.; Lee, S.-W.; Kim, Y.; Jong-Jin, P. Study on the Effect of Density Ratio of Liquid and Gas in Sloshing Experiment. In Proceedings of the Twenty-Second International Offshore and Polar Engineering Conference, Rhodes, Greece, 17–22 June 2012; p. ISOPE-I-12-398. [Google Scholar]
  7. Dias, F.; Ghidaglia, J.-M.; Le Coq, G. On the Fluid Dynamics Models for Sloshing. In Proceedings of the Seventeenth International Offshore and Polar Engineering Conference, Lisbon, Portugal, 1–6 July 2007; p. ISOPE-I-07-565. [Google Scholar]
  8. Bogaert, H.; Léonard, S.; Brosset, L.; Kaminski, M.L. Sloshing and scaling: Results from the Sloshel project. In Proceedings of the ISOPE International Ocean and Polar Engineering Conference, ISOPE, Beijing, China, 20–25 June 2010; p. ISOPE-I-10-030. [Google Scholar]
  9. Yung, T.-W.; Sandström, R.E.; He, H.; Minta, M.K. On the Physics of Vapor/Liquid Interaction During Impact on Solids. J. Ship Res. 2010, 54, 174–183. [Google Scholar] [CrossRef]
  10. Maillard, S.; Brosset, L. Influence of DR between liquid and gas on sloshing model test results. Int. J. Offshore Polar Eng. 2009, 19, ISOPE-09-19-4-271. [Google Scholar]
  11. Ahn, Y.; Kim, Y. Data mining in sloshing experiment database and application of neural network for extreme load prediction. Mar. Struct. 2021, 80, 103074. [Google Scholar] [CrossRef]
  12. Karimi, M.R.; Brosset, L.; Ghidaglia, J.M.; Kaminski, M.L. Effect of ullage gas on sloshing, Part I: Global effect of gas—liquid density ratio. Eur. J. Mech. B Fluid. 2015, 53, 213–228. [Google Scholar] [CrossRef]
  13. Karimi, M.R.; Brosset, L.; Ghidaglia, J.M.; Kaminski, M.L. Effect of ullage gas on sloshing, Part II: Local effects of gas—liquid density ratio. Eur. J. Mech. B Fluid. 2016, 57, 82–100. [Google Scholar] [CrossRef]
  14. Kim, S.-Y.; Kim, Y.; Lee, J. Comparison of sloshing-induced pressure in different scale tanks. Ships Offshore Struct. 2016, 12, 244–261. [Google Scholar] [CrossRef]
  15. Karimi, M.; Brosset, L.; Kaminski, M.; Ghidaglia, J.-M. Effects of ullage gas and scale on sloshing loads. Eur. J. Mech.B Fluids 2016, 62, 59–85. [Google Scholar] [CrossRef]
  16. Karimi, M.R.; Brosset, L.; Ghidaglia, J.-M.; Kaminski, M.L. A Study on Conservatism of Froude Scaling for Sloshing Model Tests. In Proceedings of the Twenty-fourth International Ocean and Polar Engineering Conference, Busan, Korea, 15–20 June 2014; p. ISOPE-I-14-322. [Google Scholar]
  17. Ancellin, M.; Ghidaglia, J.-M.; Laurent, B. Influence of Phase Transition on Sloshing Impact Pressures Described By a Generalized Bagnold′s Model. In Proceedings of the Twenty-second International Offshore and Polar Engineering Conference, Rhodes, Greece, 17–22 June 2012; p. ISOPE-I-12-372. [Google Scholar]
  18. Braeunig, J.-P.; Brosset, L.; Dias, F.; Ghidaglia, J.-M. On the Effect of Phase Transition on Impact Pressures Due to Sloshing. In Proceedings of the Twentieth International Offshore and Polar Engineering Conference, Beijing, China, 20–25 June 2010; p. ISOPE-I-10-182. [Google Scholar]
  19. Kim, Y.; Lee, J.; Kim, J. Experimental Observation of the Effects of Liquid Temperature and Bubbles on Impact Pressure Inside Gas Pocket. Int. J. Offshore Polar Eng. 2017, 27, 1–10. [Google Scholar] [CrossRef]
  20. Lee, J.; Ahn, Y.; Kim, Y. Experimental study on effect of density ratio and phase transition during sloshing impact in rectangular tank. Ocean. Eng. 2021, 242, 11010. [Google Scholar] [CrossRef]
  21. Lloyd’s Register. Sloshing Assessment Guidance Document for Membrane Tank LNG Operations; Additional Design Procedures: London, UK, 2009. [Google Scholar]
  22. Bureau Veritas. Strength Assessment of LNG Membrane Tanks under Sloshing Loads; Guidance Note. NI564; Bureau Veritas: Neuilly sur Seine, France, 2011. [Google Scholar]
  23. American Bureau of Shipping. Strength Assessment of Membrane-type LNG Containment Systems under Sloshing Loads; Guidance Notes; American Bureau of Shipping: Houston, TX, USA, 2009. [Google Scholar]
  24. DNVGL. Sloshing Analysis of LNG Membrane Tanks, Class Guidance, DNVGL-CG-0158. 2016. Available online: https://rules.dnv.com/docs/pdf/dnvpm/cn/2016-02/CN30-9.pdf (accessed on 29 September 2024).
  25. Chun, S.E.; Hwang, J.O.; Chun, M.S.; Suh, Y.S.; Hwangbo, S.M.; Lee, J.M.; White, N.; Wang, Z.H. Direct Assessment of Structural Capacity Against Sloshing Loads Using Nonlinear Dynamic FE Analysis Including Hull Structural Interactions. In Proceedings of the Twenty-first International Offshore and Polar Engineering Conference, Maui, HI, USA, 19–24 June 2011; p. ISOPE-I-11-473. [Google Scholar]
  26. Pillon, B.; Marhem, M.; Leclère, G.; Canler, G. Numerical Approach for Structural Assessment of LNG Containment Systems. In Proceedings of the Nineteenth International Offshore and Polar Engineering Conference, Osaka, Japan, 12–17 July 2009; p. ISOPE-I-09-044. [Google Scholar]
  27. Sang-Gab, L.; Jin-Kyung, K.; Hong-Anh, N.; Jae-Hyung, N. Structural Safety Assessment of LNGC MARK III Membrane Type CCS Under Sloshing Impact Loading. In Proceedings of the Twenty-Second International Offshore and Polar Engineering Conference, Rhodes, Greece, 17–22 June 2012; p. ISOPE-I-12-409. [Google Scholar]
  28. Wang, B.; Kim, J.W. Strength Evaluation of LNG Containment System Considering Fluid-Structure Interaction Under Sloshing Impact Pressure. In Proceedings of the ASME 2007 26th International Conference on Offshore Mechanics and Arctic Engineering. Volume 1: Offshore Technology; Special Symposium on Ocean Measurements and Their Influence on Design, San Diego, CA, USA, 10–15 June 2007; pp. 545–552. [Google Scholar]
  29. Malenica, S.; Mravak, Z.; Besse, P.; Kaminski, M.L.; Bogaert, H. Full scale experiments and new methodology to assess the structural behaviour of a membrane LNGC containment system under breaking waves project “SLOSHEL”. In Proceedings of the 24th International Conference & Exhibition for the LNG, LPG & Natural Gas Industries, Abu Dabi, United Arab Emirates, 25–28 May 2009. [Google Scholar]
  30. Nho, I.S.; Ki, M.S.; Kim, S.C. A study on simplified sloshing impact response analysis for membrane-type LNG cargo con-tainment system. J. Soc. Nav. Archit. Korea 2011, 48, 451–456. [Google Scholar] [CrossRef]
  31. Lee, J. Experimental Study on the Effect of Liquid-Gas Phase Transition during Sloshing Impact. Ph.D. Thesis, Seoul National University, Seoul, Republic of Korea, 2020. [Google Scholar]
  32. GTT Mark III Systems. Available online: https://gtt.fr/technologies/markiii-systems (accessed on 25 August 2024).
  33. Abaqus. 6.14 User’s Documentation, Getting Started with Abaqus Interactive Edition. Available online: http://62.108.178.35:2080/v6.14/books/stm/default.htm (accessed on 25 August 2024).
  34. Crawford, D.B.; Durr, C.A. Design of LNG Receiving Terminals. In Advances in Cryogenic Engineering; Springer: Boston, MA, USA, 1995; pp. 261–268. [Google Scholar]
  35. Ju, H.-B.; Jang, B.-S.; Yim, K.-H. Prediction of sloshing pressure and structural response of LNG CCS. Ocean Eng. 2022, 266, 112298. [Google Scholar] [CrossRef]
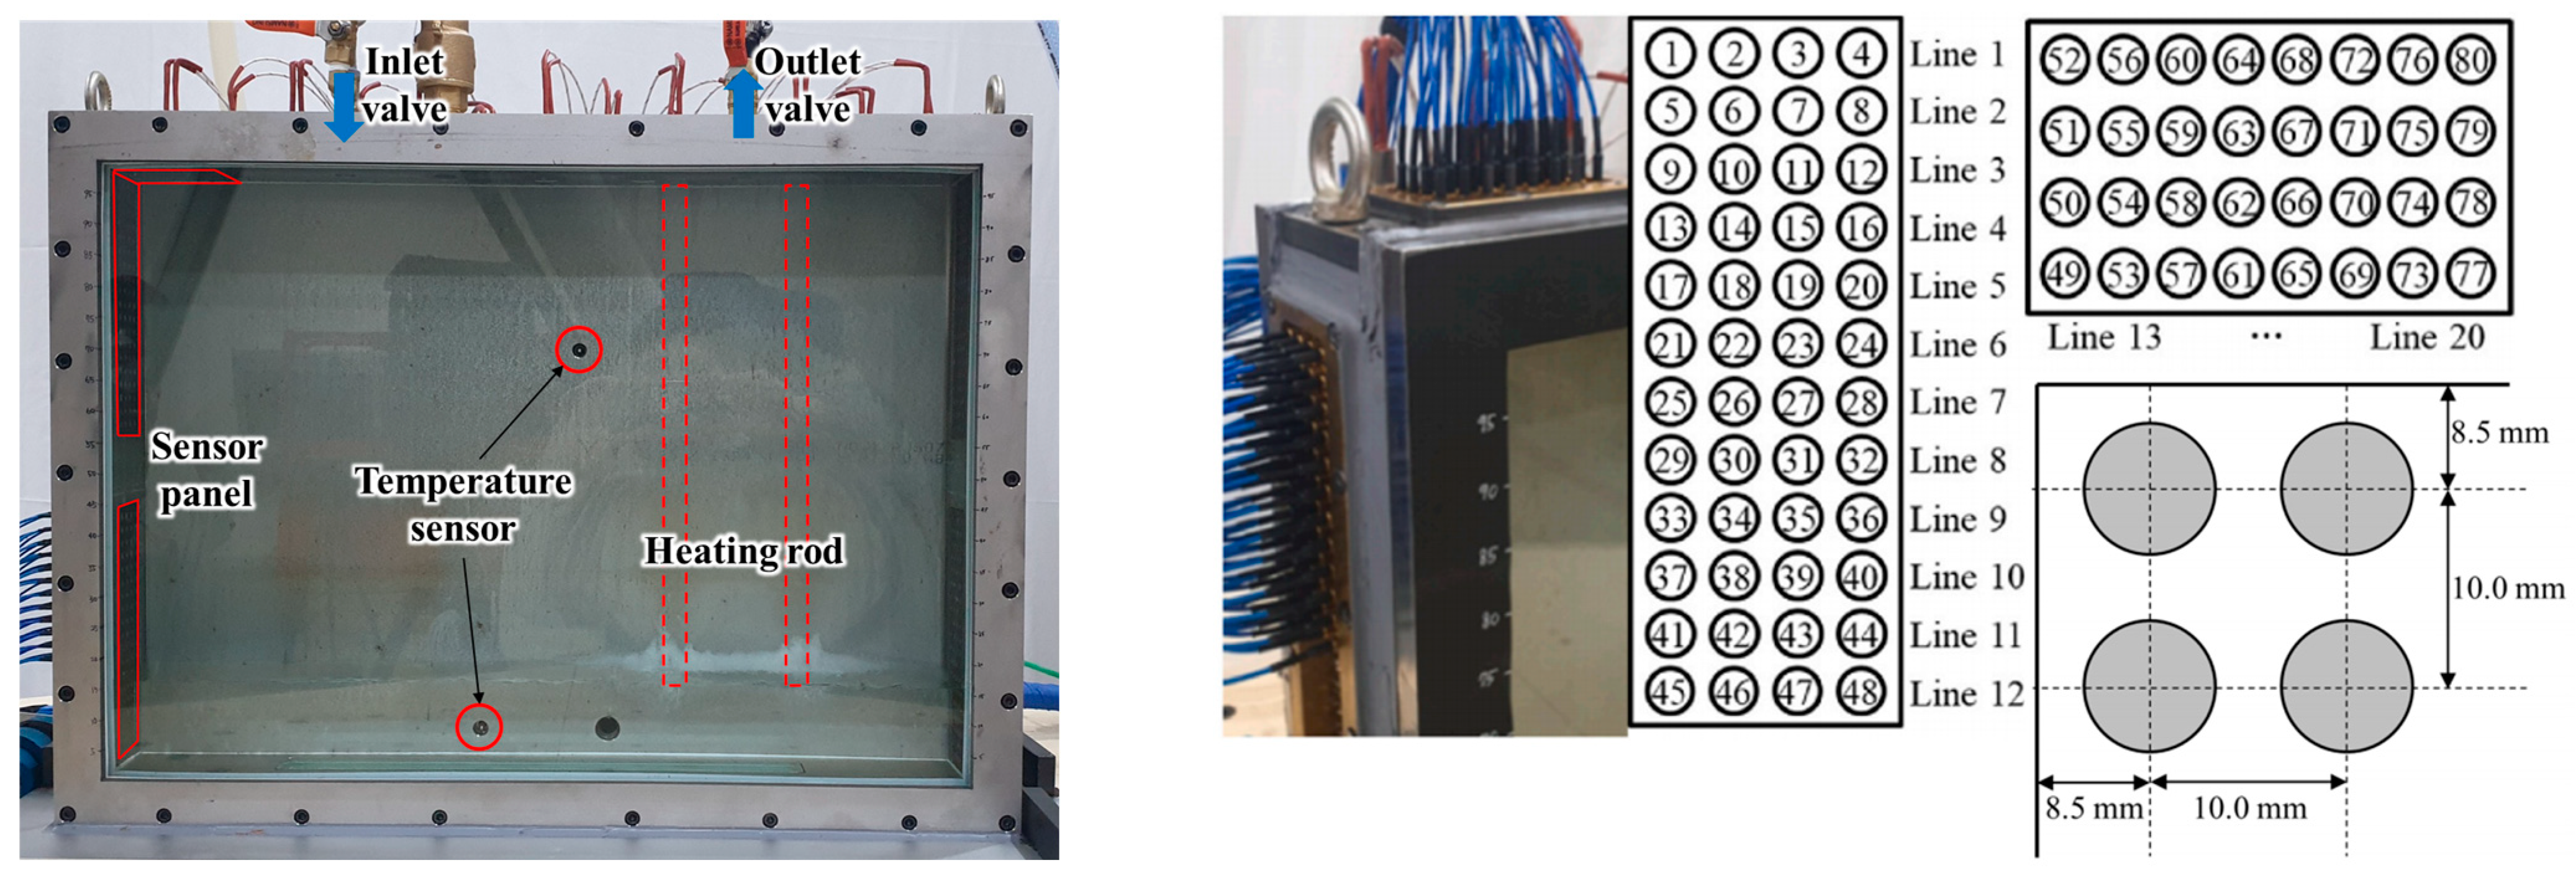
Figure 1. Tank model and sensor installation near ceiling corner [31].
Jmse 12 01794 g001
Figure 2. Pressure signals for the water–air and NOVEC 7000 (20%H Filling, ω/ω0 = 1.27) [31]. (a) Water–air; (b) NOVEC 7000, 25 °C; (c) NOVEC 7000, 34 °C.
Jmse 12 01794 g002
Figure 3. Average of 10 largest peak pressures, including more data from Lee et al. [31]. (a) 20% filling; (b) 80% filling.
Jmse 12 01794 g003
Figure 4. Average of rise times of 10 largest peak pressure, including more data from Lee et al. [31]. (a) 20% filling; (b) 80% filling.
Jmse 12 01794 g004
Figure 5. Probability density distributions of rising time around ω/ω0 = 1.0. (a) 20% filling: water–air, water–heavy gas; (b) 80% filling: water–air; (c) 20% filling: NOVEC 7000, 25 °C; (d) 80% filling: NOVEC 7000, 25 °C; (e) 20% filling: NOVEC 7000, 34 °C; (f) 80% filling: NOVEC 7000, 34 °C.
Jmse 12 01794 g005aJmse 12 01794 g005b
Figure 6. Mark-III Flex CCS configuration.
Jmse 12 01794 g006
Figure 7. Finite element model of the structure.
Jmse 12 01794 g007
Figure 8. Analysis procedure with boundary and load conditions.
Jmse 12 01794 g008
Figure 9. Schematic of the load transfer at the interface between acoustic domain and structure.
Jmse 12 01794 g009
Figure 10. Coupled FE model with loading and boundary conditions.
Jmse 12 01794 g010
Figure 11. Locations of failure modes of the structure. (a) Failure mode at CCS; (b) Failure mode at Hull.
Jmse 12 01794 g011
Figure 12. Dynamic stress responses for each impact pattern without fluid region. (a) BTWOOD_S22; (b) RPUF_2nd_S33; (c) HULL_S22.
Jmse 12 01794 g012
Figure 13. Dynamic stress responses for each impact pattern with fluid region. (a) BTWOOD_S22; (b) RPUF_2nd_S33; (c) HULL_S22.
Jmse 12 01794 g013
Figure 14. Mode shape and natural frequency from the normal mode analysis.
Jmse 12 01794 g014aJmse 12 01794 g014b
Figure 15. Triangular impulse superposition method.
Jmse 12 01794 g015
Figure 16. Procedure for the dynamic structural capacity.
Jmse 12 01794 g016
Figure 17. Locations of maximum stress for each failure mode with and without fluid. (a) WOAC; (b) AC.
Jmse 12 01794 g017
Figure 18. Dynamic structural capacities for each failure mode with and without fluid. (a) BTWOOD_S22; (b) BTWOOD_S13; (c) RPUF_1st_S33; (d) RPUF_2nd_S33; (e) HULL_S11; (f) HULL_S22; (g) ST_FL_S11; (h) ST_FL_S22.
Jmse 12 01794 g018
Figure 19. DAFs for each failure mode with/without fluid. (a) BTWOOD_S22; (b) BTWOOD_S13; (c) RPUF_1st_S33; (d) RPUF_2nd_S33; (e) HULL_S11; (f) HULL_S22; (g) ST_FL_S11; (h) ST_FL_S22.
Jmse 12 01794 g019
Figure 20. Sloshing loads vs. dynamic structural capacity.
Jmse 12 01794 g020
Figure 21. UT results at the bottom structure. (a) Water–air; (b) water–heavy gas; (c) NOVEC 7000, 25 °C; (d) NOVEC 7000, 34 °C.
Jmse 12 01794 g021aJmse 12 01794 g021b
Figure 22. UT results at the ceiling structure. (a) Water–air; (b) NOVEC 7000, 25 °C; (c) NOVEC 7000, 34 °C.
Jmse 12 01794 g022
Figure 23. UT results at the same element of the 2nd RPUF for each sloshing load (Dashed line: overlapped region between minimum structural capacity and peak sloshing loads).
Jmse 12 01794 g023
Figure 24. PDFs of each sloshing load vs. dynamic structural capacities for each AC and WOAC.
Jmse 12 01794 g024
Table 1. Material properties for analysis.
MaterialPlywoodRPUFSecondary BarrierMasticHull
Material propertyorthotropicorthotropicorthotropicisotropicisotropic
Density (kg/m3)68013027009507850
Elastic Modulus (MPa)
−170 °C
E11 = 13,800
E22 = 7200
E33 = 170
E11 = 68
E22 = 79
E33 = 80
E11 = E33 = 7500
E22 = 9900
--
Elastic Modulus (MPa)
20 °C
E11 = E22 = 8030
E33 = 70
E11 = 30.4
E22 = 50.8
E33 = 47.6
E11 = E33 = 5400
E22 = 7050
680206,000
Poisson’s Ratio
−170 °C
v12, v13, v23 = 0.1v12 = 0.4
v13 = v23 = 0.2
v12, v13, v23 = 0.30.30.3
Poisson’s Ratio
20 °C
v12, v13, v23 = 0.1v12 = 0.4
v13 = v23 = 0.2
v12, v13, v23 = 0.30.30.3
Table 2. Acoustic properties for analysis.
Natural Gas at −163 °CDensity (kg/m3)Bulk Modulus [Gpa]
LNG4700.848
Table 3. Definitions of failure modes for each component.
No.IndexFailure ModeStress
Component
1BTWOOD_S22Bending failure of bottom plywood in direction of mastic spacingS22
2BTWOOD_S13Shearing failure of bottom plywood in way of masticsS13
3RPUF_1st_S33Crushing failure of 1st RPUF in the z-directionS33
4RPUF_2nd_S33Crushing failure of 2nd RPUF in the z-directionS33
5HULL_S11Hull bending failure along the mastic ropesS11
6HULL_S22Hull bending failure across the mastic ropesS22
7ST_FL_S11Bending failure of the flange at stiffener in the x-directionS11
8ST_FL_S22Bending failure of the flange at stiffener in the y-directionS22
Table 4. Rising times of structure at minimum capacity (unit: [msec]).
BottomCeilingAC/WOAC [Times]
Failure ModeACWOACACWOACBottomCeiling
BTWOOD_S222.471.063.891.062.333.67
BTWOOD_S133.181.063.181.063.003.00
RPUF_1st_S331.771.771.771.771.001.00
RPUF_2nd_S331.771.062.121.061.672.00
HULL_S112.471.062.470.712.333.50
HULL_S222.121.062.120.712.003.00
ST_FL_S112.831.062.471.772.671.40
ST_FL_S222.121.062.121.062.002.00
Table 5. FFT of the stress responses of failure modes at the bottom and ceiling regions (unit: [Hz]).
BottomCeiling
Failure ModeACWOACACWOAC
BTWOOD_S22152.16360.68118.35214.15
BTWOOD_S13152.16287.41146.52338.13
RPUF_1st_S33225.42366.31247.96355.04
RPUF_2nd_S33225.42360.68247.96355.04
HULL_S11129.62360.68135.25417.03
HULL_S22163.43360.68157.80338.13
ST_FL_S11123.98343.77118.35293.05
ST_FL_S22163.43338.13157.80321.23
Table 6. Maximum DAF values for each failure mode of the bottom and ceiling regions.
BottomCeiling
Failure ModeACWOACACWOAC
BTWOOD_S221.24251.61891.23121.9582
BTWOOD_S131.25111.67281.27871.6055
RPUF_1st_S331.44441.20641.42941.2104
RPUF_2nd_S331.49841.60661.41901.5934
HULL_S111.08161.08881.05711.1563
HULL_S221.99251.72031.99591.9107
ST_FL_S111.48761.43441.49781.2506
ST_FL_S221.23921.71591.32081.6736
Table 7. Frequency ratios of excitation motion with maximum peak pressure for the evaluation.
Test CasesLow-Filling (20%H)High-Filling (80%H)
Air/Water (ω/ω0)1.261.17
Heavy Gas/Water (ω/ω0)1.22-
NOVEC 25 °C (ω/ω0)1.180.9
NOVEC 34 °C (ω/ω0)1.250.9
Disclaimer/Publisher’s Note: The statements, opinions and data contained in all publications are solely those of the individual author(s) and contributor(s) and not of MDPI and/or the editor(s). MDPI and/or the editor(s) disclaim responsibility for any injury to people or property resulting from any ideas, methods, instructions or products referred to in the content.