Abstract
To study the load-transfer law and shock environment of a pipe–float system, an experimental model was designed, manufactured, and installed on a floating shock platform. Two underwater explosion cases were studied, focusing on vertical and horizontal shock cases. The experimental results show that the structure of the system on the floating raft significantly influences the load acceleration transfer and the composition of the vertical and horizontal components. Furthermore, the flexible connector can effectively block the response behavior of the two ends of the pipe, and the peak acceleration difference between the two pipe ends is 98.9%. The vertical and horizontal components of the shock-wave load affect the stress concentration locations on the pipe. The main frequency in the shock environment at the connection point between the floating raft and the upper equipment shifts toward middle and low frequencies under the influence of the upper equipment, and it will be closer to the natural frequency of the upper equipment.
1. Introduction
Underwater explosions pose a significant threat to ships because they can cause irreversible damage to ship structures, shipboard equipment, and personnel. Power and ship system pipes play a crucial role in gas—liquid transportation, and the piping system with large spans and a low stiffness is susceptible to shock-wave loads. Damage to key parts of pipelines poses a considerable threat to the ship’s integrity. Therefore, studying the load-transfer law and shock environment of pipe–float systems is highly important for the design and evaluation of ship shock resistance.
Numerous experts and scholars have carried out studies on the shock resistance of ship piping systems. Yu et al. [1] proposed a three-tube system consisting of three tubes. Through experimental and numerical simulation studies, they found that the three-tube system could provide the highest energy absorption efficiency and the most stable deformation mode, thus enhancing the energy absorption capacity of the protection structure. Guo et al. [2] established a tube coefficient value model based on multi-span beam bending moment theory and found that the shock response obtained by using the simplified five-span model is basically equal to that of the complex model. Alshahrani et al. [3] established a finite element model of GFRE pipes. The finite element calculation and experimental results showed that the damage at low shock energies was mainly caused by matrix cracking, while at medium and high energies, fiber fracture occurred. Okeil [4] found that ductility generally helps to reduce the response of the piping system. Zhu et al. [5] studied the dynamic behavior of pipes under horizontal shock loads and proposed a method to describe the deformed profile based on shock experiments. Wang et al. [6] studied the transverse shock performance of the composite structure in the ultra-lightweight cement composite (ULCC)-filled pipe and found that compared with the steel hollow pipe, the sandwich composite pipe has higher shock resistance, smaller overall deformation, and local indentation. Kristoffersen et al. [7] studied the materials and components of samples collected from offshore pipes and found that the force–displacement curves of empty and open-filled pipes were extremely similar, while closed-filled pipes reacted differently due to the accumulation of internal pressure during shock. The computer simulation and experimental observation results corresponded well with one another. Semke et al. [8] studied the dynamic structural response of piping systems and recommended effective analytical techniques to evaluate the influence of bolt flanges with elastic gaskets. The results showed that a simple lumped mass pipe model provided sufficient information for evaluating the dynamic behavior of piping systems. The piping system and important equipment of modern ships are installed on the foundation support through a floating raft system [9], and the response behavior and shock environment of the pipe–float raft when the ship suffers from a shock-wave load are complicated. However, the existing studies on the shock resistance of ship piping systems have not addressed the shock-wave load-transfer law or the response behavior of key areas of pipe–float systems.
To study the load-transfer characteristics and response behavior of key areas of a multilayer pipe–float system under shock-wave loading and the shock environment of the pipe–float system, an experimental model of a pipe–float system was designed, and an underwater explosion experiment was conducted on a floating shock platform. The shock environment, load-transfer law, and response behavior of key areas of the pipe–float system under the shock-wave load were analyzed through experiments, and the influence of the shock-wave load direction on the pipe–float system was analyzed, which provides a theoretical reference for the design and selection of equipment in the pipe–float system. In Section 2, the design of the experimental model is described, including the simplification and equivalence of the experimental model and the experimental setup. Section 3 first describes the phenomenon of the experiment, analyzes the load of the explosion shock and explains the validity of the experimental data, and then describes the performance of the experimental device in Section 3.2, including the shock environment at the bottom of the shock platform. Section 3.3 is based on the analysis of experimental data to obtain the shock load-transfer law on the pipe–float system. Section 3.4 explains the response of local positions of pipe in combination with the experimental data of strain measuring points. Finally, Section 3.5 analyzes the shock environment of each layer of the pipe–float system and each part of the pipe. Section 4 summarizes Section 3 and puts forward the research to be improved in the future.
2. Experiment
2.1. Objects
To explore the load-transfer law of a pipe–float system and the response behavior of key areas, an experimental model of a pipe–float system was designed based on a real ship, as shown in Figure 1. The experimental model mainly includes the foundation support, floating raft, supporting foot, pipe, mass block, flexible connector, shock absorber, and displacement restrictor. Compared with the real ship structure, some assumptions and simplifications are made. The structure of the supporting foot is simplified without changing its mechanical characteristics. The end part of the pipe, which connects with the hull bulkhead in the real ship, is simulated by the supporting foot directly connected to the bottom of the floating platform, and the equipment on the pipe and the floating raft is equivalent and simulated by mass blocks of the same mass. The pipe model passed the water tightness test after installation and was filled with water and pressurized before the experiment to ensure that there was more than 2.5 MPa pressure inside the pipe during the test so as to simulate the internal pressure of the pipe under its working state. The foundation support, floating raft, mass block, and body of the pipe are made of Q235 steel, and the floating raft is supported by a foundation support on each side. The dimensions of the foundation support are 4380 mm × 460 mm × 244 mm, with a mass of approximately 668 kg. The floating raft is a shelf structure with a size of 4150 mm × 2567 mm × 228 mm and a mass of approximately 2541 kg. The installation positions of the shock absorbers, displacement restrictors, and supporting feet corresponding to the foundation support and the floating raft are designed with a web. The mass block simulates the equipment on the floating raft, with a size of 800 mm × 800 mm × 382 mm and a mass of approximately 1919 kg. The lower shock absorber system consists of 10 shock absorbers and 8 displacement restrictors, and the upper shock absorber system consists of 4 shock absorbers and 4 displacement restrictors. In the selection of shock absorbers, factors such as the installation size, load capacity, and total stiffness of the shock absorber system are considered. The dynamic characteristic values of the shock absorbers are shown in Table 1.
Figure 1.
Three-dimensional model and arrangement of measuring points.

Table 1.
Dynamic parameters of the displacement restrictors and shock absorbers.
As shown in Figure 1, A1–A9 acceleration measuring points are arranged at key positions at the inner bottom of the floating shock platform, floating raft, supporting foot, pipe and mass block, and vertical and horizontal acceleration sensors are installed at each measuring point. The parameters of each sensor, amplifier, and acquisition instrument are shown in Table 2. Two displacement measuring points, D1 and D2, are arranged at the two flexible connector positions. At each displacement measuring point, two displacement sensors are installed to measure both the vertical and horizontal relative displacements between the two ends of the flexible connector. Four strain measuring points, S1 to S4, are arranged at key positions on the pipe. At each strain measuring point, four strain gauges are distributed at the top and bottom of the same cross-section of the pipe and inside and outside of the bend to measure the strain at different locations of the same cross-section of the pipe.
Table 2.
Sensor parameters.
2.2. Design
As shown in Figure 2, the small floating shock platform used in the experiment consists of shock-resistant walls at the front and the back, with a total length of 5.44 m, a total width of 4.04 m, and a semicylindrical waterproof canopy supported by a skeleton at the top with a total height of 4.18 m, which can bear 8 t of experimental equipment. The floating shock platform is fixed in the center of the experimental pool by cables. The underwater pressure measuring point is positioned 5 m deep at a corner of the floating shock platform. To explore the effect of shock with different horizontal and vertical acceleration components on the pipe–float system, as well as the load-transfer rule and local response of the pipe–float system under different load components, two experimental cases are established. Case 1 mainly involves vertical shock, with the explosion source 2 m from the side at a water depth of 5.9 m. Case 2 mainly involves horizontal shock, with the explosion source 4.5 m from the side at a water depth of 3 m.
Figure 2.
Schematic of the experimental setup.
3. Experimental Results and Discussion
3.1. Shock-Wave Load
Compared with Case 2, the explosion source in Case 1 is located deeper and closer to the side, as shown in Figure 3. The explosion generates irregular spray spreading at the water surface, reaching approximately 9.2 m in height, without the formation of any obvious water column. Conversely, the explosion in Case 2 produces an obvious water column approximately 12.3 m high, accompanied by a small amount of spray spreading.
Figure 3.
Underwater explosion experiment: (a) Case 1; (b) Case 2.
As shown in Figure 4, the shock-wave pressure generated by the explosion in Case 1 reaches its peak value of 12.16 MPa in an extremely short period of time; the peak value of pressure generated by the first bubble pulsation is 1.67 MPa, representing an 86.3% decrease compared to the peak value of the shock-wave pressure. In Case 2, the peak value of the shock-wave pressure is 9.29 MPa. The peak pressure of the first bubble pulsation is 1.10 MPa, which is reduced by 88.2%. The shock from bubble pulsation is significantly smaller than that from the explosion shock wave from the perspective of energy. According to the research results of previous scholars [10,11], Many empirical formulas have been developed to predict the features of underwater explosions (Cole, 1965). For far-field underwater explosion, the empirical formula could be expressed as follows:
where is the peak pressure value in MPa, is the propagation distance of the explosion point to the test point in m, and W is the weight of the TNT charge in kg.
Figure 4.
Pressure—time history curves of the underwater explosion pressure.
For TNT, the calculation formulas for the first pulsation period T and the maximum radius Rm of underwater explosive bubbles are as follows:
where W is the explosive mass, and H is the initial water depth of the explosive source. According to Formulas (1)–(3), Table 3 shows the differences between the experimentally measured values and the theoretically calculated values of the peak shock-wave pressure and the bubble pulsation period. The pressure in the radial region is higher, and the shock waves and bubble loads in the top direction are stronger [12]. Moreover, due to the influence of various external factors in the experiment, such as the roll and displacement of the floating shock platform due to the explosion shock wave, the relative position between the underwater pressure measuring point and the explosion source varies and cannot be accurately determined. The location of the explosion source is too close to the bottom of the floating shock platform and the water surface, and the shock of the explosion shock wave on the water surface and the inner bottom of the floating shock platform is relatively significant. As a result, there are certain differences between the theoretically calculated peak shock-wave pressure and bubble pulsation period and the measured values [13,14,15,16,17,18].
Table 3.
Comparison of the experimental and theoretical values.
3.2. Model Performance
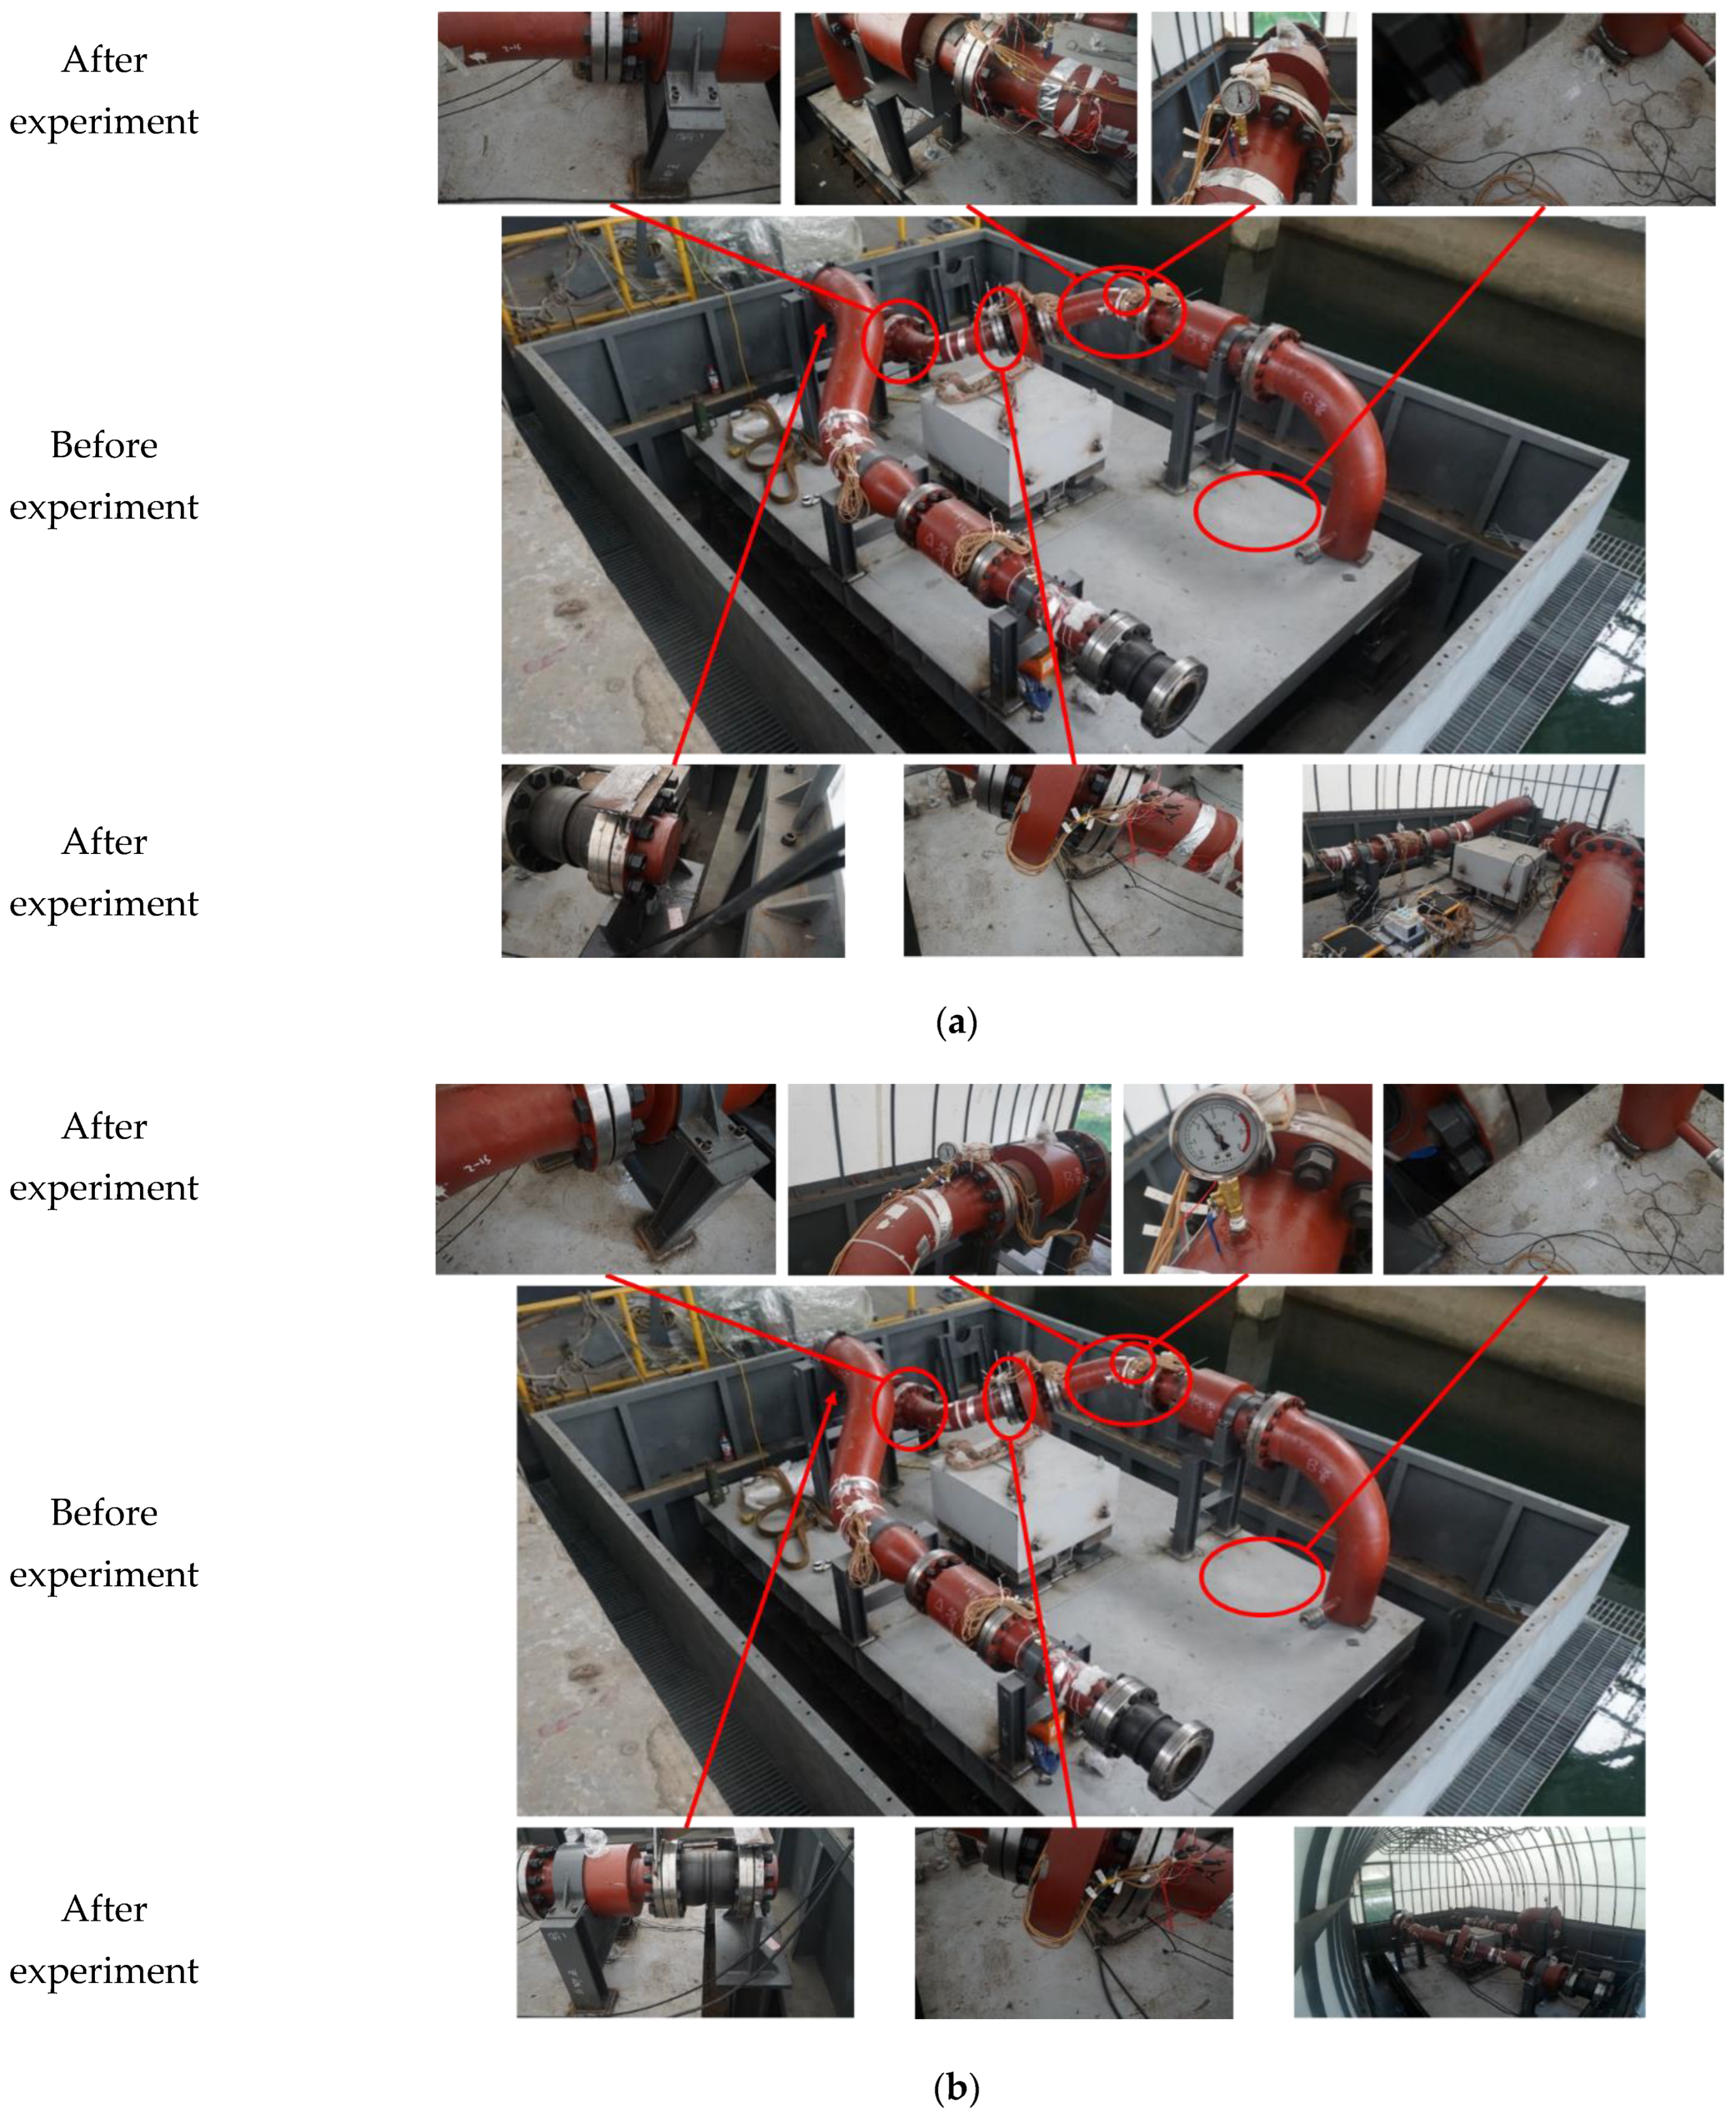
The state of the model before and after the experiment in Case 1 is shown in Figure 5. The structural integrity of the test model was not affected by the explosion shock, and no obvious deformation was observed in the foundation support, the panel, or the web of the floating raft. Additionally, no deformation was observed in the pipe, and there was no variation in the water pressure within the pipe before and after the experiment, indicating that the watertightness of the pipe was maintained. The support pin and clamp were not loose or damaged, and the shock absorbers and displacement restrictors were in normal conditions. The flexible connectors were in a normal state, and the acquisition instrument worked normally. The situation of Case 2 is also shown in Figure 5; the whole structure of the model is intact without visible damage. The water pressure in the pipe does not change, and all the equipment is in normal condition.

Figure 5.
Model performance: (a) Case 1; (b) Case 2.
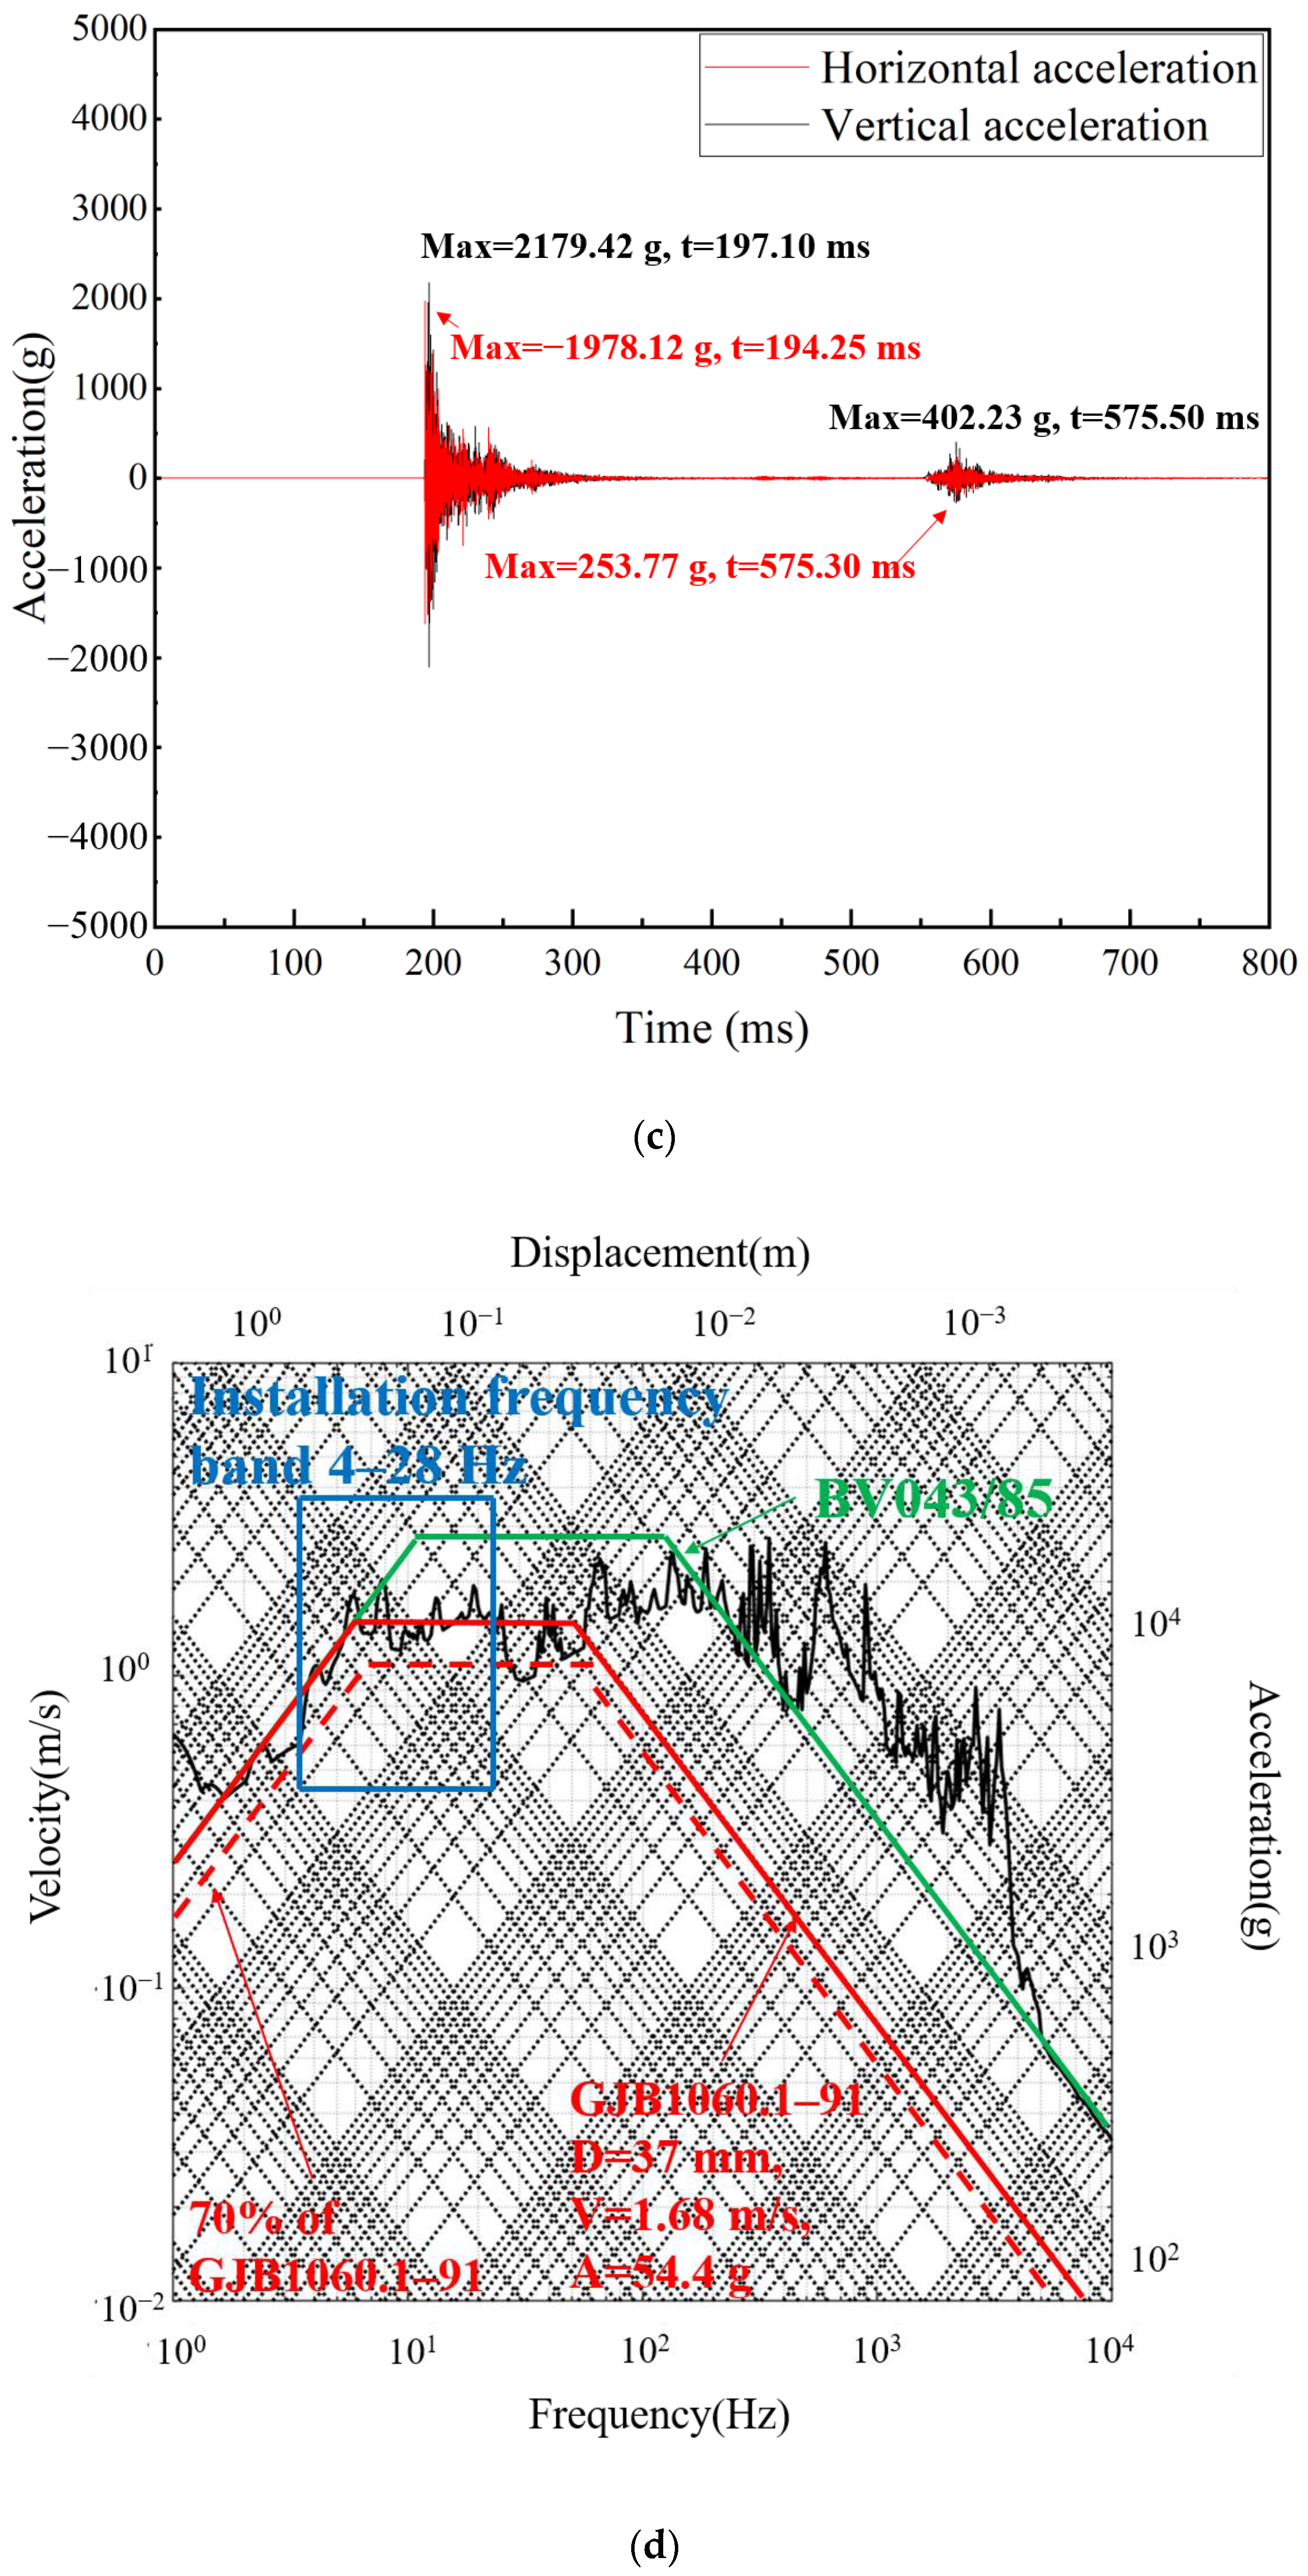
The time–acceleration history curve at A1 and the shock environment are shown in Figure 6. In each group of time–acceleration history curves, two acceleration responses caused by the explosion shock wave and the first bubble pulsation can be observed. The acceleration attenuation in Case 1 is more severe than that in Case 2. This is because the damping in the vertical direction of the pipe–float system is generally greater than that in the horizontal direction; consequently, the energy more rapidly dissipates in the vertical direction. To evaluate the shock resistance of the pipe–float system, GJB1060.1-91 [19] and the German military standard BV043/85 [20] were used to evaluate the shock environment at A1. The vertical shock environment at the inner bottom of the floating shock platform was evaluated in Case 1, while the horizontal shock environment at the inner bottom of the floating shock platform was evaluated in Case 2. The installation frequency of the pipes and equipment in a pipe–float system ranges from 4 to 28 Hz. The response spectrum curves of the shock environment at A1 are all greater than 70% of the standard shock spectrum in GJB1060.1-91, and there are more than two intersection points with the standard shock spectrum. The total area of the response spectrum below the standard shock spectrum is smaller than that above it. The shock environment at the inner bottom of the floating shock platform meets the standard requirements, and the integrity and structure of the pipe–float system are not damaged in the explosion experiment, indicating that the safety of the pipe–float system meets the requirements.
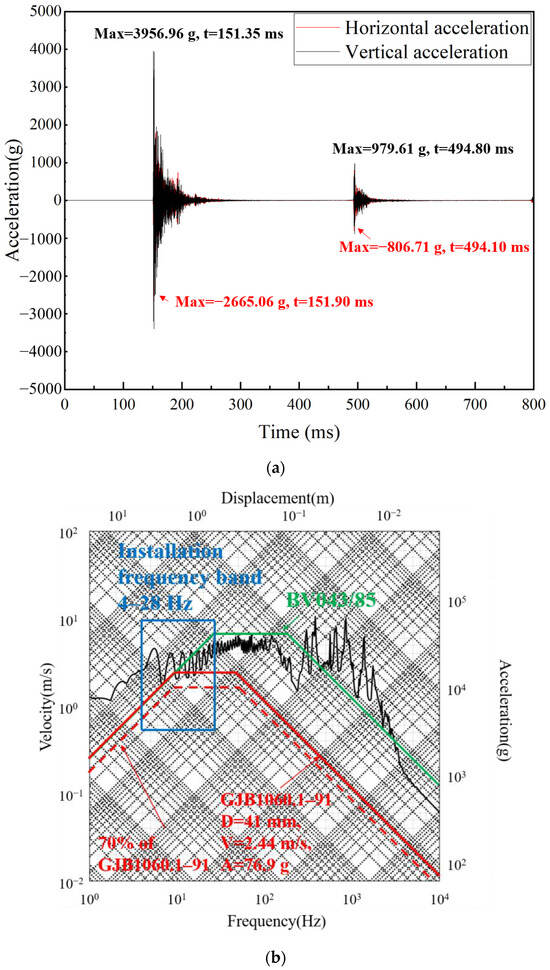
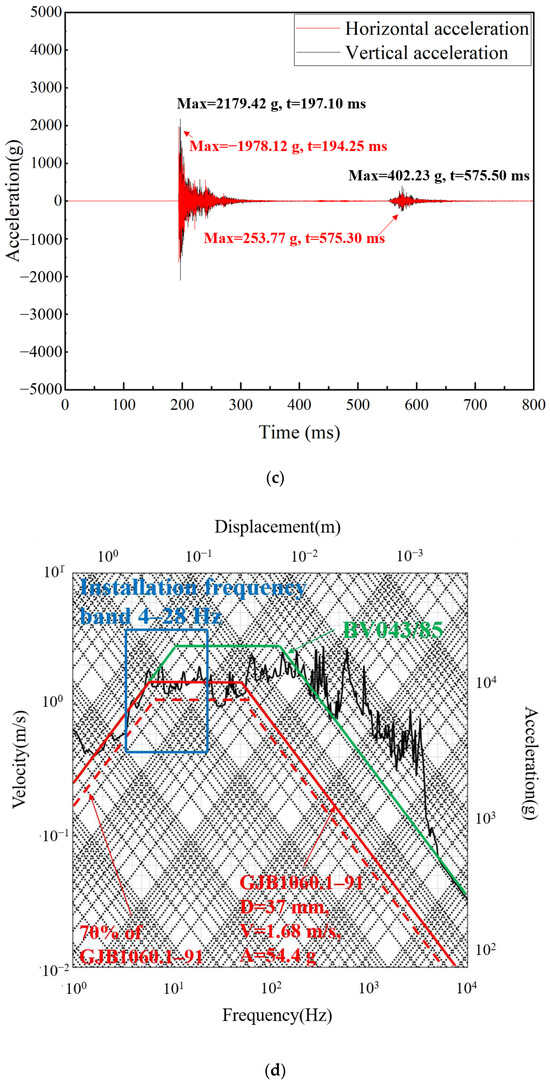
Figure 6.
Shock-wave load at the bottom of the floating shock platform: (a) time–acceleration history curves at the bottom of the floating shock platform in Case 1; (b) shock response spectrum at the bottom of the floating shock platform in Case 1; (c) time–acceleration history curves at the bottom of the floating shock platform in Case 2; and (d) shock response spectrum at the bottom of the floating shock platform in Case 2.
3.3. Load-Transfer Law
The vertical acceleration of each layer of the pipe–float system in Case 1 is shown in Figure 7. In the time sequence, the inner bottom of the floating shock platform produces an acceleration response first; the acceleration response of the mass block of the piping equipment significantly lags behind, and the acceleration reaches its peak more slowly. The time history curves of the floating raft acceleration, pipe acceleration, and mass block acceleration exhibit low-frequency response characteristics.
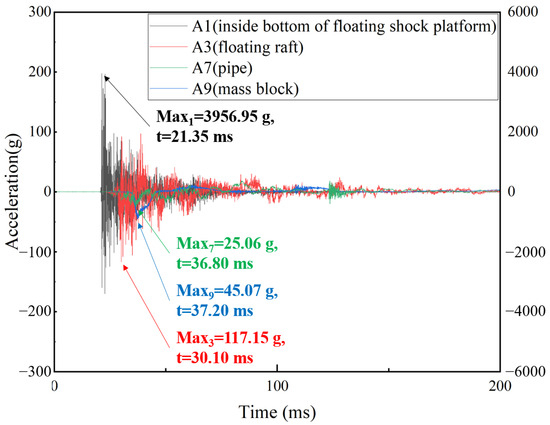
Figure 7.
Time–acceleration history curves of the vertical acceleration of the pipe–float system in Case 1.
The peak acceleration values are shown in Figure 7. In terms of timing, the vertical component and horizontal component of acceleration reach their peak values at almost the same time. The time–acceleration history curves at the inner bottom of the floating shock platform and the acceleration measuring points on the foot directly connected to it are shown. The peak acceleration at A2 is greater, and the variation is more drastic than that at A3. On the one hand, A2 is located on the explosion-facing side of the surface of the floating raft, and A2 is located between the two supporting feet and above the displacement restrictor between the two shock absorbers. Due to the special role of the displacement restrictor, the floating raft will undergo greater acceleration at this position. The vertical acceleration components significantly weaken from the inner bottom of the floating shock platform to the floating raft and then to the pipe and the mass block. The acceleration amplitude on the floating raft is more than 95% weaker than that on the floating shock platform, and the acceleration amplitude on the pipe and the mass block is approximately 60% weaker than that on the floating raft.
As shown in Figure 8, compared with Case 1, the horizontal component of the acceleration of the shock-wave load at the inner bottom of the floating shock platform is greater in Case 2. However, for the other positions, such as the floating raft and the pipe, the ratio of the vertical component to the horizontal component of the acceleration of the load significantly varies. This is because the system structure in the middle and upper layers of the pipe–float system affects the acceleration transmission of the shock-wave load. In the pipe–float system, the horizontal acceleration values at the measuring points on the same layer have little difference, slightly decreasing from the explosion-facing surface to the back surface, while the vertical acceleration values at the measuring points on the same layer have more significant differences, indicating that the system structure has less influence on the horizontal load transfer. At the same time, the horizontal component of the A3 acceleration accounts for a much larger proportion than that at A2, which indicates that the attenuation of the horizontal acceleration from the onboarding plane to the back plane on the floating raft is much weaker than that of the vertical acceleration. From A2 to A3, the amplitude of the vertical acceleration decreases by 62.8%, while the amplitude of the horizontal acceleration decreases by 16.5%. From the bottom of the floating shock platform to the floating raft, the peak horizontal acceleration of the shock-wave load attenuates by 92.4%, that from the floating raft to the pipe further attenuates by 78.5%, and that from the floating raft to the mass block attenuates by 91.3%.
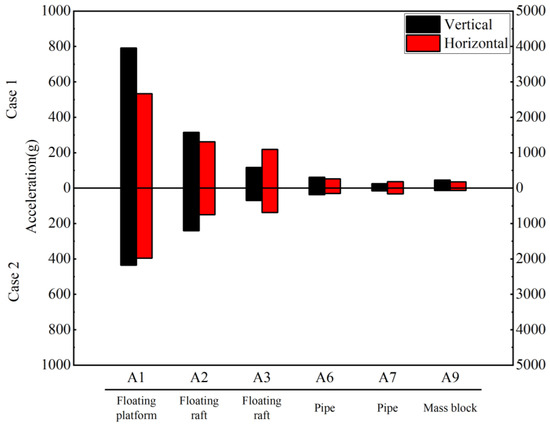
Figure 8.
Peak acceleration of each layer of the pipe–float system.
3.4. Pipe Response
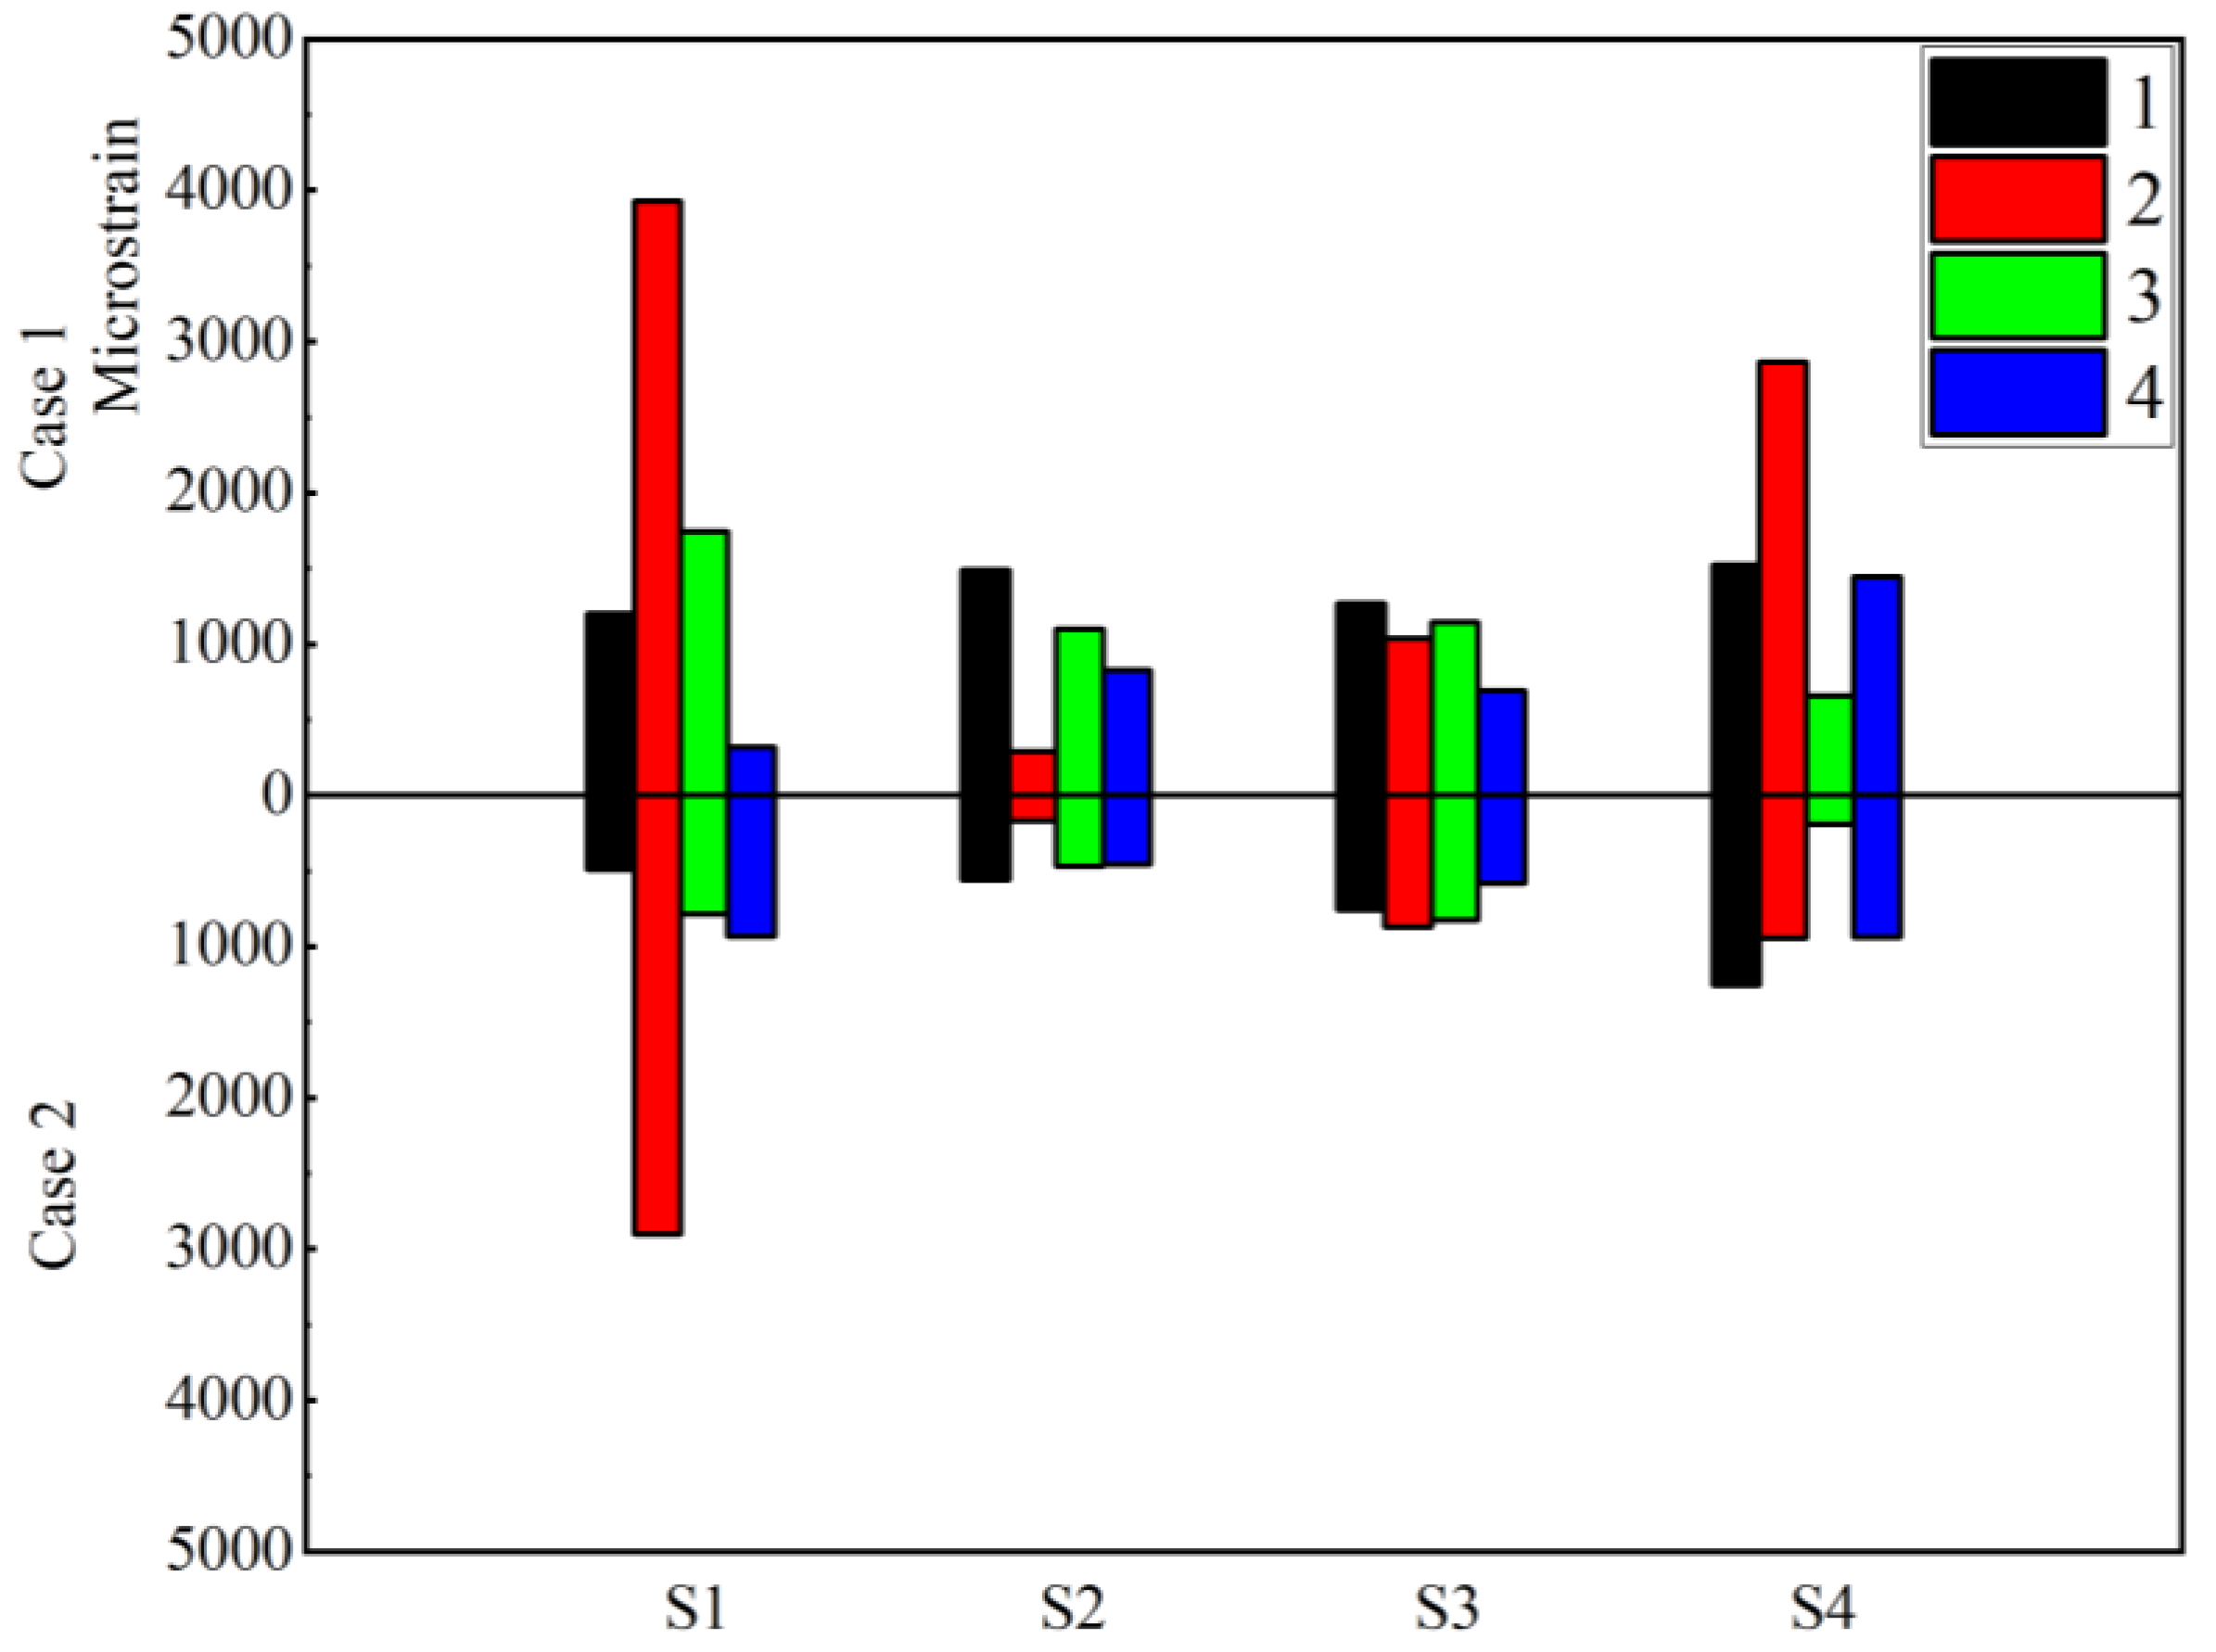
Figure 9 shows the peak value of the microstrain at each strain measuring point on the pipe in the two cases, where a positive value is the strain generated by tensile stress and a negative value is the strain generated by compressive stress. Where 1, 2, 3, and 4, respectively, represent the strain gauges corresponding to each group of strain gauges, and their corresponding positions are shown in Figure 1. A large compressive stress is generated near the inner side of the bend at S1-2, as shown in Figure 1, and the equipment equivalent mass block is connected above the inclined side of the bend at S1. When the pipe suffers from a shock-wave load, an obvious stress concentration occurs, and the stress concentration phenomenon is particularly obvious near the inner side of the bend. The peak value of the microstrain at S1-4 in Case 2 is larger than that in Case 1, indicating that the increase in the vertical component of the shock-wave load leads to an increase in the horizontal component of acceleration of the shock-wave load and the stress concentration will move closer to the inner side of the bend. In the case of the vertical shock-wave load, stress concentration is observed near the bottom of the bend.
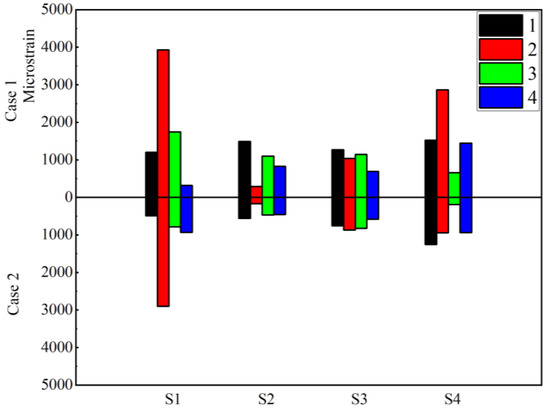
Figure 9.
Microstrain peak comparison (1, 2, 3, and 4 correspond to the four strain gauges of each group of strain measuring points in Figure 1).
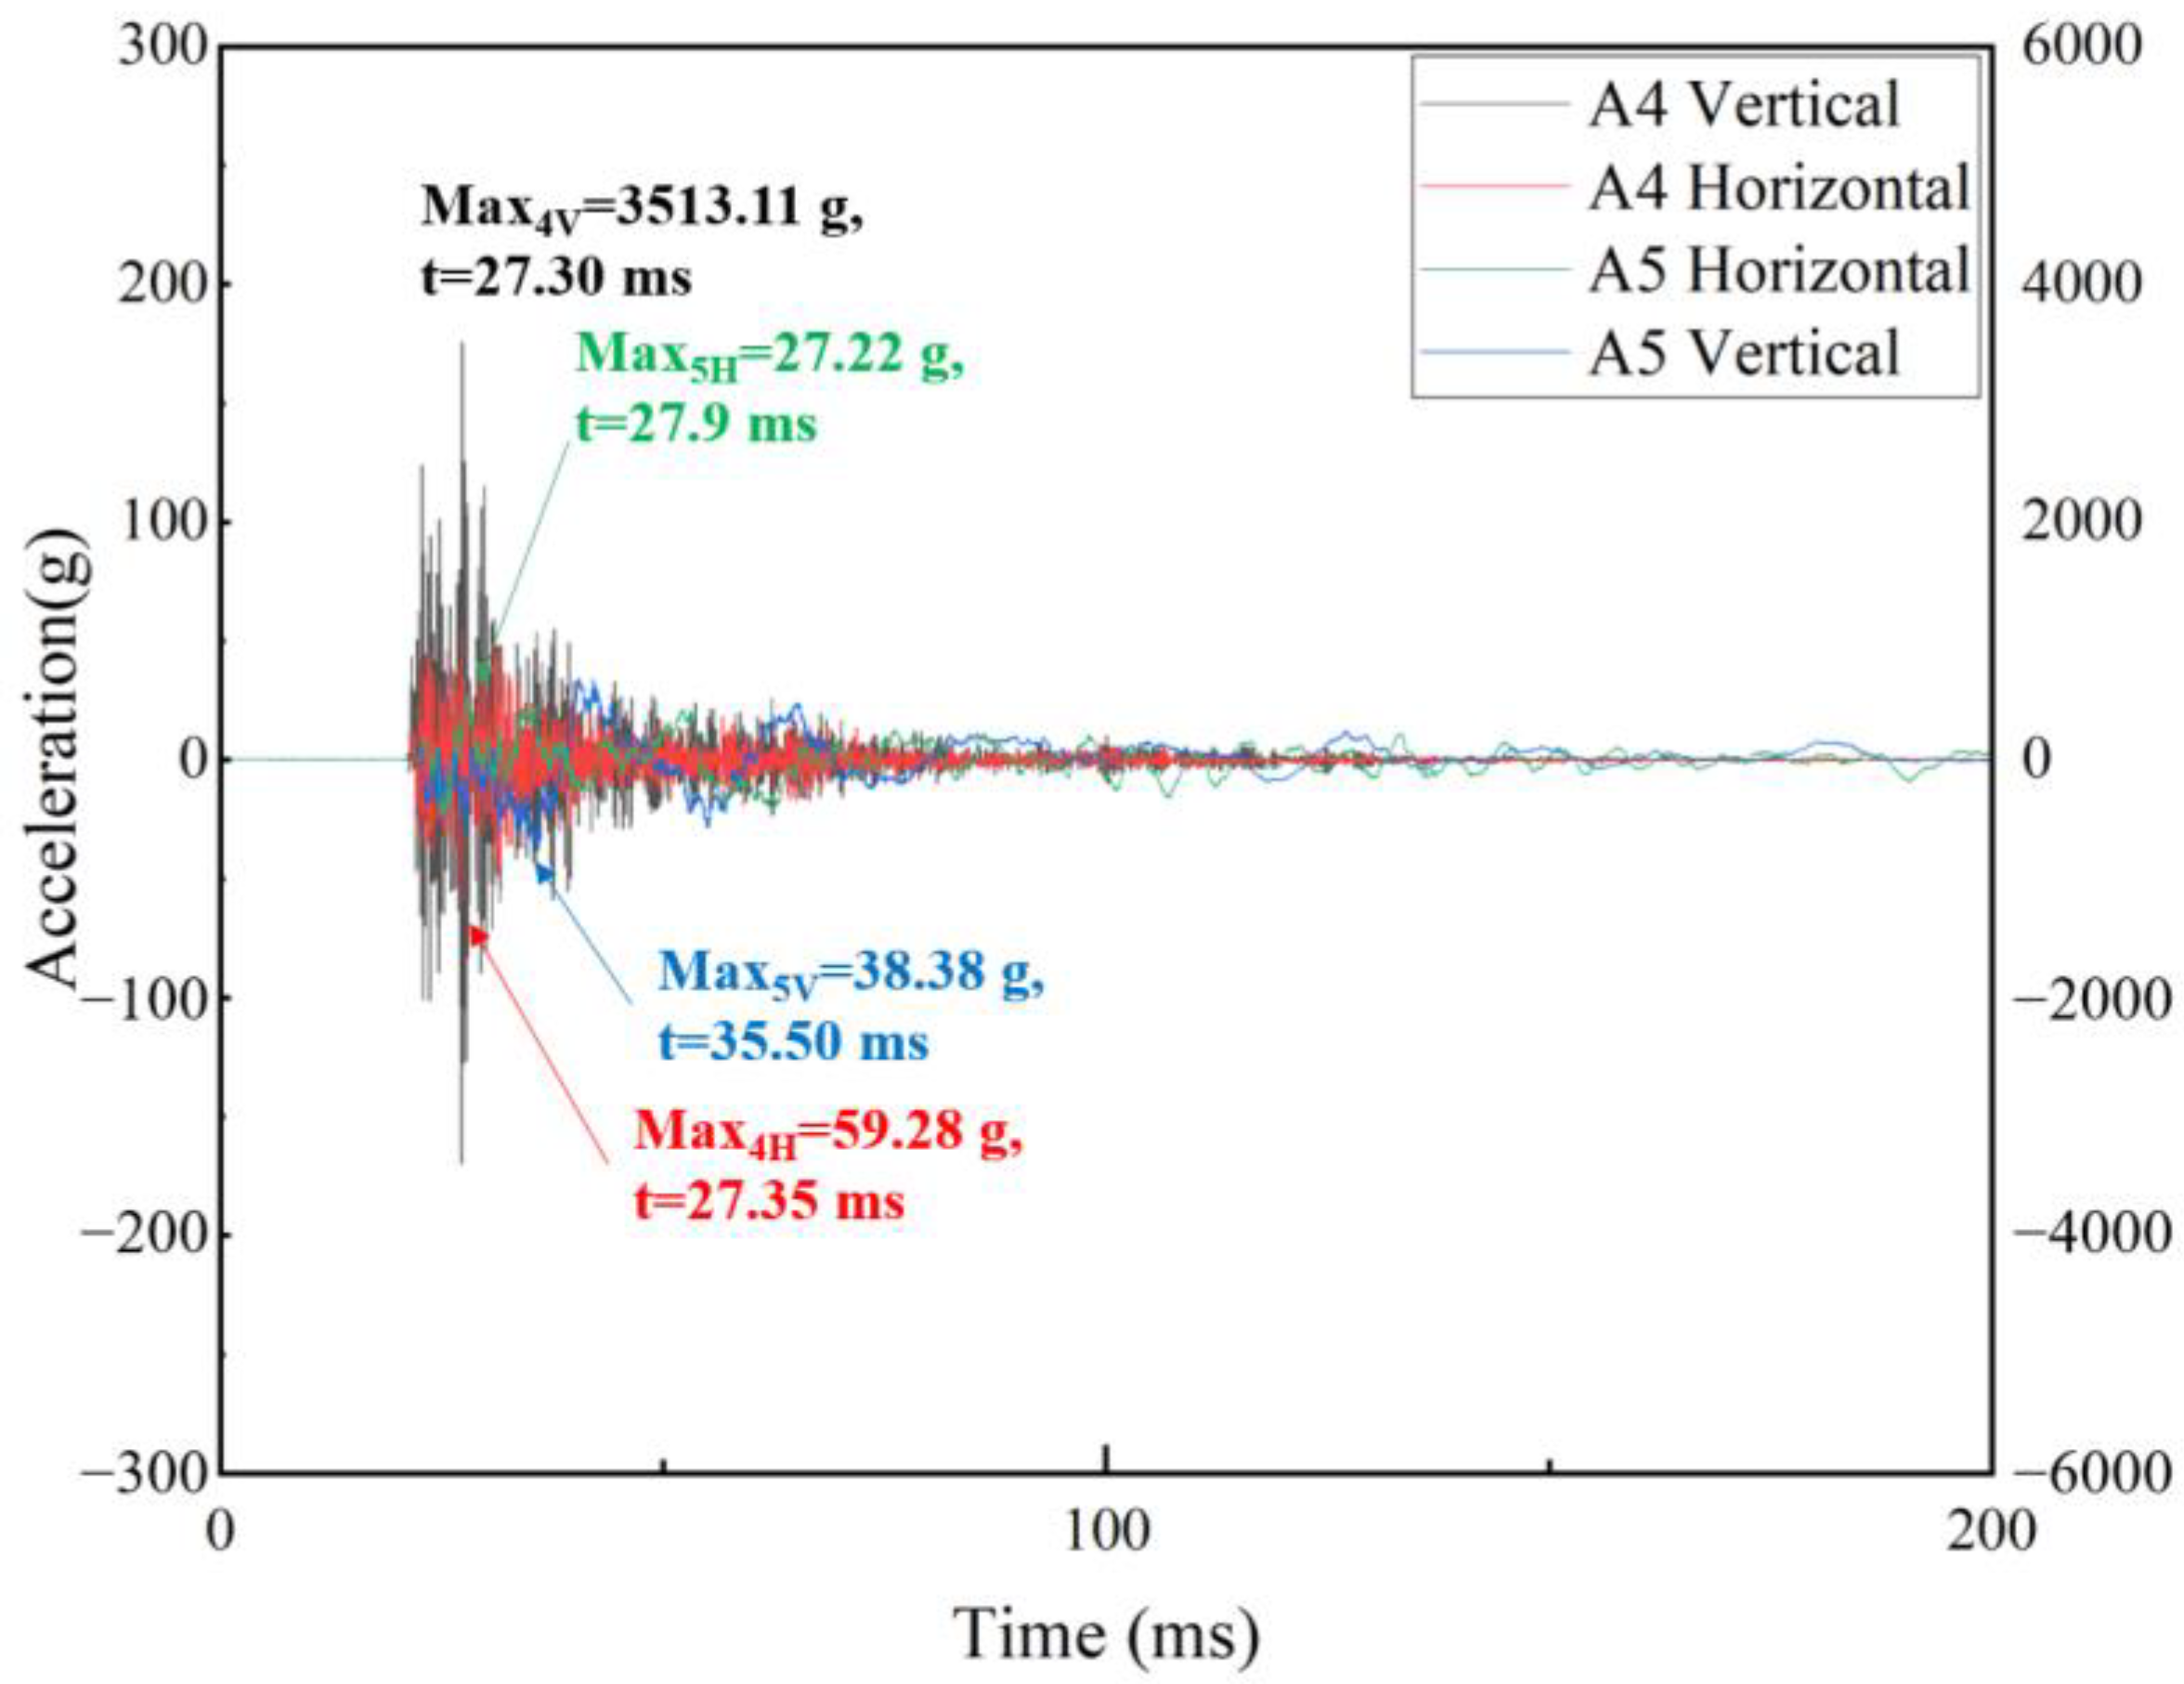
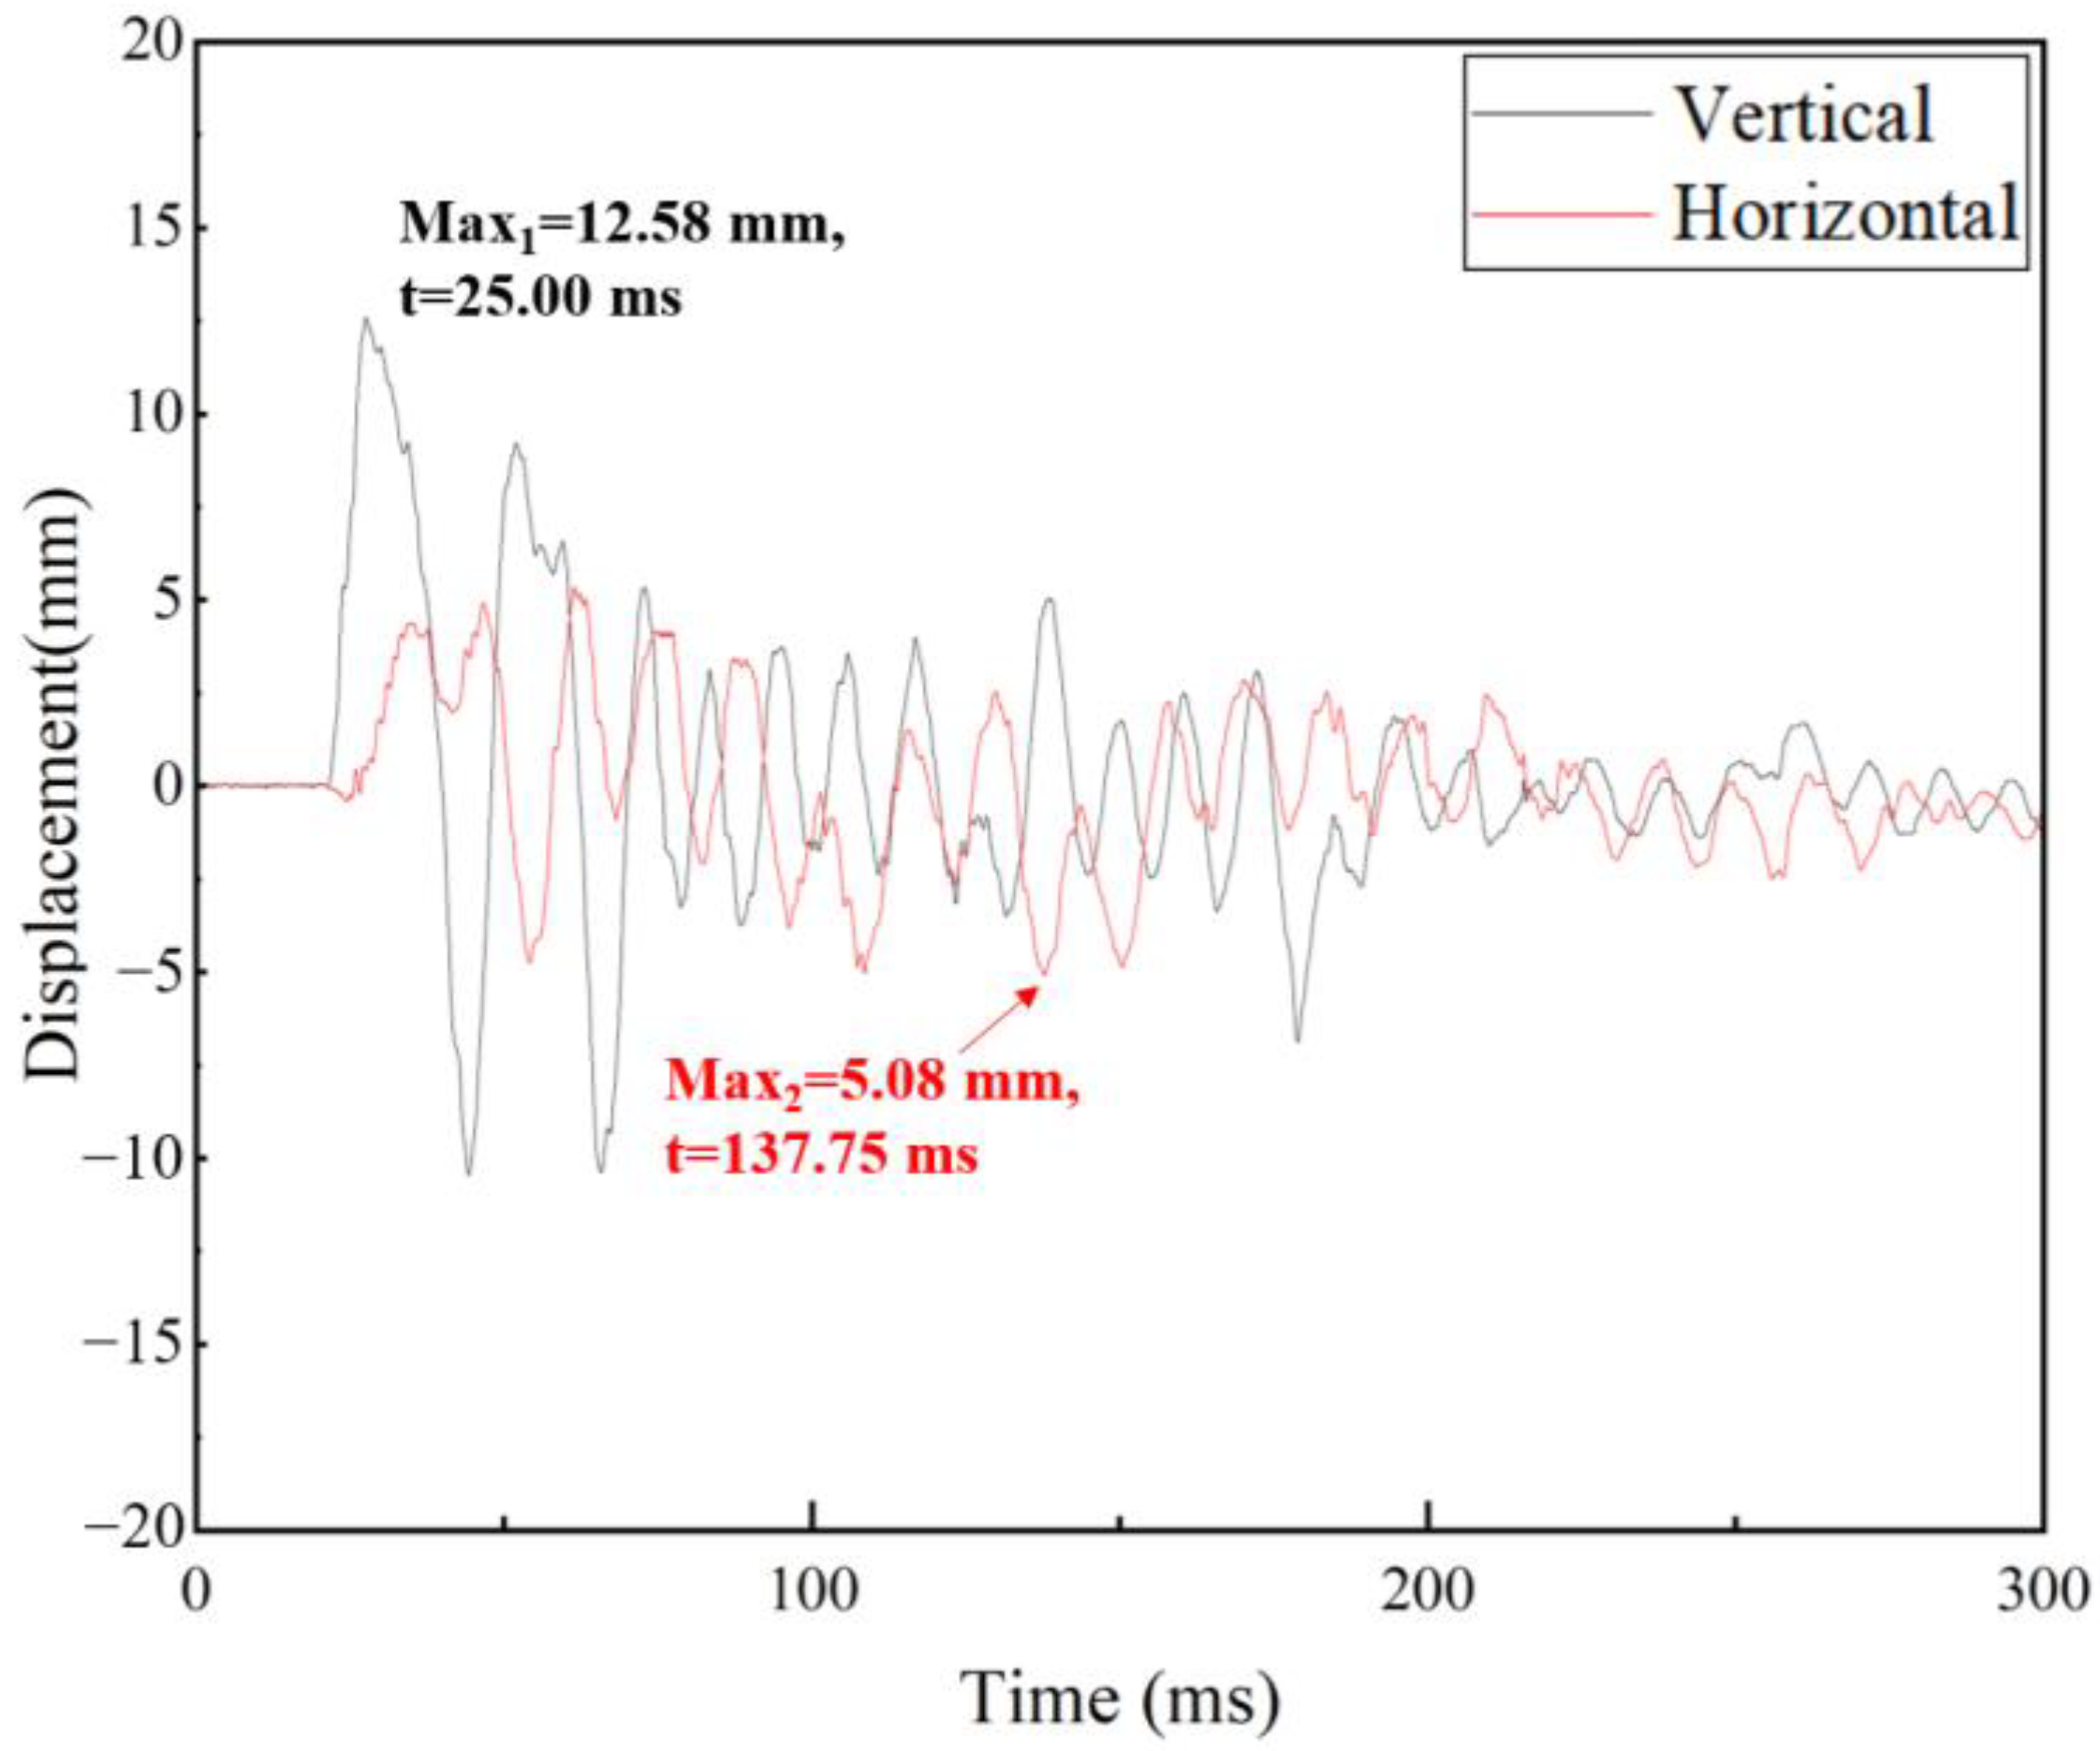
Figure 10 shows the time–acceleration history curves at measuring points A4 and A5 in Case 1. Figure 11 shows the time history curves of the vertical relative displacement and horizontal relative displacement between the two ends of the flexible connector at D2. The peak acceleration of key positions on the pipe is shown in Figure 12. Measuring point A4 is located on the foot directly connected to the inner bottom of the floating shock platform, and its time–acceleration history curve shows high-frequency response characteristics. The pipe at A5 is directly connected to the inner bottom of the floating shock platform through the supporting foot, resulting in a peak acceleration close to that at A1, and the vertical acceleration at A4 of the pipe is attenuated by 98.9% compared to that at A5 through the flexible connector. The displacement compensation effect of the flexible connector not only blocks the acceleration transmission between the pipes at the two ends of the flexible connector but also prevents the influence of the frequency response characteristics of the pipes on the two ends. In Case 1, the peak vertical relative displacement between the two ends of the flexible connector is 12.58 mm, and the peak horizontal relative displacement is 7.78 mm, both of which are within the deformation capacity of the flexible connector.
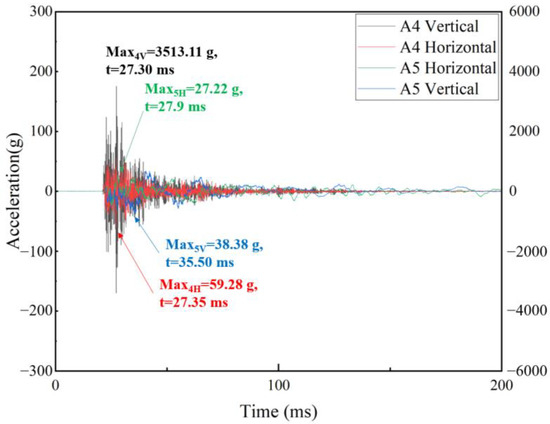
Figure 10.
Acceleration–time history curves of pipe acceleration.
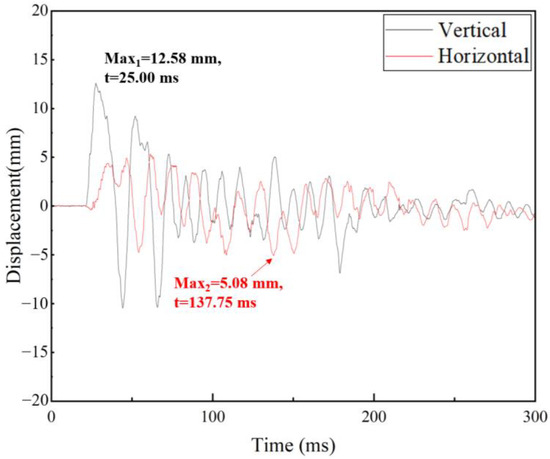
Figure 11.
Relative displacement–time history curves of the two ends of the flexible connector.

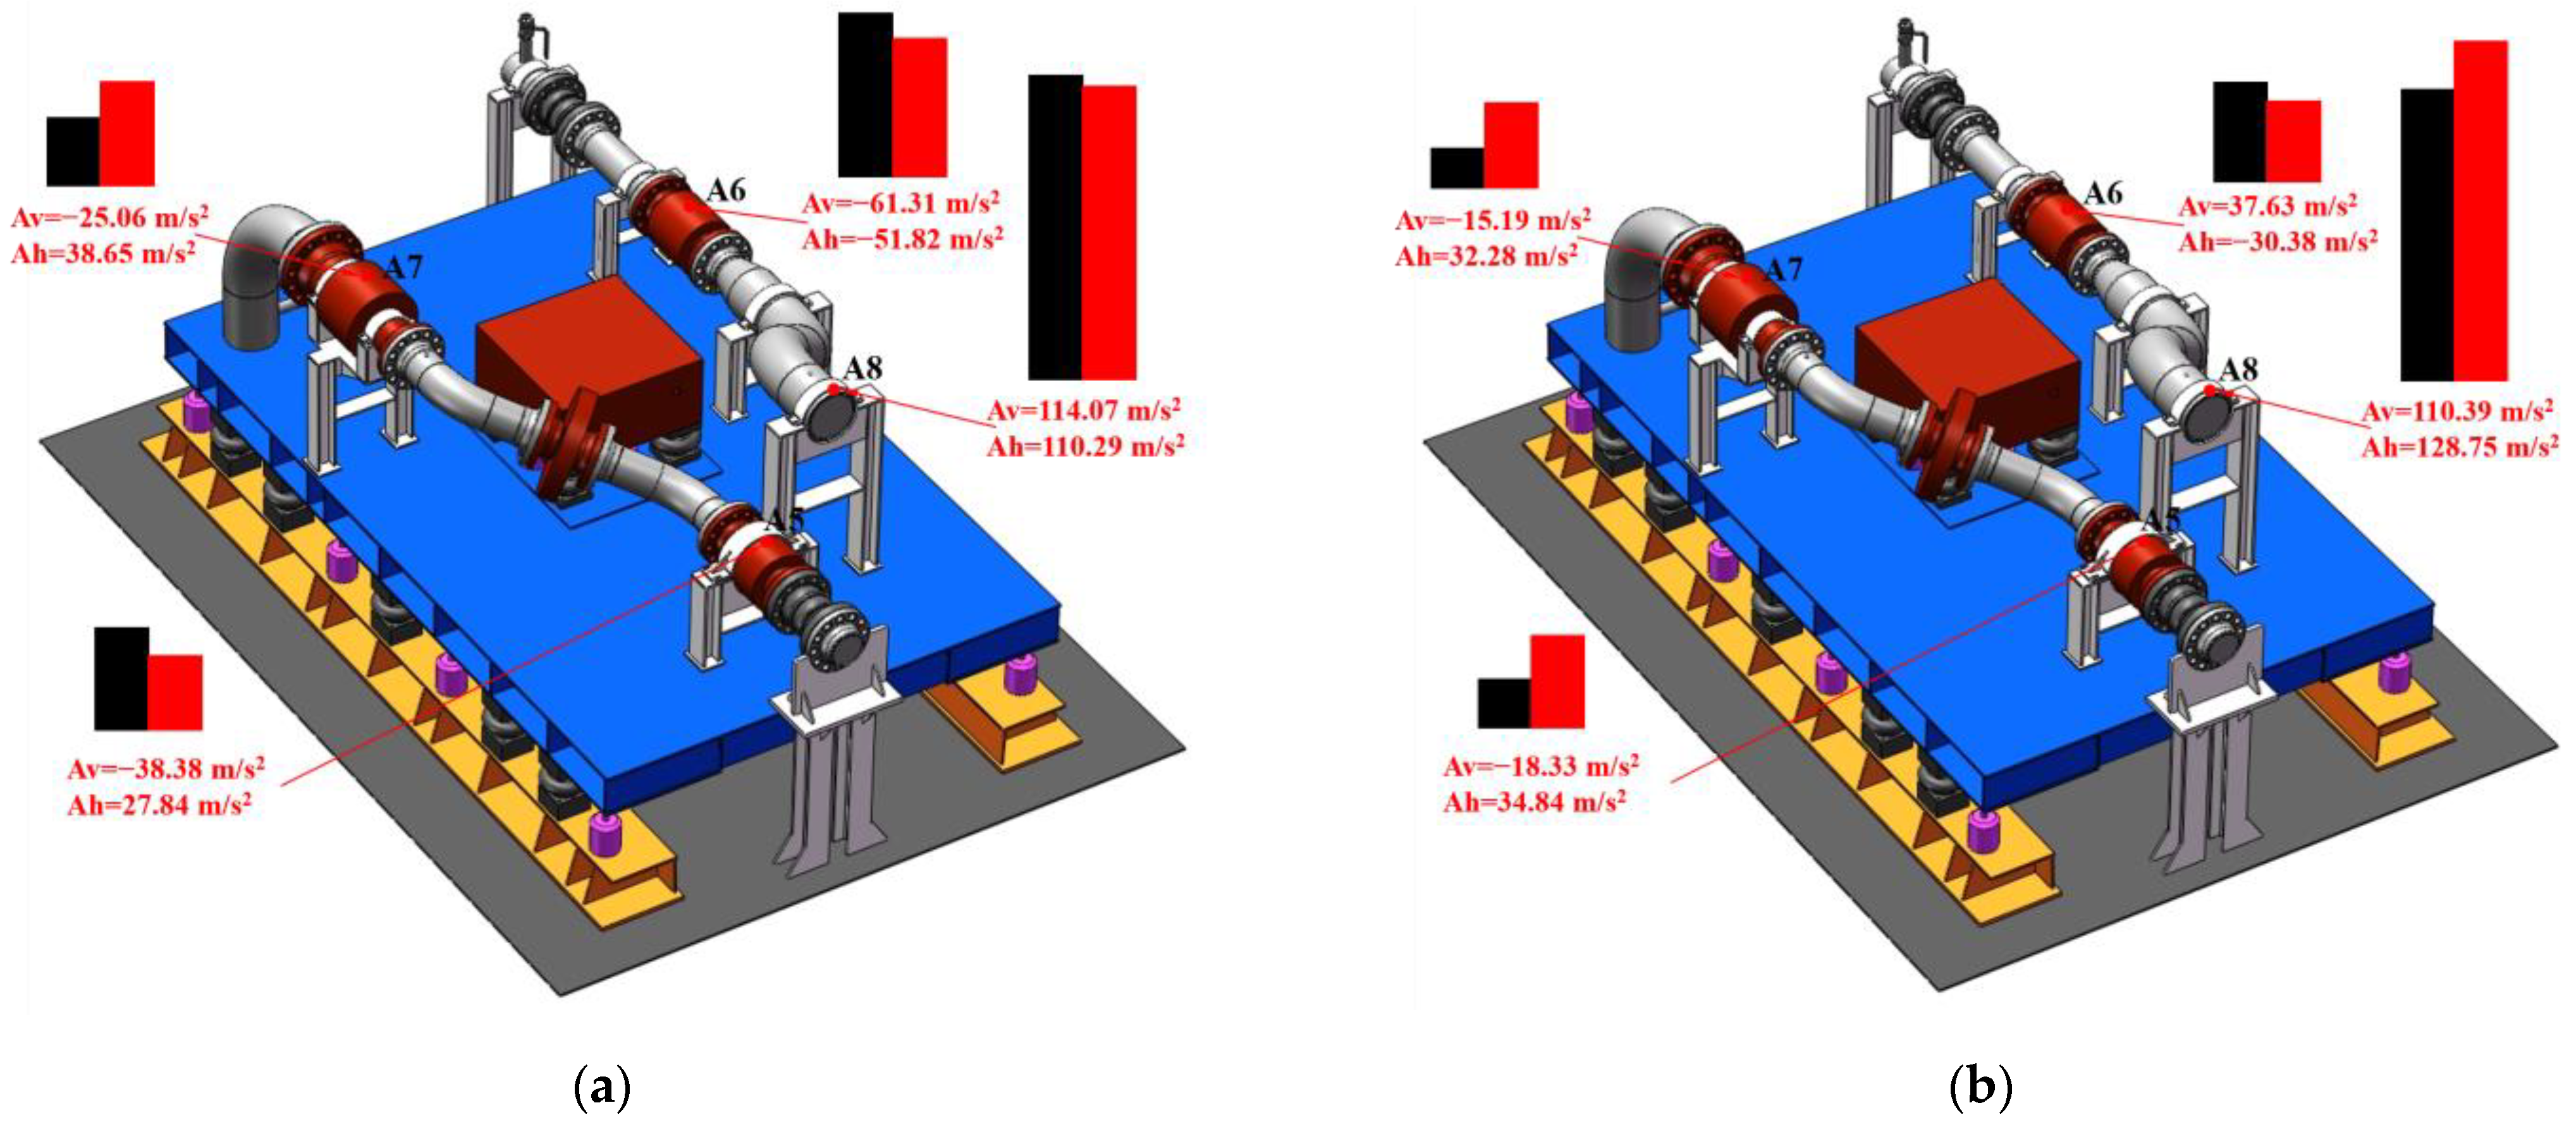
Figure 12.
Peak acceleration at the pipe measuring points: (a) Case 1; (b) Case 2.
3.5. Shock Environment Evaluation
The shock response spectra at A2 and A3 are shown in Figure 13, and it can be seen that compared with A2, the main frequency segment at A3 is shifted toward middle and low frequencies. As shown in Figure 1, A2 and A3 are located on the upper surface of the floating raft, A3 is located immediately below the supporting foot, and A2 is not near the equipment and is less affected by the equipment above. At the same time, the frequency component at A3 is extremely close to that at A7, which is located on the pipe directly above A3, and a relatively obvious spectral dip phenomenon can be observed near 30 Hz, indicating that the shock environment at position A3 is affected by the equipment above. Although A6 is located directly above A2, A2 is considerably distant from the supporting foot; consequently, the shock response spectra at A2 and A6 do not show a main frequency consistency similar to the shock response spectra at A3 and A7 [21,22].
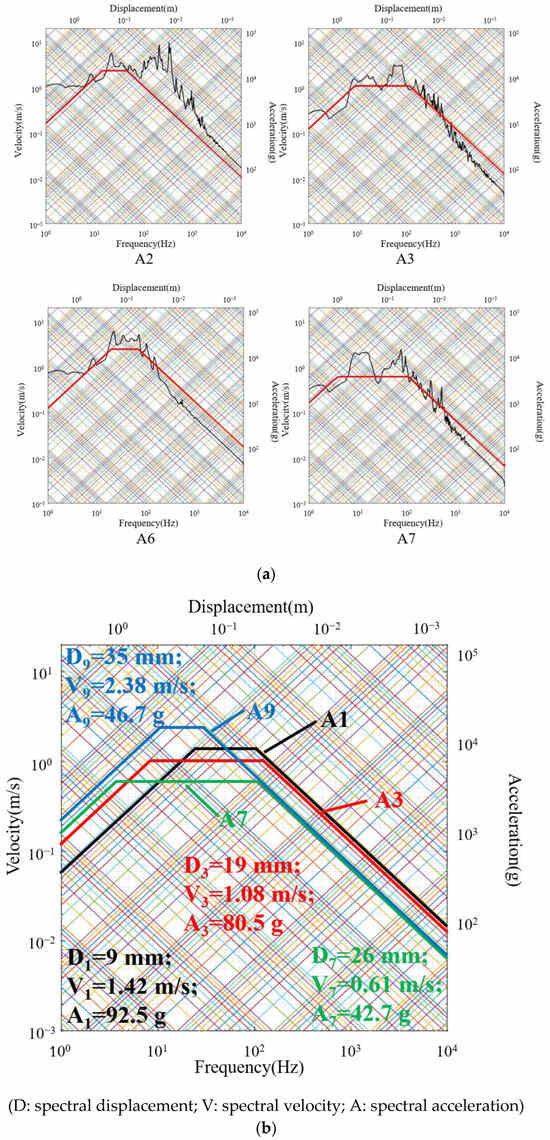
Figure 13.
Shock response spectra at A2, A3, A6, and A7: (a) shock response spectra for each point; (b) shock spectra values.
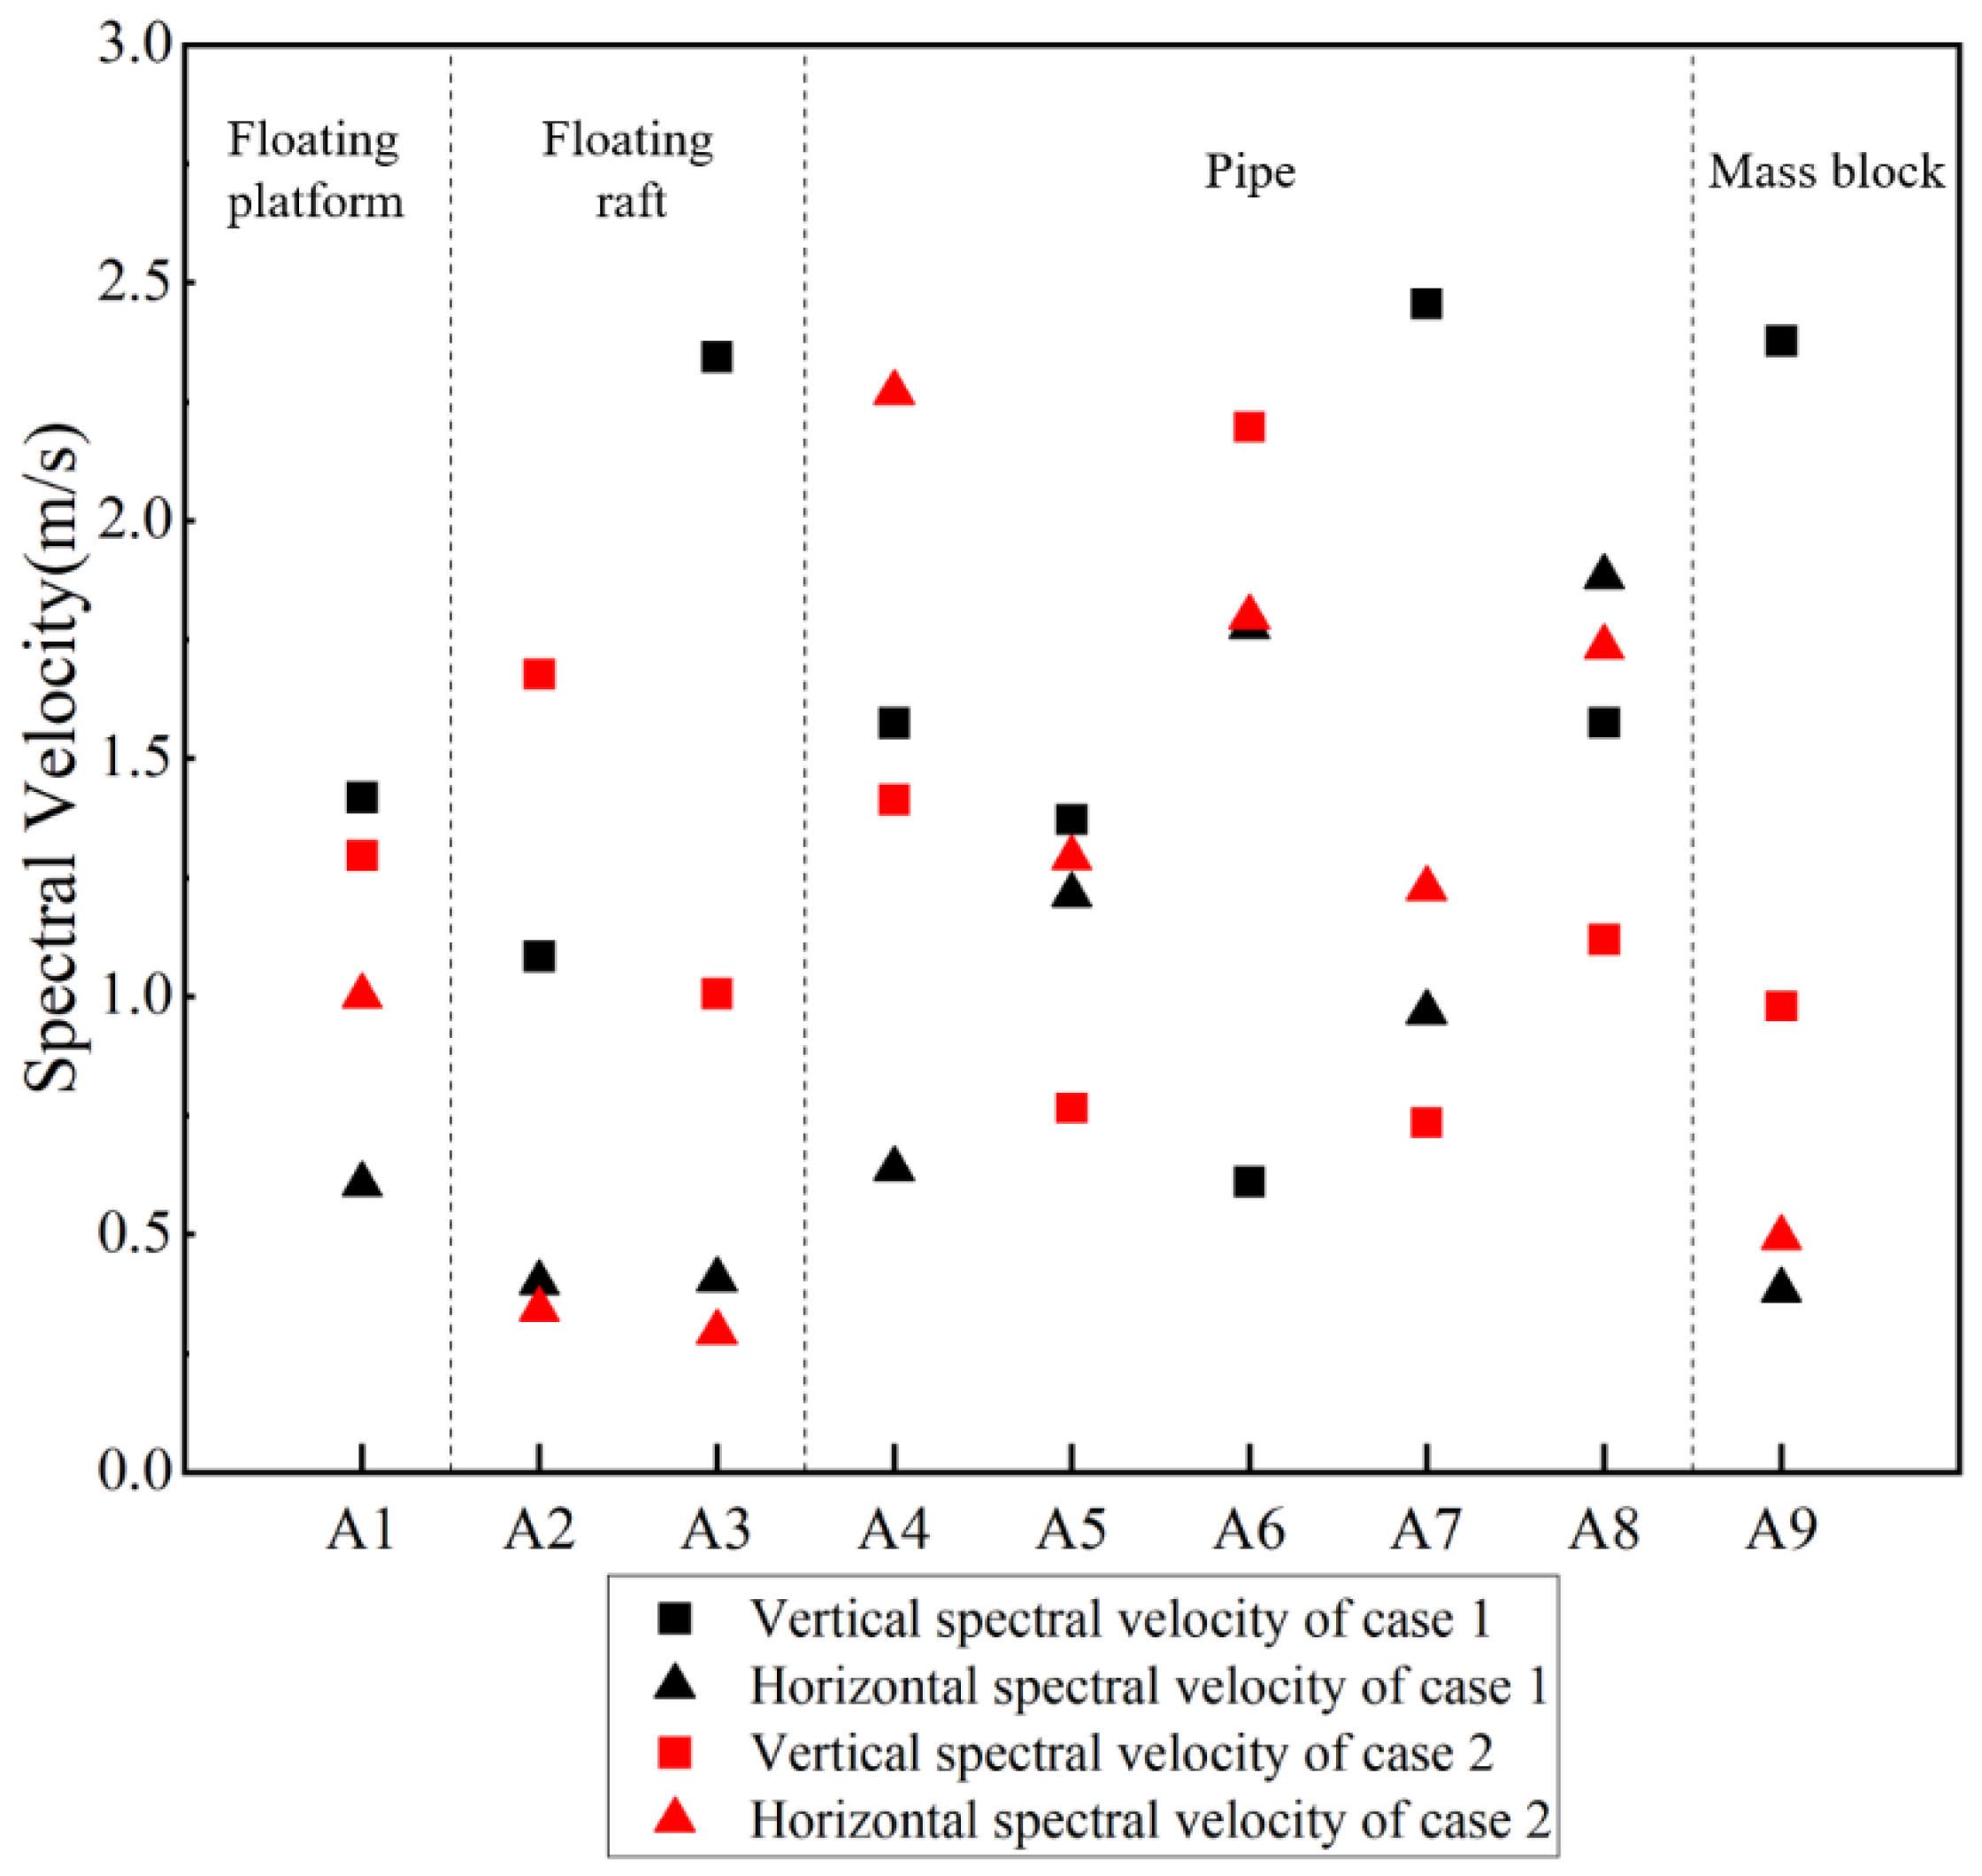
Figure 14 shows the spectral velocity at each acceleration measuring point. The horizontal spectral velocity at each acceleration measuring point in Case 2 tends to be higher than that in Case 1. The same variation trend can be seen in the spectral velocities at the acceleration measuring points on the pipe under the different cases and directions. However, due to the different structural characteristics at each measuring point, the variations in the spectral velocities are significantly different. For example, the vertical spectral velocity at A6 is obviously greater in Case 2, which may be caused by the relatively long distance between A6 and the connection position of the supporting foot and the clamp. Similarly, the A7 position is more susceptible to the vertical shock load, while the structure at A4 is more significantly affected by the horizontal shock load [23,24].
Figure 14.
Spectral velocity at acceleration measuring points.
4. Conclusions
An experimental model of a pipe–float system was designed and manufactured based on a real ship, and an underwater explosion experimental study on the floating shock platform was carried out. First, the acceleration–time history data of each layer of the pipe–float system in two cases were compared and analyzed, and the shock environment was obtained. The local response characteristics of the pipe were analyzed through the microstrain data from the strain gauges on the pipe. Combined with the acceleration transducers and the displacement transducers on the flexible connector, the load-transfer characteristics at the flexible connector were explained. Based on the acceleration–time history data, the shock environment at the key positions of the pipe–float system was obtained. The main conclusions are summarized as follows:
- (1)
- In Case 1, the explosion does not produce an obvious water column but forms a spray that spreads, with the shock-wave load predominantly exhibiting vertical acceleration. In Case 2, the explosion source is shallower and further from the side of the floating shock platform, and the explosion produces an obvious water column. Additionally, the horizontal acceleration component of the shock-wave load is larger than that in Case 1. Overall, the shock-wave load transfer in the pipe–float system decreases from the bottom to the top and from the explosion-facing surface to the back surface. The system structure on the floating raft influences the magnitude of the load acceleration and the composition of the vertical and horizontal components. Moreover, the effect of the system structure on the vertical load transfer is more significant than that on the horizontal load transfer.
- (2)
- The phenomenon of stress concentration is particularly obvious at the bend, with a maximum microstrain value of 3931.7 in Case 1 and 2899.3 in Case 2. The position of the stress concentration is influenced by both the vertical and horizontal components of the acceleration of the shock-wave load. In Case 2, with a larger proportion of horizontal acceleration, the stress concentration in the bend is closer to the inner side of the bend, while in Case 1, the stress concentration in the bend is closer to the bottom of the bend.
- (3)
- The displacement compensation effect of the flexible connector can effectively block the response behavior of the pipes at both ends, resulting in a peak vertical acceleration difference of 98.9%. In Case 1, the maximum vertical and horizontal relative displacements of the two ends of the flexible connector are 12.58 mm and 5.08 mm, respectively.
- (4)
- The shock spectral velocity at A7 and key positions in the pipe–float system are obtained. In Case 1, the vertical spectral velocity and the horizontal spectral velocity are 2.46 m/s and 0.97 m/s, while in Case 2, these values are 0.73 m/s and 1.23 m/s, respectively. These results offer valuable insights for guiding the selection of equipment at key positions on the pipe.
Author Contributions
M.L. (Miaoran Li): investigation, validation, writing—original draft preparation, and formal analysis. J.L. and X.L.: supervision and writing—review and editing. W.C.: supervision and writing—review and editing. Z.L. and L.Z.: validation and writing—review and editing. M.L. (Mengzhen Li) and C.B.L.: writing—review and editing. All authors have read and agreed to the published version of the manuscript.
Funding
This research project is supported by the National Natural Science Foundation of China (52201334).
Institutional Review Board Statement
Not applicable.
Informed Consent Statement
Not applicable.
Data Availability Statement
The authors declare that the data presented in this study are available upon request.
Conflicts of Interest
The authors declare no conflicts of interest.
References
- Yu, Z.L.; Xue, P.; Chen, Z. Nested tube system applicable to protective structures against blast shock. Int. J. Shock. Eng. 2017, 102, 129–139. [Google Scholar]
- Guo, J.; Zhao, X.; Zhang, Y.; Ji, C.; Taranukha, N.A. A simplified boundary condition method for conducting shock resistance analyses of ship piping systems. Int. J. Press. Vessel. Pip. 2020, 180, 104041. [Google Scholar] [CrossRef]
- Alshahrani, R.F.; Merah, N.; Khan, S.M.A.; Al-Nassar, Y. On the shock-induced damage in glass fiber reinforced epoxy pipes. Int. J. Shock Eng. 2016, 97, 57–65. [Google Scholar]
- Okeil, A.M.; Tung, C.C. Effects of ductility on seismic response of piping systems and their implication on design and qualification. Nucl. Eng. Des. 1996, 166, 69–83. [Google Scholar] [CrossRef]
- Zhu, L.; Liu, Q.Y.; Jones, N.; Chen, M.S. Experimental study on the deformation of fully clamped pipes under horizontal shock. Int. J. Shock. Eng. 2018, 111, 94–105. [Google Scholar]
- Wang, Y.; Qian, X.D.; Liew, J.Y.R.; Zhang, M.H. Experimental behavior of cement filled pipe-in-pipe composite structures under transverse shock. Int. J. Shock Eng. 2014, 72, 1–16. [Google Scholar]
- Kristoffersen, M.; Casadei, F.; Børvik, T.; Langseth, M.; Hopperstad, O.S. Shock against empty and water-filled X65 steel pipes—Experiments and simulations. Int. J. Shock Eng. 2014, 71, 73–88. [Google Scholar]
- Semke, W.H.; Bibel, G.D.; Jerath, S.; Gurav, S.B.; Webster, A.L. Efficient dynamic structural response modelling of bolted flange piping systems. Int. J. Press. Vessel. Pip. 2006, 83, 767–776. [Google Scholar] [CrossRef]
- Wang, H.L.; Ding, H. Vibration reduction of floating raft system based on nonlinear energy sinks. Ocean. Eng. 2023, 288, 116211. [Google Scholar] [CrossRef]
- Qu, Y.D.; Wu, J.D.; Xu, B.Y.; Li, Q.Y. Evaluating the shape and orientation effect of non-spherical charge on the pressure distribution of underwater explosion: Finite element analysis. Ocean. Eng. 2022, 266, 113209. [Google Scholar] [CrossRef]
- Wang, P.R.; Shi, D.Y.; Cui, X.W.; Ma, C.L.; Su, B.; Li, G.L. Study on bubble pulsation process of underwater explosion between parallel plates with various distances. Ocean. Eng. 2023, 278, 114512. [Google Scholar] [CrossRef]
- Ma, T.; Wang, J.X.; Liu, L.T.; Li, H.; Tang, K.; Lin, S.J.; Gu, Y.C. Study on directional enhancement effect of underwater explosion for cylindrical explosive with large length-to-diameter ratio and structural response of nearby water-back plate. Ocean. Eng. 2022, 266, 112614. [Google Scholar] [CrossRef]
- Gannon, L. Simulation of underwater explosions in close-proximity to a submerged cylinder and a free-surface or rigid boundary. J. Fluids Struct. 2019, 87, 189–205. [Google Scholar] [CrossRef]
- Zhang, Z.H.; Wang, Y.X.; Zhao, H.F.; Qian, H.F.; Mou, J.L. An experimental study on the dynamic response of a hull girder subjected to near field underwater explosion. Mar. Struct. 2015, 44, 43–60. [Google Scholar] [CrossRef]
- Wang, G.H.; Zhang, S.R.; Yu, M.; Li, H.B.; Kong, Y. Investigation of the shock wave propagation characteristics and cavitation effects of underwater explosion near boundaries. Appl. Ocean Res. 2014, 46, 40–53. [Google Scholar] [CrossRef]
- Brett, J.M.; Krelle, A. A study of bubble collapse pressure pulse waves from small scale underwater explosions near the water surface. J. Sound Vib. 2018, 435, 91–103. [Google Scholar] [CrossRef]
- Zhang, A.M.; Zhou, W.X.; Wang, S.P.; Feng, L.H. Dynamic response of the non-contact underwater explosions on naval equipment. Mar. Struct. 2011, 24, 396–411. [Google Scholar]
- Gao, Y.; Wang, S.S.; Zhang, J.X.; Jia, X.Y.; Sheng, Z.X. Influence of water depth on the peak overpressure and energy of the secondary pressure wave of underwater explosions. Ocean. Eng. 2024, 293, 116580. [Google Scholar] [CrossRef]
- GJB1060.1-91; Ship Environmental Conditions Requirements-Mechanical Environment. National Defense Science and Technology Commission: Beijing, China, 1991.
- BV0430/85; Code for Ship Construction-Shock Safety. FRG Ministry of Defense Equipment Technology and Procurement: Koblenz, Germany, 1985.
- Jin, H.; Gao, X.; Xi, H.W. Design and shock environment analysis of medium floating shock platform. Mod. Appl. Phys. 2019, 10, 66–71. [Google Scholar]
- Wang, J.; Yao, X.L.; Yang, D. Shock analysis of shock environment from floating shock platform equipment response. Explos. Shock Waves 2015, 35, 236–242. [Google Scholar]
- Yao, X.L.; Zhao, K.; Shi, D.Y. Study on the effectiveness of shock factor in underwater explosion model test. Int. J. Shock. Eng. 2014, 185, 104839. [Google Scholar]
- Mannacio, F.; Barbato, A.; Marzo, F.D.; Gaiotti, M.; Rizzo, C.M.; Venturini, M. Shock effects of underwater explosion on naval ship foundations: Validation of numerical models by dedicated tests. Ocean. Eng. 2022, 253, 111290. [Google Scholar] [CrossRef]


Disclaimer/Publisher’s Note: The statements, opinions and data contained in all publications are solely those of the individual author(s) and contributor(s) and not of MDPI and/or the editor(s). MDPI and/or the editor(s) disclaim responsibility for any injury to people or property resulting from any ideas, methods, instructions or products referred to in the content. |
© 2024 by the authors. Licensee MDPI, Basel, Switzerland. This article is an open access article distributed under the terms and conditions of the Creative Commons Attribution (CC BY) license (https://creativecommons.org/licenses/by/4.0/).