Article

Study on the Deformation Mode and Energy Absorption Characteristics of Protective Honeycomb Sandwich Structures Based on the Combined Design of Lotus Root Nodes and Leaf Stem Veins

1
Key Laboratory of High Performance Ship Technology (Wuhan University of Technology), Ministry of Education, Wuhan 430063, China
2
School of Naval Architecture, Ocean and Energy Power Engineering, Wuhan University of Technology, Wuhan 430063, China
3
China Ship Development and Design Center, Wuhan 430064, China
4
National Key Laboratory on Ship Vibration and Noise, Wuhan 430033, China
*
Author to whom correspondence should be addressed.
J. Mar. Sci. Eng. 2024, 12(4), 652; https://doi.org/10.3390/jmse12040652
Submission received: 17 March 2024 / Revised: 11 April 2024 / Accepted: 12 April 2024 / Published: 14 April 2024

Abstract

:
Sandwich structures are often used as protective structures on ships. To further improve the energy-absorbing characteristics of traditional honeycomb sandwich structures, an energy-absorbing mechanism is proposed based on the gradient folding deformation of lotus root nodes and a leafy stem vein homogenizing load mechanism. A honeycomb sandwich structure is then designed that combines lotus root nodes and leafy stem veins. Four types of peak-nest structures, traditional cellular structure (TCS), lotus root honeycomb structure (LRHS), leaf vein honeycomb structure (LVHS), and lotus root vein combined honeycomb structure (LRVHS), were prepared using 3D printing technology. The deformation modes and energy absorption characteristics of the four honeycomb structures under quasistatic action were investigated using a combination of experimental and simulation methods. It was found that the coupling design improved the energy absorption in the structural platform region of the LRHS by 51.4% compared to that of the TCS due to its mechanical mechanism of helical twisting and deformation. The leaf vein design was found to enhance the peak stress of the structure, resulting in a 4.84% increase in the peak stress of the LVHS compared to that of the TCS. The effects of the number, thickness, and position of the leaf vein plates on the honeycomb structure were further explored. The greatest structural SEA effect of 1.28 J/g was observed when the number of leaf vein plates was four. The highest SEA of 1.36 J/g was achieved with a leaf vein plate thickness of 0.6 mm, representing a 7.3% improvement compared to that of the 0.2 mm thickness. These findings may provide valuable insights into the design of lightweight honeycomb sandwich structures with high specific energy absorption.

1. Introduction

Ships in normal operation are threatened by a variety of explosive impacts, waves, and other impact loads. The excellent performance of the new anti-explosion and anti-impact structure is important for improving ship vitality. Porous structures [1,2,3] with high specific strength [4] and high energy absorption properties [5] are widely used in the design of engineering structures such as aerospace materials, vehicles, ships, and oceans. Given the limitations of single lattices [6,7,8,9,10,11] or honeycomb structures [12] in engineering applications, they are often combined with metal or composite sheets to serve as core layers in multilayer sandwich structures [13,14,15]. Scholars are increasingly focusing on advanced multilayer sandwich structures to capitalize on their protective capabilities and enhanced energy absorption to make ships more blast- and impact-resistant.
The energy-absorbing properties of honeycomb sandwich structures are influenced primarily by the configuration and materials of the core layer. The core layers can be categorized into honeycomb structures [16], composite corrugated structures [17], and cellular geometries [18], and the materials used are mainly aluminum alloys [19] and EPS foam materials [20]. Despite their advantages, both lattice-structure core layers and honeycomb-structure core layers have drawbacks. Lattice structures are susceptible to crushing effects under load [21,22,23], leading to limited energy absorption properties. Similarly, special structures, such as stiffened panels in the hull of a ship, are subjected to bending and deformation when the structure is subjected to load. Since stiffened panels are prone to over-bending under sustained forces, resulting in a loss of load-carrying capacity, only a small amount of energy is absorbed by the deformation of the stiffened panels therein during the loading process [24]. On the other hand, while honeycomb sandwich structures exhibit efficient energy absorption [25], they are prone to significant deformation under loading, resulting in reduced load-carrying capacity. In recent years, scholars inspired by biological structures have been working on improving the load-bearing role and increasing the energy absorption capacity of structures [26,27,28,29,30,31,32,33,34,35,36]. Novel structural designs incorporating biomimetic inspirations are being proposed. Sun et al. [37] designed a structure using leaf veins and performed quasistatic compression. They found that the structural load-bearing effect and energy absorption improved significantly. Xu [38], Zhang [39], and others designed honeycomb structures based on bionic ideas and found that the capacity for absorption by honeycomb structures was significant. Ganesh et al. [40] were inspired by Nautilus to use 3D printing of tubular lattice structures and found that the lattice structures are lightweight and have high load-carrying capacity. Zhang et al. [41] were inspired by the structure of grapefruit peel to design a layered honeycomb and found that the specific energy absorption and platform stress of the layered honeycomb were 1.5 and 2.5 times greater than those of the conventional honeycomb. Xu et al. [42] were inspired by the lotus root structure and found that the lotus root structure has better energy absorption and crashworthiness than a square tube structure.
While scholars have researched to enhance the design of honeycomb sandwich structures, the core layer configurations of existing structures are mostly limited to a single grid configuration or honeycomb configuration. Shi et al. [43] proposed a grid-hexagonal honeycomb sandwich structure, which improves the energy absorption of the overall sandwich structure by filling the grid structure, and the load bearing is increased by 28% compared to that of the orthogonal grid structure. Shi et al. [44] proposed an S-shaped hexagonal honeycomb sandwich structure, where the filling of S-shaped structures inside the honeycomb led to an increase in the energy absorption of the sandwich structure. When the number of S-reinforcement structures was adjusted to 20, the specific energy absorption increased by 8.41% compared with that of the normal aluminum honeycomb sandwich structure. Fan et al. [45] designed square-shaped structures, which greatly improved energy absorption and enhanced the structural strength by a factor of 2.27–2.6 compared to those of natural honeycomb structures. Indeed, in leaf structures, the leaf stem vein structure can exert a mechanical mechanism that homogenizes the load pressure. With its porous internal structure and gradient internal diameter, the lotus root can exert its unique mechanical mechanism of gradient folding and deformation when subjected to loads, resulting in a superior energy absorption capacity. The results are based on the research of previous scholars [43,44,45]. The goal of this work was to further improve the energy-absorbing capacity of traditional honeycomb sandwich structures. A honeycomb sandwich structure designed by combining lotus root nodes and leaf stem veins was proposed. Its energy-absorbing characteristics, inspired by leaf stem vein and lotus root node structures, were investigated.
To study the energy absorption characteristics of honeycomb sandwich structures incorporating lotus root vein combinations, four types of specimens (traditional honeycomb sandwich structure, lotus root honeycomb sandwich structure, leaf vein honeycomb sandwich structure, and lotus root–leaf vein combination honeycomb sandwich structure specimens) were designed and prepared via 3D printing. Quasistatic compression experiments were carried out on the four specimen configurations, and numerical simulations were conducted to compare and analyze the deformation and energy absorption characteristics of the honeycomb sandwich structures under quasistatic compression. In addition to investigating the coupling effect and leaf vein influence, this paper examines the impact of the position, number, and thickness of leaf vein plates. The main framework of this paper is organized as follows: Section 2 introduces the coupling-vein combination design sandwich structure. The results of the experimental study on the quasistatic compression of four honeycomb sandwich structures are presented in Section 3. Numerical simulation studies are described in Section 4. Section 5 discusses the coupling effect, the leaf vein effect, and the influence of the leaf vein plate position, number, thickness, and peak force on energy absorption. The main conclusions are summarized in Section 6.

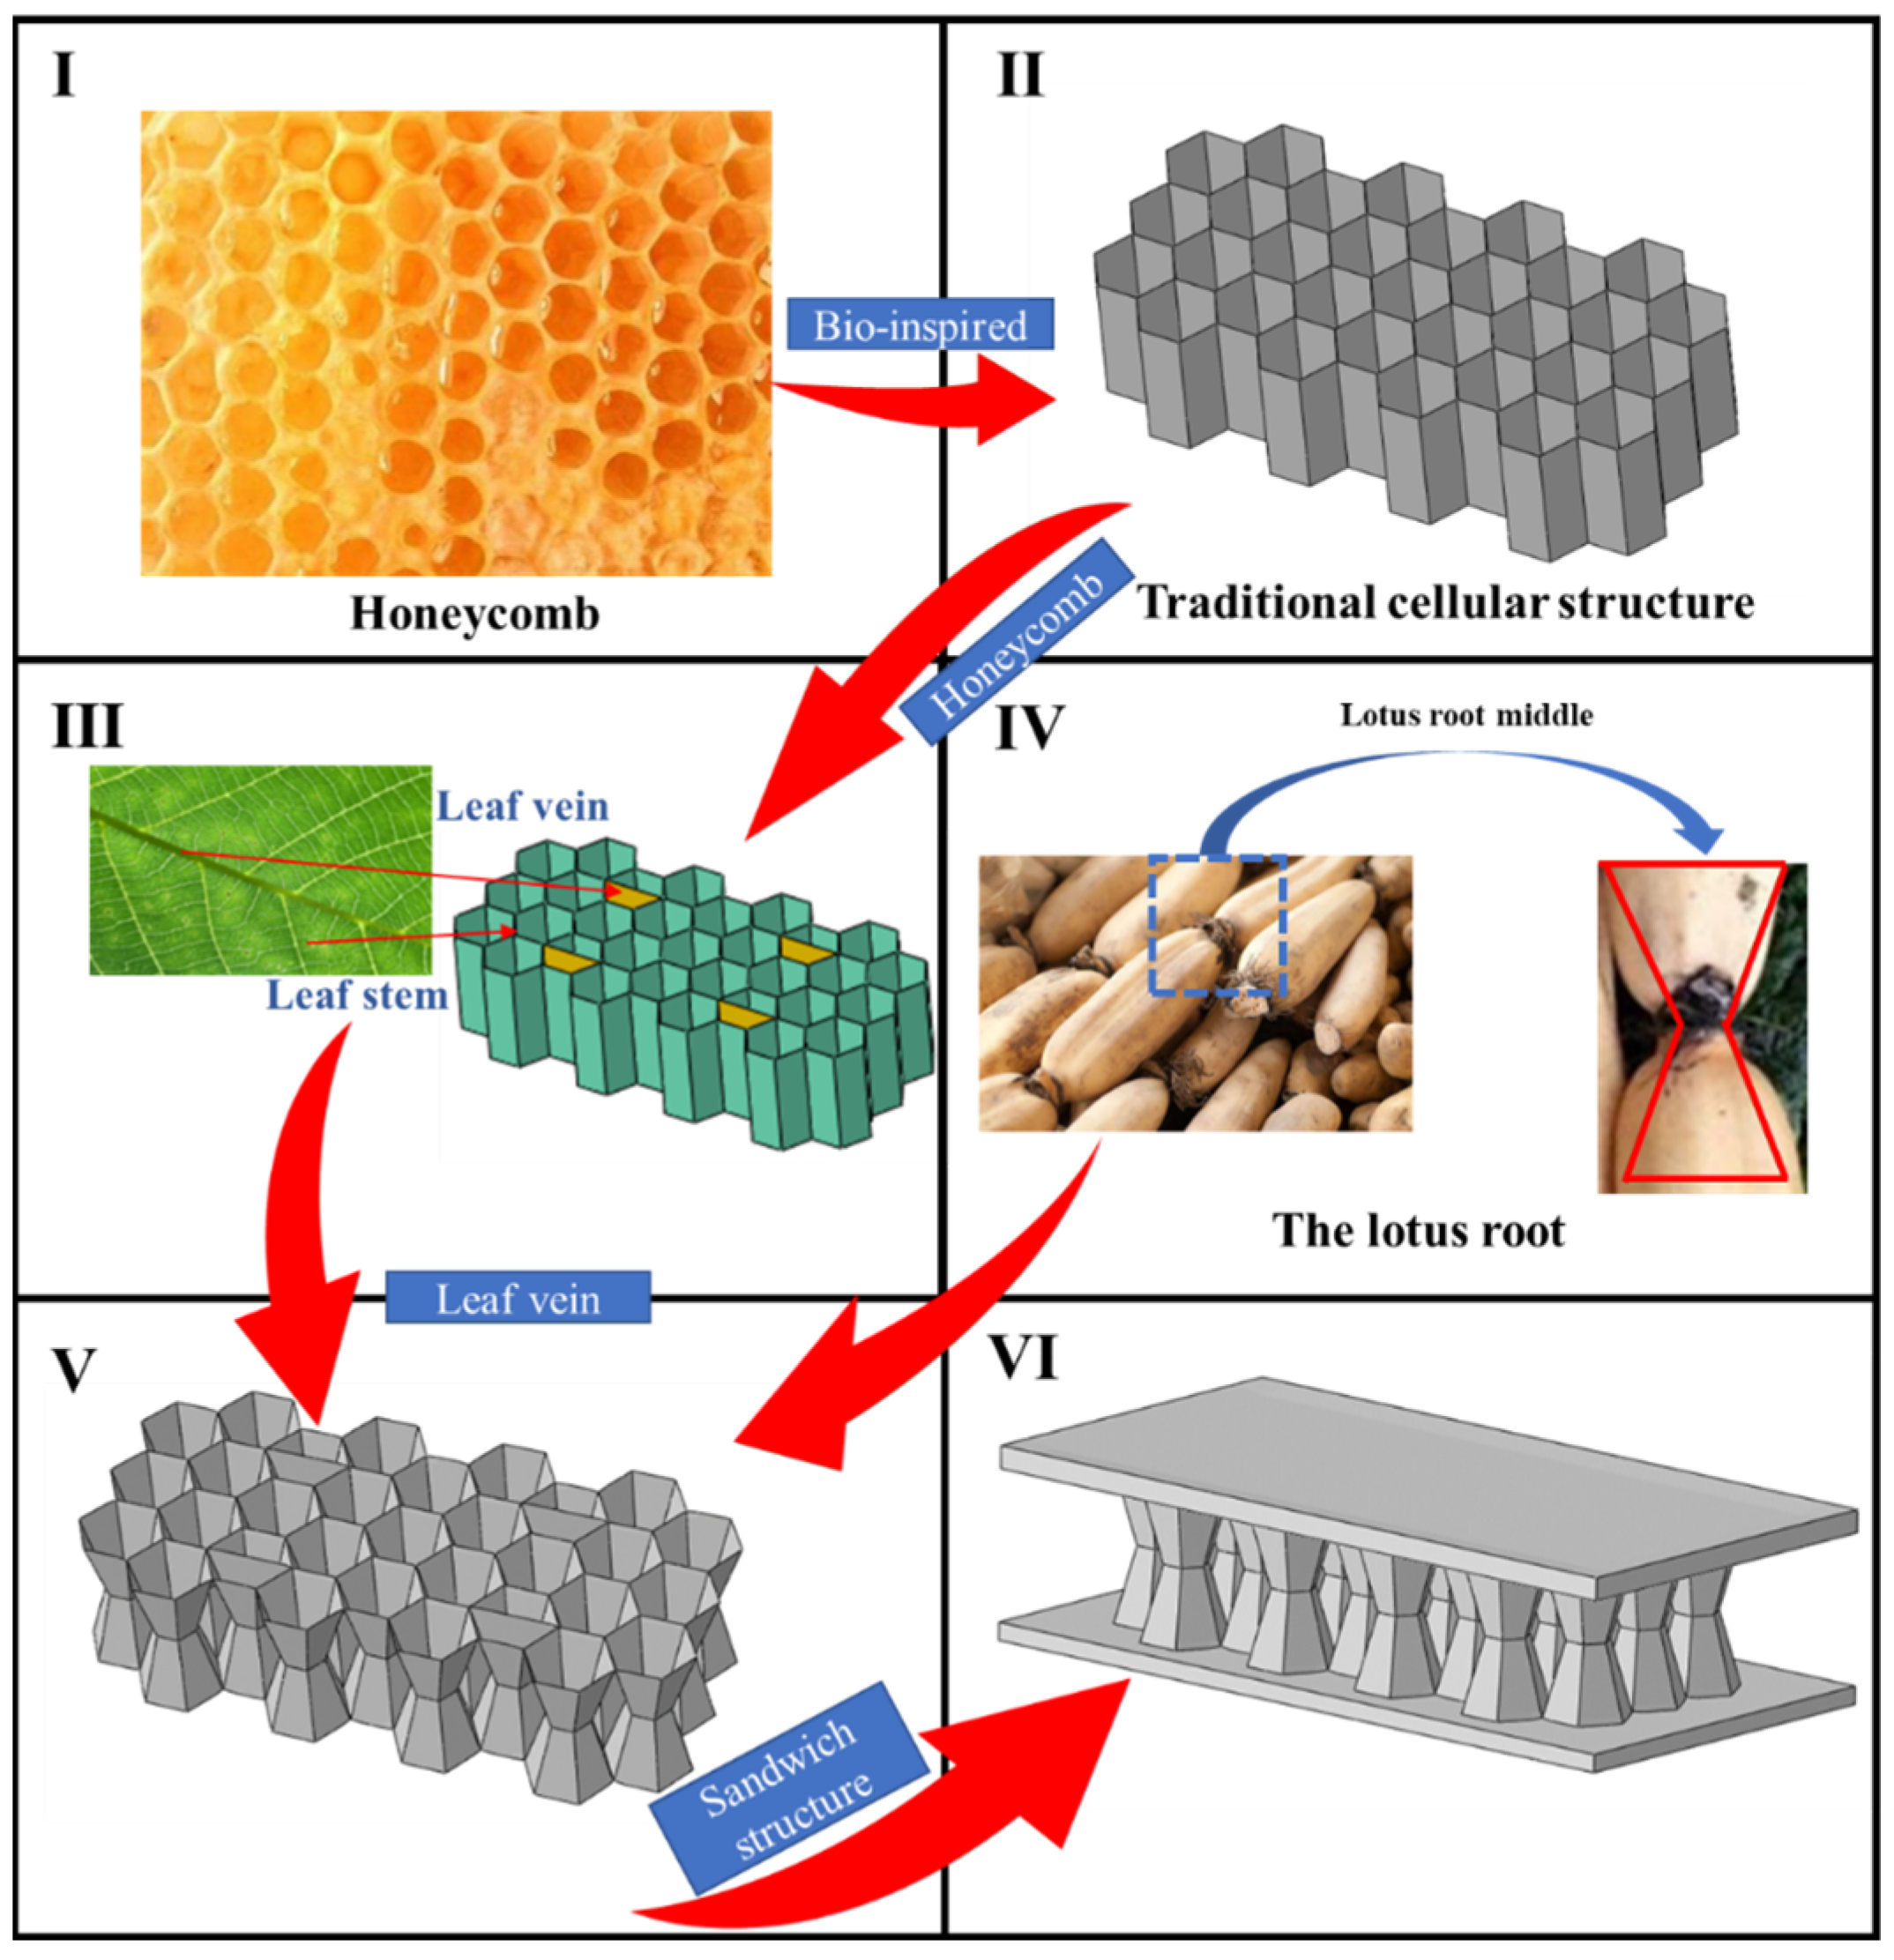
2. Bionic Structural Design

The concept of a honeycomb sandwich structure based on the combined design of lotus root nodes and leaf stem veins is illustrated as follows: The honeycomb structure is shown in Figure 1I, and the conventional honeycomb structure is derived from the actual honeycomb structure, as shown in Figure 1II. A honeycomb structure designed with leaf veins is shown in Figure 1III, taking into account the load homogenization role of leaf stem veins. Lotus roots are shown in Figure 1IV, and based on the mechanical mechanism by which lotus root nodes undergo gradient folding deformation and energy absorption in nature, a combined lotus root node–leaf vein honeycomb structure is proposed, as shown in Figure 1V. The honeycomb structure is combined with the upper and lower panels to form a new honeycomb sandwich structure featuring a combined lotus root-vein design, as shown in Figure 1VI.

3. Honeycomb Compression Experiment

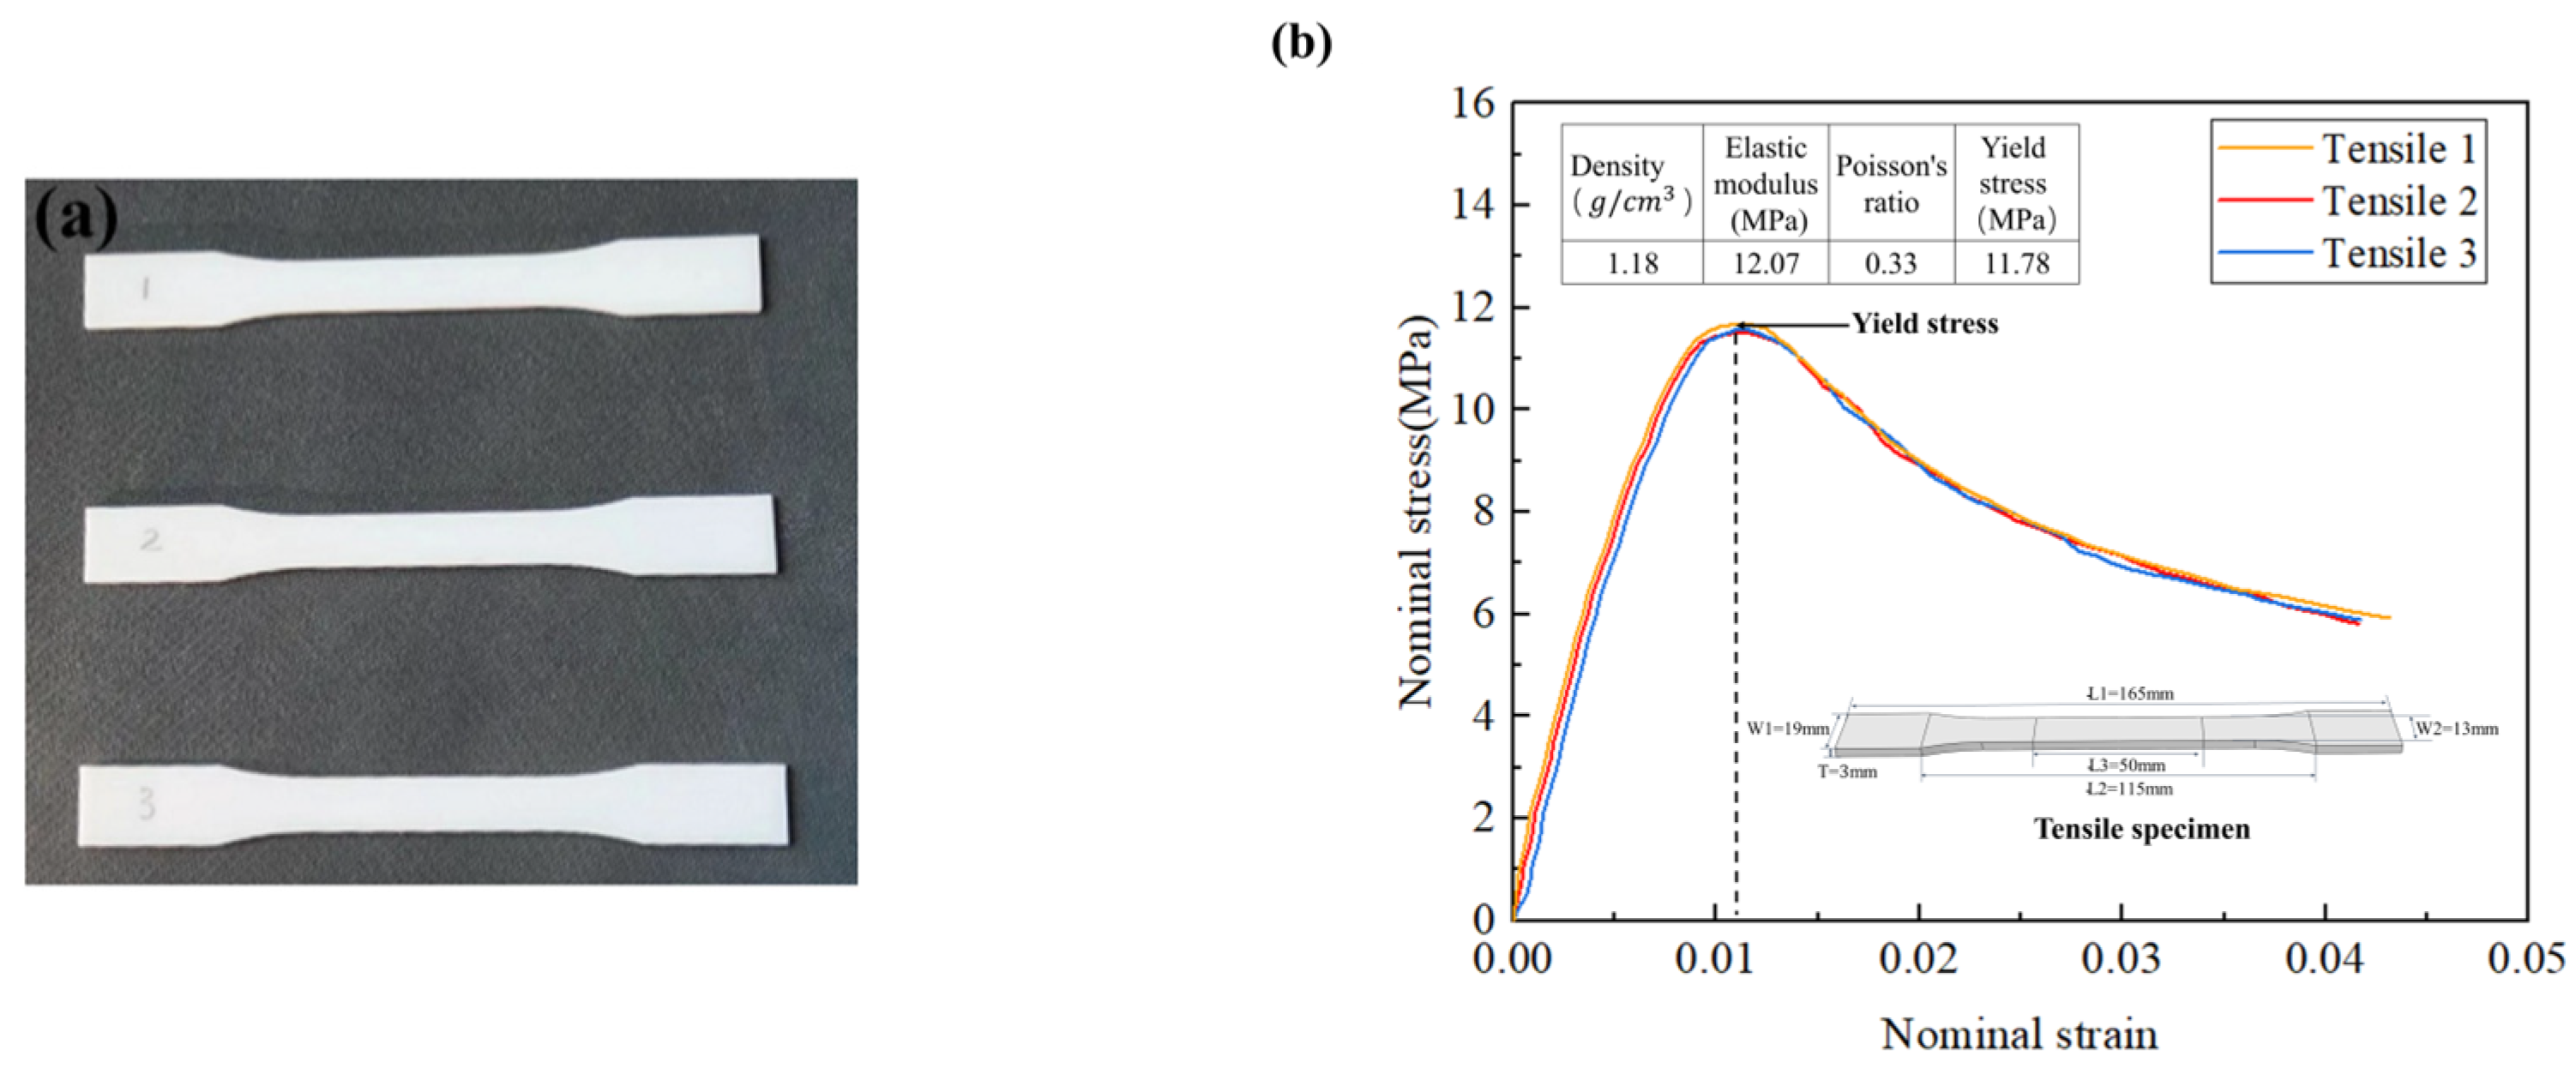
3.1. Material Properties and Specimen Preparation

ABS resin (acrylonitrile butadiene styrene) was selected for 3D printing of honeycomb sandwich structures due to its moderate cost, high strength, good toughness, and ease of processing. Three tensile specimens were prepared using 3D printing technology, as shown in Figure 2a. The dimensional variations in the specimens created during their fabrication are shown in Table 1. To determine the mechanical properties of the ABS resin materials, standard tensile specimens were printed following the ASTM D638 standard [46], and three specimens were subjected to tensile loading for the measurement of mechanical properties using a WDW-100 electronic universal experimental machine with a loading rate of 2 mm/min. The experimental results are shown in Figure 2b. The modulus of elasticity of ABS is 12.07 MPa, the yield strain is 0.012, and the stress magnitude is 11.78 MPa. To investigate the performance of honeycomb sandwich structures with a coupling-leaf vein combination design under quasistatic compression, as shown in Figure 3, four honeycomb structure specimens were designed and prepared for this paper. The compression experiments on the four honeycomb structures were carried out at a constant speed of 2 mm/min. The traditional cellular structure, lotus root honeycomb structure, leaf vein honeycomb structure, and lotus root vein combined honeycomb structure are abbreviated as TCS, LRHS, LVHS, and LRVHS, respectively. The overall dimensions of the four honeycomb structures are 84 mm ( L c ) × 41.6 mm ( L B ) × 20 mm ( L Z ), and the thickness of the honeycomb structure ( T C ) was 0.4 mm. The upper and lower panels were 100 mm (L) × 50 mm (B), with a thickness ( T t ) of 3 mm.

3.2. Energy Absorption Index

The energy absorption index is an important index for measuring the mechanical properties of honeycomb structures. This index is usually assessed in terms of platform stress, EA, SEA, and other parameters [47], where the densification strain is usually determined by the energy absorption efficiency η versus the highest point on the strain curve.
d η ( ε ) d ε ε = ε d = 0
where the energy efficiency can be determined by the ratio of the energy absorbed by the multicellular material to the corresponding nominal stress.
η ( ε ) = 0 ε σ ( ε ) d ε σ ( ε )
EA is the absorbed energy, and the specific formula is defined as
E A = 0 δ F ( x ) d x
where F(x) is the instantaneous impact force, x is the instantaneous impact displacement, and δ is the effective displacement during the impact process.
The specific energy absorption (SEA) represents the energy absorbed per unit mass, which is an essential criterion for lightweight design, and the specific formula is defined as follows:
S E A = E A M
where M denotes the mass of the structure.

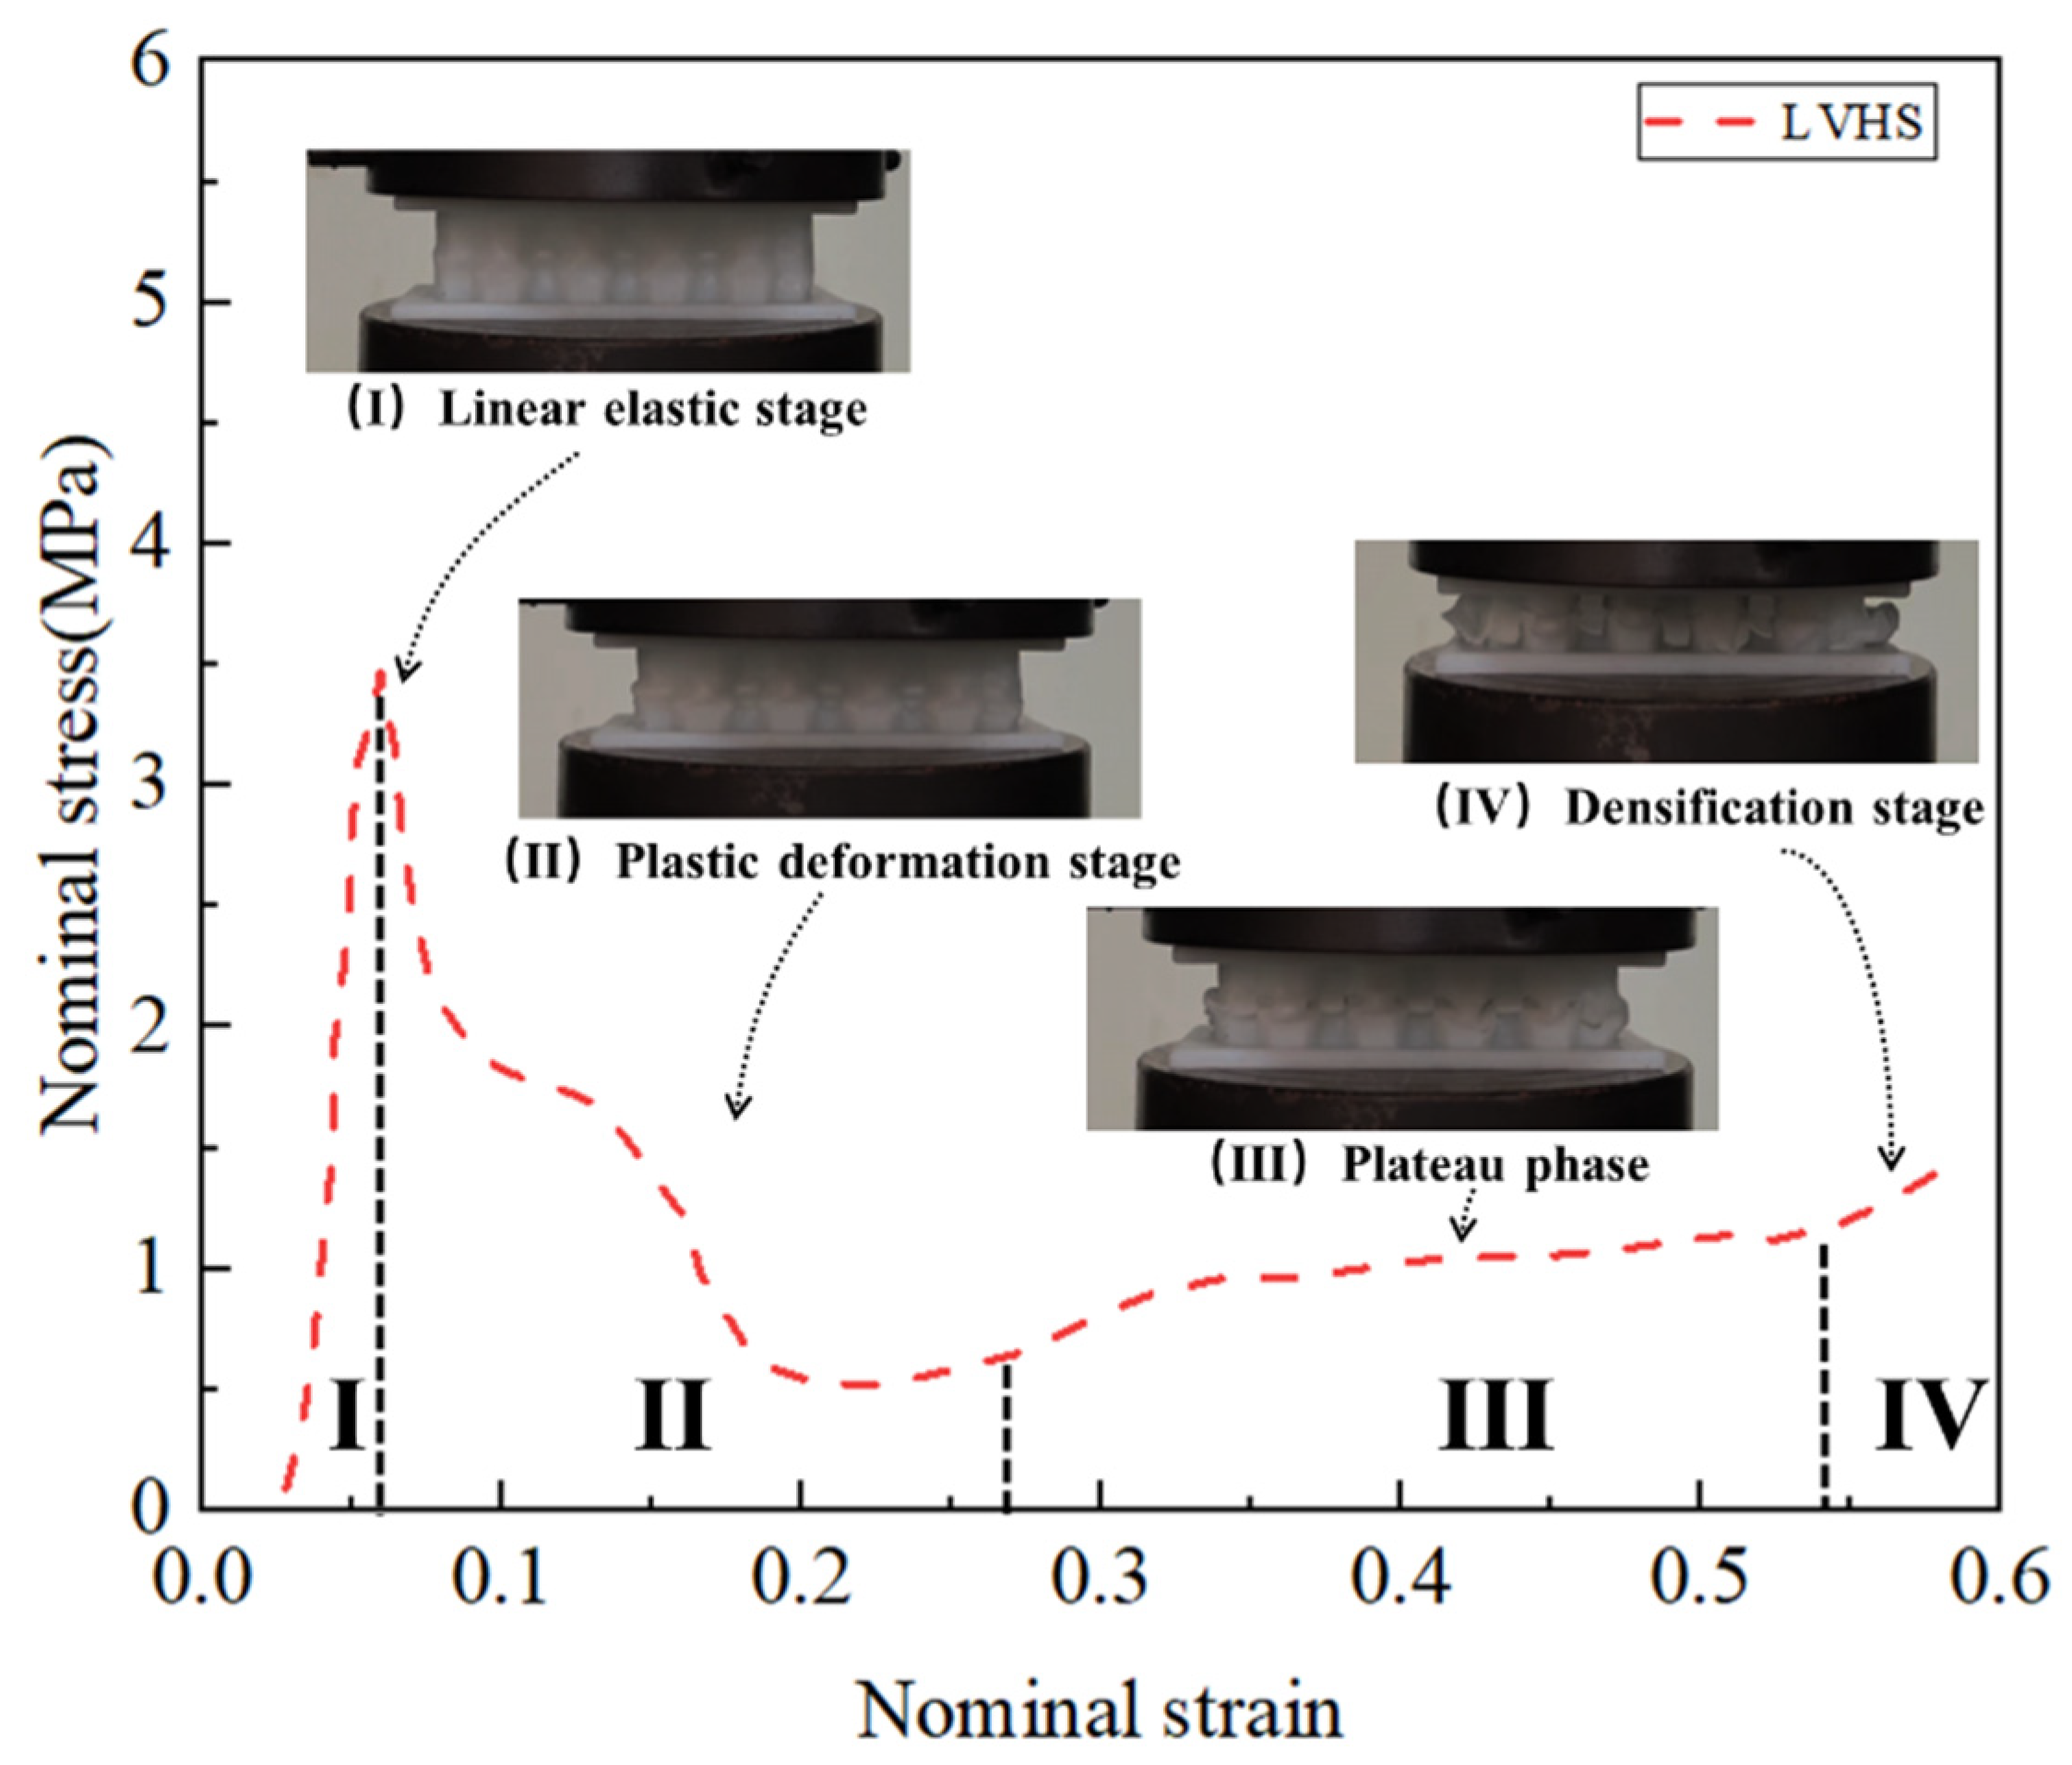
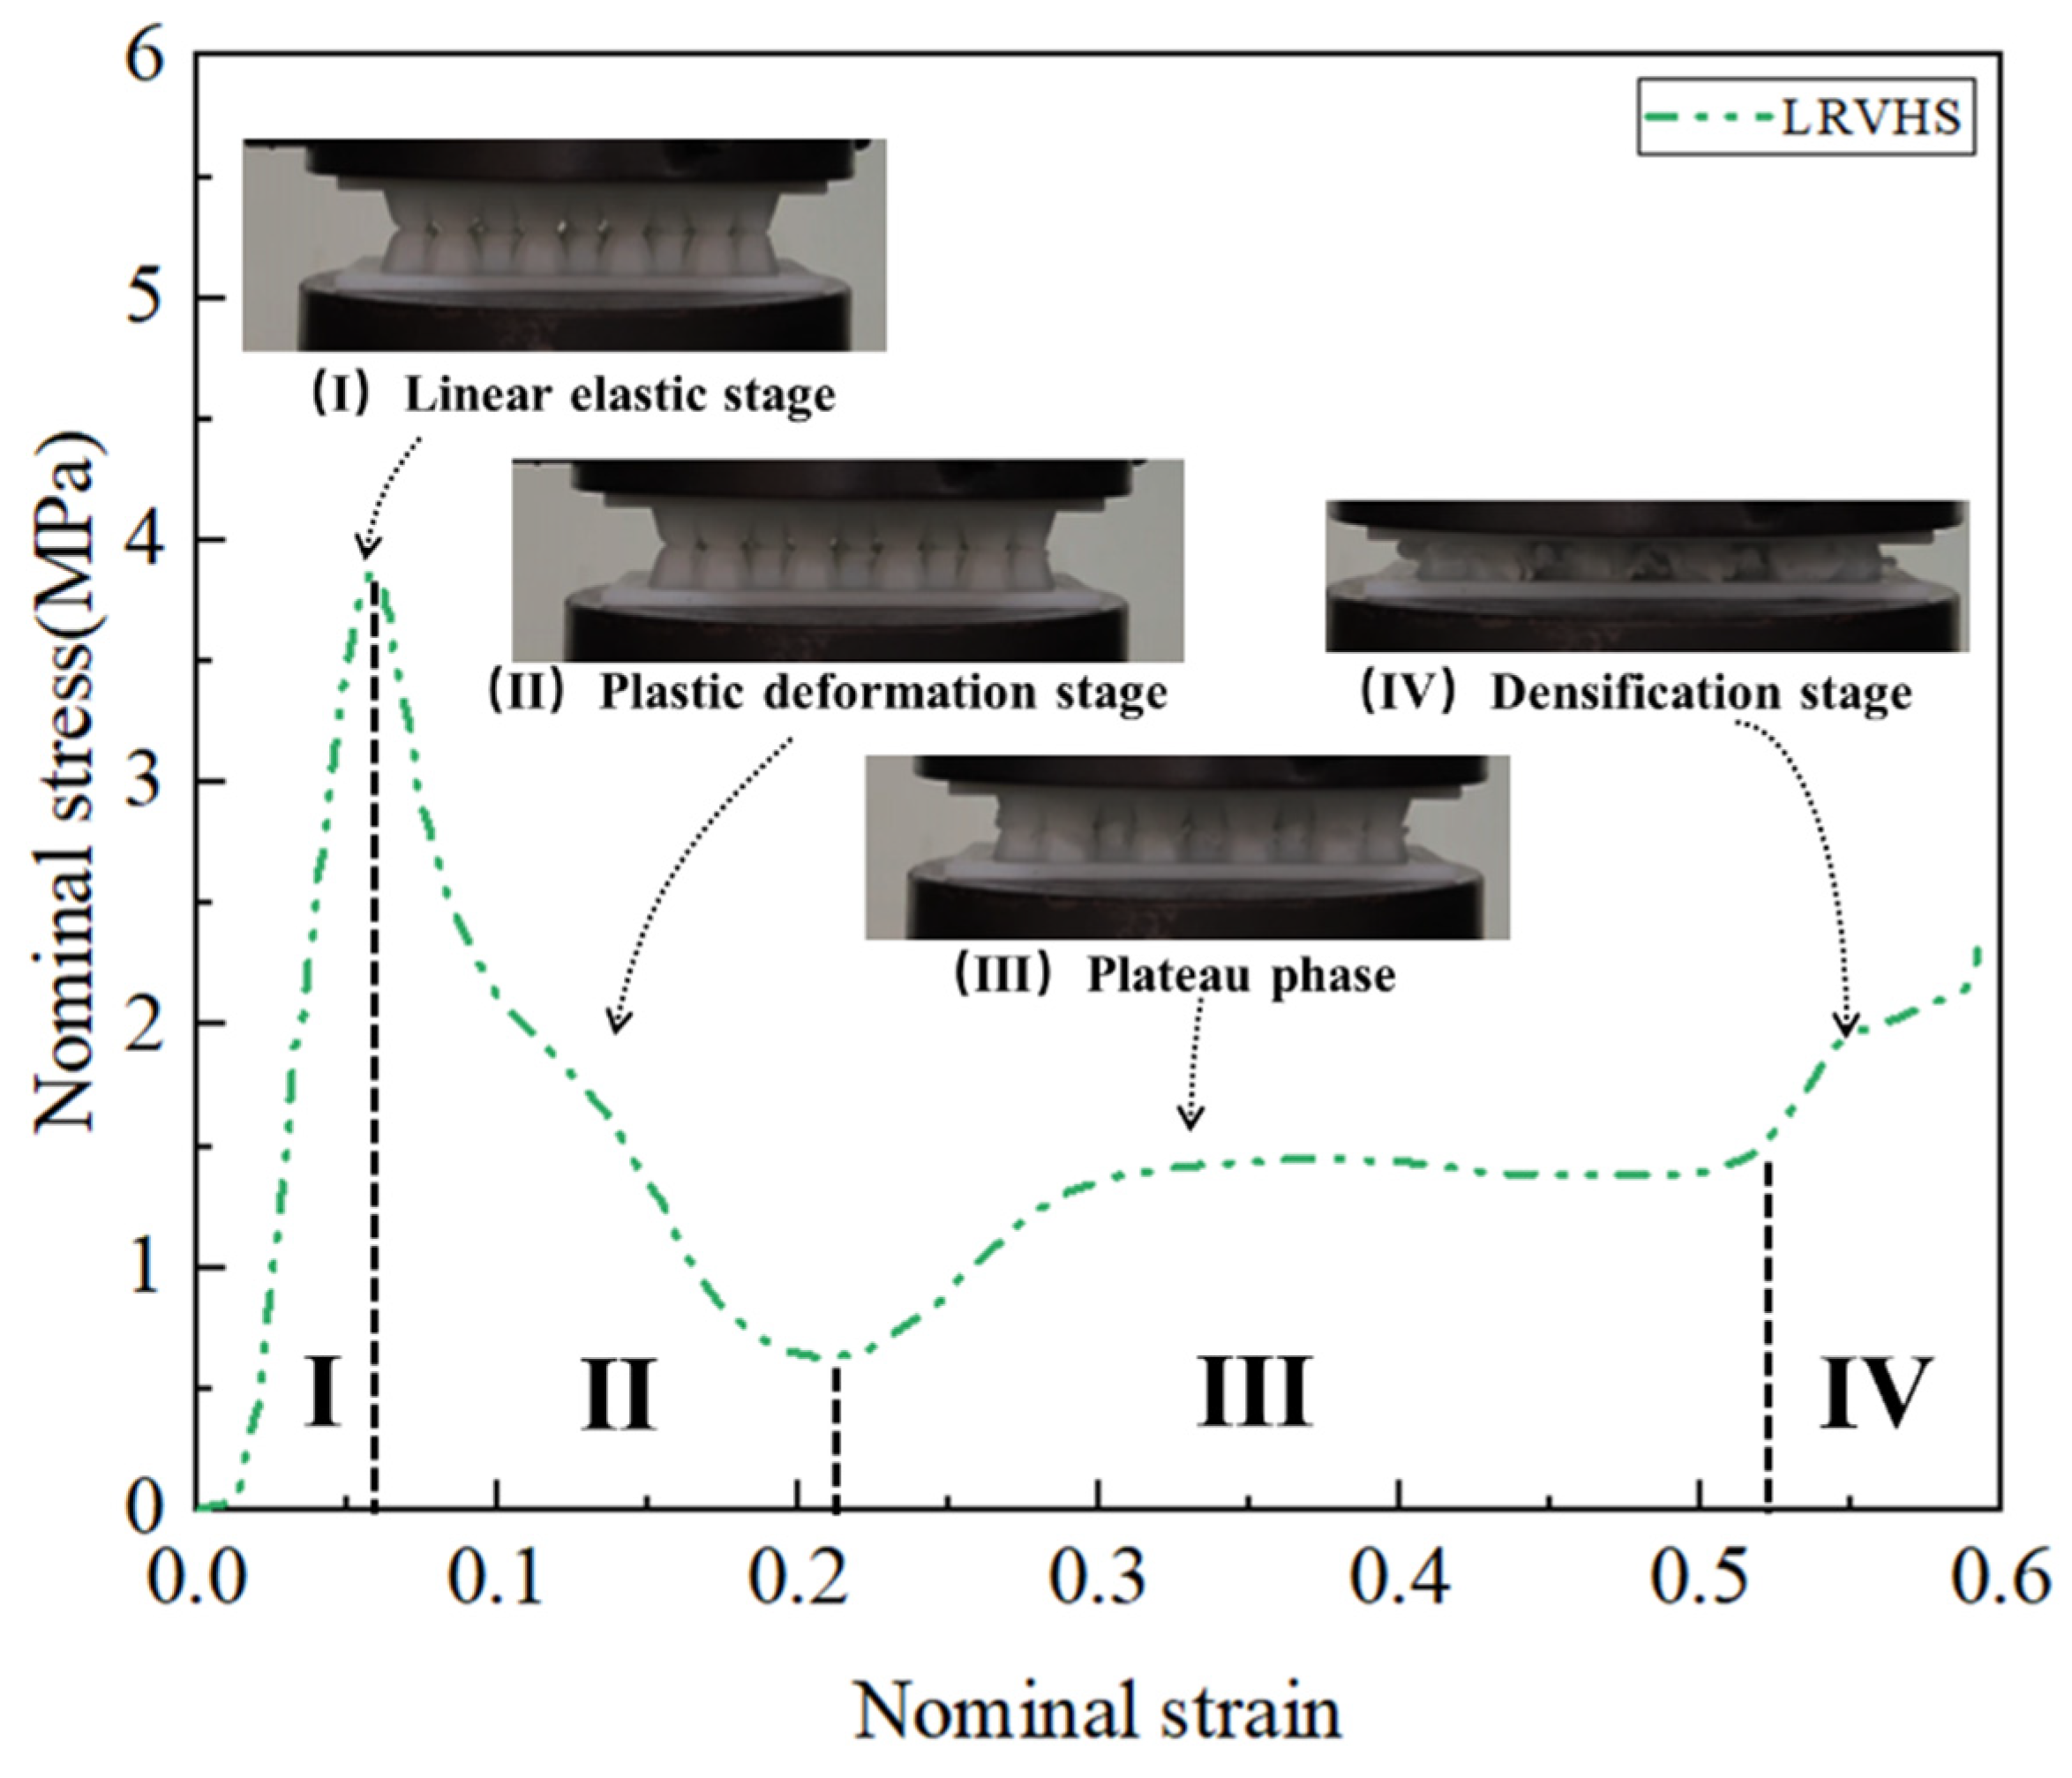
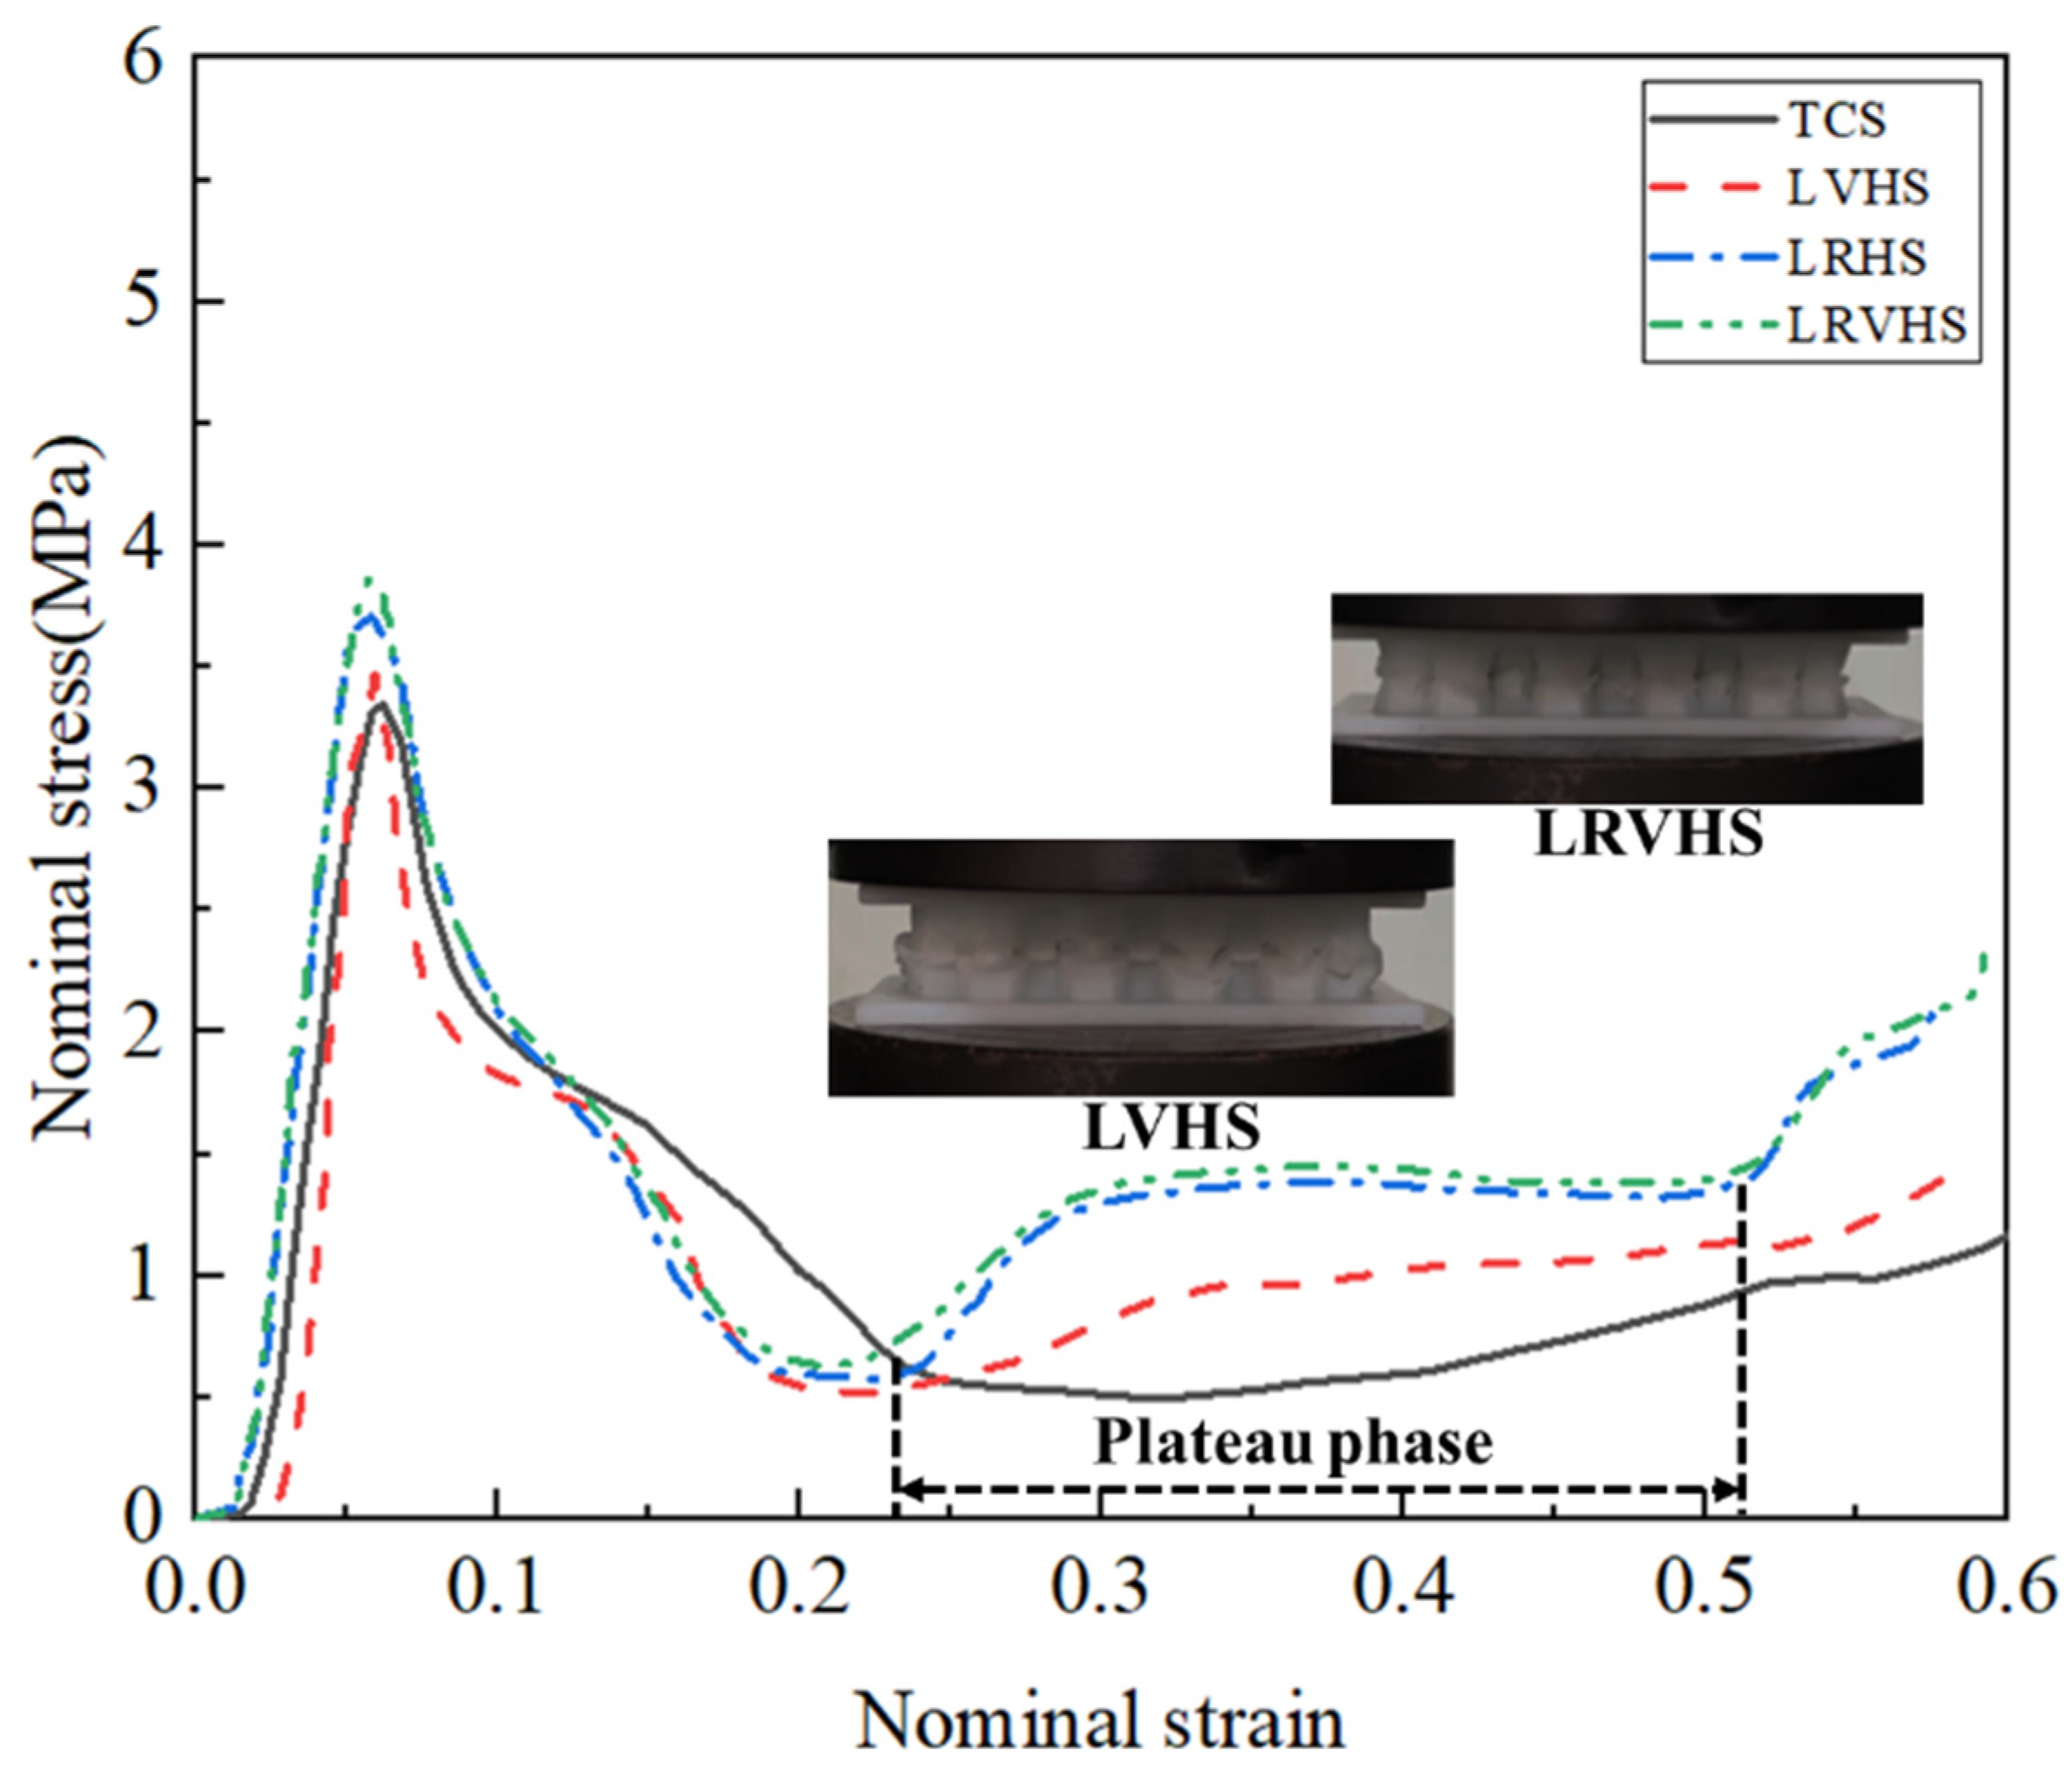
3.3. Experimental Results

Figure 4 illustrates the deformation process of the LVHS and LRVHS specimens under quasistatic compressive loading. In Figure 4a, the LVHS experiences initial destabilization at the bottom at a strain of 0.06. As loading progresses, the bottom of the LVHS continues to compress at a strain of 0.2, as shown in Figure 4b. Figure 4c shows that as the strain reaches 0.4, the LVHS is subjected to continuous loading until the core intermediate structure is completely stacked. Figure 4d shows that the LVHS is excessively deformed at a strain of 0.57. Figure 4e shows that for the LRVHS, the middle section buckles first at a strain of 0.052, resulting in a decrease in structural stability. Figure 4f shows that as the load displacement increases, the upper and lower trapezoidal portions of the LRVHS undergo stacked compression at a strain of 0.14. Figure 4g shows a spiral twist in the middle part of the LRVHS at a strain of 0.34. Figure 4h shows that the LRVHS is excessively deformed at a strain of 0.54. The experimental deformation process reveals distinct patterns for the LVHS and LRVHS under loading. The bottom of the LVHS exhibits buckling and folding, resulting in a loss of overall stability, while the middle portion of the LRVHS buckles, deforms, and develops a spiral twist.
Figure 5, Figure 6 and Figure 7 show the stress–strain curves and deformation processes of four honeycomb sandwich structures under quasistatic compression. The deformation process can be divided into four stages: linear elastic deformation, plastic deformation, platform deformation, and densification. The linear elastic phase of the structure can be determined from the linear elastic deformation of the structure with a linear increase in the stress–strain curve, and the linear elastic phase ends when the increase ends. The structural platform phase can be determined by the inflection point or change in the rate of change in stress. Using the energy absorption efficiency method based on densification strains, the end of the platform phase and the beginning of the densification phase can be determined [48]. For the LVHS, the entire structure underwent linear elastic behavior within the strain range of 0–0.06. The internal stress increases linearly with strain during this phase until the structure reaches the peak stress at a strain of 0.06, at which point the bottom of the structure undergoes flexural deformation. The LRVHS is in the linear elastic phase within the strain range of 0–0.052. Unlike the LVHS, the middle part of the LRVHS deforms within this phase. The peak force of the LRVHS when subjected to quasistatic compression was greater than that of the TCS when the peak stress reached 3.8 MPa, representing a 13.2% increase compared to the TCS stress. Within the strain range of 0.06–0.22, the LVHS enters the plastic deformation stage. The overall deformation of the structure increases so that the stress decreases rapidly, with high energy absorption occurring within this stage. The LRVHS is in the plastic deformation stage at a strain of 0.14, and the change in internal stress during this stage follows a pattern similar to that of the plastic deformation stage of the LVHS. The LVHS experiences the platform stage in the strain range of 0.22–0.54; the overall deformation of the structure increases, the energy absorption is smooth, and the energy absorption effect in this stage is affected by the geometric configuration of the structure. The LRVHS plateaued within a strain range of 0.22–0.52. The upper and lower parts are deformed and compressed against each other due to the lotus node configuration. A larger contact area of the structure results in a significant increase in energy absorption. Unlike the LVHS, the LRVHS undergoes a spiral-twisting phenomenon in the middle part of the platform stage. The LVHS reaches a densification stage after a strain of 0.54, and the structure is excessively deformed.
Figure 8 shows that the SEAs in the TCS and LRHS are 1.02 J/g and 1.23 J/g, respectively. A 3.86% and 4.29% difference were observed in the SEA compared to the LVHS and LRVHS, respectively. Additionally, as shown in Figure 7, the LVHS stress peak was greater than that of TCS, resulting in significantly greater structural energy absorption. The best energy-absorbing structure in Figure 7 was in the LRVHS, with an SEA of 1.28 J/g. The plateau stresses of the LRHS and LRVHS were greater than those of the TCS and LVHS. This can be attributed to the mechanical mechanism of deformation involving helical twisting during the platform phase, as illustrated in Figure 4.

4. Numerical Simulation

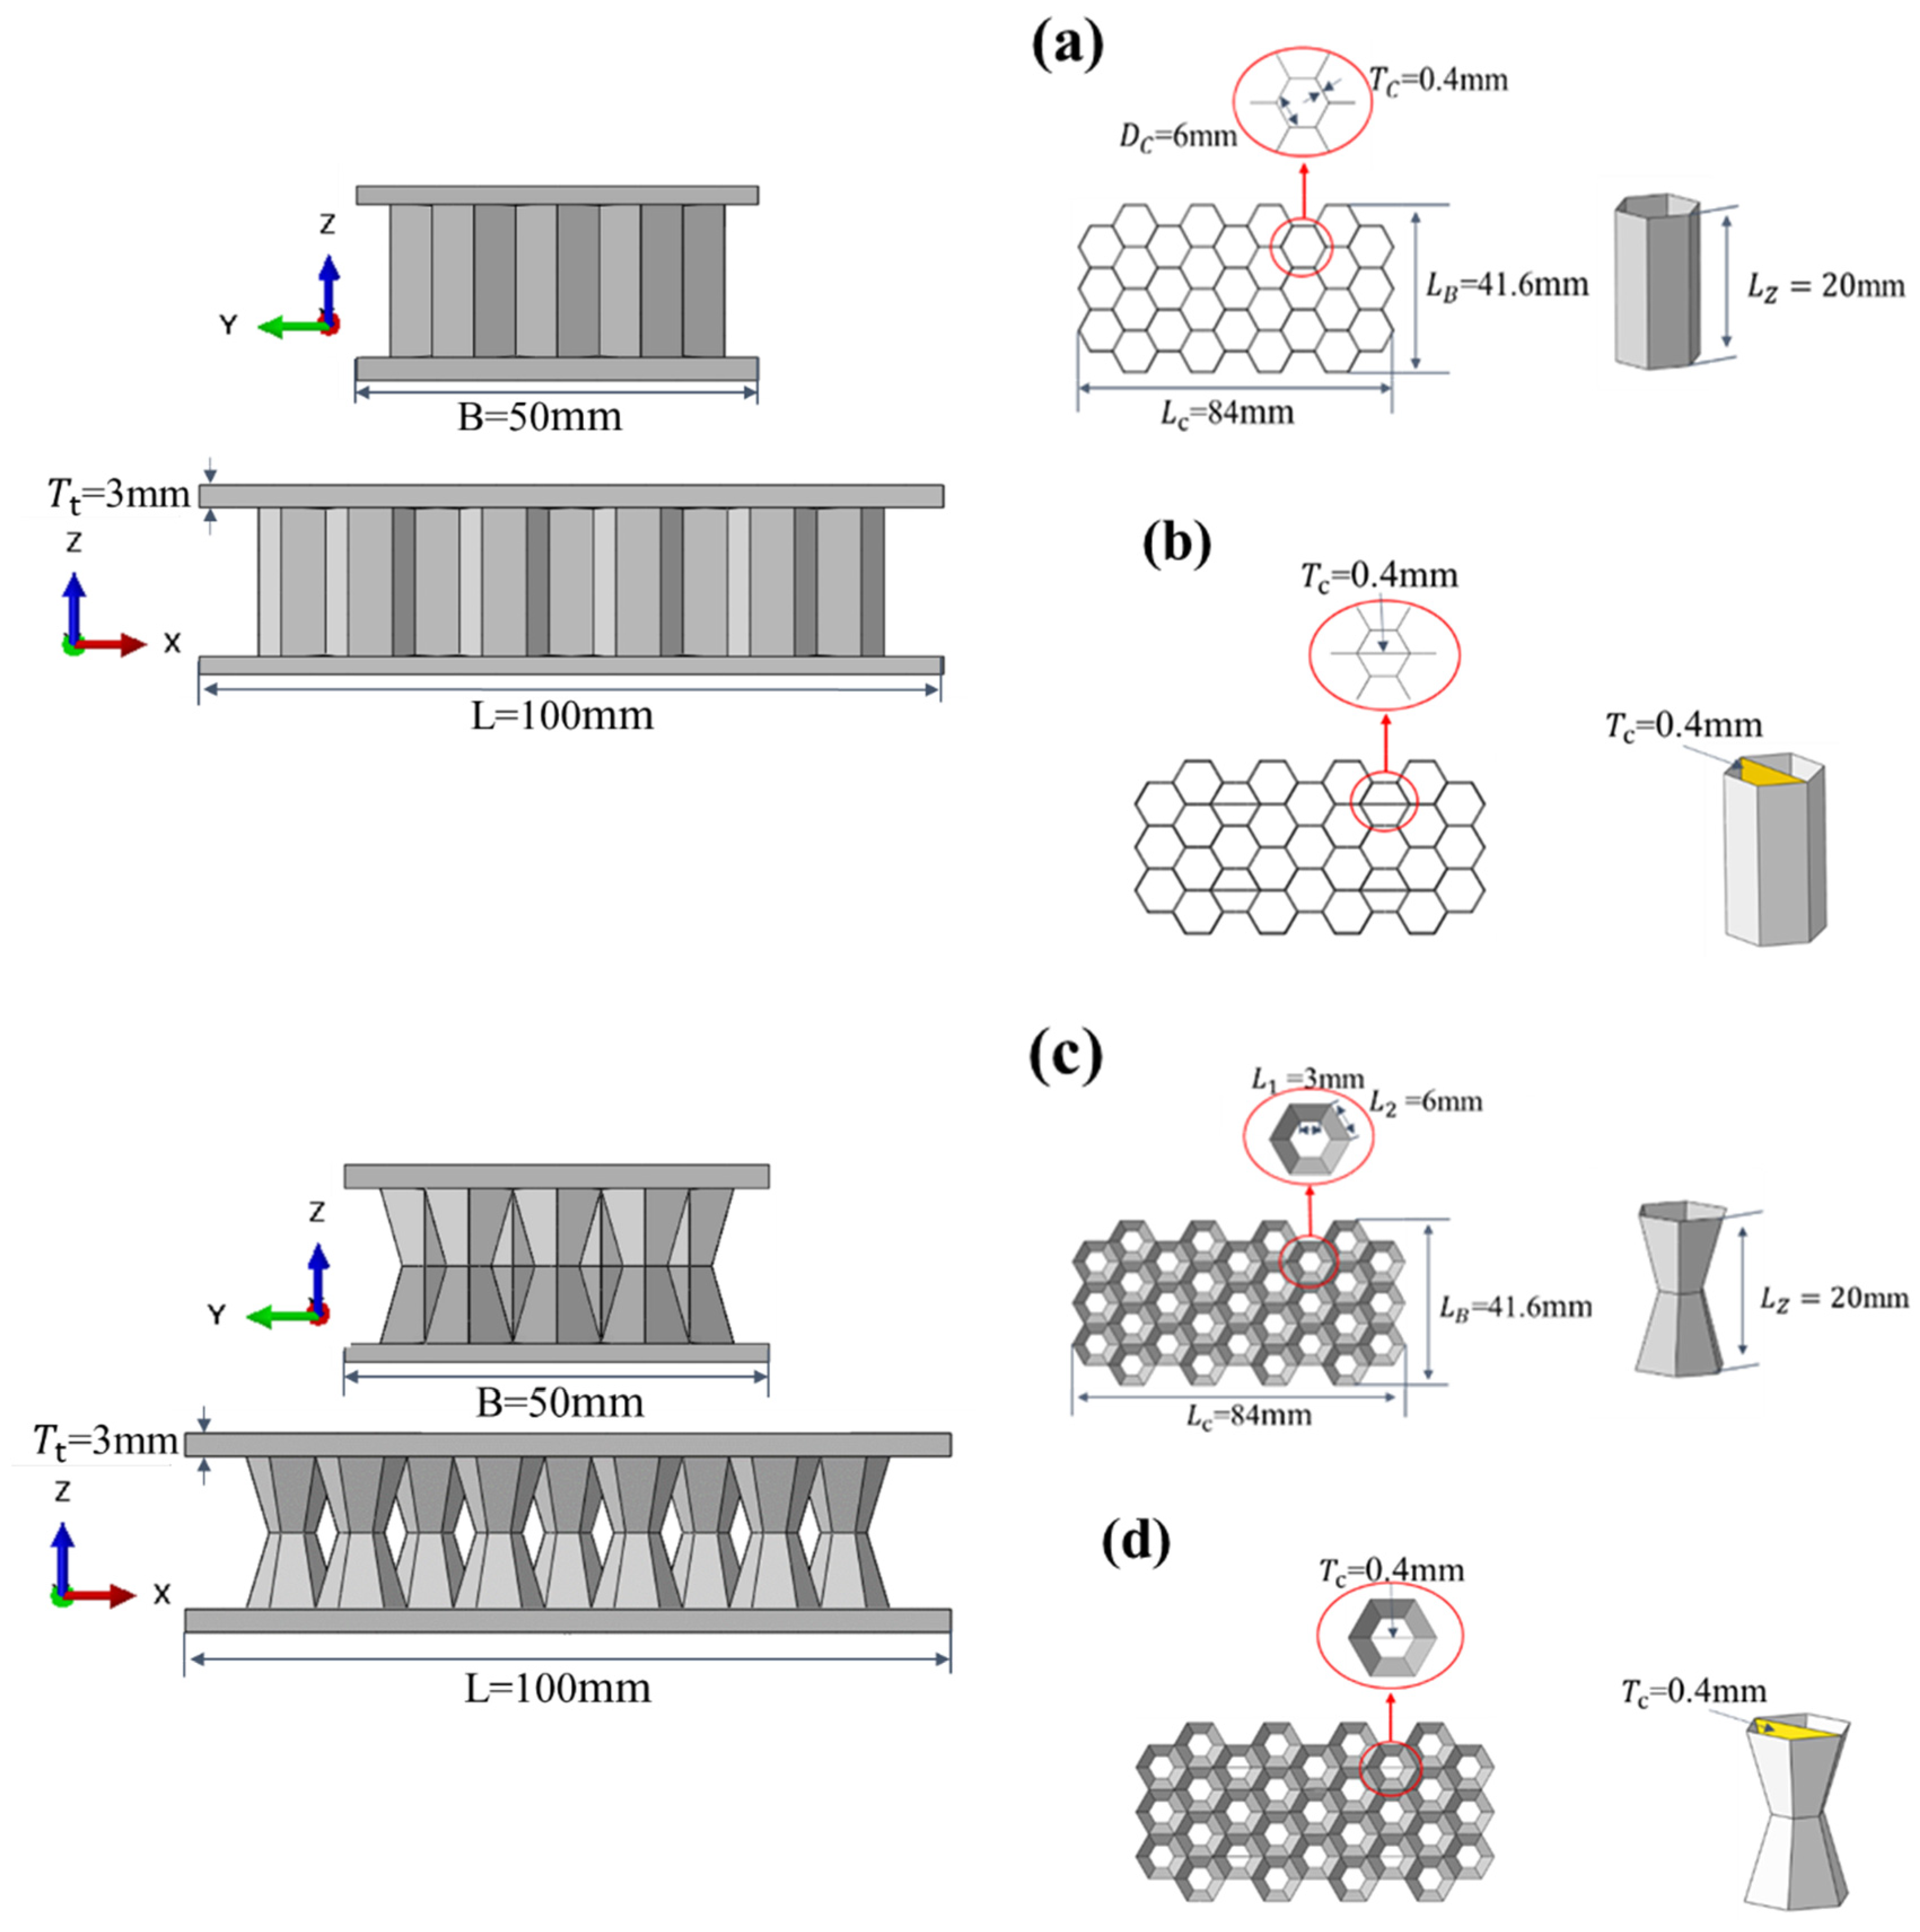
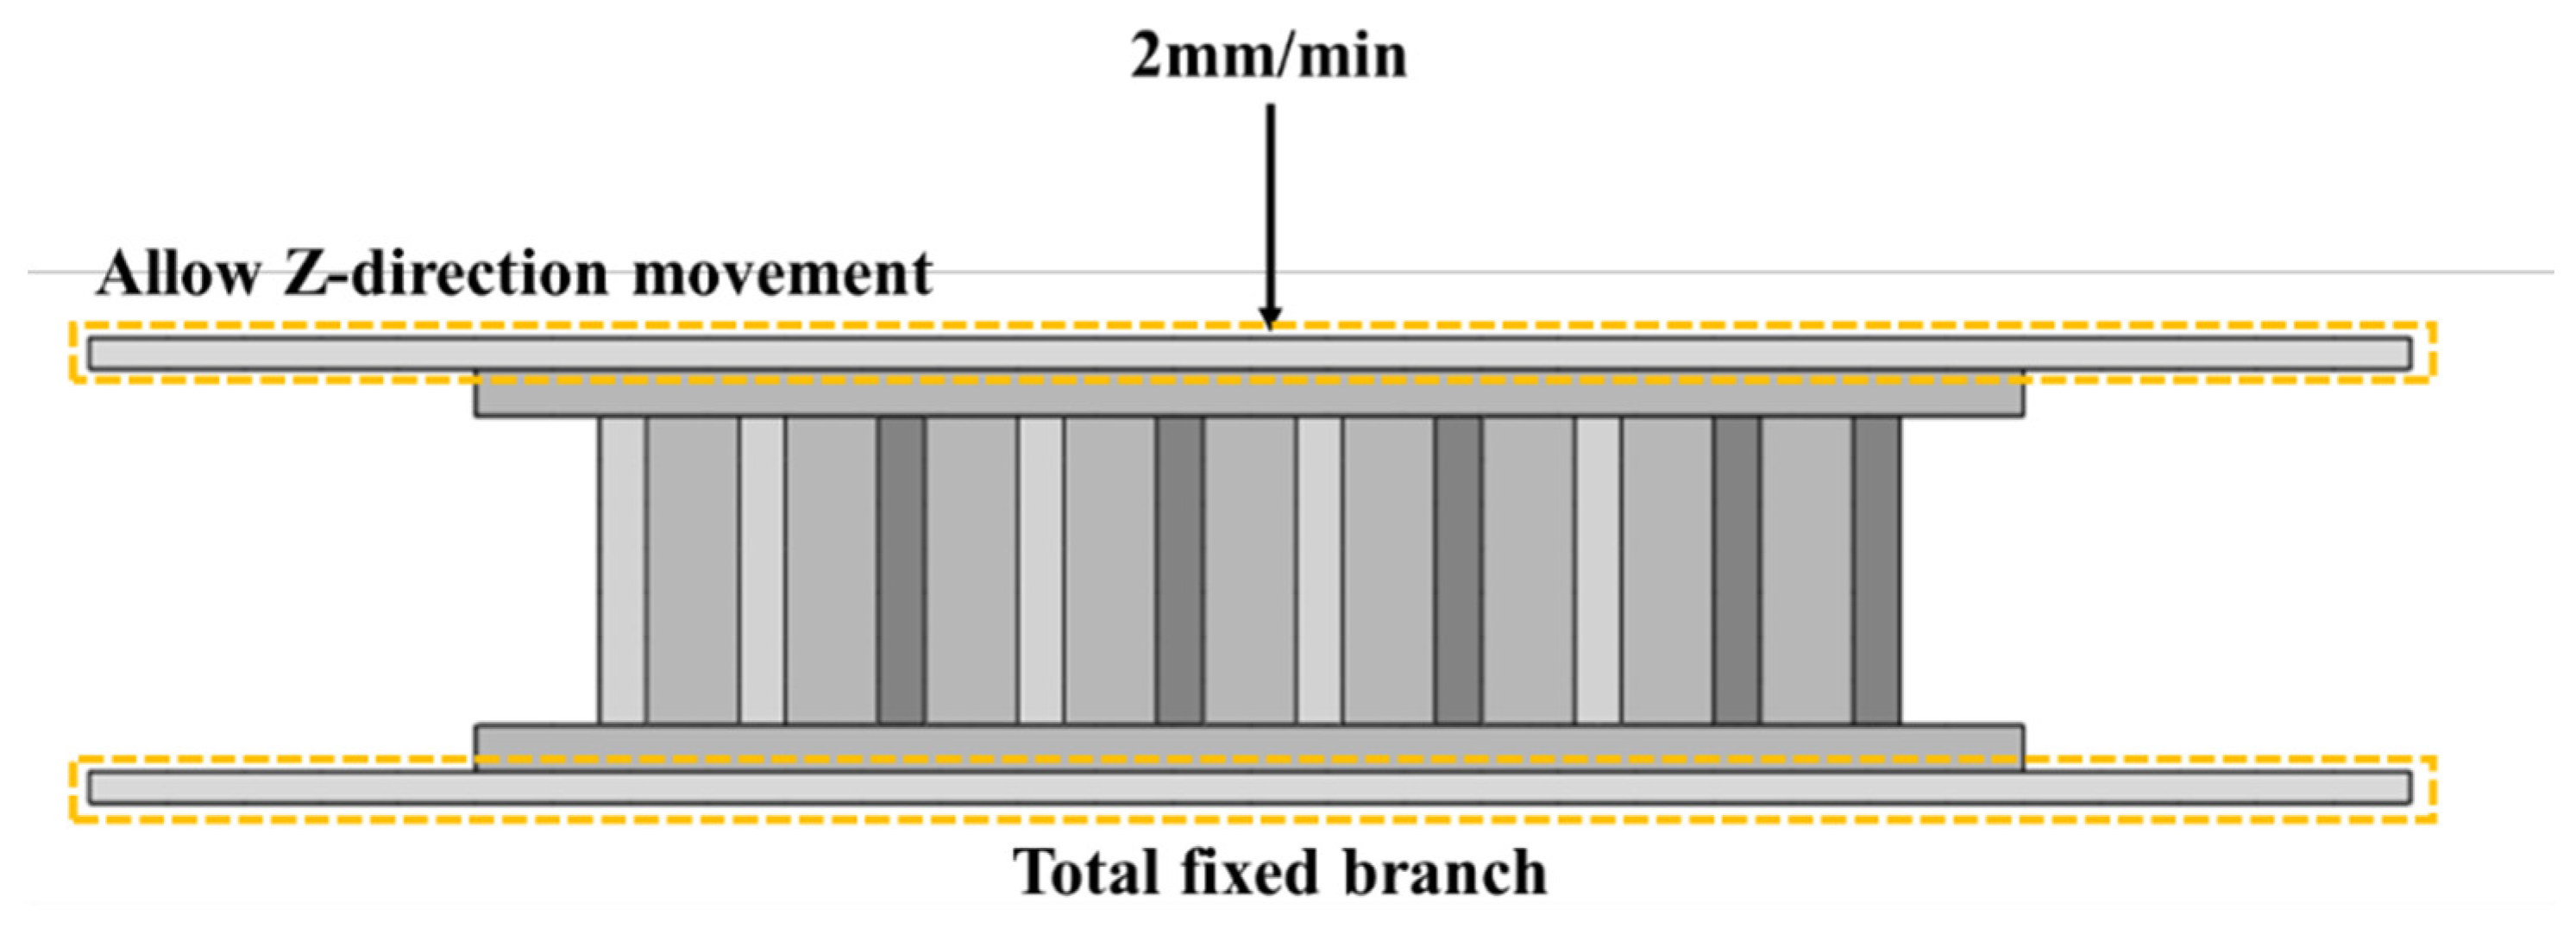
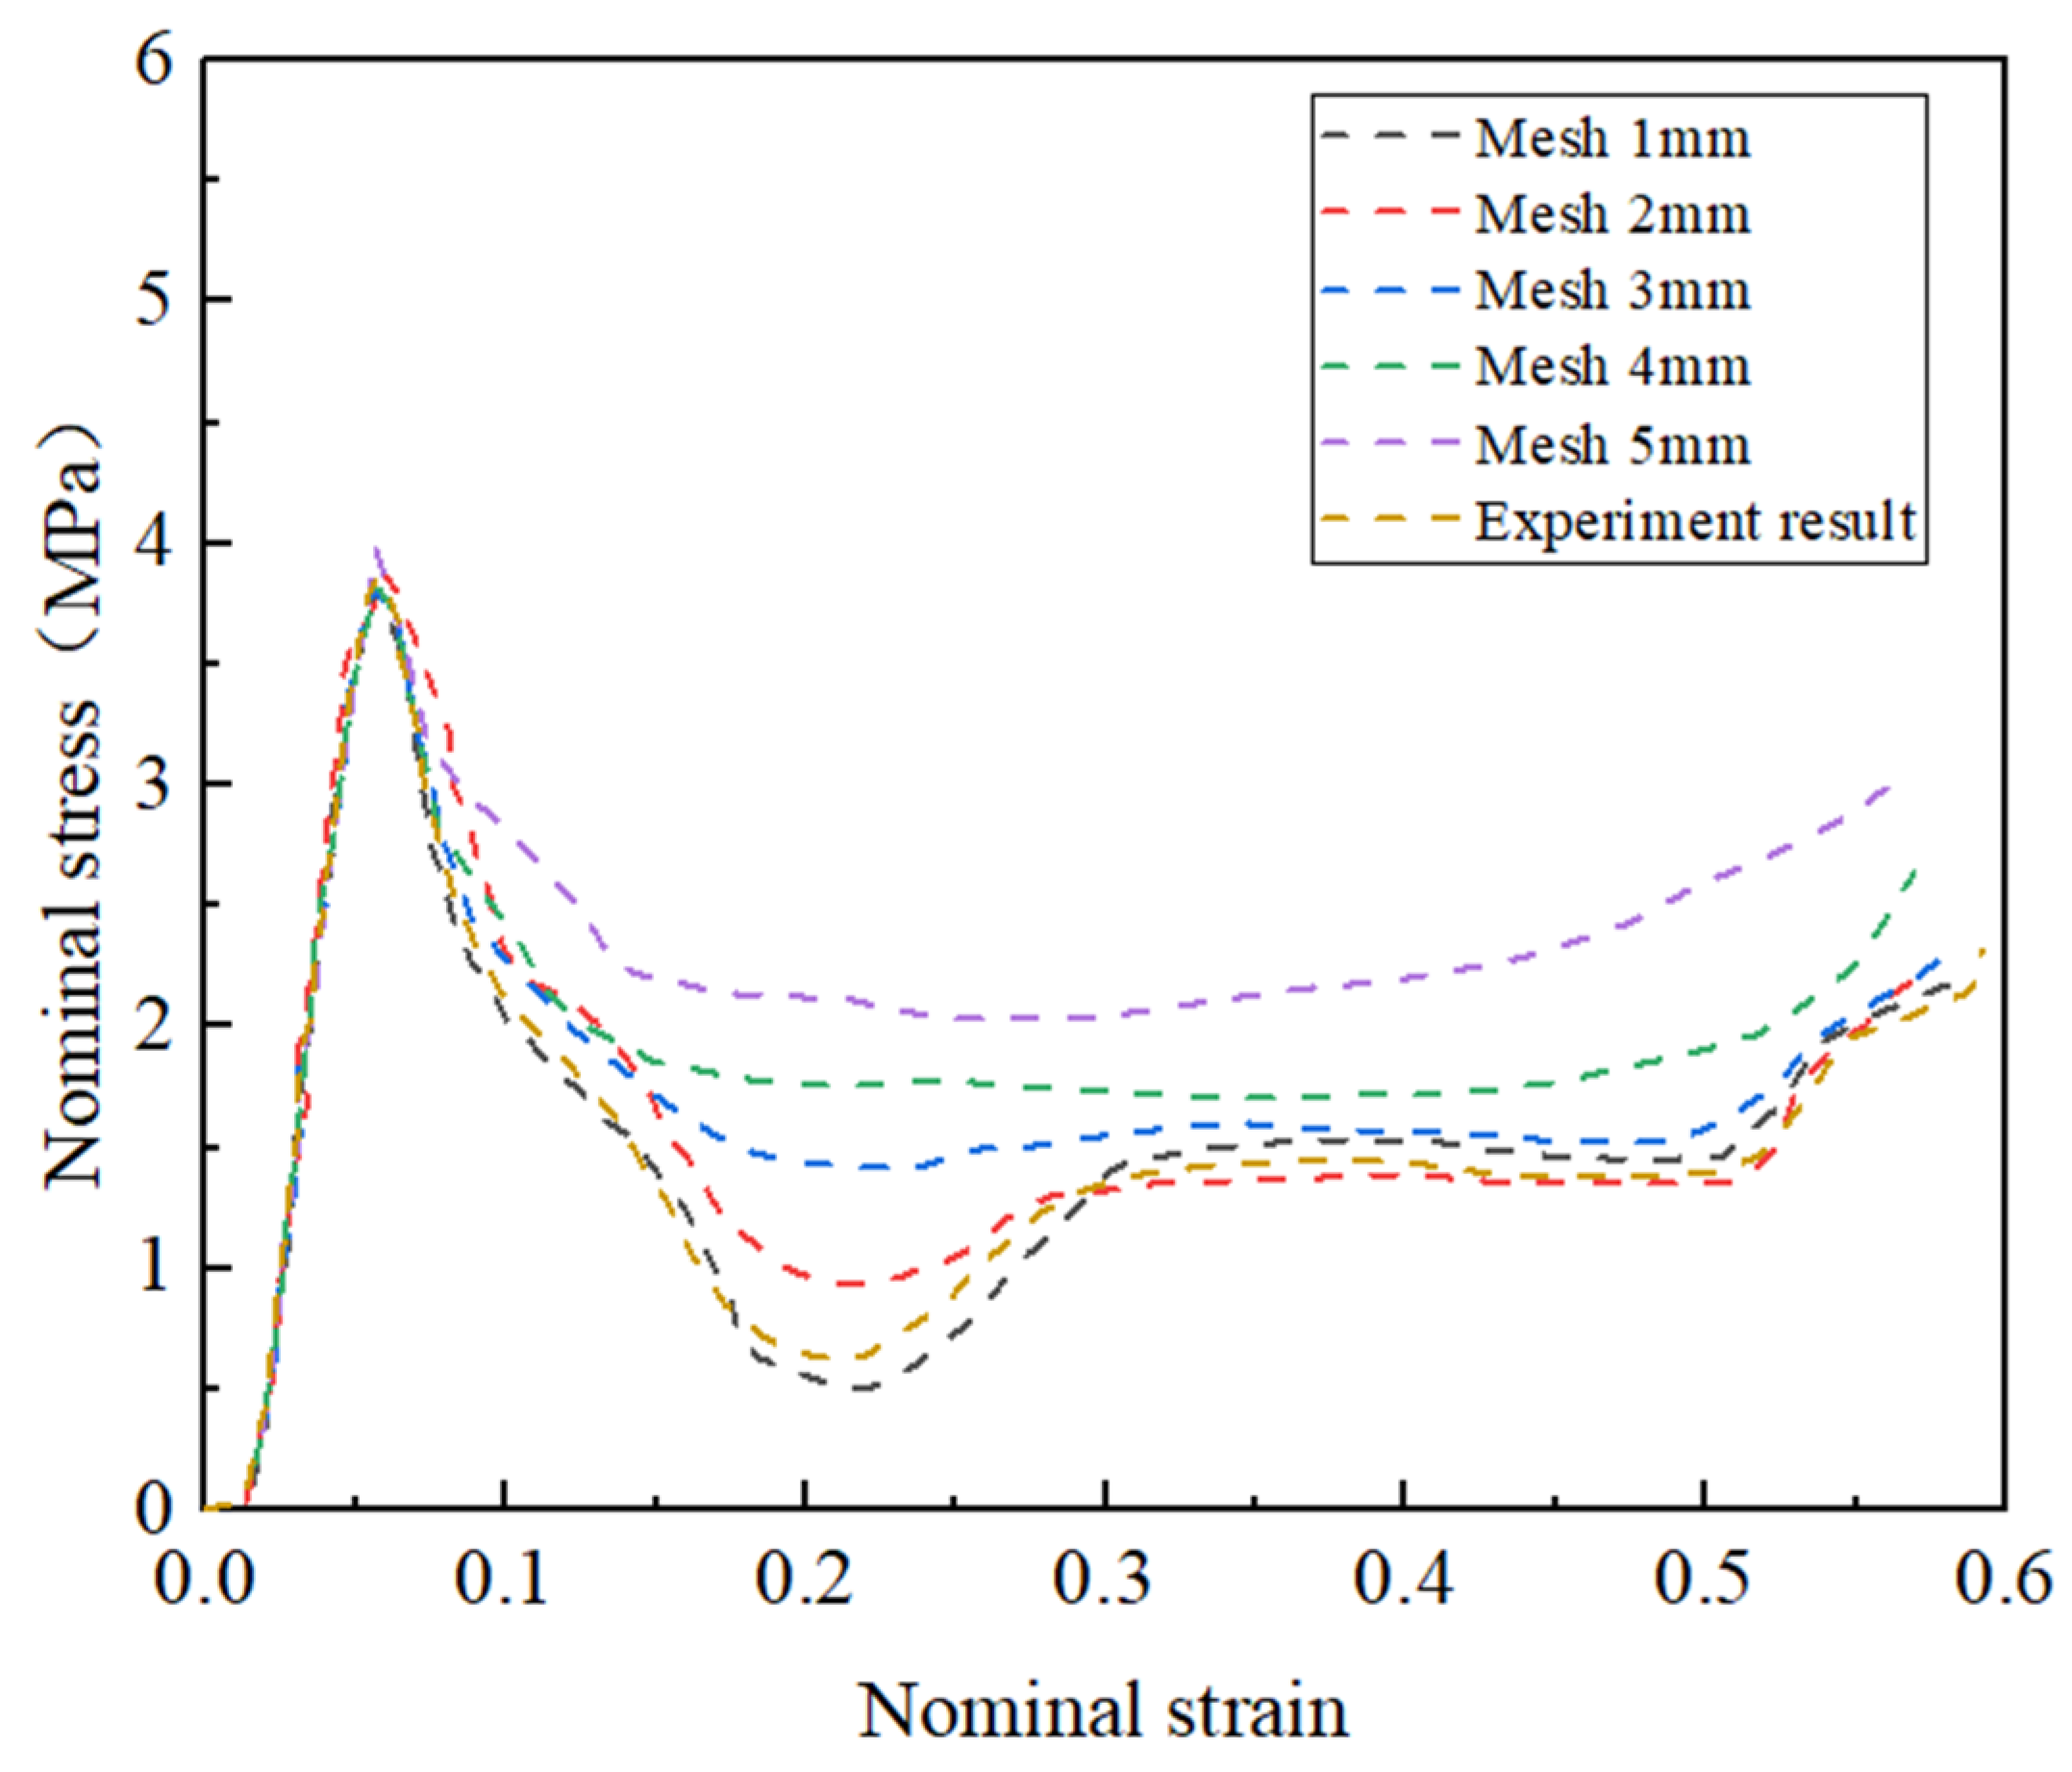
4.1. Finite Element Modeling

The four honeycomb sandwich structures were modeled using 4-node curved shell finite elements (S4R) with the help of Abaqus/Explicit 2021. The core structure in the sandwich structure needs to be constrained between the top and bottom panels to simulate the boundary conditions during the quasistatic compression process, as shown in Figure 9. The bottom panel is fully solidly supported. The top panel was subjected to a downward movement at a controlled rate of 2 mm/min under a displacement-controlled load. This approach ensured that the kinetic energy was negligible compared to that in other works, meeting the conditions required for quasistatic compression in the experiment. Universal contact with a coefficient of static friction of 0.2 was employed between the model units. As shown in Figure 10, a mesh convergence analysis was conducted. At a mesh size of 1 mm, the error between the peak stress and the platform stress in both the experimental and numerical simulations was less than 5%. Therefore, a mesh size of 1 mm was determined to be the ideal choice. The mechanical parameters of ABS were determined from the tensile experiment in Figure 2; the material had a modulus of elasticity of 1207 MPa, a yield stress of 11.78 MPa, a Poisson’s ratio of 0.33, and a density of 1.18 g/cm3.

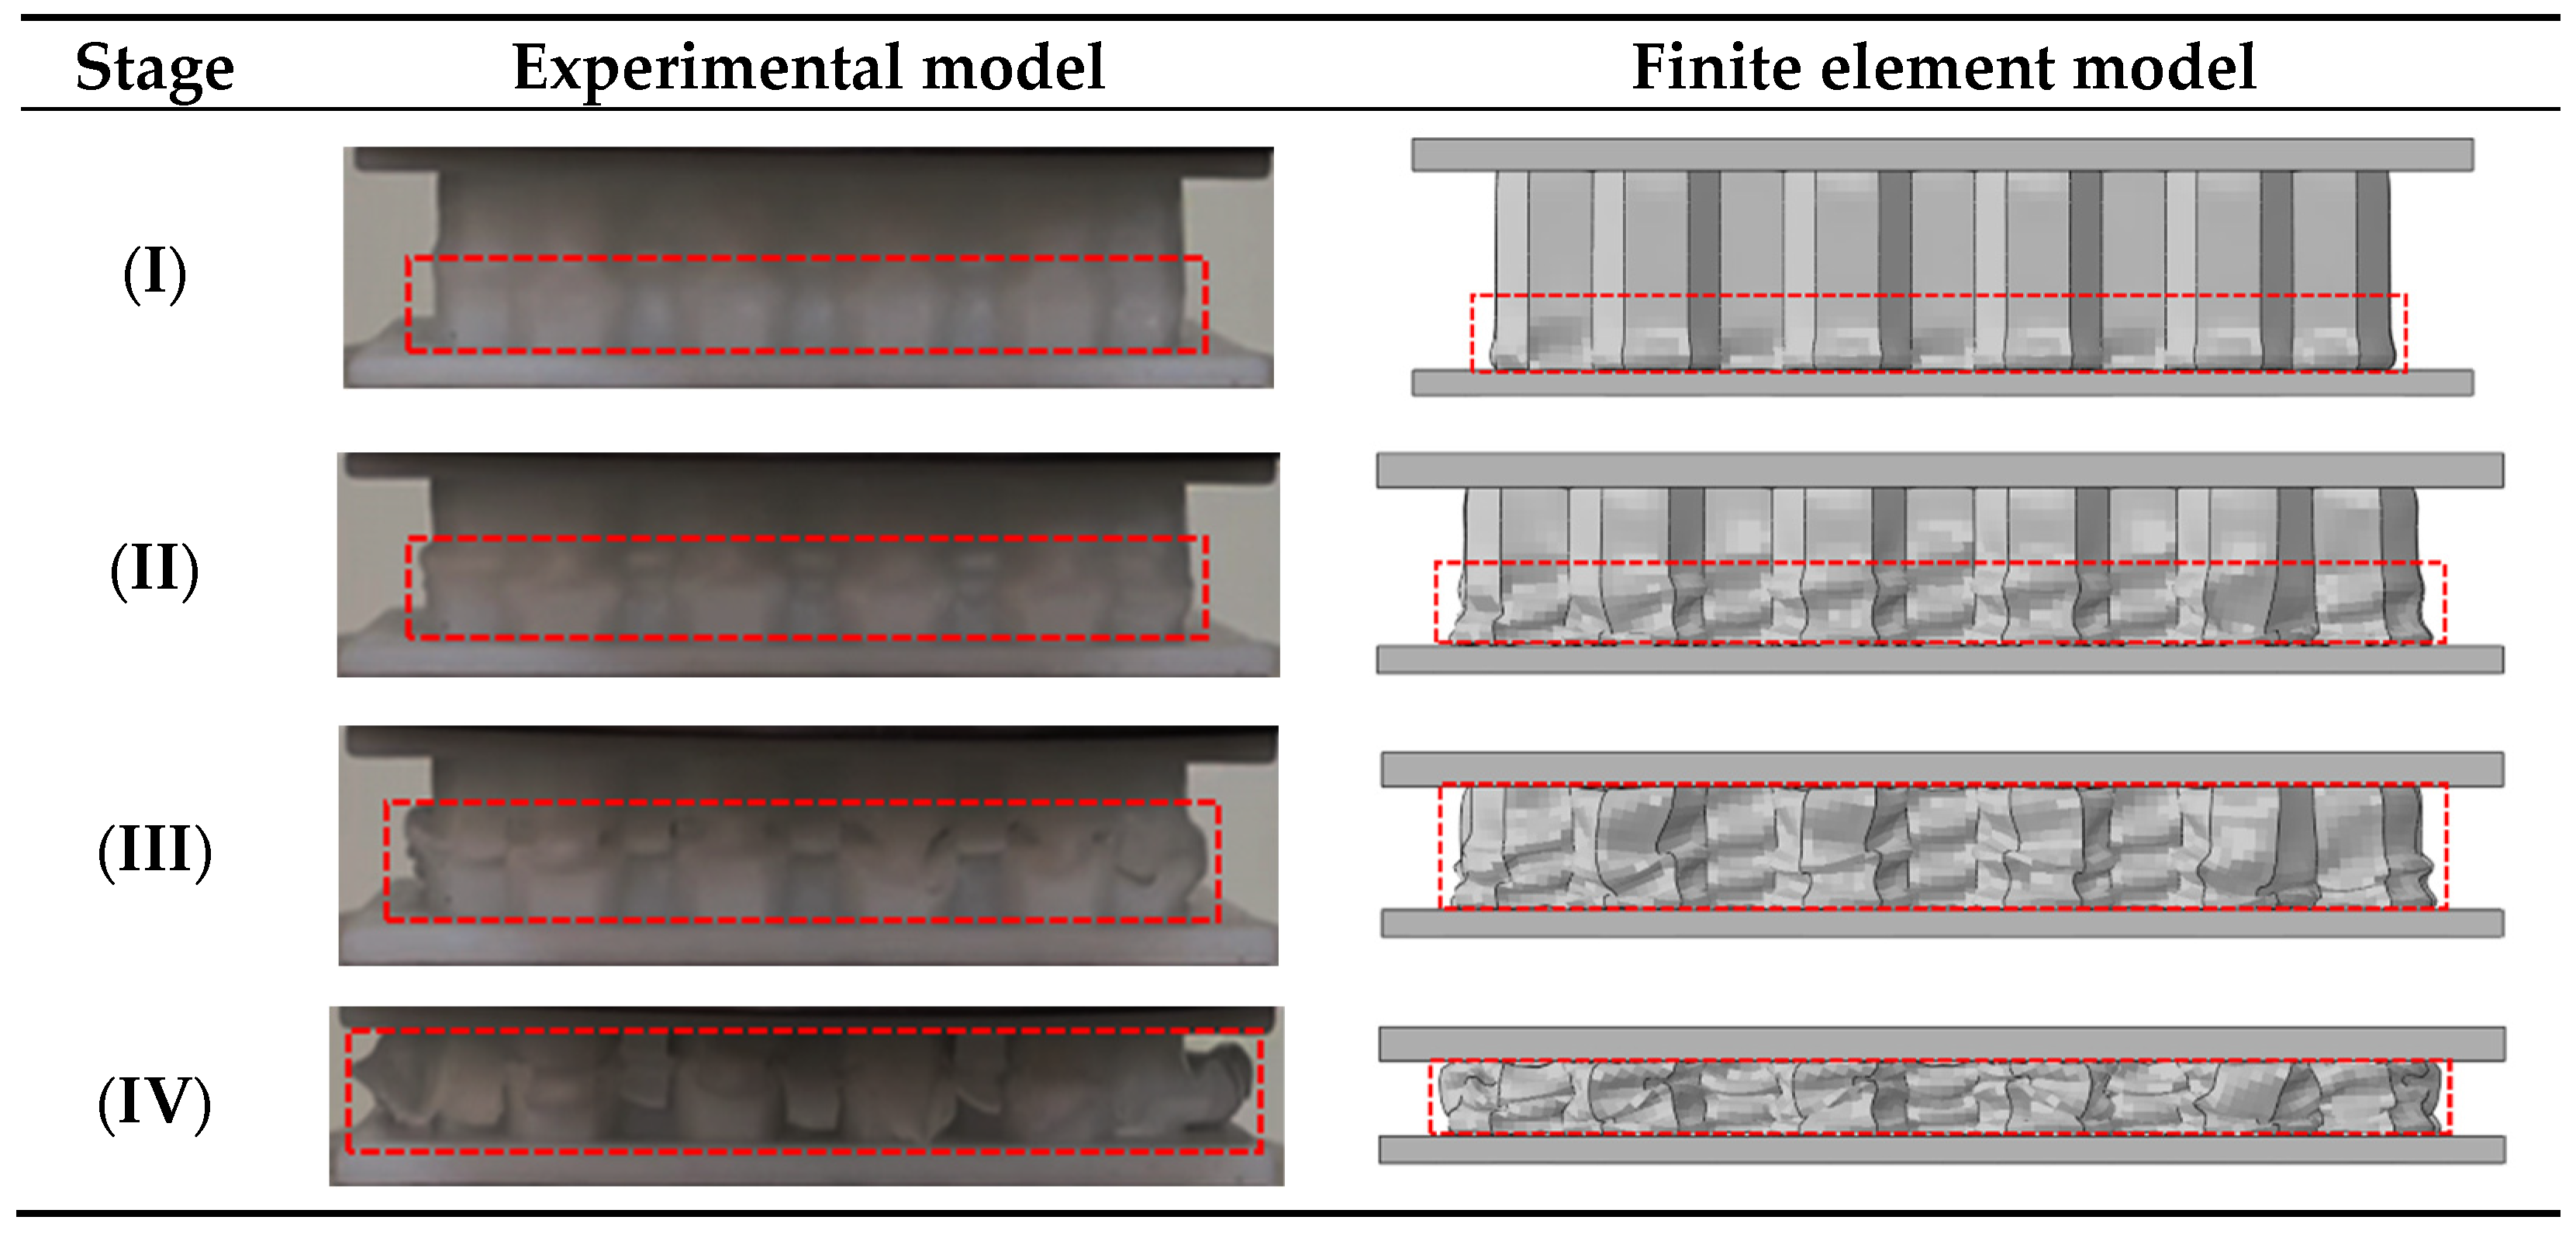
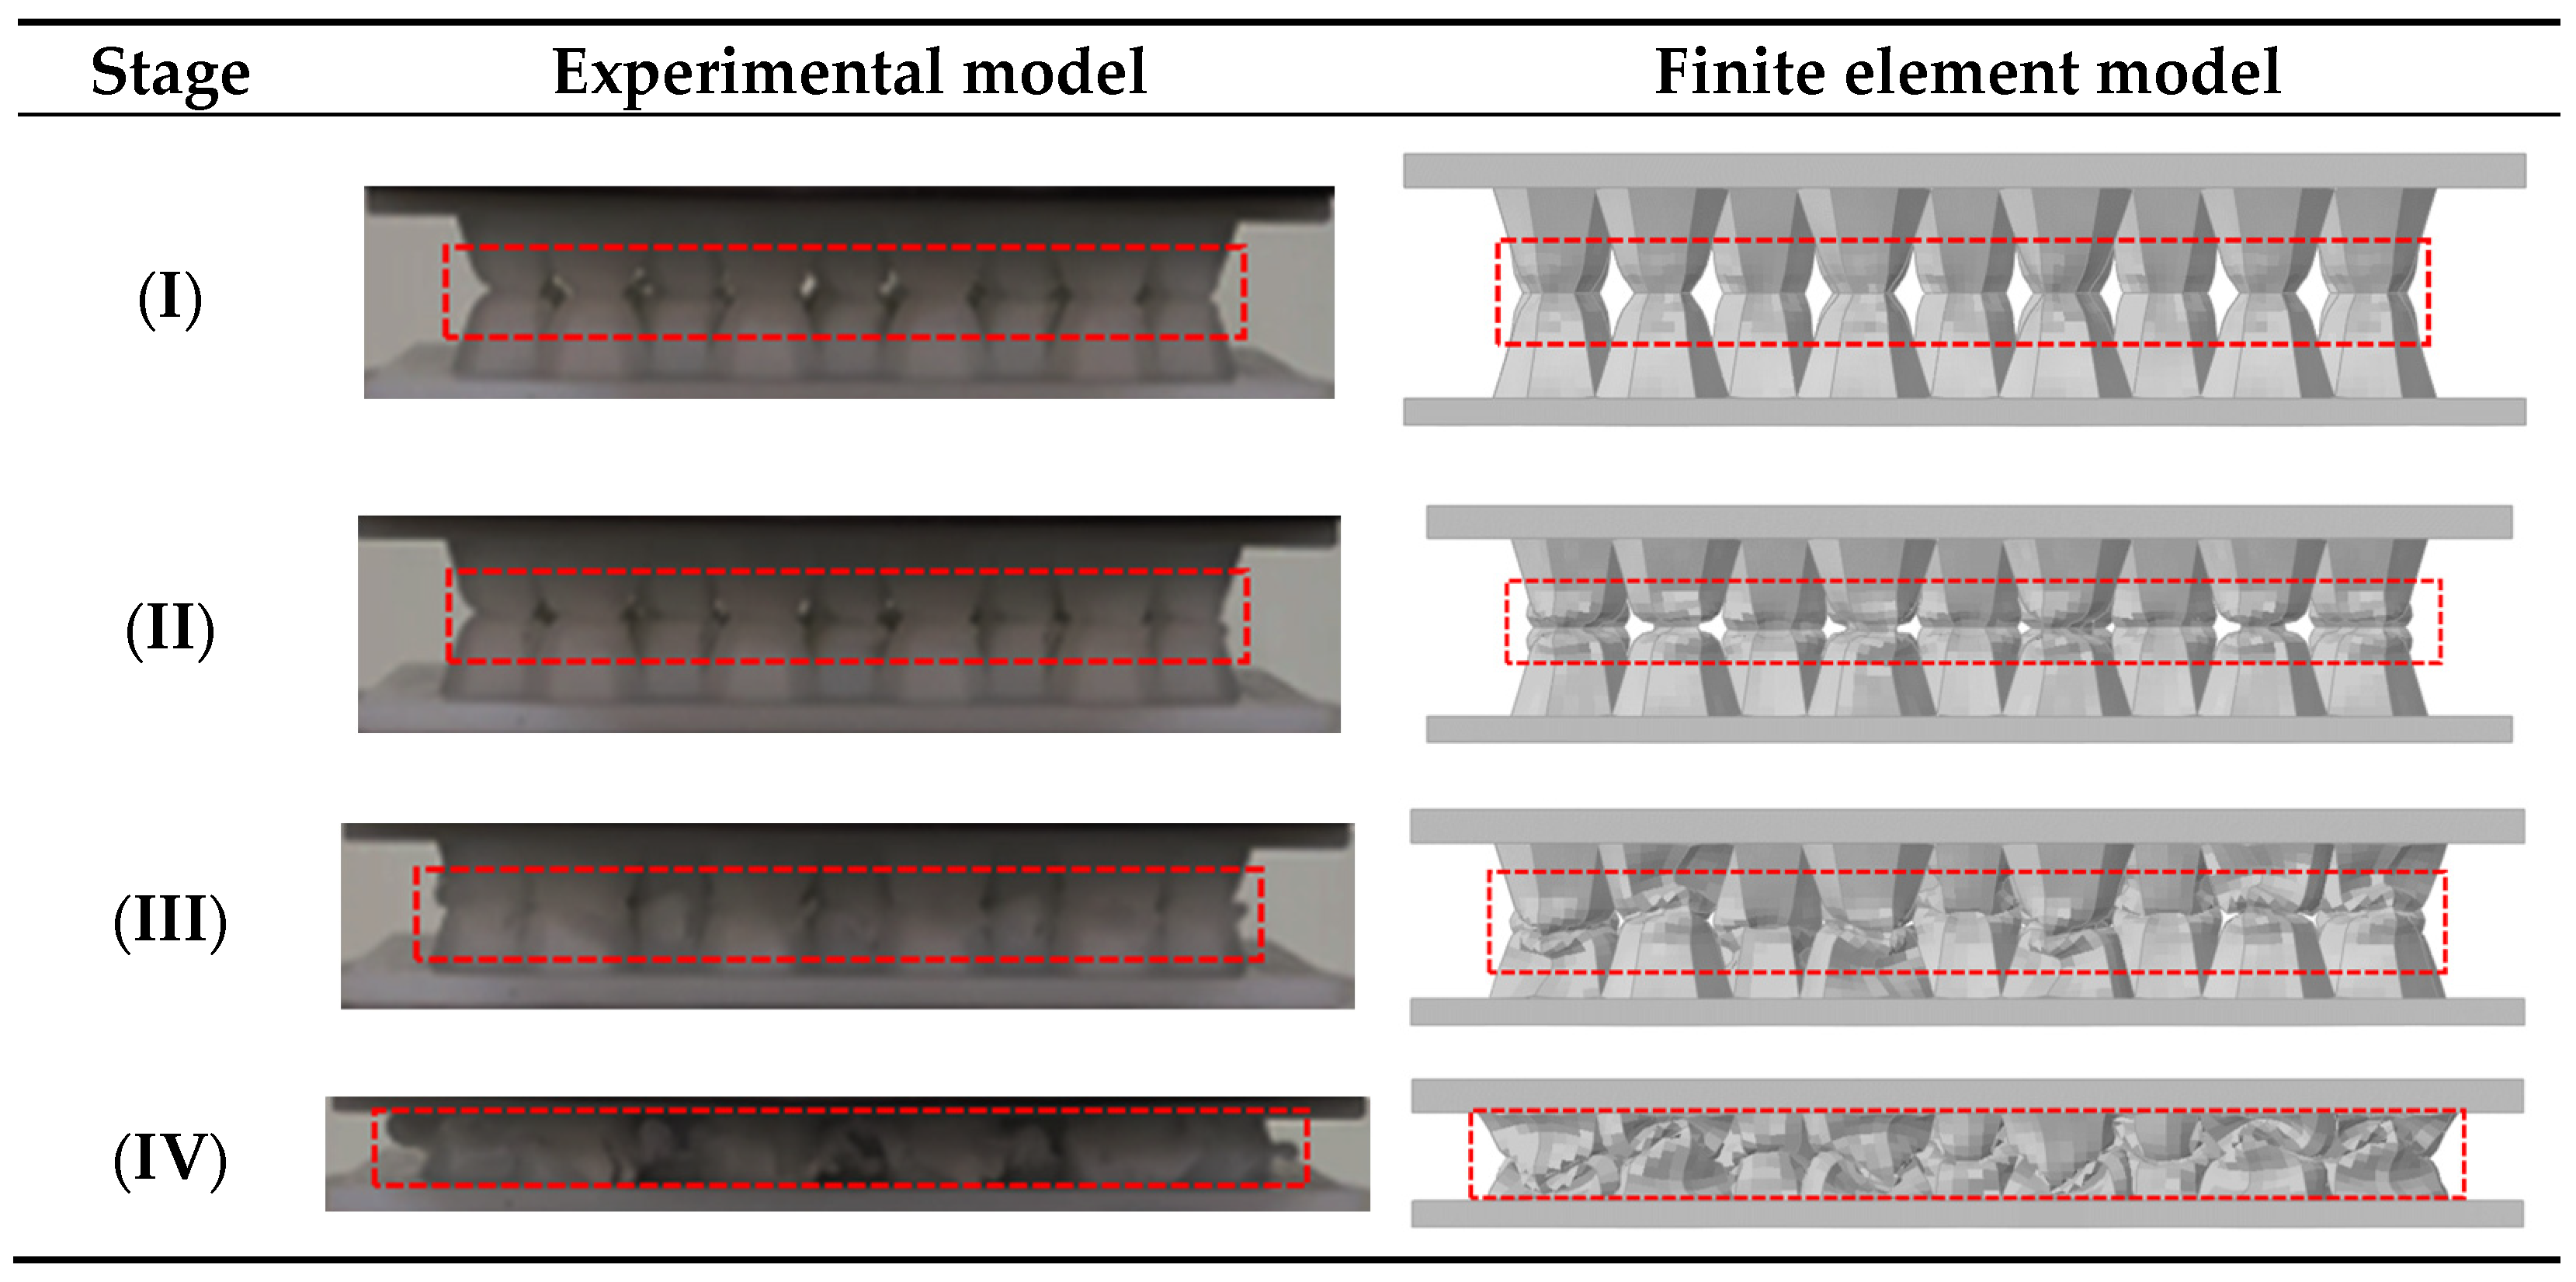
4.2. Numerical Results

As shown in Figure 11, during the linear elastic stage of the LVHS, the outer core walls bent outward while the inner core walls tilted, and the numerical simulation results were close to the experimental outer wall tilt angle. The bending of the core walls was more pronounced during the plastic deformation stage, when no significant fracturing had yet occurred. In the platform stage, the folds that formed in the middle part of the experimental structure at this point basically match those in the numerical simulation. In the final stage of densification, the overall structure was entirely destroyed. Figure 12 illustrates the behavior of the LRVHS during its elastic phase. The outer core walls bent inward, and the inner core walls tilted. The numerical simulation had essentially the same tilt angle as the experimental outer wall. During the plastic deformation stage, folding began to occur in the middle part of the structure. As the load continued to be applied in the platform stage, some regions of the structure exhibited a spiral twisting phenomenon, with the experimental and numerical simulation results generally being consistent. As the load was continuously applied, the structure entered a densification stage, during which overall damage occurred. Figure 13 shows that when the LRVHS was subjected to quasistatic compression, the middle portion of the structure deformed first, and the overall structure elements were compressed against each other. The structure reached its peak stress and underwent deformation at a strain of 0.052. At a strain of 0.22, the structure entered the platform stage, where energy absorption improved rapidly. During this stage, the middle part of the LRVHS exhibited a spiral twisting phenomenon, enhancing energy absorption through mutual compression. This stage proved to be the most effective for energy absorption. After reaching a strain of 0.52, the structure enters the densification stage, where it is overcompressed under the constant action of the load, resulting in severe deformation.

5. Discussion and Analysis

5.1. The Lotus Root Effect

Figure 14 shows the stress–strain curves and deformation processes of the TCS and LRHS under quasistatic compression. Under quasistatic action, the peak stress was reached at a TCS strain of 0.052, at which point the structure yielded. At this time, the LRHS single-cell meta-structure was in stage I. The inner core wall of the middle part of the structure was tilted. The contact area between the upper and lower parts of the structure was larger than that between the other parts, which can provide the structure with a load-bearing capacity and an energy-absorbing effect. Thus, the LRHS deformed less than the TCS under load, with the peak stress of the LRHS being 9.97% greater than that of the TCS. At a strain of 0.32, the LRHS had greater structural deformation than the TCS due to the helical stacking phenomenon that occurred in the middle part of the LRHS. At this time, the LRHS single-cell meta-structure was in stage III. The inner core walls of the middle part of the structure are tilted. The outer core walls were bent inward, which resulted in a helical twist in the middle part of the structure, and more energy was absorbed by the structure. Therefore, the LRHS had a greater energy absorption effect than the TCS in the plateau stage. Compared with that of TCS, the mechanical mechanism of helical twisting and deformation from the lotus root effect increased the energy absorption of the LRHS in the plateau stage by 51.4%. In addition, Xu et al. [42] performed quasistatic compression on a lotus root structure and reported that the structure was able to absorb more energy and absorb more specific energy during compression. The excellent energy absorption of the LRHS originates from the deformation mechanics mechanism of helical twisting, which enhances the energy absorption of the entire structure.

5.2. The Leaf Venation Effect

Figure 15 shows the stress–strain curves and deformation processes of the TCS and LVHS under quasistatic compression. The structural deformation of the LVHS was less than that of the TCS under quasistatic action. The TCS underwent yield deformation at a strain of 0.06, with the peak stress reaching 3.34 MPa, indicating a 4.84% lower peak stress than that of the LVHS. Under the load action, the leaf vein plate action in the LVHS began in Stage I. The lower part of the leaf vein plate underwent initial fold deformation, presenting an overall arc deformation mode. Structural deformation played a crucial role in providing out-of-plane bearing capacity, resulting in a larger stress peak for the structure. As the leaf vein plate transitioned into Stage II, two deformations were manifested in the lower part of the leaf vein plate, which adopted an overall S-shaped deformation pattern. This deformation not only enhanced the energy-absorbing effect of the structure but also marked the beginning of stress reduction. Moving into Stages III and IV, three folds emerged in the leaf vein plate, shaping the overall leaf vein plate into a W-shaped deformation pattern. Overall, the leaf vein plate lost its energy-absorbing effect due to excessive deformation. Under load, the leaf vein plate changed through arc, S, and W shapes, resulting in the greater out-of-plane load-carrying capacity and energy absorption capacity values of the LVHS than of the TCS. Lv et al. [49] designed a CFRP orthogonal mesh-reinforced structure that was found to have the strongest load-carrying capacity at the reinforced part of the foliation plate. Leaf vein plates have excellent energy absorption properties and better out-of-plane load-carrying capacity for resisting high loads.

5.3. Effect of Leaf Vein Plate Position, Number, and Thickness

The experimental results show that the SEA of the LRVHS was better than that of other structures. To further investigate the effect of the position and number of leaf vein plates on the energy absorption of the structure, the position of the structural leaf vein plates was adjusted while ensuring that the number of leaf vein plates remained the same. As shown in Figure 16a, three different positions on the leaf vein plates were set up to analyze the energy absorption effect. Among these configurations, Type 3, with a total of 6 leaf vein plates, demonstrated the most effective energy absorption. Compared with those of Type 1 and Type 2, the energy absorption increases were 3.8% and 2.5%, respectively. Structurally, the configuration absorbs energy from the center pointing outward, where the position of the leaf vein plate is to the outside. This was because, during the quasistatic compression process, the outer cell element first deformed and failed. The outer cell element deformed to a greater extent than the inner cell element, which increased the structural out-of-plane bearing capacity under the action of the foliation plate. Thus, the structural energy absorption effect was enhanced. The effect of the leaf vein plate position on the energy absorption of the structure was analyzed. The number of structural leaf vein plates was analyzed based on the above-optimized positions of the leaf vein plates to explore the overall energy absorption of the structure with different numbers of structural leaf vein plates. Figure 16c shows the strain-SEA maps for different numbers of leaf vein plate structures. Type 6 had the best SEA effect, with a value of 1.11 J/g. As the number of leaf vein plates increased, the structural SEA effect further decreased because too many leaf vein plates increased the mass of the structure. The excessive out-of-plane bearing capacity provided by the leaf vein plates resulted in a structure that was less prone to deformation, consequently diminishing its ability to absorb energy. The structure attained the optimal SEA effect with a leaf vein plate number of 6, and the SEA was reduced by 14.9% compared to the results of the LRVHS experiment in Figure 8. When the number of leaf vein plates was 16, the highest out-of-plane bearing capacity occurred. This resulted in a maximum SEA at a strain of 0.052. However, at strains of 0.21 and 0.48, the SEA values were smaller than those of structures with other leaf vein plate numbers. Consequently, the optimal SEA for the structure was achieved when the number of leaf vein plates was 4, as this provided the best balance between the out-of-plane bearing capacity and energy absorption.
The effects of different vein plate thicknesses on the structural peak force and SEA variation under quasistatic action were explored. Figure 17 shows the structural peak force and SEA at the different vein plate thicknesses for the LRVHS. The magnitude of the peak structural force increased with increasing thickness of the foliation plate, and the slope of the peak structural force gradually increased. The peak force of the structure was 20.61 kN when the thickness of the vein plate was 0.8 mm, representing the optimal structural out-of-plane load-carrying capacity. This corresponds to a 7.9% increase in the peak force compared to that of the structure with a vein plate thickness of 0.2 mm. Lv et al. [50] compared honeycomb vein plates with thicknesses of 1 mm, 2 mm, and 3 mm under loading and found that with increasing vein plate thickness, the results increased. When the load gradually increased to produce a peak force load, the higher the peak force load was, the less the structural energy absorption changed, and the greater the thickness was, the greater the peak load was. The structural peak force can be modulated by varying the thickness of the vein plate. This is compared to Lv et al. [50], who reported that the thickness of a honeycomb structure under load is essentially stable with respect to the SEA variation. The variation in the thickness of the leaf vein plate in the LRVHS reported in this paper had a significant effect on the structural SEA. The SEA showed an increasing trend until the leaf vein plate thickness reached 0.6 mm. The SEA was optimal when the leaf vein plate thickness was 0.6 mm. With a value of 1.36 J/g, there was a 7.3% increase in SEA compared to the leaf vein plate thickness of 0.2 mm. After exceeding a thickness of 0.6 mm, the SEA decreased instead by continuously increasing the thickness. The reason for this difference was that the increase in vein plate thickness contributed to an increase in the peak force of the structure, subsequently enhancing its energy absorption capacity. Increasing the thickness of the leaf vein plate further increases the mass of the structure while enhancing its energy absorption effect. However, beyond a thickness of 0.6 mm, this positive impact on energy absorption, driven by increased plate thickness, was offset by the negative effect of reduced energy absorption associated with the escalating mass due to the thickness increase. This resulted in an overall decrease in the specific energy absorption (SEA) of the structure.

6. Conclusions

In this paper, a novel honeycomb sandwich structure based on the combined design of lotus root nodes and leaf stem veins is proposed by combining the biomimetic concepts of lotus root nodes and leaf stem veins. Using 3D printing technology, four kinds of honeycomb sandwich structure specimens were designed and prepared. Quasistatic compression experiments and numerical simulations were carried out to explore the deformation and energy absorption characteristics of the four kinds of sandwich structures under quasistatic compression. The following conclusions are drawn:
(1)
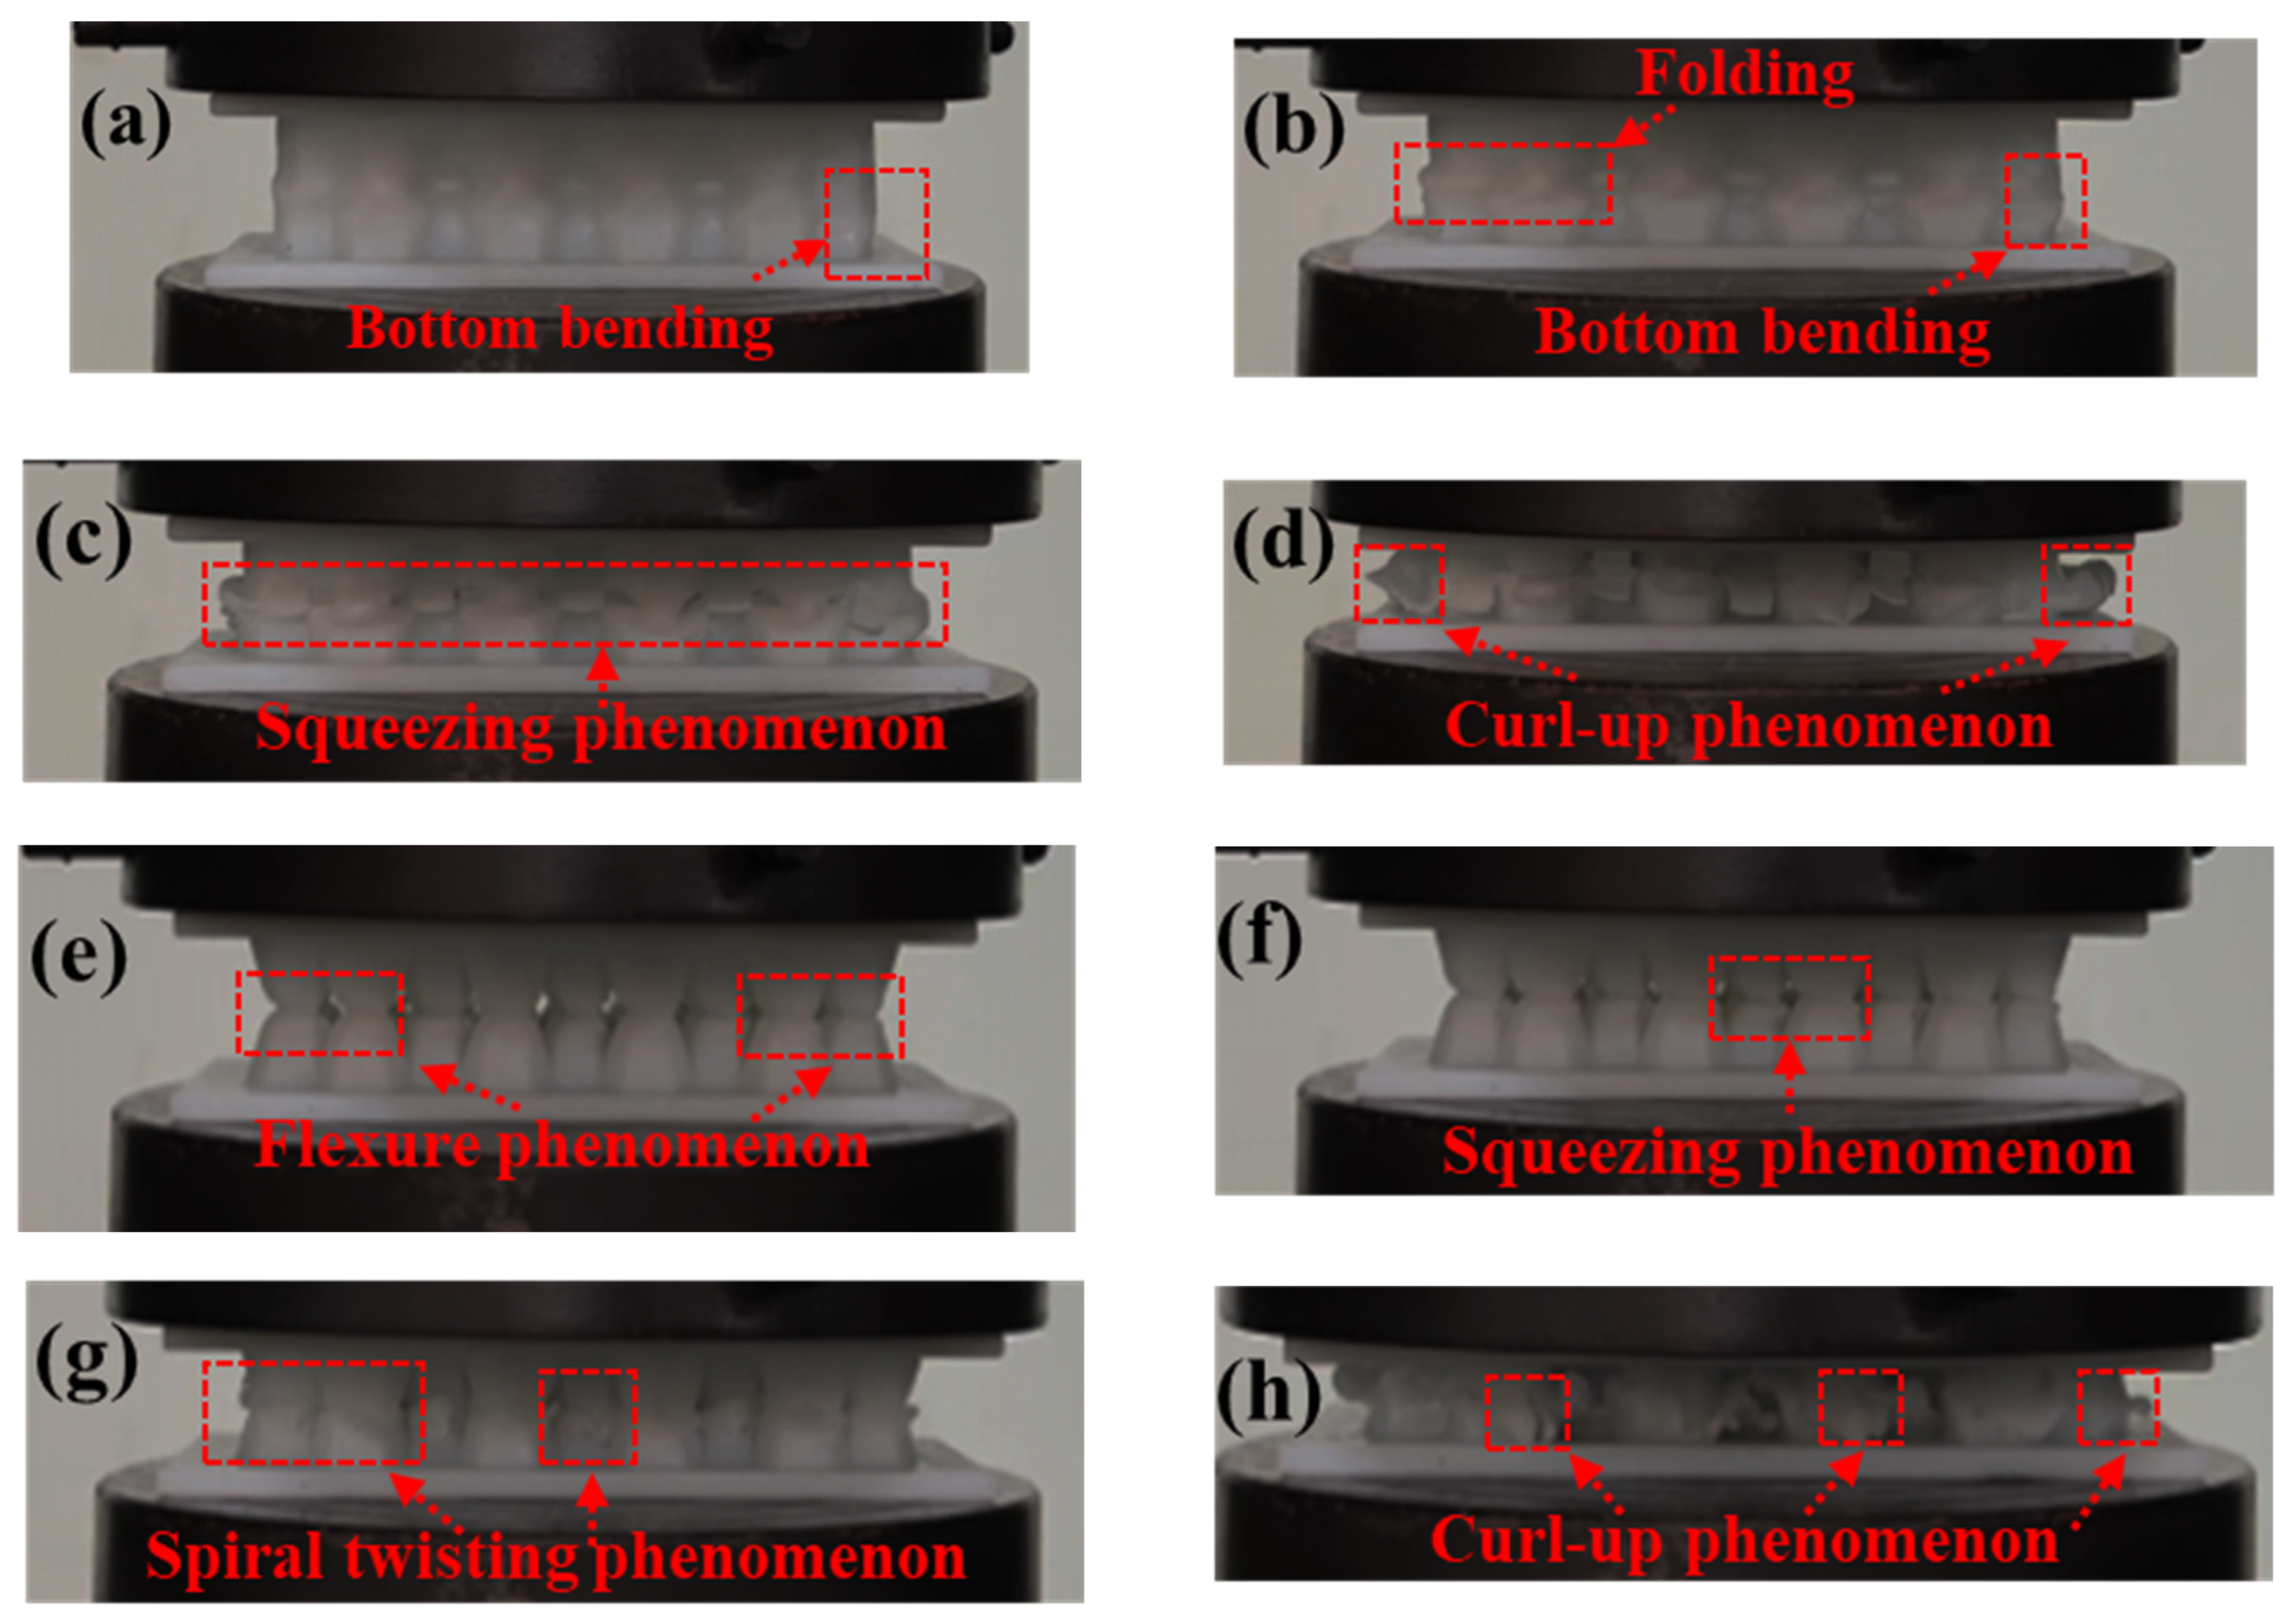
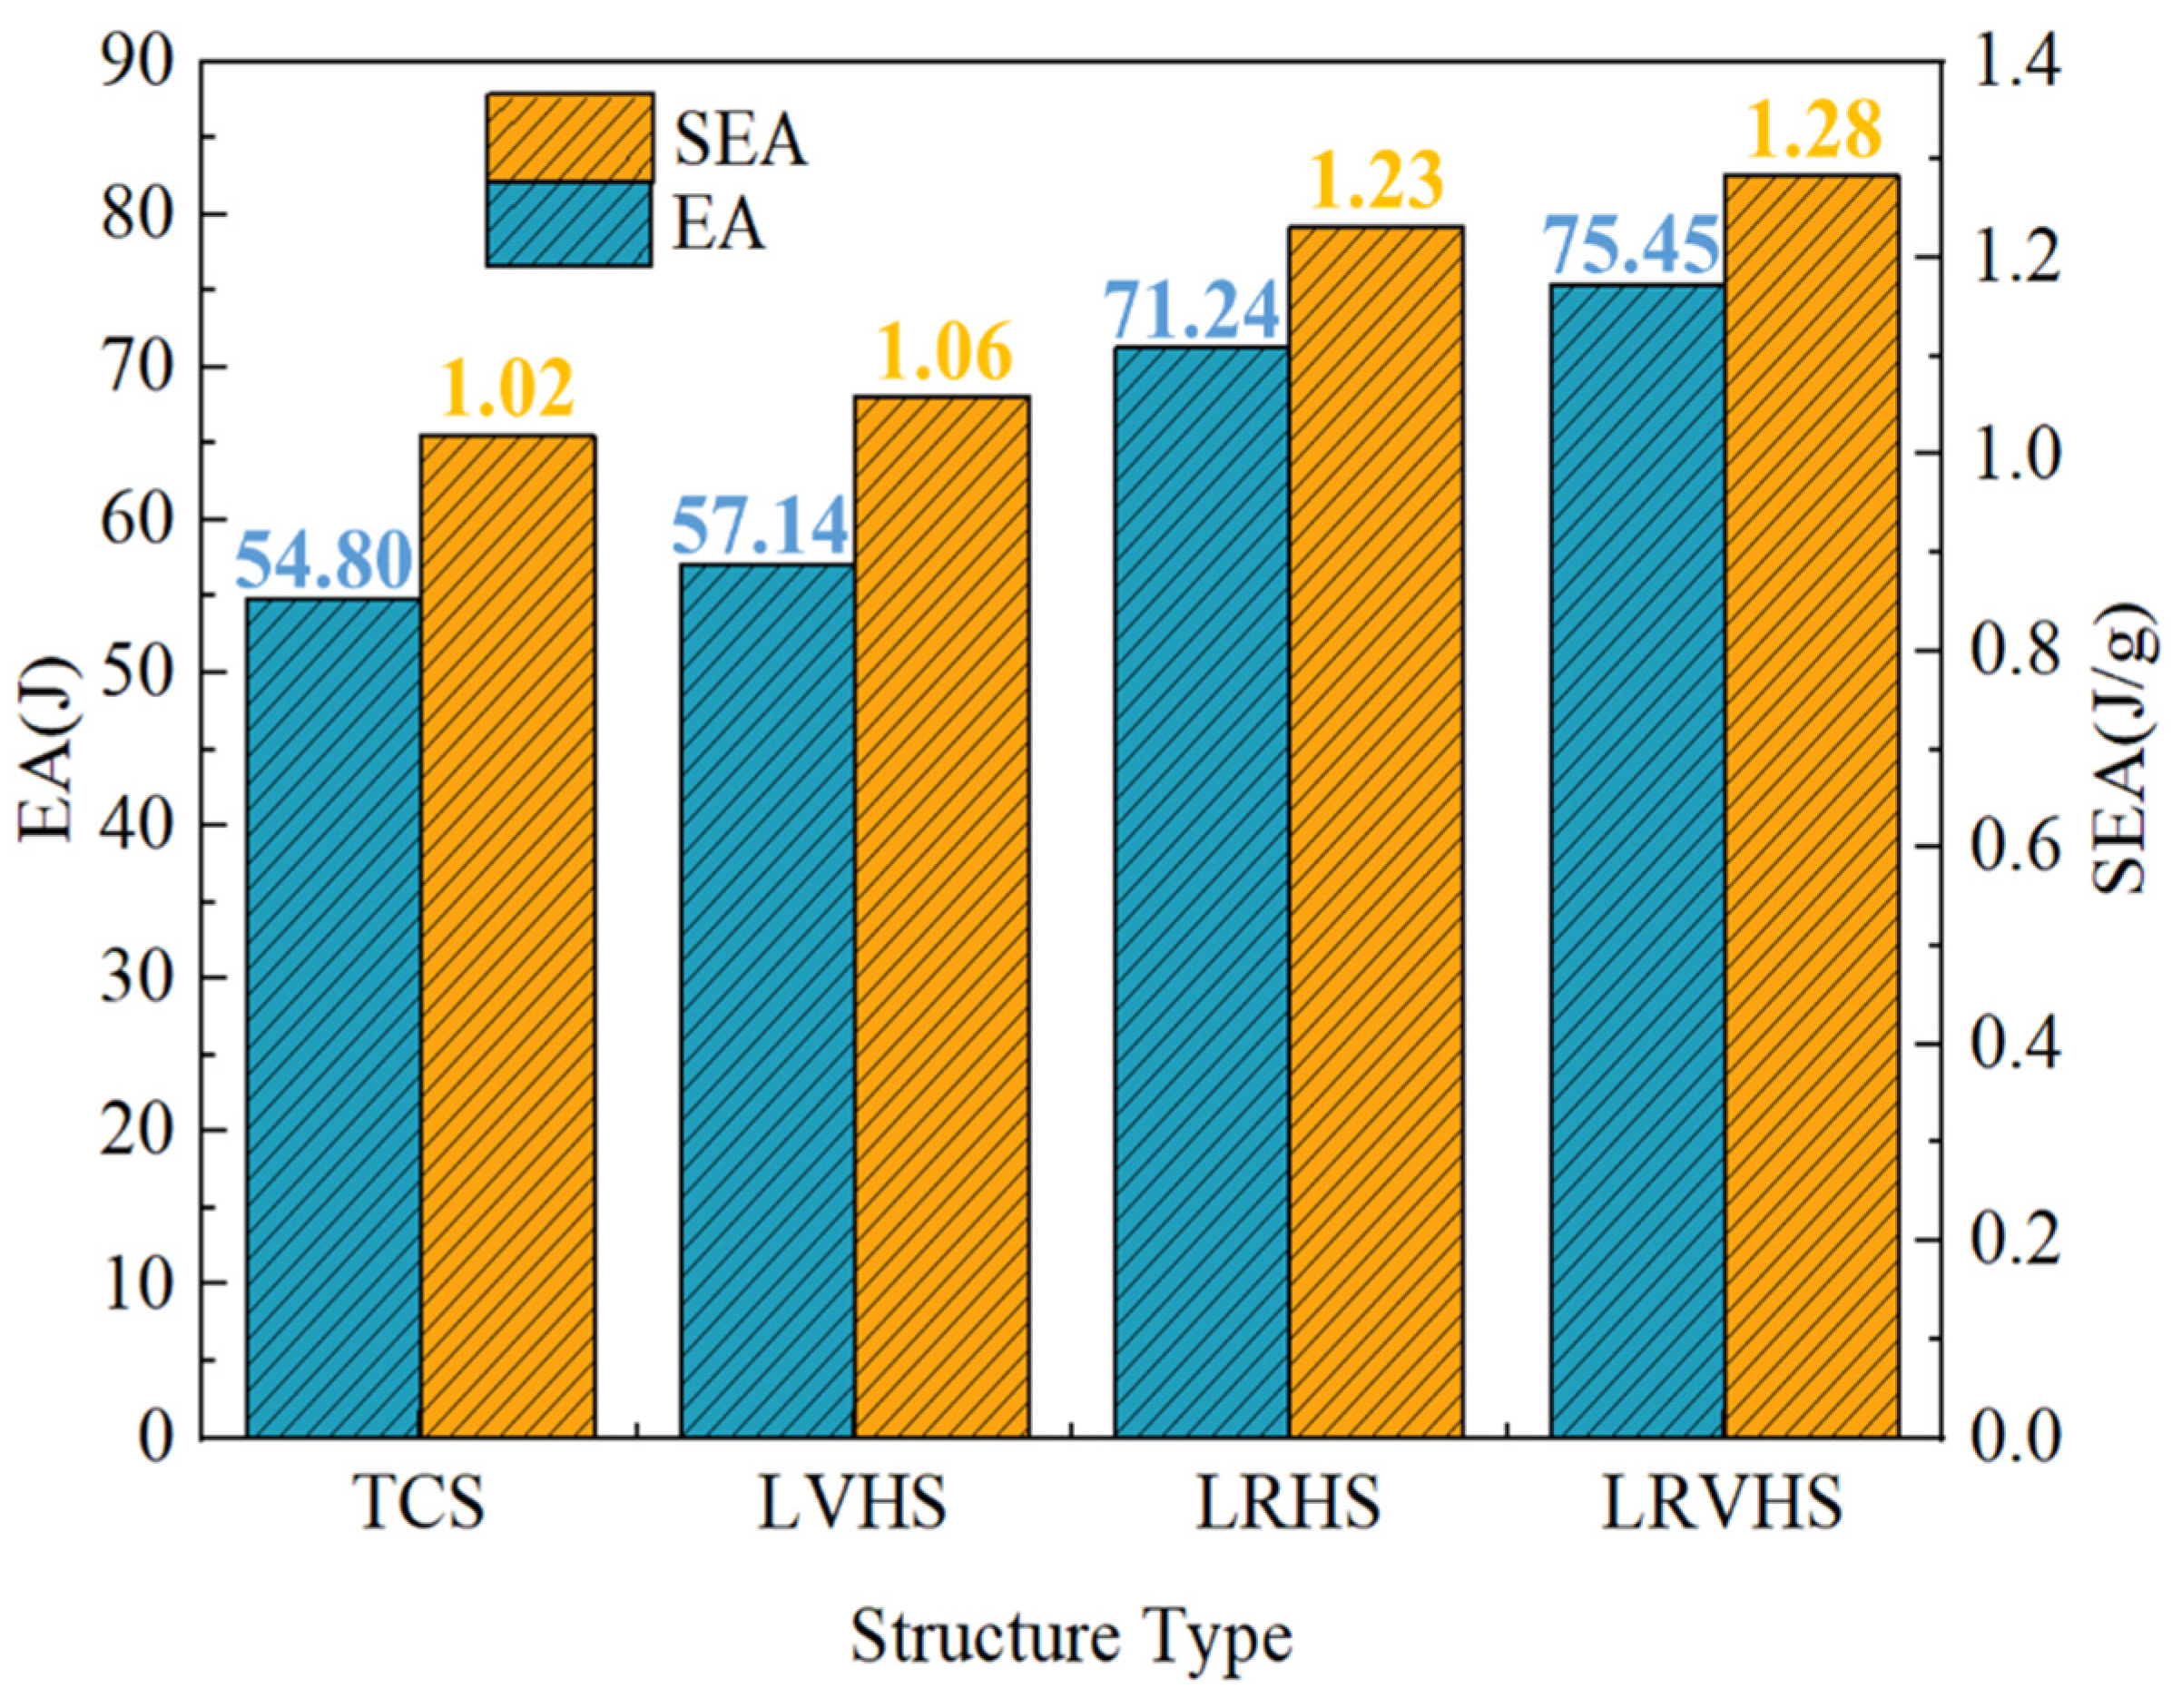
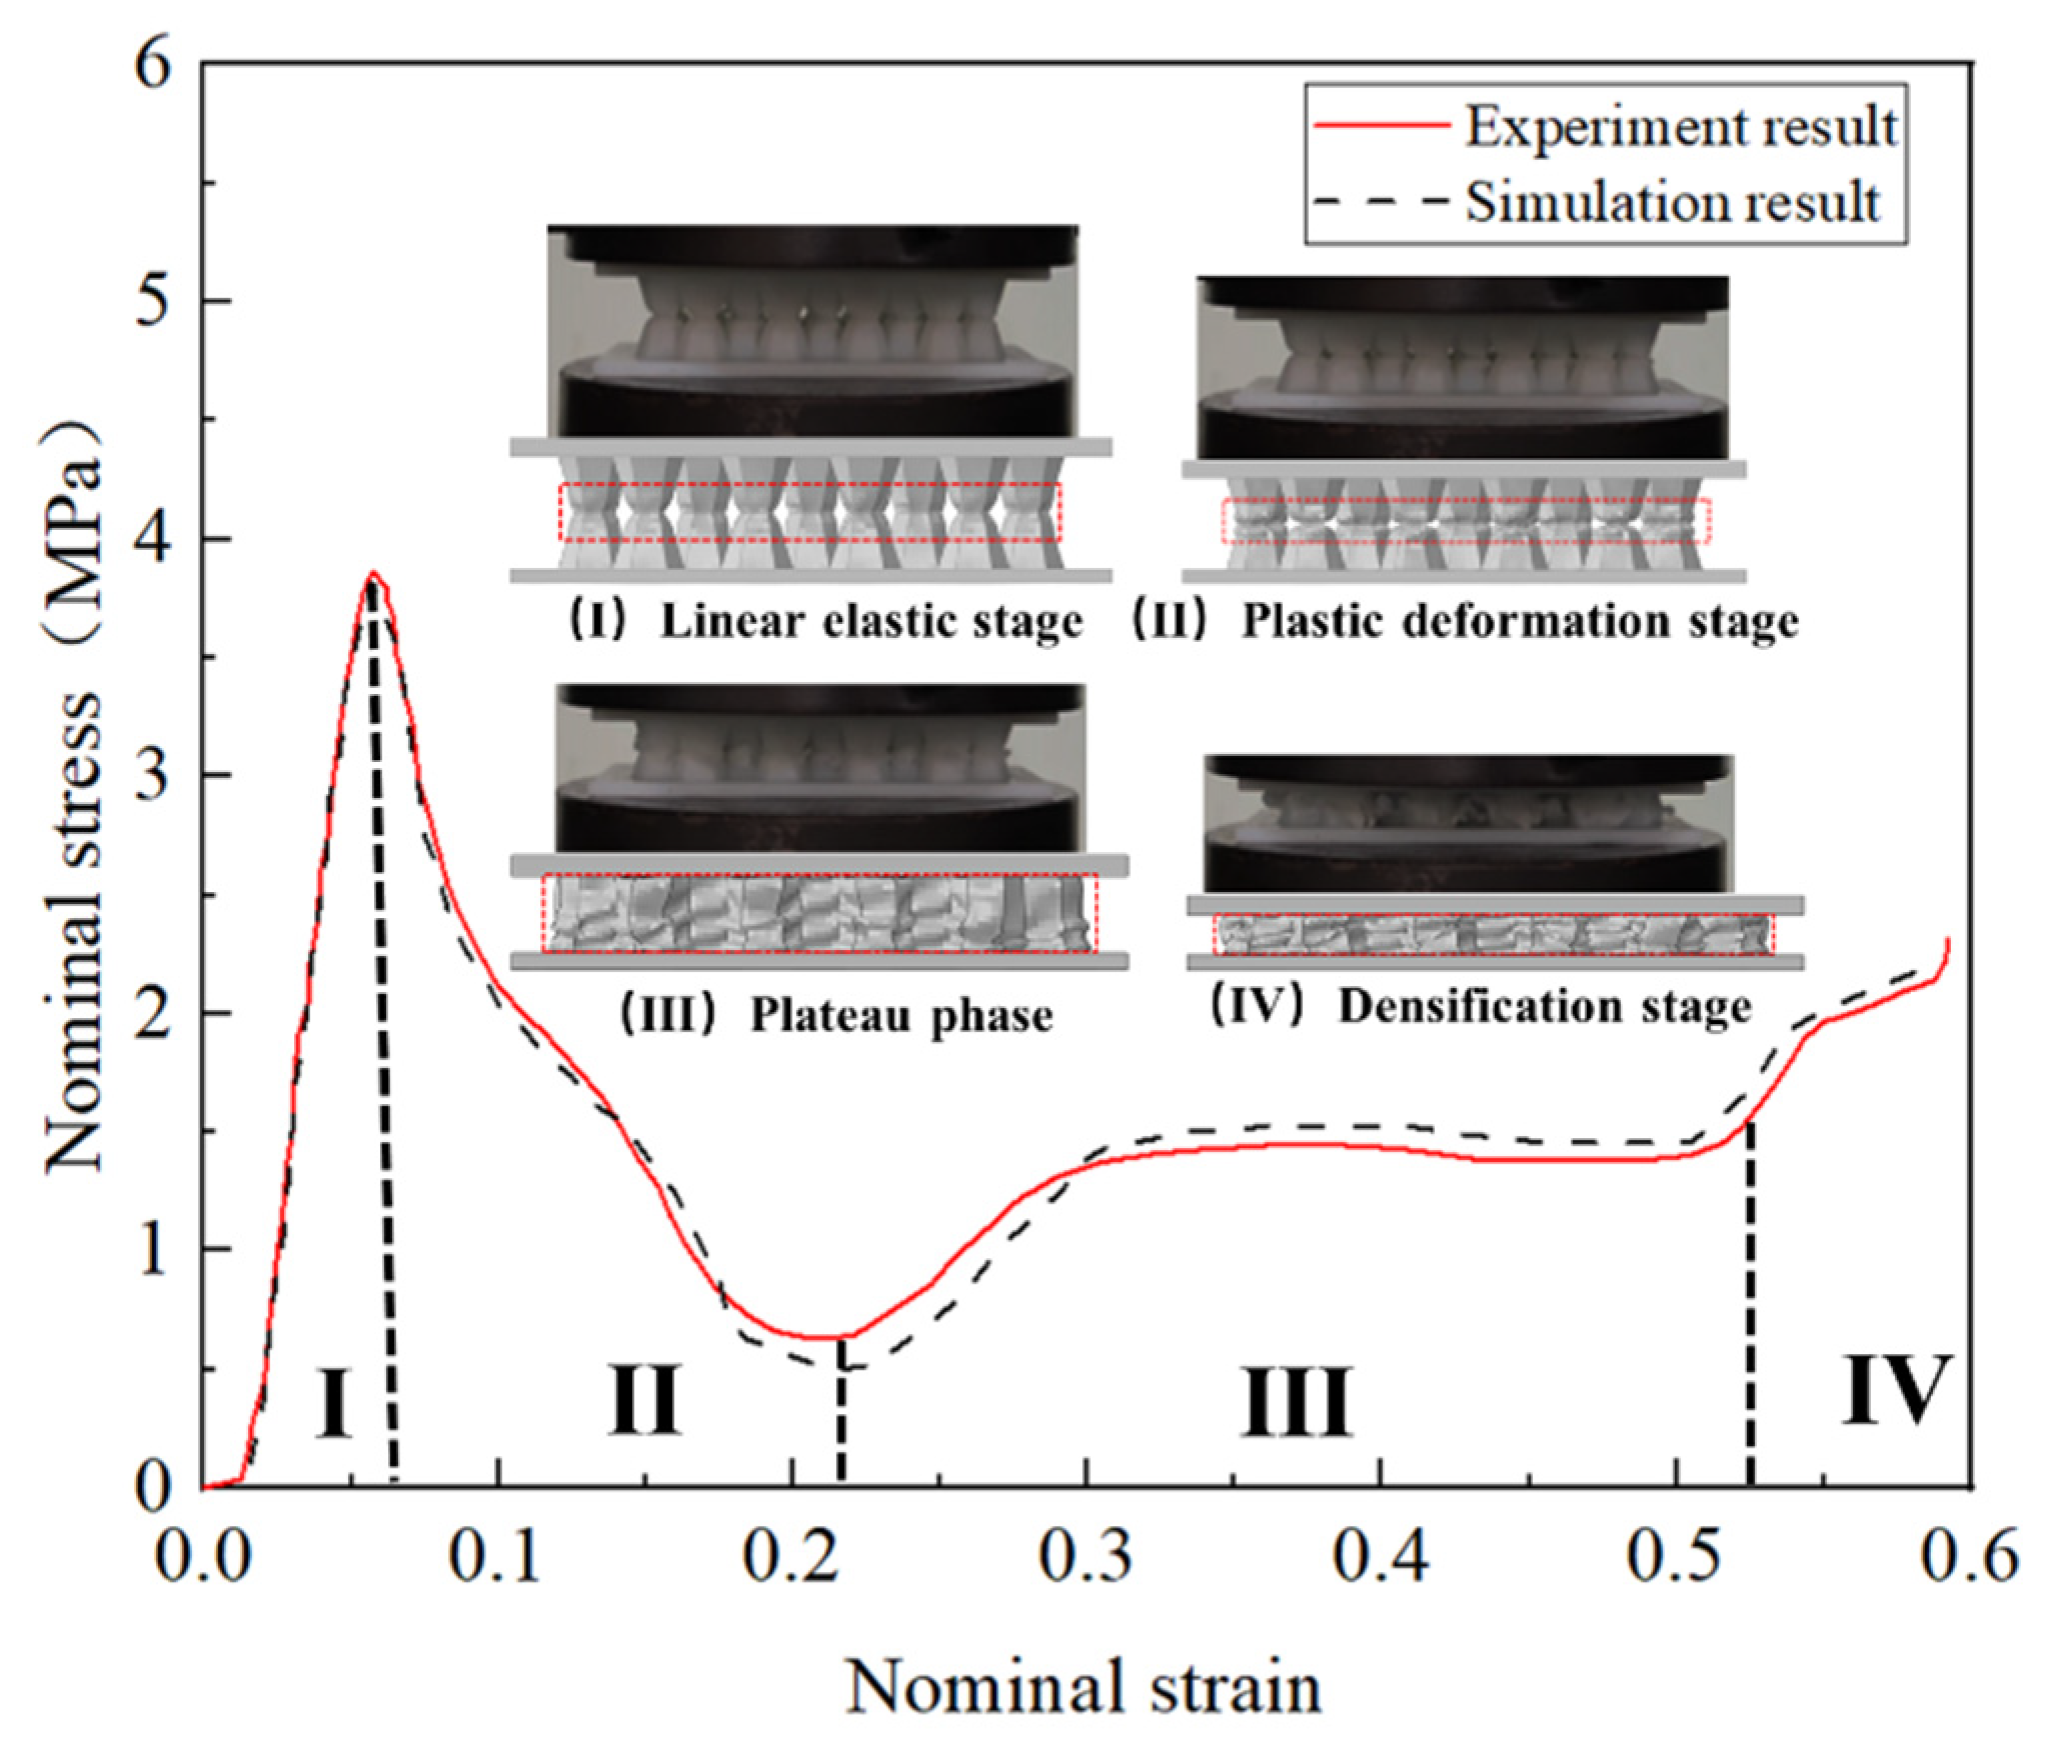
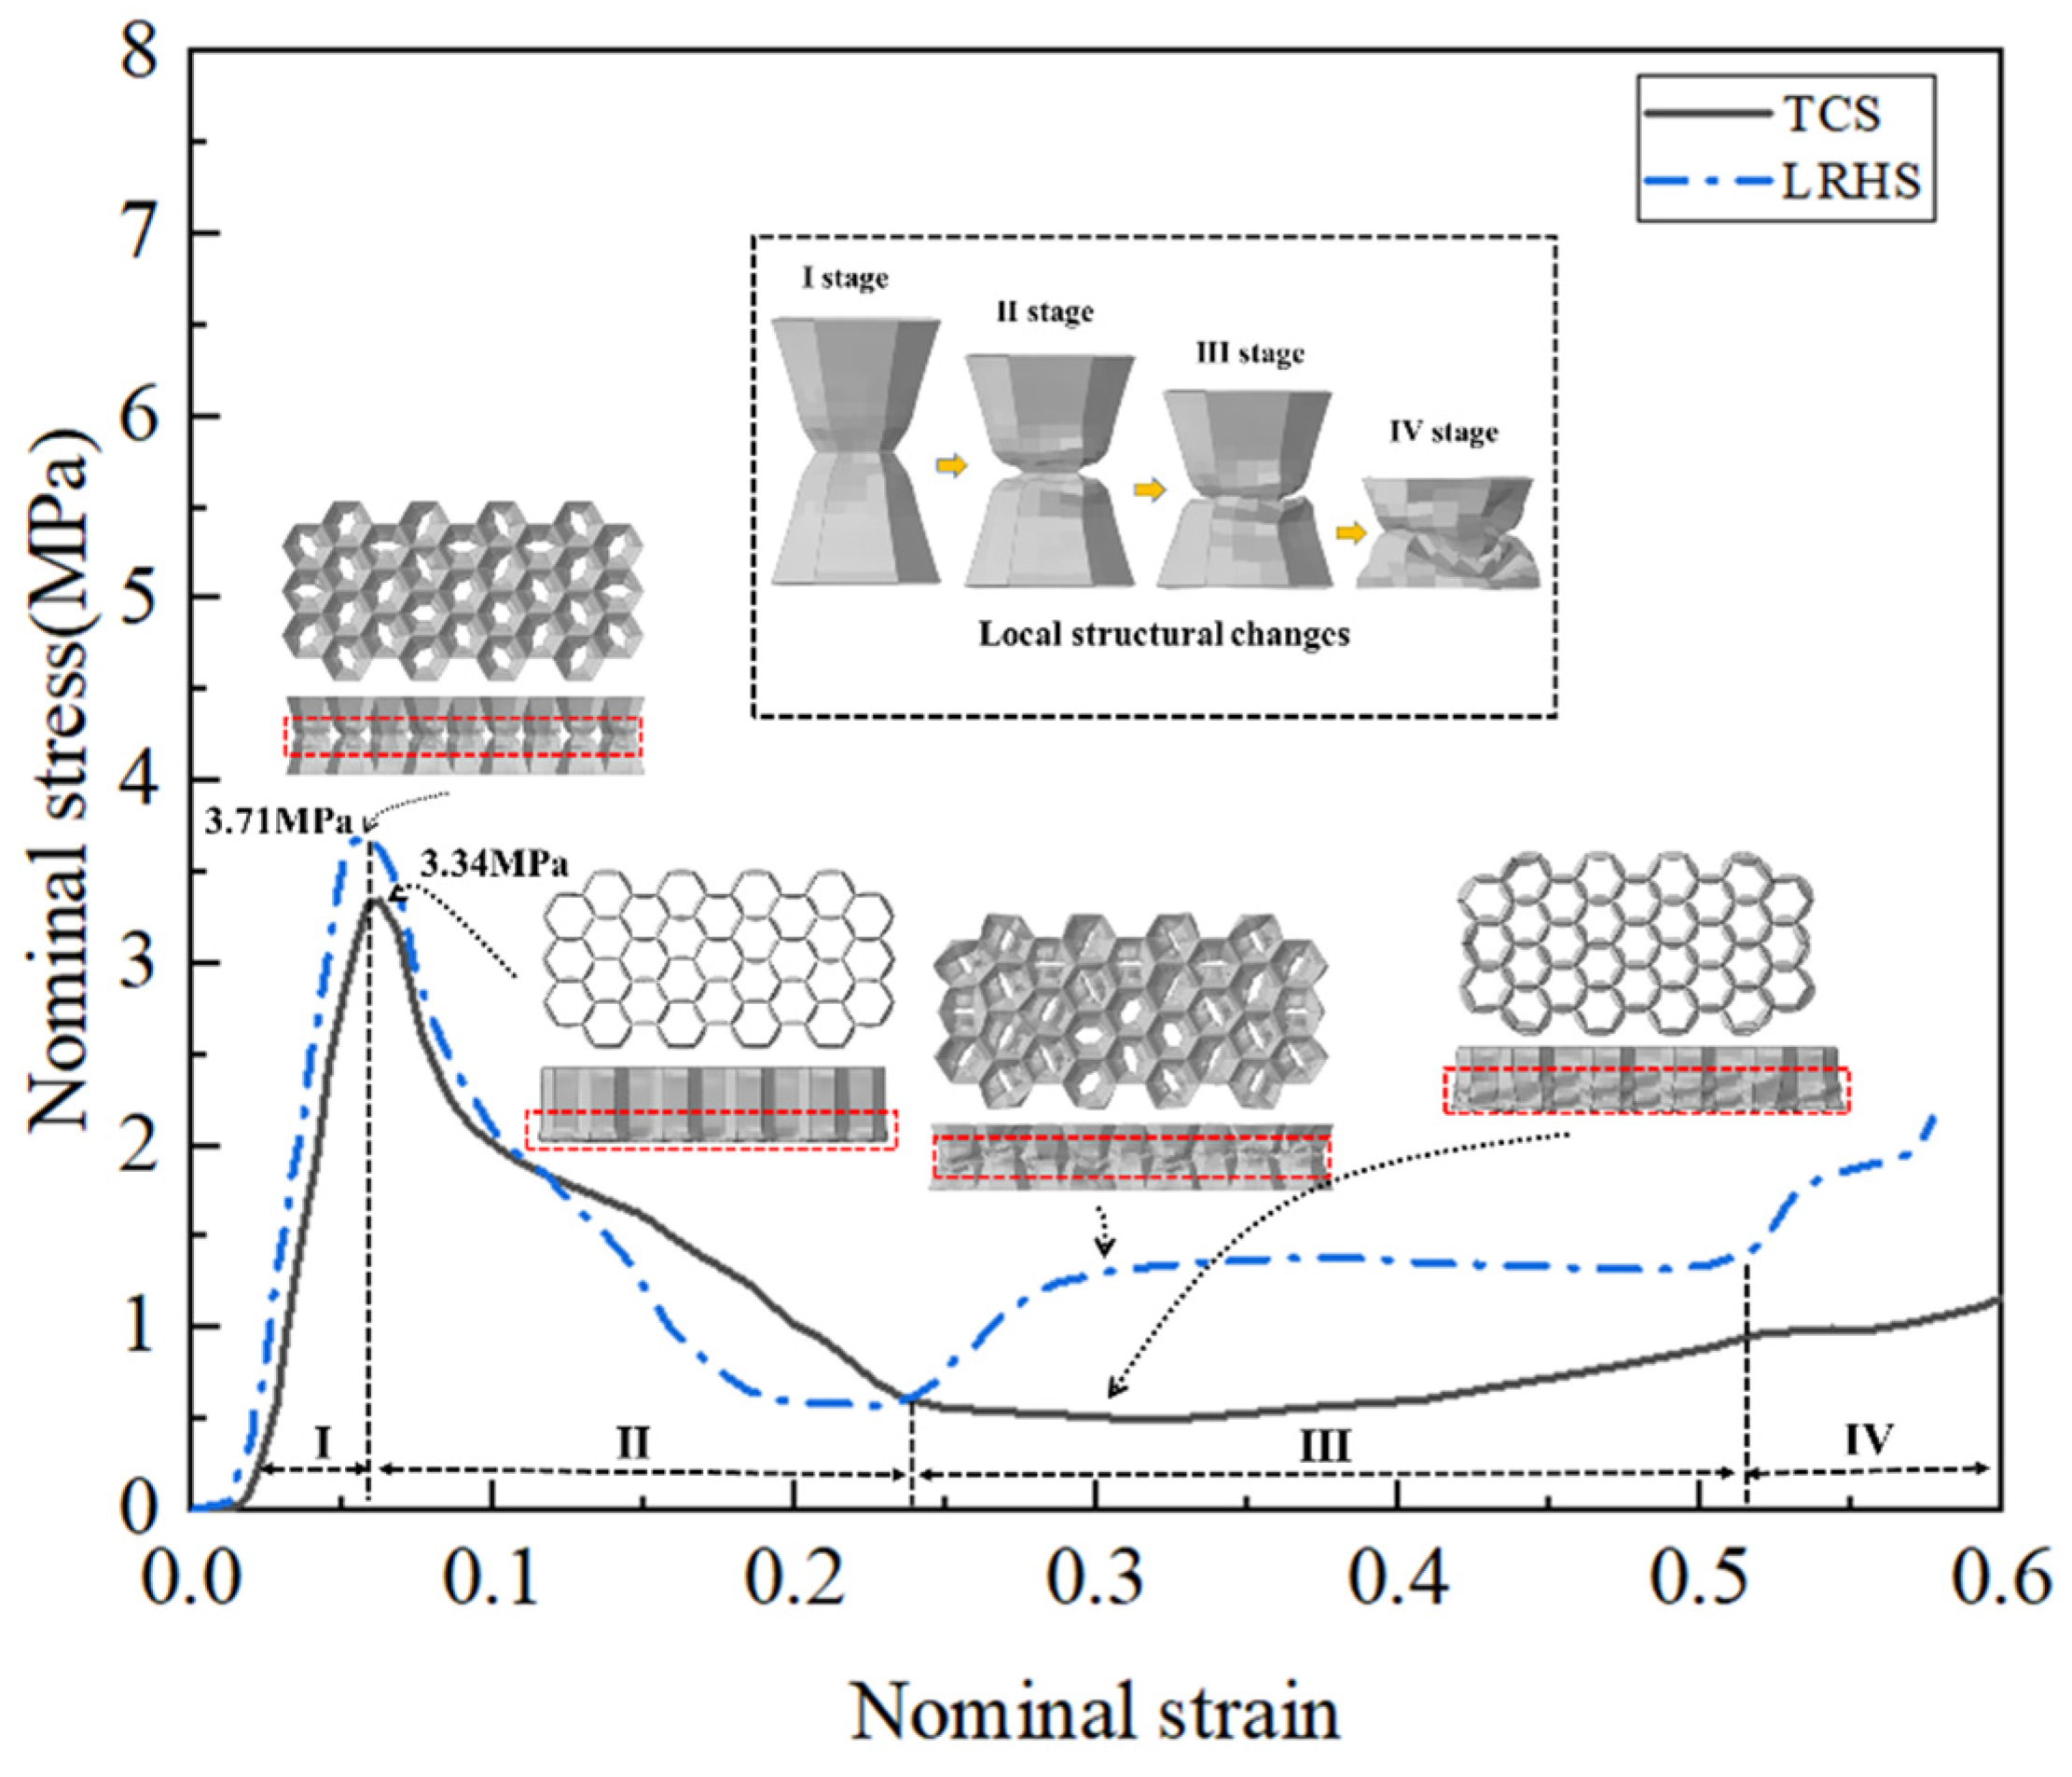
Quasistatic compression experiments with TCS, LVHS, LRHS, and LRVHS were carried out. The LRHS and LRVHS deformation patterns exhibited helical twisting under continuous load application. The nominal stress–strain curves of the TCS, LVHS, LRHS, and LRVHS were analyzed. Compared with TCS, the LRHS had greater peak nominal stress and plateau stress values. The SEA differences between TCS and LRHS and between LVHS and LRVHS were 3.86% and 4.29%, respectively.
(2)
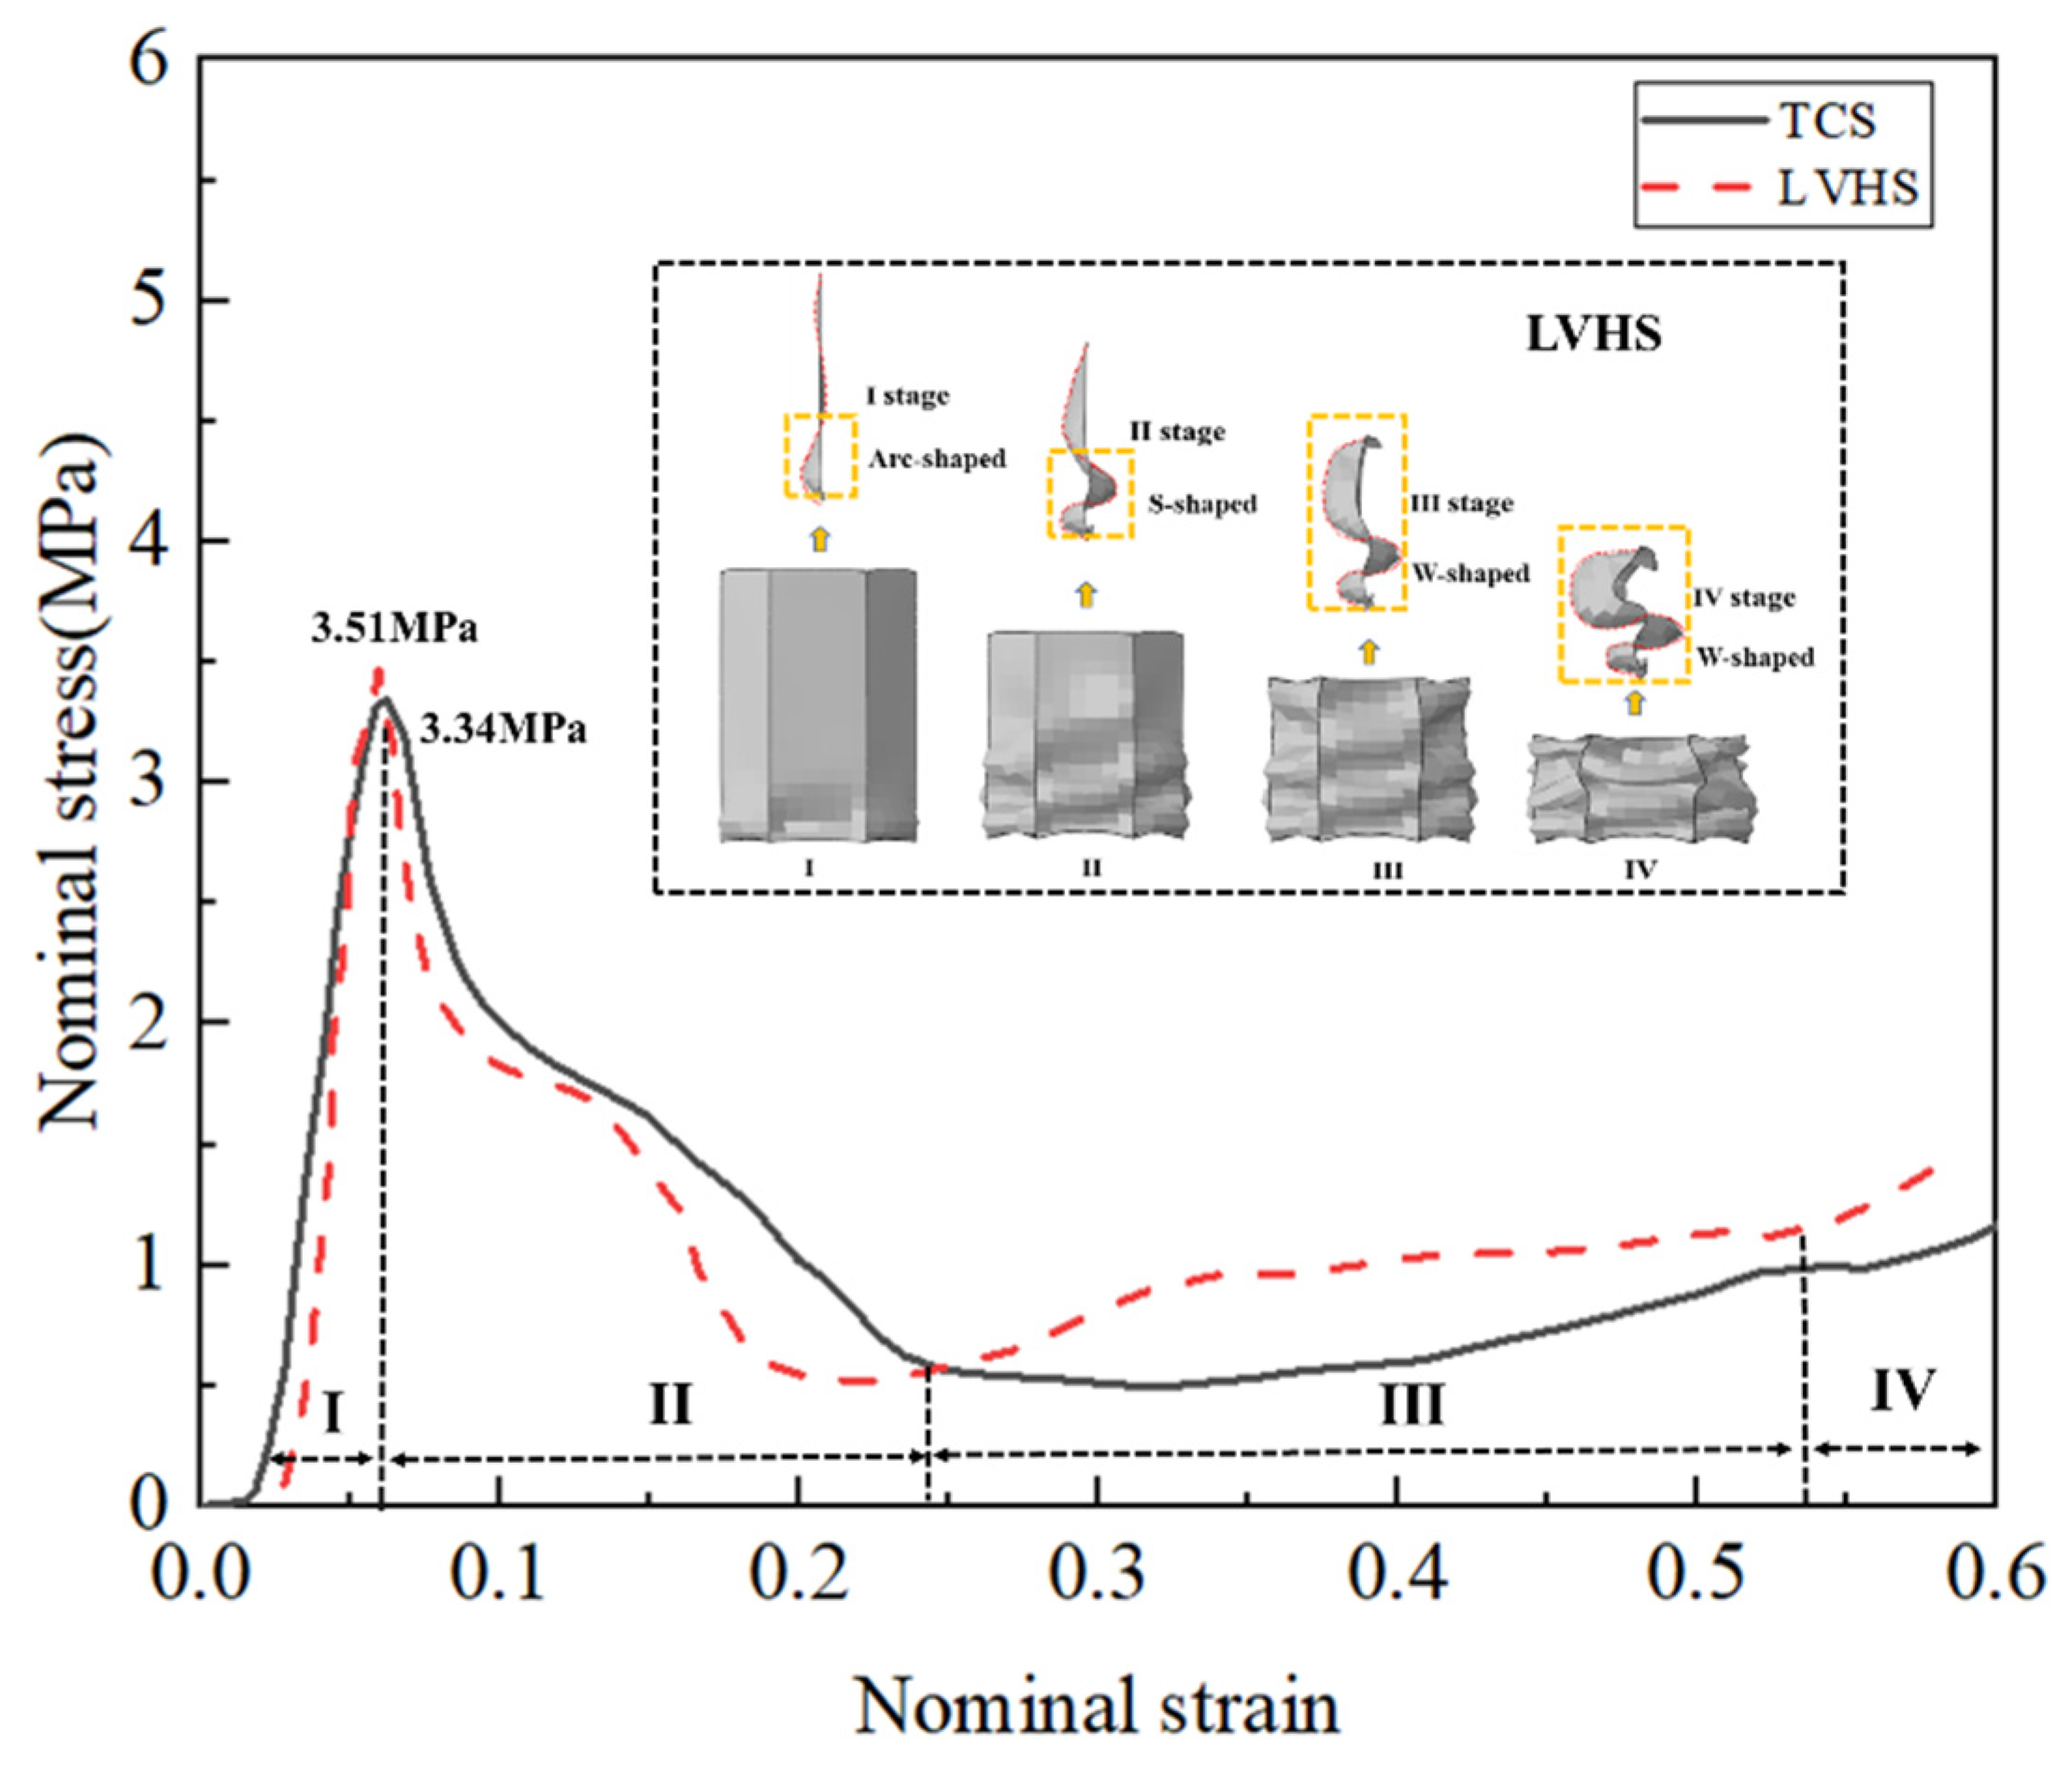
Research on the mechanisms of the lotus root effect and leaf vein effect was carried out. It was found that through the lotus root effect mechanism, the energy absorption of LRHS increased by 51.4%. Compared with that of TCS in the plateau stage, the deformation mechanical mechanism of the LRHS was helical twisting in the plateau stage. Compared with that of TCS, the peak nominal stress of LVHS increased by 4.84% through the mechanism of the leaf vein effect. The leaf vein plate provided greater out-of-plane load-carrying capacity and energy-absorbing effect values for the overall structure through changes in the arc, S-type, and W-type deflections.
(3)
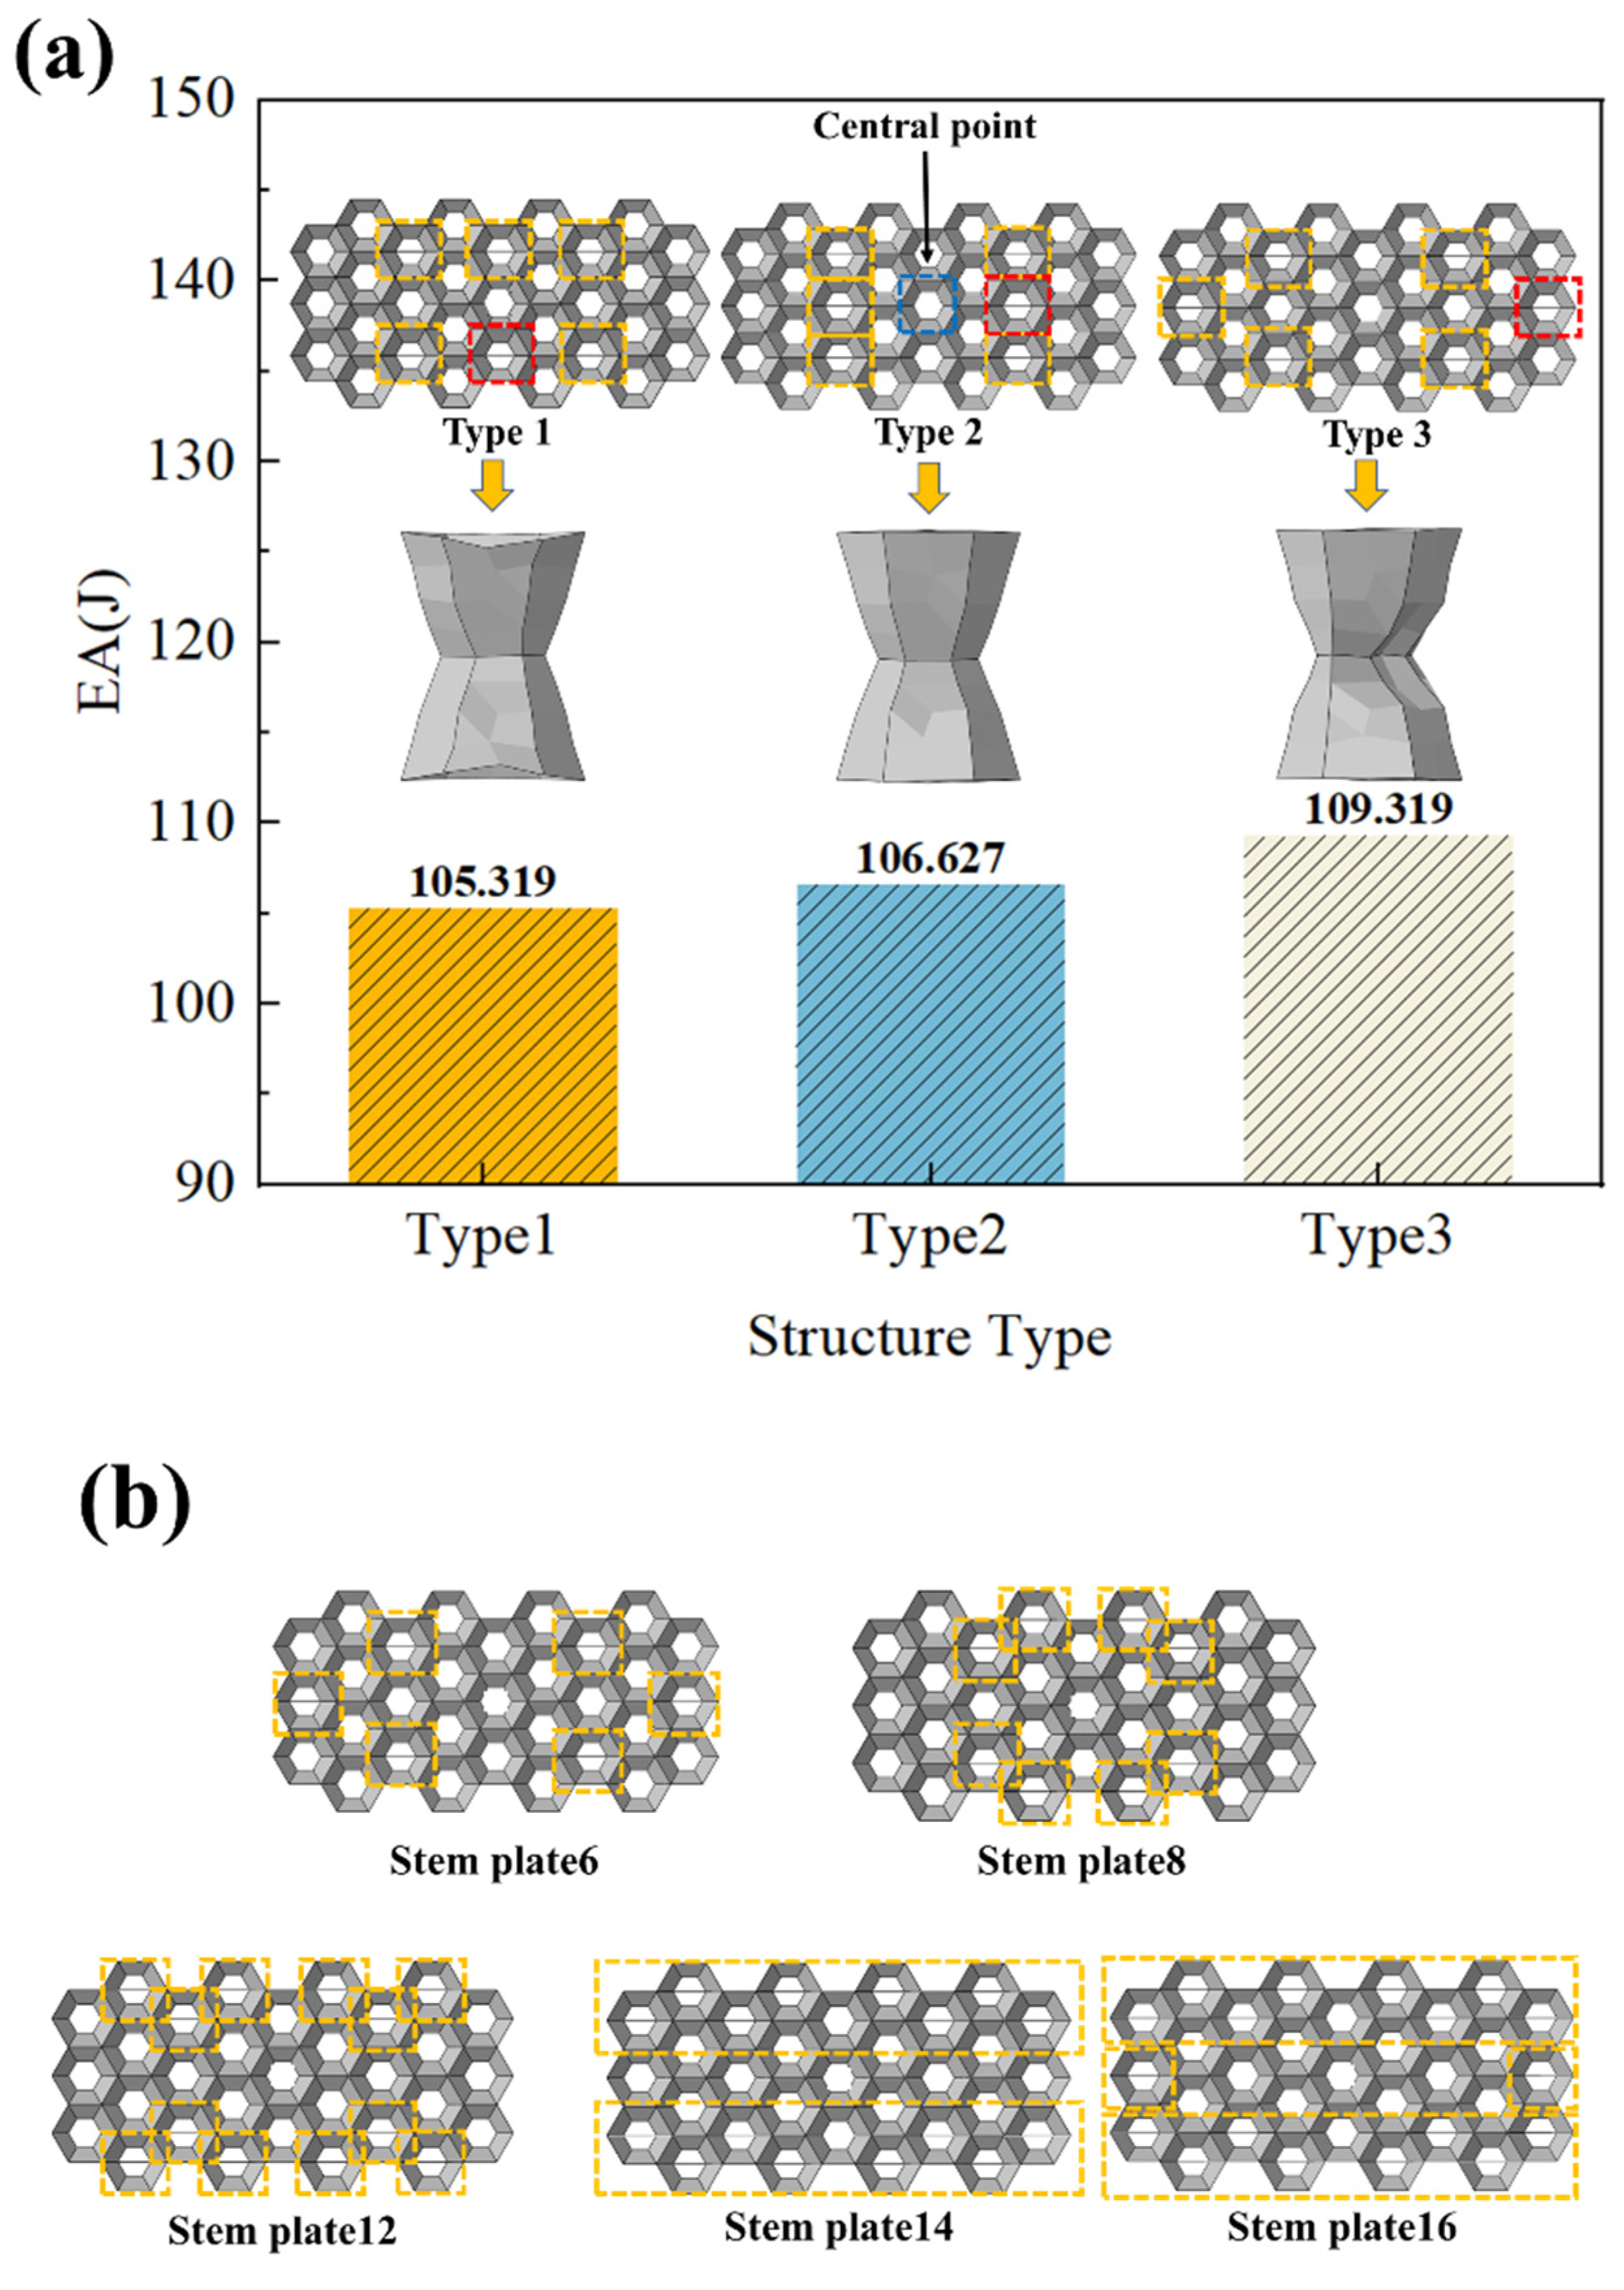
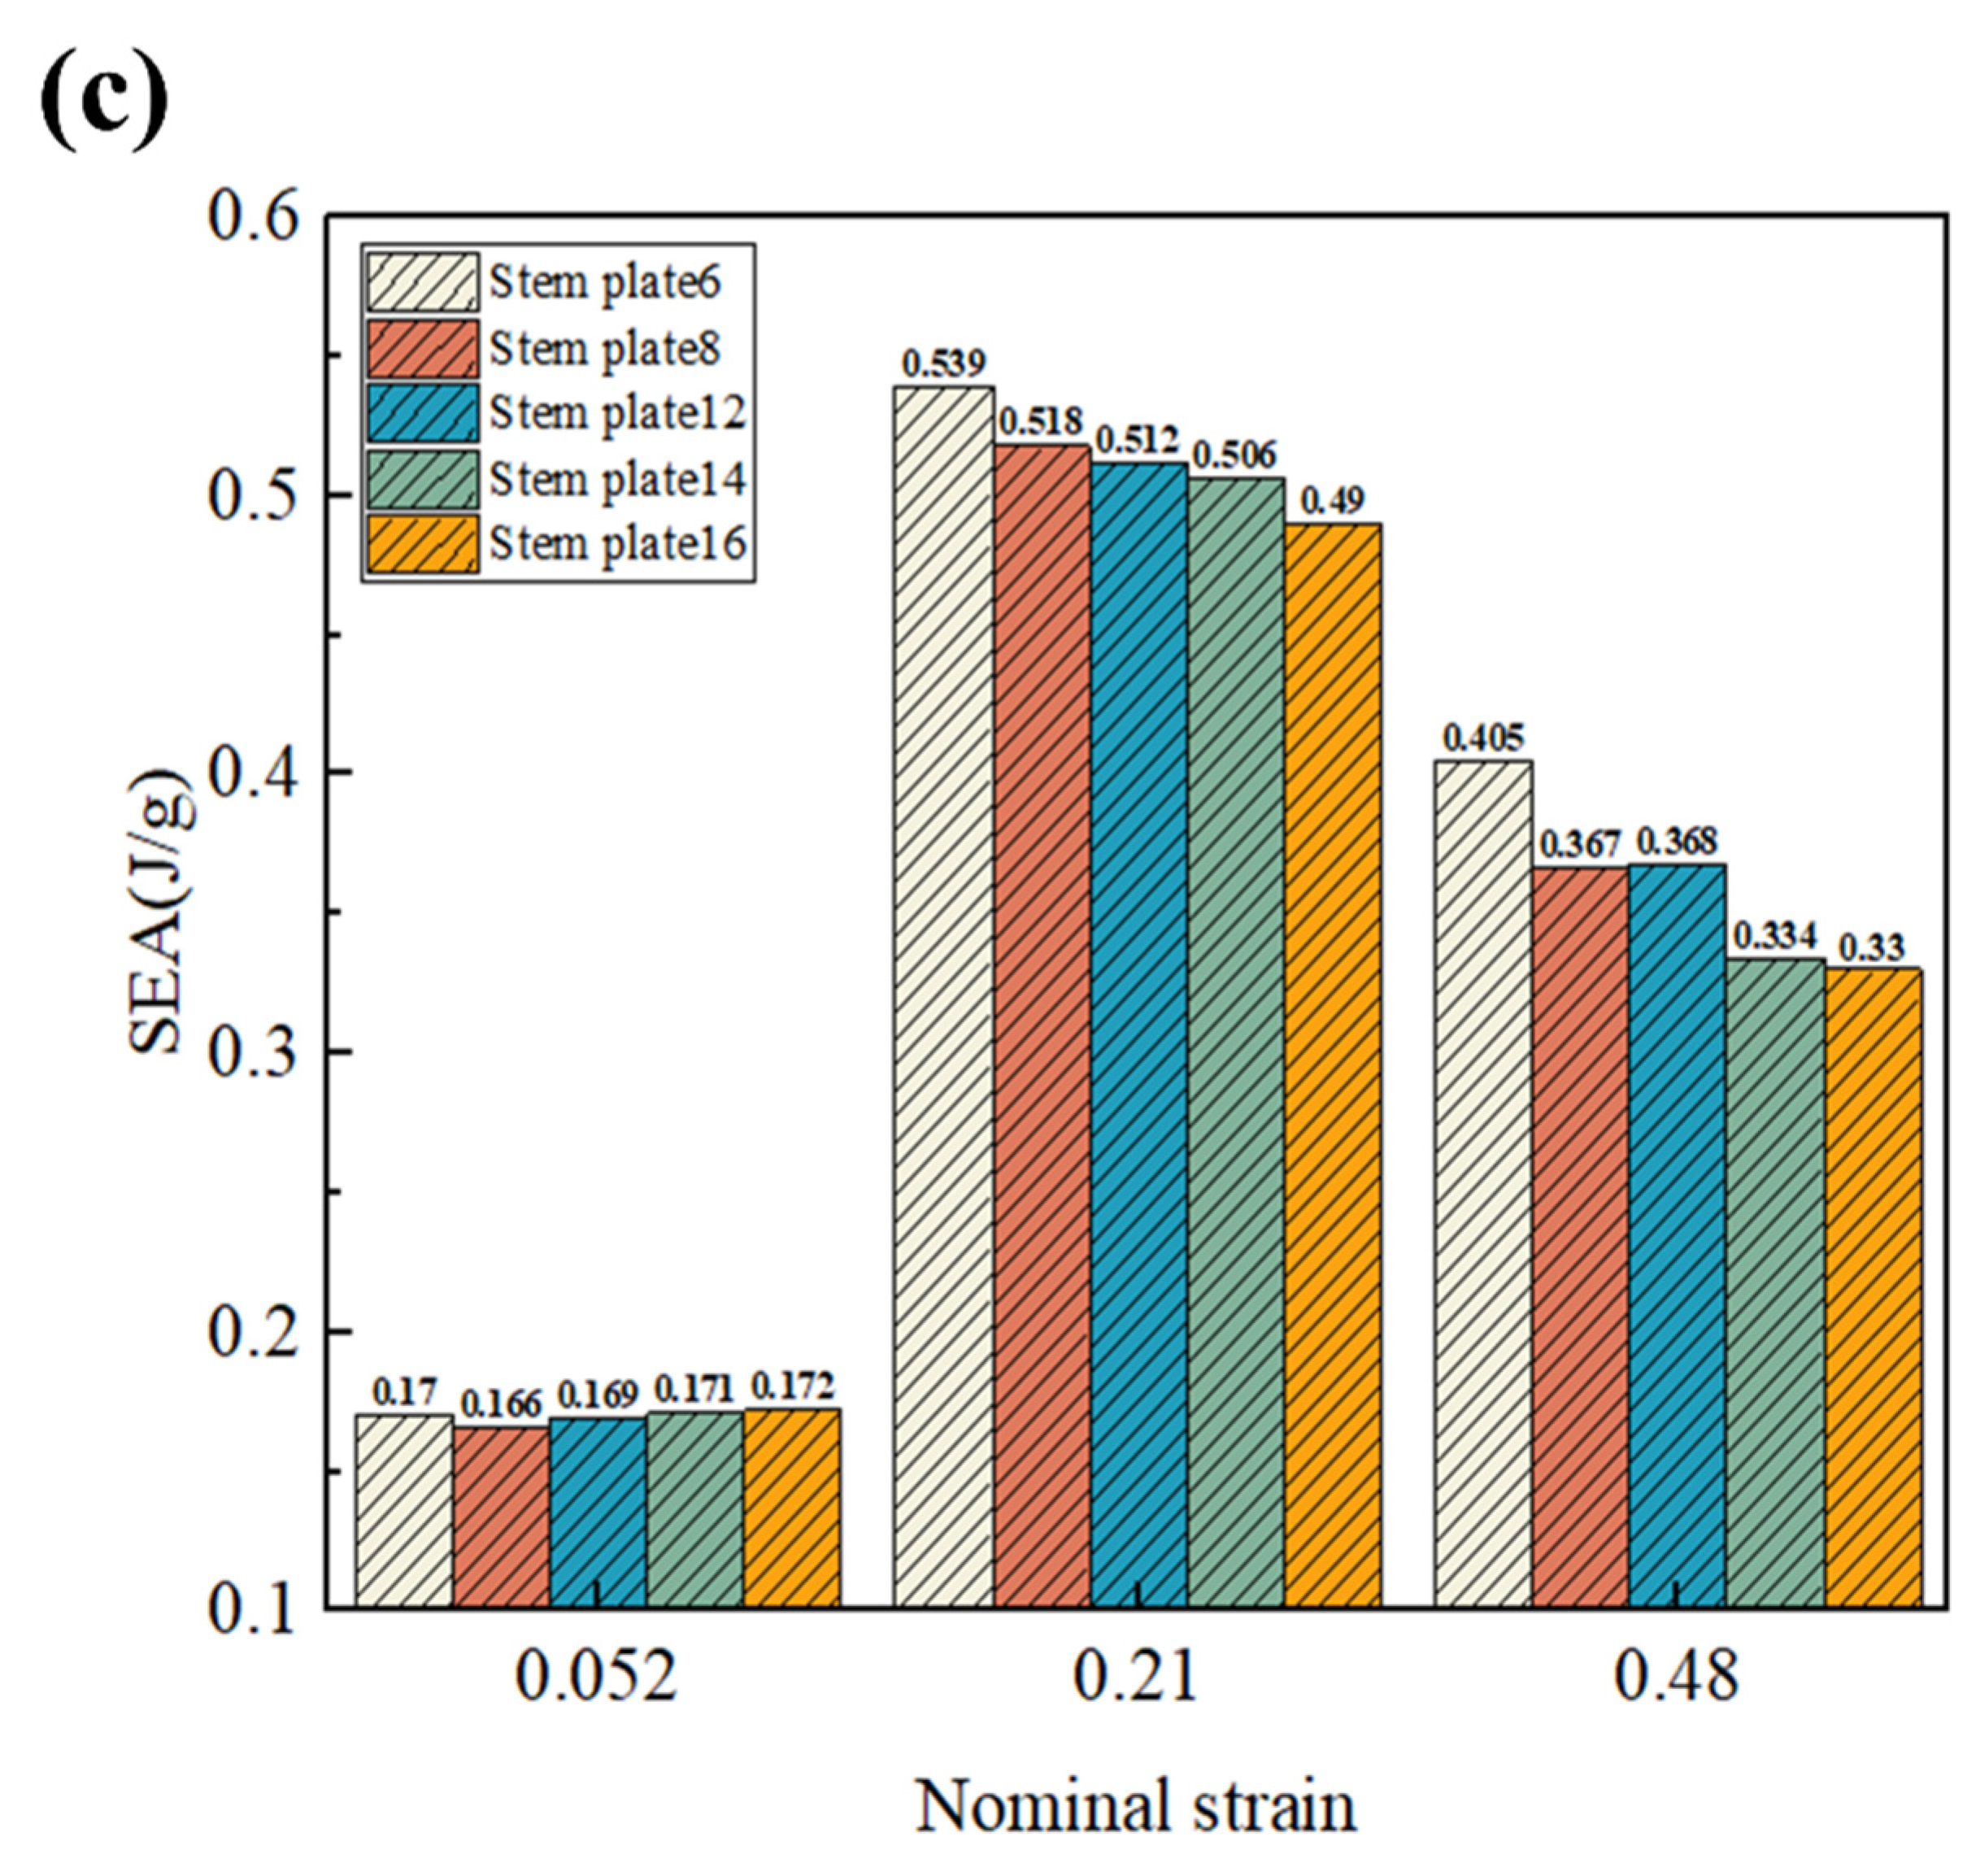
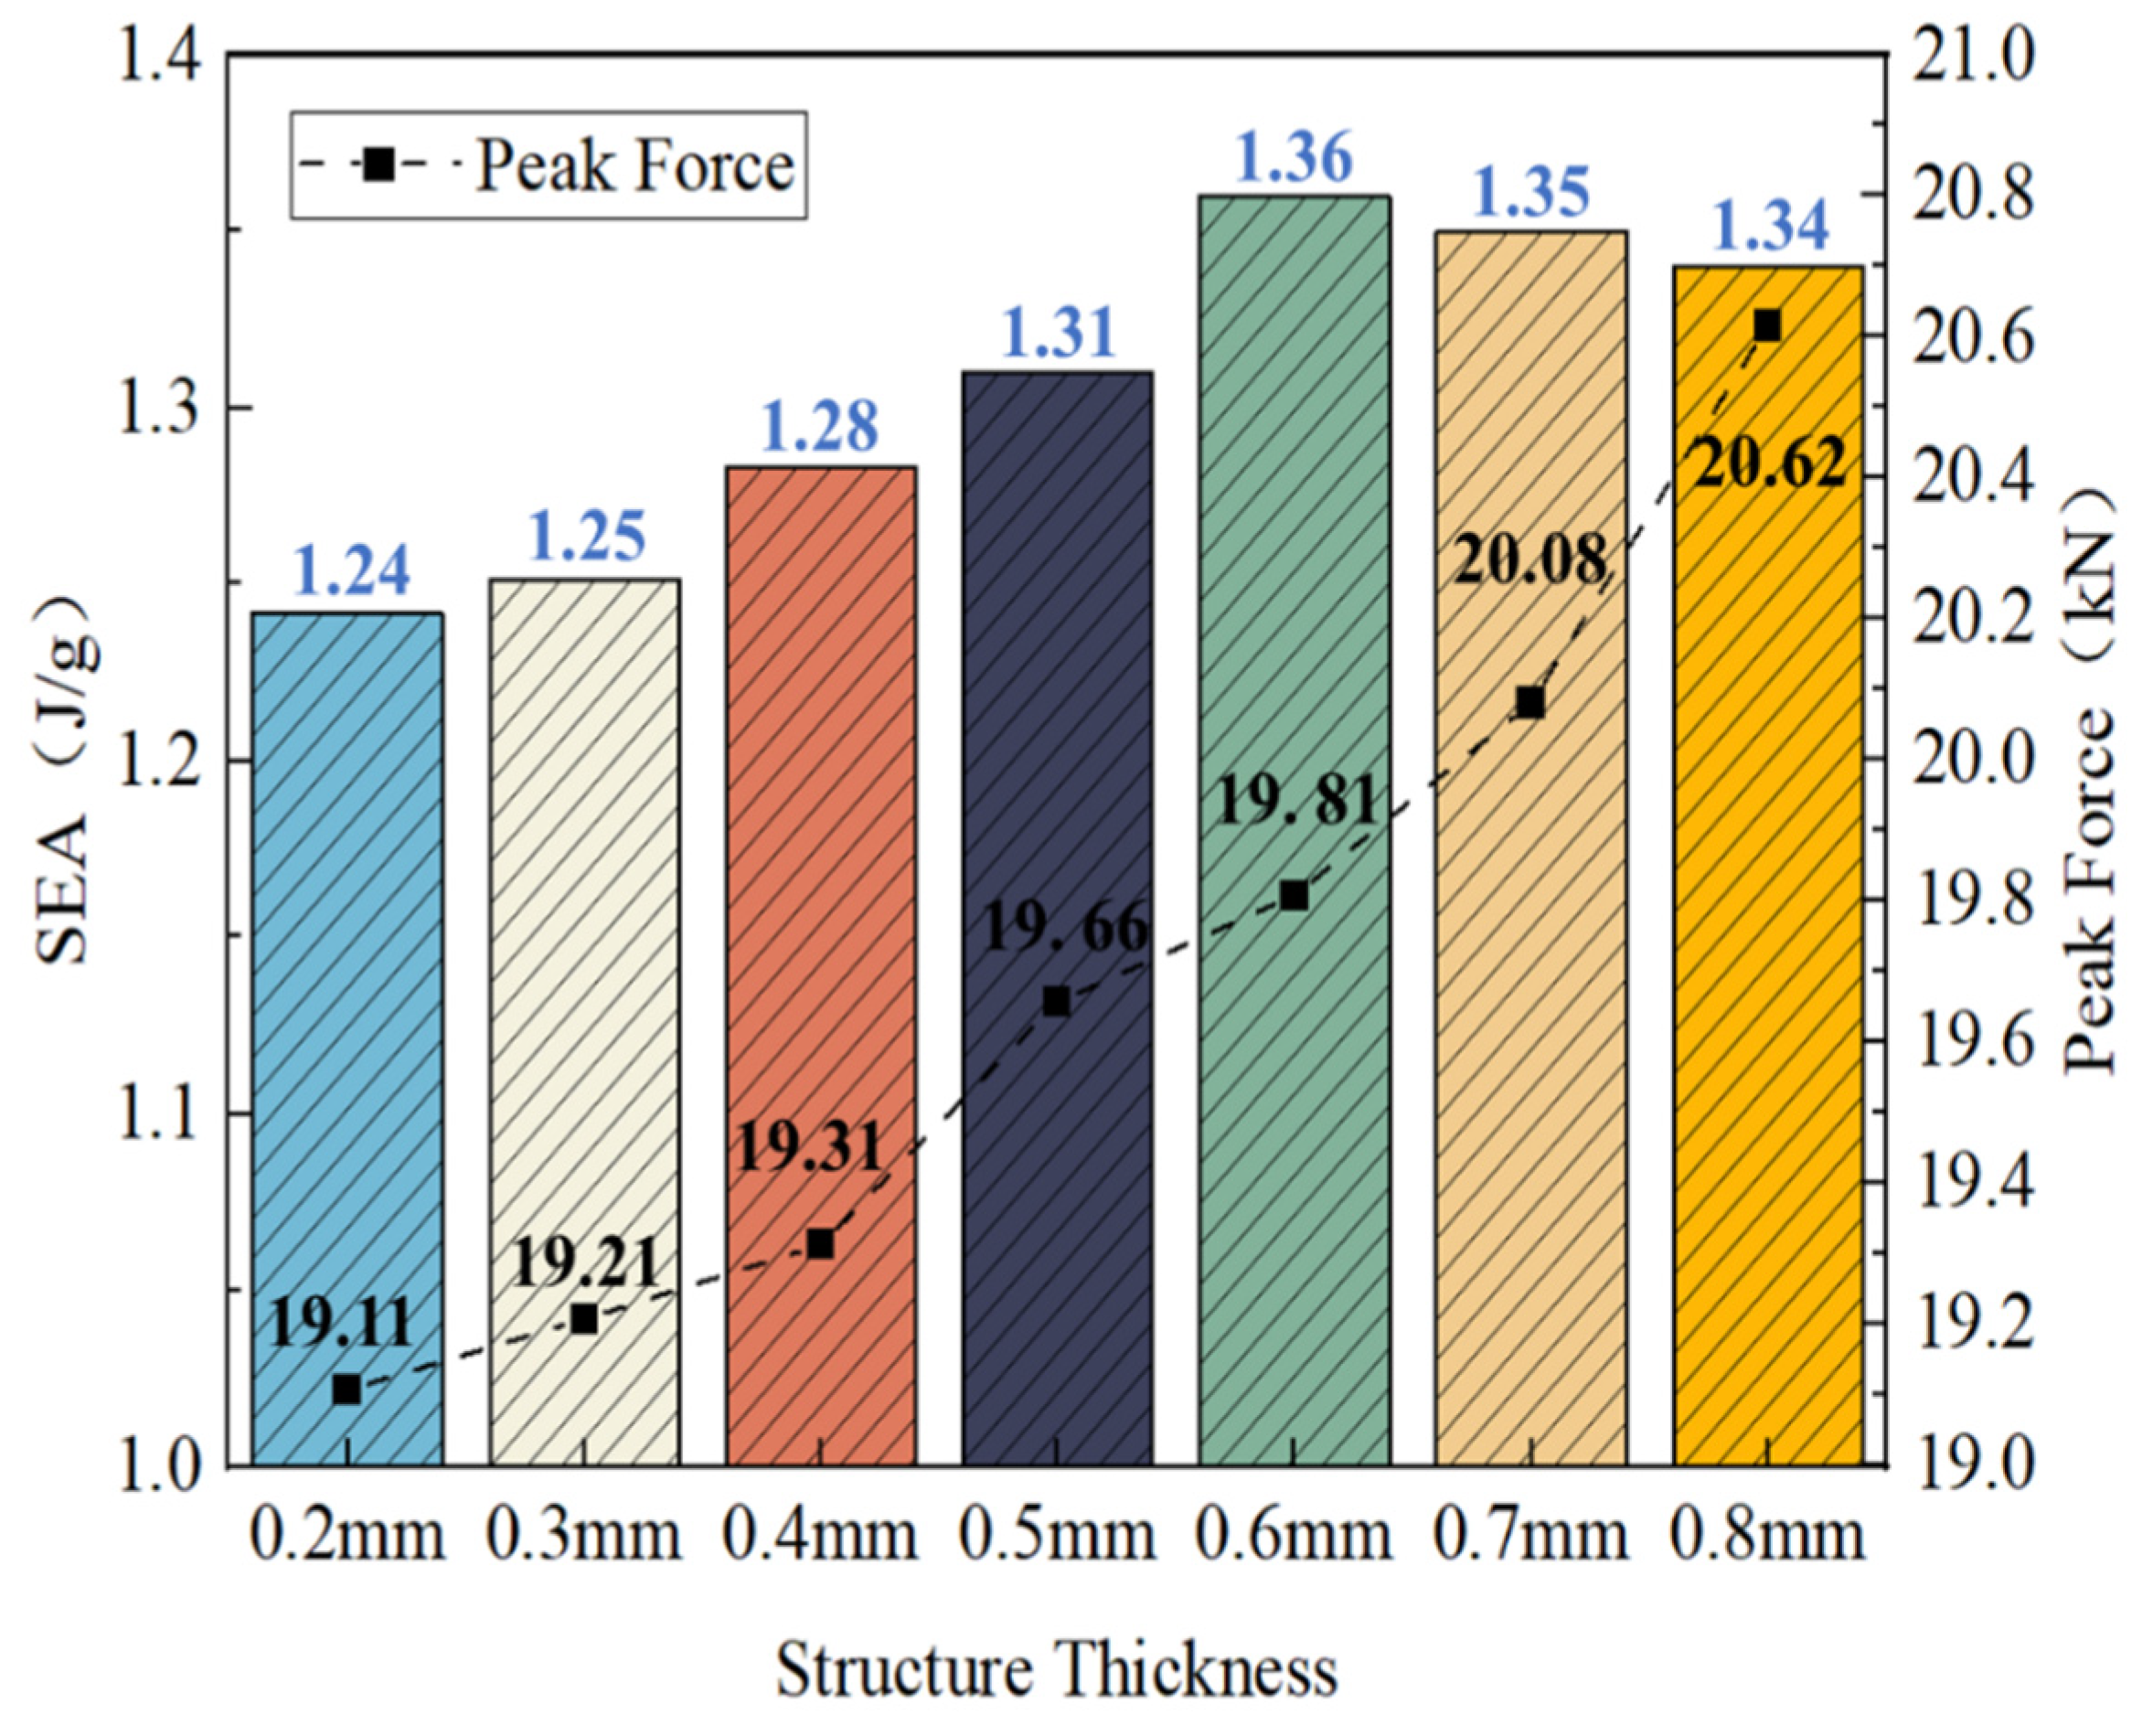
An extensive analysis was conducted to examine the impact of the leaf vein plate position, number, and thickness on the overall mechanical properties of the structure. Optimal energy-absorbing properties were observed when the leaf vein plates were positioned outward. The structure exhibited the most effective SEA when the number of leaf vein plates was 4. Leaf vein plate thickness played a significant role in determining the peak force magnitude, with an increasing trend observed as the thickness increased. Notably, at a leaf vein plate thickness of 0.6 mm, the SEA was enhanced by up to 7.3% compared to that at other thicknesses. However, above a thickness of 0.6 mm, the structure’s energy absorption decreased with increasing leaf vein plate thickness.

Author Contributions

W.C.: investigation, validation, writing—original draft preparation, and formal analysis. C.C.: formal analysis and writing—original draft preparation. Y.Z.: writing—review and editing, and validation. P.L. and M.L.: writing—review and editing. X.L.: writing—review and editing, and supervision. All authors have read and agreed to the published version of the manuscript.

Funding

The research project was supported by the National Natural Science Foundation of China (grant numbers: 52201334; 51979213).

Data Availability Statement

The authors declare that the data presented in this study are available upon request.

Conflicts of Interest

The authors declare no conflicts of interest.

References

  1. Zeng, S.; Liu, G.; He, W.; Wang, J.; Ye, J.; Sun, C. Design and performance prediction of selective laser melted porous structure for femoral stem. Mater. Today Commun. 2023, 34, 104987. [Google Scholar] [CrossRef]
  2. Zhang, M.K.; Li, J.W.; Liao, X.; Xu, M.Z.; Shi, W.Q. Influence of cycle number on the compression behavior of nonlinear periodi-cally gradient porous structures produced by laser powder bed fusion. Mater. Des. 2022, 223, 111257. [Google Scholar] [CrossRef]
  3. Tüzemen, M.; Salamcı, E.; Ünal, R. Additive manufacturing design approach to strut-based functionally graded porous structures for personalized implants. J. Manuf. Process. 2022, 84, 1526–1540. [Google Scholar] [CrossRef]
  4. Wei, L.L.; Zhao, X.; Yu, Q.; Zhang, W.D.; Zhu, G.H. In-plane compression behaviors of the auxetic star honeycomb: Experi-mental and numerical simulation. Aerosp. Sci. Technol. 2021, 115, 106797. [Google Scholar] [CrossRef]
  5. Xue, Z.; Hutchinson, J.W. Preliminary assessment of sandwich plates subject to blast loads. Int. J. Mech. Sci. 2003, 45, 687–705. [Google Scholar] [CrossRef]
  6. Yang, N.; Du, C.-F.; Wang, S.; Yang, Y.; Zhang, C. Mathematically defined gradient porous materials. Mater. Lett. 2016, 173, 136–140. [Google Scholar] [CrossRef]
  7. Liverani, E.; Fortunato, A. Stiffness prediction and deformation analysis of Cobalt-Chromium lattice structures: From periodic to functionally graded structures produced by additive manufacturing. J. Manuf. Process. 2021, 68, 104–114. [Google Scholar] [CrossRef]
  8. Niknam, H.; Akbarzadeh, A. Graded lattice structures: Simultaneous enhancement in stiffness and energy absorption. Mater. Des. 2020, 196, 109129. [Google Scholar] [CrossRef]
  9. Li, Q.Q.; Zhan, L.Y.; Miao, X.J.; Hu, L.; Li, E.; Zou, T.F. Morning glory-inspired lattice structure with negative Poisson’s ratio effect. Int. J. Mech. Sci. 2022, 232, 107643. [Google Scholar] [CrossRef]
  10. Liu, H.; Chen, L.; Jiang, Y.; Zhu, D.; Zhou, Y.; Wang, X. Multiscale optimization of additively manufactured graded non-stochastic and stochastic lattice structures. Compos. Struct. 2023, 305, 116546. [Google Scholar] [CrossRef]
  11. Birman, V.; Kardomateas, G.A. Review of current trends in research and applications of sandwich structures. Compos. Part B Eng. 2018, 142, 221–240. [Google Scholar] [CrossRef]
  12. Zeng, C.J.; Liu, L.W.; Bian, W.F.; Leng, J.S.; Liu, Y.J. Compression behavior and energy absorption of 3D printed continuous fi-ber reinforced composite honeycomb structures with shape memory effects. Addit. Manuf. 2021, 38, 101842. [Google Scholar]
  13. Zhang, T.; Cheng, X.; Guo, C.; Dai, N. Toughness-improving design of lattice sandwich structures. Mater. Des. 2023, 226, 111600. [Google Scholar] [CrossRef]
  14. Zhao, W.Q.; Liu, T.; Chen, L.M.; Guo, Y.G.; Pan, X.; Zhu, S.W.; Li, W.G. Influence of density gradient and hybrid effect on qua-sistatic axial crushing behavior of lattice cylindrical structures. Thin-Walled Struct. 2023, 186, 110720. [Google Scholar] [CrossRef]
  15. Nemat-Nasser, S.; Kang, W.J.; McGee, J.D.; Guo, W.-G.; Isaacs, J.B. Experimental investigation of energy-absorption characteristics of components of sandwich structures. Int. J. Impact Eng. 2007, 34, 1119–1146. [Google Scholar] [CrossRef]
  16. Ivañez, I.; Fernandez-Cañadas, L.M.; Sanchez-Saez, S. Compressive deformation and energy-absorption capability of aluminium honeycomb core. Compos. Struct. 2017, 174, 123–133. [Google Scholar] [CrossRef]
  17. Guo, K.J.; Liu, X.F.; Ren, Y.R.; Jiang, H.Y. Experimental study on crashworthiness and failure mechanisms of aeronautical multifibers hybrid composite corrugated structures with Carbon, Glass, Kevlar. Aerosp. Sci. Technol. 2023, 142, 108599. [Google Scholar] [CrossRef]
  18. Zhu, G.; Wen, D.; Wei, L.; Wang, Z.; Zhao, X. Mechanical performances of novel cosine function cell-based metallic lattice structures under quasi-static compressive loading. Compos. Struct. 2023, 314, 116962. [Google Scholar] [CrossRef]
  19. Yang, Y.; Liu, H.; Zhang, Q.; Ma, J.; Yang, X.; Yang, J. Energy absorption characteristics of a super hexagonal honeycomb under out-of-plane crushing. Thin-Walled Struct. 2023, 189, 110914. [Google Scholar] [CrossRef]
  20. Li, S.; Fan, H. Flexural behaviors and local failure analyses of EPS foam-filled GFRC truss-core sandwich panels. Case Stud. Constr. Mater. 2021, 15, e00688. [Google Scholar] [CrossRef]
  21. Ling, C.; Cernicchi, A.; Gilchrist, M.D.; Cardiff, P. Mechanical behaviour of additively-manufactured poly-meric octet-truss lattice structures under quasi-static and dynamic compressive loading. Mater. Des. 2019, 162, 106–118. [Google Scholar] [CrossRef]
  22. Putranto, T.; Kõrgesaar, M.; Jelovica, J. Ultimate strength assessment of stiffened panels using Equivalent Single Layer approach under combined in-plane compression and shear. Thin-Walled Struct. 2022, 180, 109943. [Google Scholar] [CrossRef]
  23. Putranto, T.; Kõrgesaar, M.; Tabri, K. Application of Equivalent Single Layer Approach for Ultimate Strength Analyses of Ship Hull Girder. J. Mar. Sci. Eng. 2022, 10, 1530. [Google Scholar] [CrossRef]
  24. Liu, M.; Gao, Y.; Zhang, D.; Wang, Z.; Wu, D.; Yu, B.; Lei, Y. An enhanced elastoplastic damage coupled model for compression characteristics analysis of continuous fiber-reinforced thermoplastic composite stiffened panel. Compos. Struct. 2022, 297, 115924. [Google Scholar] [CrossRef]
  25. Meng, F.; Zhang, B.; Zhao, Z.; Xu, Y.; Fan, H.; Jin, F. A novel all-composite blast-resistant door structure with hierarchical stiffeners. Compos. Struct. 2016, 148, 113–126. [Google Scholar] [CrossRef]
  26. Li, Z.D.; Zhai, W.; Li, X.W.; Yu, X.; Guo, Z.C.; Wang, Z.G. Additively manufactured dual-functional metamaterials with customisable mechanical and sound-absorbing properties. Virtual Phys. Prototyp. 2022, 17, 864–880. [Google Scholar] [CrossRef]
  27. Xu, T.; Liu, N.; Yu, Z.; Xu, T.; Zou, M. Crashworthiness design for bionic bumper structures inspired by cattail and bamboo. Appl. Bionics Biomech. 2017, 2017, 1–9. [Google Scholar] [CrossRef] [PubMed]
  28. Wang, C.; Li, Y.; Zhao, W.; Zou, S.; Zhou, G.; Wang, Y. Structure design and multi-objective optimization of a novel crash box based on biomimetic structure. Int. J. Mech. Sci. 2018, 138–139, 489–501. [Google Scholar] [CrossRef]
  29. Wang, Z.; Sun, Y.; Wu, H.; Zhang, C. Low velocity impact resistance of bio-inspired building ceramic composites with nacre-like structure. Constr. Build. Mater. 2018, 169, 851–858. [Google Scholar] [CrossRef]
  30. Ullah, I.; Elambasseril, J.; Brandt, M.; Feih, S. Performance of bio-inspired Kagome truss core structures under compression and shear loading. Compos. Struct. 2014, 118, 294–302. [Google Scholar] [CrossRef]
  31. Huang, J.H.; Durden, H.; Chowdhury, M. Bioinspired armor protective material systems for ballistic shock mitigation. Mater. Des. 2011, 32, 3702–3710. [Google Scholar] [CrossRef]
  32. Xin, Z.B.; Zhang, X.H.; Duan, Y.G.; Xu, W. Nacre-inspired design of CFRP composite for improved energy absorption proper-ties. Compos. Struct. 2018, 184, 102–109. [Google Scholar] [CrossRef]
  33. Zou, M.; Xu, S.; Wei, C.; Wang, H.; Liu, Z. A bionic method for the crashworthiness design of thin-walled structures inspired by bamboo. Thin-Walled Struct. 2016, 101, 222–230. [Google Scholar] [CrossRef]
  34. Ha, N.S.; Lee, T.-U.; Ma, J.; Li, J.; Xie, Y.M. Energy absorption of a bio-inspired cylindrical sandwich structure. Thin-Walled Struct. 2024, 195, 111378. [Google Scholar] [CrossRef]
  35. Ghazlan, A.; Ngo, T.; Tan, P.; Xie, Y.M.; Tran, P.; Donough, M. Inspiration from Nature’s body armours—A review of biological and bioinspired composites. Compos. Part B Eng. 2021, 205, 108513. [Google Scholar] [CrossRef]
  36. Xiang, J.W.; Du, J.X. Energy absorption characteristics of bio-inspired honeycomb structure under axial impact loading. Mater. Sci. Eng. A 2017, 696, 283–289. [Google Scholar] [CrossRef]
  37. Sun, Z.; Shi, S.S.; Guo, X.; Hu, X.Z.; Chen, H.R. On compressive properties of composite sandwich structures with grid rein-forced honeycomb core. Compos. Part B Eng. 2016, 94, 245–252. [Google Scholar] [CrossRef]
  38. Xu, S.Q.; Beynon, J.H.; Ruan, D.; Lu, G.X. Experimental study of the out-of-plane dynamic compression of hexagonal hon-eycombs. Compos. Struct. 2012, 94, 2326–2336. [Google Scholar]
  39. Zhang, Q.C.; Yang, X.H.; Li, P.; Huang, G.Y.; Feng, S.S.; Shen, C.; Han, B.; Zhang, X.H.; Jin, F.; Xu, F.; et al. Bioinspired engineer-ing of honeycomb structure—Using nature to inspire human innovation. Prog. Mater. Sci. 2015, 74, 332–400. [Google Scholar] [CrossRef]
  40. Chouhan, G.; Gunji, B.M.; Bidare, P.; Ramakrishna, D.; Kumar, R. Experimental and numerical investigation of 3D printed bio-inspired lattice structures for mechanical behaviour under Quasi static loading conditions. Mater. Today Commun. 2023, 35, 105658. [Google Scholar] [CrossRef]
  41. Zhang, W.; Yin, S.; Yu, T.; Xu, J. Crushing resistance and energy absorption of pomelo peel inspired hierarchical honeycomb. Int. J. Impact Eng. 2018, 125, 163–172. [Google Scholar] [CrossRef]
  42. Xu, P.; Guo, W.; Yang, L.; Yang, C.; Ruan, D.; Xu, J.; Yao, S. Crashworthiness analysis of the biomimetic lotus root lattice structure. Int. J. Mech. Sci. 2024, 263, 108774. [Google Scholar] [CrossRef]
  43. Shi, S.S.; Sun, Z.; Hu, X.Z.; Chen, H.R. Flexural strength and energy absorption of carbon-fiber–aluminum-honeycomb compo-site sandwich reinforced by aluminum grid. Thin-Walled Struct. 2014, 84, 416–422. [Google Scholar] [CrossRef]
  44. Shi, S.; Cheng, G.; Chen, B.; Zhou, X.; Liu, Z.; Lv, H.; Sun, Z. Effect of an S-shaped reinforced core on the compression properties of composite honeycomb sandwich panel and tube structures. Thin-Walled Struct. 2023, 187, 110732. [Google Scholar] [CrossRef]
  45. Fan, Z.X.; Ye, G.Y.; Li, S.; Bai, Z.Y.; Yong, Q.W.; Zhang, Y.H.; Hu, Y.C. Compression performance and failure mechanism of hon-eycomb structures fabricated with reinforced wood. Structures 2023, 48, 1868–1882. [Google Scholar] [CrossRef]
  46. Dusanapudi, S.; Krupakaran, R.; Srinivas, A.; Nikhil, K.S.; Vamshi, T. Optimization and experimental analysis of mechanical properties and porosity on FDM based 3D printed ABS sample. Mater. Today Proc. 2023. Advance Online Publication. [Google Scholar] [CrossRef]
  47. Niu, X.; Xu, F.; Zou, Z.; Fang, T.; Zhang, S.; Xie, Q. In-plane dynamic crashing behavior and energy absorption of novel bionic honeycomb structures. Compos. Struct. 2022, 299, 116064. [Google Scholar] [CrossRef]
  48. Wang, H.; Lu, Z.; Yang, Z.; Li, X. In-plane dynamic crushing behaviors of a novel auxetic honeycomb with two plateau stress regions. Int. J. Mech. Sci. 2019, 151, 746–759. [Google Scholar] [CrossRef]
  49. Lv, H.; Shi, S.; Chen, B.; Liu, Z. Low-velocity impact performance of orthogonal grid reinforced CFRP-foam sandwich structure. Thin-Walled Struct. 2023, 193, 111236. [Google Scholar] [CrossRef]
  50. Lv, H.; Shi, S.; Chen, B.; Ma, J.; Sun, Z. Low-velocity impact response of composite sandwich structure with grid–honeycomb hybrid core. Int. J. Mech. Sci. 2023, 246, 108149. [Google Scholar] [CrossRef]
Figure 1. Structural design concept ((I) for actual honeycomb structure, (II) for traditional honeycomb structure, (III) for leaf vein honeycomb structure, (IV) for actual lotus root node, (V) for lotus root node–leaf vein combination honeycomb structure, and (VI) for lotus root node–leaf vein combination honeycomb sandwich structure).
Jmse 12 00652 g001
Figure 2. Tensile specimen parameters and tensile test results ((a) is the tensile specimen parameters, (b) is the tensile specimen stress–strain curve).
Jmse 12 00652 g002
Figure 3. Three-dimensional schematic of the TCS, LVHS, LRHS, and LRVHS ((a) is the TCS, (b) is the LVHS, (c) is the LRHS, and (d) is the LRVHS).
Jmse 12 00652 g003
Figure 4. LVHS and LRVHS deformation processes ((ad) are LVHS deformation processes; (eh) are LRVHS deformation processes).
Jmse 12 00652 g004
Figure 5. Relationships between the LVHS stress–strain curves and deformation processes.
Jmse 12 00652 g005
Figure 6. Relationships between the LRVHS stress–strain curves and deformation processes.
Jmse 12 00652 g006
Figure 7. Stress–strain curves and deformation processes in four honeycomb structures.
Jmse 12 00652 g007
Figure 8. Experimental results for the TCS, LVHS, LRHS, and LRVHS for EA and SEA (EA (energy absorption) and SEA (specific energy absorption)).
Jmse 12 00652 g008
Figure 9. Structural boundary conditions.
Jmse 12 00652 g009
Figure 10. Verification of mesh convergence.
Jmse 12 00652 g010
Figure 11. Comparison between the LVHS experiments and numerical simulations (I) shows the linear elastic stage, (II) shows the plastic deformation stage, (III) shows the plateau stage, and (IV) shows the densification stage (the red dotted line in the figure shows the main deformation areas of the structure).
Jmse 12 00652 g011
Figure 12. Comparison between the LVRHS experiments and numerical simulations (I) shows the linear elastic stage, (II) shows the plastic deformation stage, (III) shows the plateau stage, and (IV) shows the densification stage (the red dotted line in the figure shows the main deformation areas of the structure).
Jmse 12 00652 g012
Figure 13. Comparison of the experimental and simulated LRVHS stress–strain curves.
Jmse 12 00652 g013
Figure 14. Comparison of the stress–strain curves and deformation processes of the TCS and LRHS (the red dotted line in the figure shows the main deformation areas of the structure).
Jmse 12 00652 g014
Figure 15. Comparison of stress–strain curves and deformation processes of TCS and LVHS single-cell elements ((I) is the linear elastic stage, (II) is the plastic deformation stage, (III) is the platform stage, and (IV) is the densification stage).
Jmse 12 00652 g015
Figure 16. Analysis of structural energy absorption at different positions and on different numbers of leaf vein plates ((a) is the effect of different vein plate positions on the energy absorption of the structure, and (b,c) are the effects of different numbers of vein plates on the energy absorption of the structure).
Jmse 12 00652 g016aJmse 12 00652 g016b
Figure 17. Structural peak forces at different leaf vein plate thicknesses with SEA.
Jmse 12 00652 g017
Table 1. Tensile specimen process parameters and errors.
Specimen SamplesL1
(mm)
L2
(mm)
L3
(mm)
W1
(mm)
W2
(mm)
T
(mm)
Mass
(g)
1164.8114.749.919.313.33.18.5
2164.8114.849.819.113.12.98.5
3165.3115.350.319.213.238.4
Error±0.3±0.3±0.3±0.3±0.3±0.2
Disclaimer/Publisher’s Note: The statements, opinions and data contained in all publications are solely those of the individual author(s) and contributor(s) and not of MDPI and/or the editor(s). MDPI and/or the editor(s) disclaim responsibility for any injury to people or property resulting from any ideas, methods, instructions or products referred to in the content.

