
Spatial and Temporal Characteristics and Mechanisms of Marine Heatwaves in the Changjiang River Estuary and Its Surrounding Coastal Regions
Abstract
:1. Introduction
2. Data and Methods
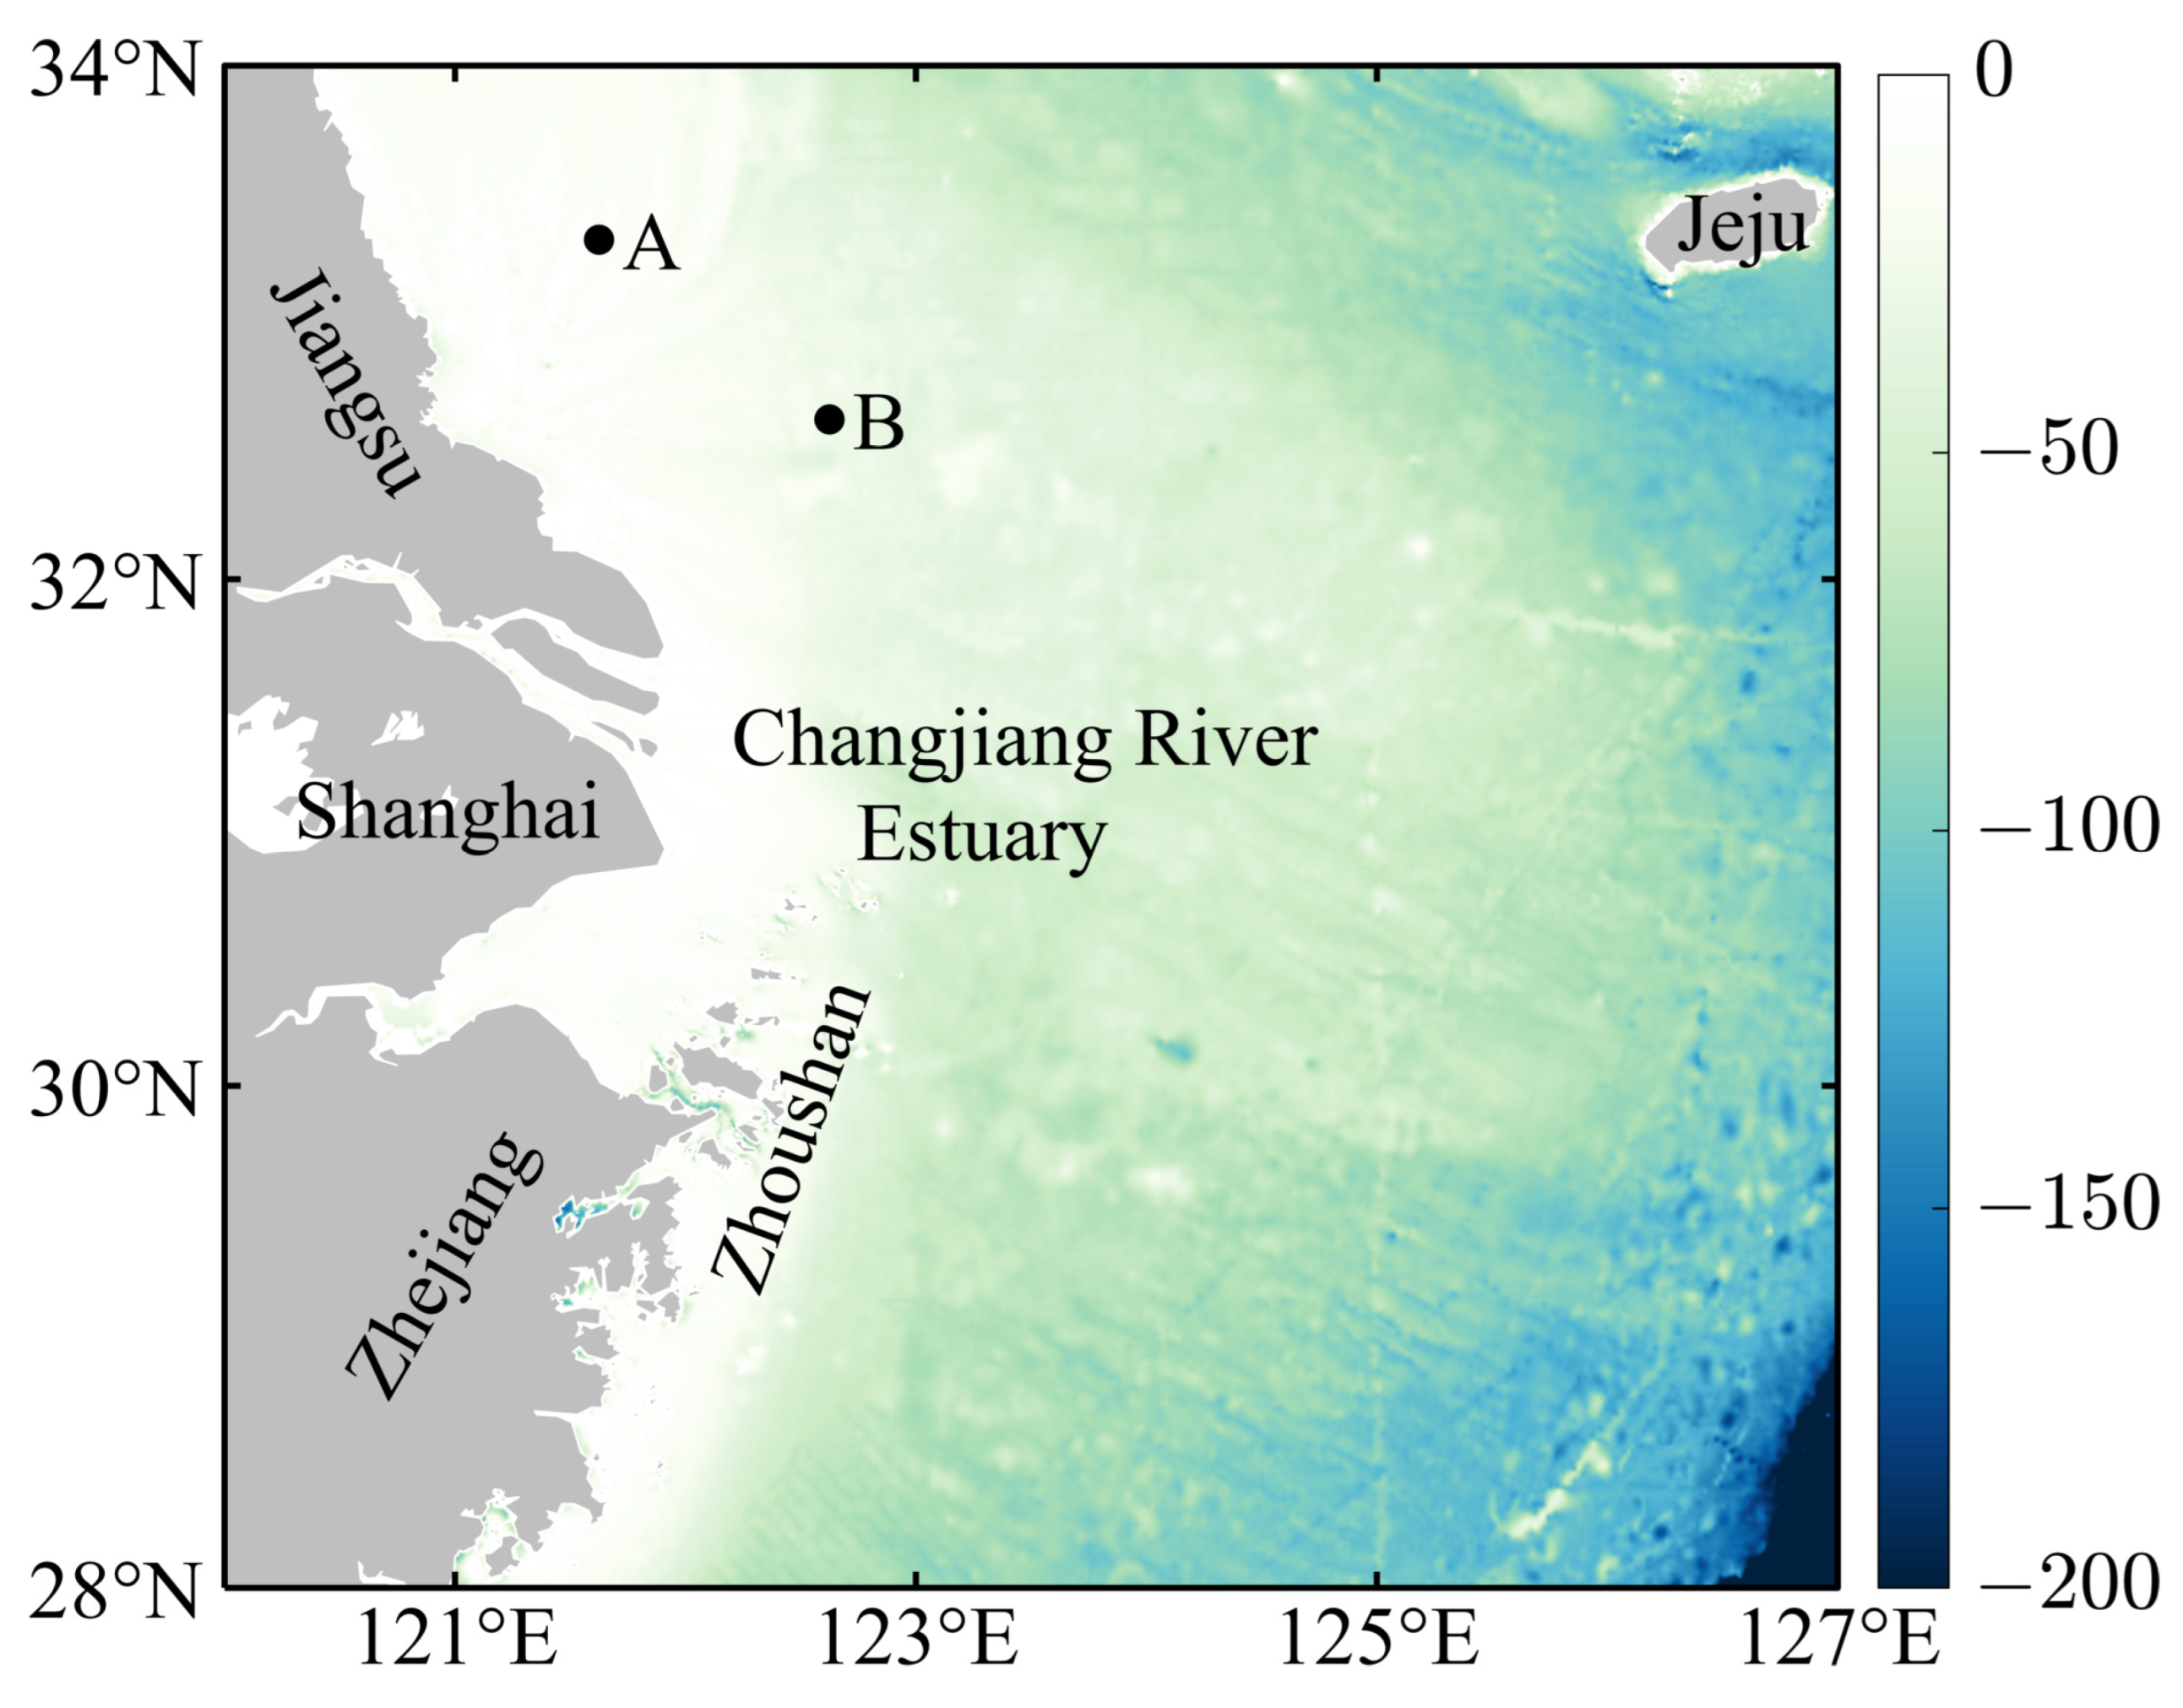
2.1. Study Area
2.2. Data Sources
2.3. Methods
2.3.1. Define the MHW Event
2.3.2. Definition of MHW Indices
3. Results
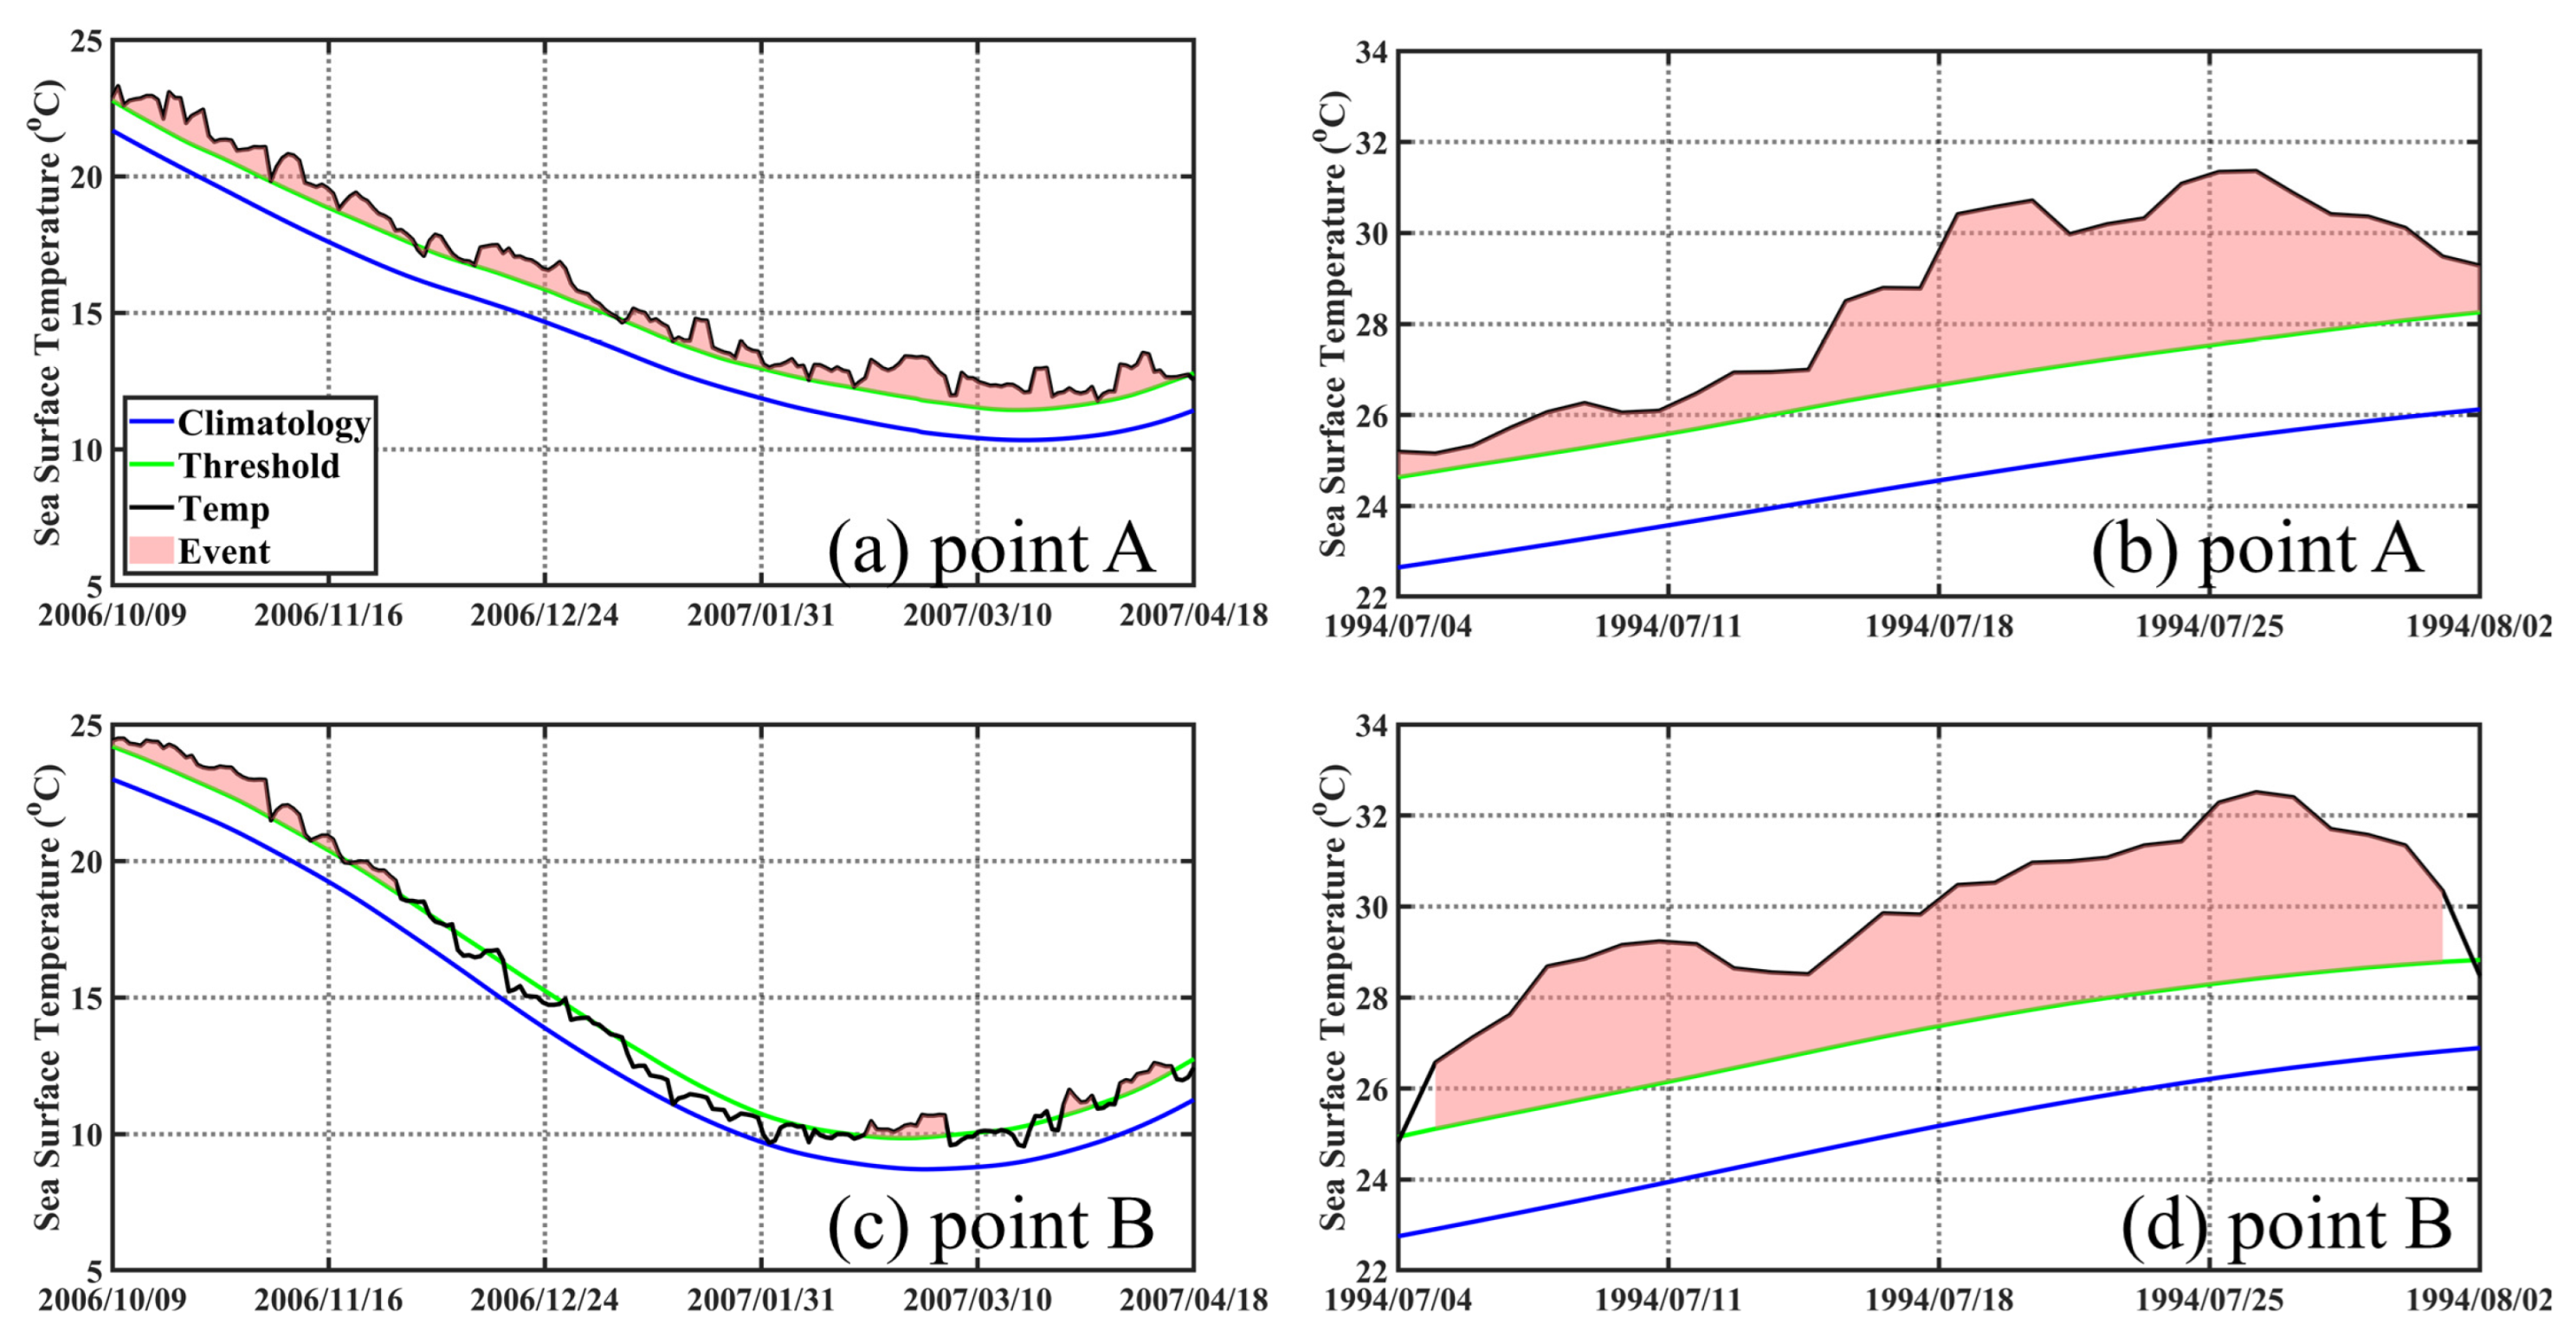
3.1. Examples of Typical MHWs in the study areas
3.2. Characteristics of MHWs in the Study Area
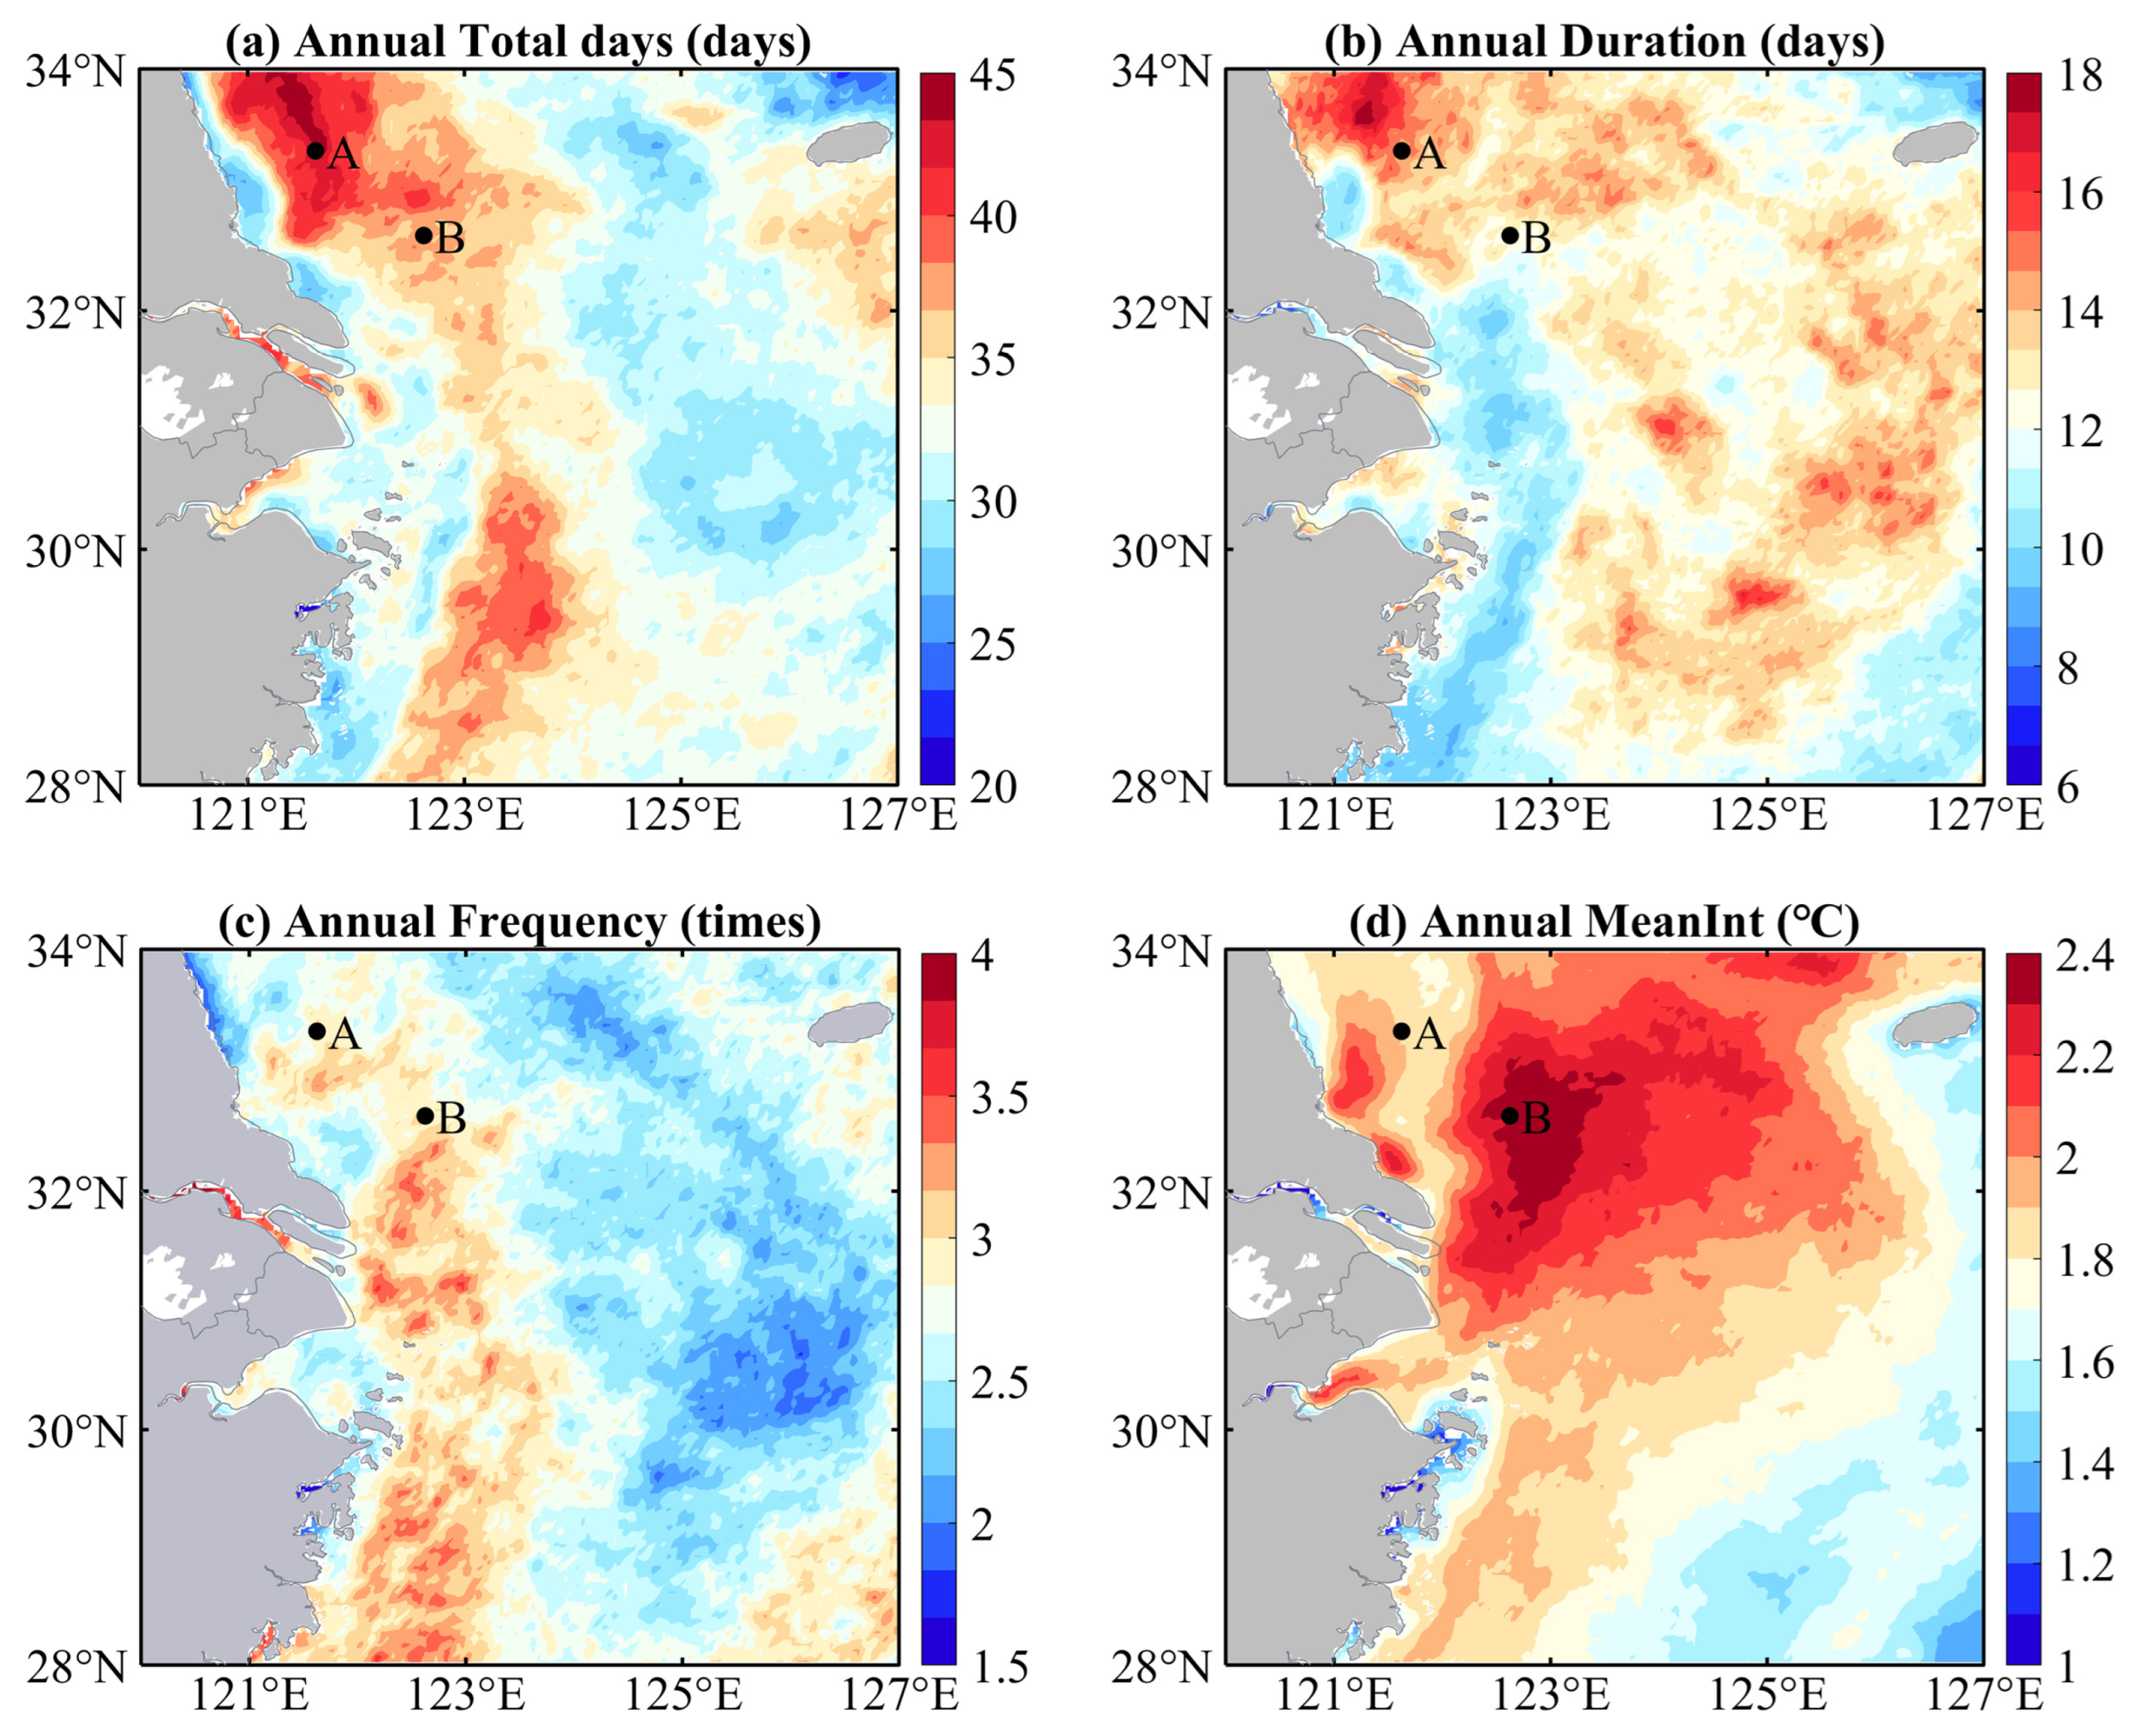
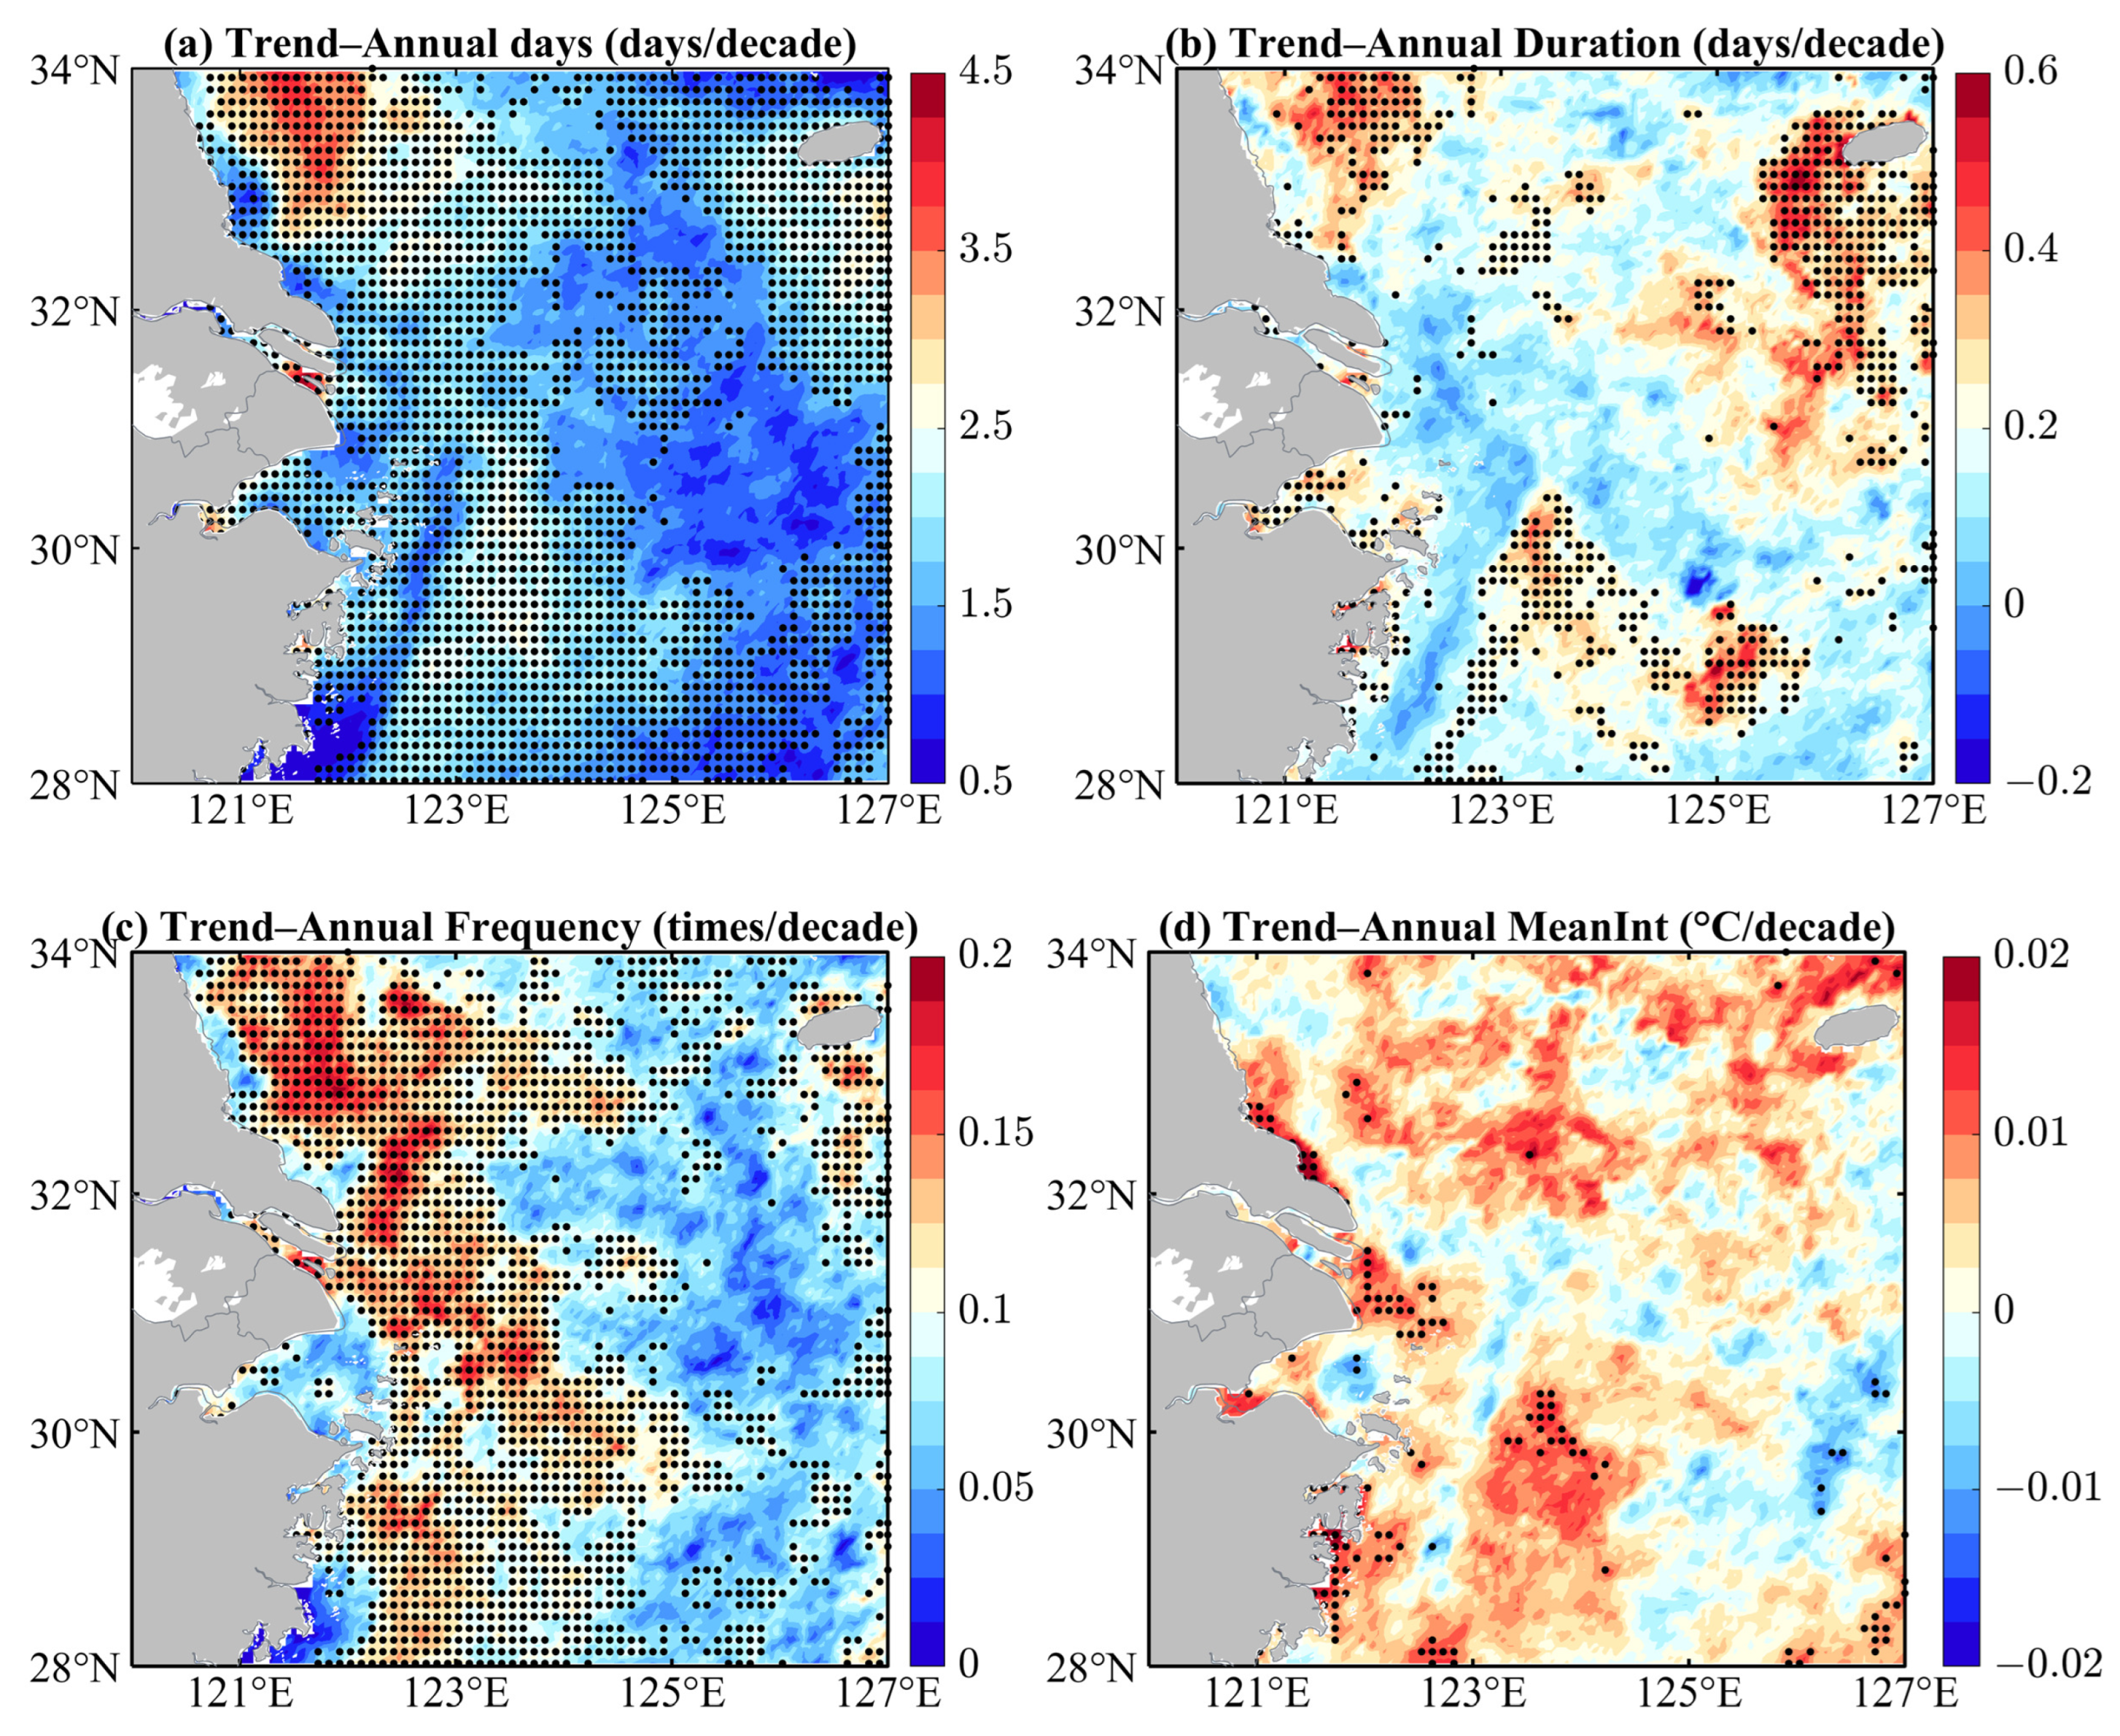
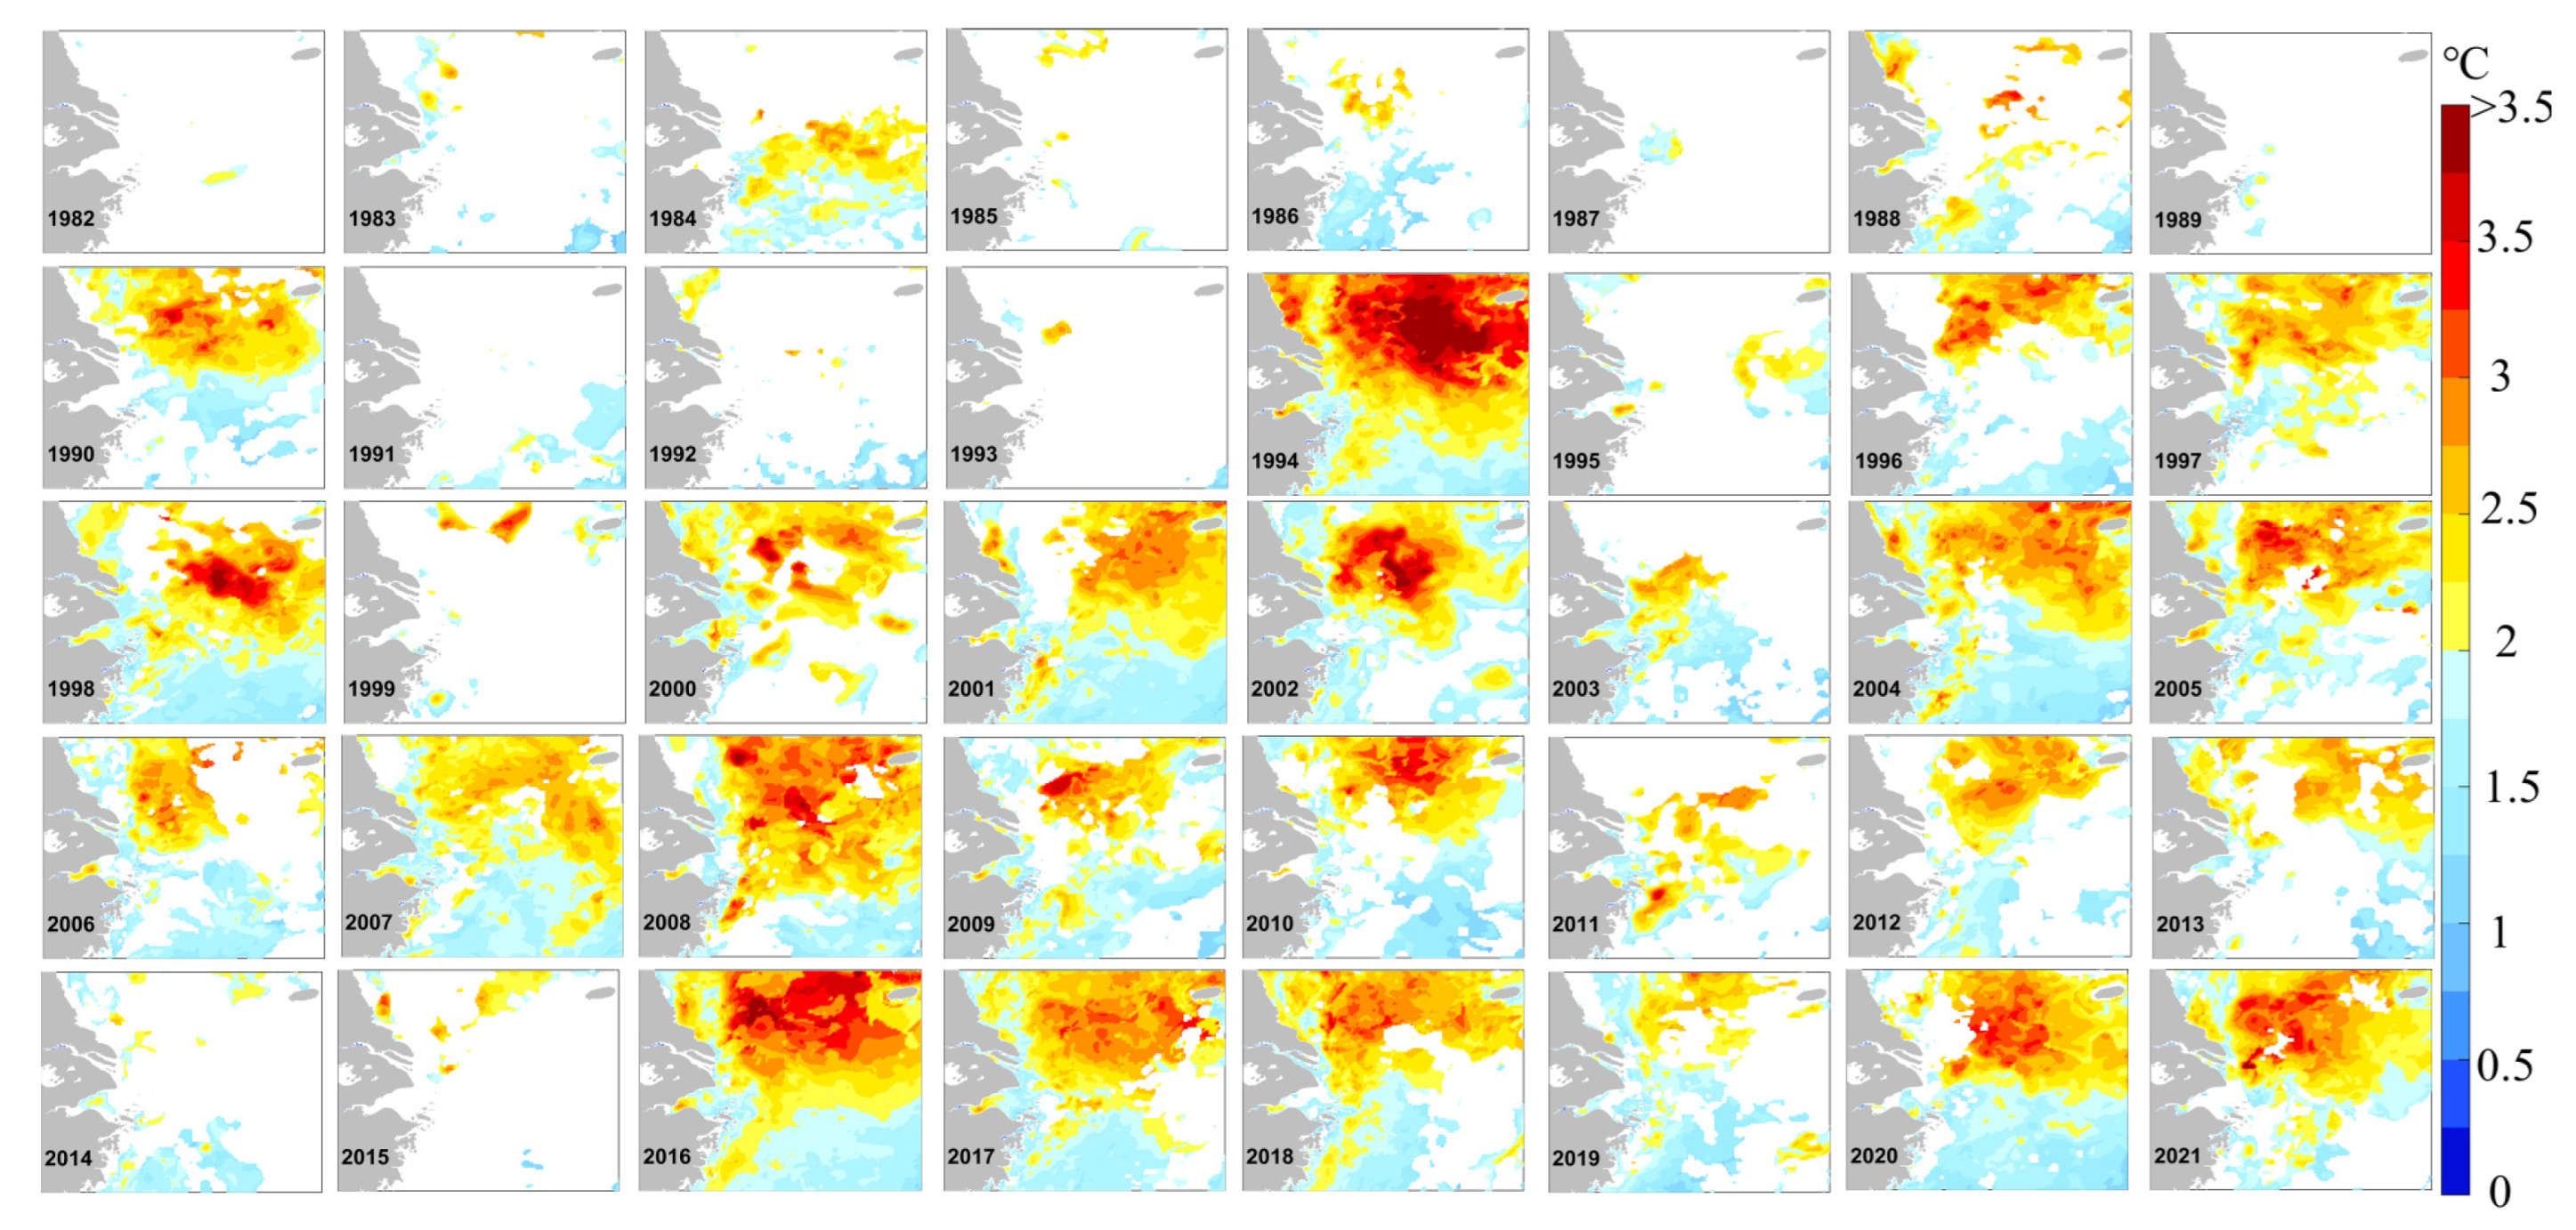
3.2.1. Spatial Distribution and Trends of MHWs in 1982–2021
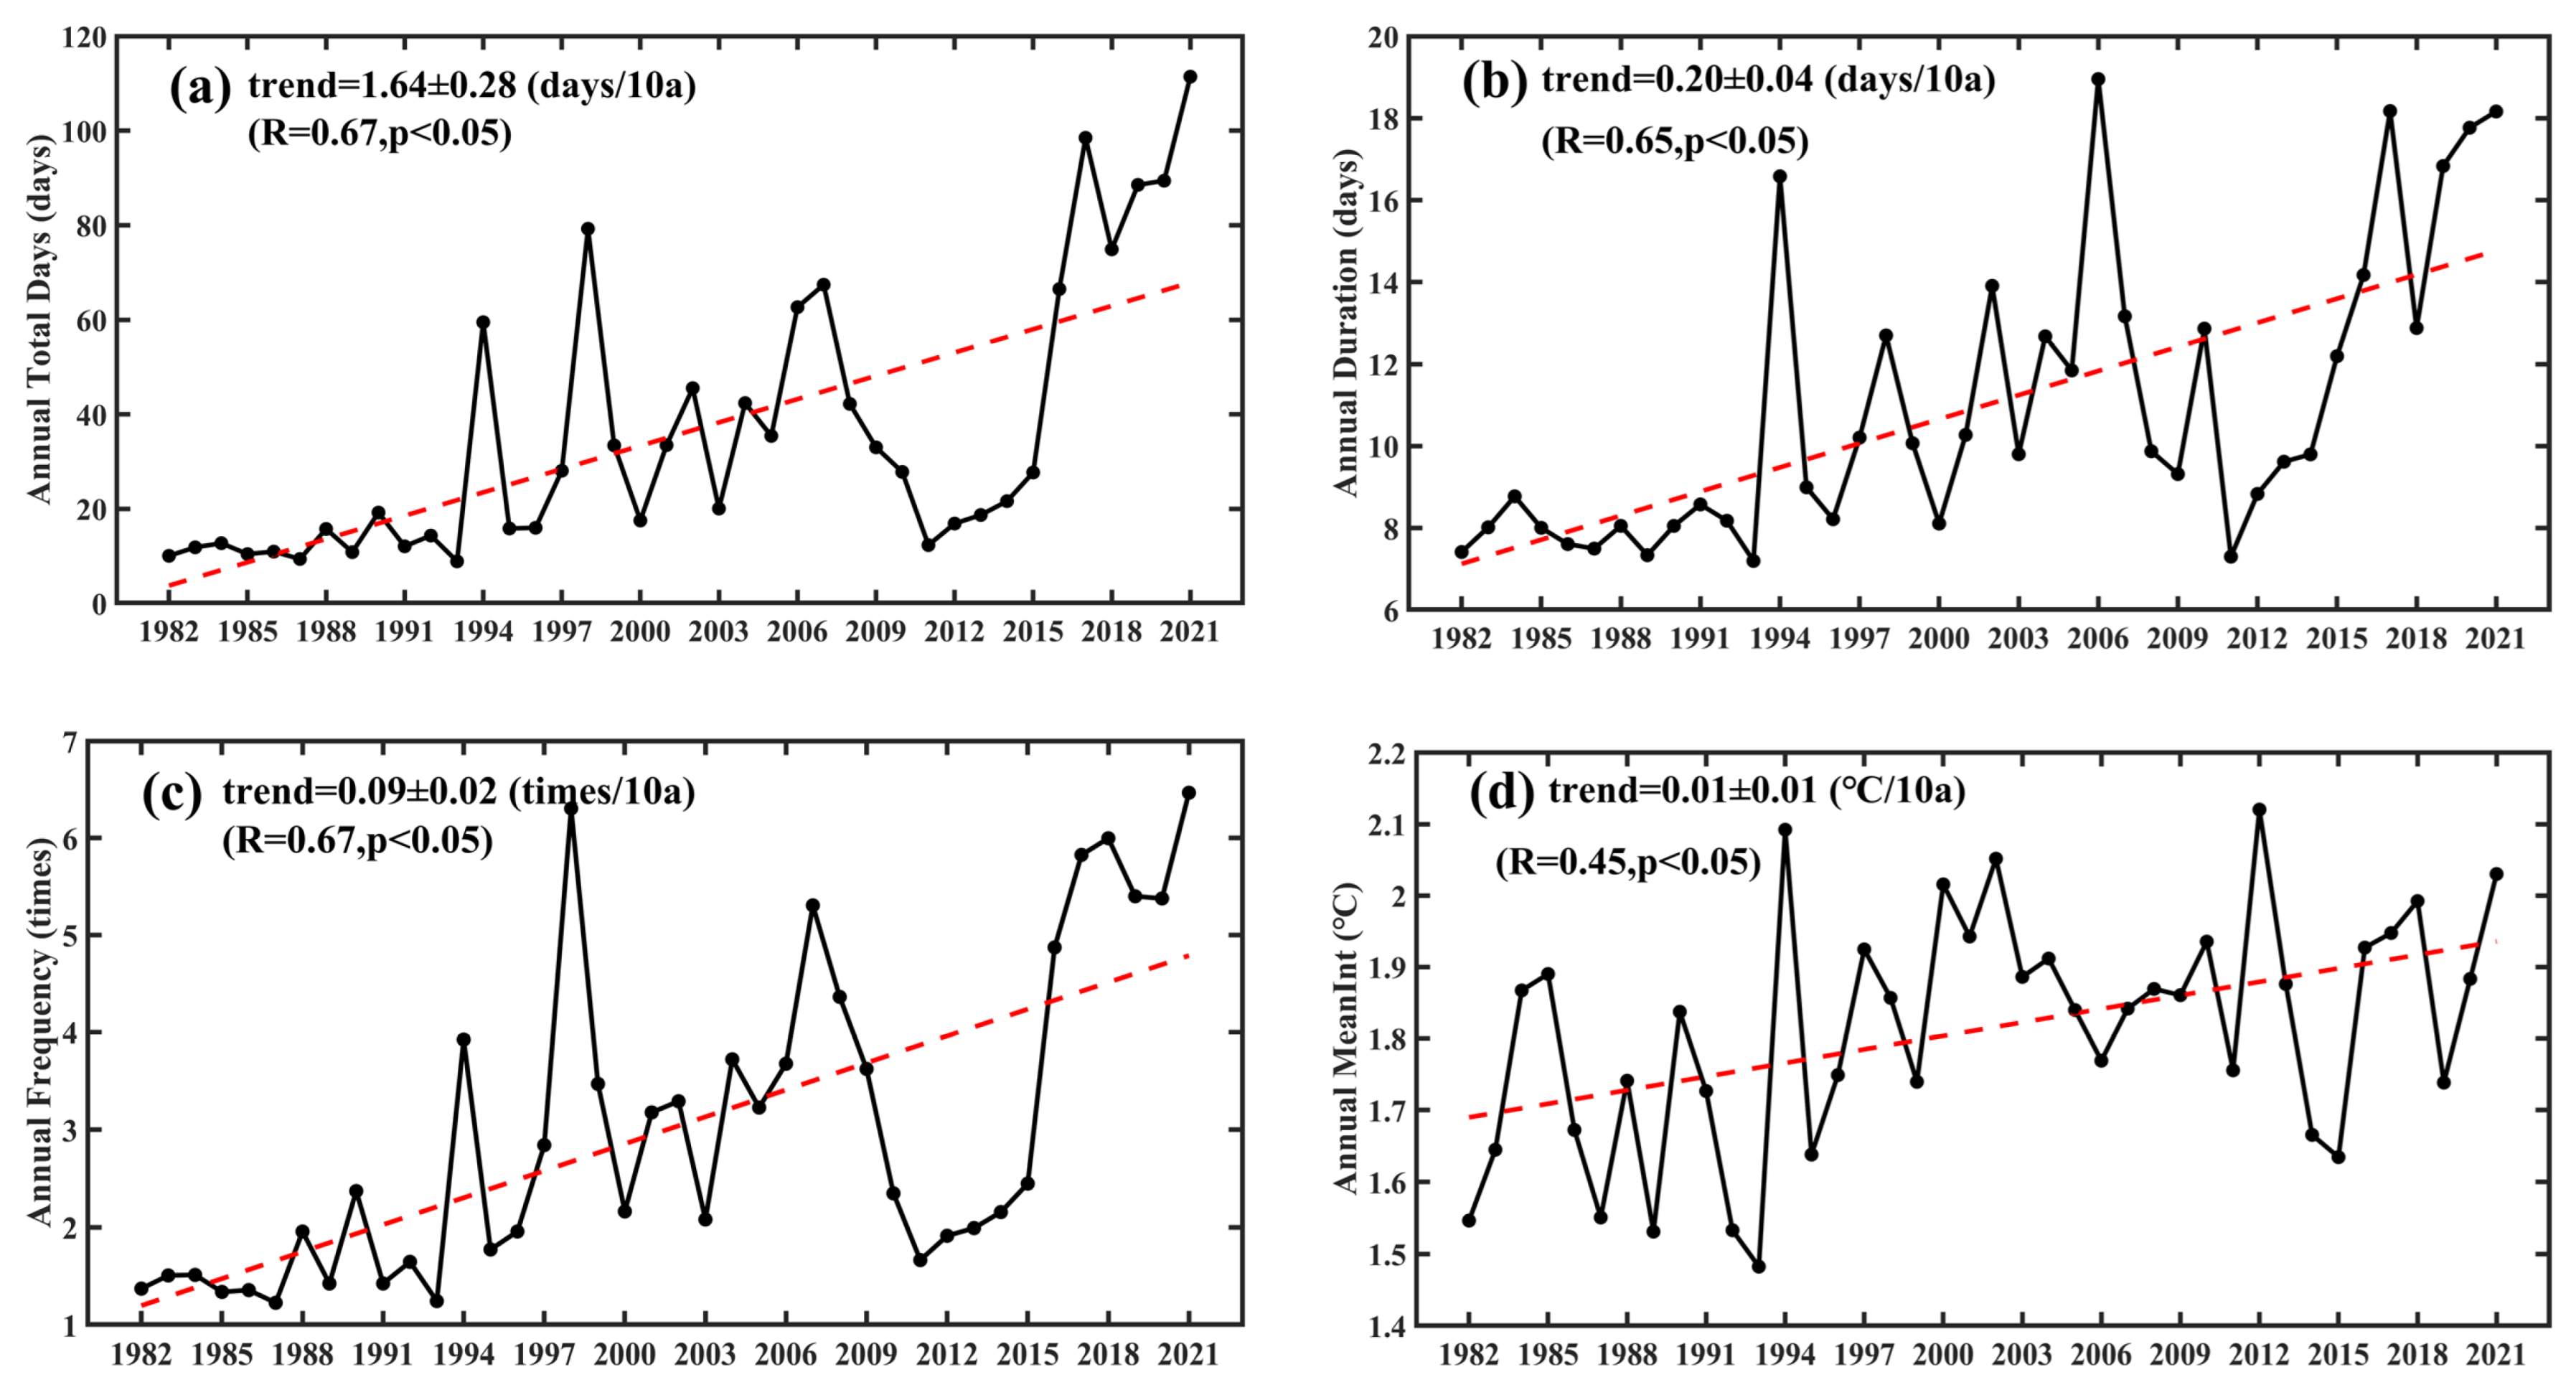
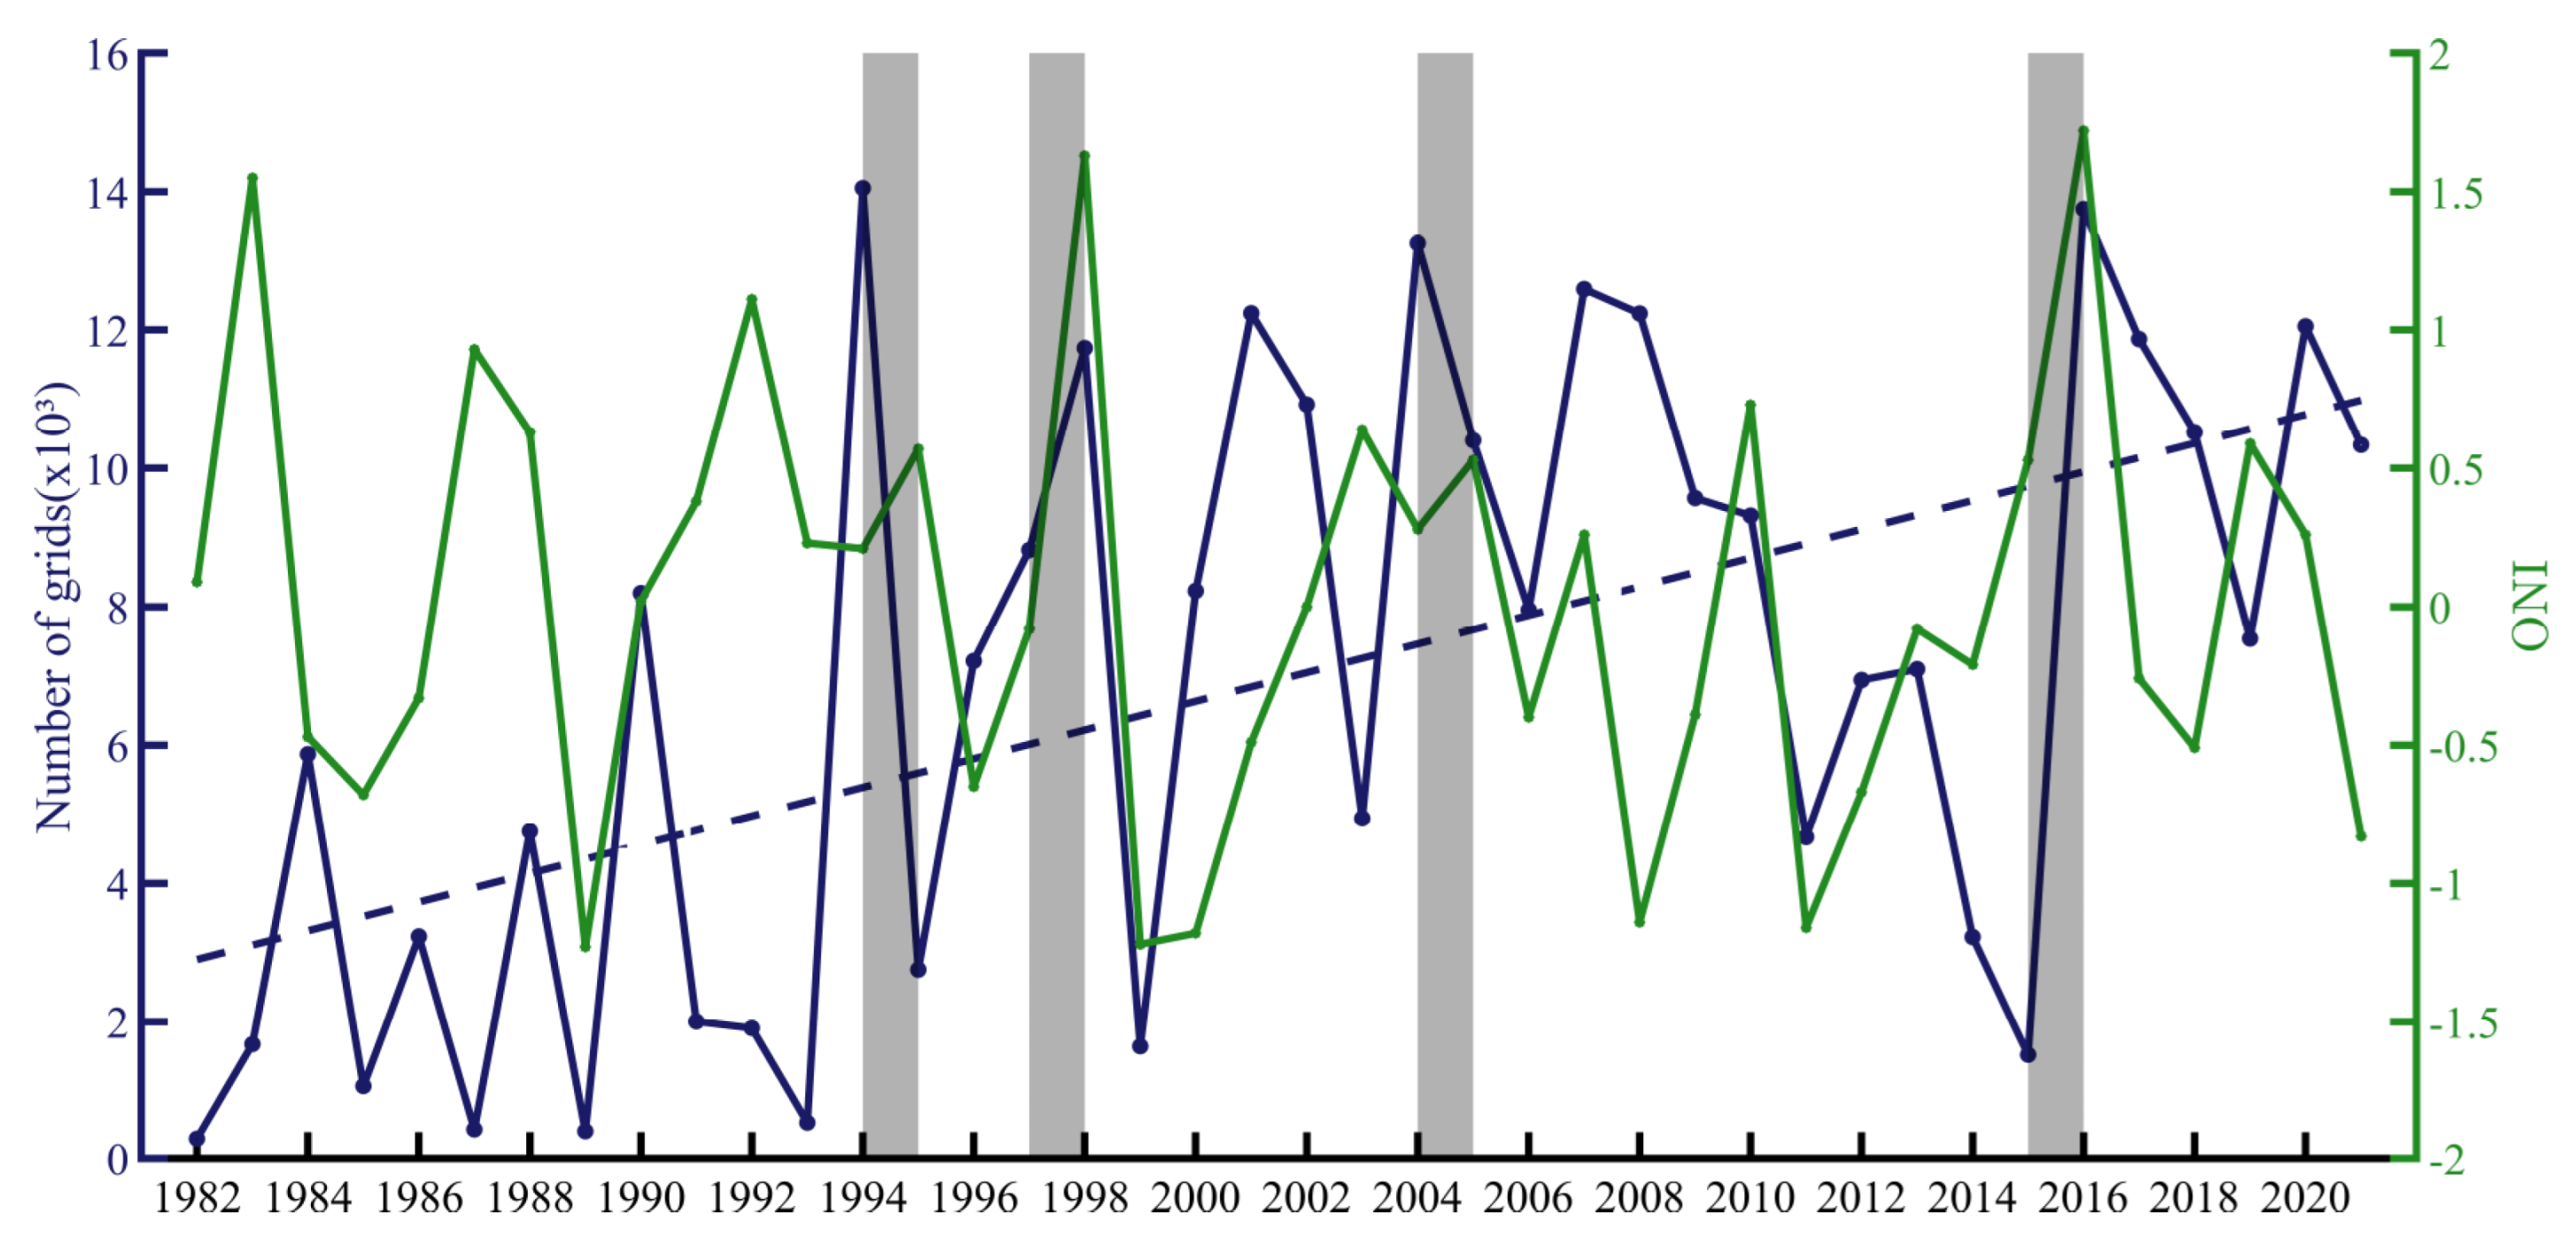
3.2.2. Temporal Evolution of MHWs in 1982–2021
3.3. Characteristics of Summer MHWs in the Study Area
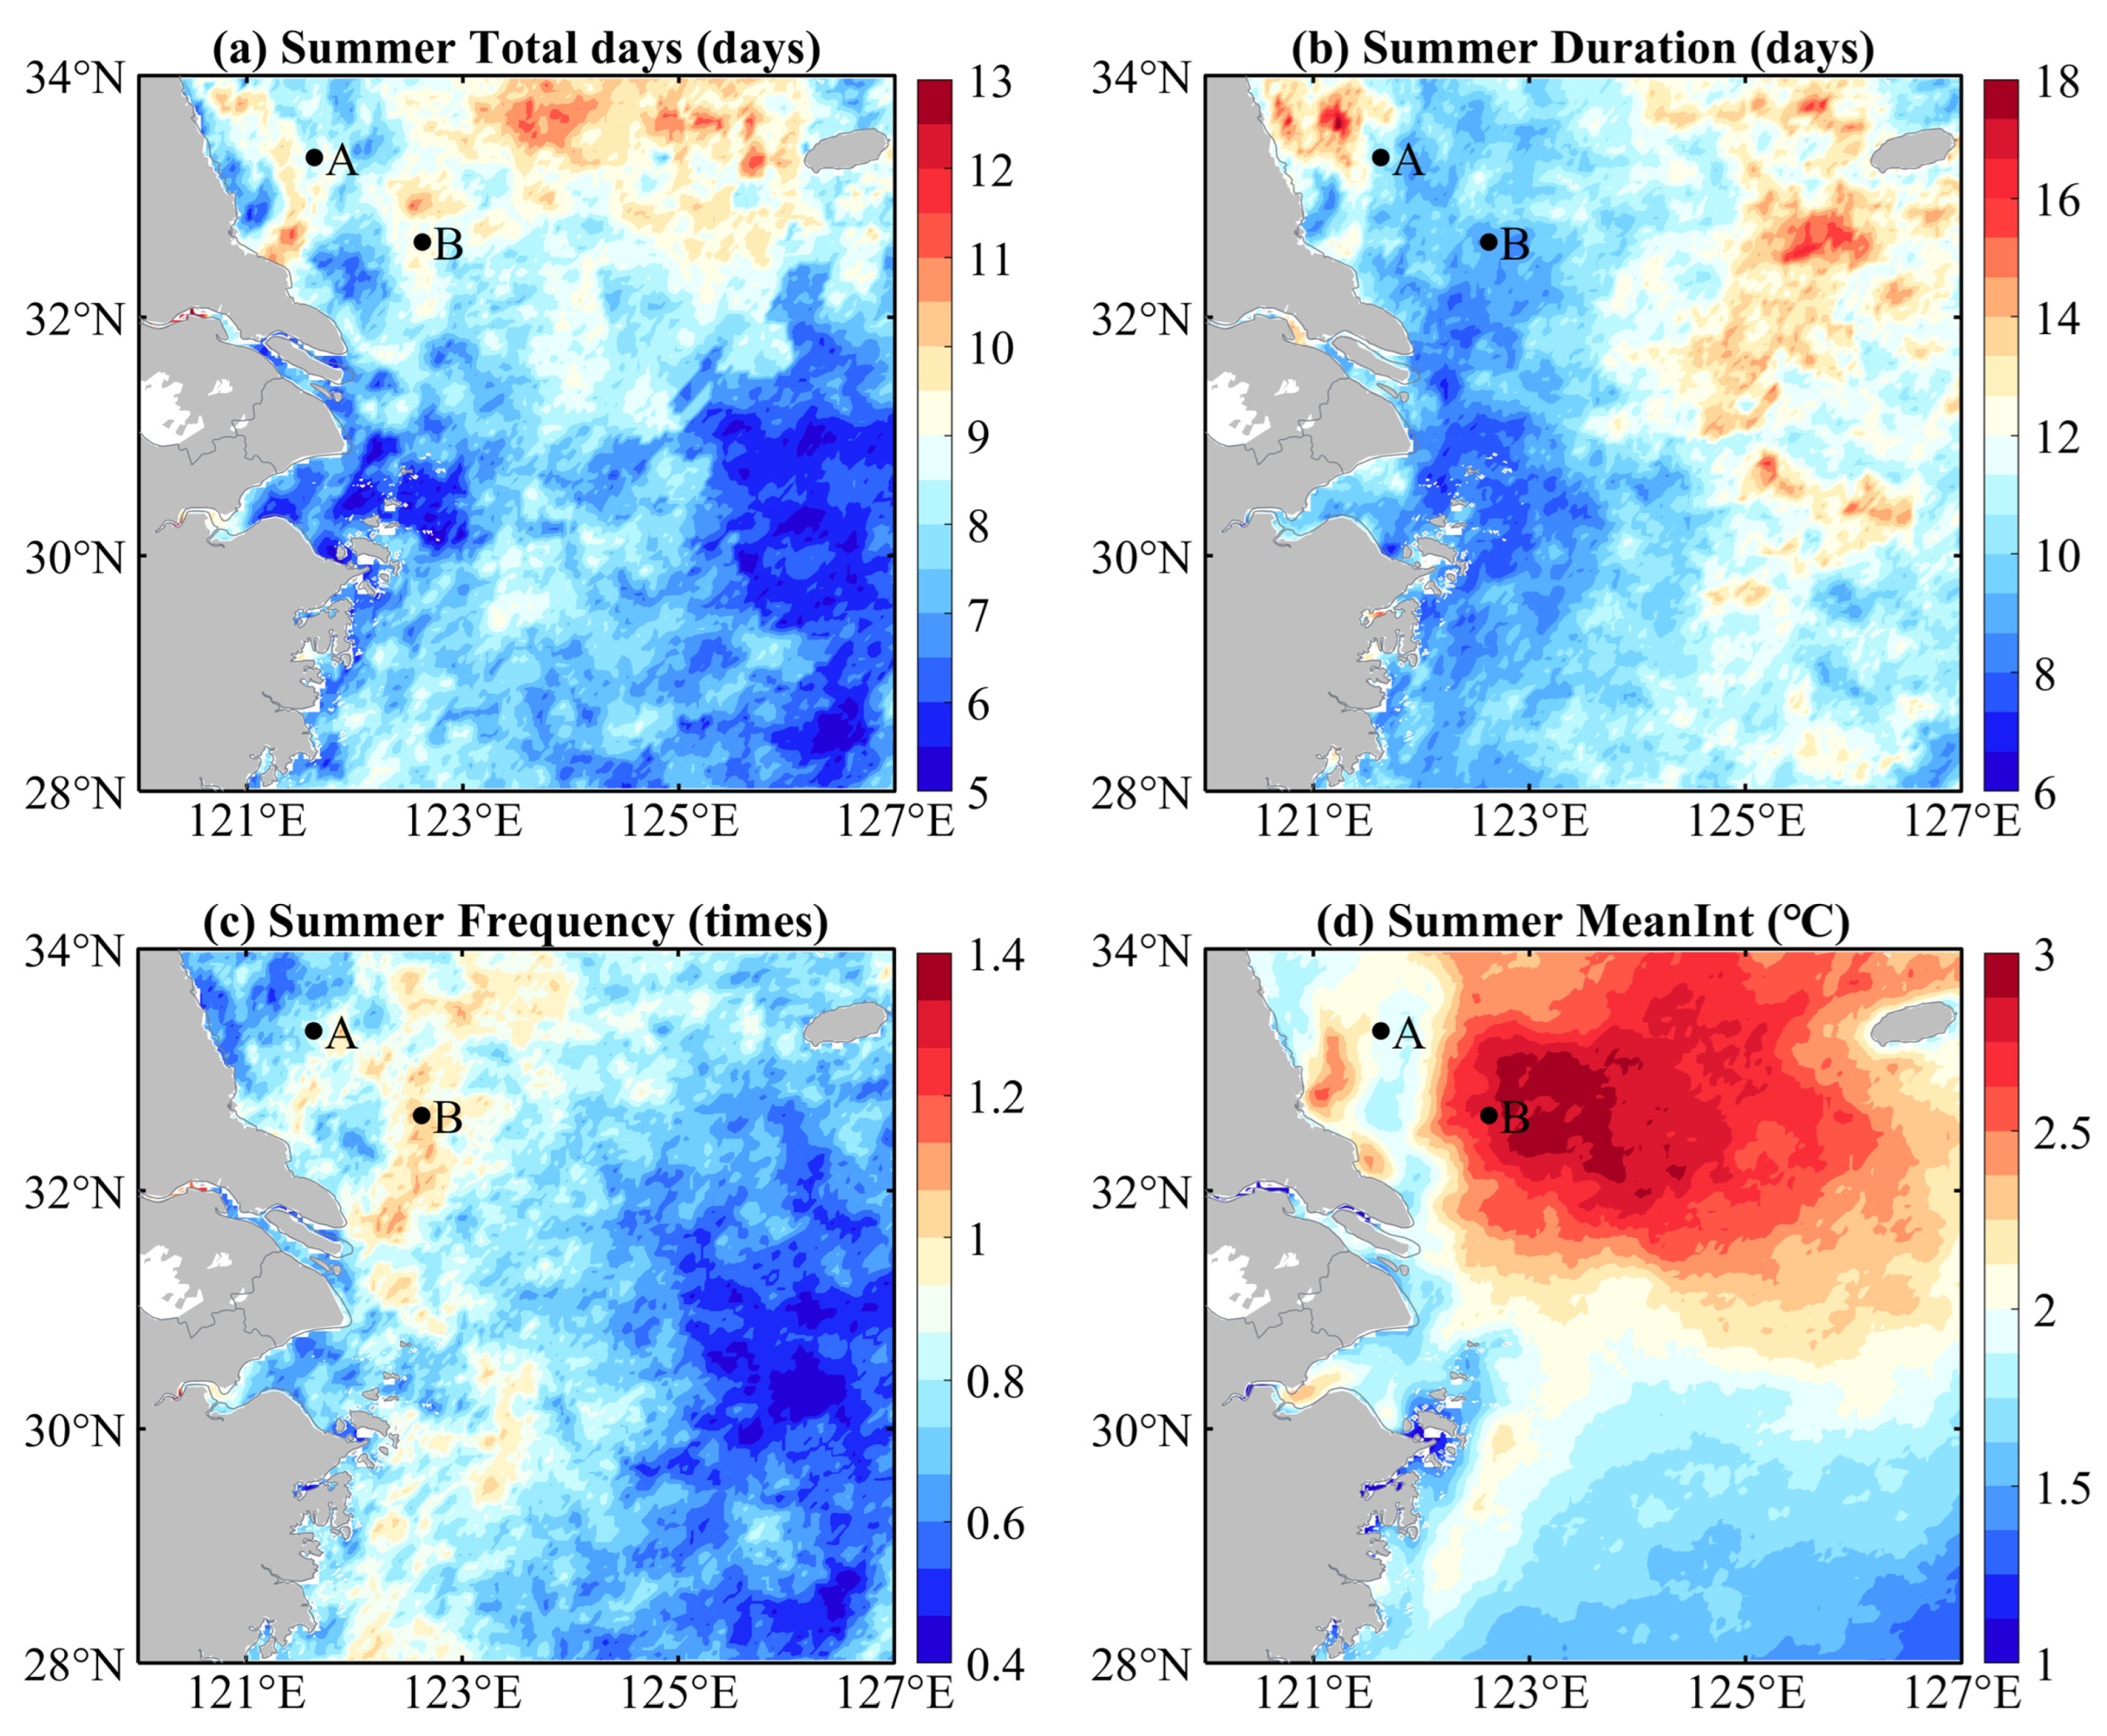
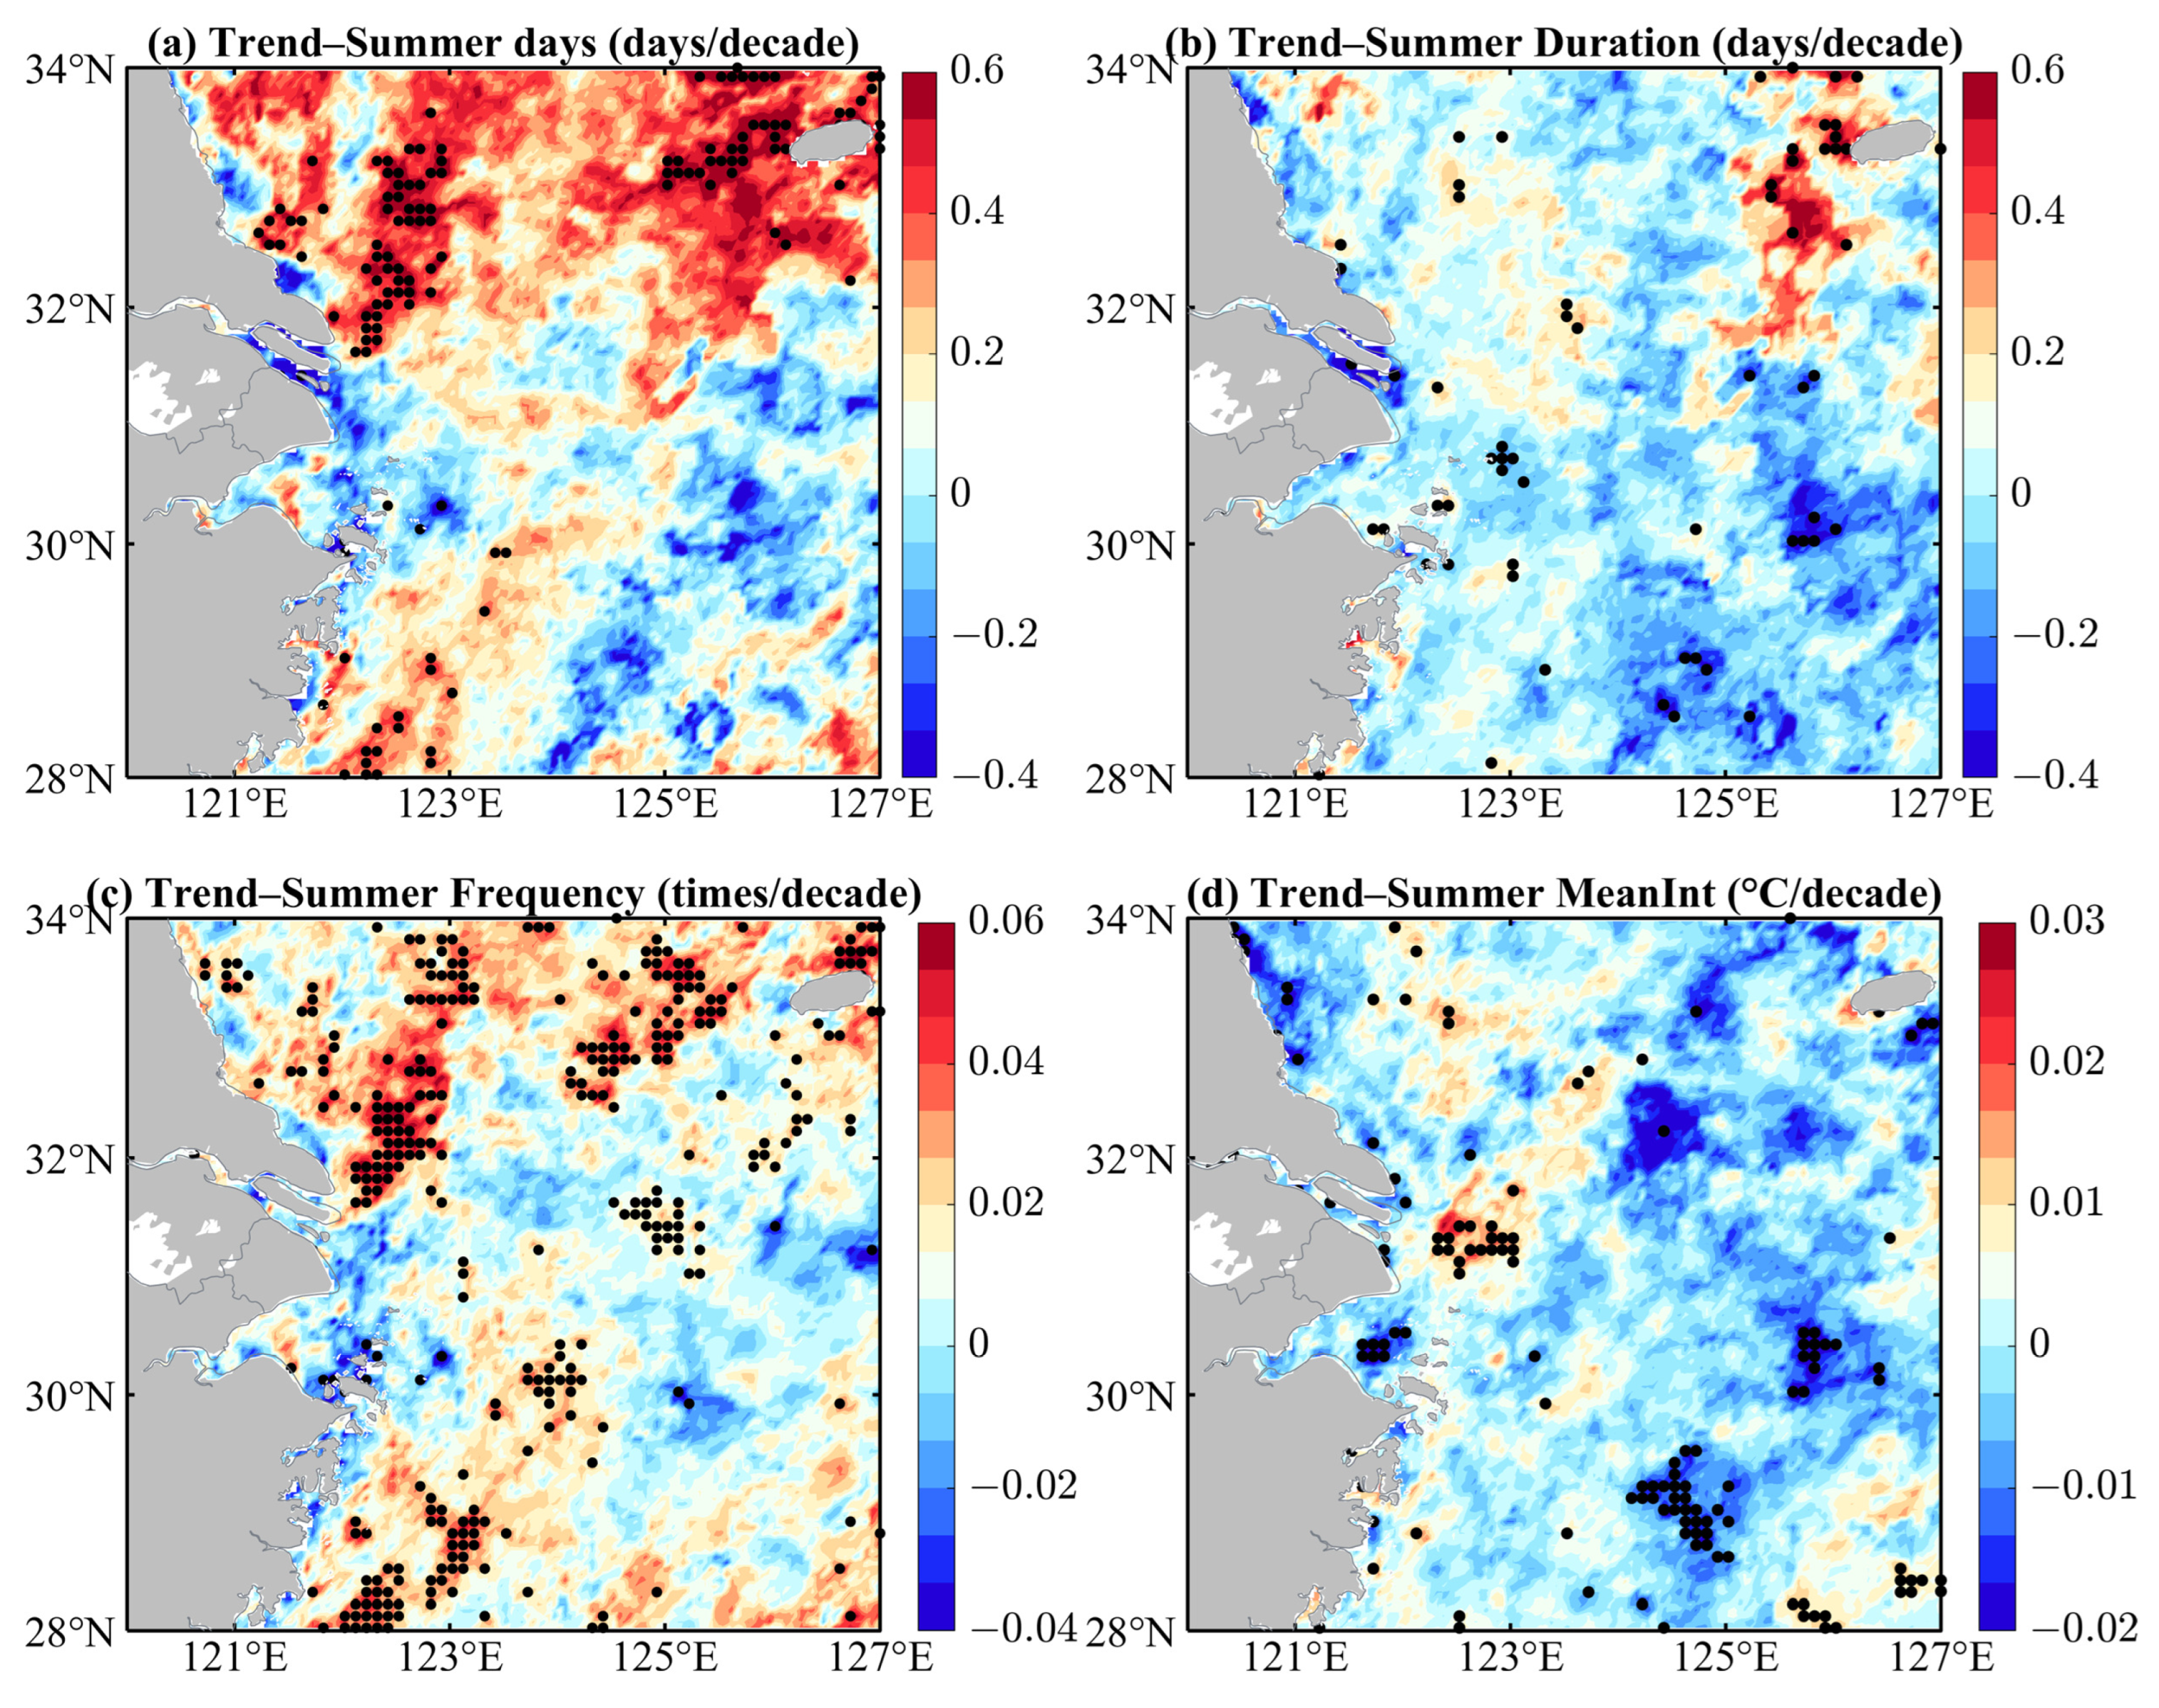
3.3.1. Spatial Distribution and Trends of MHWs in Summer (1982–2021)
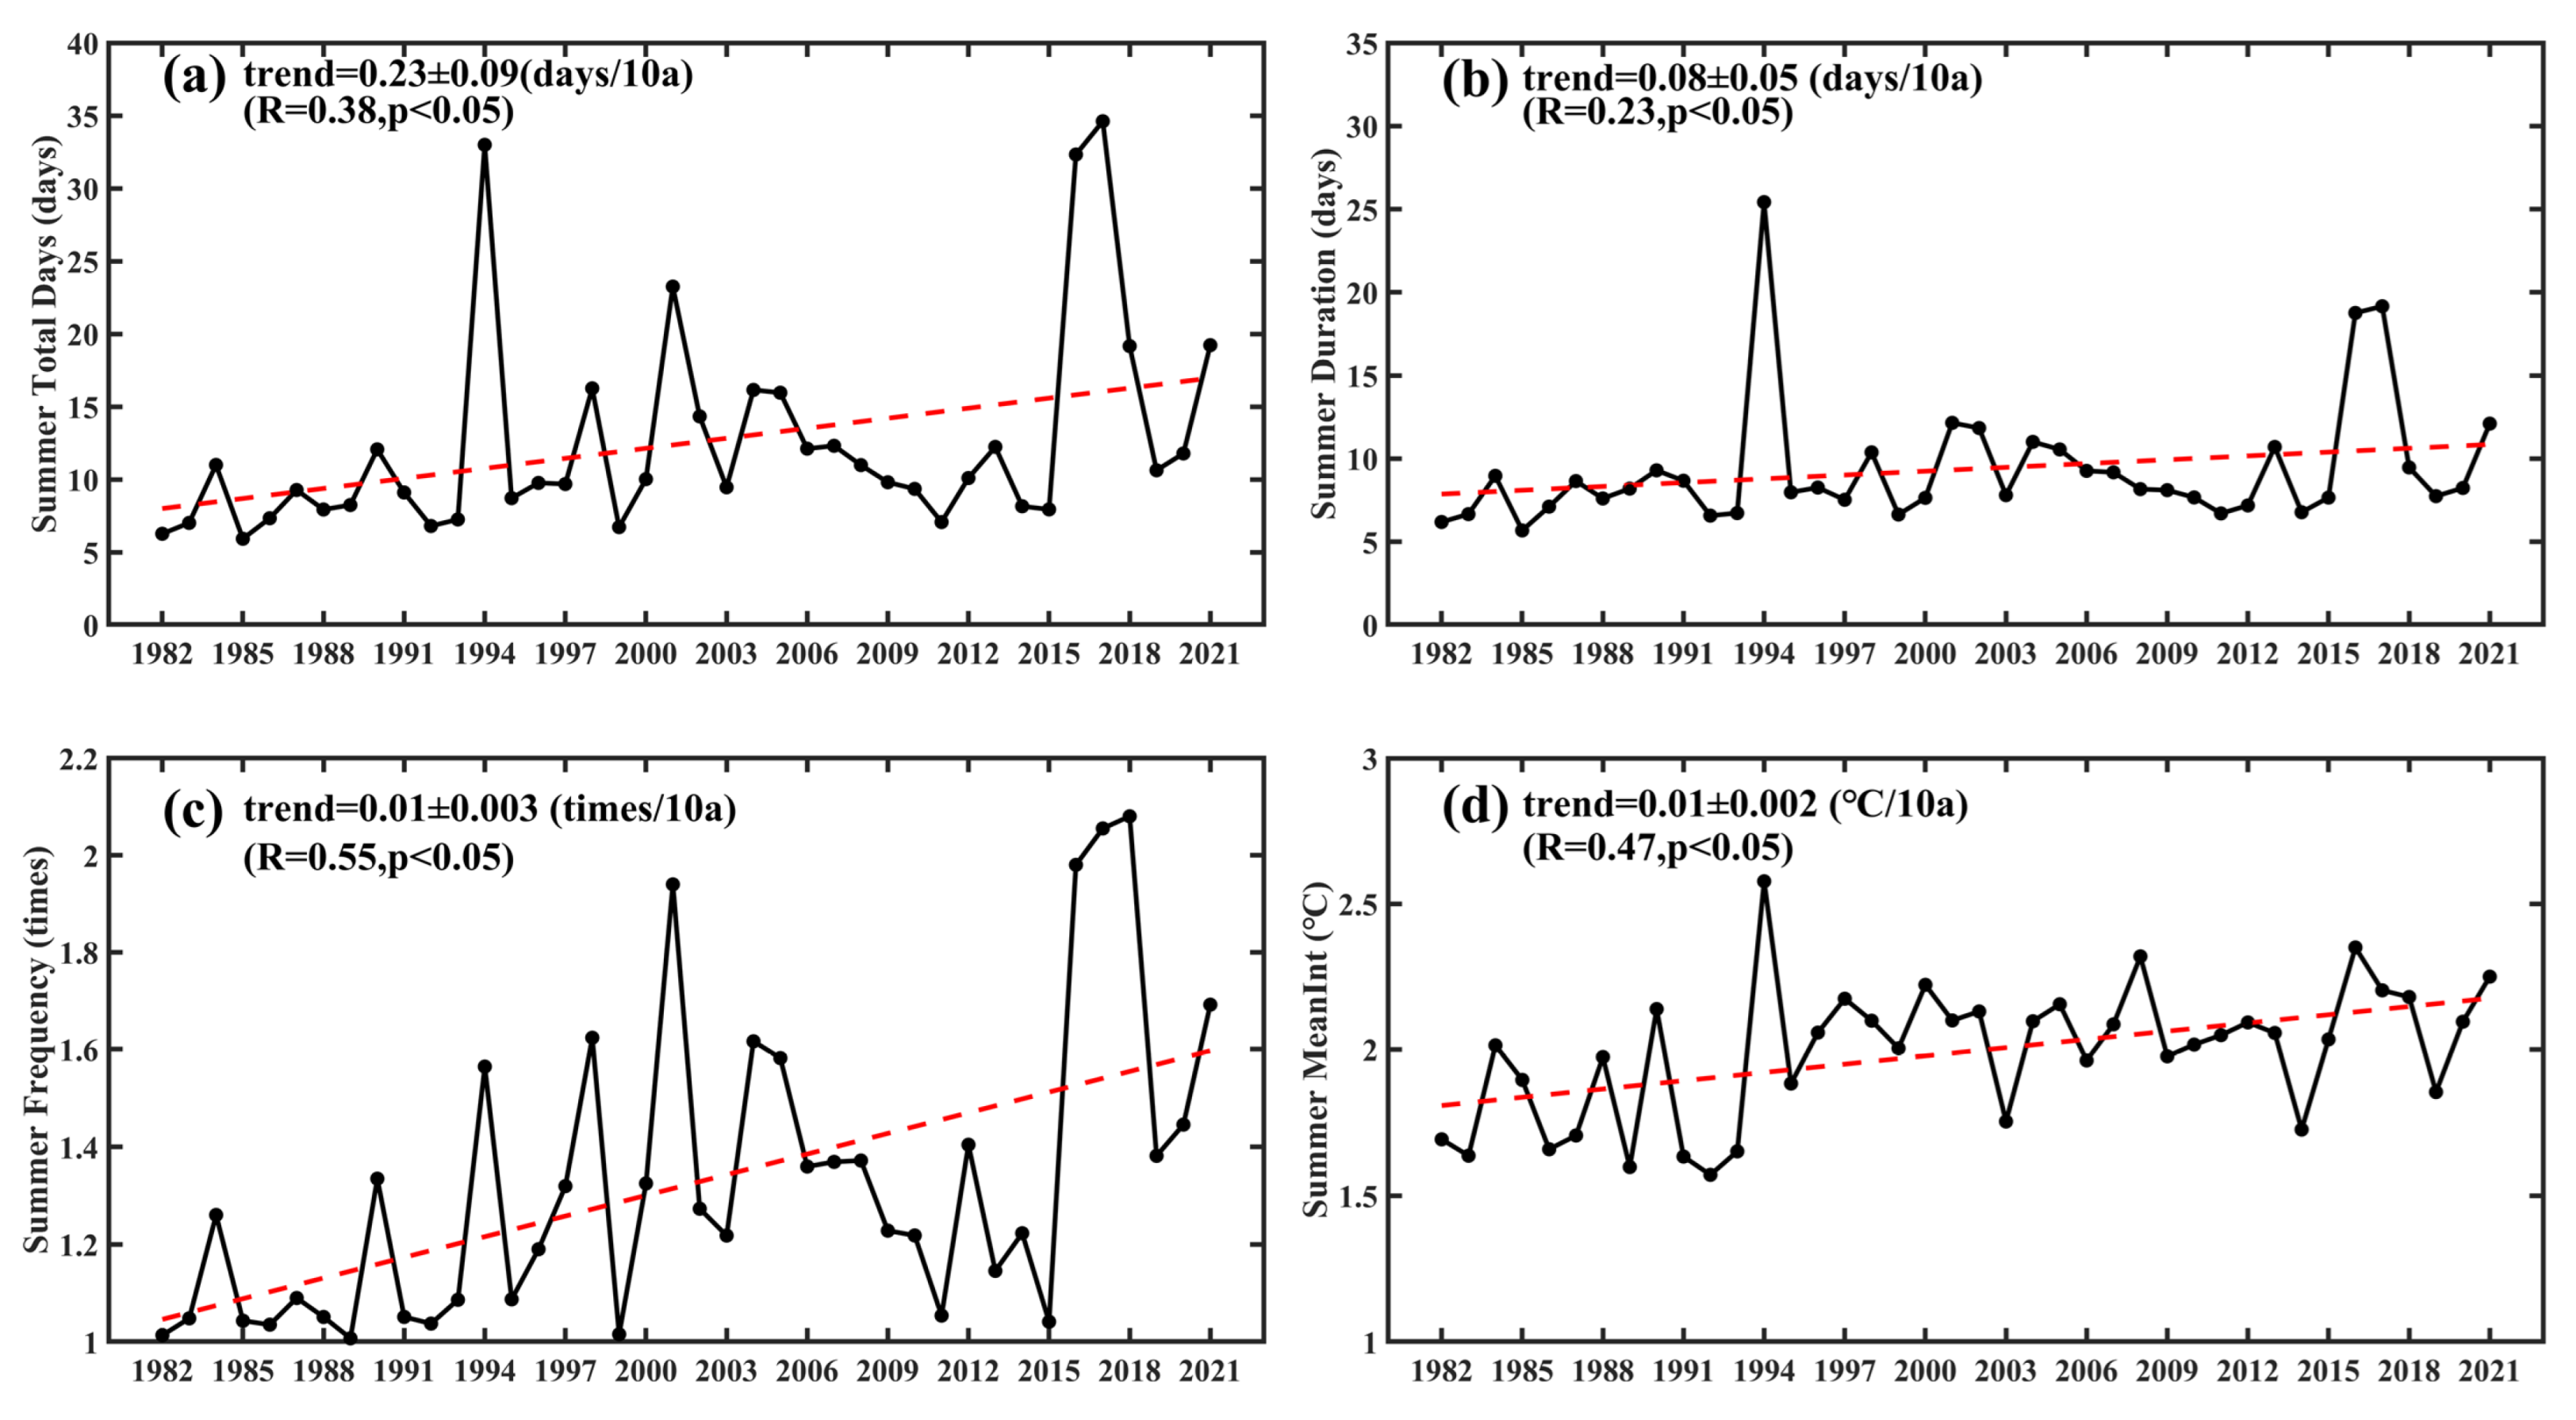
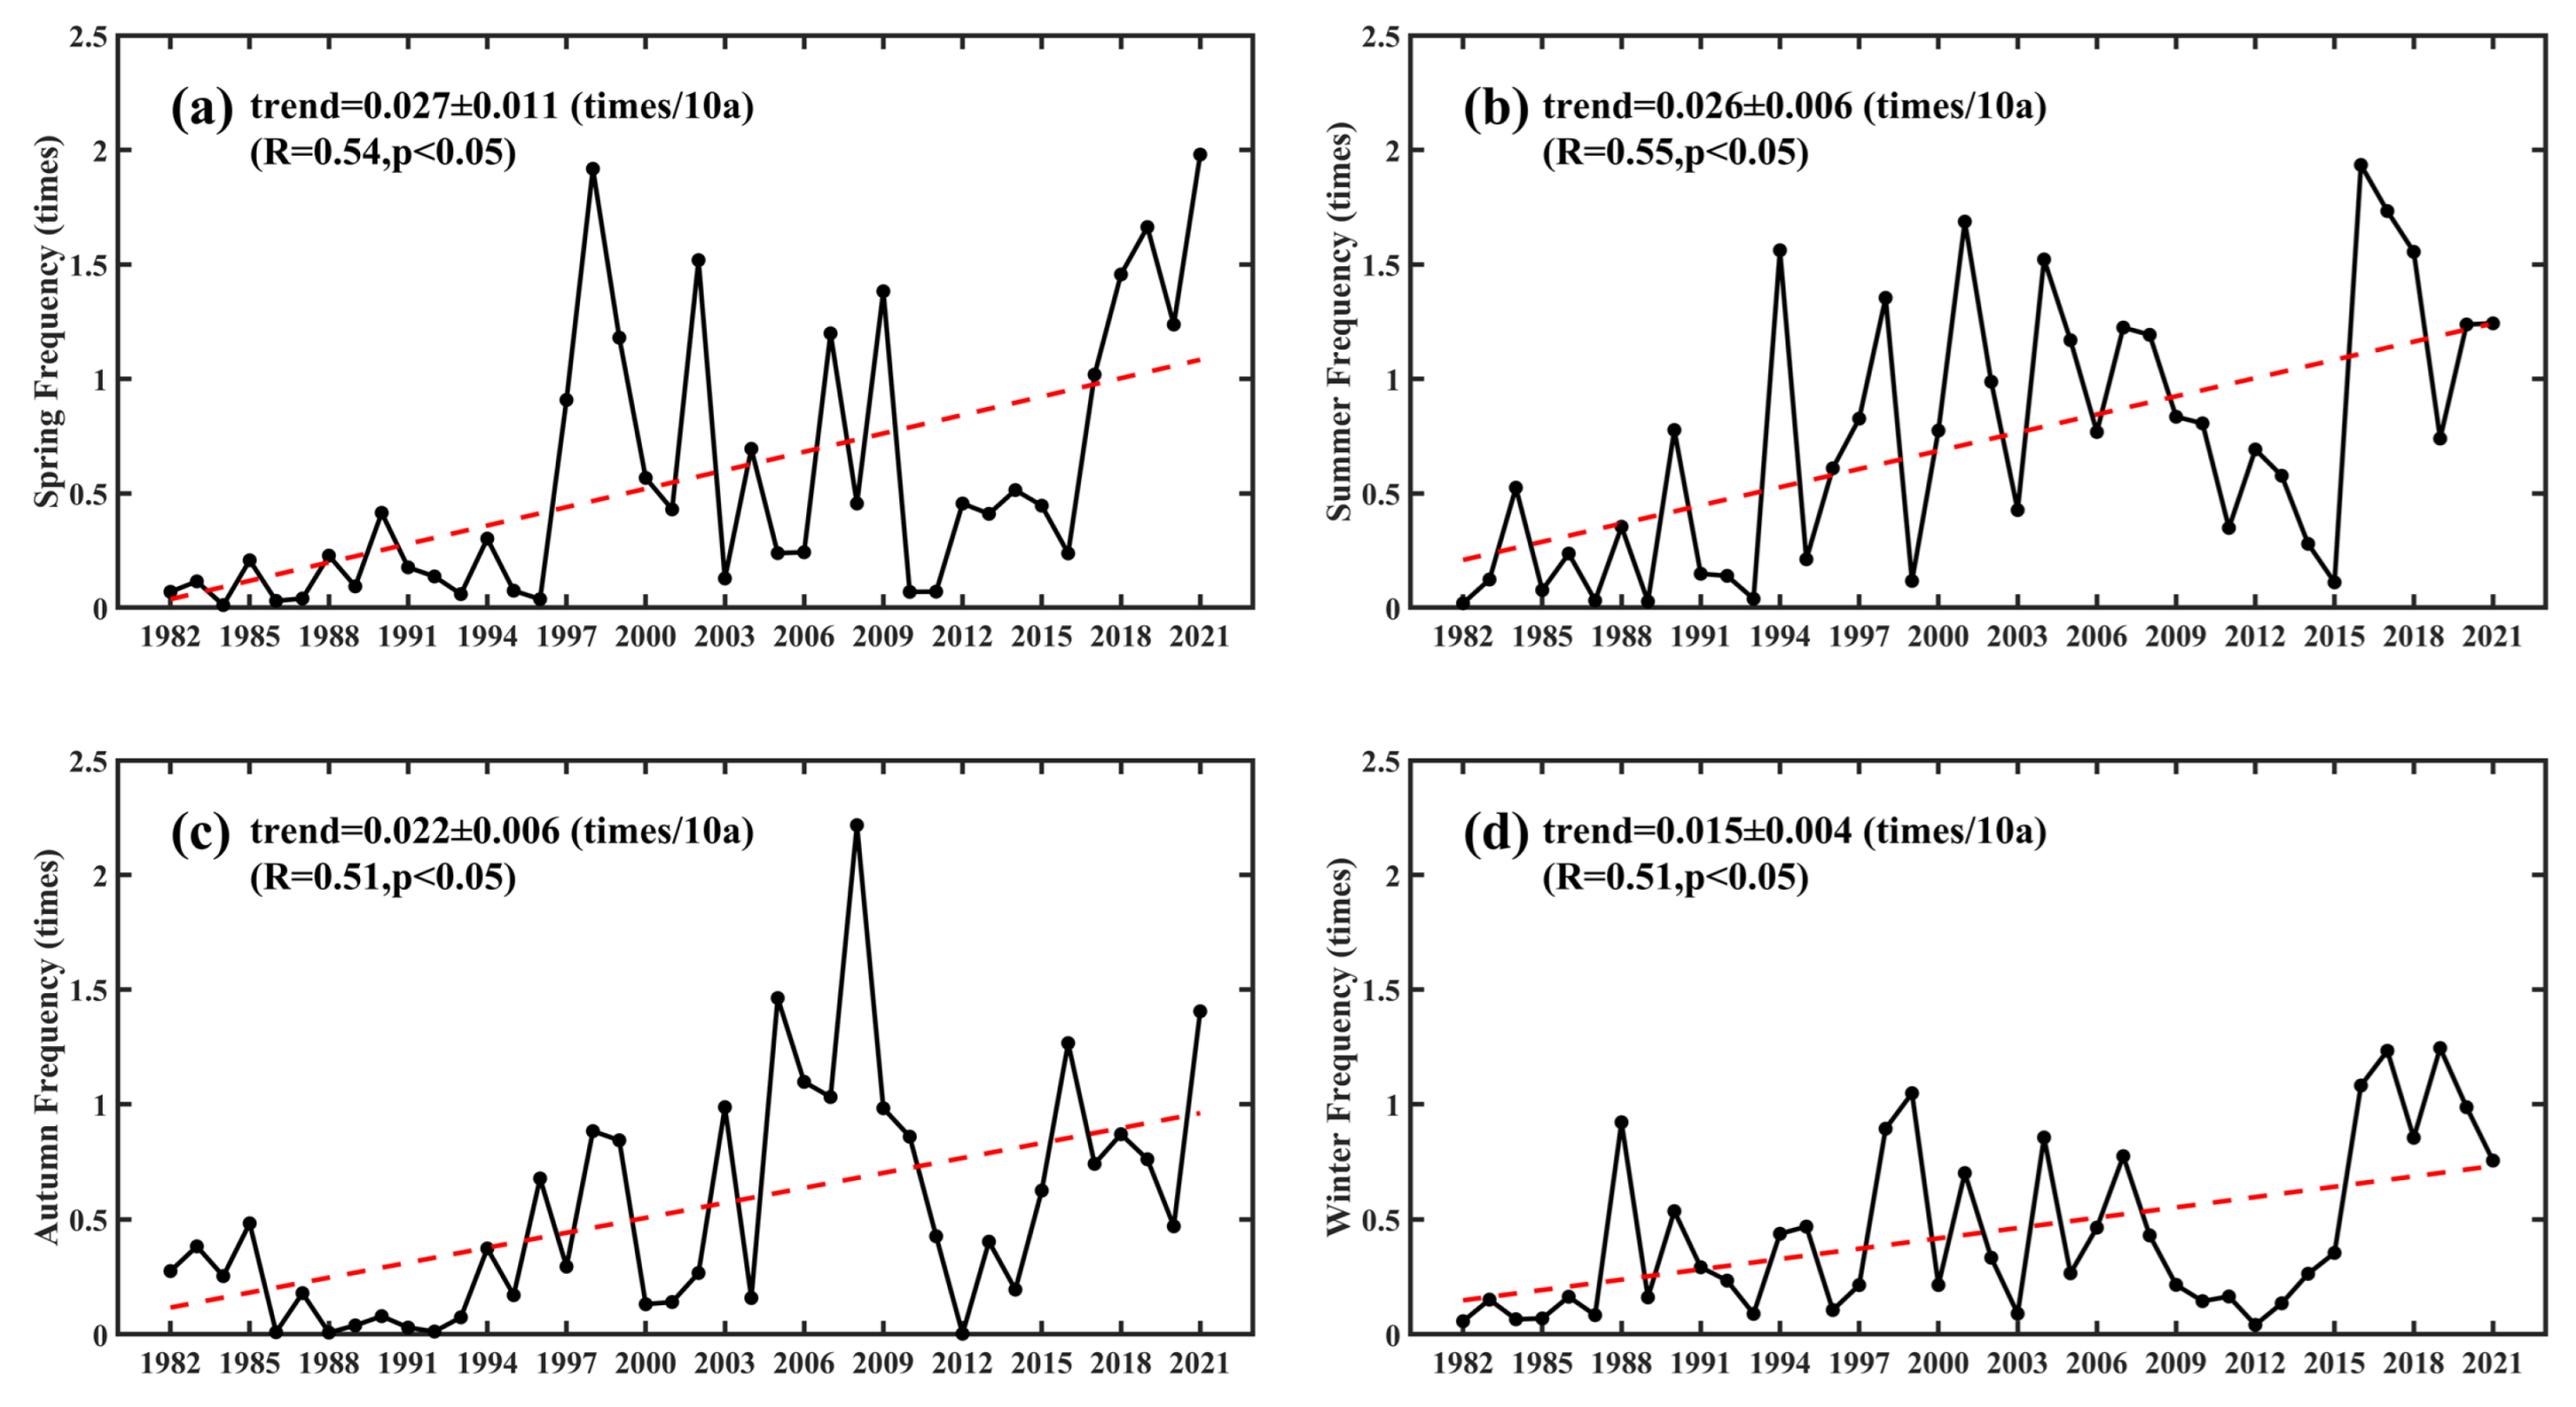
3.3.2. Temporal Evolution of MHWs in Summer (1982–2021)
4. Discussion
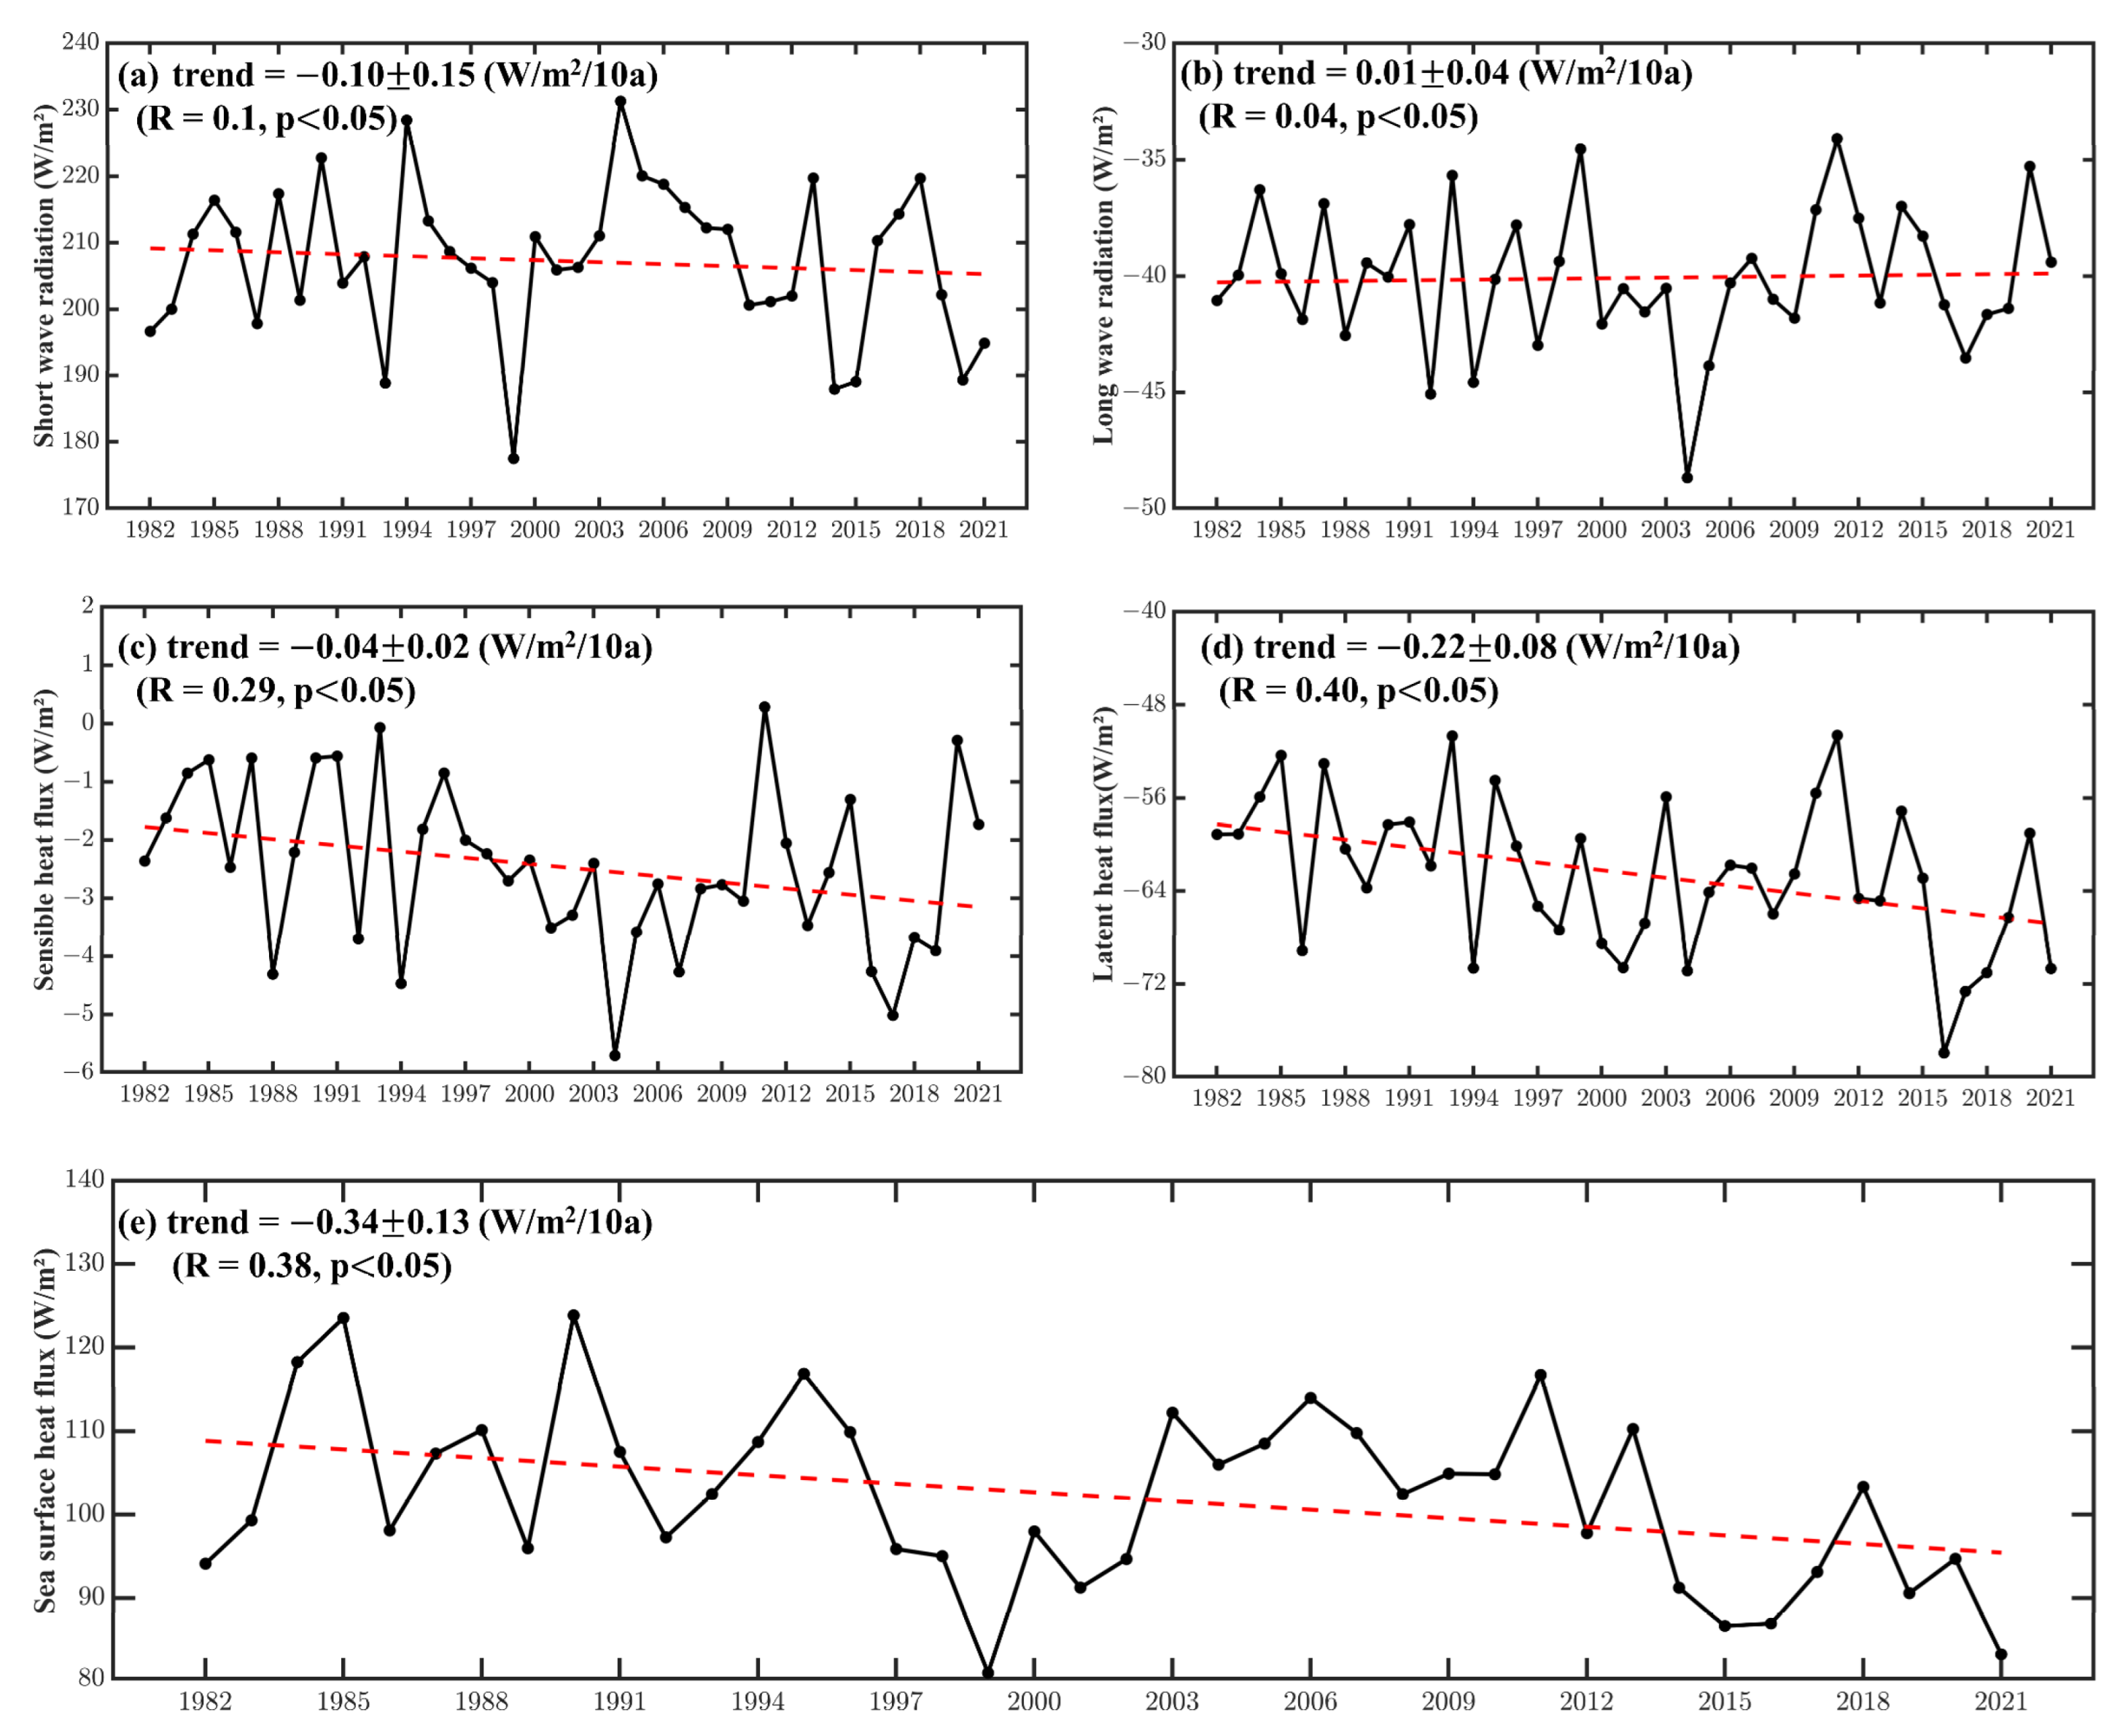
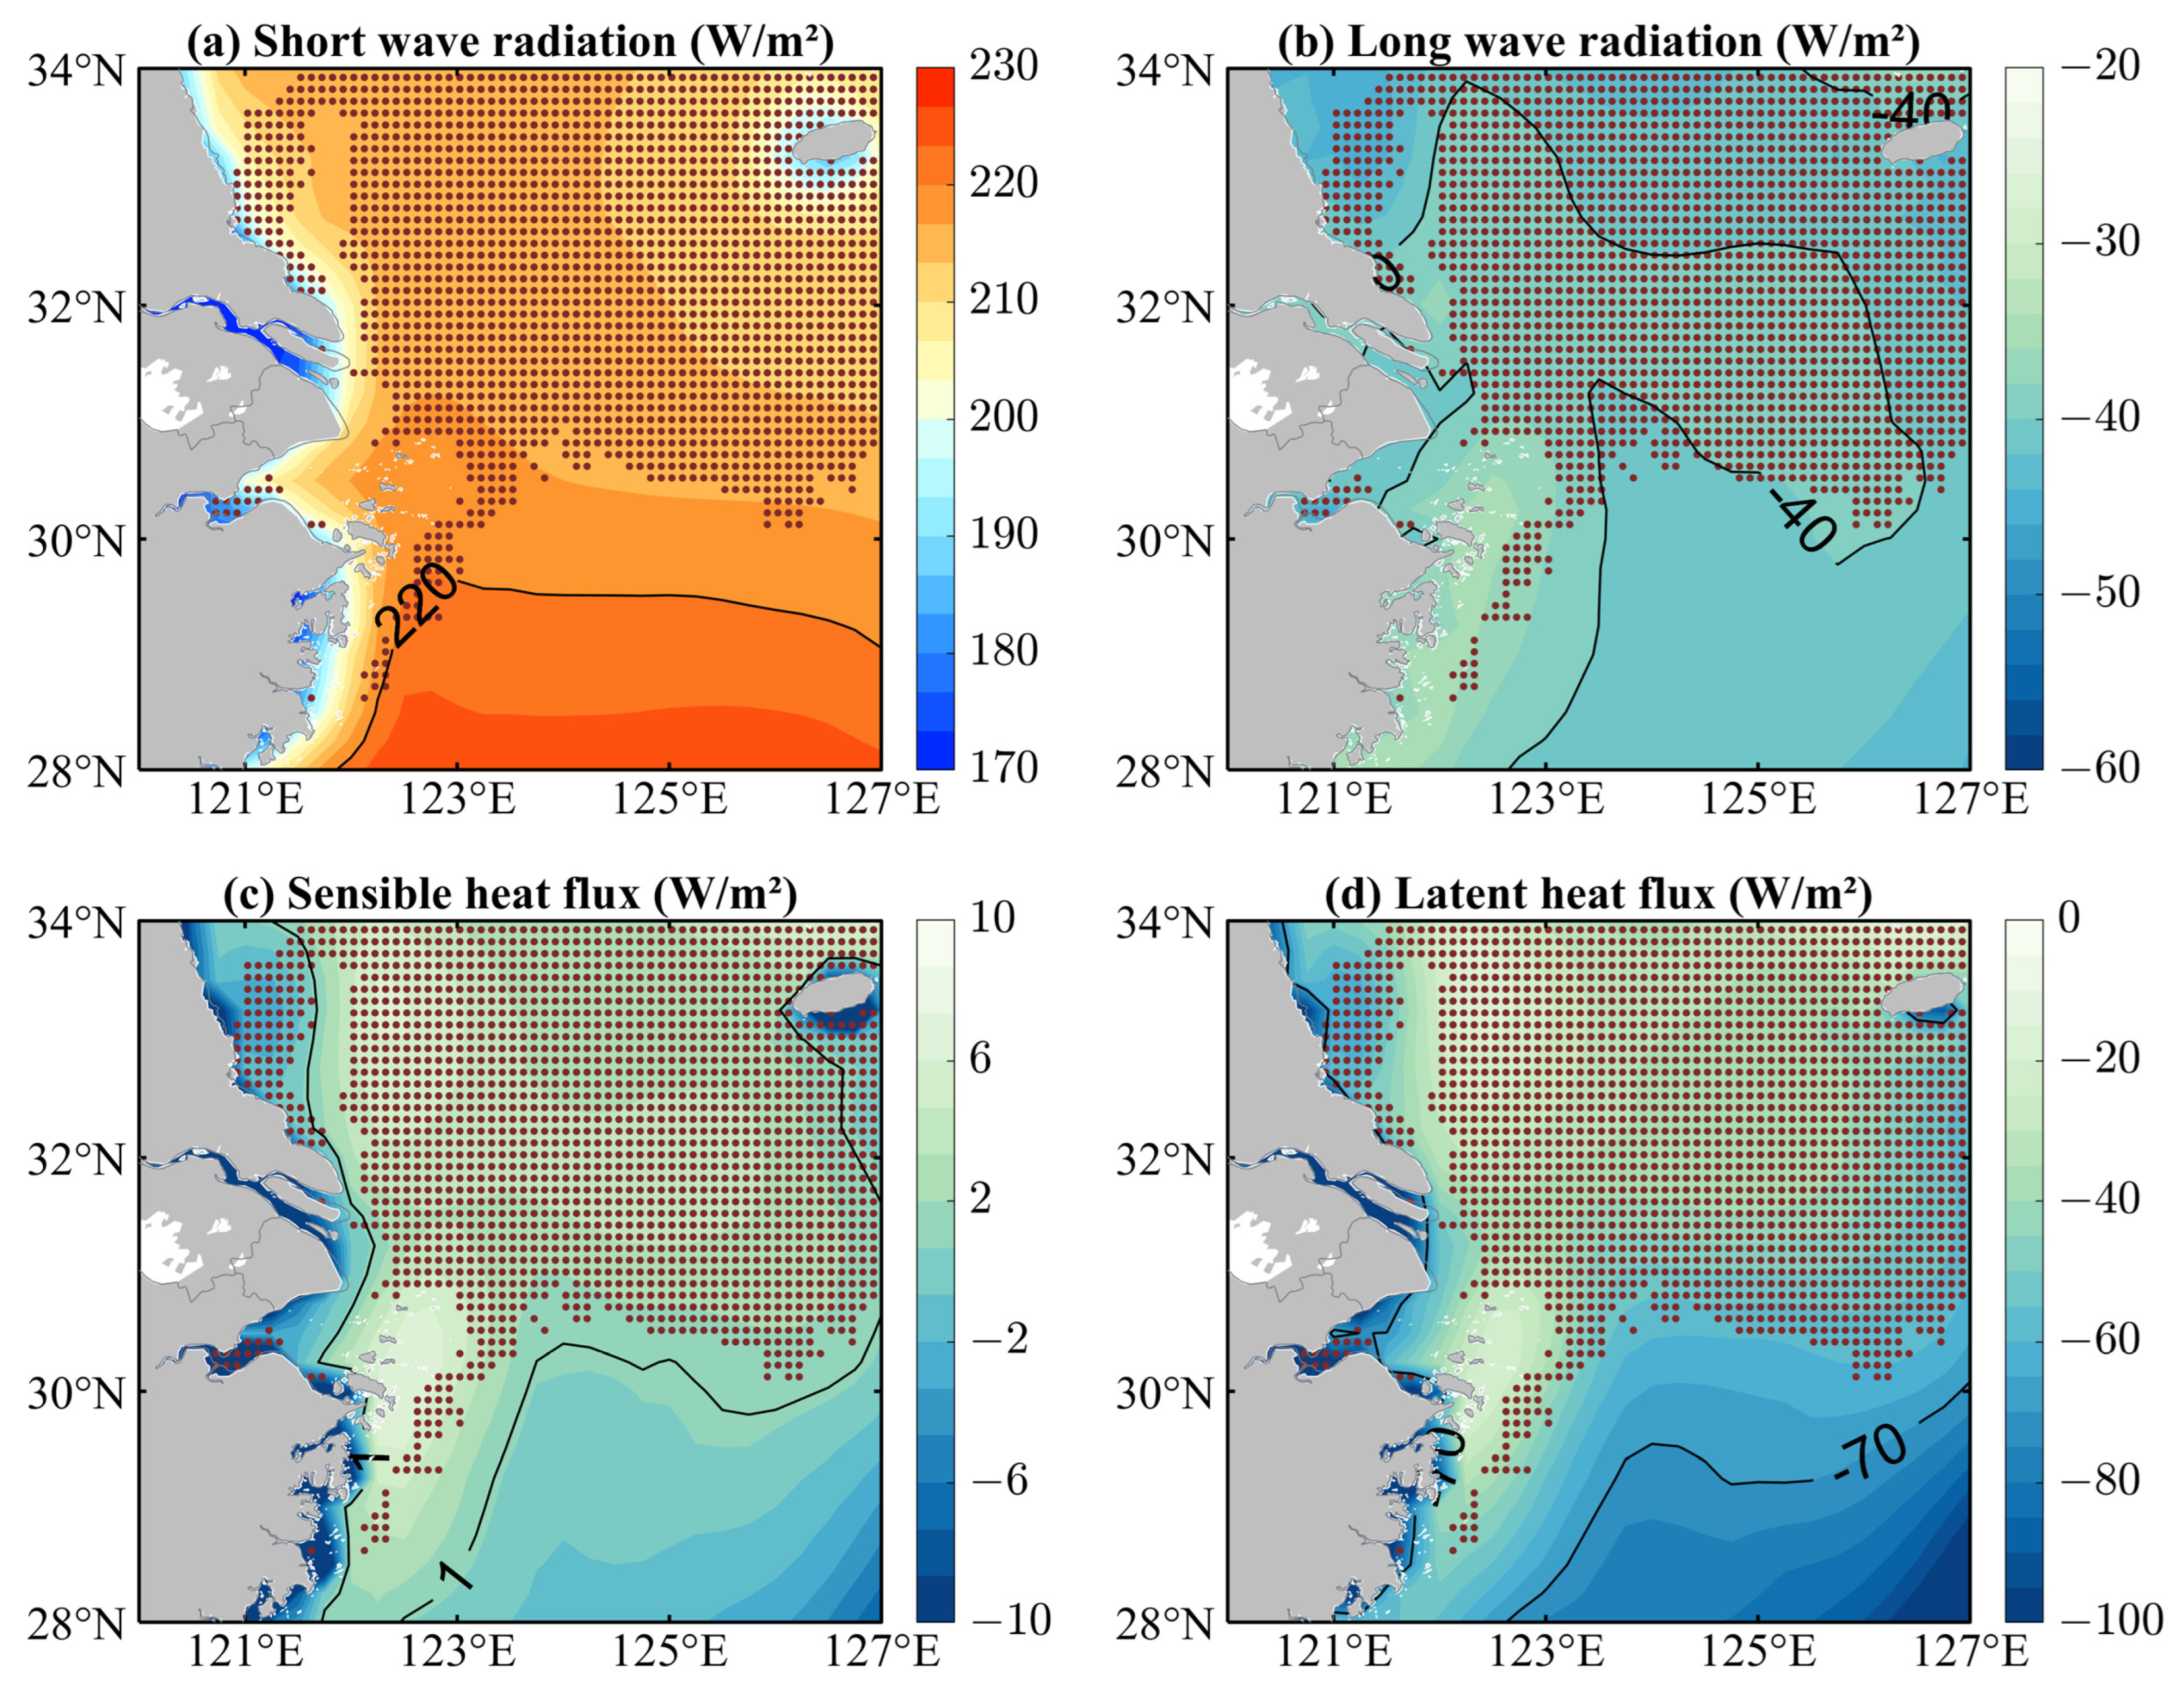
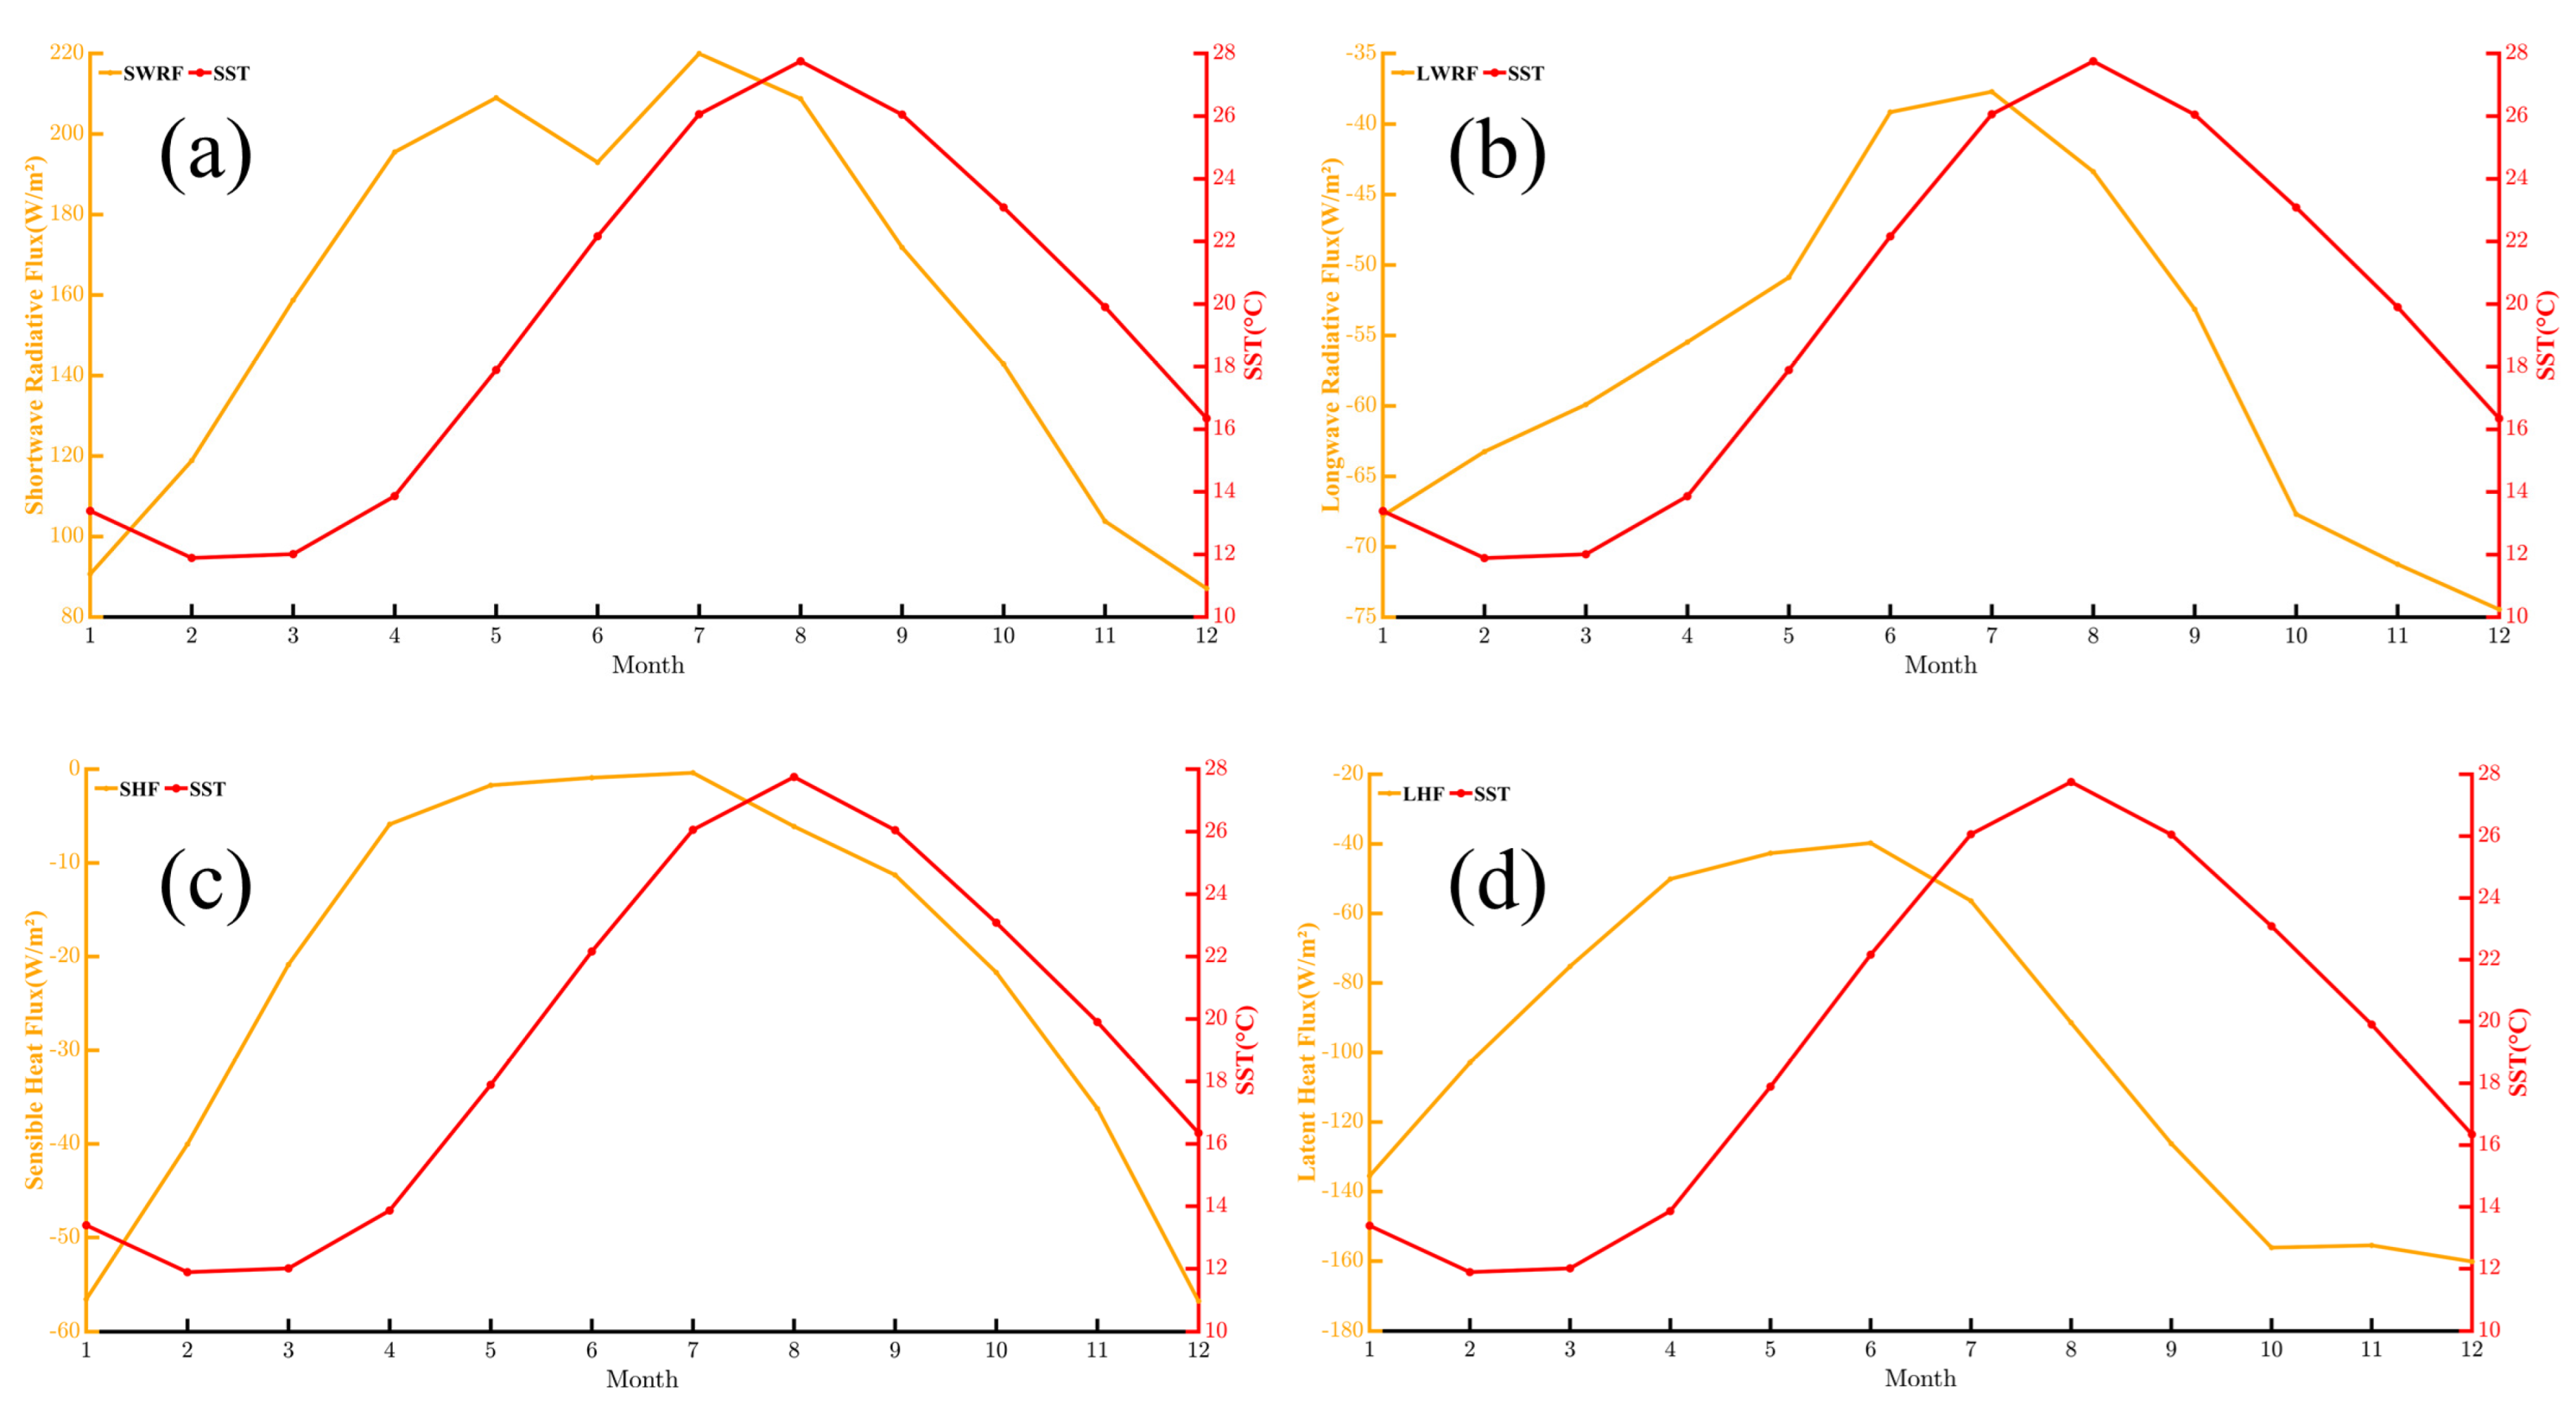
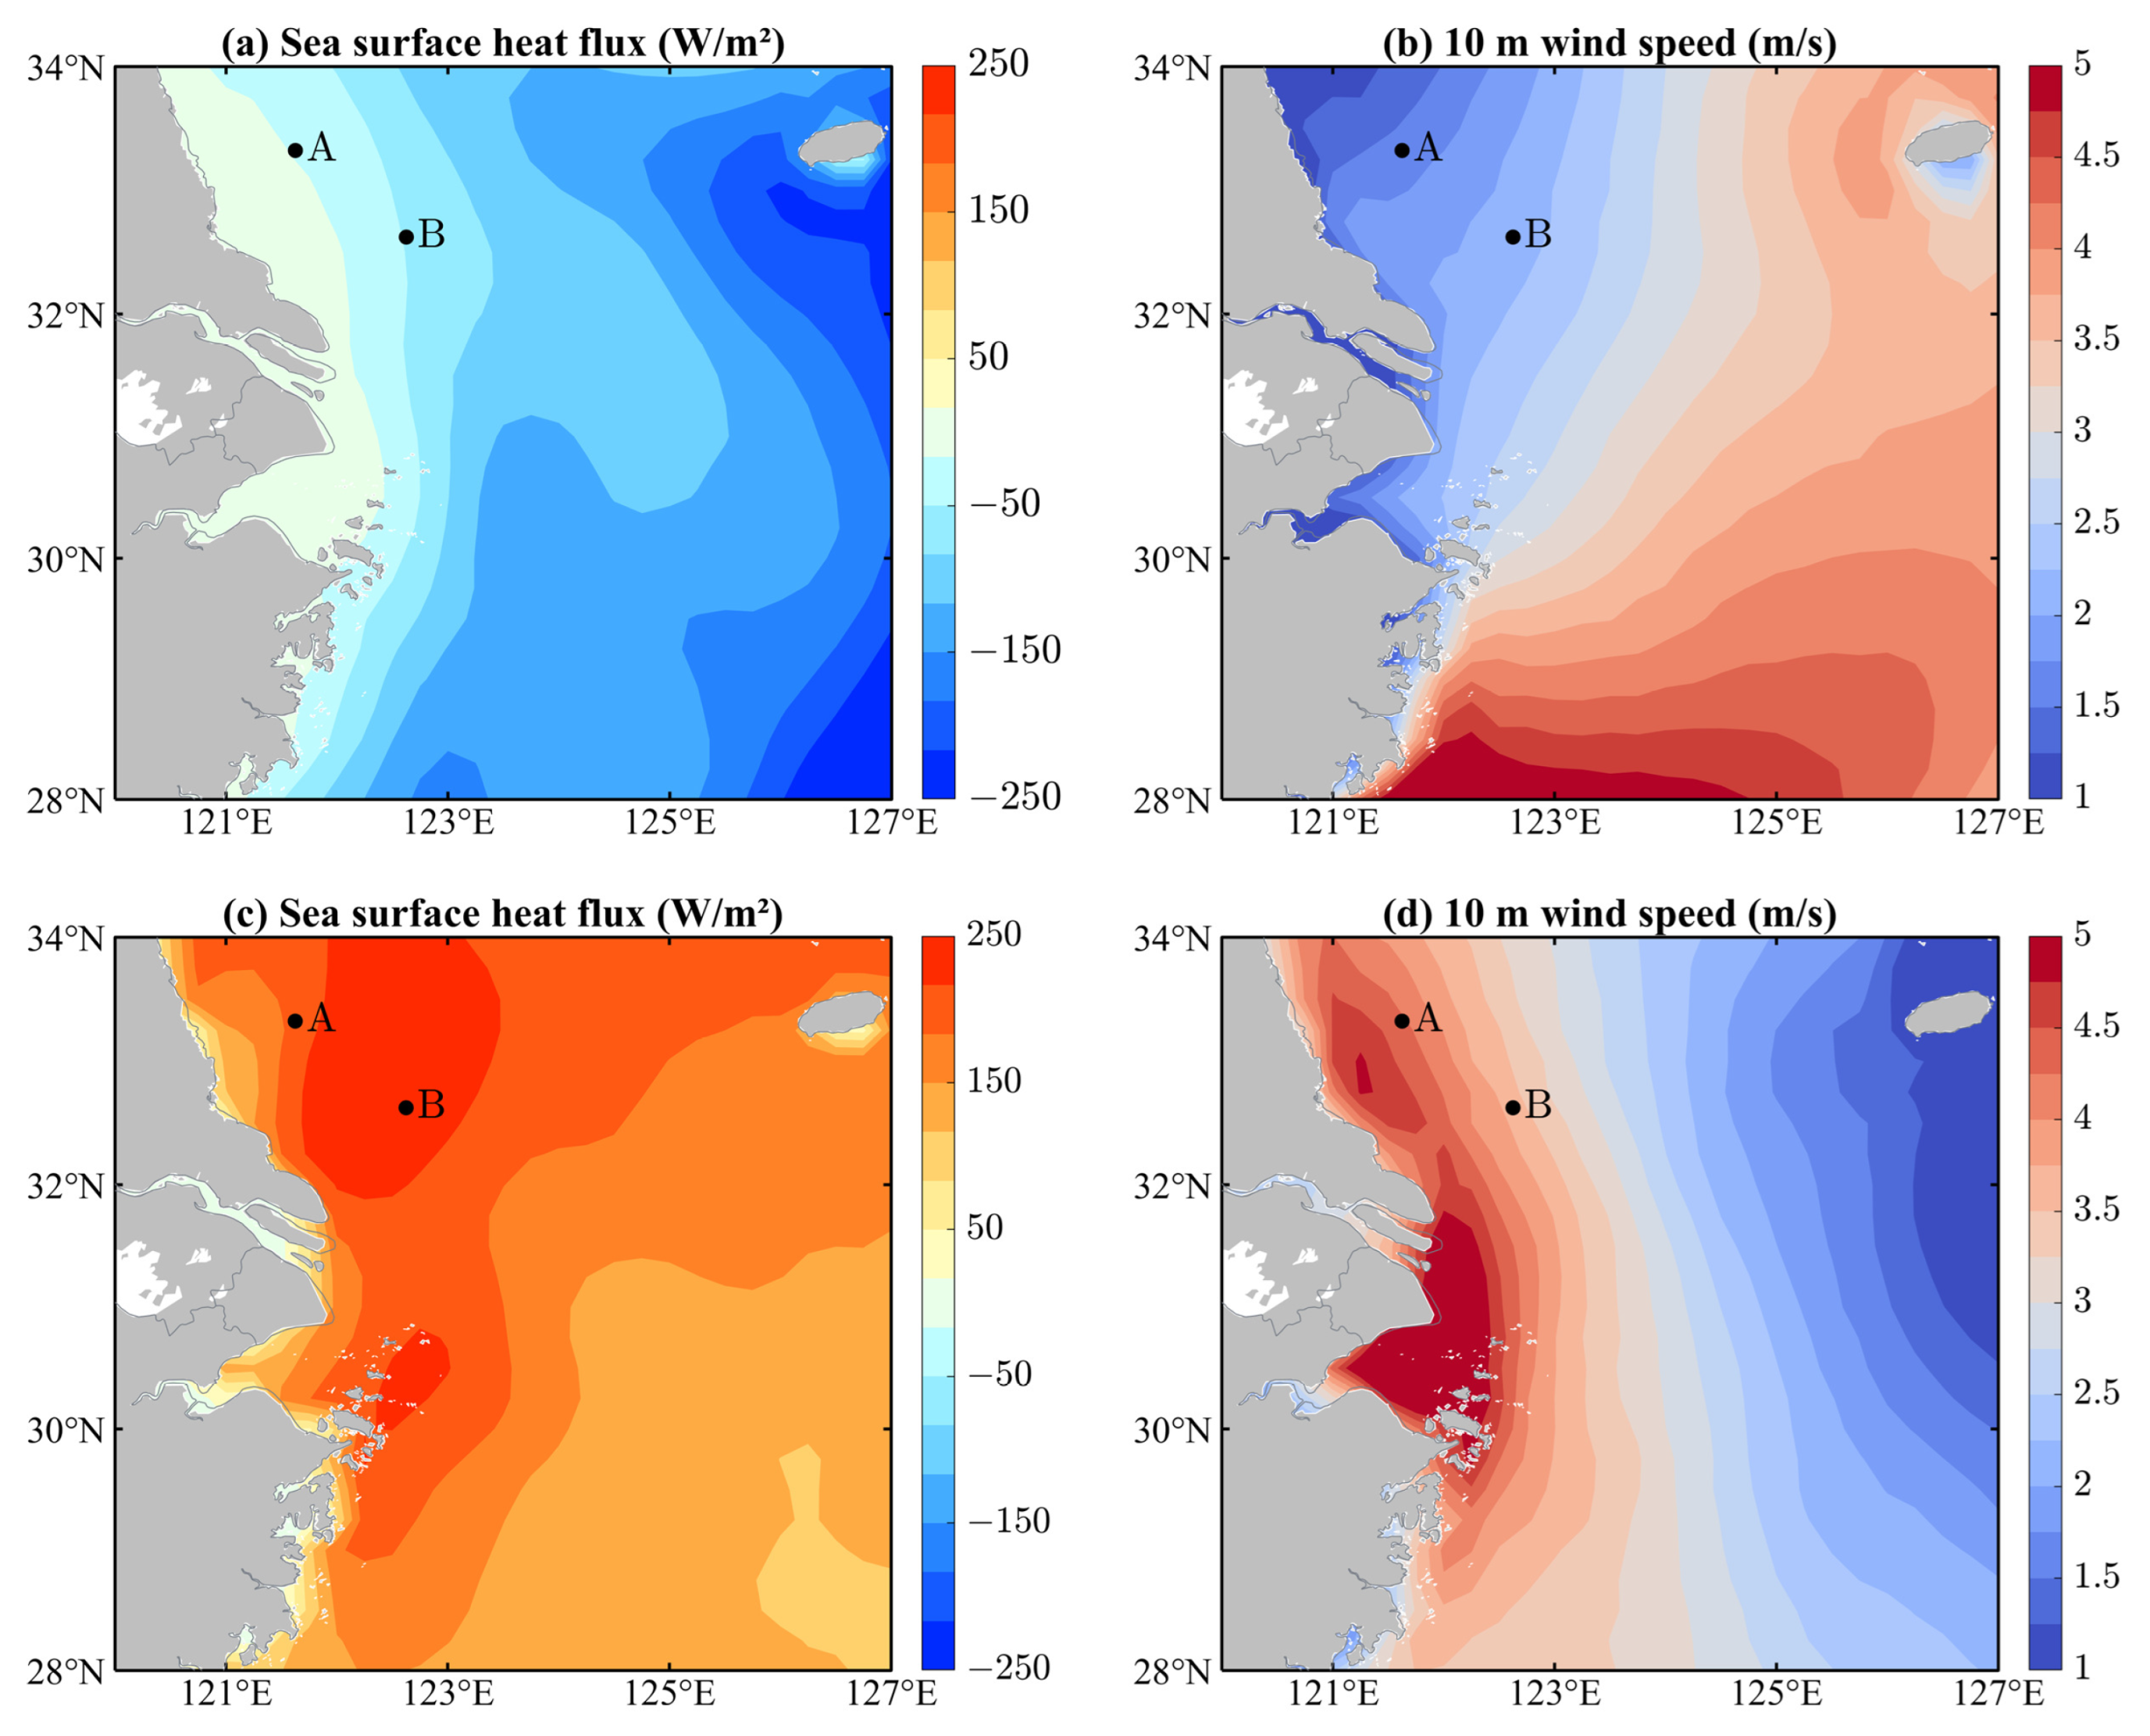
4.1. Influence of Sea Surface Heat Flux
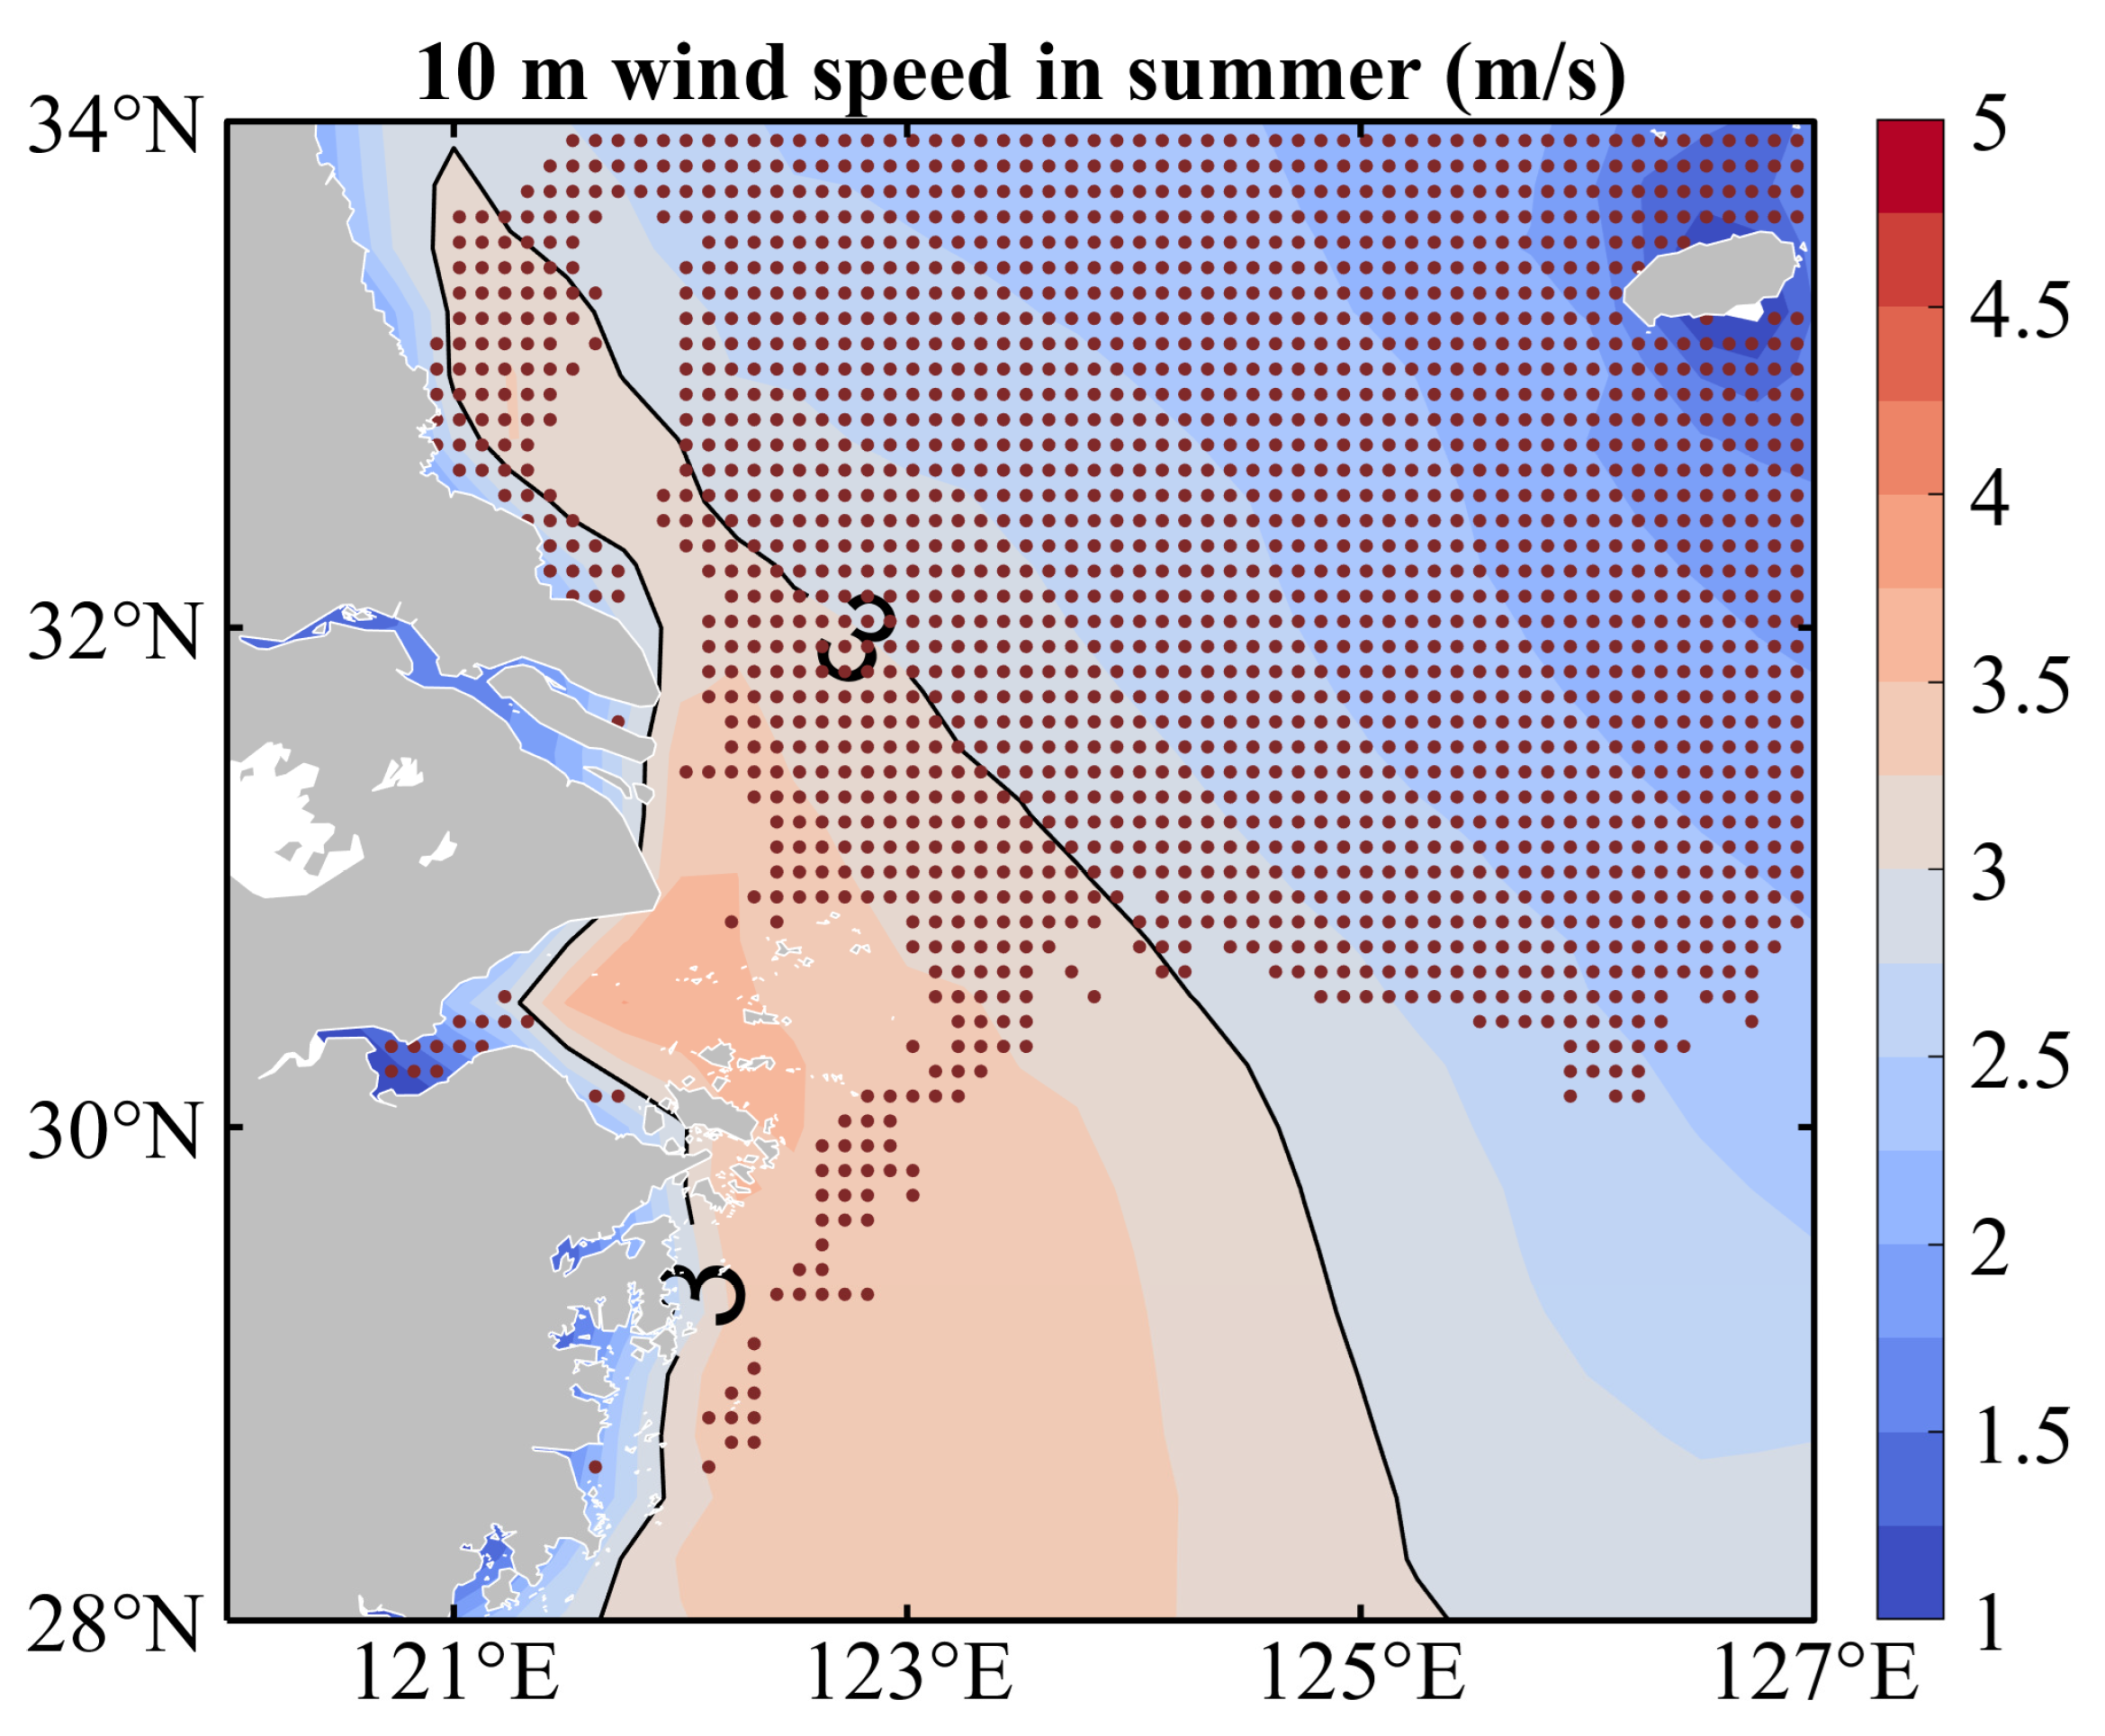
4.2. Influence of Wind
4.3. Influence of El Niño
5. Conclusions
- Two severe MHW events were recorded in the study area. The first event occurred from 9 October 2006 to 17 April 2007 at the geographical coordinates of 124.225° E, 33.375° N. The second took place from 5 July to 1 August 1994 at the coordinates of 124.425° E, 32.125° N, with an average intensity of 4.93 °C;
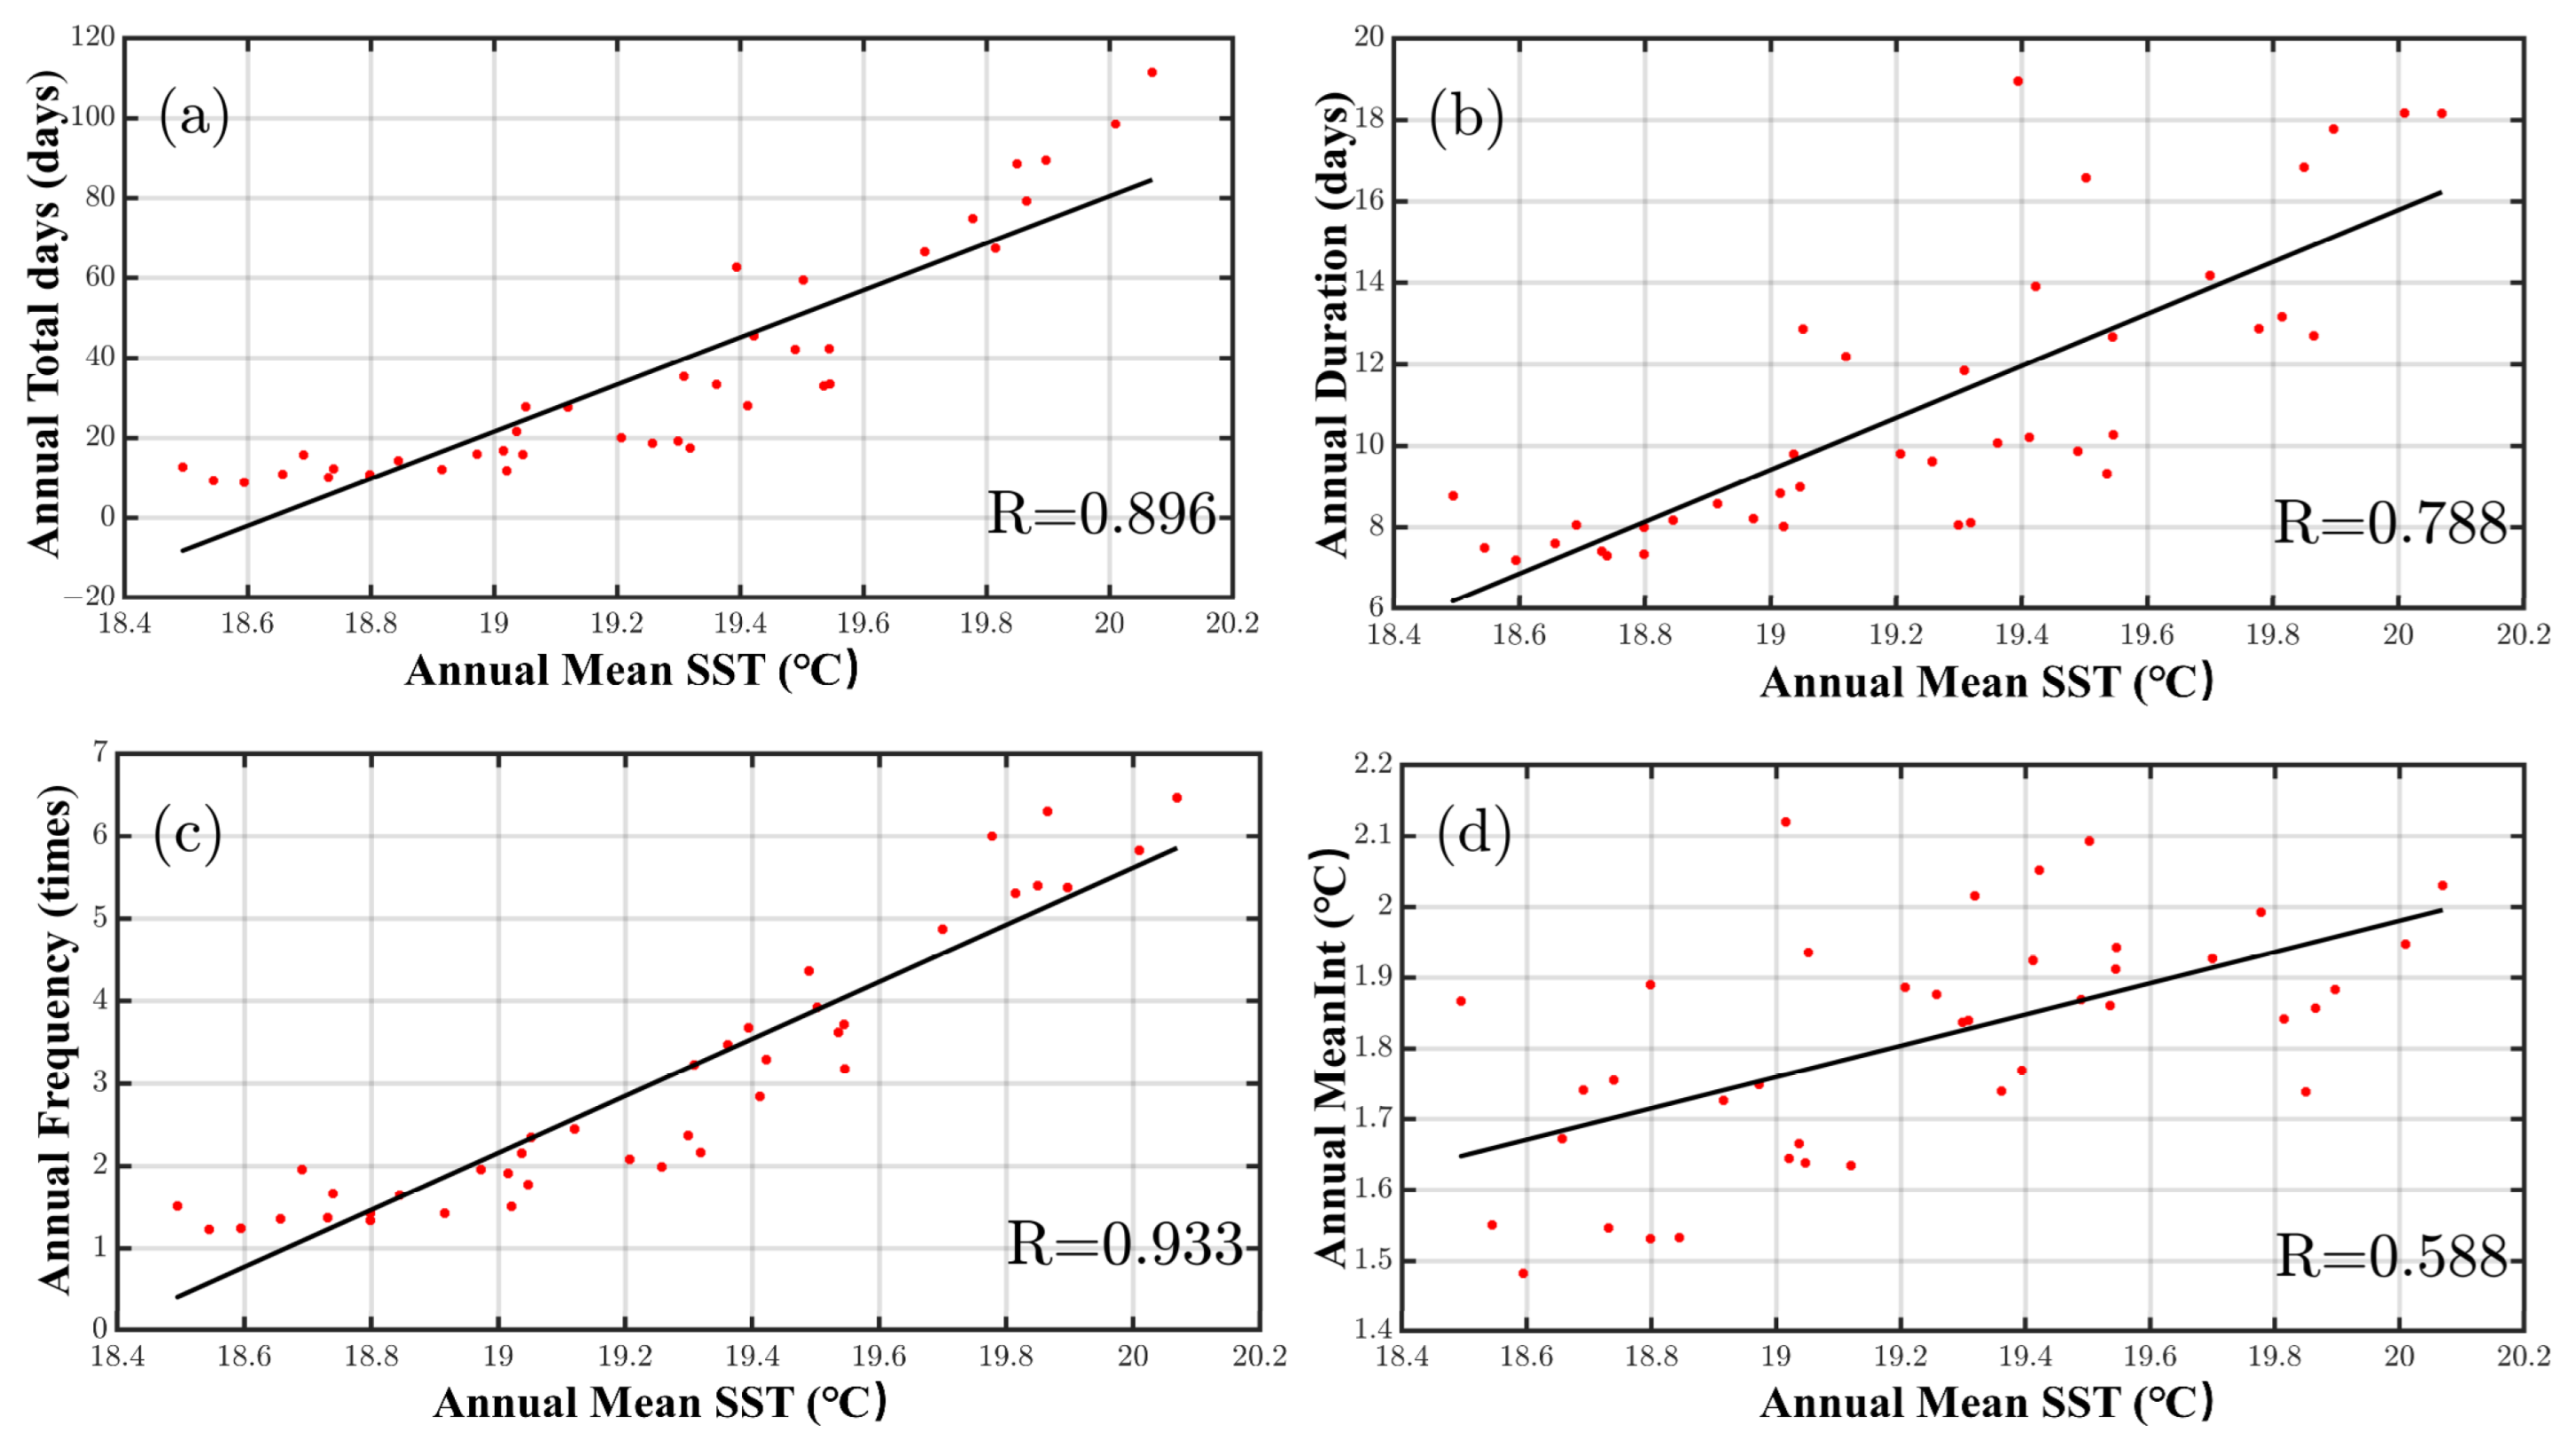
- From 1982 to 2021, MHWs were significantly more frequent and intense along the coasts of Jiangsu, Shanghai, and Zhejiang. Moreover, key indicators of MHWs in the study area showed statistical significance (p > 0.01) in most marine regions. At the same time, there was an increasing trend in the total days (3.5 days/decade), duration (0.4 days/decade), and frequency (0.15 times/decade) of MHWs throughout the entire year. And the four indices showed a strong correlation with the annual mean sea surface temperature;
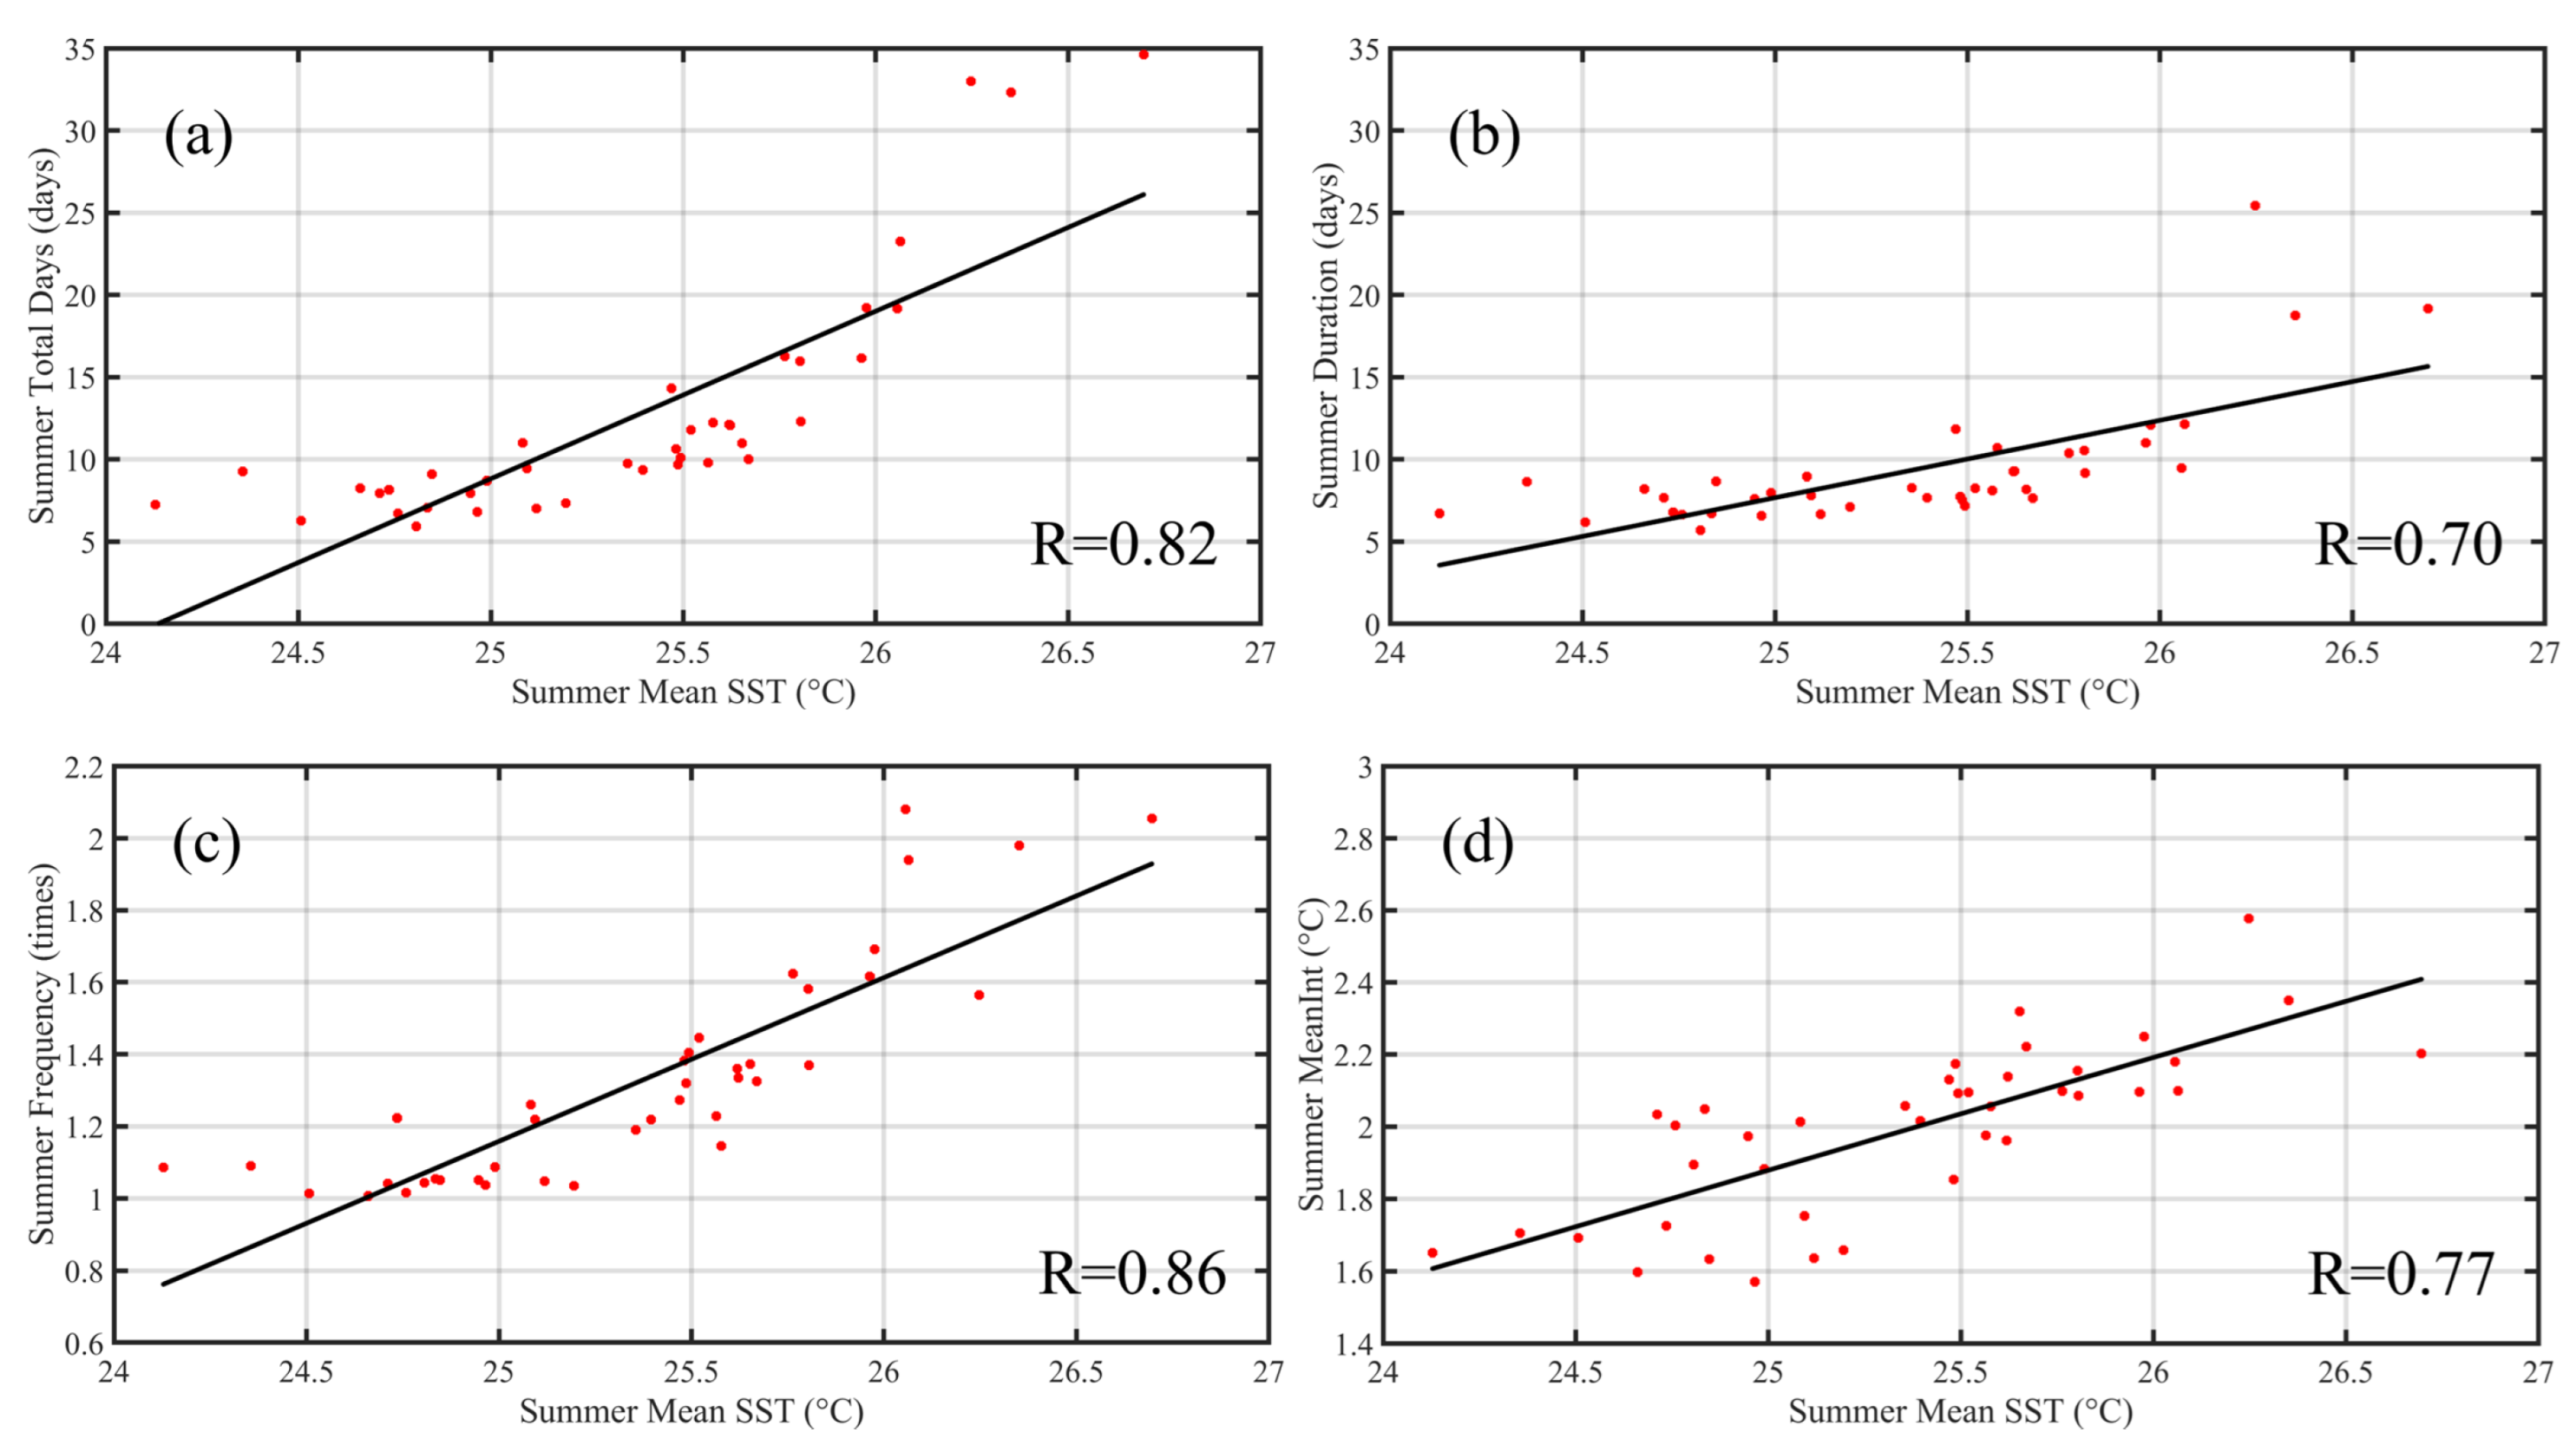
- Various indicators of MHWs during the summer season from 1982 to 2021 exceeded those of other seasons. The spatial distribution of these indicators closely resembled the overall MHW’s characteristics throughout the entire year, with relatively indistinct changing trends. The summer MHW’s total days and frequency along the Jiangsu coast showed a trend value within the range of 0.4 °C/10 years (p > 0.05);
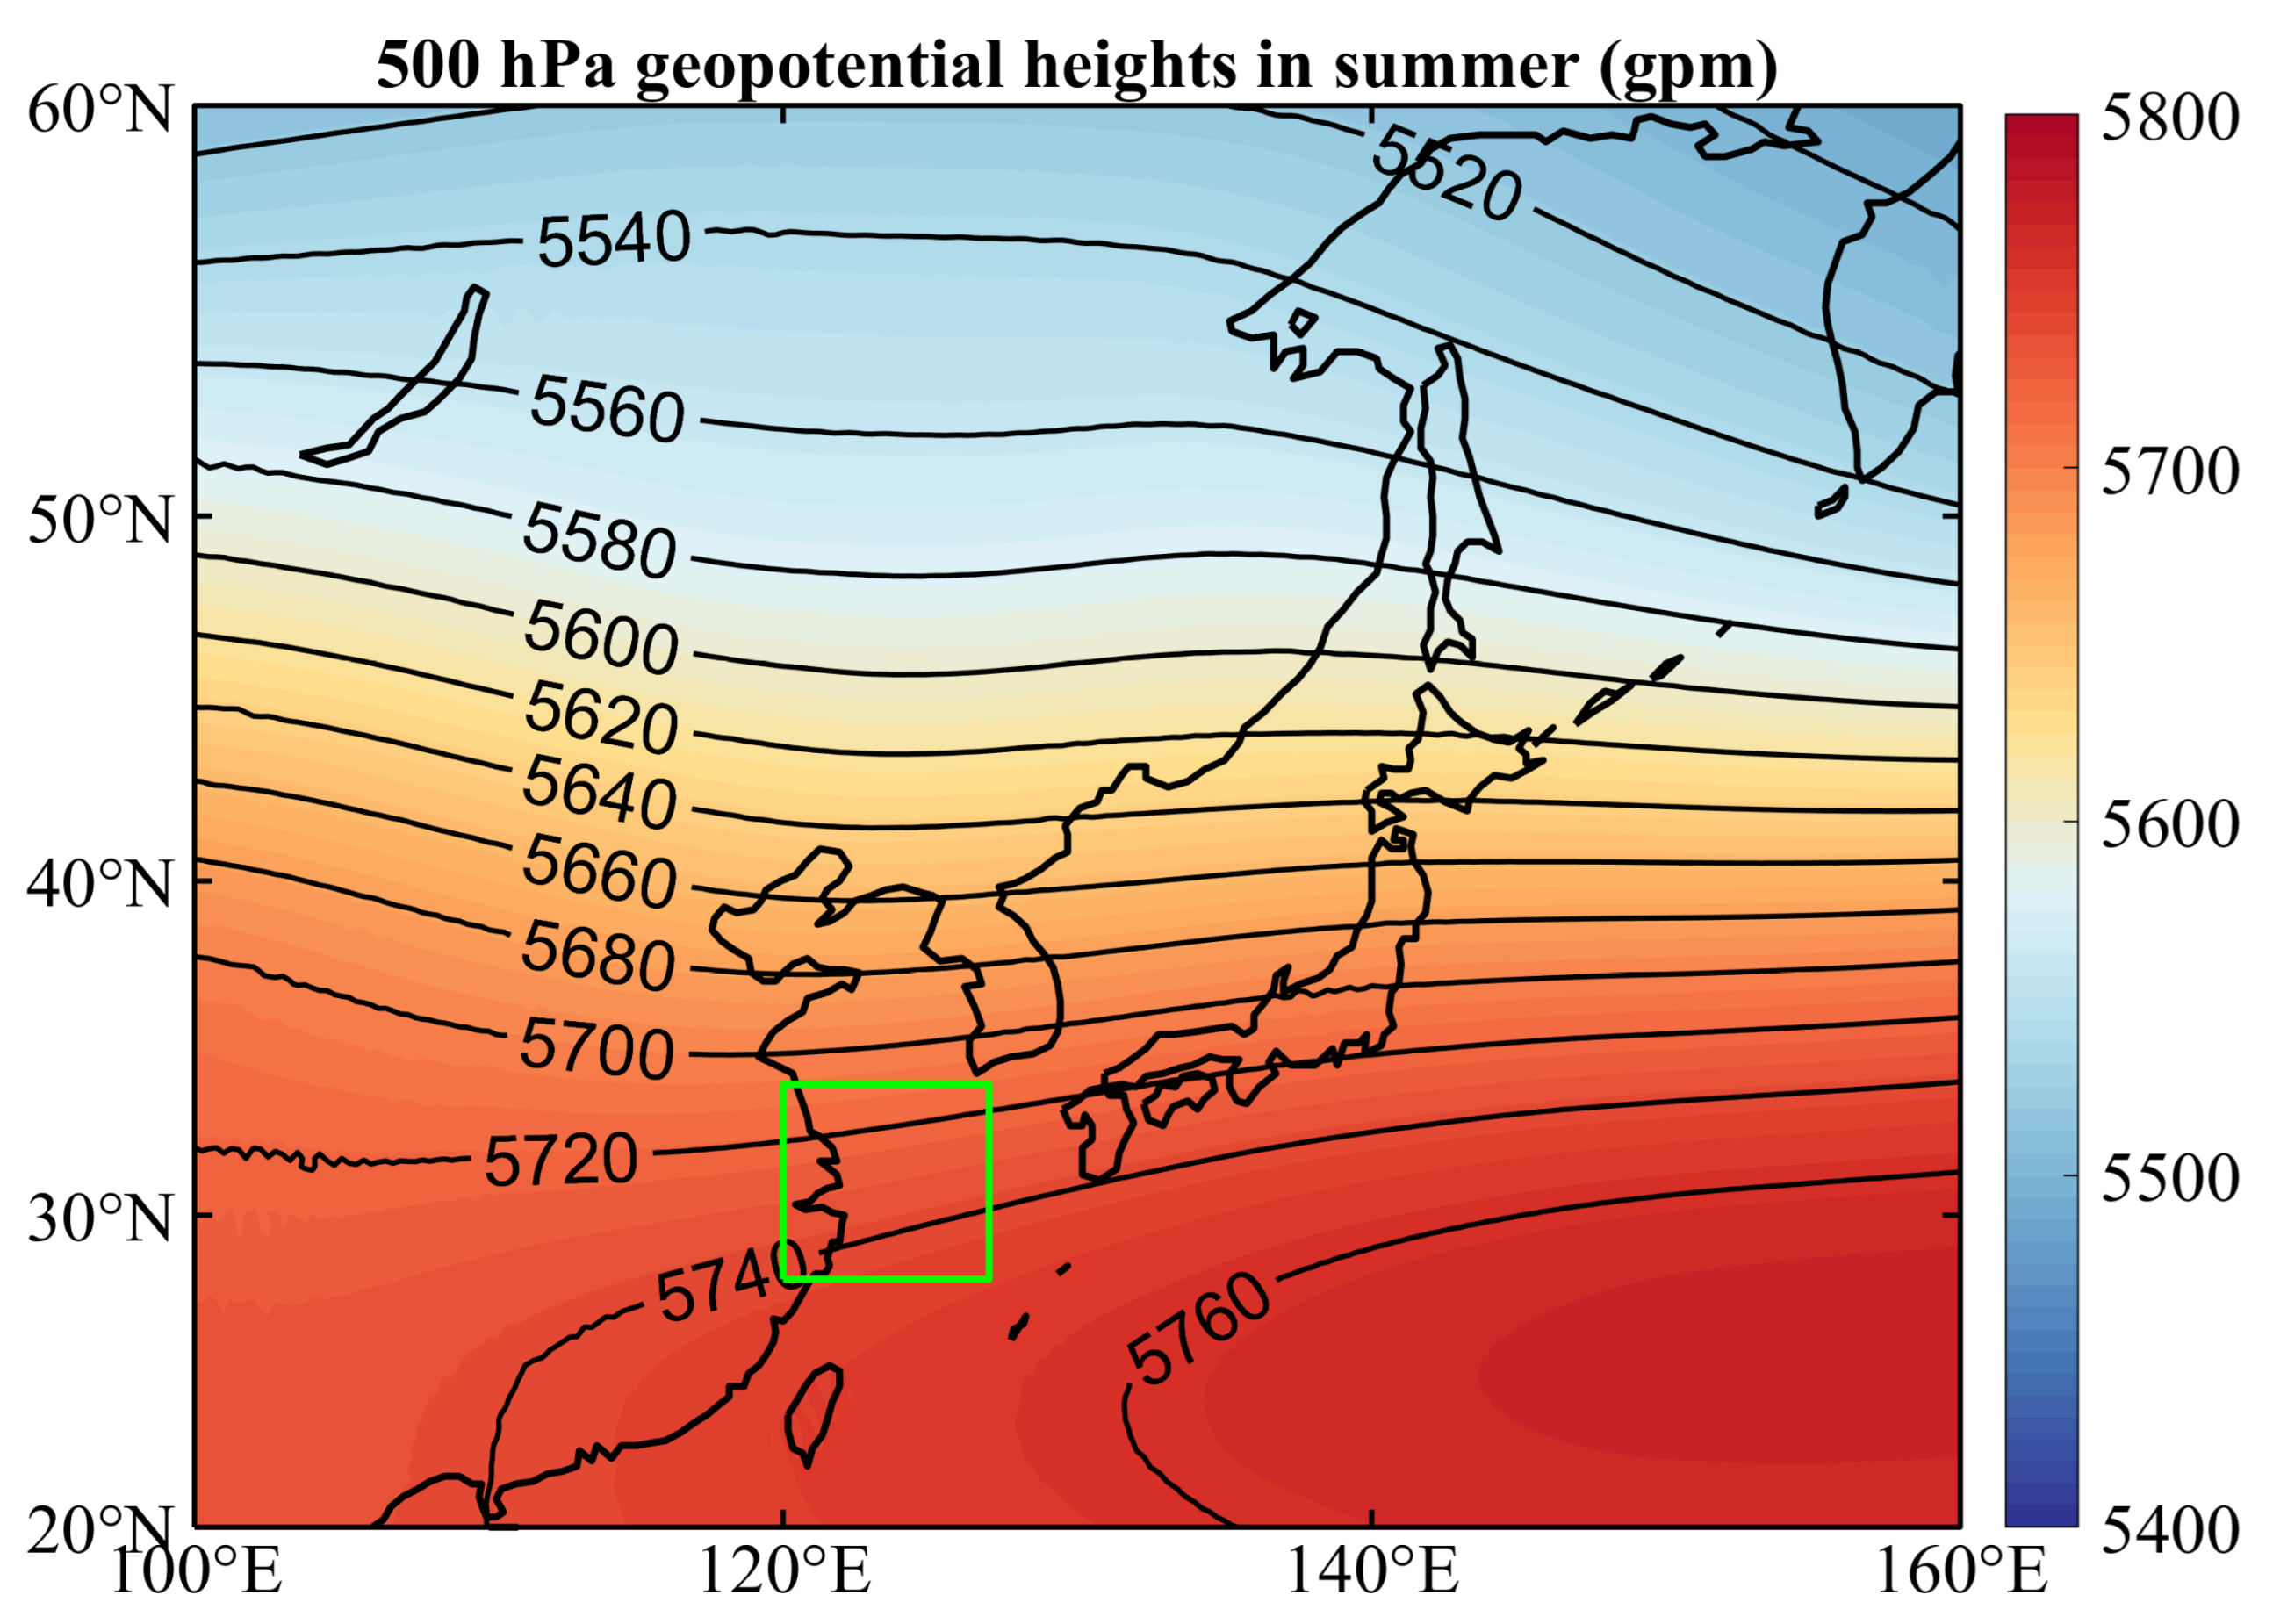
- During the summer season, the occurrence of MHWs was facilitated by the influence of the subtropical high-voltage system. Under its control, cloud cover decreased, leading to increased solar radiation. Additionally, the weaker wind speeds contributed to a decrease in ocean heat loss. These combined factors created favorable conditions for the occurrence of summer MHWs. Simultaneously, powerful El Niño events contributed to some extent to the increased summer MHW intensity.
- Event A was primarily driven by weak wind speeds, while event B was predominantly influenced by the large sea surface heat flux. Despite their proximity, the characteristics of MHWs can vary significantly between these events, owing to the complex underlying mechanisms.
Author Contributions
Funding
Institutional Review Board Statement
Informed Consent Statement
Data Availability Statement
Conflicts of Interest
References
- Hobday, A.J.; Alexander, L.V.; Perkins, S.E.; Smale, D.A.; Straub, S.C.; Oliver, E.C.J.; Benthuysen, J.A.; Burrows, M.T.; Donat, M.G.; Peng, M.; et al. A hierarchical approach to defining marine heatwaves. Prog. Oceanogr. 2016, 141, 227–238. [Google Scholar] [CrossRef]
- Olita, A.; Sorgente, R.; Natale, S.; Gaberšek, S.; Ribotti, A.; Bonanno, A.; Patti, B. Effects of the 2003 European heatwave on the Central Mediterranean Sea: Surface fluxes and the dynamical response. Ocean Sci. 2007, 3, 273–289. [Google Scholar] [CrossRef]
- Rosenzweig, C.; Karoly, D.; Vicarelli, M.; Neofotis, P.; Wu, Q.; Casassa, G.; Menzel, A.; Root, T.L.; Estrella, N.; Seguin, B.; et al. Attributing physical and biological impacts to anthropogenic climate change. Nature 2008, 453, 353–357. [Google Scholar] [CrossRef] [PubMed]
- Garrabou, J.; Coma, R.; Bensoussan, N.; Bally, M.; ChevaldonnÉ, P.; Cigliano, M.; Diaz, D.; Harmelin, J.G.; Gambi, M.C.; Kersting, D.K.; et al. Mass mortality in Northwestern Mediterranean rocky benthic communities: Effects of the 2003 heat wave. Glob. Change Biol. 2009, 15, 1090–1103. [Google Scholar] [CrossRef]
- Feng, Y.T.; Bethel, B.J.; Dong, C.M.; Zhao, H.; Yao, Y.L.; Yu, Y. Marine heatwave events near Weizhou Island, Beibu Gulf in 2020 and their possible relations to coral bleaching. Sci. Total Environ. 2022, 823, 153414. [Google Scholar] [CrossRef] [PubMed]
- Smith, K.E.; Burrows, M.T.; Hobday, A.J.; King, N.G.; Moore, P.J.; Sen Gupta, A.; Thomsen, M.S.; Wernberg, T.; Smale, D.A. Biological Impacts of Marine Heatwaves. Annu. Rev. Mar. Sci. 2023, 15, 119–145. [Google Scholar] [CrossRef]
- Babcock, R.C.; Bustamante, R.H.; Fulton, E.A.; Fulton, D.J.; Haywood, M.D.E.; Hobday, A.J.; Kenyon, R.; Matear, R.J.; Plagányi, E.E.; Richardson, A.J.; et al. Severe Continental-Scale Impacts of Climate Change Are Happening Now: Extreme Climate Events Impact Marine Habitat Forming Communities along 45% of Australia’s Coast. Front. Mar. Sci. 2019, 6, 466674. [Google Scholar] [CrossRef]
- Smale, D.A.; Wernberg, T.; Oliver, E.C.J.; Thomsen, M.; Harvey, B.P.; Straub, S.C.; Burrows, M.T.; Alexander, L.V.; Benthuysen, J.A.; Donat, M.G.; et al. Marine heatwaves threaten global biodiversity and the provision of ecosystem services. Nat. Clim. Change 2019, 9, 306–312. [Google Scholar] [CrossRef]
- Galli, G.; Solidoro, C.; Lovato, T. Marine Heat Waves Hazard 3D Maps and the Risk for Low Motility Organisms in a Warming Mediterranean Sea. Front. Mar. Sci. 2017, 4, 136. [Google Scholar] [CrossRef]
- Benthuysen, J.; Feng, M.; Zhong, L.J. Spatial patterns of warming off Western Australia during the 2011 Ningaloo Nino: Quantifying impacts of remote and local forcing. Cont. Shelf Res. 2014, 91, 232–246. [Google Scholar] [CrossRef]
- Wernberg, T.; Smale, D.A.; Tuya, F.; Thomsen, M.S.; Langlois, T.J.; Bettignies, T.; Bennett, S.; Rousseaux, C.S. An extreme climatic event alters marine ecosystem structure in a global biodiversity hotspot. Nat. Clim. Change 2012, 3, 78–82. [Google Scholar] [CrossRef]
- Mills, K.; Pershing, A.; Brown, C.; Chen, Y.; Chiang, F.S.; Holland, D.; Lehuta, S.; Nye, J.; Sun, J.; Thomas, A.; et al. Fisheries Management in a Changing Climate: Lessons from the 2012 Ocean Heat Wave in the Northwest Atlantic. Oceanography 2013, 26, 191–195. [Google Scholar] [CrossRef]
- Conti, S.; Meli, P.; Minelli, G.; Solimini, R.; Toccaceli, V.; Vichi, M.; Beltrano, C.; Perini, L. Epidemiologic study of mortality during the Summer 2003 heat wave in Italy. Environ. Res. 2005, 98, 390–399. [Google Scholar] [CrossRef]
- Benthuysen, J.A.; Oliver, E.C.J.; Feng, M.; Marshall, A.G. Extreme Marine Warming across Tropical Australia during Austral Summer 2015–2016. J. Geophys. Res. Ocean. 2018, 123, 1301–1326. [Google Scholar] [CrossRef]
- Kajtar, J.B.; Bachman, S.D.; Holbrook, N.J.; Pilo, G.S. Drivers, Dynamics, and Persistence of the 2017/2018 Tasman Sea Marine Heatwave. J. Geophys. Res. Ocean. 2022, 127, e2022JC018931. [Google Scholar] [CrossRef]
- Oliver, E.C.J.; Benthuysen, J.A.; Bindoff, N.L.; Hobday, A.J.; Holbrook, N.J.; Mundy, C.N.; Perkins-Kirkpatrick, S.E. The unprecedented 2015/16 Tasman Sea marine heatwave. Nat. Commun. 2017, 8, 16101. [Google Scholar] [CrossRef] [PubMed]
- Trenberth, K.E. Framing the way to relate climate extremes to climate change. Clim. Change 2012, 115, 283–290. [Google Scholar] [CrossRef]
- Wu, L.; Cai, W.; Zhang, L.; Nakamura, H.; Timmermann, A.; Joyce, T.; McPhaden, M.J.; Alexander, M.; Qiu, B.; Visbeck, M.; et al. Enhanced warming over the global subtropical western boundary currents. Nat. Clim. Change 2012, 2, 161–166. [Google Scholar] [CrossRef]
- Holbrook, N.; Scannell, H.; Sen Gupta, A.; Benthuysen, J.; Feng, M.; Oliver, E.; Alexander, L.; Burrow, M.; Donat, M.; Hobday, A. A global assessment of marine heatwaves and their drivers. Nat. Commun. 2019, 10, 2624. [Google Scholar] [CrossRef]
- Oliver, E.C.J.; Benthuysen, J.A.; Darmaraki, S.; Donat, M.G.; Hobday, A.J.; Holbrook, N.J.; Schlegel, R.W.; Sen Gupta, A. Marine Heatwaves. Annu. Rev. Mar. Sci. 2021, 13, 313–342. [Google Scholar] [CrossRef]
- Carrasco, D.; Pizarro, O.; Jacques-Coper, M.; Narváez, D.A. Main drivers of marine heat waves in the eastern South Pacific. Front. Mar. Sci. 2023, 10, 1129276. [Google Scholar] [CrossRef]
- Lee, H.; Calvin, K.; Dasgupta, D.; Krinner, G.; Mukherji, A.; Thorne, P.W.; Trisos, C.; Romero, J.; Aldunce, P.; Barrett, K.; et al. Climate Change 2023: Synthesis Report. Contribution of Working Groups I, II and III to the Sixth Assessment Report of the Intergovernmental Panel on Climate Change; IPCC: Geneva, Switzerland, 2023; pp. 35–115. [Google Scholar] [CrossRef]
- Frölicher, T.L.; Fischer, E.M.; Gruber, N. Marine heatwaves under global warming. Nature 2018, 560, 360–364. [Google Scholar] [CrossRef] [PubMed]
- Mora, C.; Spirandelli, D.; Franklin, E.C.; Lynham, J.; Kantar, M.B.; Miles, W.; Smith, C.Z.; Freel, K.; Moy, J.; Louis, L.V.; et al. Broad threat to humanity from cumulative climate hazards intensified by greenhouse gas emissions. Nat. Clim. Change 2018, 8, 1062–1071. [Google Scholar] [CrossRef]
- Yao, Y.L.; Wang, C.Z. Variations in Summer Marine Heatwaves in the South China Sea. J. Geophys. Res. Ocean. 2021, 126, e2021JC017792. [Google Scholar] [CrossRef]
- Miao, Y.; Xu, H.; Liu, J. Variation of summer marine heatwaves in the Northwest Pacific and associated air-sea interaction. J. Trop. Oceanogr. 2021, 40, 31–43. [Google Scholar]
- Kuroda, H.; Setou, T. Extensive Marine Heatwaves at the Sea Surface in the Northwestern Pacific Ocean in Summer 2021. Remote Sens. 2021, 13, 3989. [Google Scholar] [CrossRef]
- Chen, S.J.; Yao, Y.L.; Feng, Y.T.; Zhang, Y.C.; Xia, C.S.; Sian, K.T.C.L.K.; Dong, C.M. Characteristics and Drivers of Marine Heatwaves in 2021 Summer in East Korea Bay, Japan/East Sea. Remote Sens. 2023, 15, 713. [Google Scholar] [CrossRef]
- Cheng, L.; Trenberth, K.; Fasullo, J.; Boyer, T.; Abraham, J.; Zhu, J. Improved estimates of ocean heat content from 1960 to 2015. Sci. Adv. 2017, 3, e1601545. [Google Scholar] [CrossRef] [PubMed]
- Yao, Y.L.; Wang, C.Z. Marine heatwaves and cold-spells in global coral reef zones. Prog. Oceanogr. 2022, 209, 102920. [Google Scholar] [CrossRef]
- Liu, S.; Lao, Q.; Zhou, X.; Jin, G.; Chen, C.; Chen, F. Impacts of Marine Heatwave Events on Three Distinct Upwelling Systems and Their Implications for Marine Ecosystems in the Northwestern South China Sea. Remote Sens. 2024, 16, 131. [Google Scholar] [CrossRef]
- Wang, A.; Wang, H.; Fan, W.; Luo, J.; Li, W.; Xu, S. Study on characteristics of marine heatwave in the China offshore in 2019. Haiyang Xuebao 2021, 43, 35–44. [Google Scholar]
- Cai, R.; Tan, H.; Qi, Q. Impacts of and adaptation to inter-decadal marine climate change in coastal China seas. Int. J. Climatol. 2016, 36, 3770–3780. [Google Scholar] [CrossRef]
- Zhang, W.; Zheng, Z.; Zhang, T.; Chen, T.J.H.X. Strengthened marine heatwaves over the Beibu Gulf coral reef regions from 1960 to 2017. Haiyang Xuebao 2020, 42, 45–52. [Google Scholar]
- Wang, Q.; Li, Q.; Li, Y.; Liu, Y.; Wang, Y.J.H. Temporal and spatial characteristics of marine heat waves in the Bohai Sea and Yellow Sea during 1982–2019. Haiyang Xuebao 2021, 43, 38–49. [Google Scholar]
- Meehl, G.A.; Tebaldi, C. More Intense, More Frequent, and Longer Lasting Heat Waves in the 21st Century. Science 2004, 305, 994–997. [Google Scholar] [CrossRef] [PubMed]
- Cronin, M.F.; Kwon, Y.-O.; Joyce, T.M.; Qiu, B.; Samelson, R.M.; Small, R.J.; Kelly, K.A. Western Boundary Currents and Frontal Air–Sea Interaction: Gulf Stream and Kuroshio Extension. J. Clim. 2010, 23, 5644–5667. [Google Scholar] [CrossRef]
- Yao, Y.L.; Wang, J.J.; Yin, J.J.; Zou, X.Q. Marine Heatwaves in China’s Marginal Seas and Adjacent Offshore Waters: Past, Present, and Future. J. Geophys. Res. Ocean. 2020, 125, e2019JC015801. [Google Scholar] [CrossRef]
- Gao, G.D.; Marin, M.; Feng, M.; Yin, B.S.; Yang, D.Z.; Feng, X.R.; Ding, Y.; Song, D.H. Drivers of Marine Heatwaves in the East China Sea and the South Yellow Sea in Three Consecutive Summers during 2016–2018. J. Geophys. Res. Ocean. 2020, 125, e2020JC016518. [Google Scholar] [CrossRef]
- Tan, H.; Cai, R. What caused the record-breaking warming in East China Seas during August 2016? Atmos. Sci. Lett. 2018, 19, e853. [Google Scholar] [CrossRef]
- Mohamed, B.; Nagy, H.; Ibrahim, O. Spatiotemporal Variability and Trends of Marine Heat Waves in the Red Sea over 38 Years. J. Mar. Sci. Eng. 2021, 9, 842. [Google Scholar] [CrossRef]
- Chen, X.; Zhou, T. Relative contributions of external SST forcing and internal atmospheric variability to July–August heat waves over the Changjiang River valley. Clim. Dyn. 2017, 51, 4403–4419. [Google Scholar] [CrossRef]
- Wang, P.Y.; Tang, J.P.; Sun, X.G.; Wang, S.Y.; Wu, J.; Dong, X.N.; Fang, J. Heat Waves in China: Definitions, Leading Patterns, and Connections to Large-Scale Atmospheric Circulation and SSTs. J. Geophys. Res. Atmos. 2017, 122, 10679–10699. [Google Scholar] [CrossRef]
- Hu, S.; Li, S. Progress and prospect of marine heatwave study. Adv. Earth. Sci. 2022, 37, 51–64. [Google Scholar] [CrossRef]
- Wang, Q.; Zhang, B.; Zeng, L.L.; He, Y.K.; Wu, Z.W.; Chen, J. Properties and Drivers of Marine Heat Waves in the Northern South China Sea. J. Phys. Oceanogr. 2022, 52, 917–927. [Google Scholar] [CrossRef]
- Amaya, D.J.; Miller, A.J.; Xie, S.P.; Kosaka, Y. Physical drivers of the summer 2019 North Pacific marine heatwave. Nat. Commun. 2020, 11, 1903. [Google Scholar] [CrossRef] [PubMed]
- Schlegel, R.W.; Oliver, E.C.J.; Chen, K. Drivers of Marine Heatwaves in the Northwest Atlantic: The Role of Air–Sea Interaction During Onset and Decline. Front. Mar. Sci. 2021, 8, 627970. [Google Scholar] [CrossRef]
- Chiswell, S.M. Atmospheric wavenumber-4 driven South Pacific marine heat waves and marine cool spells. Nat. Commun. 2021, 12, 4779. [Google Scholar] [CrossRef]
- Gentemann, C.L.; Fewings, M.R.; García-Reyes, M. Satellite sea surface temperatures along the West Coast of the United States during the 2014–2016 northeast Pacific marine heat wave. Geophy. Res. Lett. 2017, 44, 312–319. [Google Scholar] [CrossRef]
- Oliver, E.C.J.; Burrows, M.T.; Donat, M.G.; Sen Gupta, A.; Alexander, L.V.; Perkins-Kirkpatrick, S.E.; Benthuysen, J.A.; Hobday, A.J.; Holbrook, N.J.; Moore, P.J.; et al. Projected Marine Heatwaves in the 21st Century and the Potential for Ecological Impact. Front. Mar. Sci. 2019, 6, 734. [Google Scholar] [CrossRef]
- Androulidakis, Y.S.; Krestenitis, Y.N. Sea Surface Temperature Variability and Marine Heat Waves over the Aegean, Ionian, and Cretan Seas from 2008–2021. J. Mar. Sci. Eng. 2022, 10, 42. [Google Scholar] [CrossRef]
- Marullo, S.; Serva, F.; Iacono, R.; Napolitano, E.; di Sarra, A.; Meloni, D.; Monteleone, F.; Sferlazzo, D.; De Silvestri, L.; de Toma, V.; et al. Record-breaking persistence of the 2022/23 marine heatwave in the Mediterranean Sea. Environ. Res. Lett. 2023, 18, 114041. [Google Scholar] [CrossRef]


| Dataset | Institute | Resolution | Period |
|---|---|---|---|
| OSTIA | CMEMS | 0.05° × 0.05° | 1982–2021 (daily) |
| ERA5 | ECMWF | 0.25° × 0.25° | 1982–2021 (monthly) 1994, 2006, 2007 (daily) |
| ONI | NOAA | \ | 1982–2021 (monthly) |
| Indices | Formula | Unit |
|---|---|---|
| Total days | days | |
| Duration | days | |
| Frequency | times | |
| MeanInt | °C |
| Point | MHWstart | MHWend | Lon °E | Lat °N | Duration (Days) | MeanInt (°C) |
|---|---|---|---|---|---|---|
| A | 09/10/2006 | 17/04/2007 | 124.225 | 33.375 | 191 | 1.82 |
| B | 08/10/2006 | 28/11/2006 | 124.425 | 32.125 | 52 | 1.62 |
| A | 01/07/1994 | 10/08/1994 | 124.225 | 33.375 | 41 | 3.68 |
| B | 05/07/1994 | 01/08/1994 | 124.425 | 32.125 | 28 | 4.93 |
| Total Days (Days) | Duration (Days) | Frequency (Times) | MeanInt (°C) | |
|---|---|---|---|---|
| Spring | 12.26 ± 2.07 | 8.76 ± 0.85 | 1.35 ± 0.01 | 1.91 ± 0.07 |
| Summer | 12.48 ± 2.21 | 9.36 ± 1.19 | 1.32 ± 0.09 | 1.99 ± 0.07 |
| Autumn | 11.27 ± 1.84 | 9.08 ± 1.16 | 1.22 ± 0.08 | 1.60 ± 0.06 |
| Winter | 11.34 ± 1.29 | 8.81 ± 0.74 | 1.28 ± 0.05 | 1.49 ± 0.03 |
Disclaimer/Publisher’s Note: The statements, opinions and data contained in all publications are solely those of the individual author(s) and contributor(s) and not of MDPI and/or the editor(s). MDPI and/or the editor(s) disclaim responsibility for any injury to people or property resulting from any ideas, methods, instructions or products referred to in the content. |
© 2024 by the authors. Licensee MDPI, Basel, Switzerland. This article is an open access article distributed under the terms and conditions of the Creative Commons Attribution (CC BY) license (https://creativecommons.org/licenses/by/4.0/).
Share and Cite
Xie, M.; Ji, Q.; Zheng, Q.; Meng, Z.; Wang, Y.; Gao, M. Spatial and Temporal Characteristics and Mechanisms of Marine Heatwaves in the Changjiang River Estuary and Its Surrounding Coastal Regions. J. Mar. Sci. Eng. 2024, 12, 653. https://doi.org/10.3390/jmse12040653
Xie M, Ji Q, Zheng Q, Meng Z, Wang Y, Gao M. Spatial and Temporal Characteristics and Mechanisms of Marine Heatwaves in the Changjiang River Estuary and Its Surrounding Coastal Regions. Journal of Marine Science and Engineering. 2024; 12(4):653. https://doi.org/10.3390/jmse12040653
Chicago/Turabian StyleXie, Minghong, Qiyan Ji, Qingdan Zheng, Ziyin Meng, Yuting Wang, and Meiling Gao. 2024. "Spatial and Temporal Characteristics and Mechanisms of Marine Heatwaves in the Changjiang River Estuary and Its Surrounding Coastal Regions" Journal of Marine Science and Engineering 12, no. 4: 653. https://doi.org/10.3390/jmse12040653