Review

A Critical Review of Constitutive Models Applied to Ice-Crushing Simulations

by
Mojtaba Mokhtari
* and
Bernt Johan Leira
Department of Marine Technology, Norwegian University of Science and Technology (NTNU), 7052 Trondheim, Norway
*
Author to whom correspondence should be addressed.
J. Mar. Sci. Eng. 2024, 12(6), 1021; https://doi.org/10.3390/jmse12061021
Submission received: 4 May 2024 / Revised: 8 June 2024 / Accepted: 9 June 2024 / Published: 19 June 2024
(This article belongs to the Special Issue Design of Marine Structures against Ice Actions)

Abstract

:
In marine engineering, understanding the compressive behaviour of ice is crucial for accurately modelling ice loads on ships and offshore structures in ice-prone waters. Over the past few decades, numerous studies have focused on numerically simulating the ice-crushing process using various material models. A significant source of contention among these models lies in the representation of ice strength envelopes and their evolution with pressure and strain rate. Moreover, there is ongoing debate regarding whether plasticity or viscoelasticity more effectively captures the rheology of ice. Additionally, various flow rules have been implemented in plasticity models and different damage models have been used in viscoelasticity models, all of which play a critical role in simulating ice loads. This critical review aims to shed light on the reasons behind these disagreements and to evaluate the advantages and limitations of the most commonly used models, based on established theories in ice mechanics and empirical evidence.

1. Introduction

In recent decades, the progressive melting of Arctic ice caps has caused a substantial increase in human activities within ice-prone marine environments [1]. This expansion includes sectors such as shipping, commercial fisheries, tourism, and natural resource exploration, all of which have experienced unprecedented growth owing to the enhanced accessibility of these remote areas [2]. Concurrently, the global commitment to achieving net-zero emissions by 2050 has led to an uptick in the installation of wind turbines in challenging icy waters [3,4]. These evolving circumstances call for innovative approaches to better understand and model ice load, essential for the sustainable design and operation of maritime and offshore structures in icy conditions.
Ice load dynamics are greatly influenced by the ice failure mechanisms. The predominant failure mechanisms of ice during interactions with ships and offshore structures include crushing and flexural failures. Both are influenced by the compressive behaviour of ice, whereas only flexural failure is affected by its tensile behaviour. Traditionally, ice-crushing simulations have focused on collisions with large ice features, such as icebergs and ice ridges, while flexural failure has been studied in the context of bending sea ice against sloping structures to leverage tensile stress advantages. However, the deployment of upright cylindrical structures, primarily in monopile wind turbines, in ice-covered areas has underscored the importance of accurately modelling the compressive behaviour of ice and the mechanical processes of ice crushing. This is further emphasised by the consideration of floating offshore wind turbines in icy waters, such as the Labrador Sea, where they risk collision with bergy bits [5].
The complexity and variability of ice behaviour make the accurate simulation of ice crushing a formidable challenge. Several material and failure/damage models have been proposed, yet the lack of a universally accepted model highlights the ongoing research and debate within the field. The cost implications of renewable energy production, significantly higher than those of fossil fuels, further necessitate the development of cost-effective yet safe designs. A material model that accurately simulates the ice-crushing process, among other factors, is indispensable for achieving such designs, considering the prohibitive cost and limitations of physical testing, as well as the inaccuracies inherent in analytical and empirical methods due to their necessary simplifications of such a complex process.
Ice material modelling is fraught with numerous uncertainties due to the diverse nature of ice. Natural ice can be classified into several categories, including freshwater ice, glacial ice, and saline or sea ice. Additionally, academic studies often use lab-grown or laboratory ice, as well as artificial or “design-ice” in some numerical simulations. Other categorisations are based on the ice size, shape, and/or age. The complex mechanical properties of ice are influenced by various microstructural and environmental factors, including grain size, porosity and its distribution, brine volume, and other flaws, as well as loading rate and direction, confinement, and temperature.
Material models for ice-crushing simulations are based on constitutive models establishing a relationship between stress and strain throughout the entire crushing process, from intact ice in the solid state to a fluid-like pulverised substance. The most commonly used numerical method for the implementation of ice-crushing material models is the Finite Element Method (FEM). The typical stress–strain curves of ice under uniaxial compressive loads are shown in Figure 1, having their roots in works by Schulson [6], Jones [7], and Shazly et al. [8]. This, together with Figure 2, obtained from over 100 physical tests on non-saline ice specimens, shows strong dependency of the stress–strain curve as well as the failure stress of ice to strain rate [9,10].
Ice strength is also highly dependent on hydrostatic pressure. Several experimental studies involving triaxial testing of numerous laboratory ice specimens have demonstrated that ice strength initially increases with rising confining pressure (pressure hardening) up to a certain threshold. Beyond this point, further increases in confining pressure lead to a reduction in strength (pressure softening) [11,12,13], as shown in Figure 3. Pressure hardening occurs because it is more difficult for cracks to initiate and propagate under higher confining pressures. On the other hand, pressure softening is due to the fact that increased pressure lowers the melting temperature of ice, and ice becomes softer near its melting point, which is believed to be due to the shortening of the O:H nonbond and elongation of the H–O bond under increased pressure [14]. If the confining pressure is increased sufficiently, ice melts, a phenomenon known as the pressure melting of ice. Several “strength envelopes” have been proposed or adopted from the rock and soil mechanics field for constitutive modelling of ice-crushing mechanical behaviour, as discussed below.

2. Ice Strength Envelopes for Yield and Failure Criteria

The term “strength envelope” is used here as a general descriptor, in lieu of more specific terms such as “yield” or “failure” envelope/surface/criterion. The strength envelope corresponds to the yield surface in plasticity-based models or the failure surface in both plasticity- and viscoelasticity-based models. While the definitions of failure strength or stress may vary across different sources, in this review, failure stress or strength is defined as the highest von Mises equivalent stress recorded for an ice specimen during compression testing, whether uniaxial or triaxial with confining pressure.
Long before the development of ice mechanics, pressure-dependent strength envelopes were already in use for soil, rock, and concrete. Two of the most prominent models later adopted in ice mechanics include the Mohr–Coulomb (M–C) model, which is more frequently applied, and the Drucker–Prager (D–P) model. Their loci are illustrated in Figure 4. Examples of applications of these models in ice-crushing simulations are references [16,17,18,19] for M–C and [19,20,21,22,23] for D–P. The M–C criterion can be expressed by
F M C = σ 1 σ 3 2 + σ 1 + σ 3 2 sin ϕ c cos ϕ = 0
where F is the failure surface function, σ 1 and σ 3 are principal stresses, ϕ denotes the friction angle, and c represents the cohesion. The linearly extended D–P model, as a smooth version of the Mohr–Coulomb (M–C) envelope, when it circumscribes the M–C envelope under the condition of uniform confinement, can be written as
F D P = s p tan ϕ c = 0
where p = 1 3 tr   ( σ ) is the hydrostatic pressure, σ signifies the Cauchy stress tensor, and s represents the von Mises equivalent stress.
A potential limitation of the M–C and D–P criteria when applied to ice-crushing simulations in their conventional form is their inability to capture the pressure softening of ice. However, they may effectively approximate pressure hardening at lower confining pressures. Other strength envelopes borrowed from soil, rock, and concrete models for simulating ice mechanical behaviour may exhibit similar limitations in their conventional form (e.g., Pariseau’s n-type function [24]). These models should be used with caution to ensure that the hydrostatic pressure remains sufficiently below the hardening to softening transition pressure for the specific ice-crushing scenario to which they are applied, and that the pressure hardening can be sufficiently approximated by the adopted strength envelope.
Due to the limitations of the pressure range in the strength criteria discussed above, Nadreau and Michel [12] proposed the Teardrop (TD) failure envelope (Figure 5):
F T D = σ a x 0 σ c n f tan θ ( C T D σ c n f ) 1 + ( σ c n f C T D ) ( C T D T T D ) = 0
where σ a x 0 is the maximum axial compressive stress in triaxial testing of an ice specimen; σ c n f denotes the confining pressure; θ represents the tail’s angle divided by 2; CTD is the phase transition parameter (pressure melting) and varies with temperature; and TTD represents a biaxial tension reference stress.
Although the TD function fits well to the experimental data, it does not appear to have been utilised for progressive ice-crushing simulations in the literature, at least not in practical, full-scale ice structure interaction scenarios. Consequently, its performance and applicability cannot currently be evaluated based on the available literature.
Perhaps the most widely used strength envelope in ice-crushing constitutive models is the elliptical envelope (Figure 3), first formulated by Derradji-Aouat [11] in 2000 for isotropic ice, as follows:
( p ξ p c ) 2 + ( τ o c t η τ max ) 2 = 1
where ξ , p c , τ max , and η = 0 are material constants, while τ o c t is the octahedral shear stress. This elliptical envelope could be considered as a special case of the Tsai–Wu failure criterion [25] when isotropy is assumed. The elliptical strength envelop is based upon empirical data from triaxial testing of approximately 300 isotropic ice specimens. These tests covered a broad range of hydrostatic pressures (0.1 < p < 85.0 MPa), temperatures (−45 °C < T< −1 °C), and strain rates (10−6 < ε ˙ < 10−1 s−1). Given its close correlation with the triaxial test data, obtained from a relatively large number of samples covering a broad range of influential parameters, and its simplicity, this envelope has been extensively used in ice-crushing constitutive models, including both plasticity- and viscoelasticity-based models. The application and implications of this model in the context of viscoelasticity- and plasticity-based constitutive modelling of the ice-crushing process will be further discussed.

3. Rheological Theories Applied in Constitutive Models for Ice Crushing Simulations

Constitutive models, which define the stress–strain relationship under various mechanical loads, are central to achieving reliable simulation outcomes. Constitutive models for ice crushing are broadly divided into two primary categories, reflecting their foundational rheological theories: viscoelastic and elastoplastic models. Additionally, while viscoplastic and viscoelastic-plastic models exist, their infrequent application compared to the viscoelastic and elastoplastic models makes the assessment of their accuracy and practicality challenging at this stage. Thus, they are not discussed herein.

3.1. Viscoelasticity

Glen’s seminal work in 1955 [26] explored the creep characteristics of polycrystalline ice by subjecting it to compressive stresses between 1 and 10 bars at temperatures from −13 °C to its melting point. He presented a power-law equation correlating the viscous/creep strain rate, which he termed “minimum flow rate”, with the applied stress, defined as
ε ˙ c = B exp Q / R T σ n
where ε ˙ c and σ represent the creep strain rate and stress, respectively, for polycrystalline ice under uniaxial compression; R = 8.314   J / mol   K denotes the universal gas constant; B and n are constants; Q indicates the activation energy; and T signifies the absolute temperature in Kelvin. The validity of Glen’s power law is supported in several investigations (e.g., [27,28,29]).
In 1978, Sinha [30] proposed a phenomenological relationship suggesting a Burgers-type viscoelastic behaviour in columnar-grained ice subjected to uniaxial compressive force. In this model, he decomposed the total strain, ε , to three components. These included one instantaneous elastic component and two creep components, written as
ε = ε e + ε d + ε c
where ε e represents the instantaneous elastic strain, ε d is the delayed elastic strain (or recoverable primary creep strain), and ε c signifies the permanent viscous strain (or secondary creep strain). These strain components are shown in Figure 6. For consistency in this review, ε c and ε d will be respectively referred to as secondary creep strain and delayed elastic strain. Using Glen’s power law as a foundation, Sinha [30] then proposed a corresponding power-law equation to quantify the rate of secondary creep strain for columnar-grained ice:
ε ˙ c = ε ˙ 0 c σ σ 0 m
where m is a material constant, and ε ˙ 0 c signifies the reference secondary creep strain rate at unit stress σ 0 = 1 MPa. Further, Sinha [30] provided a relationship for the delayed elastic strain component:
ε d = c σ E ς 1 exp ( a T t ) b
in which c , ς , a T , and b are constants; E represents the elastic modulus; and t is time. Subsequent modifications for polycrystalline ice [31] involved incorporating the effect of grain size by developing a grain size-dependent term, c 1 ( d 1 / d ) , to replace constant c . In this new term, c 1 = 9 is a constant associated with the unit grain diameter d 1 = 1 mm, while d is the grain diameter.
In 1988, Jordaan and McKenna [32] extended Sinha’s work by introducing a strict Burgers model, which included a Kelvin unit with a nonlinear stress-dependent dashpot, such that
ε d = σ E K 1 exp 0 t E K μ K ( σ d ) d t
where E K and μ K denote the spring elastic modulus and the dashpot viscosity within the Kelvin unit, respectively. This adjustment acknowledges the stress dependency and offers an enhanced description of the viscoelastic behaviour of ice under varying loads.
The nonlinear viscoelastic model formulated by Jordaan and McKenna [32,33], which includes a damage mechanism based upon the continuum damage theory of Schapery [34,35] to capture microstructural alterations in crushing ice, has been expanded upon in various studies [36,37,38,39,40,41]. In 1997, Xiao [37] put forward a constitutive model for simulating the viscoelastic behaviour of ice under compression built upon the investigations by Jordaan and McKenna [32,33,42] and Jordaan et al. [43]. The constitutive equations in Xiao’s model [37] are
ε ˙ i j = ε ˙ i j e + ε ˙ i j d + ε ˙ i j c
ε ˙ i j = ε ˙ i j e + e ˙ i j d + e ˙ i j c + ε ˙ υ δ i j
ε ˙ υ = f 3 p s ( e ˙ e ˙ e ) = f 3 p s ( e ˙ d + e ˙ c )
e d = 0 t e ˙ d d t
e ˙ i j d = 3 2 ε ˙ 0 d s E k e d σ 0 n s i j s
e ˙ i j c = 3 2 ε ˙ 0 c ( s σ 0 ) m s i j s
In Xiao’s model, three strain rate components form the total strain rate ε ˙ i j . The first component is the instantaneous elastic strain rate, ε ˙ i j e , in the Maxwell spring. The second component is the delayed elastic strain rate, ε ˙ i j d , in the Kelvin unit, and the last component is the secondary creep strain rate, ε ˙ i j c , in the Maxwell dashpot. Subsequently, ε ˙ i j d and ε ˙ i j c are decomposed to deviatoric and volumetric components such that e ˙ i j d and e ˙ i j c represent the deviatoric components and ε ˙ υ signifies the volumetric component given by Equation (12). The volumetric component, ε ˙ υ , accounts for the dilatation in ice as it undergoes cracking and pulverisation or compaction and sintering in the presence of high confining pressure during the crushing process [37,44,45,46,47]. The deviatoric stress is denoted by s i j , while e ˙ is the total equivalent strain rate, comprising total instantaneous elastic, e ˙ e , total delayed elastic, e ˙ d , and total secondary creep, e ˙ c , components; f 3 is a constant; ε ˙ 0 d and ε ˙ 0 c are the delayed elastic and secondary creep components of the reference strain rate at the reference stress σ 0 ; n and m are constants; t is time; and e d is the equivalent delayed strain.
To capture the strain softening due to microstructural damage in ice. Equations (14) and (15) need to be multiplied by an exponential term [37,48]. Therefore,
e ˙ i j d = 3 2 ε ˙ 0 d s E k e d σ 0 n s i j s exp ( β d S )
e ˙ i j c = 3 2 ε ˙ 0 c ( s σ 0 ) m s i j s exp ( β c S )
where β d and β c are constants termed as creep enhancement factors, with S being the damage index function. Based on the investigations carried out in [34,35,42,46,48,49,50], Xiao [37] formulated S as
S = S 1 + S 2 = 0 t { f 1 ( p ) ( s s 0 ) q 1 + f 2 ( p ) exp ( s s 0 ) } d t
f 1 ( p ) = a 1 1 p p 1 2 p < p 1 0 p p 1
f 2 ( p ) = a 2 p p 2 r
in which s 0 represents the reference stress for the damage model, while q 1 , a 1 , a 2 , p 1 , p 2 , and r are constants. This damage model by Xiao [37] is hereafter termed “DMa” and will be compared with other viscoelastic damage models discussed later in this review. The damage index function accounts for microcracking damage through S 1 , whereas processes contributing to pressure softening, such as dynamic recrystallisation and pressure melting, are considered by S 2 . For undamaged ice, S is zero, deactivating the damage terms in Equations (16a) and (17), since exp(0) is 1.
Recent investigations [9,41,51] have identified potential limitations in the viscoelastic model governed by the constitutive equations delineated above (Equations (10)–(20)), indicating that these constitutive equations may yield exaggerated stress values in numerical simulations under certain conditions. Shi et al. [51] observed that while the constitutive model accurately captures the compressive creep behaviour under low to moderate strain rates, it potentially overestimates ice strength during iceberg–ship collisions, which involve considerably higher strain rates compared to creep tests. According to Shi et al. [51], this overestimation arises because the model does not accommodate the transition from ductile to brittle behaviour, resulting in a continuous exponential growth in stress with strain rate, even past the transition point, after which, based on empirical evidence, the ice strength should plateau or slightly decrease and then increase, with a noticeably lower rate [9,52,53,54].
In an extensive examination, Turner [41] assessed the same viscoelastic constitutive model and discovered that its FEM implementation sometimes generated von Mises stresses that far exceeded those of the physical tests on ice specimens. Turner’s experimental work, which included triaxial tests on cylindrical samples of granular ice, prepared in accordance with Stone et al. [55], showed that ice strength does not exceed a specific failure threshold of 26.0 ± 1.6 MPa. When the confining pressure was increased incrementally from 40 MPa to 45 MPa and subsequently to 60 MPa, there was a noticeable decrease in the strength of the ice samples. This observation aligns with the phenomenon of pressure softening outlined in Figure 3. He termed the failure mechanism “high-shear elastic failure” (HSEF) and investigated four different approaches to incorporate this ice strength threshold, which he considered a constant value, into the viscoelastic constitutive model:
HSEF 1 :   σ i j = σ i j s 26   MPa σ i j 26 s s > 26   MPa
HSEF 2 :   S 1 = S 1 s 26   MPa S max s > 26   MPa
HSEF 3 :   E M = E M s 26   MPa E M 26 s s > 26   MPa
HSEF 4 :   E M = E M s 26   MPa E M 100 s > 26   MPa
HSEF1, which imposes a 26.0 MPa cap on the von Mises stress, failed to yield results correlating with the experimental data. The second model was also dismissed, partly due to an abrupt decrease in load accompanied by a rapid expansion of the damage layer within just 0.002 s—a behaviour that diverges from the more gradual damage layer expansion observed in experimental studies on ice indentation. The subsequent approaches, HSEF3 and HSEF4, decrease the elastic modulus after the von Mises stress exceeds 26.0 MPa. Although HSEF3 and HSEF4 yielded more acceptable outcomes than their predecessors, they contradicted the theory of “constant elastic modulus” confirmed earlier in Turner’s study [41], and their physical meaning remained unclear. Consequently, further theoretical and experimental investigations were suggested to deepen the understanding and computational representation of “high-shear elastic failure” [41]. Turner also slightly modified the delayed strain rate formulation and the damage model such that
e ˙ i j d = 3 2 ε ˙ 0 d sgn ( s E k e d ) s E k e d σ 0 n s i j s exp ( β d S )
S = S 1 + S 2 = 0 t { f 1 ( p ) ( s s 0 ) q 1 + f 2 ( p ) ( 2 s / s 0 1 ) } d t
f 1 ( p ) = a 1 exp ( p p 1 )
sgn(∙) denotes the sign function. This updated damage model by Turner [41], consisting of Equations (18b), (19b) and (20), is hereafter termed “DMb”.
Mokhtari et al. [9] proposed a progressive damage model that incorporated an iterative algorithm. This model addressed the unrealistically large stresses noted earlier, allowing for an unprecedented simulation of repetitive cycles of ice crushing and viscous extrusion. Consequently, Mokhtari et al. [9] presented a viscoelastic constitutive model with this iterative damage model that combined the constitutive equations proposed by Xiao [37] and Turner [41] and was founded upon the leading studies by Jordaan and McKenna [32,33,42] and Jordaan et al. [43]. The constant von Mises stress cap of 26.0 MPa proposed by Turner [41] was replaced with the elliptical failure envelope discussed earlier, which evolved with strain rate in addition to pressure (Figure 7).
The iterative damage model, termed “iDM” (iterative damage model) [9], assumed that the damage index function in Equation (18b) is only valid if the stress stayed within the elliptical ice failure envelope (Figure 7). Once the stress exceeded the failure surface, an iterative damage function was activated that monotonically increased the damage index, until the stress was returned to the failure surface. The failure envelope accounted for both ductile-to-brittle transition strain rate and pressure softening and thus could resolve the unrealistically high stresses associated with overlooking these two phenomena in earlier studies. In reference [9], this failure surface was expressed by
F ELP = s 2 + α 2 ( p p 0 ) 2 B = 0
where α = B A is the shape factor; A and B are the horizontal and vertical semiaxes of the elliptical envelope (Figure 7b); p 0 = p c p t 2 determines the ellipse centre on the p-axis using p t , the hydrostatic tensile strength, and p c , the hydrostatic compressive strength (note p c should be always positive). The shape factor, α , is calculated by
α = 3 k ( 3 k t + k ) ( 3 k ) ;   k = σ f p c ;   k t = p t p c
The failure stress in a uniaxial compression test, σ f (MPa), was defined as a rate-dependent function by fitting a curve to Jones’ [20] data for glacial ice in the ductile regime ( ε ˙ 0.001 in Equation (27)), and using Shazly et al.’s [1] strain hardening relationship for the brittle regime ( ε ˙ > 0.001 in Equation (27)).
σ f = 24 . 8 ( ε ˙ 0 . 196 )   if   ε ˙ 0.001 10 . 52 ( ε ˙ 0 . 0955 )   if   ε ˙ > 0.001
The performances of DMa, DMb, and iDM in simulating the force-displacement response in physical ice-crushing tests of a conical ice specimen (shown in Appendix A) are compared in Appendix B.
Equation (27) is an approximation bound by the data available in the literature and can be adjusted for different applications. For instance, using the Bohai sea ice strength data in [56], it was calibrated in another study by Mokhtari et al. [57] to simulate concurrent crushing and flexural failure of sea ice such that
σ f = 21 . 572 ( ε ˙ 0 . 2492 ) if   ε ˙ < 0.00275 0 . 1586 ( ε ˙ 0.582 ) if   0 . 00275 ε ˙ < 0.0074 2.7568 if   ε ˙ 0.0074
Mokhtari et al. [57] integrated their isotropic viscoelastic model [9] with the cohesive zone method such that a cohesive interaction behaviour was introduced at the vertical interface of adjacent finite elements (Figure 8a) with a traction-separation law and damage evolution (Figure 8b) to simulate the anisotropic failure of columnar sea ice. To validate this modelling approach, a numerical model of an ice-breaking cone mounted on a jacket structure in the Bohai Sea, interacting with drifting level ice, was developed. This model successfully replicated the typical ice-breaking pattern, including the radial and circumferential cracks observed in field studies (Figure 9). Compared to similar research, this model produced better agreement with field-measured data in terms of both magnitude and frequency of ice forces (refer to [57] for details).
The viscoelastic constitutive models discussed in this section are not widely used in ice-crushing simulations due their complexity, the large number of parameters requiring calibration, the computational power required to solve them, and their unavailability in commercial simulation software. Therefore, the prevalent practice for modelling the inelastic deformations of ice has been using plastic rheology, despite evidence suggesting that ice behaves as a viscoelastic material [30,37,47,48,58,59,60,61,62,63].
Figure 9. (a) Ice-breaking pattern in the numerical simulation [57] and (b) the ice forces from field measured data [64] and the numerical simulation [57].
Jmse 12 01021 g009

3.2. Plasticity

Plasticity-based constitutive models applied for ice-crushing simulations often simulate the ice in two phases, elastic and plastic, and thus they are also referred to as elastoplastic models and are implemented to model “design-ice” in the context of damage evaluation or for design purposes [65]. “Design-ice” constitutive modelling means that the numerical model is not intended to fully capture the physics of ice crushing but is developed to reasonably approximate the ice load magnitudes on marine structures in a collision or high-loading-rate scenario with acceptable computational efficiency for practical full-scale simulations.
Contrary to the viscoelastic models, which have no application limitations in theory, the applicability of the elastoplastic models is limited to a specific range of strain rates (i.e., above the transition rate in Figure 1 and Figure 2). Schulson [6] describes the ductile-to-brittle transition as a shift from viscous to plastic deformation. However, this might not be an accurate interpretation, since both the strength and elastic stiffness of ice in the brittle range are still rate dependent and can be simulated with a viscoelastic material model. Also, the mechanical behaviour of ice post-failure, when deformations are large in highly crushed and pulverised ice under confining pressure, requires modelling of a viscous flow rather than a plastic flow. Elastoplastic models idealise the elastic response using a constant (i.e., strain rate-independent) elastic modulus. The permanent deformation of ice is then simulated using a plasticity model with a yield criterion and a certain flow rule. The yield stress is obtained from the mechanical testing of ice specimens under uniaxial or triaxial (for pressure dependent models) loading. There are also models that, for simplicity, assume that plasticity begins immediately after loading is applied [66].
The commonly implemented yield criteria include the Mohr–Coulomb, Drucker–Prager, and elliptical (simplified Tsai–Wu) models. The Mohr–Coulomb and Drucker–Prager plasticity models are readily available in most commercial finite element analysis (FEA) software packages, including Abaqus and LS-DYNA. Therefore, these models do not require a user-defined constitutive model, which would necessitate extensive knowledge of continuum and damage mechanics, numerical methods, and programming skills. This might be a major reason for their frequent application in ice-crushing simulations, given their limitations in modelling the pressure softening of ice, as discussed in Section 2.
The only plasticity model available in commercial FEA software that features the elliptical yield envelope appears to be the Crushable Foam (CF) model. The CF model is also widely used for ice-crushing simulations [19,67,68,69,70,71,72], partly due to its availability in commercial software. In a comparative study, Han et al. [19] concluded that the CF plasticity model generally outperforms the D–P and M–C models in ice-crushing simulations. This is consistent with the theory, as the latter cannot capture the pressure softening of ice. This conclusion was based on comparing force-displacement curves from physical indentation tests on cone-shaped ice specimens with those from numerical simulations.
In 2007, Gagnon [73] employed the built-in CF plasticity model in LS-DYNA to simulate a heavy impactor collision with growlers. He stated that the numerical simulation results did not support the hypothesis that nominal pressure depends on the nominal contact area. However, theoretically and based on experimental evidence, an increase in contact area should increase the confining pressure. In subsequent studies in 2010 and 2011, Gagnon [66,74] used the CF model in another ice-crushing simulation. This material model was unable to replicate the typical sawtooth load pattern observed in ice-crushing tests. To address this, Gagnon proposed a manual adjustment in the setup of the numerical model to artificially reproduce the sawtooth load pattern. He divided the ice domain into numerous material layers, each comprising two overlapping facets. One facet was assigned a high yield stress property, while the other was given a low yield stress property (Figure 10) to model the transition from hard to soft ice, before and after damage, thus facilitating an artificial representation of the spalling effect [66,74], as Gagnon attributed the sawtooth load pattern to spalling. However, other sources that focus on viscoelastic rheology [75,76,77] suggest that spalling is only partly or barely responsible for the sawtooth load pattern, depending on factors such as loading rate, confining pressure, and the temperature of the ice. Other mechanisms, such as the viscous extrusion of the damaged layer and cyclic pressure softening followed by subsequent hardening due to phase changes in the ice, also contribute to the sawtooth pattern.
Kim et al. [78,79,80] also utilised the CF material model, adopting a similar artificial modelling technique to that of Gagnon [66,74]. However, rather than dividing the ice domain into multiple layers, with each layer having both high- and low-strength properties, they partitioned the ice geometry into two distinct domains. These include a High Pressure Zone (HPZ) at the central contact area and a Low Pressure Zone (LPZ) around the periphery, as depicted in Figure 11. Although this method of modelling two different strength zones within the ice domain simplifies the setup compared to layering, it remains unclear how to configure the partitions for the HPZ and LPZ across various ice-crushing scenarios. These scenarios may include different ice geometries, ice types, loading rates, and other influencing factors.
These manual assignments of high and low strength zones in studies such as references [66,74,78,79,80] based on the CF plasticity model, to replicate the ice-crushing test results, suggest that the CF plasticity model cannot capture some of the important ice physics during the crushing process. This potential issue was systematically investigated by Mokhtari et al. [65]. They first assessed the appropriateness of the flow rule in the CF constitutive laws for ice, considering that it was originally developed for metallic foams [81]. The CF model built in commercial software used to simulate the ice-crushing process [82,83] is based on a non-associated flow rule incorporating a zero plastic Poisson’s ratio. This is because metallic foams show negligible deformation in directions orthogonal to the loading. However, this characteristic is inconsistent with the behaviour of ice under compression, where ice tends to expand laterally under compressive loads. When this expansion is constrained—due to continuity of the ice medium and/or by external support from the structure (in particular if it is dented by the initial impact)—the hydrostatic pressure in ice increases. Therefore, with a zero plastic Poisson’s ratio, it is impossible to accurately simulate the hydrostatic pressure in ice, and as a result, neither the pressure hardening nor the pressure softening of confined ice can be correctly modelled using the built-in CF plasticity model. Consequently, manual partitioning to weak and strong ice zones, as discussed earlier, is necessary to at least approximate the pressure hardening effects, although pressure softening effects are likely still unaddressed.
To demonstrate the limitations of the built-in CF model in simulating hydrostatic pressure in ice, Mokhtari et al. [65] compared FEA results from the built-in CF model with those from another plasticity model that uses the same elliptical yield surface but incorporates a different flow rule (associated flow rule), developed by Liu et al. [84]. The evaluation involved two different finite element models. Initially, a “single-element test” model was employed, including eight different load cases designed to assess the constitutive laws independent of geometrical and mesh effects. Subsequently, to validate the findings from the single-element test, a physical crushing test of a conical ice sample (Appendix A) was simulated using both the CF model and the model by Liu et al. [84]. The latter was termed VUMAT, as it was implemented through a VUMAT subroutine in reference [85].
The results from the single-element test for two cases are shown in Figure 12. The difference between the two cases lies solely in the confinement conditions. The first case lacked physical confining walls, allowing lateral expansion of the element under axial loading. In contrast, the second case included fixed walls around the vertical sides of the element, which induced resistance to lateral expansion under axial loading, thereby increasing the confining and subsequently hydrostatic pressures. The same failure model, based on a failure strain criterion, was implemented for both the CF model and the VUMAT. Upon meeting the failure criterion, the element was eroded (refer to [65] for more details).
According to Figure 12, for the case without confining walls, both plasticity models yielded very similar results. However, with the confining walls, the results were markedly different. It is clear that the confinement condition had no noticeable impact on the CF model results, whereas it significantly influenced the VUMAT results. Consequently, it was concluded that the VUMAT can capture the effects of confinement, while the CF model is insensitive to confinement.
The performance of the CF plasticity model and the VUMAT were also compared through 28 different numerical models simulating a physical indentation test on a cone-shaped ice specimen, with the setup shown in Appendix A. As expected, due to its zero plastic Poisson’s ratio, resulting in decreased confining pressure within the ice domain, the CF model generated significantly lower contact pressure and consequently lower force compared to the VUMAT. The CF model also showed significantly greater sensitivity to element size than the VUMAT. For instance, reducing the element size from 3 mm to 0.75 mm markedly influenced the forces produced by the CF model, whereas the force-displacement curves from the VUMAT showed only minor changes with the same alteration in element size (see [65] for details). Consequently, conducting a mesh sensitivity analysis is crucial when utilising the CF model in ice–structure interaction simulations.
In spite of the satisfactory performance of the model proposed by Liu et al. [84] in simulating the physical cone crushing test discussed in [65], it is strain rate-independent—a common limitation in plasticity-based models. Consequently, recalibration of the model parameters is necessary for different collision velocities, given the rate dependency of ice mechanical behaviour even within the brittle regime. To address this, Mokhtari et al. [10] modified the material model of Liu et al. [84] to account for the rate dependency of ice, using the data shown in Figure 2. This modified model was calibrated and validated against the ice-crushing tests conducted at the Memorial University of Newfoundland under two different indentation speeds (Appendix A). Later, this modified model was applied in another study [86] to simulate the structural damage of an aluminium panel subjected to ice impact load in a drop test performed at Hamburg University of Technology [87]. The modified elastoplastic model was implemented without any recalibration of the model parameters, despite the ice specimen being grown in a different laboratory with a different preparation process. Nevertheless, the numerical results from the ice drop test simulation correlated closely with the experimental data (Figure 13). Therefore, it was concluded that the modified model proposed in [10] can accurately estimate contact forces induced by lab-grown granular freshwater ice without requiring recalibration when crushing is the dominant failure mode. However, for natural ice or when significant spalling occurs, the modified material model in [10] was suggested to lead to conservative estimations of the structural damage. Thus, further research on these matters is recommended.

4. Conclusions

This study presented a critical review of the strength envelopes and rheological theories commonly employed in the constitutive material models for simulating ice crushing in marine engineering applications. The discussions were based on the established principles of ice mechanics and empirical evidence. The main conclusions are summarised in Table 1 and detailed below.
The yield and failure criteria adopted from soil, rock, and concrete mechanics, including Mohr–Coulomb and Drucker–Prager criteria, are not suitable in their conventional forms for simulating pressure softening and melting of ice. As such, when employing constitutive models founded on these or similar criteria that do not account for pressure softening, caution is imperative. Their application should be limited to scenarios where the hydrostatic pressure in ice remains sufficiently below the hardening-to-softening transition pressure.
For plasticity-based models, the elliptical (simplified Tsai–Wu) yield envelope has gained traction due to its agreement with physical compression test data and its capability to account for both the pressure hardening and softening of ice. Consequently, the Crushable Foam plasticity model, which utilises this yield envelope, has emerged as a popular choice in ice-crushing research. This prevalence is also partly due to it being readily available in commercial FEA software. Nevertheless, recent research has demonstrated that this model is incapable of replicating the confining pressure effects in ice due to its flow rule, assuming a zero plastic Poisson’s ratio. Hence, implementations of this model in the literature involve a manual procedure in the pre-processing to partition the ice domain into zones, which are assigned high and low strength properties to compensate for the shortcomings of the Crushable Foam model.
The manual partitioning of the ice domain into hard and soft zones lacks precise information regarding the size and shape of these zones across various ice–structure interaction scenarios. These scenarios are characterised by changing geometrical properties and types of ice, as well as variable loading rates and environmental conditions. Due to these uncertainties, manual partitioning of the ice domain into different zones is not a practical or reliable technique. An alternative plasticity model using the elliptical yield criteria (available on GitHub [85]) was formulated by Liu et al. [84] and modified by Mokhtari et al. [10,86] to include strain rate effects. This model has an associated flow rule and can effectively capture the confining effects, thereby outperforming the Crushable Foam model in ice-crushing simulations.
The application range of plasticity models is limited to the brittle regime of ice, at strain rates above the ductile-to-brittle transition rate. In addition, they cannot simulate the viscous flow of pulverised ice. Conversely, viscoelastic models have no strain rate limitations and can be universally applied to ice–structure interaction scenarios. They can model the phase transition from the solid intact ice to the fluid-like pulverised ice, including its viscous flow. Yet, the complexity of viscoelastic models, their extensive calibration requirements for numerous parameters, and the substantial computational resources they require make them a less practical choice for widespread application in large-scale marine engineering projects.
The constitutive models discussed in this paper have been almost invariably implemented using the explicit solver in either Abaqus or LS-DYNA, which are general-purpose multiphysics simulation software packages. However, the choice between these two software options has a negligible influence on the outputs of ice-crushing simulations when the same problem is addressed using identical constitutive models, the same numerical method (e.g., FEM), and the same solver type.

Author Contributions

Conceptualization, M.M.; methodology, M.M. and B.J.L.; software, M.M.; validation, M.M.; formal analysis, M.M.; investigation, M.M.; resources, M.M.; data curation, M.M.; writing—original draft preparation, M.M.; writing—review and editing, M.M. and B.J.L.; visualization, M.M. All authors have read and agreed to the published version of the manuscript.

Funding

This research received no external funding.

Institutional Review Board Statement

Not applicable.

Informed Consent Statement

Not applicable.

Data Availability Statement

Not applicable.

Acknowledgments

The first author is grateful for the support provided by the Norwegian University of Science and Technology, NTNU, through the Onsager Fellowship Programme.

Conflicts of Interest

The authors declare no conflicts of interest.

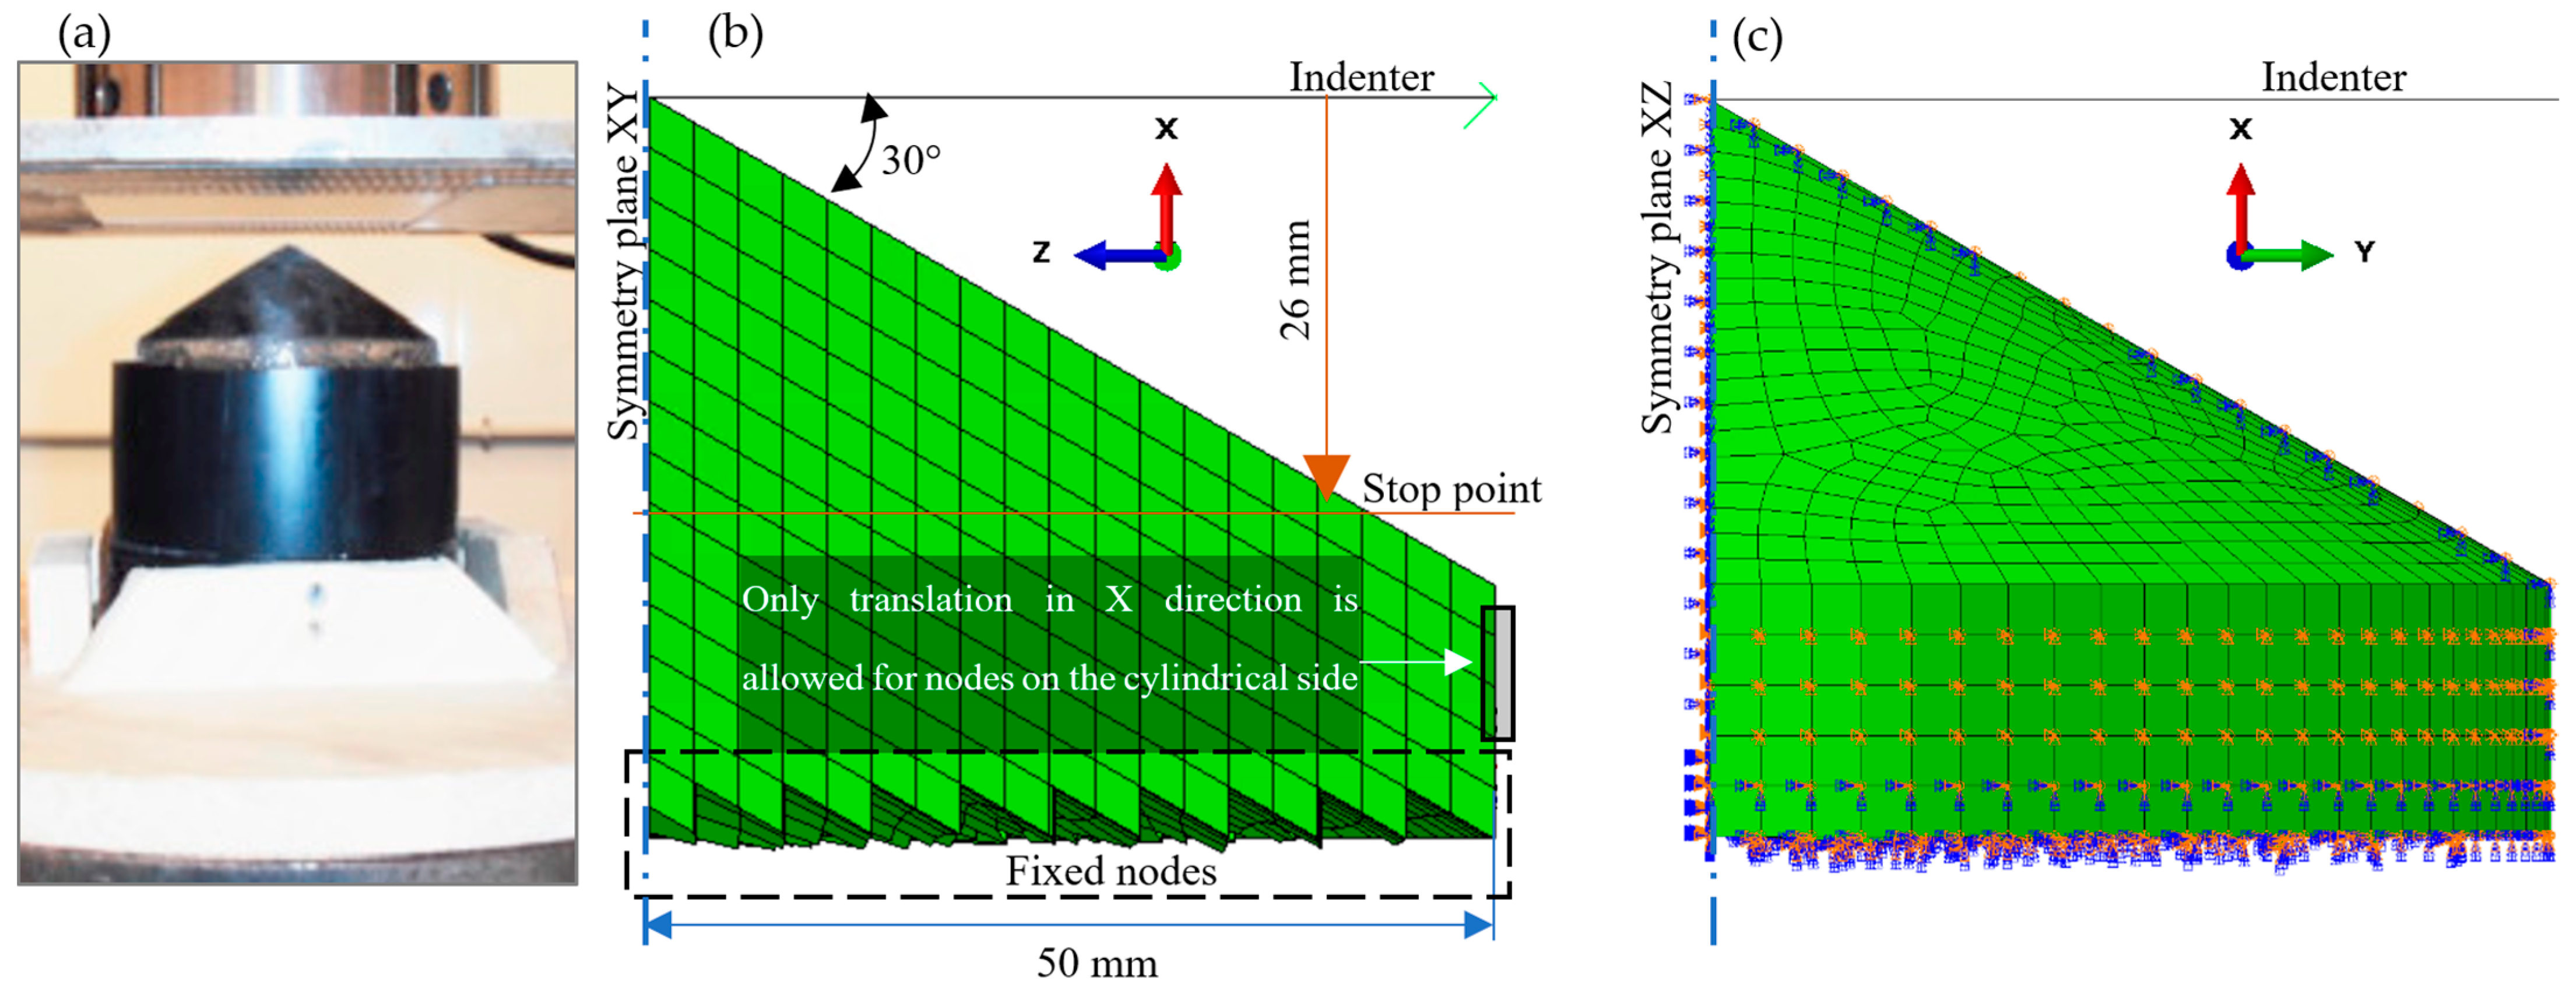
Appendix A. Conical Ice-Crushing Test: Physical and Numerical Model Setup

Figure A1 illustrates the setup of ice-crushing tests conducted by Kim et al. [79] along with the corresponding numerical model developed by Mokhtari et al. in [9,10,65] with two different indentation speeds: V = 100 mm/s and V = 1 mm/s.
Figure A1. (a) Physical test setup [79]. (b) Front view of a finite element model discretized with 3 mm elements. (c) Back view of the same finite element model with boundary conditions visualised. (with permission from Elsevier).
Jmse 12 01021 g0a1

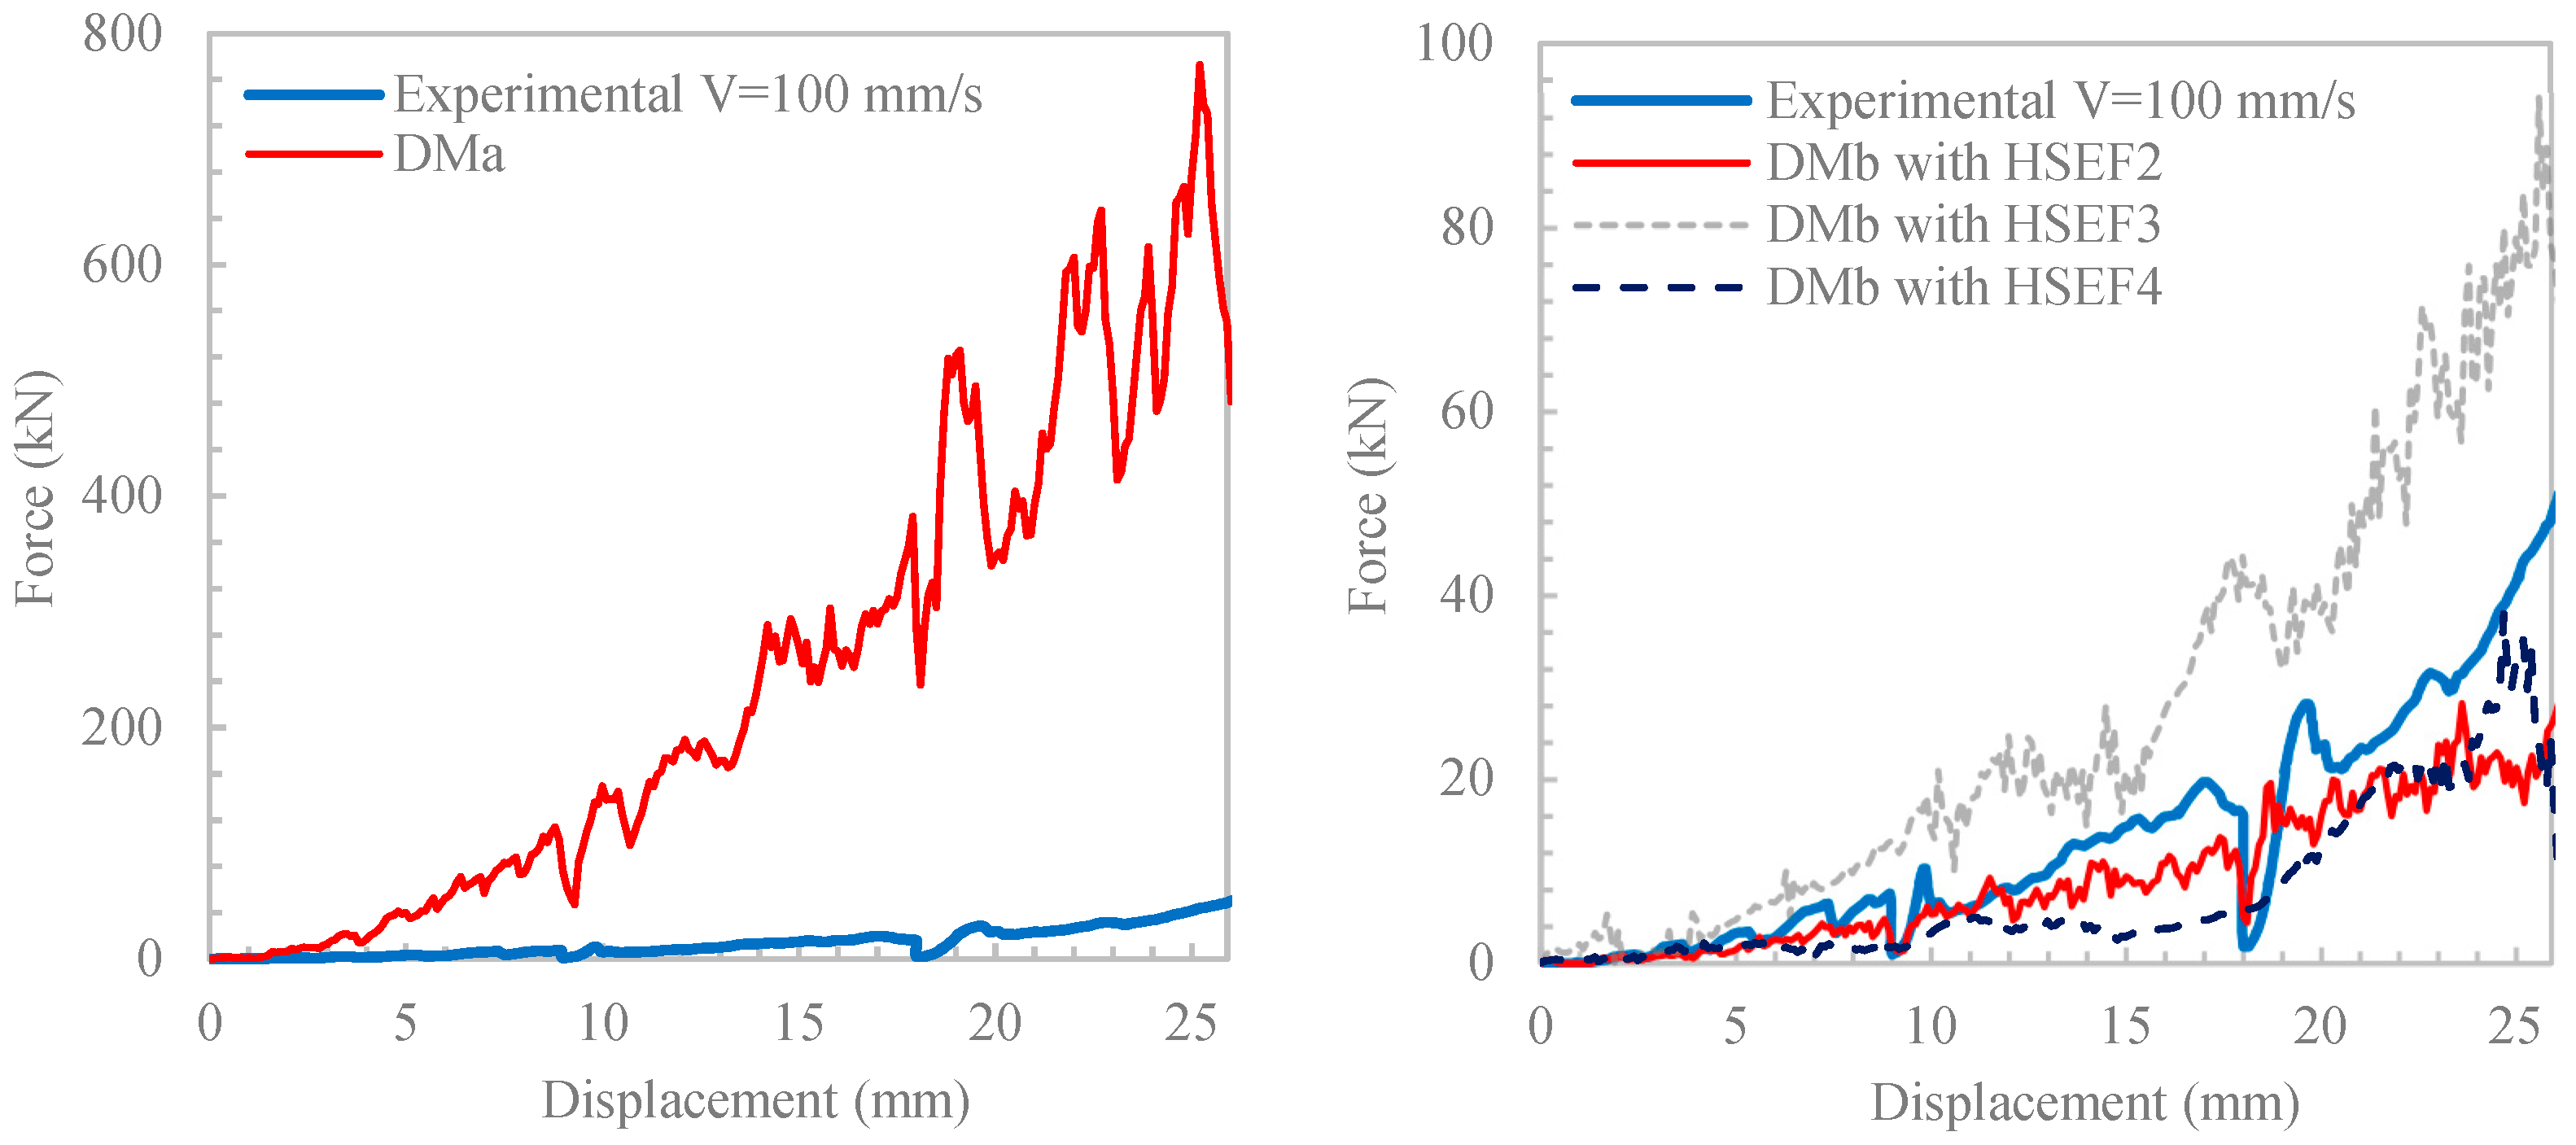
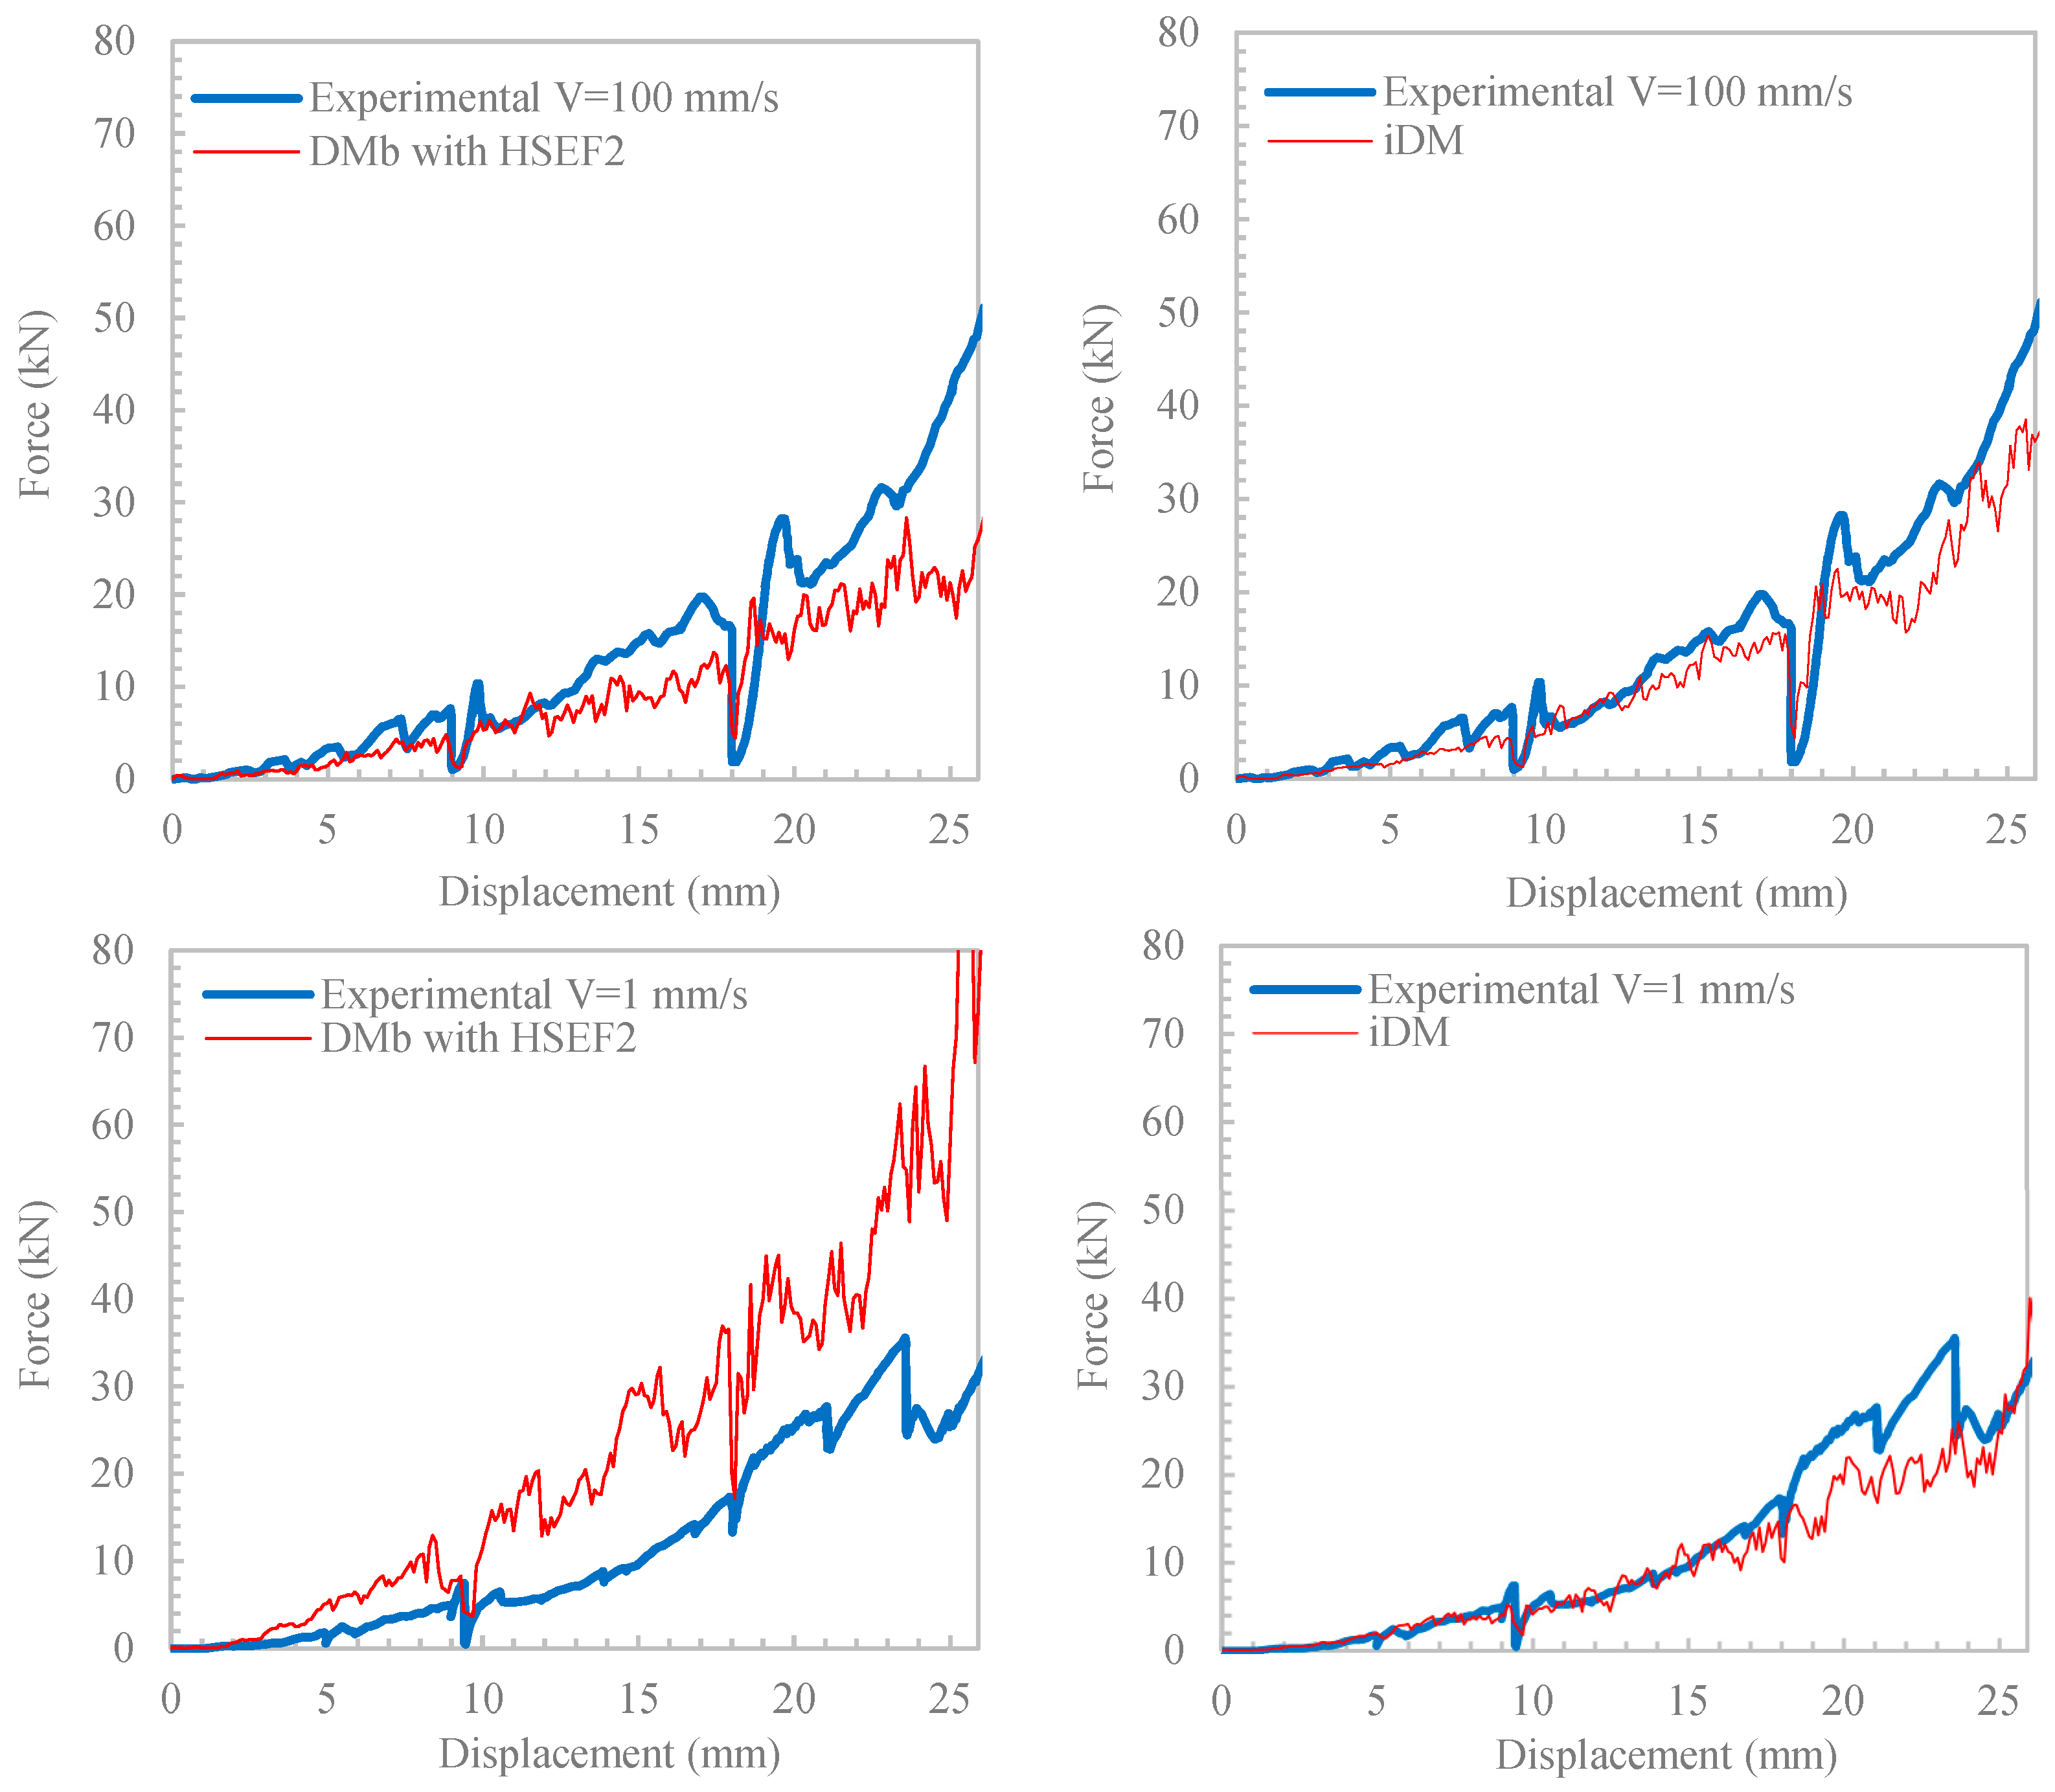
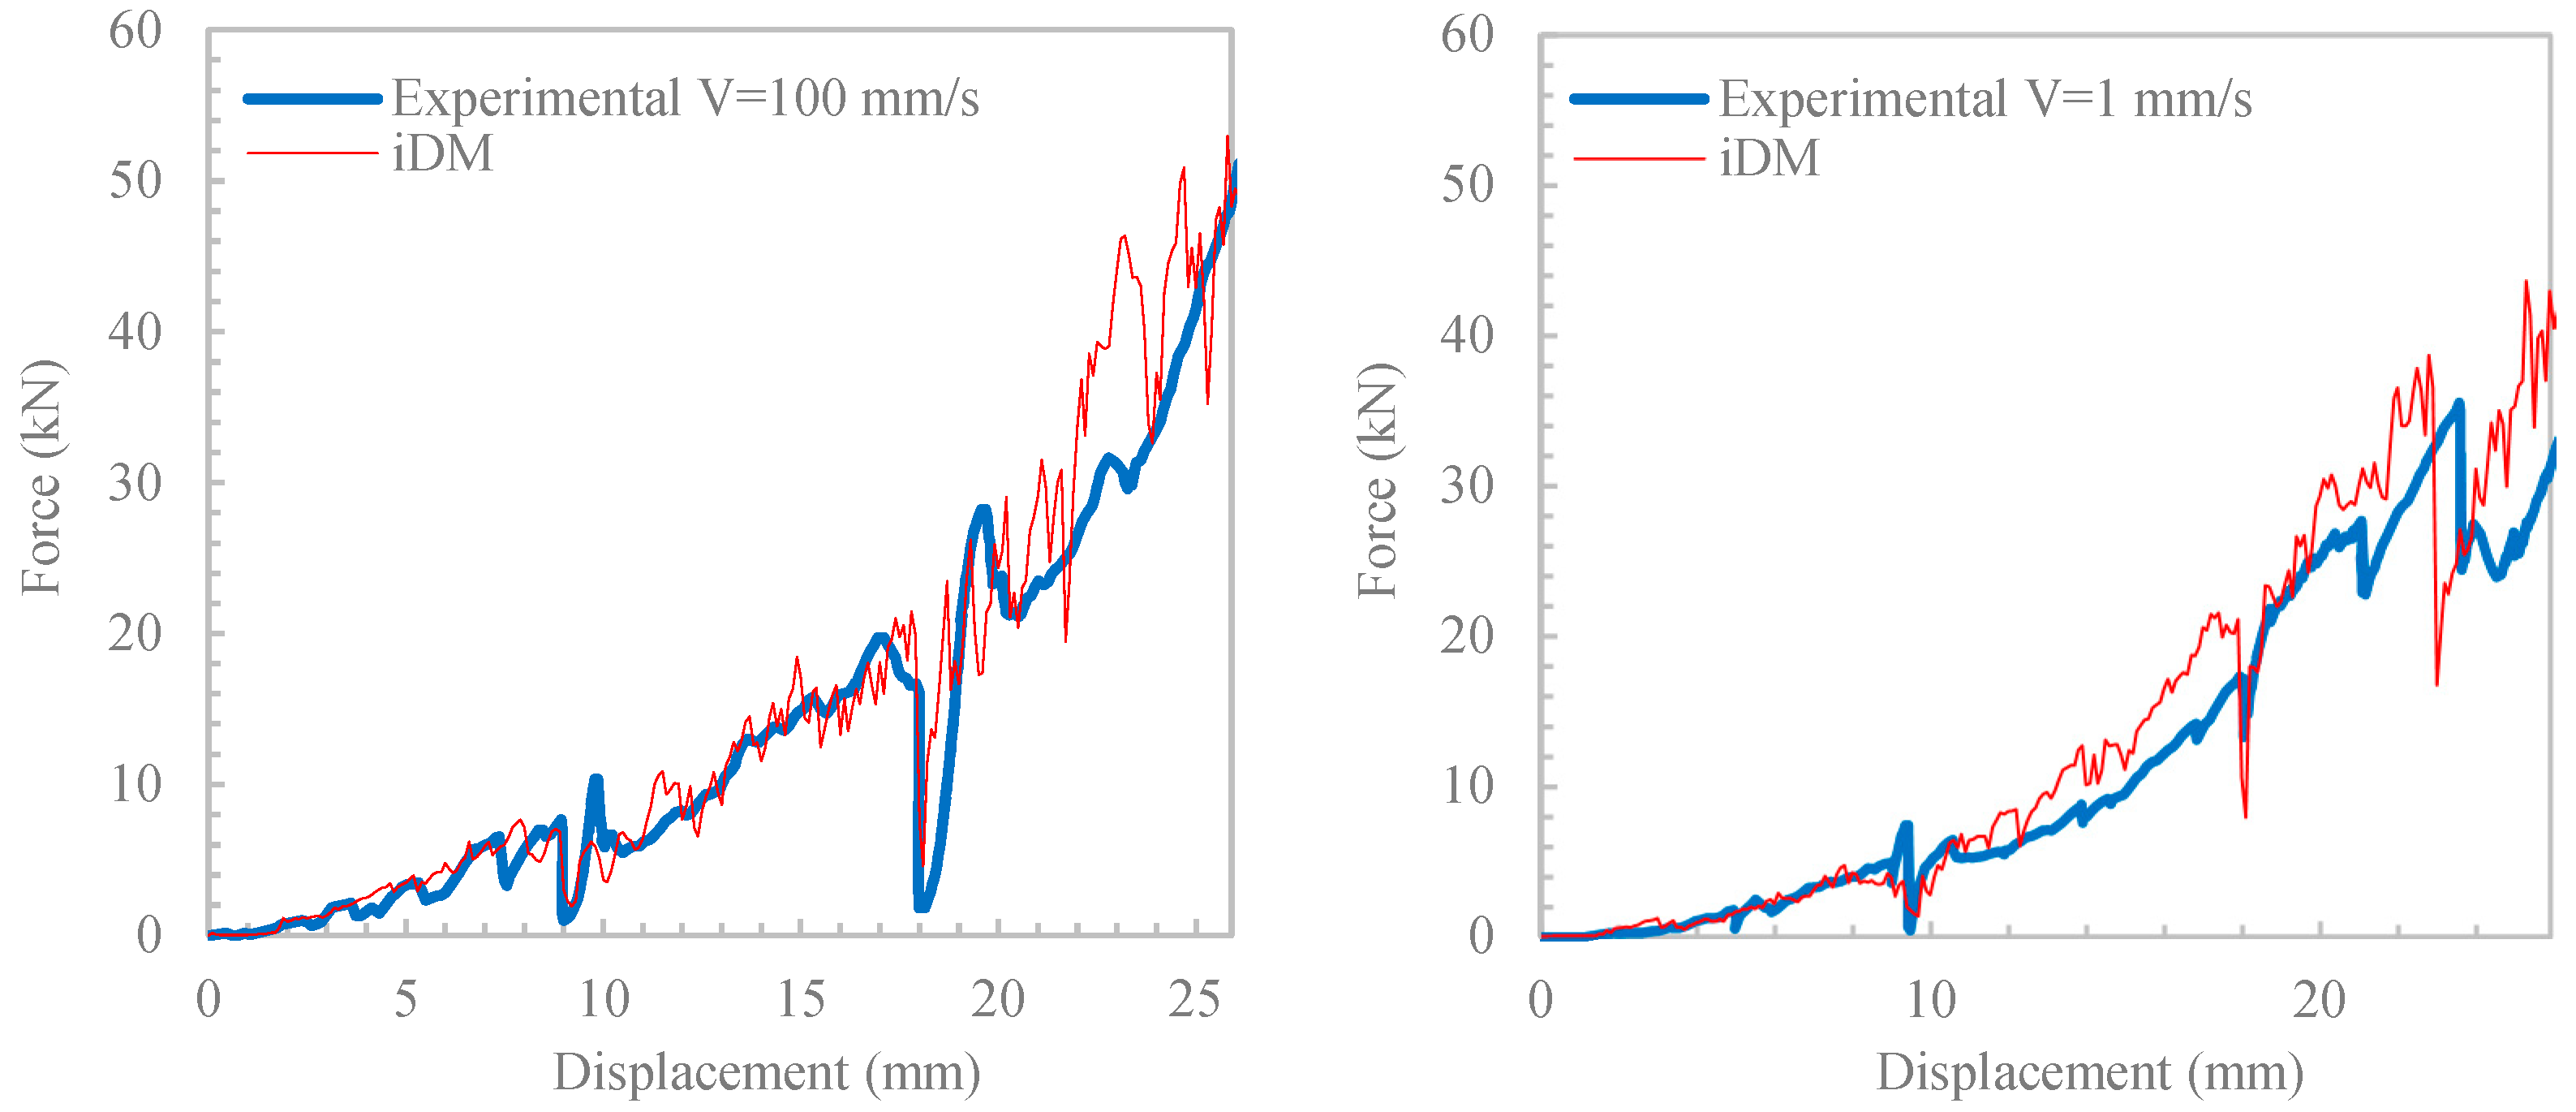
Appendix B. Performance Assessment of the Viscoelastic Damage Models [9]

The capabilities of the viscoelastic damage models discussed in Section 3.1—DMa, DMb, and iDM—to simulate the progressive crushing of the conical ice specimen given in Appendix A are demonstrated in Figure A2 and Figure A3. The numerical model with DMa (by Xiao [37]) significantly overestimated ice forces in the test with V = 100 mm/s. The numerical results based on DMb (by Turner [41]) correlated much better with the physical test data, and the best performance of DMb was observed when applied in conjunction with HSEF2. However, Figure A3 shows that with DMb, the numerical ice forces increased when the indentation speed decreased from 100 mm/s to 1 mm/s, in contrast to the physical test results, which exhibited an opposite trend. The numerical model using iDM (by Mokhtari et al. [9]) closely replicated the trend observed in the physical test results and simulated ice forces consistent with the physical test data for both indentation speeds. Figure A4 demonstrates that the numerical results could be further improved by using iDM in conjunction with the coupled FEM-SPH method. For further details, refer to [9].
Figure A2. FEM force-displacement results obtained for V = 100 mm/s using DMa and DMb (with three different HSEF models) versus experimental data.
Jmse 12 01021 g0a2
Figure A3. Comparison of DMb-HSEF2 and iDM in replicating physical test results at both indentation speeds using FEM.
Jmse 12 01021 g0a3
Figure A4. Numerical results using iDM when the coupled FEM-SPH method is implemented instead of FEM.
Jmse 12 01021 g0a4

References

  1. Meier, W.N.; Hovelsrud, G.K.; Van Oort, B.E.; Key, J.R.; Kovacs, K.M.; Michel, C.; Haas, C.; Granskog, M.A.; Gerland, S.; Perovich, D.K. Arctic sea ice in transformation: A review of recent observed changes and impacts on biology and human activity. Rev. Geophys. 2014, 52, 185–217. [Google Scholar] [CrossRef]
  2. Brosnan, I.G.; Leschine, T.M.; Miles, E.L. Cooperation or conflict in a changing Arctic? Ocean Dev. Int. Law 2011, 42, 173–210. [Google Scholar] [CrossRef]
  3. Hammer, T.C.; Hendrikse, H. Experimental study into the effect of wind-ice misalignment on the development of ice-induced vibrations of offshore wind turbines. Eng. Struct. 2023, 286, 116106. [Google Scholar] [CrossRef]
  4. Barooni, M.; Nezhad, S.K.; Ali, N.A.; Ashuri, T.; Sogut, D.V. Numerical study of ice-induced loads and dynamic response analysis for floating offshore wind turbines. Mar. Struct. 2022, 86, 103300. [Google Scholar] [CrossRef]
  5. King, T.; Ralph, F.; Fuglem, M.; Stuckey, P.; Thijssen, J.; Turnbull, I.; Huang, Y.; Talimi, V.; Liu, L.; Yulmetov, R. Ice Risk Analysis for Floating Wind Turbines, Offshore Newfoundland and Labrador. In Proceedings of the Offshore Technology Conference, Houston, TX, USA, 2–5 May 2022; p. D031S031R007. [Google Scholar]
  6. Schulson, E.M. Brittle failure of ice. Eng. Fract. Mech. 2001, 68, 1839–1887. [Google Scholar] [CrossRef]
  7. Jones, S.J. A review of the strength of iceberg and other freshwater ice and the effect of temperature. Cold Reg. Sci. Technol. 2007, 47, 256–262. [Google Scholar] [CrossRef]
  8. Shazly, M.; Prakash, V.; Lerch, B.A. High strain-rate behavior of ice under uniaxial compression. Int. J. Solids Struct. 2009, 46, 1499–1515. [Google Scholar] [CrossRef]
  9. Mokhtari, M.; Kim, E.; Amdahl, J. A non-linear viscoelastic material model with progressive damage based on microstructural evolution and phase transition in polycrystalline ice for design against ice impact. Int. J. Impact Eng. 2023, 176, 104563. [Google Scholar] [CrossRef]
  10. Mokhtari, M.; Kim, E.; Amdahl, J. A rate and pressure dependent elastoplastic material model for glacial ice colliding with marine structures. In Advances in the Analysis and Design of Marine Structures; CRC Press: London, UK, 2023. [Google Scholar]
  11. Derradji-Aouat, A. A unified failure envelope for isotropic fresh water ice and iceberg ice. In Proceedings of the ETCE/OMAE Joint Conference Energy for the New Millenium, New Orleans, LA, USA, 14–17 February 2000. [Google Scholar]
  12. Nadreau, J.-P.; Michel, B. Yield and failure envelope for ice under multiaxial compressive stresses. Cold Reg. Sci. Technol. 1986, 13, 75–82. [Google Scholar] [CrossRef]
  13. Li, H.; Feng, Y.; Ong, M.C.; Zhao, X.; Zhou, L. An Approach to Determine Optimal Bow Configuration of Polar Ships under Combined Ice and Calm-Water Conditions. J. Mar. Sci. Eng. 2021, 9, 680. [Google Scholar] [CrossRef]
  14. Sotthewes, K.; Bampoulis, P.; Zandvliet, H.J.; Lohse, D.; Poelsema, B. Pressure-induced melting of confined ice. ACS Nano 2017, 11, 12723–12731. [Google Scholar] [CrossRef]
  15. Jones, S.J. The Confined Compressive Strength of Polycrystalline Ice. J. Glaciol. 1982, 28, 171–178. [Google Scholar] [CrossRef]
  16. Patil, A.; Sand, B.; Cwirzen, A.; Fransson, L. Numerical prediction of ice rubble field loads on the Norströmsgrund lighthouse using cohesive element formulation. Ocean Eng. 2021, 223, 108638. [Google Scholar] [CrossRef]
  17. Li, L.; Gao, Q.; Bekker, A.; Dai, H. Formulation of ice resistance in level ice using double-plates superposition. J. Mar. Sci. Eng. 2020, 8, 870. [Google Scholar] [CrossRef]
  18. Patil, A.; Sand, B.; Fransson, L. Numerical simulations of shear properties of ice rubble: A shear box experiment. In Proceedings of the 22nd International Conference on Port and Ocean Engineering under Arctic Conditions, Espoo, Finland, 9–13 June 2013. [Google Scholar]
  19. Han, D.; Lee, H.; Choung, J.; Kim, H.; Daley, C. Cone ice crushing tests and simulations associated with various yield and fracture criteria. Ships Offshore Struct. 2017, 12, S88–S99. [Google Scholar] [CrossRef]
  20. Jeon, S.; Kim, Y. Numerical simulation of level ice–structure interaction using damage-based erosion model. Ocean Eng. 2021, 220, 108485. [Google Scholar] [CrossRef]
  21. Zhang, N.; Zheng, X.; Ma, Q. Updated smoothed particle hydrodynamics for simulating bending and compression failure progress of ice. Water 2017, 9, 882. [Google Scholar] [CrossRef]
  22. Zhang, N.; Zheng, X.; Ma, Q.; Hu, Z. A numerical study on ice failure process and ice-ship interactions by Smoothed Particle Hydrodynamics. Int. J. Nav. Archit. Ocean Eng. 2019, 11, 796–808. [Google Scholar] [CrossRef]
  23. Bhat, S.; Choi, S.; Wierzbicki, T.; Karr, D. Failure analysis of impacting ice floes. J. Offshore Mech. Arct. Eng. 1991, 113, 171–178. [Google Scholar] [CrossRef]
  24. Pariseau, W.G. Plasticity Theory For Anisotropic Rocks And Soil. In Proceedings of the 10th U.S. Symposium on Rock Mechanics (USRMS), Austin, TX, USA, 20–22 May 1968; pp. 267–295. [Google Scholar]
  25. Tsai, S.W.; Wu, E.M. A general theory of strength for anisotropic materials. J. Compos. Mater. 1971, 5, 58–80. [Google Scholar] [CrossRef]
  26. Glen, J.W. The creep of polycrystalline ice. Proceedings of the Royal Society of London. Series A. Math. Phys. Sci. 1955, 228, 519–538. [Google Scholar]
  27. Dillon, H.; Andersland, O. Physics of Snow and Ice. In Proceedings of the International Conference on Low Temperature Science. I. Conference on Physics of Snow and Ice, II. Conference on Cryobiology, Sapporo, Japan, 14–19 August 1966; pp. 313–328. [Google Scholar]
  28. Gold, L.W. The Failure Process in Columnar-Grained Ice. Ph.D. Thesis, McGill University, Montréal, QC, Canada, 1970. [Google Scholar]
  29. Barnes, P.; Tabor, D.; Walker, J. The friction and creep of polycrystalline ice. Proc. R. Soc. Lond. A Math. Phys. Sci. 1971, 324, 127–155. [Google Scholar]
  30. Sinha, N.K. Rheology of columnar-grained ice. Exp. Mech. 1978, 18, 464–470. [Google Scholar] [CrossRef]
  31. Sinha, N.K.; Ehrhart, P.; Carstanjen, H.; Fattah, A.; Roberto, J. Grain boundary sliding in polycrystalline materials. Philos. Mag. A 1979, 40, 825–842. [Google Scholar] [CrossRef]
  32. Jordaan, I.J.; McKenna, R.F. Constitutive relations for the creep of ice. In Proceedings of the International Association for Hydraulic Research (IAHR) Symposium on Ice, Sapporo, Japan, 23–27 August 1988; pp. 47–58. [Google Scholar]
  33. Jordaan, I.J.; McKenna, R.F. Modelling of progressive damage in ice. In Proceedings of the International Association for Hydraulic Research (IAHR) Symposium on Ice, Sapporo, Japan, 23–27 August 1988; pp. 582–624. [Google Scholar]
  34. Schapery, R.A. On viscoelastic deformation and failure behavior of composite materials with distributed flaws. In 1981 Advances in Aerospace Structures and Materials, Proceedings of the Winter Annual Meeting, Washington, DC, USA, 15–20 November 1981; NASA STI: Hampton, VA, USA, 1981; pp. 5–20. [Google Scholar]
  35. Schapery, R.A. Correspondence principles and a generalized J integral for large deformation and fracture analysis of viscoelastic media. Int. J. Fract. 1984, 25, 195–223. [Google Scholar] [CrossRef]
  36. Xiao, J. Finite Element Modelling of Damage Processes in Ice-structure Interaction. Master’s Thesis, Memorial University of Newfoundland, St. John’s, NL, Canada, 1991. [Google Scholar]
  37. Xiao, J. Damage and Fracture of Brittle Viscoelastic Solids with Application to Ice Load Models. Ph.D. Thesis, Memorial University of Newfoundland, St. John’s, NL, Canada, 1997. [Google Scholar]
  38. Liu, B. Numerical Modelling of Medium Scale Indentation Tests. Master’s Thesis, Memorial University of Newfoundland, St. John’s, NL, Canada, 1994. [Google Scholar]
  39. Li, C. Finite Element Analysis of Ice-Structure Interaction with a Viscoelastic Model Coupled with Damage Mechanics. Master’s Thesis, Memorial University of Newfoundland, St. John’s, NL, Canada, 2002. [Google Scholar]
  40. Moore, P.; Jordaan, I.; Taylor, R. Explicit finite element analysis of compressive ice failure using damage mechanics. In Proceedings of the 22nd International Conference on Port and Ocean Engineering under Arctic Conditions, Espoo, Finland, 9–13 June 2013; pp. 9–13. [Google Scholar]
  41. Turner, J. Constitutive Behaviour of Ice under Compressive States of Stress and Its Application to Ice-Structure Interactions. Ph.D. Thesis, Memorial University of Newfoundland, St. John’s, NL, Canada, 2018. [Google Scholar]
  42. Jordaan, I.J.; McKenna, R.F. Processes of deformation and fracture of ice in compression. In Ice-Structure Interaction: IUTAM-IAHR Symposium on Ice-Structure Interaction, St. John’s, Newfoundland, Canada, 1989; Springer: Berlin/Heidelberg, Germany, 1991; pp. 283–309. [Google Scholar]
  43. Jordaan, I.J.; Stone, B.M.; McKenna, R.F.; Fuglem, M.K. Effect of microcracking on the deformation of ice. Can. Geotech. J. 1992, 29, 143–150. [Google Scholar] [CrossRef]
  44. Singh, S.; Jordaan, I. Constitutive behaviour of crushed ice. Int. J. Fract. 1999, 97, 171–187. [Google Scholar] [CrossRef]
  45. Singh, S.; Jordaan, I. Triaxial tests on crushed ice. Cold Reg. Sci. Technol. 1996, 24, 153–165. [Google Scholar] [CrossRef]
  46. Singh, S.K. Mechanical Behaviour of Viscoelastic Material with Changing Microstructure. Ph.D. Thesis, Memorial University of Newfoundland, St. John’s, NL, Canada, 1993. [Google Scholar]
  47. Xiao, J.; Jordaan, I. Application of damage mechanics to ice failure in compression. Cold Reg. Sci. Technol. 1996, 24, 305–322. [Google Scholar] [CrossRef]
  48. Jordaan, I.J.; Matskevitch, D.G.; Meglis, I.L. Disintegration of ice under fast compressive loading. Int. J. Fract. 1999, 97, 279–300. [Google Scholar] [CrossRef]
  49. McKenna, R.F.; Jordaan, I.J.; Xiao, J. Analysis of damage and energy flow in the crushed layer during rapid ice loading. In Proceedings of the IAHR Symposium of Ice, Espoo, Finland, 20–23 August 1990; pp. 231–245. [Google Scholar]
  50. Jonas, J.; Muller, F. Deformation of Ice under High Shear Stress. Can. J. Earth Sci. 1969, 6, 963–968. [Google Scholar] [CrossRef]
  51. Shi, C.; Hu, Z.; Ringsberg, J.; Luo, Y. A nonlinear viscoelastic iceberg material model and its numerical validation. Proc. Inst. Mech. Eng. Part M J. Eng. Marit. Environ. 2017, 231, 675–689. [Google Scholar] [CrossRef]
  52. Gagnon, R.; Gammon, P. Triaxial experiments on iceberg and glacier ice. J. Glaciol. 1995, 41, 528–540. [Google Scholar] [CrossRef]
  53. Michel, B.; Toussaint, N. Mechanisms and theory of indentation of ice plates. J. Glaciol. 1977, 19, 285–300. [Google Scholar] [CrossRef]
  54. Ince, S.T.; Kumar, A.; Paik, J.K. A new constitutive equation on ice materials. Ships Offshore Struct. 2017, 12, 610–623. [Google Scholar] [CrossRef]
  55. Stone, B.M.; Jordaan, I.J.; Jones, S.J.; McKenna, R.F. Damage of isotropic polycrystalline ice under moderate confining pressures. In Proceedings of the 10th International Conference on Port and Ocean Engineering under Arctic Conditions, Lulea, Sweden, 12–16 June 1989; pp. 408–419. [Google Scholar]
  56. Ji, S.; Chen, X.; Wang, A. Influence of the loading direction on the uniaxial compressive strength of sea ice based on field measurements. Ann. Glaciol. 2020, 61, 86–96. [Google Scholar] [CrossRef]
  57. Mokhtari, M.; Kim, E.; Amdahl, J. Numerical Simulation of Concurrent Flexural and Crushing Failure of Level Ice. In Proceedings of the International Conference on Offshore Mechanics and Arctic Engineering, Singapore, 9–14 June 2024. [Google Scholar]
  58. Sinha, N.K. Short-term rheology of polycrystalline ice. J. Glaciol. 1978, 21, 457–474. [Google Scholar] [CrossRef]
  59. Sinha, N.K. Creep model of ice for monotonically increasing stress. Cold Reg. Sci. Technol. 1983, 8, 25–33. [Google Scholar] [CrossRef]
  60. Sinha, N.K. Crack-enhanced creep in polycrystalline material: Strain-rate sensitive strength and deformation of ice. J. Mater. Sci. 1988, 23, 4415–4428. [Google Scholar] [CrossRef]
  61. Jordaan, I.J. Mechanics of ice–structure interaction. Eng. Fract. Mech. 2001, 68, 1923–1960. [Google Scholar] [CrossRef]
  62. Taylor, R.S. Analysis of Scale Effect in Compressive Ice Failure and Implications for Design. Ph.D. Thesis, Memorial University of Newfoundland, St. John’s, NL, Canada, 2010. [Google Scholar]
  63. O’Rourke, B.J.; Jordaan, I.J.; Taylor, R.S.; Gürtner, A. Experimental investigation of oscillation of loads in ice high-pressure zones, part 1: Single indentor system. Cold Reg. Sci. Technol. 2016, 124, 25–39. [Google Scholar] [CrossRef]
  64. Wang, Y.; Yao, X.; Teo, F.C.; Zhang, J. Cohesive Element Method to Level Ice-sloping Structure Interactions. Int. J. Offshore Polar Eng. 2020, 30, 385–394. [Google Scholar] [CrossRef]
  65. Mokhtari, M.; Kim, E.; Amdahl, J. Pressure-dependent plasticity models with convex yield loci for explicit ice crushing simulations. Mar. Struct. 2022, 84, 103233. [Google Scholar] [CrossRef]
  66. Gagnon, R. A numerical model of ice crushing using a foam analogue. Cold Reg. Sci. Technol. 2011, 65, 335–350. [Google Scholar] [CrossRef]
  67. Kim, J.-H.; Kim, Y. Numerical simulation of concrete abrasion induced by unbreakable ice floes. Int. J. Nav. Archit. Ocean Eng. 2019, 11, 59–69. [Google Scholar] [CrossRef]
  68. Obisesan, A.; Sriramula, S. Efficient response modelling for performance characterisation and risk assessment of ship-iceberg collisions. Appl. Ocean Res. 2018, 74, 127–141. [Google Scholar] [CrossRef]
  69. Price, A.; Quinton, B.W.; Veitch, B. Shared-energy prediction model for ship-ice interactions. In Proceedings of the SNAME Maritime Convention, Providence, RI, USA, 27–29 October 2021. [Google Scholar]
  70. Gagnon, R.; Wang, J. Numerical simulations of a tanker collision with a bergy bit incorporating hydrodynamics, a validated ice model and damage to the vessel. Cold Reg. Sci. Technol. 2012, 81, 26–35. [Google Scholar] [CrossRef]
  71. Cao, B.; Bae, D.-M.; Sohn, J.-M.; Prabowo, A.R.; Chen, T.H.; Li, H. Numerical analysis for damage characteristics caused by ice collision on side structure. In Proceedings of the International Conference on Offshore Mechanics and Arctic Engineering, Busan, Republic of Korea, 18–24 June 2016; p. V008T007A019. [Google Scholar]
  72. Wang, B.; Yu, H.-C.; Basu, R. Ship and ice collision modeling and strength evaluation of LNG ship structure. In Proceedings of the International Conference on Offshore Mechanics and Arctic Engineering, Estoril, Portugal, 15–20 June 2008; pp. 911–918. [Google Scholar]
  73. Gagnon, R. Results of numerical simulations of growler impact tests. Cold Reg. Sci. Technol. 2007, 49, 206–214. [Google Scholar] [CrossRef]
  74. Gagnon, R. Numerical rendition of ice crushing. In Proceedings of the 20th IAHR International Symposium on Ice, Lahti, Finland, 14–18 June 2010; pp. 14–18. [Google Scholar]
  75. Jordaan, I.; Wells, J.; Xiao, J.; Derradji-Aouat, A. Ice crushing and cyclic loading in compression. In Proceedings of the 19th IAHR Symposium on Ice, Vancouver, BC, Canada, 6–11 July 2008; pp. 801–813. [Google Scholar]
  76. Singh, S.K.; Jordaan, I.J.; Xiao, J.; Spencer, P.A. The flow properties of crushed ice. J. Offshore Mech. Arct. Eng. 1995, 117, 276–282. [Google Scholar] [CrossRef]
  77. Wells, J.; Jordaan, I.; Derradji-Aouat, A.; Taylor, R. Small-scale laboratory experiments on the indentation failure of polycrystalline ice in compression: Main results and pressure distribution. Cold Reg. Sci. Technol. 2011, 65, 314–325. [Google Scholar] [CrossRef]
  78. Kim, H. Simulation of compressive ‘cone-shaped’ ice specimen experiments using LS-DYNA. In Proceedings of the 13th International LS-DYNA Users Conference, Dearborn, MI, USA, 8–10 June 2014. [Google Scholar]
  79. Kim, H.; Daley, C.; Colbourne, B. A numerical model for ice crushing on concave surfaces. Ocean Eng. 2015, 106, 289–297. [Google Scholar] [CrossRef]
  80. Kim, H.; Quinton, B. Evaluation of moving ice loads on an elastic plate. Mar. Struct. 2016, 50, 127–142. [Google Scholar] [CrossRef]
  81. Deshpande, V.S.; Fleck, N.A. Isotropic constitutive models for metallic foams. J. Mech. Phys. Solids 2000, 48, 1253–1283. [Google Scholar] [CrossRef]
  82. ABAQUS Standard User’s Manual. Version 6.14; Dassault Systemes Simulia Corp.: Providence, RI, USA, 2014.
  83. Hallquist, J. LS-Dyna Keyword User’s Manual; Livermore Software Technology Corporation (LSTC): Livermore, CA, USA, 2006. [Google Scholar]
  84. Liu, Z.; Amdahl, J.; Løset, S. Plasticity based material modelling of ice and its application to ship–iceberg impacts. Cold Reg. Sci. Technol. 2011, 65, 326–334. [Google Scholar] [CrossRef]
  85. Mokhtari, M. Ice-Elastoplastic-Material-Model. Available online: https://github.com/NTNU-IMT/Ice-Elastoplastic-Material-Model (accessed on 8 January 2023).
  86. Mokhtari, M.; Kim, E.; Amdahl, J. Numerical Simulation of an Aluminium Panel Subject to Ice Impact Load Using a Rate and Pressure Dependent Elastoplastic Material Model for Ice. In Proceedings of the International Conference on Offshore Mechanics and Arctic Engineering, Melbourne, Australia, 11–16 June 2023; p. V006T007A016. [Google Scholar]
  87. Herrnring, H.; Kubiczek, J.M.; Ehlers, S.; Niclasen, N.O.; Burmann, M. Experimental investigation of an accidental ice impact on an aluminium high speed craft. In Progress in the Analysis and Design of Marine Structures; CRC Press: Boca Raton, FL, USA, 2017; pp. 697–704. [Google Scholar]
Figure 1. Schematic illustration of ice stress–strain curve dependency on the strain rate under uniaxial compressive loading condition. Strain rate hardening occurs in the ductile region ( ε ˙ < ε ˙ t ), followed by slight strain rate softening in the transition range, which is then succeeded by another strain rate hardening region, but with a lower increase rate.
Jmse 12 01021 g001
Figure 2. Non-saline ice strength vs. strain rate under uniaxial compressive stress condition [9,10], including the functions fitted on data in Jones [7] and Shazly et al. [8].
Jmse 12 01021 g002
Figure 3. Ice strength vs. confining pressure data from Jones [15] for freshwater isotropic ice and the elliptical failure envelope fitting proposed by Derradji-Aouat [11]. Ice strength here is the highest equivalent stress recorded during compressive mechanical testing of polycrystalline cylindrical specimens at −10 °C (see [15]).
Jmse 12 01021 g003
Figure 4. Mohr–Coulomb, Drucker–Prager, and the elliptical strength envelopes in the principial stress space. Note this is a schematic presentation only, to compare the shapes. The location, aspect ratio, and size of each envelope should be determined by calibrating the model parameters.
Jmse 12 01021 g004
Figure 5. The Teardrop model fitted to ice strength vs. confining pressure data from Jones [15].
Jmse 12 01021 g005
Figure 6. (a) Burgers material body diagram and (b) the strain response in blue dashed line to a constant stress in red solid line; s is the von Mises stress.
Jmse 12 01021 g006
Figure 7. (a) The evolution of isotropic ice failure locus in the principal stress space; (b) the elliptical locus and its parameters in the p-s space.
Jmse 12 01021 g007
Figure 8. (a) The ice–ice cohesive contact model in [57] using (b) a traction separation model with exponential damage evolution.
Jmse 12 01021 g008
Figure 10. The multi-layer modelling approach involving two different volumetric strain hardening curves for each layer proposed by Gagnon [66] (with permission from Elsevier).
Jmse 12 01021 g010
Figure 11. The two-zone modelling approach by Kim et al. [80] with a different ice strength for each zone (with permission from Elsevier).
Jmse 12 01021 g011
Figure 12. The single-element test setup and results from [65].
Jmse 12 01021 g012
Figure 13. Model information and the results from the ice drop test simulation in [86] using the rate- and pressure-dependent ice model in [10]. The experimental results are from [87].
Jmse 12 01021 g013
Table 1. Overview of major limitations of the main constitutive models reviewed. “Y” marks where a limitation exists, while empty green cells indicate no such limitation for the model.
Major Limitations Elastoplasticity Viscoelasticity
Mohr–Coulomb Drucker–PragerCrushable FoamLiu et al. [84]Mokhtari et al. [10] DMa by Xiao [37]DMb by Turner [41]iDM by Mokhtari et al. [9]
Limited to brittle range above transition strain rate YYYYY
Strain rate-independent elastic stiffnessYYYYY
Does not account for the effects of pulverised ice viscous flowYYYYY
Strain rate-independent strength YYYY
Does not include pressure softening of iceYY
Cannot capture confining/hydrostatic pressure in ice Y
Limited to ductile range below transition strain rate Y
Inaccurate in simulating progressive crushing of ice YY
Complex, parameter-intensive, and computationally expensive YYY
Disclaimer/Publisher’s Note: The statements, opinions and data contained in all publications are solely those of the individual author(s) and contributor(s) and not of MDPI and/or the editor(s). MDPI and/or the editor(s) disclaim responsibility for any injury to people or property resulting from any ideas, methods, instructions or products referred to in the content.

