Article

Regional Difference in Distribution Pattern and Morphological Characteristics of Embayed Sandy Beaches in Zhejiang Province, Eastern China

1
Second Institute of Oceanography, Ministry of Natural Resources of China, Hangzhou 310012, China
2
Key Laboratory of Ocean Space Resource Management Technology, Ministry of Natural Resources of China, Hangzhou 310012, China
3
Institute of Coastal System-Analysis and Modeling, Helmholtz-Zentrum Hereon, 21502 Geesthacht, Germany
*
Authors to whom correspondence should be addressed.
J. Mar. Sci. Eng. 2024, 12(7), 1223; https://doi.org/10.3390/jmse12071223
Submission received: 13 June 2024 / Revised: 19 July 2024 / Accepted: 19 July 2024 / Published: 20 July 2024
(This article belongs to the Special Issue Advance in Sedimentology and Coastal and Marine Geology—2nd Edition)

Abstract

:
The distribution pattern and the morphology of sandy beaches have been extensively studied, while those in turbid coastal environments near large river estuaries are still unclear. This study analyzes the distribution pattern, morphological characteristics, and influencing factors of Zhejiang sandy beaches using statistical analysis, based on field data and historical records. Results show that the mean grain size distribution of Zhejiang sandy beaches ranges from fine sand to very coarse sand, and the beach slope and sediment grain size correspond well with the wave heights in the three regions of Zhejiang. The extent of beach headlands in central Zhejiang appeared the largest, suggesting an increased susceptibility to wave erosion due to the less sheltered headlands. Most sandy beaches in Zhejiang formed on the islands and the areas far from the estuaries, showing quantity difference in beach distribution. The comparison of the regional difference in Zhejiang sandy beaches shows that embayment is the main factor affecting the beach distribution pattern and morphological characteristics. The different embayment characteristics provide the space for beach formation and the interaction with the coastal process, the sediment supply, the nearshore hydrodynamic environment, and human intervention also have influence on the morphological characteristics of Zhejiang beaches.

1. Introduction

Sandy coasts constitute over one-third of the world’s non-frozen coasts [1] and possess significant socio-economic and ecological value. These coasts provide habitats for coastal flora and fauna, and sandy beaches are popular tourist destinations, generating substantial benefits for coastal areas [2]. Furthermore, sandy coasts serve as crucial buffers during extreme events, such as storms and coastal flooding, providing a natural protective barrier for coastal residents. However, sandy beaches have experienced erosion in recent years, with 15% of them retreating landward at a rate of 1 m/a or even faster over the past decades [1]. To address this issue, numerous beach ecological protection and restoration projects have been implemented worldwide since the early 20th century [3,4,5], making it crucial to understand the formation conditions and morphological characteristics of sandy beaches.
The distribution pattern and morphological characteristics of sandy beaches have been extensively studied using coastal morphodynamic methods and statistical analysis techniques [6,7,8,9]. Wave action is the primary coastal dynamic factor [10,11], with additional influences from tides, currents, and winds [12,13,14]. Apart from the aforementioned coastal forces, headland (embayment) characteristics, sediment supply, and sea level changes can also play a role in beach formation and evolution [6,15,16]. Among the influencing factors, the geological setting exerts significant control over beach sediments and morphology [17,18,19,20], shaping the distribution pattern of beach landforms. With the increasing demand for beach tourism, human activities such as the construction of seawalls, artificial headlands, artificial sandbars, and breakwaters, and beach nourishment have been undertaken to prevent storm erosion and maintain recreational functions [21,22]. There interventions can also change the nearshore hydrodynamics, and even cause long-term disturbance [23,24], thus influencing beach evolution.
Embayed beaches constitute more than 50% of sandy beaches [25] and exhibit distinct behavior compared to beaches without headland control [7,18,19,26]. This distinction is crucial for beach management and conservation. Assessing and categorizing headland morphology has been proven effective in organizing embayment. The indentation of embayment has impacts on sediment transport and influences morphological patterns [27,28,29]. Previous studies have focused on the classification of embayed beaches [28,30,31,32], while the distribution pattern and morphological characteristics of embayed sandy beaches in different regions require further understanding.
Most of the sandy beaches in China are embayed beaches, and they are mainly distributed in the south and in the Shandong Peninsula, while they are rare in eastern China [15,33]. Zhejiang, with a total coastline of 6910 km—the longest among China’s coastal provincial administrative regions—only has 122 km of gravel–sandy coastline and limited embayed sandy beach resources [34]. Tides, waves, and coastal currents promote the southward transport and diffusion of Yangtze River sediments [35,36,37], resulting in the turbid coastal environment of Zhejiang province with sufficient fine-grained sediment supply [38,39]. Current studies on this sandy beach-poor area are focused on the morphodynamic processes on individual beaches [40,41], while the basic characteristics and regional differences in sandy beaches formed on this coast with sufficient fine sediment supply remain unclear.
Therefore, this study focuses on the Zhejiang sandy beaches in the turbid coastal environment near the Yangtze River estuary, and the aims of this study are (1) to systematically analyze the distribution pattern and morphological characteristics, (2) to find out the regional difference in the sandy beaches in Zhejiang, and (3) to further explore the influencing factors of the distribution pattern and morphological characteristics of sandy beaches in a similar area.

2. Study Area

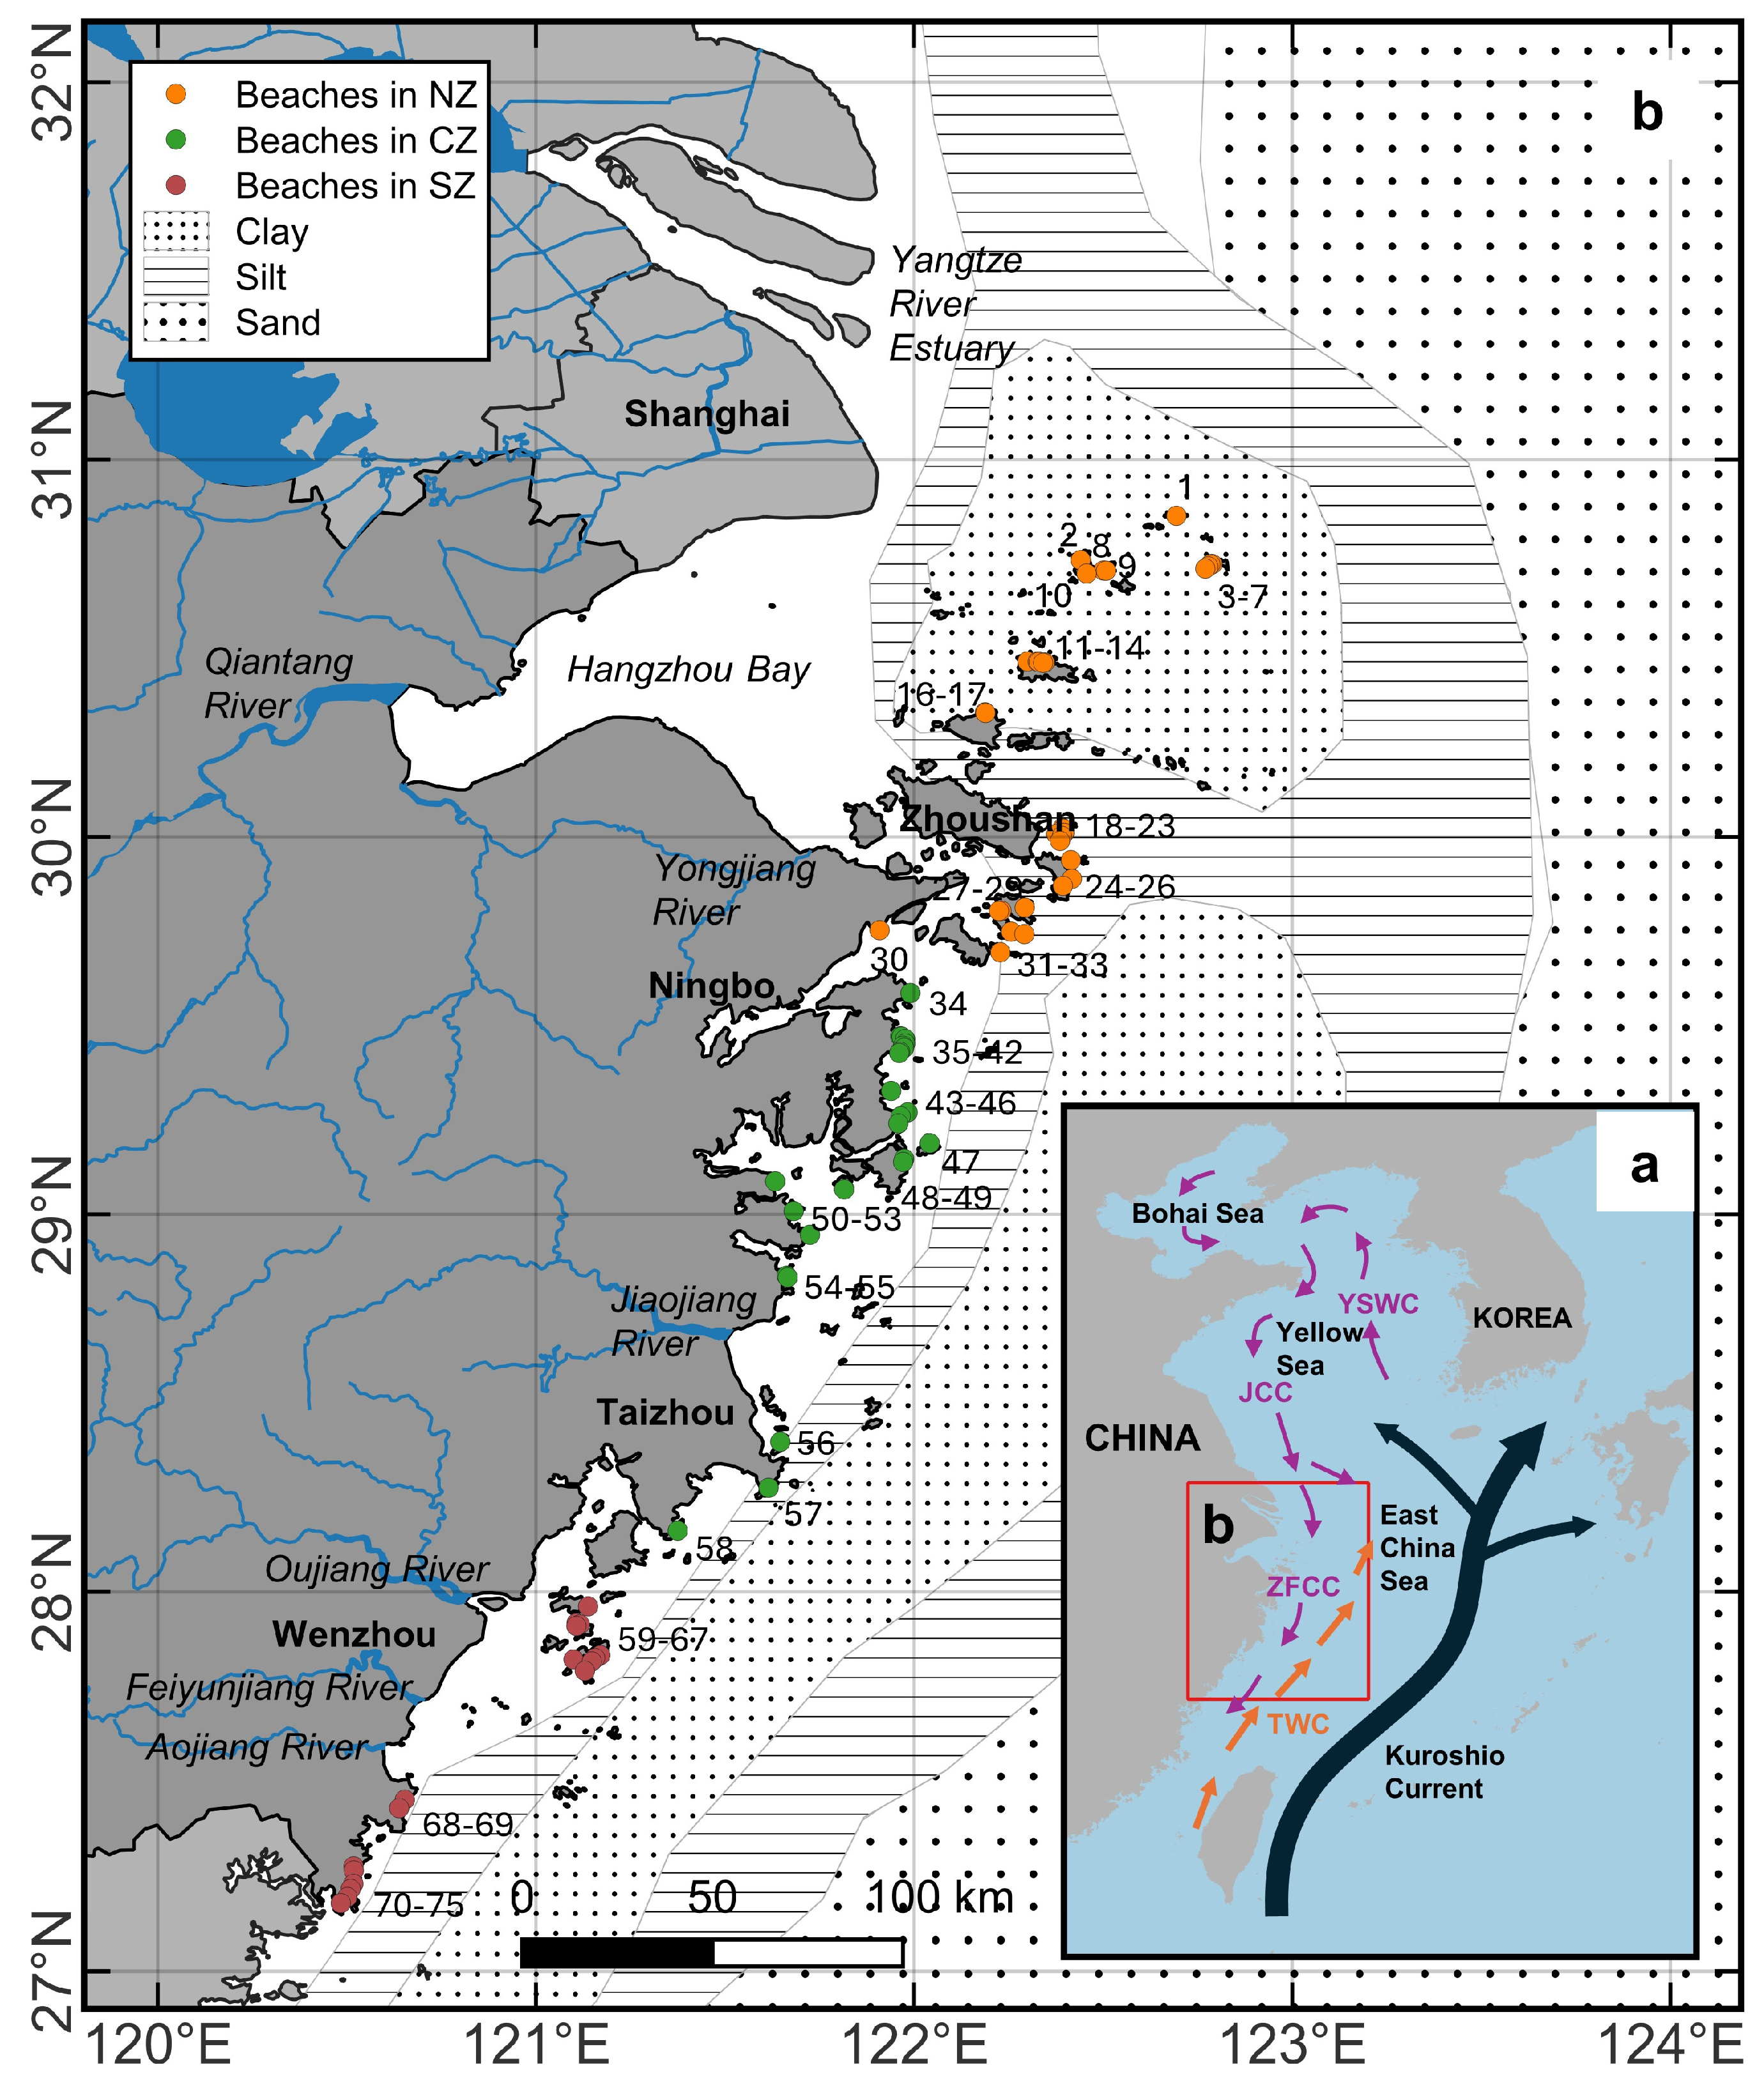
2.1. Geographical Location and Geological Setting

Zhejiang province is situated on the eastern coast of China (Figure 1a), in a subtropical monsoon climate zone, characterized by seasonal changes in prevailing wind direction and precipitation, and frequently affected by typhoon events (approximately six typhoons per year [42]).
The total length of the Zhejiang coastline is 6910 km, including 2410 km of mainland coastline and 4500 km of island coastline [34]. The Zhejiang coastal zone is in the South China Uplifted Belt. A series of NE-SW and NW-SE trending fault structures formed in the Cenozoic era intersect with the South China coastline obliquely, and mountains or hills rise to the sea, thus forming a series of meandering coasts, which is the basis for the formation of the embayed coast. The northern coast of Zhejiang province is located in the southern margin of the Yangtze River delta plain, while the other coast is located in the volcanic hills of eastern and southern Zhejiang province [33]. Its coastal regions can be broadly divided into northern Zhejiang (NZ), central Zhejiang (CZ), and southern Zhejiang (SZ) from north to south. The NZ coastal region is located at the southern end of the Yangtze River delta plain, including Zhoushan city, which has a wide range of islands and intersecting waterways. The CZ coastal region mainly covers Ningbo city and Taizhou city, with a small number of scattered islands. The SZ coastal region is mostly under the jurisdiction of Wenzhou city, which has a large number of relatively concentrated islands [43]. The southward transport of fine sediments from the Yangtze River has a significant impact on the extensive development of tidal flats in Zhejiang, while the sandy–gravel coastline only accounts for 4% [34]. This study focuses on 75 embayed sandy beaches along the Zhejiang coast, including 30 mainland beaches and 45 island beaches (Figure 1b and Table S1).
Apart from the influence of the southward transport of Yangtze River sediment, Zhejiang rivers also have impacts on the coast. The main rivers of Zhejiang, including Qiantangjiang, Yongjiang, Jiaojiang, Oujiang, Feiyunjiang, and Aojiang, flow into the East China Sea and are all mountainous rivers with short streams, forming the basis of the headland coast of Zhejiang and providing part of the sediment source for the coast (Figure 1b) [33,44]. Among the Zhejiang rivers, Qiantangjiang and Oujiang are the largest and the second large river, with a multiyear averaged sediment discharge of 668.7 × 10⁴ t and 225.6 × 10⁴ t, respectively [33].
The surficial sediments in the Zhejiang sea area are mainly silt and clay (Figure 1b), resulting from the southward transport of Yangtze River sediment and the local small–moderate rivers [36]. The total sediment volume of the clinoform in the Zhejiang–Fujian mud wedge is estimated to be about 4.5 × 10¹¹ m3, which represents about 32% the total Yangtze-derived mud to the sea. The suspended sediment concentration (SSC) in the sea area of NZ is between 0.02 kg/m3 and 0.57 kg/m3 during winter. The SSC distribution in summer is generally lower than that in winter, but the distribution pattern is basically similar, characterized by a low concentration in the eastern islands far from the mainland. The SSC in the CZ sea area is generally low, and the SSC in winter is much higher than that in summer. The SSC in CZ during winter is mostly between <0.1 kg/m3 and 0.69 kg/m3, while the SSC is low during summer, with values mostly below 0.05 kg/m3. The SSC in the sea area of SZ is between <0.1 kg/m3 and 1.66 kg/m3, with the most turbid value occurring in the Oujiang estuary. In summer, the SSC is obviously centered on the Oujiang estuary, and the SSC shows a downward trend from south to east. Compared with winter, the range of low-value areas is greatly expanded, and the range of high-value areas is correspondingly reduced. The SSC in the estuary area is greater than that in the offshore area in SZ [43].

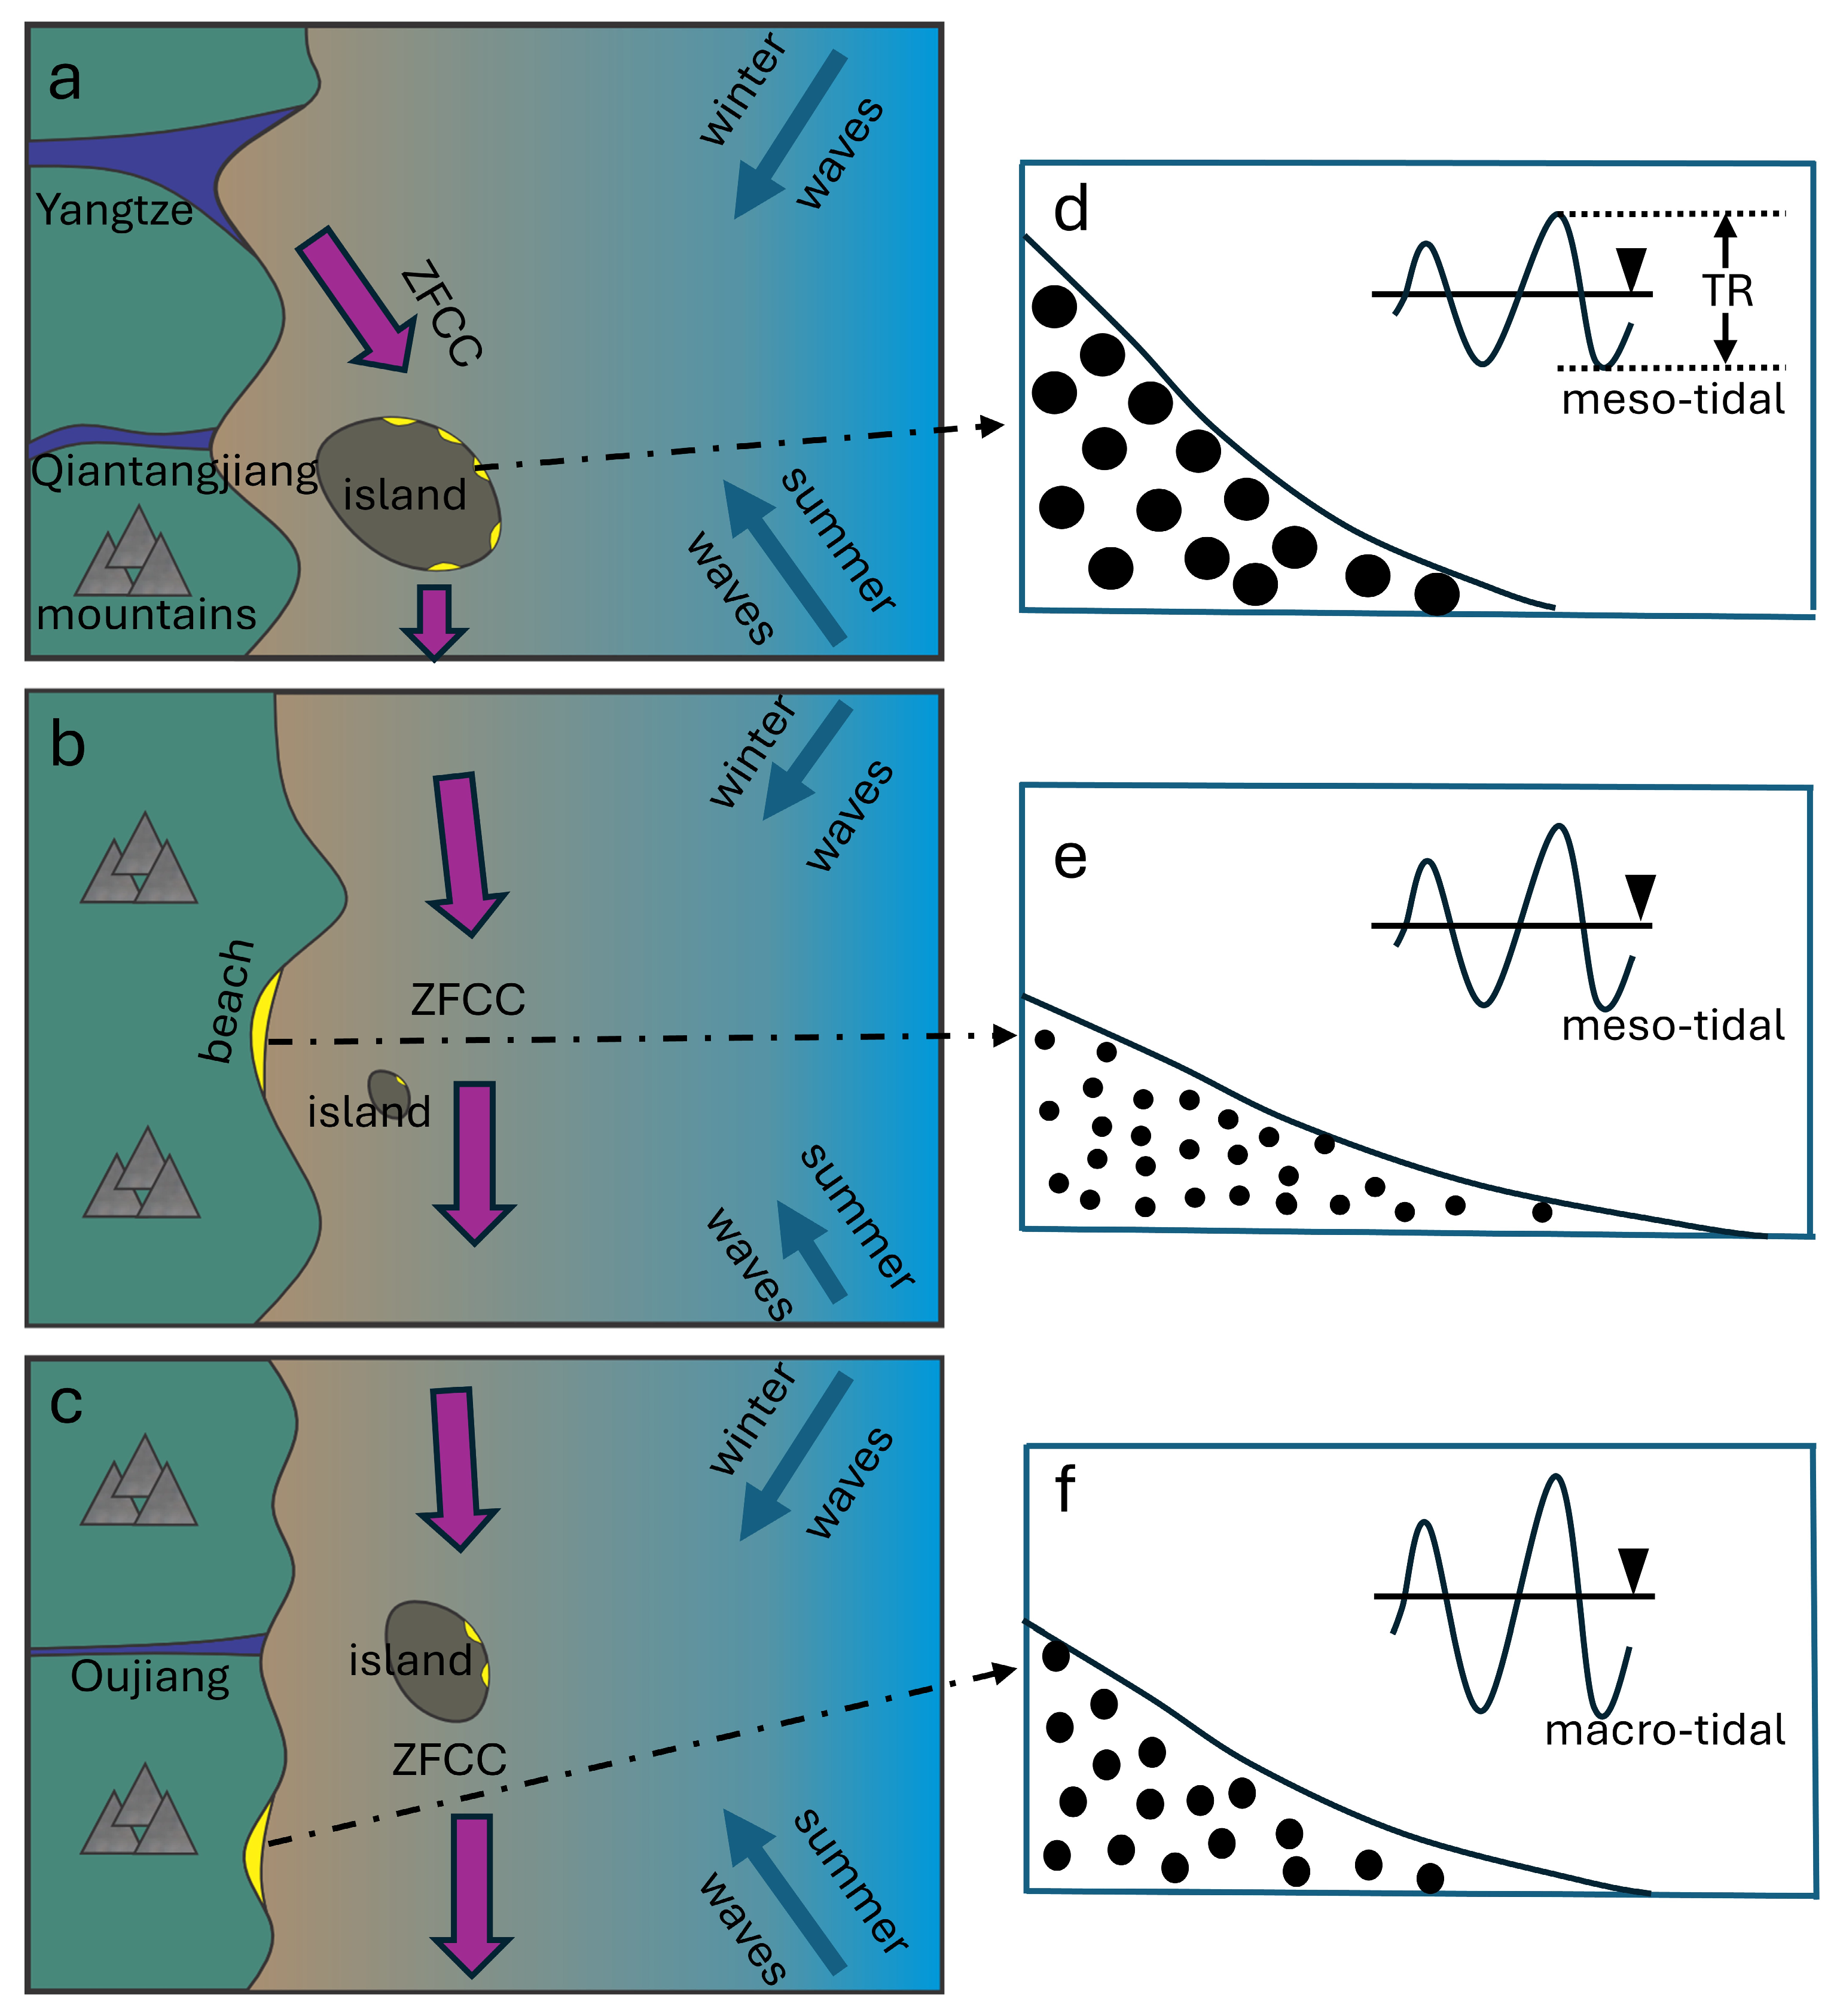
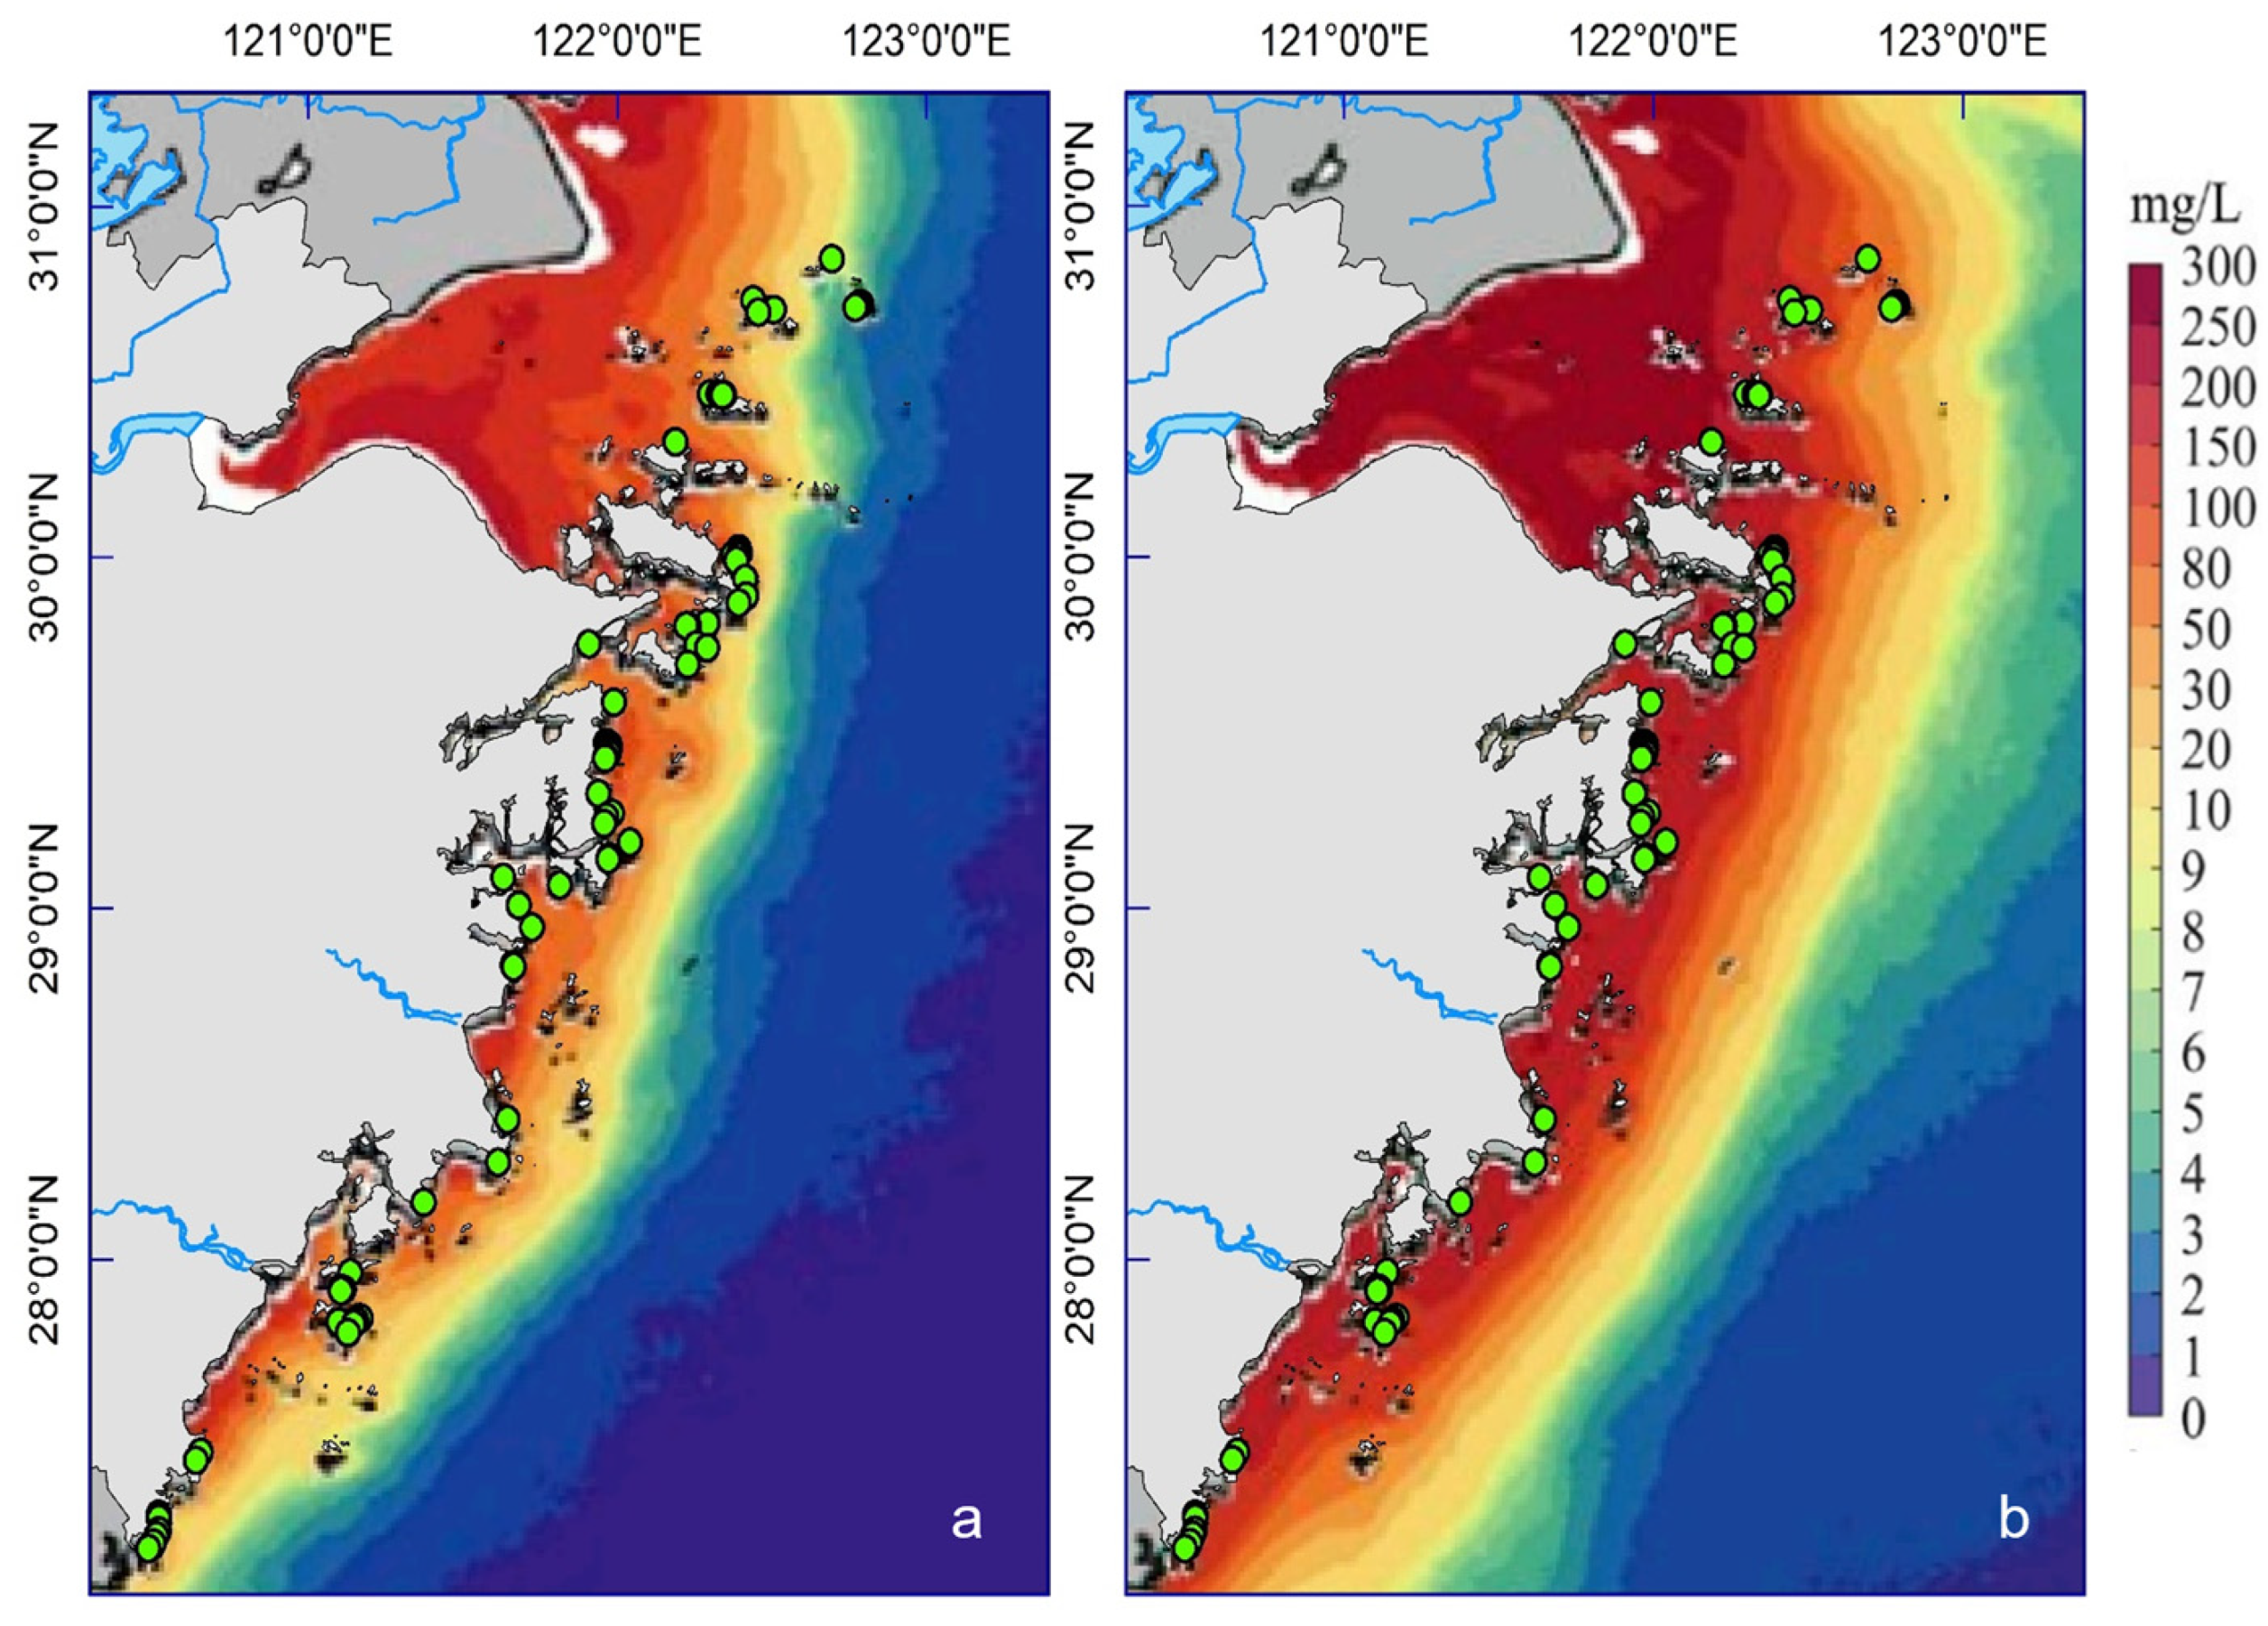
2.2. Coastal Hydrodynamic Environment

The wave direction in the Zhejiang coastal area is generally consistent with the seasonal wind direction. During summer, the waves mainly originate from the south in the coastal regions of Zhejiang, while northeasterly waves are predominant during spring and autumn. The multi-annual average wave heights along the Zhejiang coast range from 0.3 m to 1.2 m, with the average wave periods being between 1.4 s and 5.6 s [43,45,46,47]. The annual averaged wave height of NZ, CZ, and SZ are 0.79 m, 0.52 m, and 0.69 m [43,45,46,47], with the main wave directions from S-SE during summer and N-NE during winter, respectively.
Tides also show significant regional difference in the Zhejiang coastal area. The NZ region is situated in a mixed sea area with both regular and irregular semi-diurnal tides, while CZ and SZ belong to the regular semi-diurnal tidal sea area [48]. The distribution of tidal range along the Zhejiang coast exhibits distinct regional characteristics, with the average tidal range ranging from 1.91 m to 4.48 m. The annual averaged tidal range of NZ, CZ, and SZ is 2.48 m, 3.29 m, and 4.23 m, respectively [43]. The tidal range in the nearshore and island areas gradually increases from north to south and from east to west [43,49].
The coastal current in Zhejiang is mainly the Zhejiang–Fujian Coastal Current (ZFCC) flowing southward (Figure 1a), and this current intensifies in winter, carrying the Yangtze’s brackish water and sediment discharge southward along the inner shelf [36]. Offshore, there is a northward flow of warm and saline middle-deep water flow, the Taiwan Warm Current (TWC, Figure 1). In summer, under the prevailing southeast monsoon, the northward TWC intensifies and, correspondingly, the southward ZFCC weakens.

3. Materials and Methods

3.1. Collection and Processing of Beach Slope and Sediment

In this study, we conducted field measurements on 75 accessible sandy beaches in Zhejiang with lengths greater than 100 m, including 30 mainland beaches and 45 island beaches (Figure 1 and Table S1). To be specific, we established three (in the north, central, and south parts of beaches), two (in the north and south parts of beaches), and one (in the central of beaches) profiles on beaches with lengths longer than 500 m, 300 m to 500 m, and shorter than 300 m, respectively (Table S1). The profiles were measured at low tide on the measurement day from July to August 2020 using RTK GPS connected to Continuously Operating Reference Stations (CORS), with a vertical and horizontal accuracy of ±15 mm and ±8 mm, respectively. The profiles were perpendicular to the coastline, extending from the base (seawall or bedrock) to the daily low tide waterline, and a total of 147 profiles were collected (Table S1). The elevation data were then corrected to the 1985 Yellow Sea Elevation Datum. The average slope (i) of the beach was obtained by calculating the arithmetic mean of slope using the elevation data from all profiles on each beach (Figure S1).
During the measurement of beach slope, we also collected surficial sediment along the profiles (Figure S1), and a total of 441 sediment samples were obtained (Table S1). For beaches with berms, samples were collected along the profile at the backshore, beach berm, and the beach face, respectively. For beaches without berms, the sampling stations were located at the higher, middle, and lower intertidal beach along the profile, respectively. The samples were pre-treated according to laboratory standards [50] and then analyzed by SFY-D sonic vibratory automatic sieve size analyzer (Nanjing Zhonghu Ltd., Nanjing, China). Grain size parameters such as the mean grain size (Mz), sorting coefficient (σ), skewness (Sk), and kurtosis (Ku) of the beach sediments were calculated according to the graphical method [51]. Mz can represent the change in beach sediment characteristics in previous studies on the Zhejiang coast [40] and in the statistical analysis [9], and so we only used this in the subsequent statistical analysis.

3.2. Collection and Processing of Beach Length and Dry Beach Width

In this study, we utilized the beach length (l) and averaged dry beach width (w) (Figure S1) to characterize the beach morphology. The beach length (l) was defined as the coastline length of the sandy beach in this study and determined using ArcGIS 10.8, while the dry beach width (w) was calculated as the arithmetic average of the width between the base (the landward rocky cliff foot or seawall foot) and the waterline at low tide, measured from each beach profile (Figure S1).

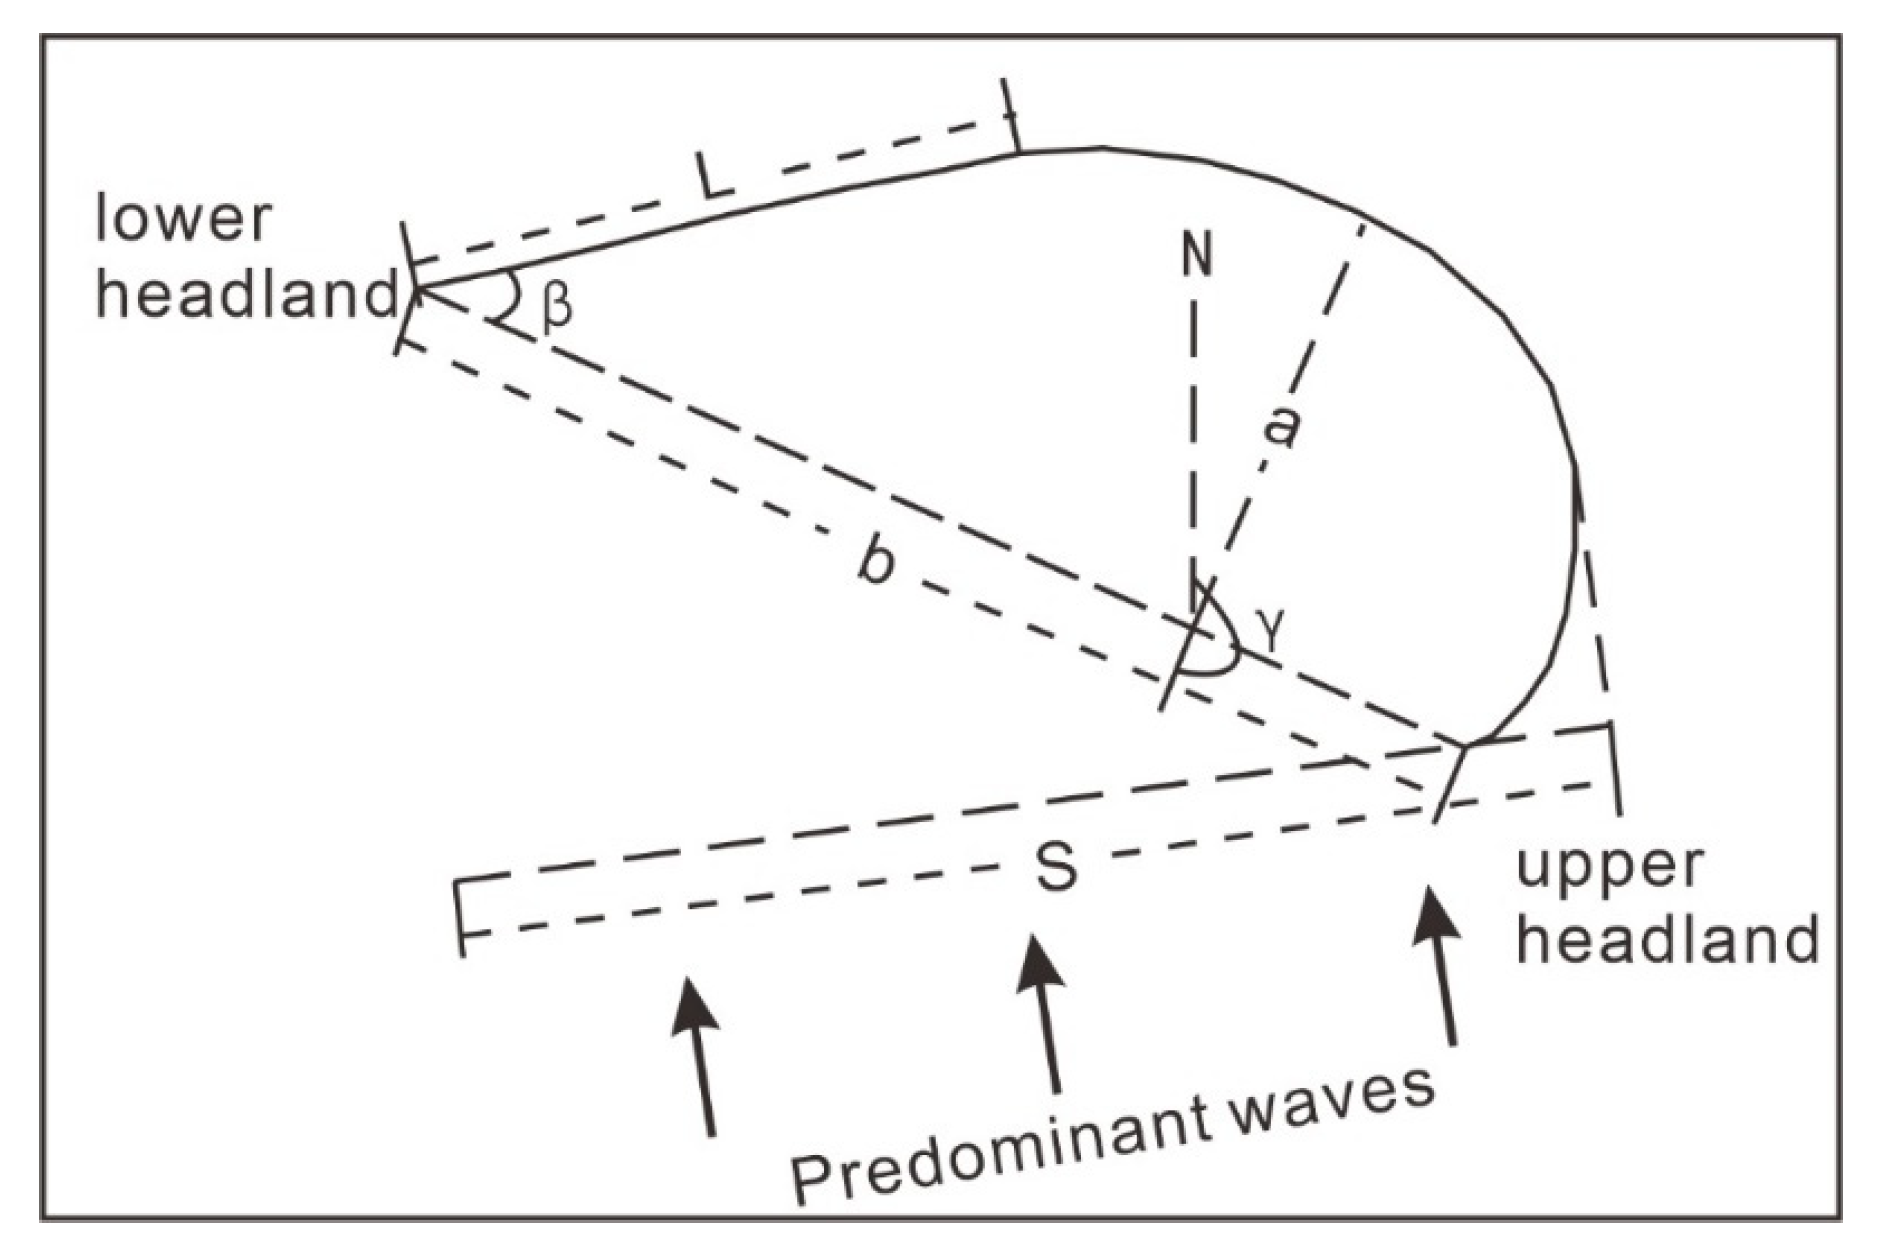
3.3. Collection and Processing of Embayment Characteristic Parameters

The beaches in this study are all embayed beaches, characterized by the upper and lower control headlands, a sheltered section, and a tangential section (sometimes divided into transitional sections) [52]. The embayment parameters used in this study were derived from previous research by [6,7,9,52]. These parameters include the headland length (S), the bay mouth orientation angle (γ), the spiral tangent angle (β), the maximum indentation (a), the bay mouth chord length (b), the ratio of the maximum indentation to the bay mouth chord length (a/b), and the tangential section length (L) (Figure 2).
The perennial dominant wave is taken as the vertical line, which is tangent to the arc curve of the shielding section, and the length between the tangent line and the upper headland is S. S can reflect the shadow size of the headland. γ is calculated from the N direction, measured clockwise, reflecting the tectonic setting of the coast. Spiral tangent angle β is the angle between the straight section of the bay and the chord of the bay. It is not only related to the degree of bay erosion retreat, but also related to the bay chord length. a is defined as the longest segment length of the intersection of the vertical line connecting the upper and lower headlands and the curved shoreline. It represents the degree of erosion and the retreat of the coastline under the action of waves. b was defined as the distance between the upper and lower headlands, reflecting the spatial scale of the bay and is related to geological structure. a/b is a ratio which can represent the relative strength of the wave force and the headland sheltering ability. L is the length of the straight shore segment of the curved bay. It indicates the beach segment that is not obscured by the headland, and the incident wave reaches the shoreline directly without diffraction, which is related to the chord length of the bay mouth [6,9,52].
Statistical analyses were performed on those embayment parameters, along with the average wave height and average tidal range obtained from [43,45,46,49].

3.4. Correlation Analysis and Principal Component Analysis

We defined the beach slope (i), mean grain size (Mz), and embayment parameters as the morphological factors and took them into the Pearson correlation analysis. To explore the factors affecting the distribution patten and morphological characteristics of embayed sandy beaches in Zhejiang, we further conducted principal component analysis (PCA) by region. Apart from the morphological factors, we also included the mean tidal range (TR) and mean wave height ( H ¯ ) obtained from [34,43,45,46,47,49] in PCA, and all of the factors used in PCA are defined as morphodynamic factors in this study. The eigenvalues, variance contribution, and cumulative variance contribution of each principal component were obtained through PCA. A principal component was considered to reflect the main information represented by the morphodynamic factors when the cumulative variance contribution was greater than or equal to 70–85% [53].

4. Results

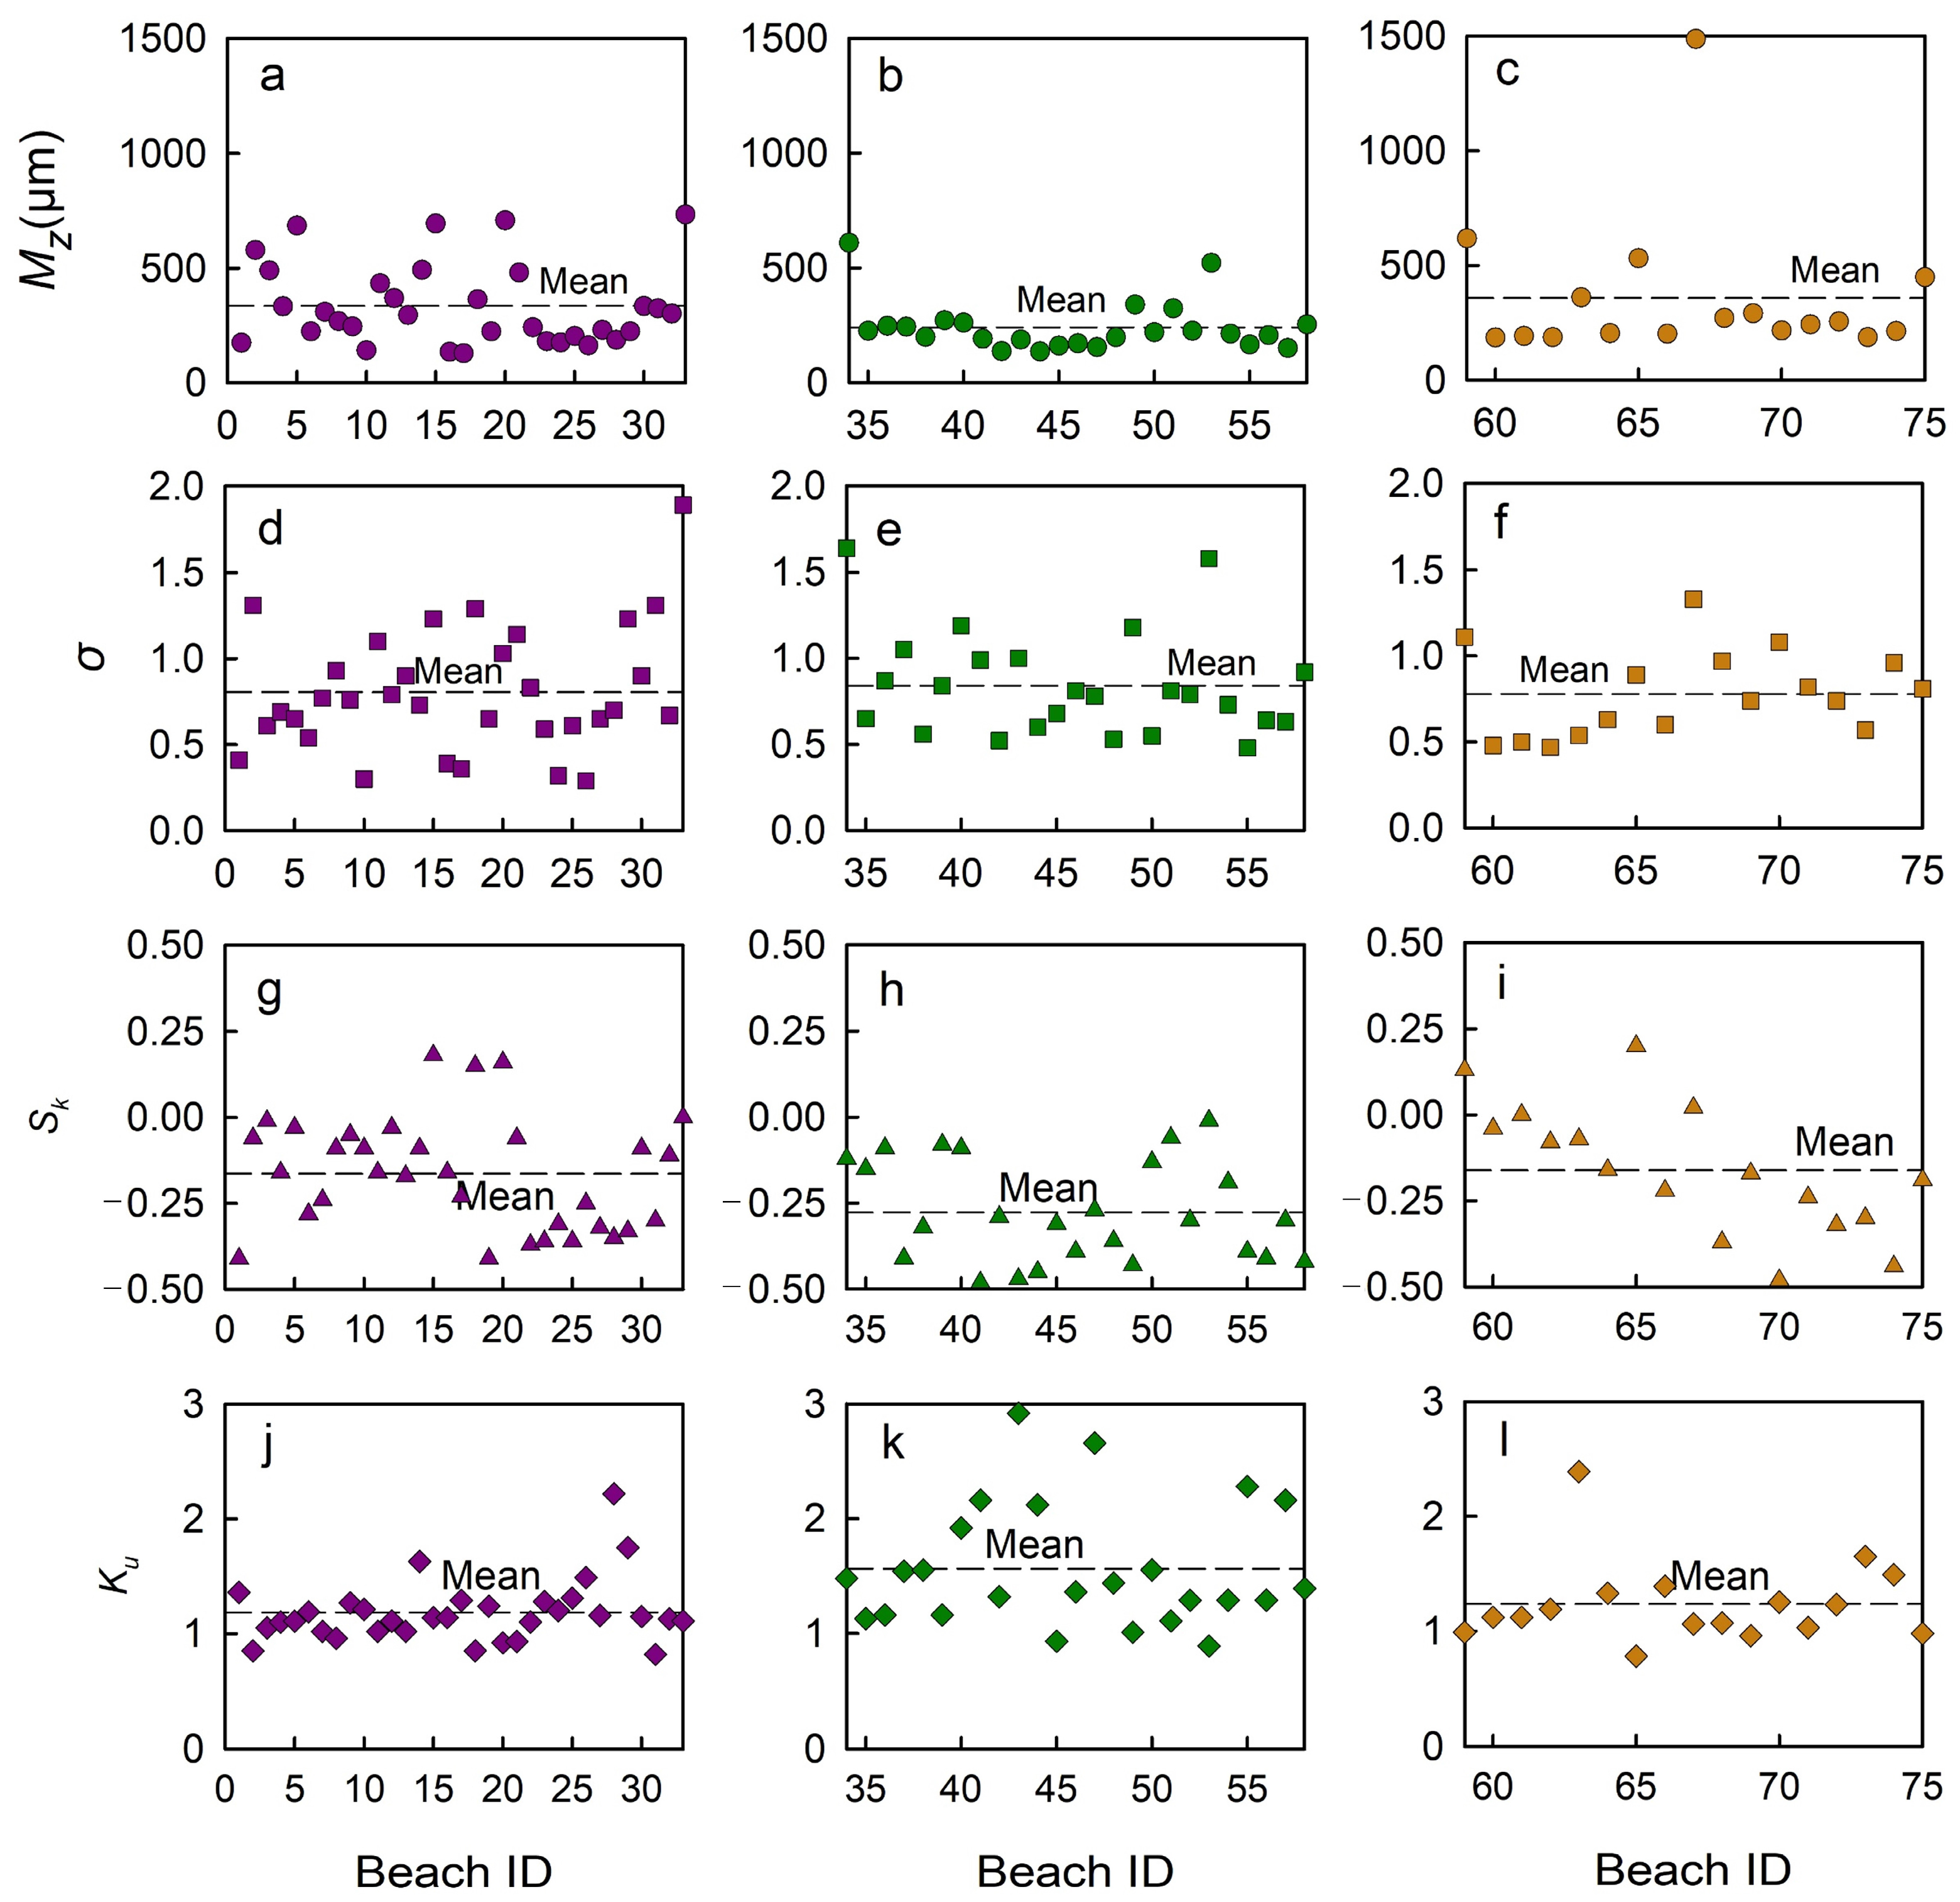
4.1. Beach Slope and Sediment Grain Size

The average slope (i) of sandy beaches in Zhejiang varied from 0.02 to 0.13 (Figure 3), with a mean value of 0.06. Among these, the inclination of the slope was found to be gentlest at Yangshashan beach and steepest at Miaogan beach. The averaged beach slope was steepest in NZ, while it was gentlest in CZ.
The mean grain size Mz of the surficial sediments of sandy beaches in Zhejiang mainly ranged from 128.93 μm (fine sand) to 1486.74 μm (very coarse sand), with a mean value of 309.07 μm (medium sand). The average value of mean grain size of sandy beaches in NZ was the largest, followed by beaches in SZ, and the finest sediments were observed in CZ beaches (Figure 4a–c). Specifically, in NZ, the Mz distribution ranged from 128.93 μm (fine sand) to 732.91 μm (coarse sand), with a mean value of 335.70 μm (medium sand), while in CZ, it varied between 134.69 μm (fine sand) and 609.30 μm (coarse sand), with a mean value of 240.09 μm (fine sand). In SZ, Mz ranged between 186.45 μm (fine sand) and 1486.74 μm (very coarse sand), with a mean value of 358.80 μm (medium sand).
The sediment sorting coefficients (σ) of beach surficial sediments ranged from 0.29 to 1.89, with an average of 0.81. This indicates that the sediments ranged from poorly sorted to well sorted. The best and worst sorting were observed on Qiansha beach and Huangsha beach (Figure 4d–f), respectively. The mean σ values of surficial sediments on sandy beaches in NZ, CZ, and SZ were 0.81, 0.84, and 0.78, respectively, suggesting that the sediments of SZ beaches had the best sorting.
The skewness coefficient (Sk) of the sediments ranged from −0.48 to 0.20 (Figure 4g–i), with a mean value of −0.20. Predominantly, negative skewness was observed, with extremely negative skewness, negative skewness, and near-symmetry being the main types. The averaged Sk values of surficial sediments on sandy beaches in NZ, CZ, and SZ were −0.16, −0.28, and −0.16, respectively, indicating that negative skewness is the predominant performance.
The kurtosis (Ku) of surficial sediments of studied beaches ranged from 0.78 to 2.92, with a mean value of 1.32, generally showing moderate and narrow peaks (Figure 4j–l). The averaged Ku values of surficial sediments on sandy beaches in NZ, CZ, and SZ were 1.19, 1.56, and 1.24, respectively.

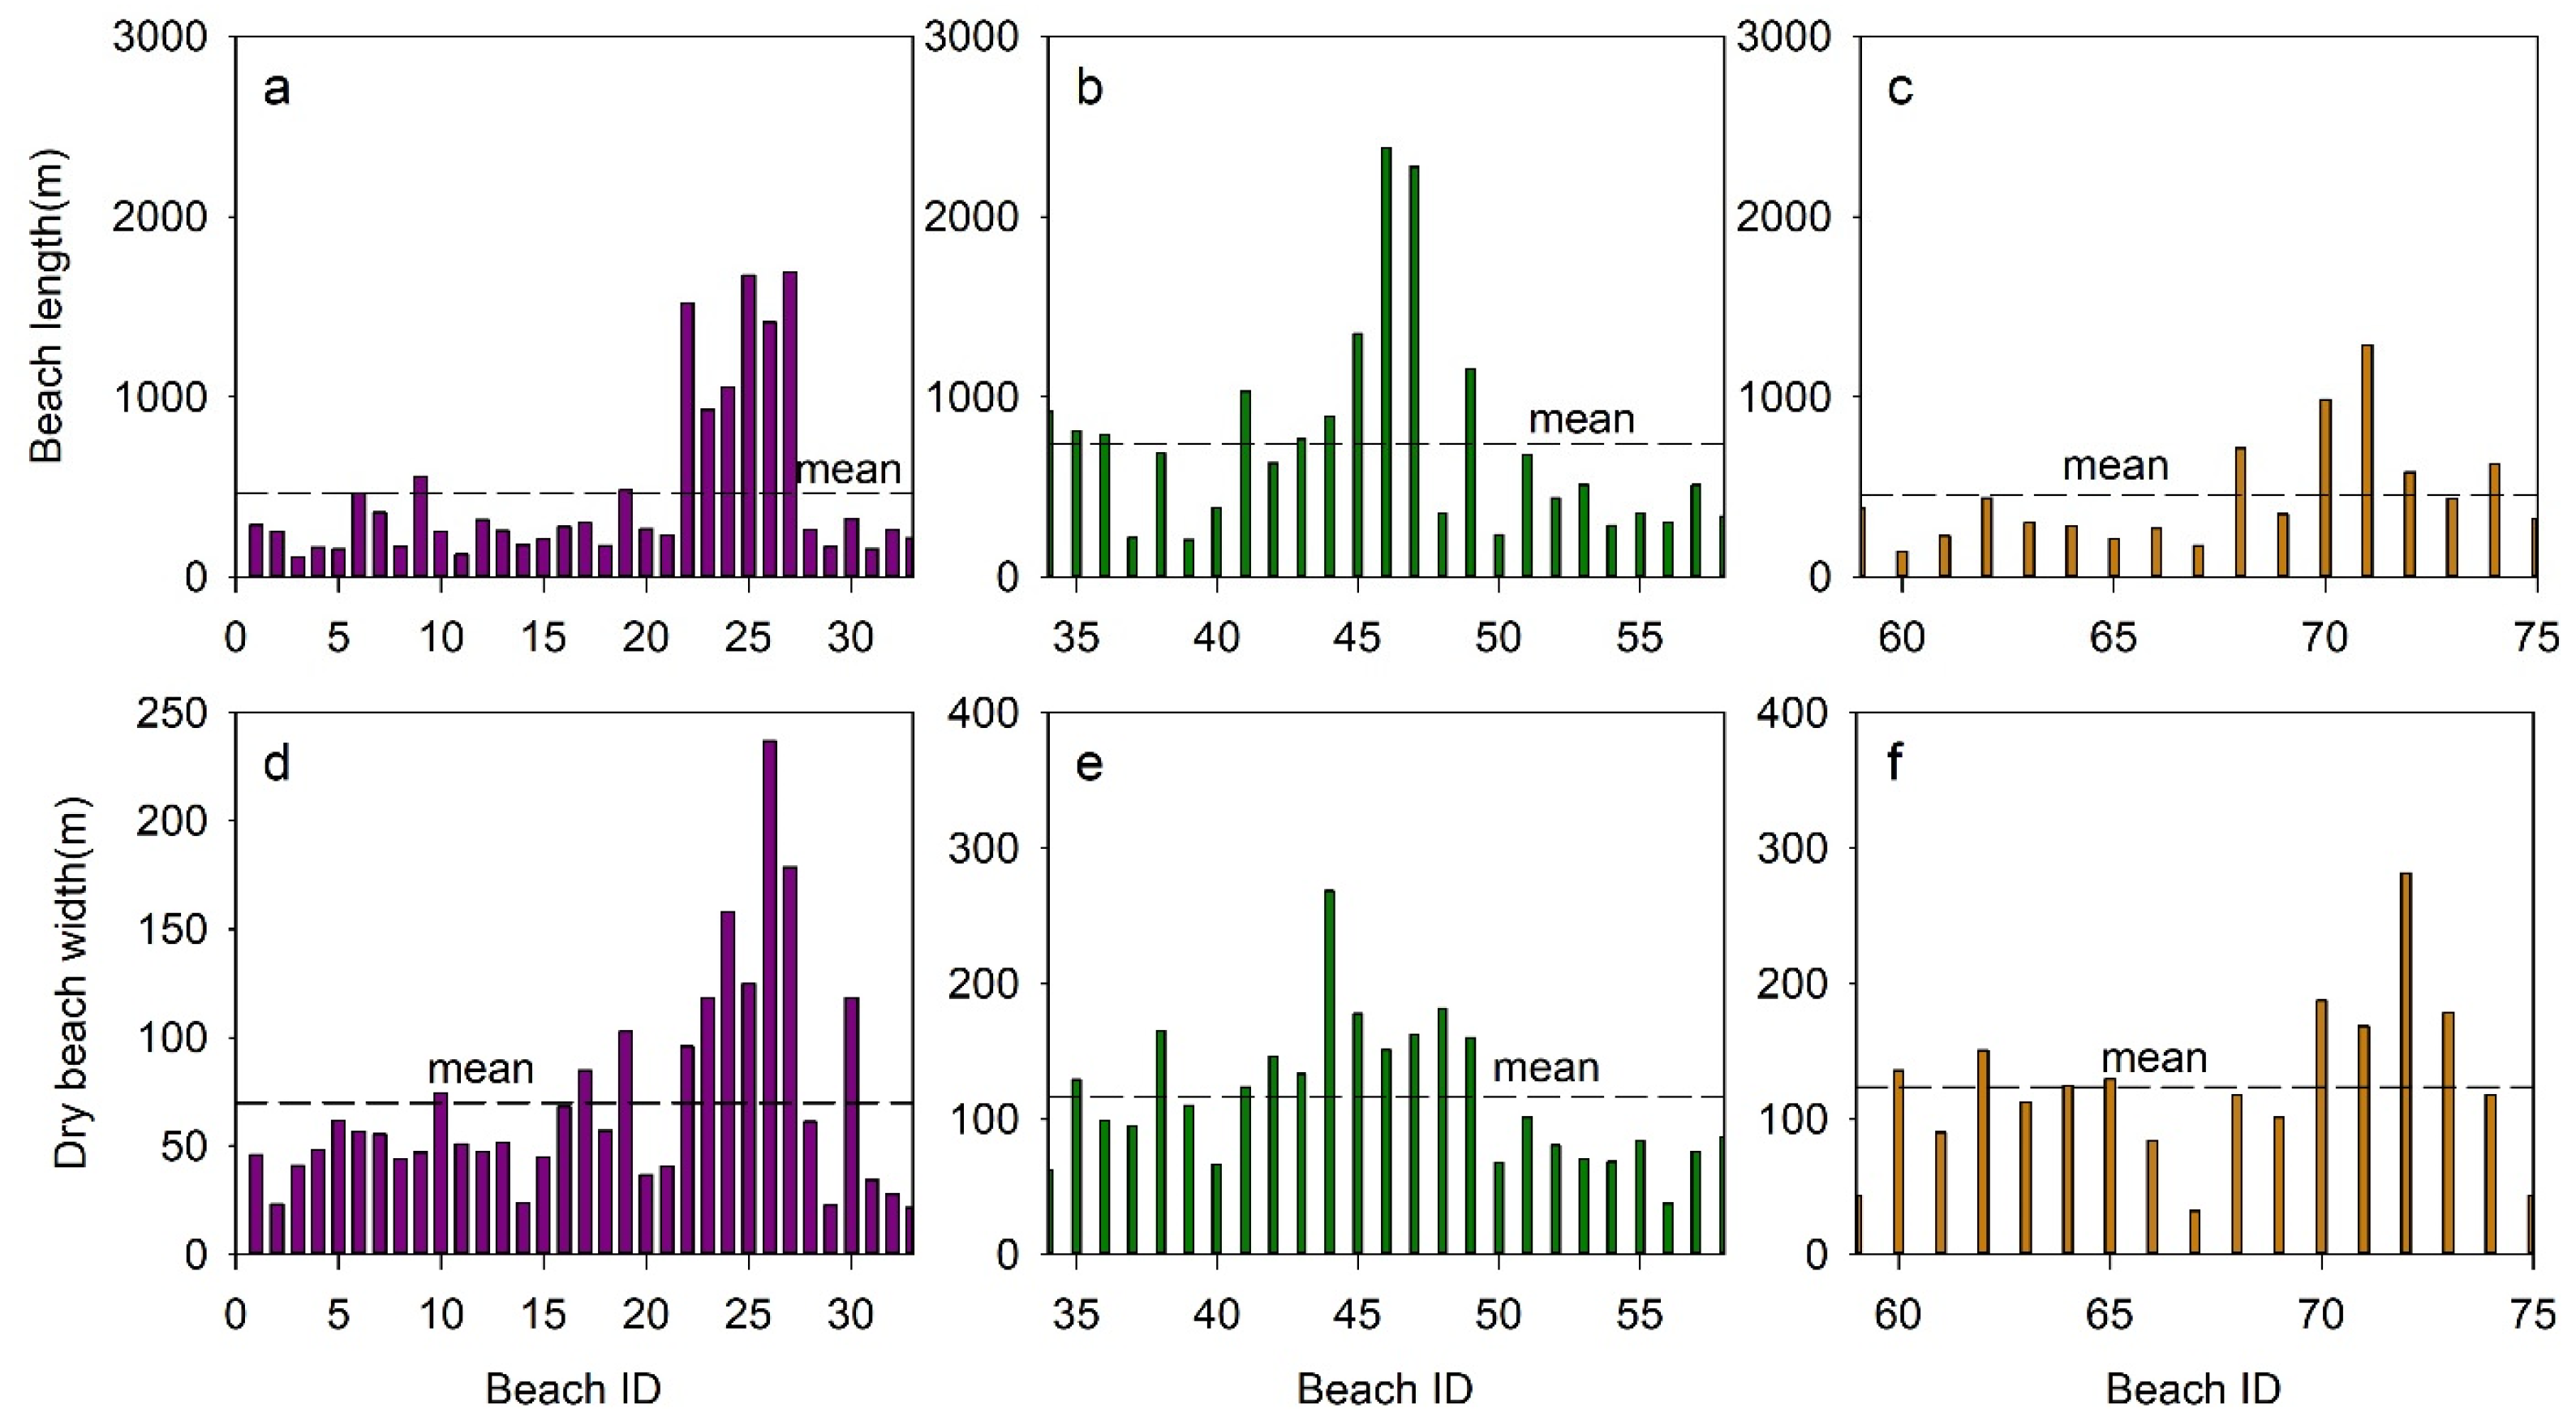
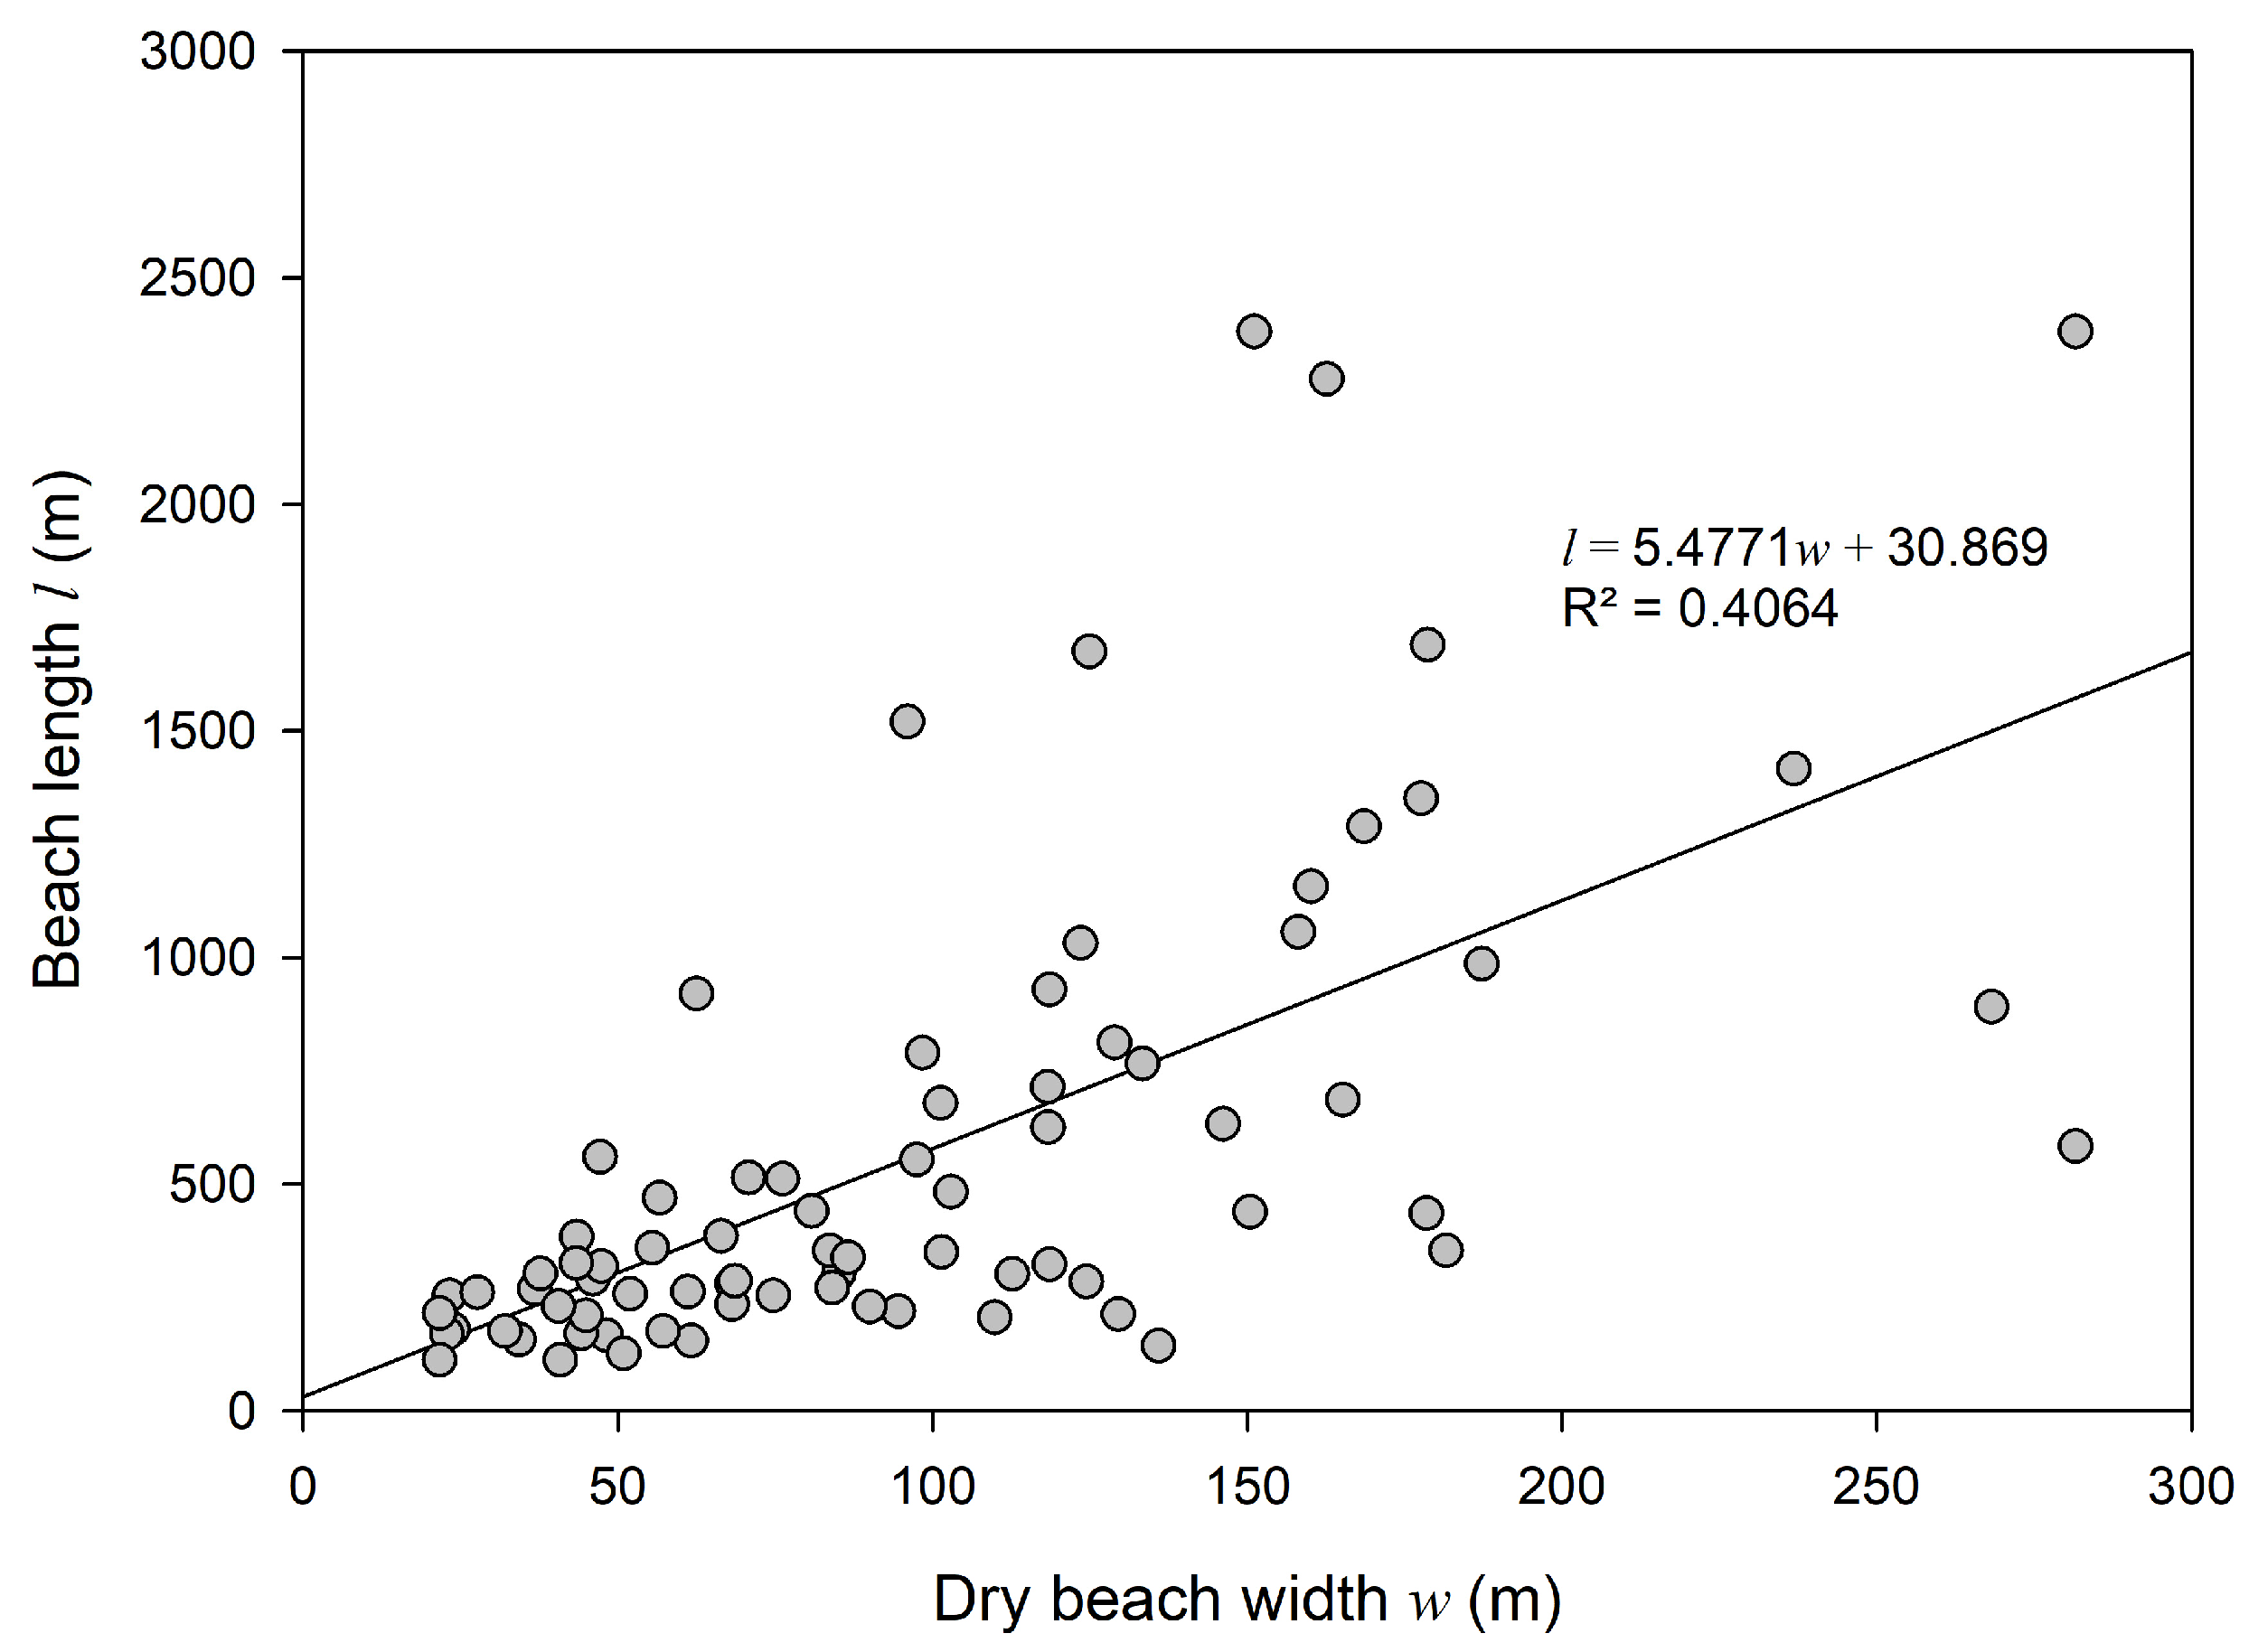
4.2. Beach Length and Dry Beach Width

It is evident from Figure 5 that the lengths of sandy beaches varied significantly, ranging from 112.61 m (Si’ao beach) to 2381.46 m (Huangcheng beach). The sandy beaches in CZ were the longest, with most of them being in the range of 200 m to 1000 m. In contrast, NZ predominantly featured beaches shorter than 1000 m, while those in SZ were mostly shorter than 500 m. The widest and narrowest dry beach widths among the studied beaches were Houcao beach (281.57 m) and Huangsha beach (21.69 m) in NZ, respectively. The average dry beach width (w) of sandy beaches in NZ ranged from 21.69 m to 334.60 m, with the majority measuring smaller than 180 m. The averaged dry beach widths of sandy beaches in CZ were relatively wider, ranging from 37.63 to 268.20 m, and were concentrated in the range from 50 m to 200 m. Meanwhile, w ranged from 32.06 m to 281.57 m in the south, with w smaller than 200 m prevailing. There was significant correlation between the beach width and the beach length, as shown in Figure 6, indicating a trend where longer beaches tended to have wider widths.

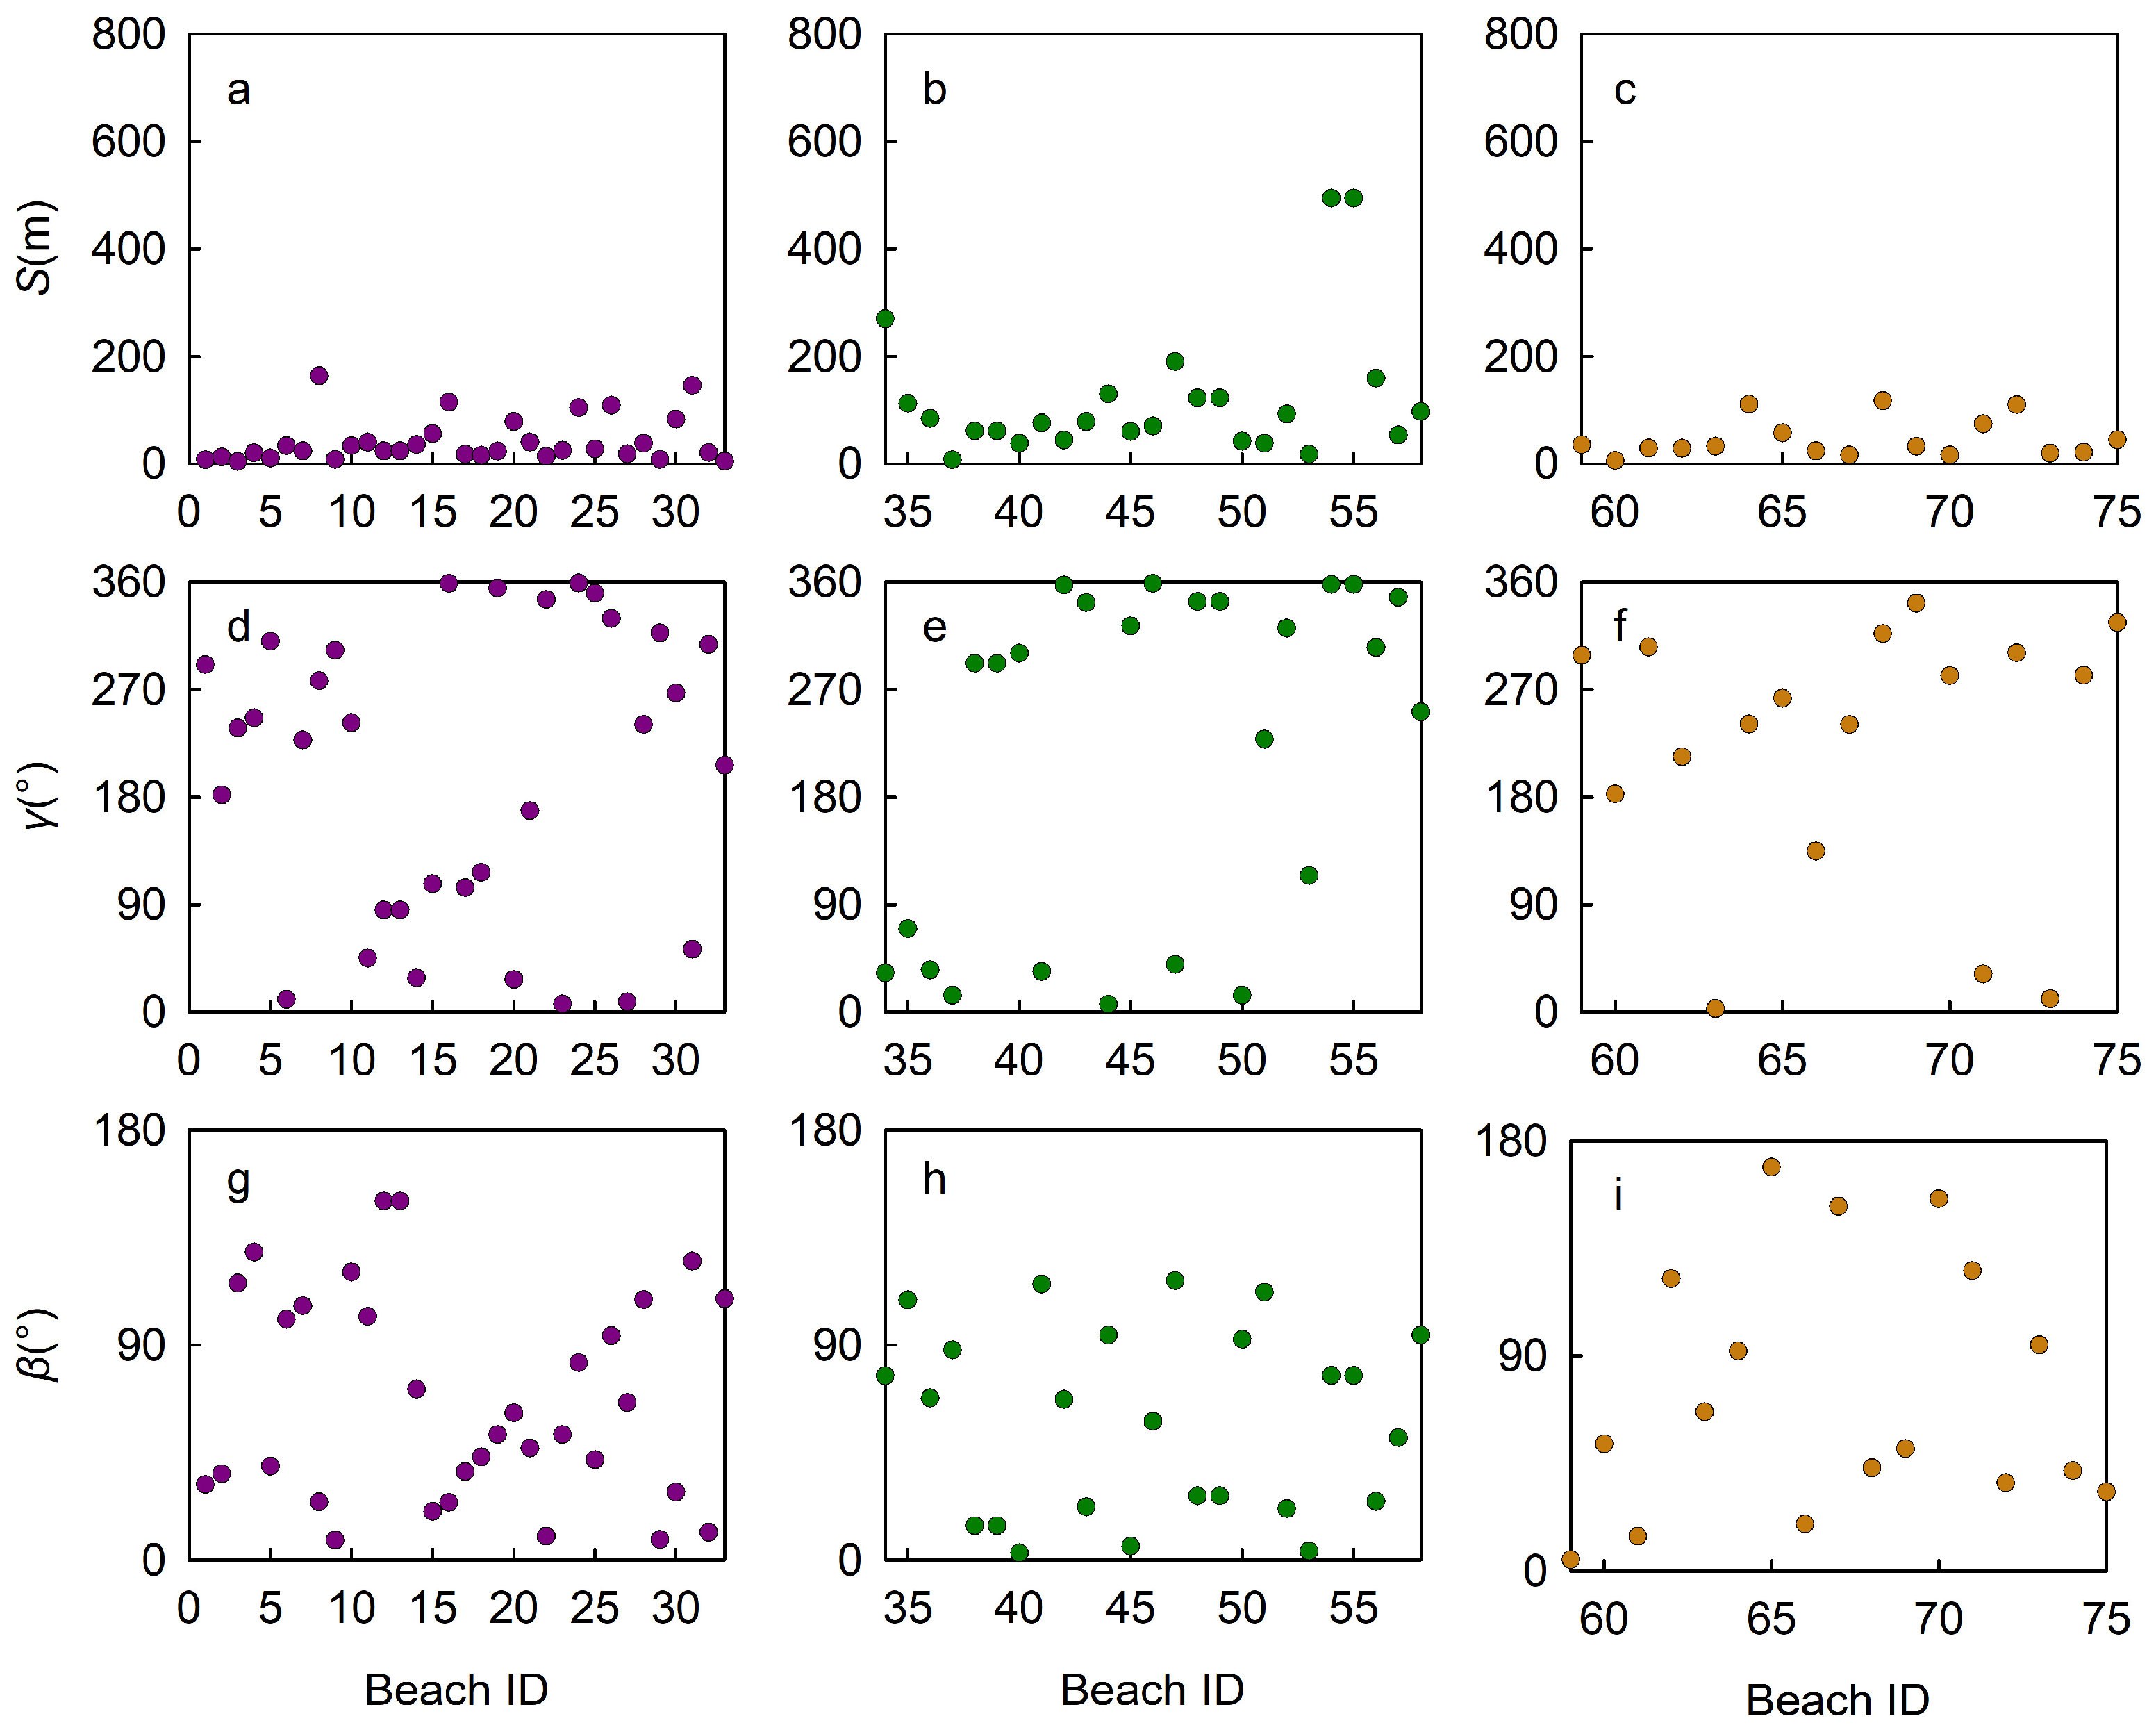
4.3. Embayment Characteristics

The headland length (S), bay mouth orientation (γ), and spiral tangential angle (β) are shown in Figure 7. The beach headlands in CZ were the largest among the three regions in Zhejiang, suggesting the higher susceptibility to wave erosion due to the less sheltered headlands. In CZ, the headland length (S) was the largest and exhibited the widest variation, ranging from 7.82 m to 494.65 m, indicating a broader sheltering range. Meanwhile, in NZ, the averaged S value was the second largest, ranging from 4.48 m to 611.18 m, with most beaches having an S shorter than 160 m. Conversely, the averaged S value in SZ was the smallest, with an average shorter than 40 m, ranging between 6.25 m and 117.47 m. The bay mouth orientation (γ) of sandy beaches varied across regions. In NZ, the orientations varied significantly due to the presence of numerous islands, with most facing northeast and northwest. CZ beaches also had an orientation facing northwest and northeast, with γ values mainly ranging from 0° to 90° and 270° to 360°, while in SZ, the γ values mainly ranged from 180° to 360°, with the majority facing southwest and northwest. The spiral tangential angles of sandy beaches in Zhejiang ranged from 2.92° to 168.93°, showing no significant regional difference. The distribution range of β of beaches in CZ was relatively concentrated, while those in NZ and SZ were more dispersed.
The maximum indentation (a) of sandy beaches in NZ ranged from 67.12 to 2743.84 m, with a mean value of 502.55 m, and most of the values were smaller than 900 m (Figure 8a). In CZ, sandy beaches had the largest mean maximum indentation (815.02 m), with values ranging from 171.65 to 1828.58 m, and the distribution of a values was more dispersed (Figure 8b). In SZ, a varied between 42.18 m and 1278.92 m, with a mean value of 440.67 m (Figure 8c), showing the smallest indentation in the three parts of Zhejiang coastal regions.
The bay mouth chord length (b) of sandy beaches in NZ varied from 123.12 m to 2839.65 m, with the most between 123.12 m and 900 m (Figure 8d). In CZ, the headland opening degree was larger, and the shading effect was weaker. Here, b was mainly concentrated between 250 and 1500 m, with a variation range of 290.85 to 3096.37 m (Figure 8e). In SZ, sandy beaches varied from 176.98 to 2175.09 m, with most b values less than 600 m (Figure 8f), indicating a relatively small headland opening degree.
The ratio of the maximum indentation to the bay mouth chord length (a/b) was mostly distributed between 0.25 and 1.00, with the range of variation from 0.22 to 1.60 in NZ, 0.49 to 1.75 in CZ, and 0.18 to 1.59 in SZ (Figure 8g–i). In CZ, the ratios were mostly greater than 0.50, reflecting larger headland indentation, stronger wave action, and a smaller shadowing effect in CZ.
The tangential section length L of sandy beaches in NZ varied from 48.18 m to 1077.91 m, with most of the L values shorter than 400 m (Figure 8j). In CZ, the tangential section was the longest, with the L values scattered between 71.76 m and 448.97 m (Figure 8k). In SZ, L varied from 66.55 m to 834.53 m, with most values distributed within 300 m (Figure 8l).

5. Discussion

5.1. Difference in the Distribution and Morphological Characteristics of Beaches in Zhejiang

All beaches in NZ are distributed on the islands, and most of them are located on the east coast of the islands facing the predominant waves. No sandy beaches have formed along the continental coastline shaded by islands. The beaches in NZ have the coarsest sediment grain size and the steepest beach slope, which corresponds to the maximum nearshore wave height among the three regions in Zhejiang. Meanwhile, the beaches in NZ are affected by the sediments from the Yangtze River and Qiantang River, and fine sediments are abundant. The beaches in NZ can be summarized as sandy beaches affected by rivers and only developed on islands.
There are relatively few islands in the CZ, and a few beaches are distributed on the mainland coast without island shelter in the seaward. The beach headland in CZ is the longest, and the average values of beach lengths and widths in the region are also the largest among the three regions along the Zhejiang coast. Sediment grain size is the finest and beach slope is the gentlest among the three regions, corresponding to the minimum wave height in the CZ sea area.
The beaches in SZ are the least distributed, mainly formed on the islands far away from the Oujiang estuary and the southernmost end of the Zhejiang mainland coast (Cangnan). Affected by the sediment of the Oujiang River, the turbidity in the estuary area of SZ is very high, and there is no sandy beach near the estuary.
To summarize, the distribution pattern and the morphological characteristics of sandy beaches in NZ, CZ, and SZ are different (Figure 3, Figure 4, Figure 5, Figure 6, Figure 7 and Figure 8). All accessible sandy beaches are embayed beaches, with most of the sandy beaches formed on the islands (especially in NZ) and the regions far from the estuaries, showing quantity difference in beach distribution (Figure 9).

5.2. Controlling Factors of the Different Distribution and Morphology among Zhejiang Beaches

To further explore the controlling factors on the difference in Section 5.1, a correlation analysis and a PCA were conducted. The correlation results (Table 1) show that beach slope (i) and the mean grain size (Mz) exhibited a significant positive correlation, indicating that coarser beach sediment particles are associated with steeper beach slopes in this study. The maximum indentation (a) is positively correlated with the length of the tangential section (L), the chord length of the bay mouth (b), and the length of the headland (S), suggesting that a is influenced by multiple parameters. This also implies that the intensity of wave erosion is related to the distance between headlands, resulting from wave refraction and diffraction effects on headland bay geometries [16,19,20,26]. Specifically, as the distance between headlands increases, the erosion ability of waves increases, leading to stronger wave bypassing and refraction with spatial gyration, and ultimately resulting in greater beach indentation.
The chord length of the bay mouth (b), the tangential section length (L), and the headland length (S) were significantly and positively correlated with each other, indicating that the headland distance of the beach is related to the geological structure, which in turn affects the tangential section length and headland length of the beach.
Given the correlations among the above morphodynamic parameters, a principal component analysis was conducted by region to further explore the factors influencing the distribution pattern and morphological characteristics of sandy beaches in Zhejiang, following the methods of previous studies [6,9,54].

5.2.1. NZ Beaches

Four principal components were extracted after the analysis of the morphodynamic factors of beaches in NZ, with the cumulative contribution of the total variance reaching 72.97% (Table S2). These four principal components were then used to analyze the main morphodynamic features. The load values of each factor in the first four principal components were also extracted (Table 2). In the first principal component, the load values of maximum indentation a, tangential section length L, and bay mouth chord length b are relatively large, 0.25, 0.23, and 0.23, respectively. Headland morphology is the primary geological control on the hydrodynamic and morphological processes of embayed beaches [19,55,56,57]. The three embayment characteristic factors (a, b, and L) reflect the geological settings of the headland coast. Several mountainous rivers with short streams enter the East China Sea, forming the basis of the headland coast of Zhejiang. A series of NE-SW and NW-SE trending fault structures formed in the Cenozoic are oblique to the coastline of South China, and mountains or hills rise to the sea, thus forming a series of meandering coasts, which is the basis for the formation of these embayed coasts [33]. The first principal component well reflects this feature, which is consistent with previous research results [9]. The beach slope i and the mean sediment grain size Mz correlate well with the second principal component, both with a load value of 0.32. The second principal component mainly reflects the influence of sediment sources in the formation of the beach. The main source of the sandy beach in Zhejiang is the local erosion of the headland and the sandy sediment from the river discharge [58], the large quantities of islands in NZ, and the Qiantang River can provide the sediment source. Among the third and fourth principal components, the factor loads of the ratio a/b and the average wave height are the largest, with values of 0.61 and 0.68, respectively. The ratio of a/b reflects the relative strength of wave force and the shadowing ability of the headland [6], indicating that these two parameters illustrate the important role of wave action in the formation of sandy beaches.

5.2.2. CZ Beaches

The principal component analysis results for sandy beaches in CZ are shown in Table S3 and Table 2. The first four principal components were used to analyze the main morphodynamic features, as their accumulated contribution reached 78.103%. In the first principal component, the loads of maximum indentation a, tangential section length L, bay mouth chord length b, and headland length S are the largest, with values of 0.26, 0.23, 0.27, and 0.24, respectively. This is consistent with the result of NZ, reflecting the important influence of headland characteristics on beach development. In the second principal component, the load of beach slope i and the mean sediment grain size Mz accounted for a relatively large proportion, 0.50 and 0.45, respectively, closely related to the sediment source. In the third and fourth principal components, the factor loads of the spiral tangent angle β, the ratio of a/b, and the average wave height H ¯ are the largest, with values of 0.48, 0.44, and −0.49, respectively. The spiral tangent angle reflects the sheltering ability of the headland on the beach, while a/b reflects the relative strength of wave power and the sheltering ability of the headland. Therefore, these three factors are closely related to wave forcing.

5.2.3. SZ Beaches

The principal component analysis results of sandy beaches in SZ are shown in Table S4 and Table 2. The first four principal components, as their accumulated contribution rate reached 72.98%, were used to analyze the main morphodynamic features. In the first principal component, the loads of maximum indentation and bay mouth chord length are the largest, with values of 0.27 and 0.29, respectively, which are similar to those in NZ and CZ. In the second principal component, the load values of the maximum indentation and the ratio of a/b are the largest, with values of −0.29 and 0.27, respectively. In the third principal component, the load value of beach slope i and sediment mean grain size Mz are relatively large (with the same value of 0.43), further indicating that the sediment source contributes to the formation of the sandy beach. In the fourth principal component, the mean tidal range TR has the largest load, with a value of 0.51, reflecting the influence of tides on the beach. Although sandy beaches are mainly controlled by waves, this component may indicate that the influence of tides cannot be ignored in a macrotidal coast like SZ. The flood and ebb tides affect the wave action on the beach, affecting the distribution of net sediment transport in space and time, and ultimately causing differences in the beach morphological characteristics.

5.3. Influence of Hydrodynamic Environment on Beach Morphological Characteristics

The morphological characteristics of sandy beaches are primarily driven by wave action [10,11]. The deformation and breaking of waves as they propagate from deep water to shallow water dominate the hydrodynamic processes near the beach [11,59]. Wave breaking is a key driver of various coastal processes, including sediment transport and morphodynamic changes [26,55,60]. Wave action in the coastal regions of islands is typically stronger than that in the sheltered mainland coastal regions along Zhejiang [47], resulting in a significantly higher number of sandy beaches on islands compared to the mainland coast (Table S1). The annual averaged wave height of NZ, CZ, and SZ is 0.79, 0.52, and 0.69, respectively [43,45,46,47], showing that NZ has the strongest wave force. This may be the reason why NZ has the majority of the beaches among the three regions with similar sediment supply, although the NZ coast can obtain more sediment from the Yangtze River [36]. The average values of the beach slope (Figure 3) and the mean grain size (Figure 4) in NZ, CZ, and SZ correspond well with the wave height. The larger the wave height, the coarser the mean grain size, and the steeper the beach slope.
Tides are also an important factor in controlling the position of wave action and the resulting changes in beach morphology [12,14,61]. The magnitude of the tidal range can indicate the strength of the coastal tidal dynamic environment. Based on the magnitude of the tidal range [62], coasts can be classified as micro-tidal (0 < TR < 2 m), meso-tidal (2 m < TR < 4 m), or macro-tidal (TR > 4 m). The mean tidal ranges in the sea areas of NZ, CZ, and SZ are 2.48 m (meso-tidal), 3.29 m (meso-tidal), 4.23 m (macro-tidal), respectively, showing a gradual increase from north to south and from east to west in the mainland nearshore and island areas [49]. The distribution of wave height and tidal range along the Zhejiang coast exhibits significant regional differences, and the combination of wave and tide forcings can produce diverse beach morphological characteristics.
Waves, tides, and coastal currents promote the southward transport and diffusion of Yangtze River sediments [35,36,37], creating a turbid coastal environment (Figure 10) with sufficient fine sediment supply supplemented by the Qiantangjiang and Oujiang rivers [38,39]. This may also explain the quantity difference between island beaches and mainland beaches and the quantity difference between the estuary region and other areas (Figure 1b). The sandy sediments are mainly from the local small–moderate rivers, as well as the erosion of rocks from the headlands [58]. The construction of seawalls (Table S1) and the abundance of fine sediments have led to insufficient sand supply, causing some beaches to have the potential to become muddy [63,64]. In this study, 5 mainland sandy beaches among the 75 studied beaches exhibit mud on the subaerial beach at low tide (Table 3 and Figure 1). Similar phenomena were also found in sandy beaches along the Fujian coast of China [65,66], Cayenne beach in French Guiana [67], Casino beach in Brazil [68], Dassari beach in South Korea [69], and a mesotidal beach near the Mekong River Delta in Vietnam [70]. These beaches are all in a hydrodynamic environment with abundant fine sediments, large tidal range, and small wave height, highlighting the need to consider the risk of becoming muddy in the future development and protection of these beaches. The difference is that those beaches with mud occurrence in the above studies are usually open beaches near the river mouth, while the five mudding beaches in this study are embayed beaches, which may be related to the effect of abundant sediment supply from the Yangtze River and the Zhejiang rivers.

5.4. Influence of Human Activities on Beach Evolution

The coastal zone is a fragile and complex dynamic system threatened by the combined pressure of anthropogenic constraints and climate change. Sandy beaches, a significant type of coast, are increasingly at risk of erosion. Typhoons represent the most severe meteorological disaster in Zhejiang province, with an average of six typhoons per year [42], significantly impacting beach morphology and threatening the tourism industry. To mitigate typhoon-induced erosion and meet the increasing tourism demands, Zhejiang has seen an increasing number of beach protection or restoration projects [72] (Table S1), including both hard engineering and soft engineering. The most common approach adopted in Zhejiang to protect beaches is hard engineering, primarily due to the frequent influence of typhoons (e.g., the construction of seawalls and breakwaters; Table S1). Although seawalls provide protection against coastline retreat and the associated loss of coastal property, they may have negative impacts on the adjacent beach and potentially aggravate beach erosion. Additionally, accommodation space is important for beaches facing sea level rise due to climate change [73]. Over half of the studied beaches in Zhejiang have seawalls (Table S1), resulting in insufficient accommodation space and increasing the risk of beach extinction (Figure 11a). In addition to hard engineering, 10 beaches with nourishment projects have been documented (Table S1 and Figure 11b). Beach nourishment could significantly broaden beach width and maintain recreation functions [74,75]. However, nourishment projects may change the nearshore hydrodynamics [76] and further affect the long-term evolution of sandy beaches [23]. Therefore, human intervention is also an important factor influencing sandy beach development in Zhejiang.

6. Conclusions

Based on the analyses of beach sediment, slope, and planform characteristics, combined with the annual averaged tidal range and wave height, this study revealed regional differences in beach distribution, morphological characteristics, and influencing factors of 75 accessible beaches in Zhejiang, eastern China, and the following main conclusions were obtained.
The averaged slope of sandy beaches in Zhejiang varies from 0.02 to 0.13, with the beach slope in NZ being the steepest and that in CZ being the gentlest. The studied beaches are all embayed beaches, with most located on the islands, especially in NZ. The mean grain size (Mz) distribution of sandy beach sediments along the Zhejiang coast ranges from fine sand (128.93 μm) to very coarse sand (1486.74 μm), with the coarsest sediment occurring in SZ and the finest occurring in CZ. Beach sediment grain size is closely related to beach slope, showing that steeper beach slopes correspond to coarser sediment grain size.
The length of sandy beaches in Zhejiang ranges from 112.61 m to 2381.46 m, with the average length of sandy beaches in CZ being the longest. The dry beach width of the studied beaches ranges from 21.69 m to 281.57 m, with the widest beach occurring in CZ. The beach scale in the CZ coast is larger than those in NZ and SZ. In general, the longer the beach length, the wider the beach width.
The beach headlands in CZ are the largest among the three regions in Zhejiang, suggesting the higher susceptibility to wave erosion in the latter regions due to the less sheltered headlands. The distribution pattern and the morphological characteristics of sandy beaches in NZ, CZ, and SZ are different. All accessible sandy beaches are embayed beaches, and most of them formed on the islands (especially in NZ) and the regions far from the estuaries, showing the quantity difference in beach distribution.
Through a comparison of the regional difference in the distribution pattern and morphological characteristics of embayed sandy beaches in NZ, CZ, and SZ, we found that there is a gradual shift from more wave influence in the north to more tidal influence in the south. Although waves are the primary factor controlling sandy beach evolution, the embayment characteristic is the main influencing factor affecting the beach distribution pattern and the morphological characteristics in Zhejiang beaches. The different characteristics of embayment provide the space for beach formation and the interaction with the coastal process, the sediment supply, the nearshore hydrodynamic environment, and human intervention also have influence on the morphological characteristics of Zhejiang beaches.

Supplementary Materials

The following supporting information can be downloaded at: https://www.mdpi.com/article/10.3390/jmse12071223/s1, The Supplementary Materials include Tables S1–S4 and Figure S1. Table S1 shows the location, measurement information, and human intervention information of the studied beaches. Tables S2–S4 show the principal component eigenvalues, variance contribution rates, and cumulative contribution rates of sandy beaches in NZ, CZ, and SZ, respectively. Figure S1 shows the profile and sampling site setting examples for beaches with different length and the calculation of beach slope and dry beach width. More details can be found in the Supplementary Materials.

Author Contributions

Conceptualization, J.G. and L.S.; methodology, J.G. and M.Z.; software, J.G. and M.Z.; validation, J.G., L.S. and M.Z.; formal analysis, J.G. and M.Z.; investigation, J.G., M.Z. and Z.G.; resources, L.S.; data curation, J.G., M.Z. and Z.G.; writing—original draft preparation, J.G. and L.S.; writing—review and editing, J.G., L.S., M.Z., Z.G., W.C. and X.X.; visualization, J.G.; supervision, L.S.; project administration, J.G. and L.S.; funding acquisition, J.G. and L.S. All authors have read and agreed to the published version of the manuscript.

Funding

This research was funded by the National Key R&D Program of China, grant number 2022YFC3106200, the Scientific Research Funds of the Second Institute of Oceanography, MNR (JG2315&XRJH2309), and the Zhejiang Provincial Natural Science Foundation of China: LHZ22D060001.

Institutional Review Board Statement

Not applicable.

Informed Consent Statement

Not applicable.

Data Availability Statement

Data can be obtained by contacting the corresponding authors.

Acknowledgments

We thank Daheng Zhang for the help in field investigation and Yang Chang for the help in data processing. We also thank the reviewers and the editors for their constructive suggestions on improving our manuscript.

Conflicts of Interest

The authors declare no conflicts of interest. The funders had no role in the design of the study; in the collection, analyses, or interpretation of data; in the writing of the manuscript; or in the decision to publish the results.

References

  1. Luijendijk, A.; Hagenaars, G.; Ranasinghe, R.; Baart, F.; Donchyts, G.; Aarninkhof, S. The State of the World’s Beaches. Sci. Rep. 2018, 8, 6641. [Google Scholar] [CrossRef] [PubMed]
  2. Park, K.; Reisinger, Y.; Kang, H. Visitors’ Motivation for Attending the South Beach Wine and Food Festival, Miami Beach, Florida. J. Travel Tour. Mark. 2008, 25, 161–181. [Google Scholar] [CrossRef]
  3. Castelle, B.; Turner, I.L.; Bertin, X.; Tomlinson, R. Beach Nourishments at Coolangatta Bay over the Period 1987–2005: Impacts and Lessons. Coast. Eng. 2009, 56, 940–950. [Google Scholar] [CrossRef]
  4. Hamm, L.; Capobianco, M.; Dette, H.H.; Lechuga, A.; Spanhoff, R.; Stive, M.J.F. A Summary of European Experience with Shore Nourishment. Coast. Eng. 2002, 47, 237–264. [Google Scholar] [CrossRef]
  5. Hanson, H.; Brampton, A.; Capobianco, M.; Dette, H.H.; Hamm, L.; Laustrup, C.; Lechuga, A.; Spanhoff, R. Beach Nourishment Projects, Practices, and Objectives—A European Overview. Coast. Eng. 2002, 47, 81–111. [Google Scholar] [CrossRef]
  6. Dai, Z.; Li, C. Coastline Configuration and Geomorphologic Development Mode of Arc-Shaped Coast in South China. Acta Geogr. Sin. 2004, 59, 92–95. [Google Scholar]
  7. Fellowes, T.E.; Vila-Concejo, A.; Gallop, S.L. Morphometric Classification of Swell-Dominated Embayed Beaches. Mar. Geol. 2019, 411, 78–87. [Google Scholar] [CrossRef]
  8. Gallop, S.L.; Kennedy, D.M.; Loureiro, C.; Naylor, L.A.; Fellowes, T.E. Geologically Controlled Sandy Beaches: Their Geomorphology, Morphodynamics and Classification. Sci. Total Environ. 2020, 731, 139123. [Google Scholar] [CrossRef] [PubMed]
  9. Li, Z.; Li, W.; Chen, Z.; Zhu, Y. Influencing Factors and Classifications of Arc-Shaped Coasts in South China. Acta Geogr. Sin. 2014, 69, 595–606. [Google Scholar]
  10. Ding, Y.; Yu, J.; Cheng, H. Long-Term Wave Climate Characteristics and Potential Impacts on Embayed Beaches along the West Guangdong Coastline. Reg. Stud. Mar. Sci. 2019, 30, 100741. [Google Scholar] [CrossRef]
  11. Komar, P.D. Beach Processes and Sedimentation, 2nd ed.; Prentice-Hall: New Jersey, NJ, USA, 1976; pp. 270–327. [Google Scholar]
  12. Butt, T.; Russell, P. Hydrodynamics and Cross-Shore Sediment Transport in the Swash-Zone of Natural Beaches: A Review. J. Coast. Res. 2000, 16, 255–268. [Google Scholar]
  13. Iglesias, G.; López, I.; Carballo, R.; Castro, A. Headland-Bay Beach Planform and Tidal Range: A Neural Network Model. Geomorphology 2009, 112, 135–143. [Google Scholar] [CrossRef]
  14. Wright, L.D.; Short, A.D. Morphodynamic Variability of Surf Zones and Beaches: A Synthesis. Mar. Geol. 1984, 56, 93–118. [Google Scholar] [CrossRef]
  15. Li, Z.; Lei, H. Distribution and Existing Problems of Sandy Coast in China. Mar. Geol. Front. 2006, 22, 1–4. [Google Scholar]
  16. da Silva, G.M.; Mousavi, S.M.S.; Jose, F. Wave-Driven Sediment Transport and Beach-Dune Dynamics in a Headland Bay Beach. Mar. Geol. 2012, 323–325, 29–46. [Google Scholar] [CrossRef]
  17. Backstrom, J.T.; Jackson, D.W.T.; Cooper, J.A.G. Contemporary Morphodynamics of a High-Energy Headland-Embayment Shoreface. Cont. Shelf Res. 2009, 29, 1361–1372. [Google Scholar] [CrossRef]
  18. Bluck, B.J. Structure of Gravel Beaches and Their Relationship to Tidal Range. Sedimentology 2011, 58, 994–1006. [Google Scholar] [CrossRef]
  19. Jackson, D.W.T.; Cooper, J.A.G. Geological Control on Beach Form: Accommodation Space and Contemporary Dynamics. J. Coast. Res. 2009, I, 69–72. [Google Scholar]
  20. Pranzini, E.; Rosas, V.; Jackson, N.L.; Nordstrom, K.F. Beach Changes from Sediment Delivered by Streams to Pocket Beaches during a Major Flood. Geomorphology 2013, 199, 36–47. [Google Scholar] [CrossRef]
  21. Cai, F.; Dean, R.G.; Liu, J. Beach Nourishment in China: Status and Prospects. Coast. Eng. Proc. 2011, 1, 31. [Google Scholar] [CrossRef]
  22. Luo, S.; Liu, Y.; Jin, R.; Zhang, J.; Wei, W. A Guide to Coastal Management: Benefits and Lessons Learned of Beach Nourishment Practices in China over the Past Two Decades. Ocean Coast. Manag. 2016, 134, 207–215. [Google Scholar] [CrossRef]
  23. Paris, P.; Leach, A.; Corbett, D.R. Potential Long-Term Disturbance Associated with Beach Nourishment—Insights and Observations from Pea Island National Wildlife Refuge, Outer Banks, North Carolina. Heliyon 2023, 9, e12816. [Google Scholar] [CrossRef] [PubMed]
  24. Ramesh, M.; Swathy Krishna, P.S.; Amrutha Raj, V.; Sheela Nair, L. Coupled Coastal Monitoring Framework for the Analysis of Beach Stability and Nearshore Hydrodynamics of a Structure Influenced Medium Energy Coast in India. Ocean Coast. Manag. 2023, 239, 106619. [Google Scholar] [CrossRef]
  25. Short, A.D.; Masselink, G.G. Embayed and Structurally Controlled Beaches. In Handbook of Beach and Shoreface Morphodynamics; Short, A.D., Ed.; Wiley: Chichester, UK, 1999; pp. 230–250. ISBN 978-0-471-96570-1. [Google Scholar]
  26. Castelle, B.; Robinet, A.; Idier, D.; D’Anna, M. Modelling of Embayed Beach Equilibrium Planform and Rotation Signal. Geomorphology 2020, 369, 107367. [Google Scholar] [CrossRef]
  27. George, D.A.; Largier, J.L.; Pasternack, G.B.; Barnard, P.L.; Storlazzi, C.D.; Erikson, L.H. Modeling Sediment Bypassing around Idealized Rocky Headlands. J. Mar. Sci. Eng. 2019, 7, 40. [Google Scholar] [CrossRef]
  28. Horta, J.; Oliveira, S.; Moura, D.; Ferreira, Ó. Nearshore Hydrodynamics at Pocket Beaches with Contrasting Wave Exposure in Southern Portugal. Estuar. Coast. Shelf Sci. 2018, 204, 40–55. [Google Scholar] [CrossRef]
  29. Valiente, N.G.; Masselink, G.; Scott, T.; Conley, D.; McCarroll, R.J. Role of Waves and Tides on Depth of Closure and Potential for Headland Bypassing. Mar. Geol. 2019, 407, 60–75. [Google Scholar] [CrossRef]
  30. Bowman, D.; Guillén, J.; López, L.; Pellegrino, V. Planview Geometry and Morphological Characteristics of Pocket Beaches on the Catalan Coast (Spain). Geomorphology 2009, 108, 191–199. [Google Scholar] [CrossRef]
  31. da Fontoura Klein, A.H.; de Menezes, J.T. Beach Morphodynamics and Profile Sequence for a Headland Bay Coast. J. Coast. Res. 2001, 17, 812–835. [Google Scholar]
  32. Prodger, S.; Russell, P.; Davidson, M.; Miles, J.; Scott, T. Understanding and Predicting the Temporal Variability of Sediment Grain Size Characteristics on High-Energy Beaches. Mar. Geol. 2016, 376, 109–117. [Google Scholar] [CrossRef]
  33. Cai, F. Overview of Beach Resources in China; China Ocean Press: Beijing, China, 2019. [Google Scholar]
  34. Xia, X. Thematic Investigation and Research Report on Shoreline Geomorphology and Silting Dynamics; Second Institute of Oceanography, State Oceanic Administration: Hangzhou, China, 2011. [Google Scholar]
  35. Liu, J.P.; Li, A.C.; Xu, K.H.; Velozzi, D.M.; Yang, Z.S.; Milliman, J.D.; DeMaster, D.J. Sedimentary Features of the Yangtze River-Derived along-Shelf Clinoform Deposit in the East China Sea. Cont. Shelf Res. 2006, 26, 2141–2156. [Google Scholar] [CrossRef]
  36. Liu, J.P.; Xu, K.H.; Li, A.C.; Milliman, J.D.; Velozzi, D.M.; Xiao, S.B.; Yang, Z.S. Flux and Fate of Yangtze River Sediment Delivered to the East China Sea. Geomorphology 2007, 85, 208–224. [Google Scholar] [CrossRef]
  37. Wang, L.; Zhou, Y.; Shen, F. Suspended Sediment Diffusion Mechanisms in the Yangtze Estuary Influenced by Wind Fields. Estuar. Coast. Shelf Sci. 2018, 200, 428–436. [Google Scholar] [CrossRef]
  38. Hu, R.; Wu, J.; Li, G.; Zhu, L.; Ma, F. Characteristics of Sediment Transport in the Zhoushan Archipelago Sea Area. Acta Oceanol. Sin. 2009, 28, 116–127. [Google Scholar]
  39. Li, G.; Gao, S.; Wang, Y.; Li, C. Sediment Flux from the Zhoushan Archipelago, Eastern China. J. Geog. Sci. 2018, 28, 387–399. [Google Scholar] [CrossRef]
  40. Guo, J.; Shi, L.; Chen, S.; Castelle, B.; Chang, Y.; Cheng, W. Sand-Mud Transition Dynamics at Embayed Beaches during a Typhoon Season in Eastern China. Mar. Geol. 2021, 441, 106633. [Google Scholar] [CrossRef]
  41. Jiang, Z.; Shi, L.; Guo, J.; Zhang, M. Storm Response and Recovery Process after Nourishment of Dongsha Beach, Zhujiajian Island, Zhejiang Province. J. Coast. Res. 2020, 95, 231–236. [Google Scholar] [CrossRef]
  42. Lu, J. Research Report on the Regional Climate of 908 Special Island Survey in Zhejiang Province; Zhejiang Ocean Monitoring and Forecast Center: Hangzhou, China, 2010; pp. 54–67. [Google Scholar]
  43. Wang, K. Comprehensive Survey of Island Resources in Zhejiang Province; Second Institute of Oceanography, State Oceanic Administration: Hangzhou, China, 1994. [Google Scholar]
  44. Wang, J.; Li, J. Analysis of Geomorphic Environment on the Formation of Coastal Cultural Resources in Zhejiang Province. J. Jingchu Univ. Technol. 2010, 25, 63–66. [Google Scholar]
  45. CCRBC (Compilation Committee of Records of Bays in China). Records of Bays in China, Volume 5, Bays in Shanghai and North Zhejiang; China Ocean Press: Beijing, China, 1992. [Google Scholar]
  46. CCRBC (Compilation Committee of Records of Bays in China). Records of Bays in China, Volume 6, Bays in South Zhejiang; China Ocean Press: Beijing, China, 1993. [Google Scholar]
  47. Yu, S. Study on the Influence of Coastal Storm Surge Level on Typhoon Wave in Zhejiang Province. Master’s Thesis, Zhejiang University, Hangzhou, China, 2012. [Google Scholar]
  48. Zhang, H. Basic Status of Marine Environmental Resources in Zhejiang Province; China Ocean Press: Beijing, China, 2013. [Google Scholar]
  49. Chen, Q.; Huang, D.; Zhang, B.; Wang, M. The Research of the Tidal Features in the Coastal Zone of Zhejiang Province. Donghai Mar. Sci. 2003, 21, 1–12. [Google Scholar]
  50. Carver, R.E. Procedures in Sedimentary Petrology; Wiley-Interscience: New York, NY, USA, 1971. [Google Scholar]
  51. Folk, R.L.; Ward, W.C. Brazos River Bar [Texas]; A Study in the Significance of Grain Size Parameters. J. Sediment. Res. 1957, 27, 3–26. [Google Scholar] [CrossRef]
  52. Hsu, J.R.C.; Evans, C. Parabolic Bay Shapes and Applications. ICE Proc. 1989, 87, 557–570. [Google Scholar] [CrossRef]
  53. Chen, D. Econometric Geography: Methods and Applications; Nanjing University Press: Nanjing, China, 2011. [Google Scholar]
  54. Hsu, J.R.C.; Silvester, R.; Xia, Y.M. Application of Headland Control. J. Waterw. Ports Coast. Ocean Eng. 1989, 115, 299–310. [Google Scholar] [CrossRef]
  55. Castelle, B.; Coco, G. The Morphodynamics of Rip Channels on Embayed Beaches. Cont. Shelf Res. 2012, 43, 10–23. [Google Scholar] [CrossRef]
  56. Loureiro, C.; Ferreira, Ó.; Cooper, J.A.G. Geologically Constrained Morphological Variability and Boundary Effects on Embayed Beaches. Mar. Geol. 2012, 329–331, 1–15. [Google Scholar] [CrossRef]
  57. Masselink, G.; Scott, T.; Poate, T.; Russell, P.; Davidson, M.; Conley, D. The Extreme 2013/2014 Winter Storms: Hydrodynamic Forcing and Coastal Response along the Southwest Coast of England. Earth Surf. Proc. Land. 2016, 41, 378–391. [Google Scholar] [CrossRef]
  58. Cai, F. Brief Introduction of Chinese Beach Resources; Ocean Press: Beijing, China, 2019. [Google Scholar]
  59. Gomes, E.R.; Mulligan, R.P.; Brodie, K.L.; McNinch, J.E. Bathymetric Control on the Spatial Distribution of Wave Breaking in the Surf Zone of a Natural Beach. Coast. Eng. 2016, 116, 180–194. [Google Scholar] [CrossRef]
  60. Aagaard, T.; Greenwood, B.; Hughes, M. Sediment Transport on Dissipative, Intermediate and Reflective Beaches. Earth-Sci. Rev. 2013, 124, 32–50. [Google Scholar] [CrossRef]
  61. Sreenivasulu, G.; Jayaraju, N.; Reddy, B.C.S.R.; Prasad, T.L.; Lakshmanna, B.; Nagalakshmi, K. Coastal Morphodynamics of Tupilipalem Coast, Andhra Pradesh, Southeast Coast of India. Curr. Sci. India. 2017, 112, 823–829. [Google Scholar] [CrossRef]
  62. Davies, J.L.; Gideon, J.D.; Davies, M.C. A Morphogenic Approach to World Shorelines. Z. Geomorphol. 1964, 8, 127–142. [Google Scholar] [CrossRef]
  63. Huang, S.; Yao, W.; Liu, X.; Wu, C. Profile Characteristics of the Beaches Adjacent to Muddy Seabed in the Headland Bays. Chin. Coast. Eng. 2016, 35, 1–9. [Google Scholar]
  64. Li, M.; Sun, Z.; Gong, Y.; Hu, Y. Numerical Simulation of Sand-Mud Coexisting Beach Based on Delft-3D. Bull. Sci. Technol. 2019, 35, 109–113. [Google Scholar]
  65. Li, Y.; Zhang, C.; Zhao, S.; Qi, H.; Cai, F.; Zheng, J. Equilibrium Configurations of Sandy-Muddy Transitional Beaches on South China Coasts: Role of Waves in Formation of Sand-Mud Transition Boundary. Coast. Eng. 2024, 187, 104401. [Google Scholar] [CrossRef]
  66. Zhao, S.; Cai, F.; Qi, H.; Liu, J.; Cao, C.; Liu, G.; Lei, G. Sediment Source-to-Sink Process Variations of Sandy-Muddy Transitional Beaches and Their Morphological Indications. Acta Oceanol. Sin. 2023, 42, 10–24. [Google Scholar] [CrossRef]
  67. Anthony, E.J.; Dolique, F. The Influence of Amazon-Derived Mud Banks on the Morphology of Sandy Headland-Bound Beaches in Cayenne, French Guiana: A Short- to Long-Term Perspective. Mar. Geol. 2004, 208, 249–264. [Google Scholar] [CrossRef]
  68. Calliari, L.J.; Machado, A.A.; Marroig, P.; Vinzon, S.; Gianuca, N. Mud Deposits at Cassino Beach: Role of Dredging. Geo-Mar. Lett. 2020, 40, 1031–1043. [Google Scholar] [CrossRef]
  69. Chang, T.S.; Hong, S.H.; Chun, S.S.; Choi, J.-H. Age and Morphodynamics of a Sandy Beach Fronted by a Macrotidal Mud Flat along the West Coast of Korea: A Lateral Headland Bypass Model for Beach-Dune Formation. Geo-Mar. Lett. 2017, 37, 361–371. [Google Scholar] [CrossRef]
  70. Tamura, T.; Horaguchi, K.; Saito, Y.; Nguyen, V.L.; Tateishi, M.; Ta, T.K.O.; Nanayama, F.; Watanabe, K. Monsoon-Influenced Variations in Morphology and Sediment of a Mesotidal Beach on the Mekong River Delta Coast. Geomorphology 2010, 116, 11–23. [Google Scholar] [CrossRef]
  71. Qiao, L.; Liu, S.; Xue, W.; Liu, P.; Hu, R.; Sun, H.; Zhong, Y. Spatiotemporal Variations in Suspended Sediments over the Inner Shelf of the East China Sea with the Effect of Oceanic Fronts. Estuar. Coast. Shelf Sci. 2020, 234, 106600. [Google Scholar] [CrossRef]
  72. Cai, F.; Liu, G. Beach Nourishment Development and Technological Innovations in China: An Overview. J. Appl. Oceanogr. 2019, 38, 452–463. [Google Scholar]
  73. Cooper, J.A.G.; Masselink, G.; Coco, G.; Short, A.D.; Castelle, B.; Rogers, K.; Anthony, E.; Green, A.N.; Kelley, J.T.; Pilkey, O.H.; et al. Sandy Beaches Can Survive Sea-Level Rise. Nat. Clim. Chang. 2020, 10, 993–995. [Google Scholar] [CrossRef]
  74. de Schipper, M.A.; Ludka, B.C.; Raubenheimer, B.; Luijendijk, A.P.; Schlacher, T.A. Beach Nourishment Has Complex Implications for the Future of Sandy Shores. Nat. Rev. Earth Environ. 2021, 2, 70–84. [Google Scholar] [CrossRef]
  75. Guo, J.; Shi, L.; Pan, S.; Ye, Q.; Cheng, W.; Chang, Y.; Chen, S. Monitoring and Evaluation of Sand Nourishments on an Embayed Beach Exposed to Frequent Storms in Eastern China. Ocean Coast. Manag. 2020, 195, 105284. [Google Scholar] [CrossRef]
  76. Kuang, C.; Mao, X.; Gu, J.; Niu, H.; Ma, Y.; Yang, Y.; Qiu, R.; Zhang, J. Morphological Processes of Two Artificial Submerged Shore-Parallel Sandbars for Beach Nourishment in a Nearshore Zone. Ocean Coast. Manag. 2019, 179, 104870. [Google Scholar] [CrossRef]
Figure 1. Geographical location of study area and the coastal current system (a) and the locations of the 75 accessible embayed sandy beaches in Zhejiang province (b). YSWC, JCC, ZFCC, and TWC in (a) represent the Yellow Sea Warm Current, Jiangsu Coastal Current, Zhejiang–Fujian Coastal current, and Taiwan Warm Current, respectively. Numbers in this figure show the ID of the studied beaches (refer to Table S1; the ID numbers of the beaches are arranged from the north according to latitude). The coastal current system and the surficial sediment type distribution were modified after [36].
Jmse 12 01223 g001
Figure 2. Embayment parameters used in this study according to [52].
Jmse 12 01223 g002
Figure 3. Averaged slope of the beaches in NZ (a), CZ (b), and SZ (c), respectively.
Jmse 12 01223 g003
Figure 4. Grain size characteristics of sandy beaches in Zhejiang from north to south: 33 beaches in NZ (a,d,g,j), 25 beaches in CZ (b,e,h,k), and 17 beaches in SZ (c,f,i,l).
Jmse 12 01223 g004
Figure 5. Beach length and averaged dry beach width of sandy beaches in Zhejiang: 33 beaches in NZ (a,d), 25 beaches in NZ (b,e), and 17 beaches in SZ (c,f).
Jmse 12 01223 g005
Figure 6. Correlation between dry beach width and beach length.
Jmse 12 01223 g006
Figure 7. Headland lengths (S), bay mouth direction angles (γ), and spiral tangent angles (β) of sandy beaches in Zhejiang: 33 beaches in NZ (a,d,g), 25 beaches in CZ (b,e,h), and 17 beaches in SZ (c,f,i).
Jmse 12 01223 g007
Figure 8. Maximum indentation (a), bay mouth arc length (b), ratio of a and b, and tangential section length (L) of sandy beaches in Zhejiang: 33 beaches in NZ (a,d,g,j), 25 beaches in CZ (b,e,h,k), and 17 beaches in SZ (c,f,i,l). The dash lines in each panel show the mean value.
Jmse 12 01223 g008
Figure 9. Conceptual model of difference in the distribution (ac) and morphological characteristics (df) of NZ beaches (a,d), CZ beaches (b,e), and SZ beaches (c,f). The black dots in (df) show the conceptual sediment grain size.
Jmse 12 01223 g009
Figure 10. Multiyear averaged surficial suspended sediment concentration (mg/L) distribution in the coastal regions of Zhejiang and the adjacent sea areas during summer (a) and winter (b) (modified from [71]), in which the green circles show the sandy beaches in this study.
Jmse 12 01223 g010
Figure 11. Example of human activities on the Zhejiang beaches: seawall construction (a) and beach nourishment (b).
Jmse 12 01223 g011
Table 1. Pearson correlation coefficients of the morphodynamic parameters of the studied sandy beaches in Zhejiang.
Parameter i MzaLbSβγa/b
i 1.000
Mz0.5231.000
a−0.2300.1091.000
L−0.0360.0980.5541.000
b−0.1970.0150.7560.5751.000
S−0.0680.0030.5870.5330.5951.000
β0.035−0.039−0.226−0.098−0.224−0.2231.000
γ0.0800.1500.020−0.012−0.0790.096−0.2741.000
a/b−0.0580.1680.3430.036−0.1820.048−0.1320.0841.000
Table 2. The load of morphodynamic factors in principal components of sandy beaches in NZ, CZ, and SZ, respectively.
PC i MzaLbSγβa/bTR H ¯
NZ1−0.173−0.1300.2460.2300.2320.0950.0280.1910.015−0.065−0.065
NZ20.3230.3210.0630.1730.0960.021−0.2830.250−0.1640.312−0.016
NZ30.0660.1270.113−0.014−0.2000.0470.2750.1300.6130.295−0.353
NZ4−0.015−0.3290.178−0.057−0.114−0.223−0.2370.1790.3510.2600.681
CZ1−0.050−0.0270.2550.2290.2680.2410.0890.095−0.0440.1200.024
CZ20.5020.449−0.0170.0050.0190.0160.208−0.074−0.1410.0960.099
CZ30.0820.174−0.0170.035−0.1150.073−0.4420.4760.1750.1200.220
CZ40.0640.2580.2270.0370.0220.0080.0090.0620.439−0.333−0.491
SZ1−0.188−0.0810.2650.1800.2900.157−0.1230.1370.003−0.1250.194
SZ2−0.142−0.2710.167−0.1060.0880.1490.180−0.2930.2680.186−0.197
SZ30.4330.4310.211−0.0530.0900.2370.0600.0140.3280.1930.184
SZ4−0.121−0.066−0.1710.219−0.1230.102−0.3910.4080.2380.505−0.227
Note: NZ1, CZ1, and SZ1 represent the first principal component in NZ beach PCA, respectively.
Table 3. Information of five mainland beaches with mud on the subaerial beach.
IDNamew (m)l (m)Mz (μm)S (m)β (°)γ (°)a/bL (m)TR (m) H ¯
30Yangshashan118.52322.9335.2682.8928.39267.080.65262.882.060.40
34Changshayucun62.43919.89609.3270.177.0732.80.66237.462.450.40
50Hutoushanzui68.13234.58218.7842.2592.3814.010.5971.764.170.50
52Mushao80.75440.55225.9292.9221.39321.480.54168.284.170.50
54Longwan68.53286.98212.25494.6577.2358.160.59448.974.170.50
Disclaimer/Publisher’s Note: The statements, opinions and data contained in all publications are solely those of the individual author(s) and contributor(s) and not of MDPI and/or the editor(s). MDPI and/or the editor(s) disclaim responsibility for any injury to people or property resulting from any ideas, methods, instructions or products referred to in the content.

