
Free-Drop Experimental and Simulation Study on the Ultimate Bearing Capacity of Stiffened Plates with Different Stiffnesses under Slamming Loads

 , ,
, ,
Abstract
1. Introduction
2. Experimental Setup
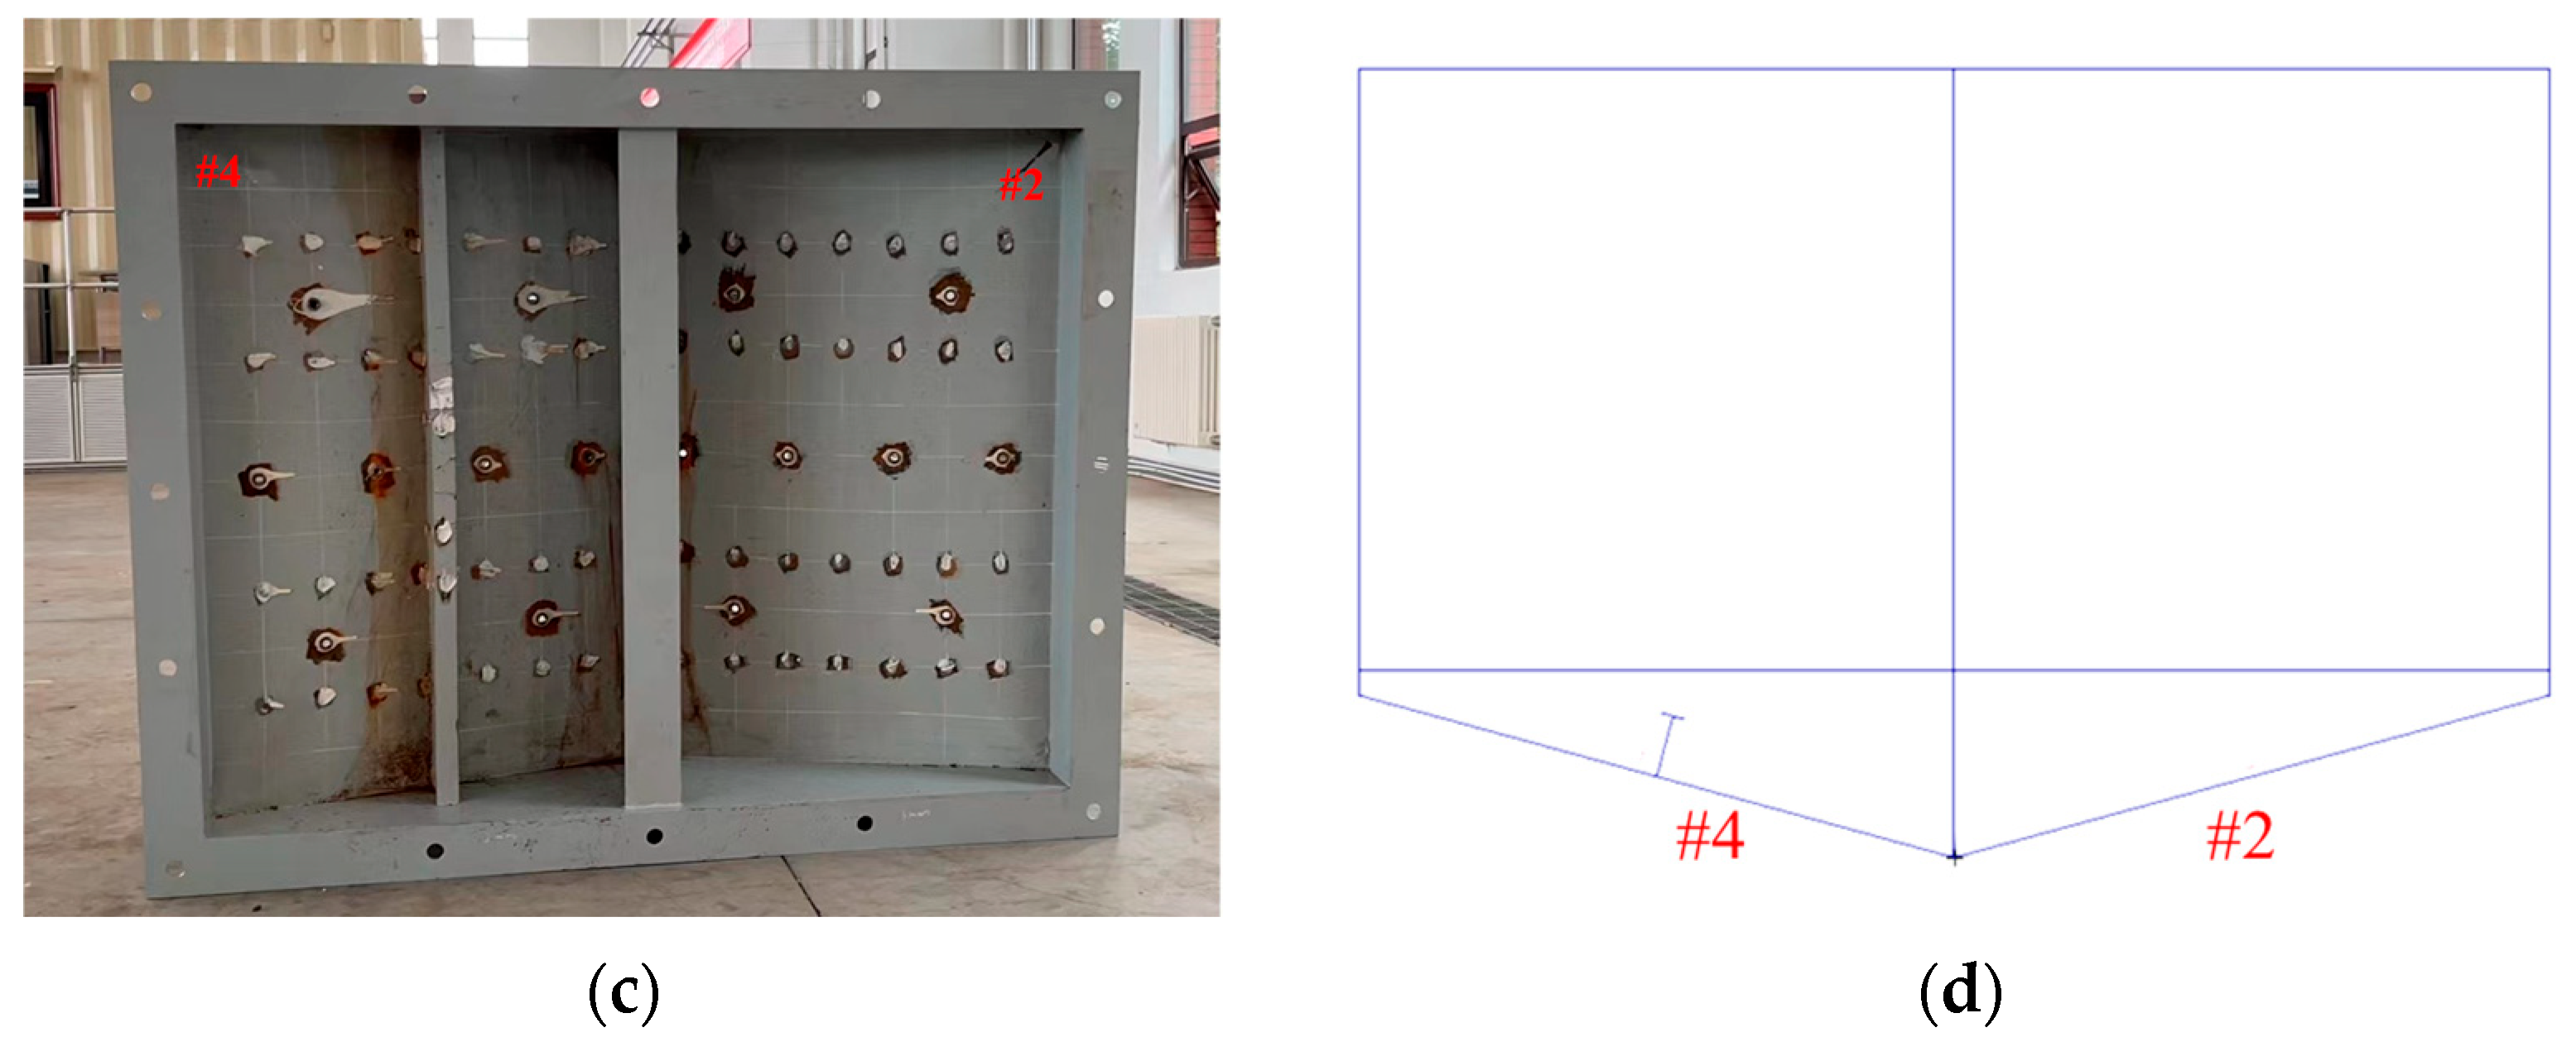
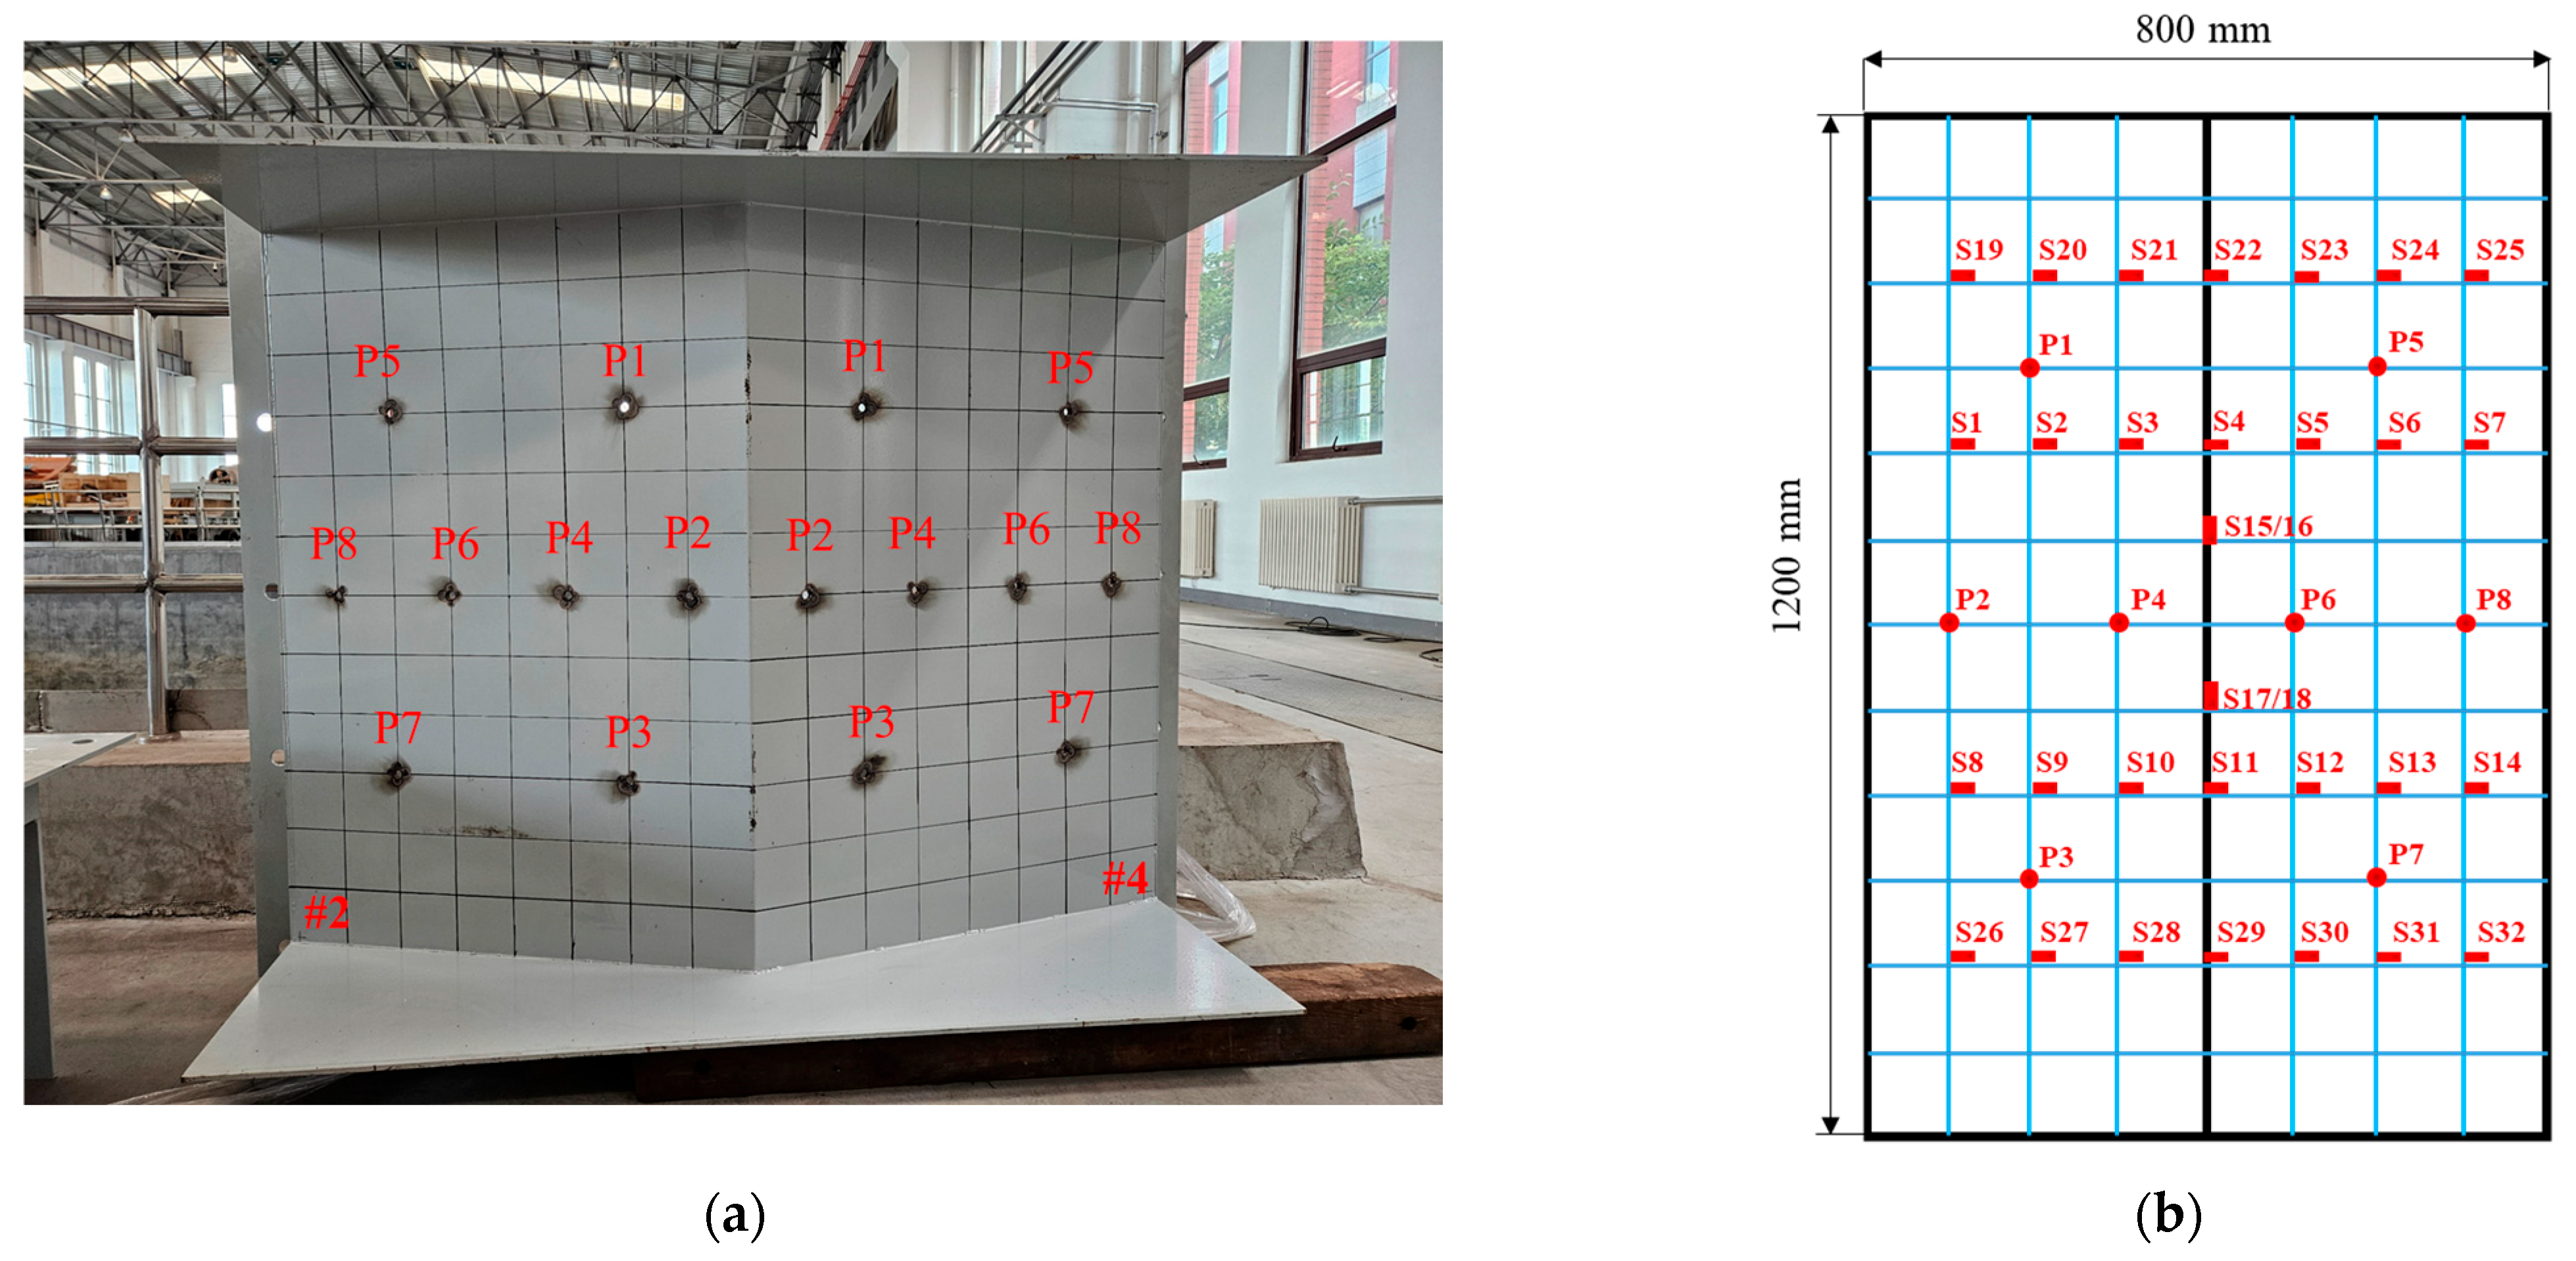
2.1. Model Design
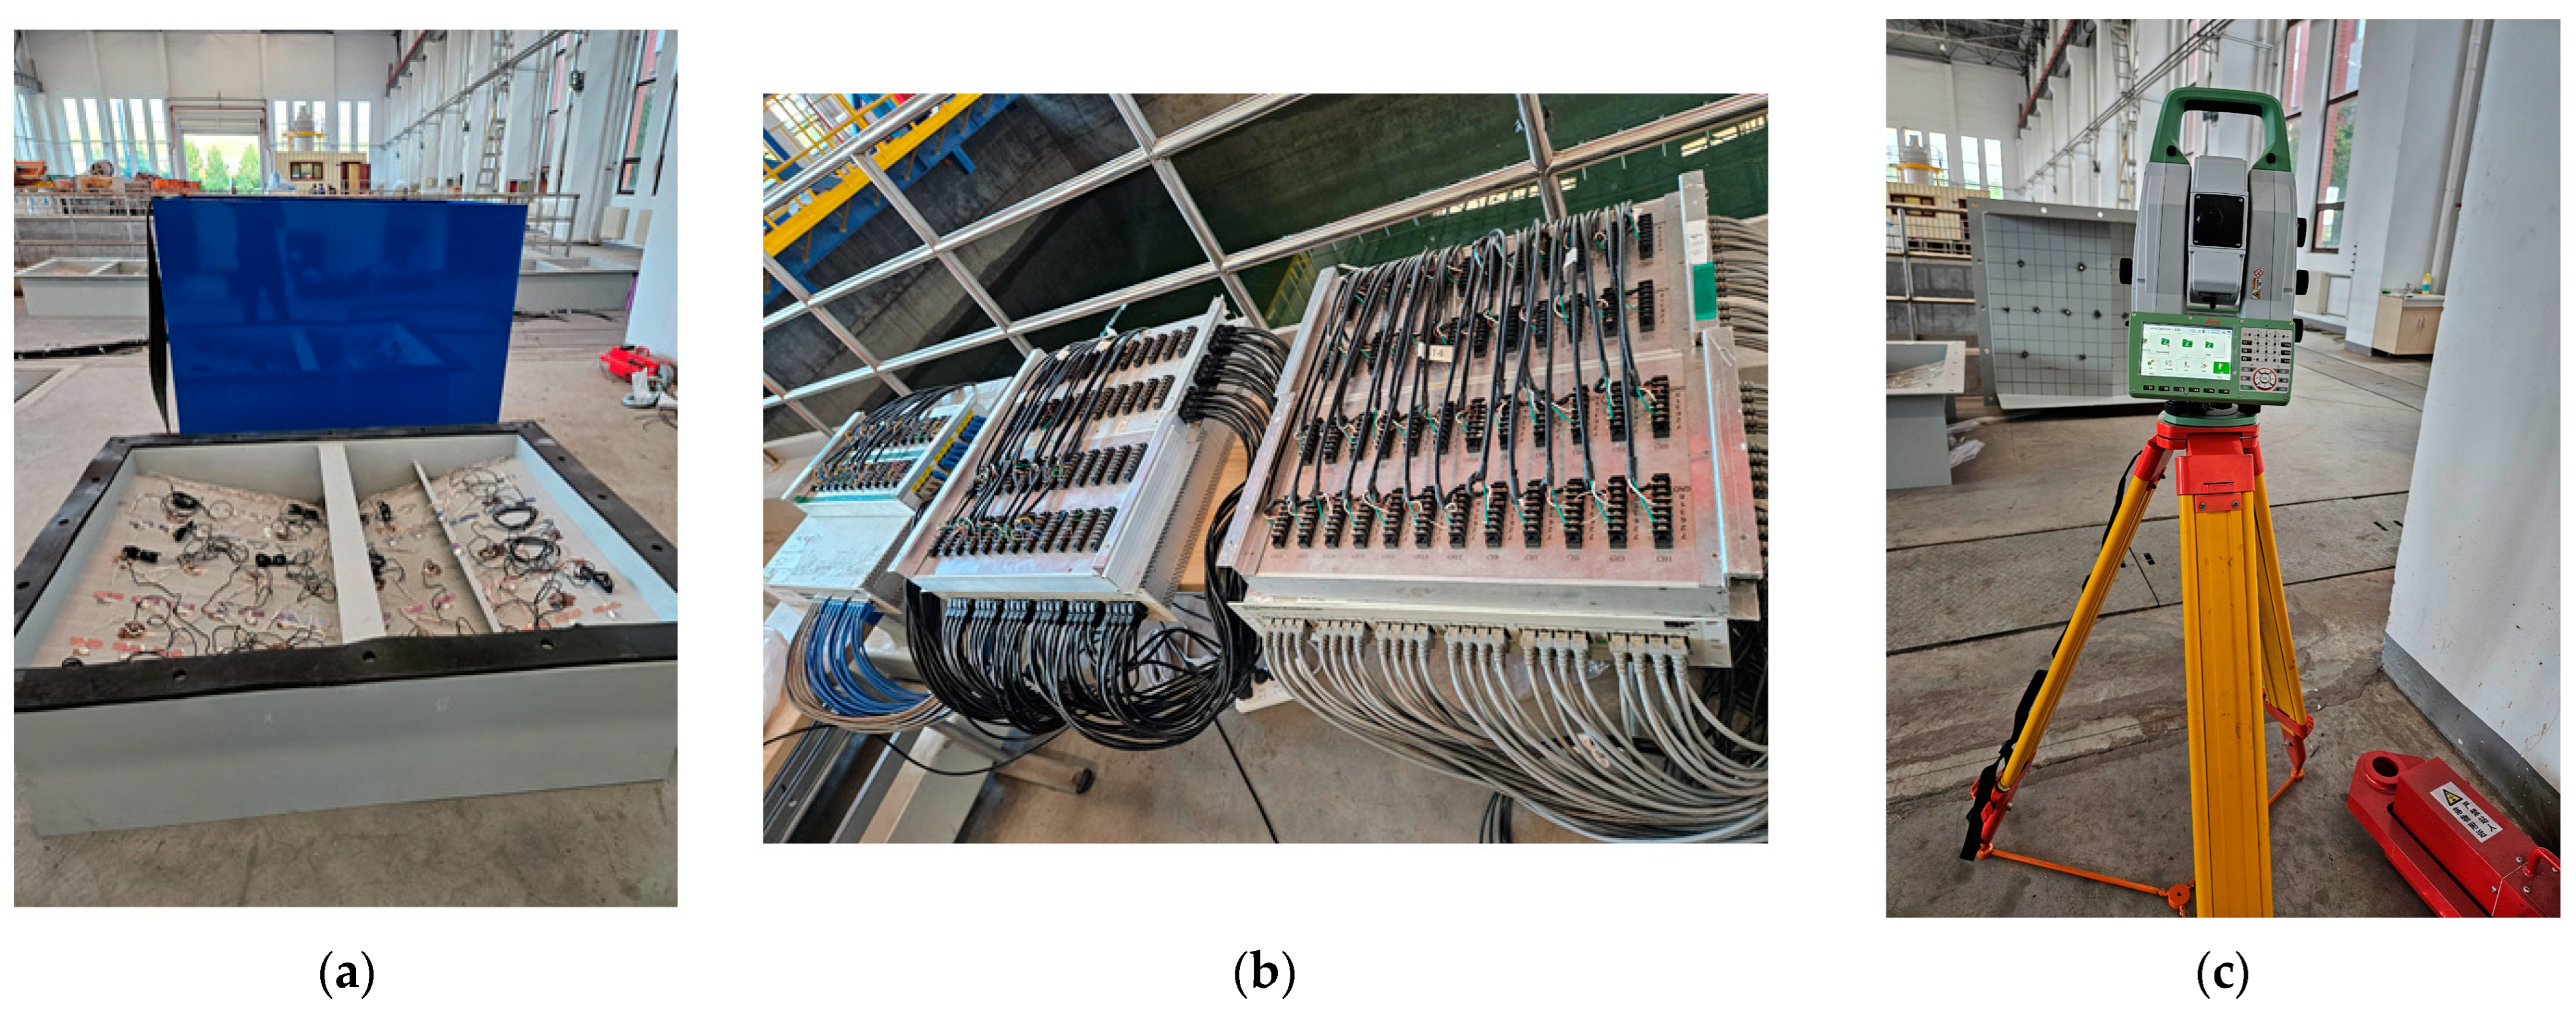
2.2. Instruments
2.3. Test Conditions and Content
3. Numerical Simulation
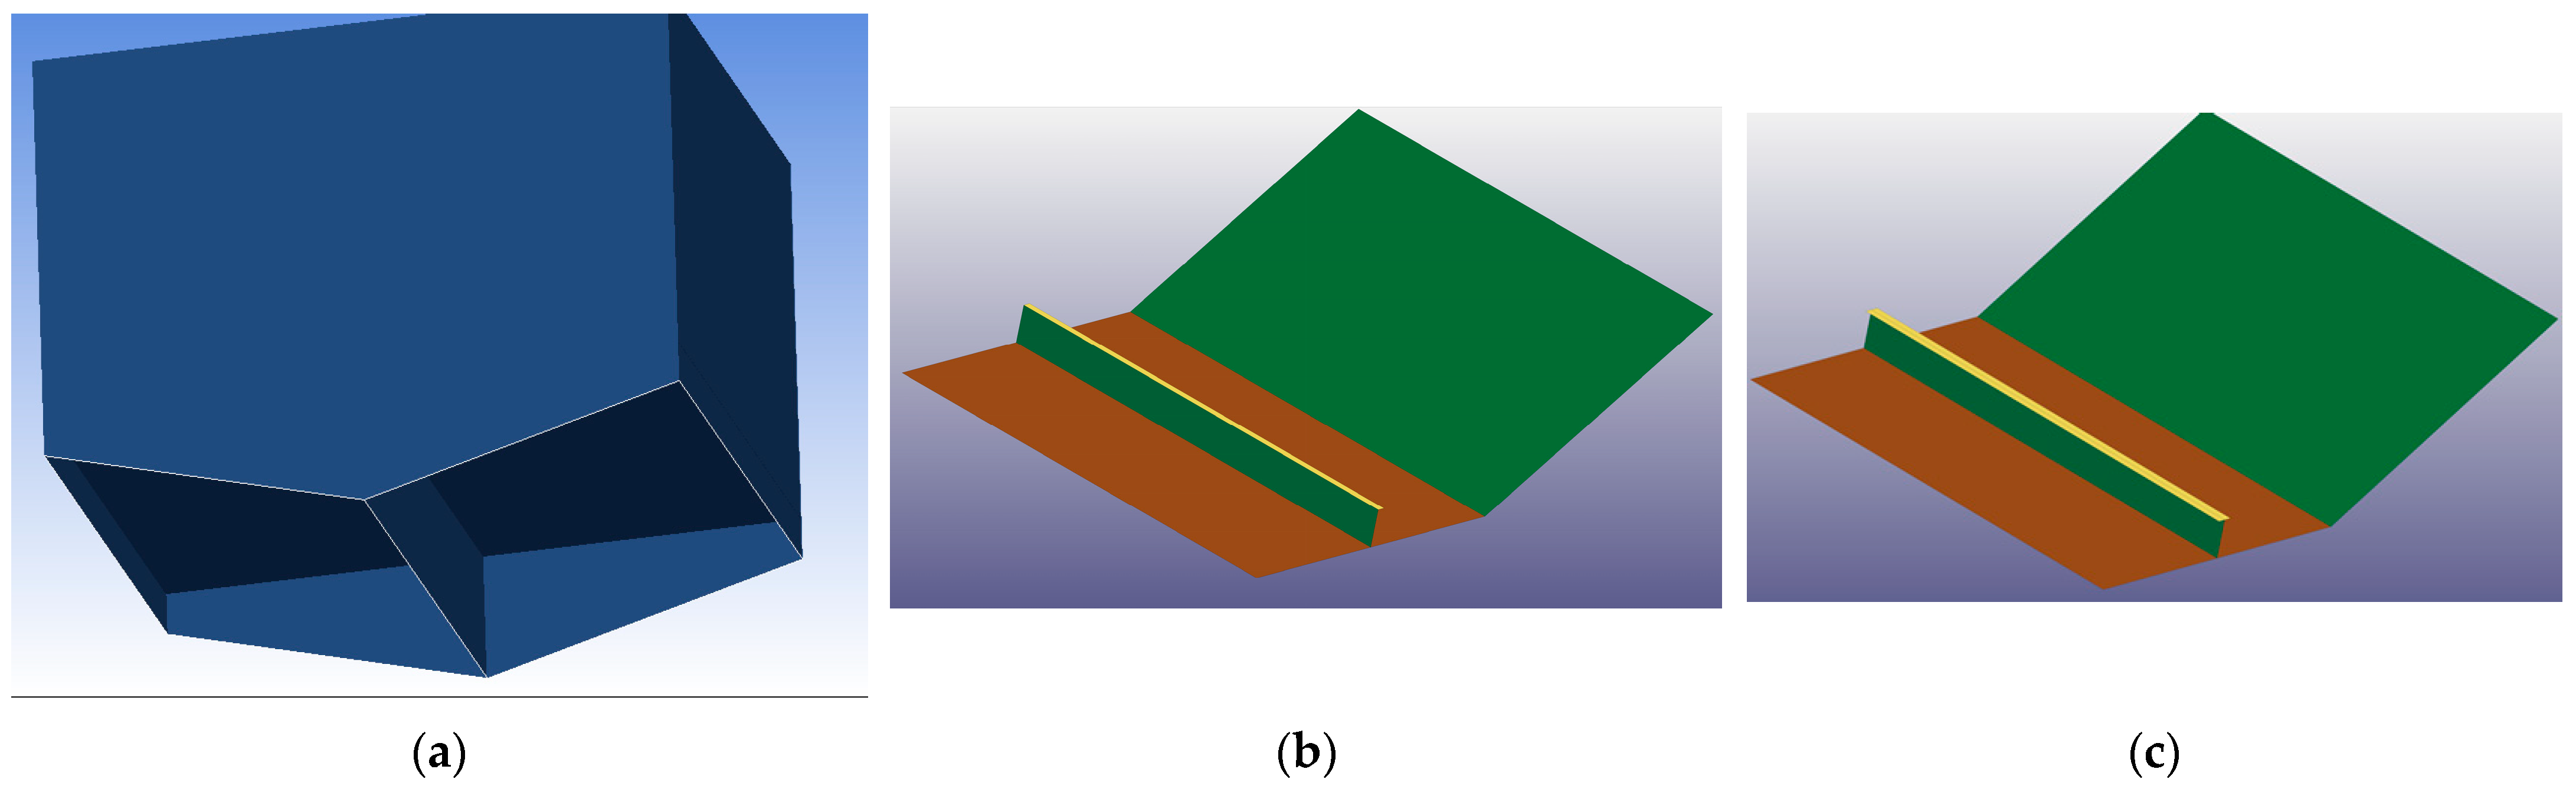
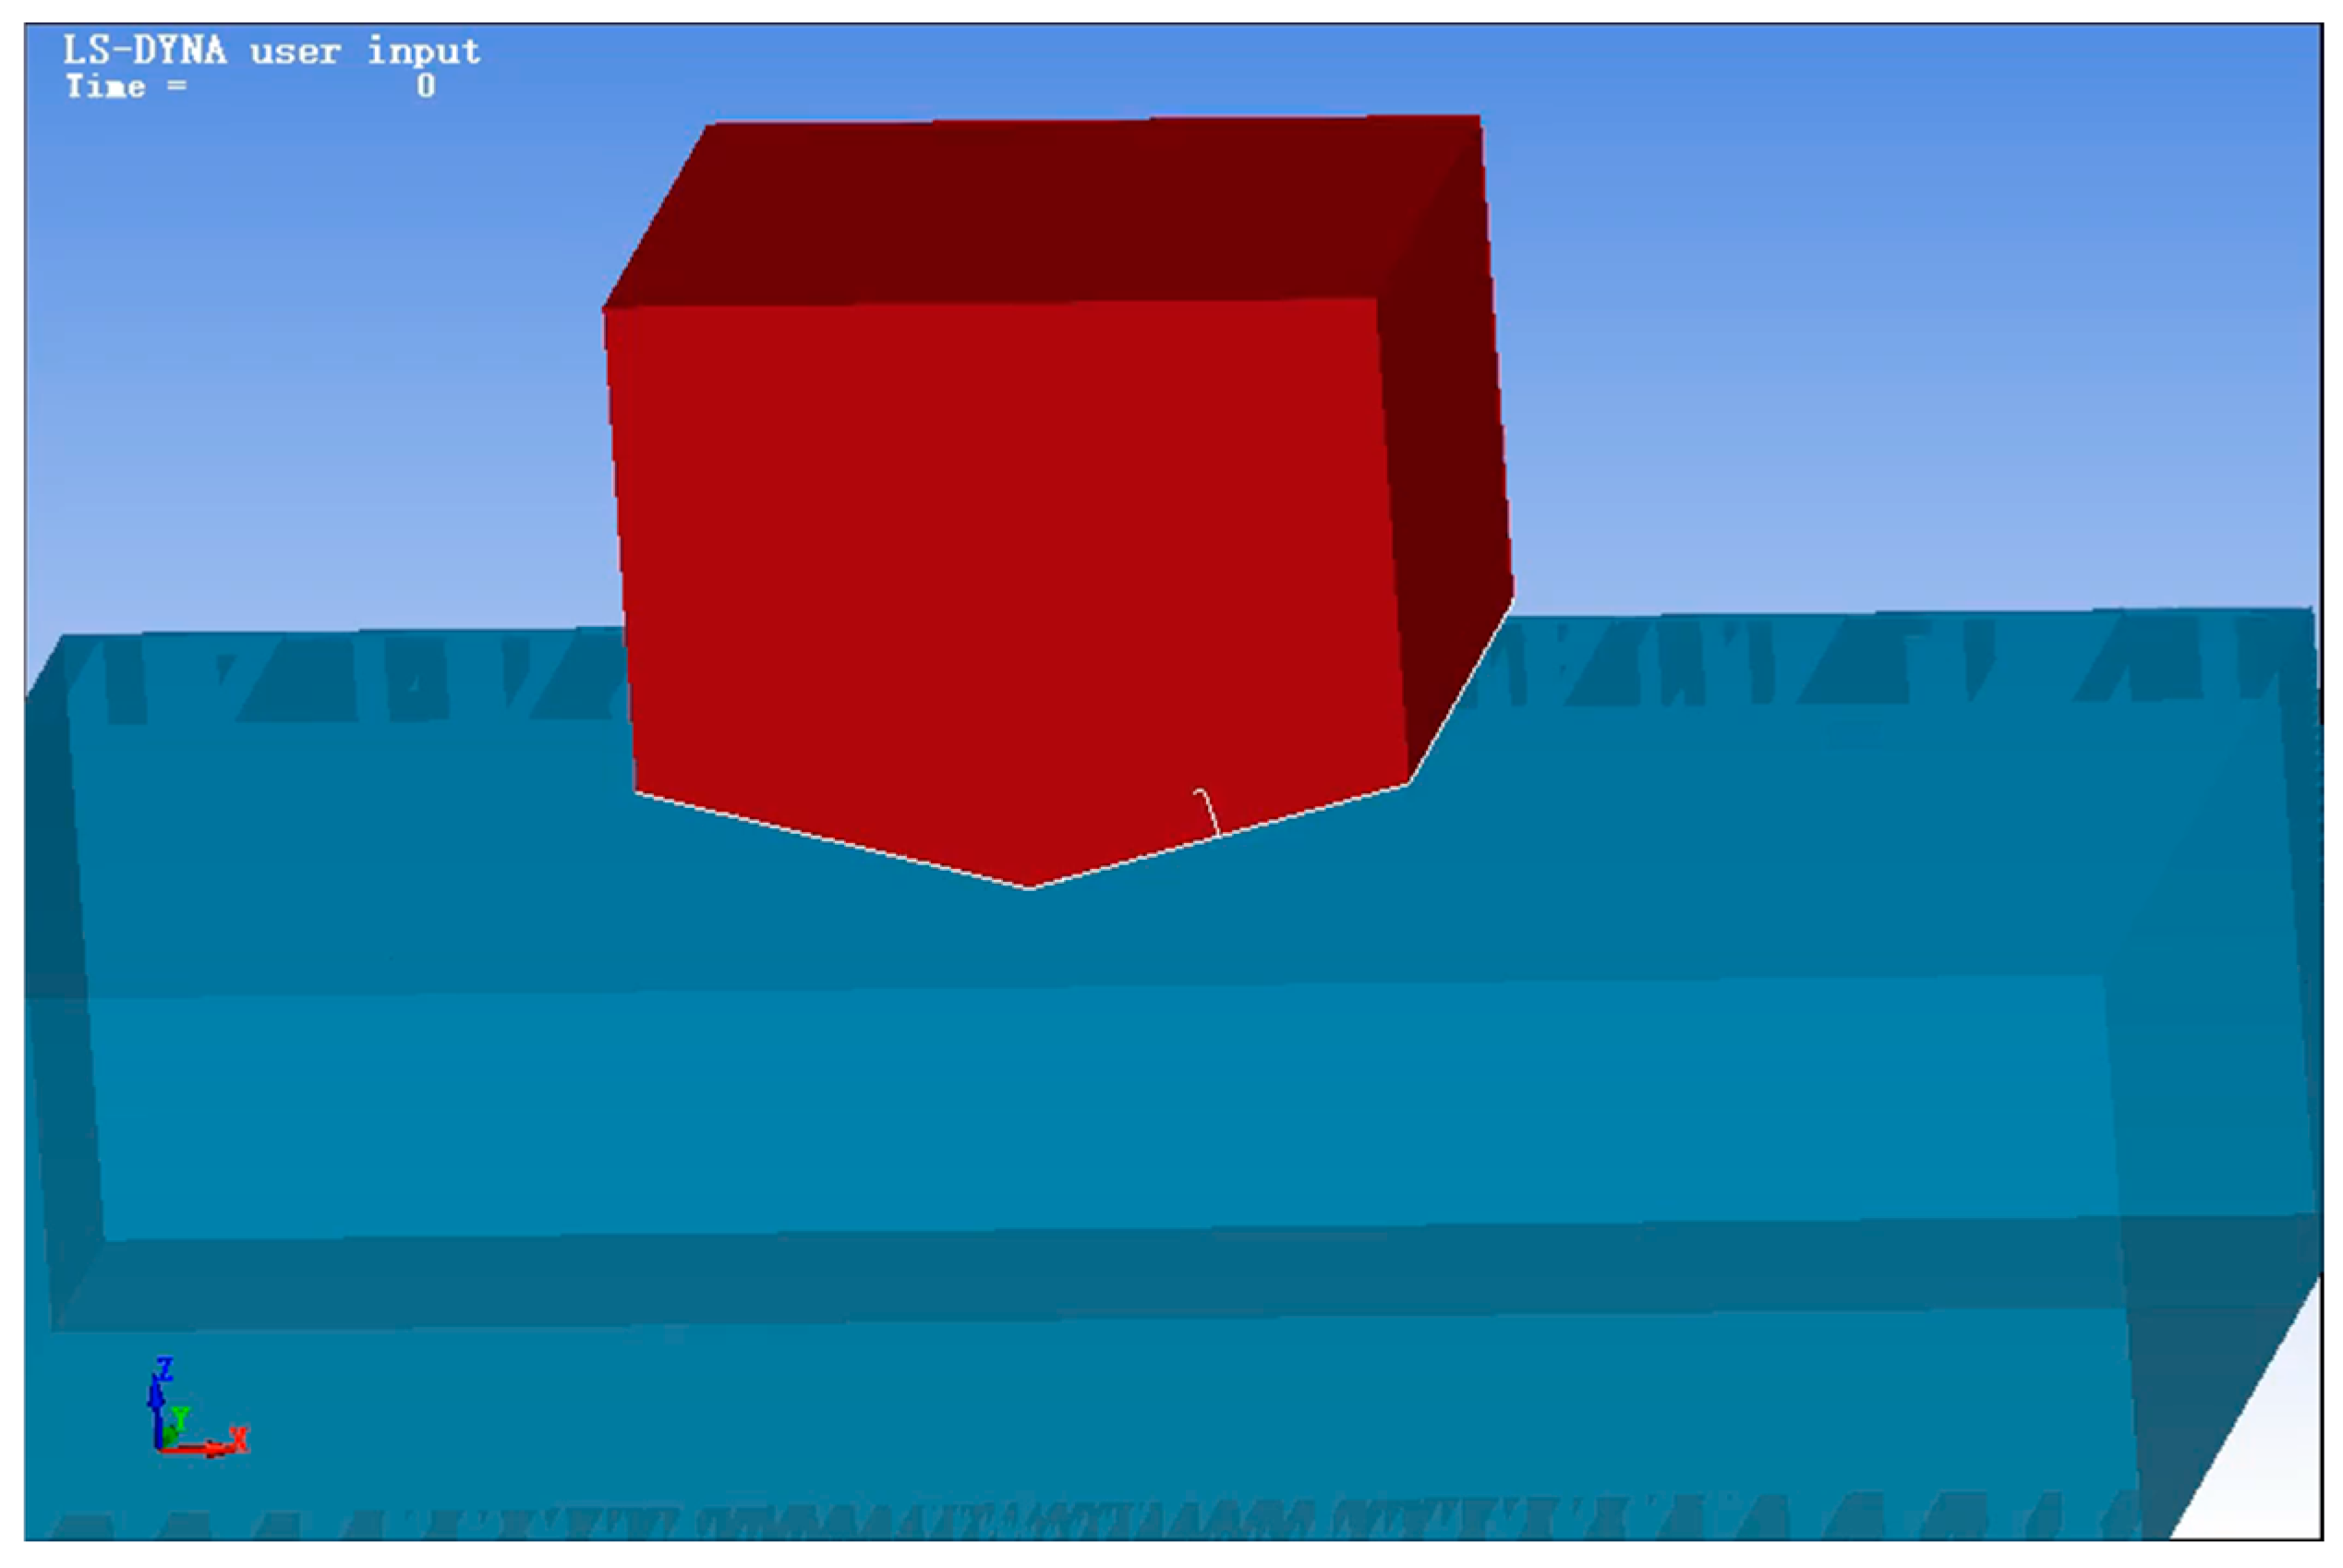
3.1. Simulation Model and Parameters
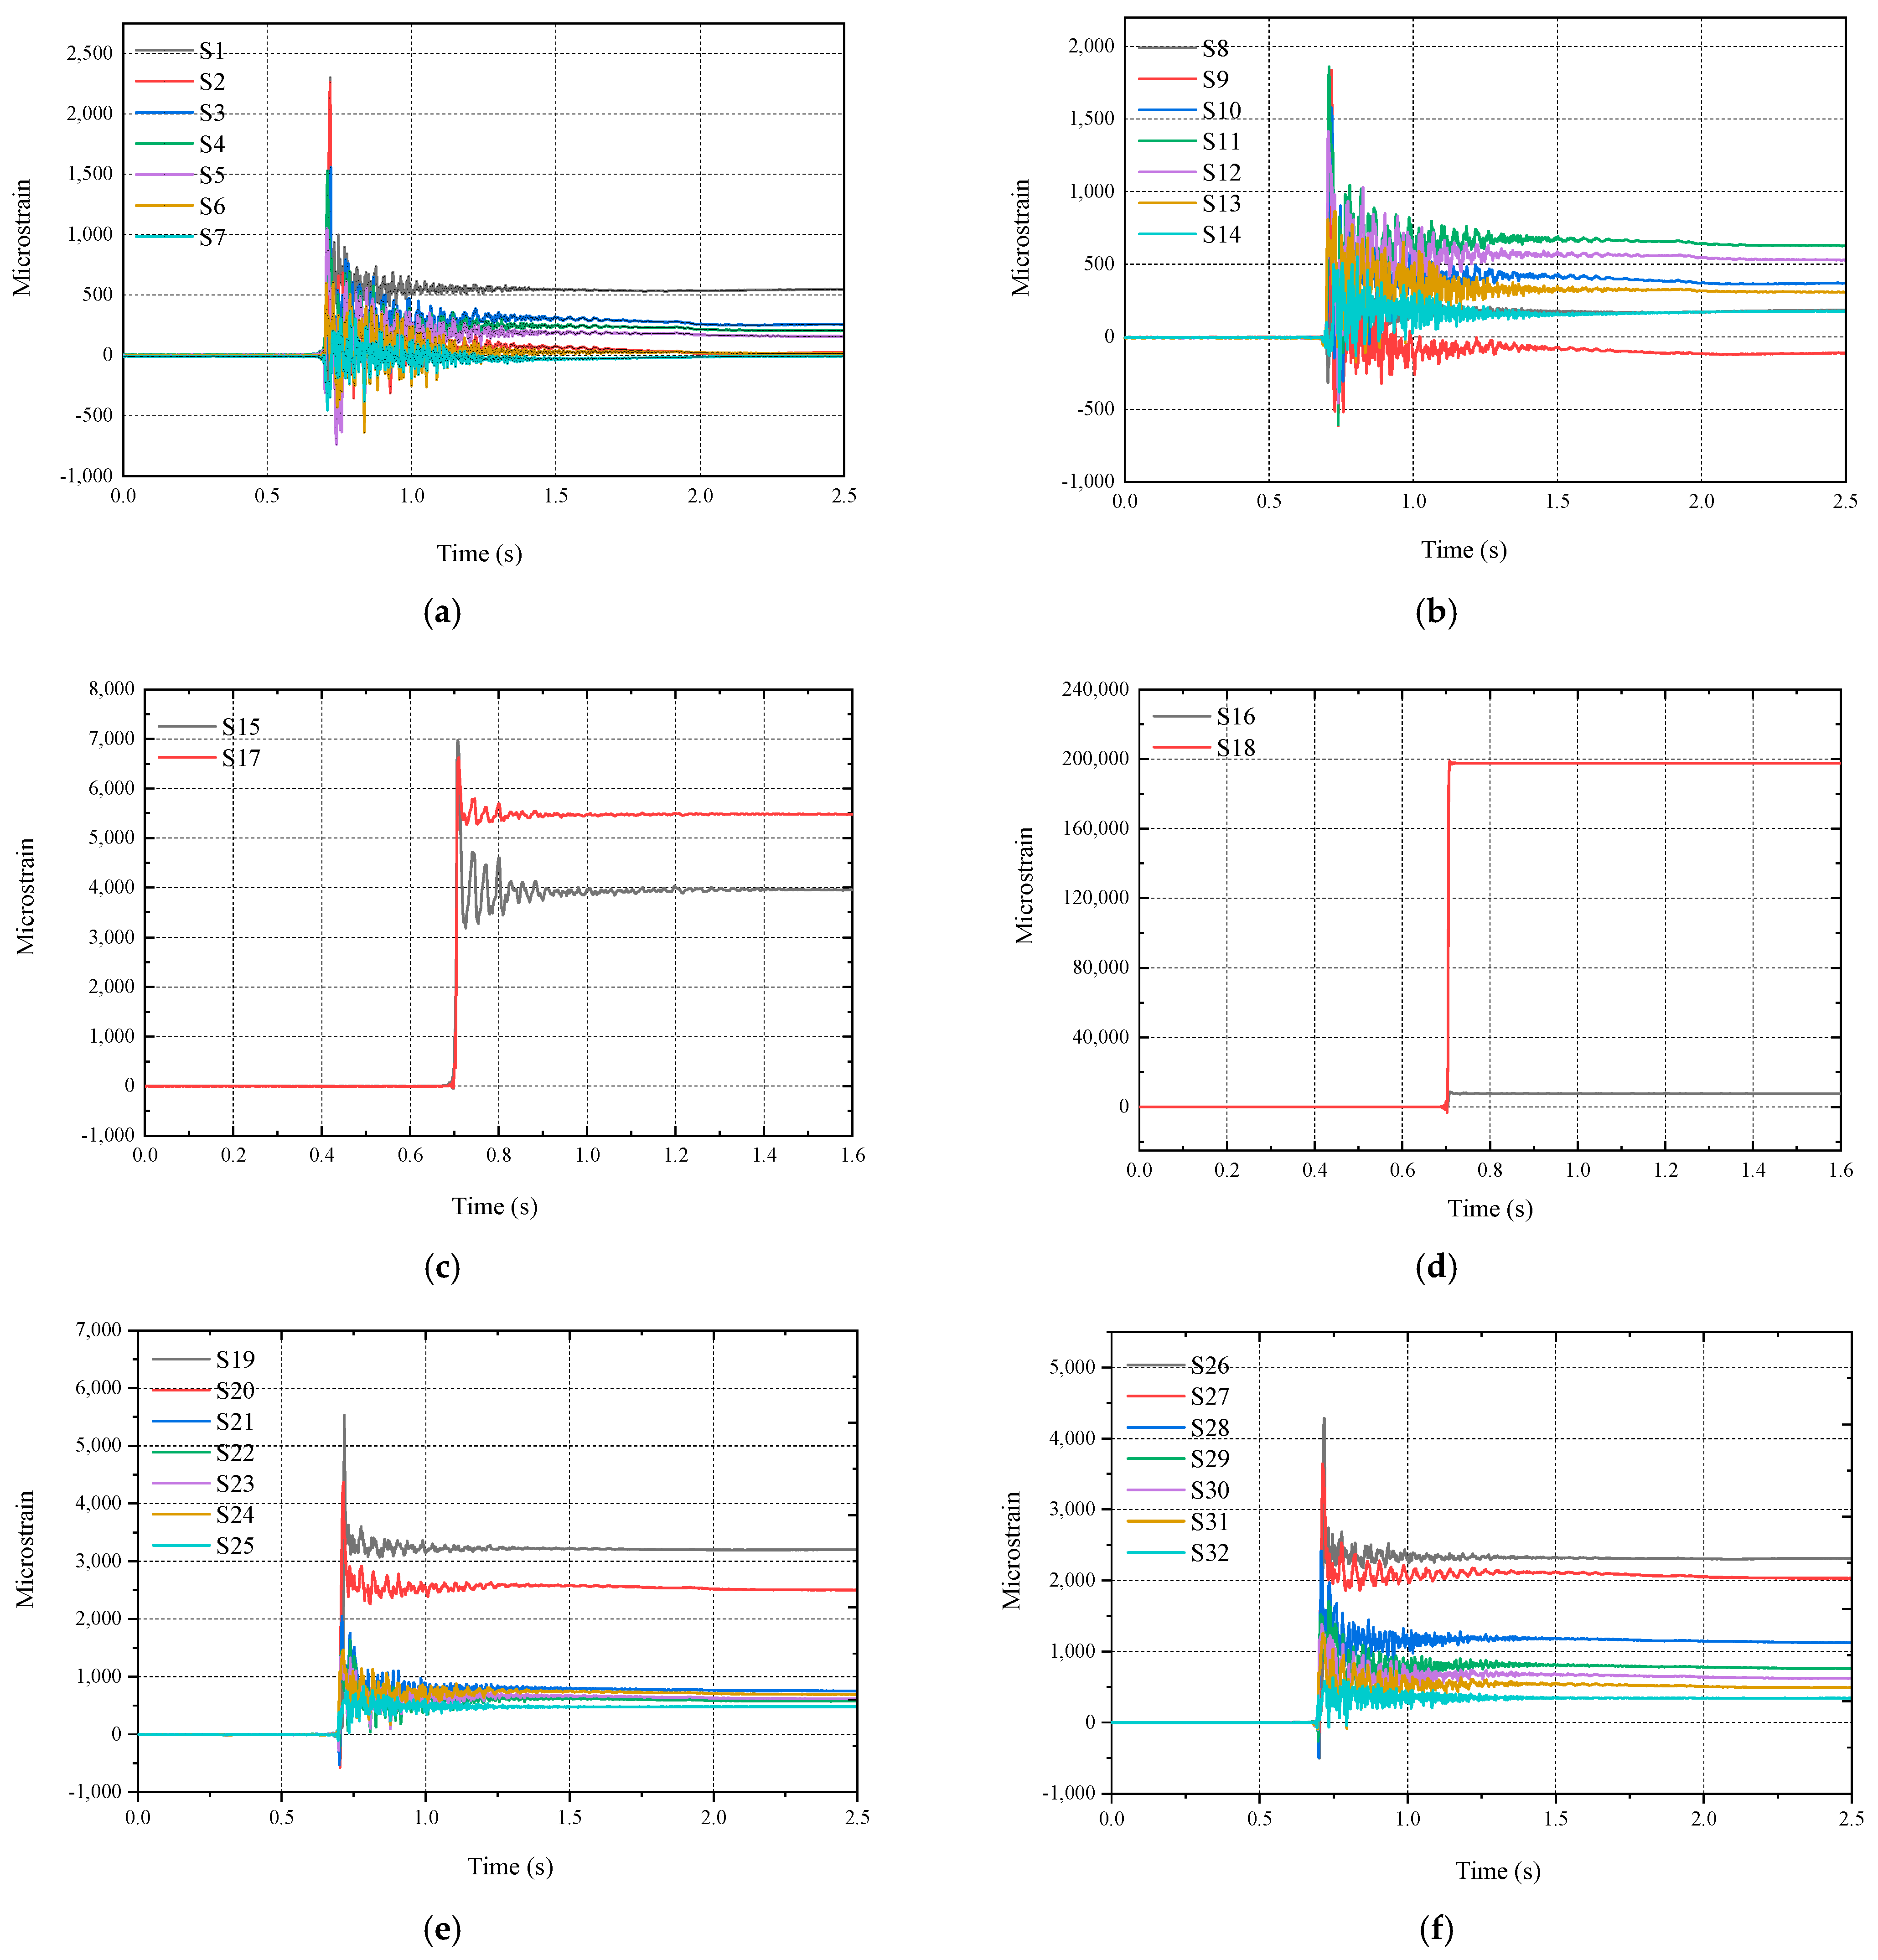
3.2. Monitoring Points and Data Presentation
4. Comparison and Verification
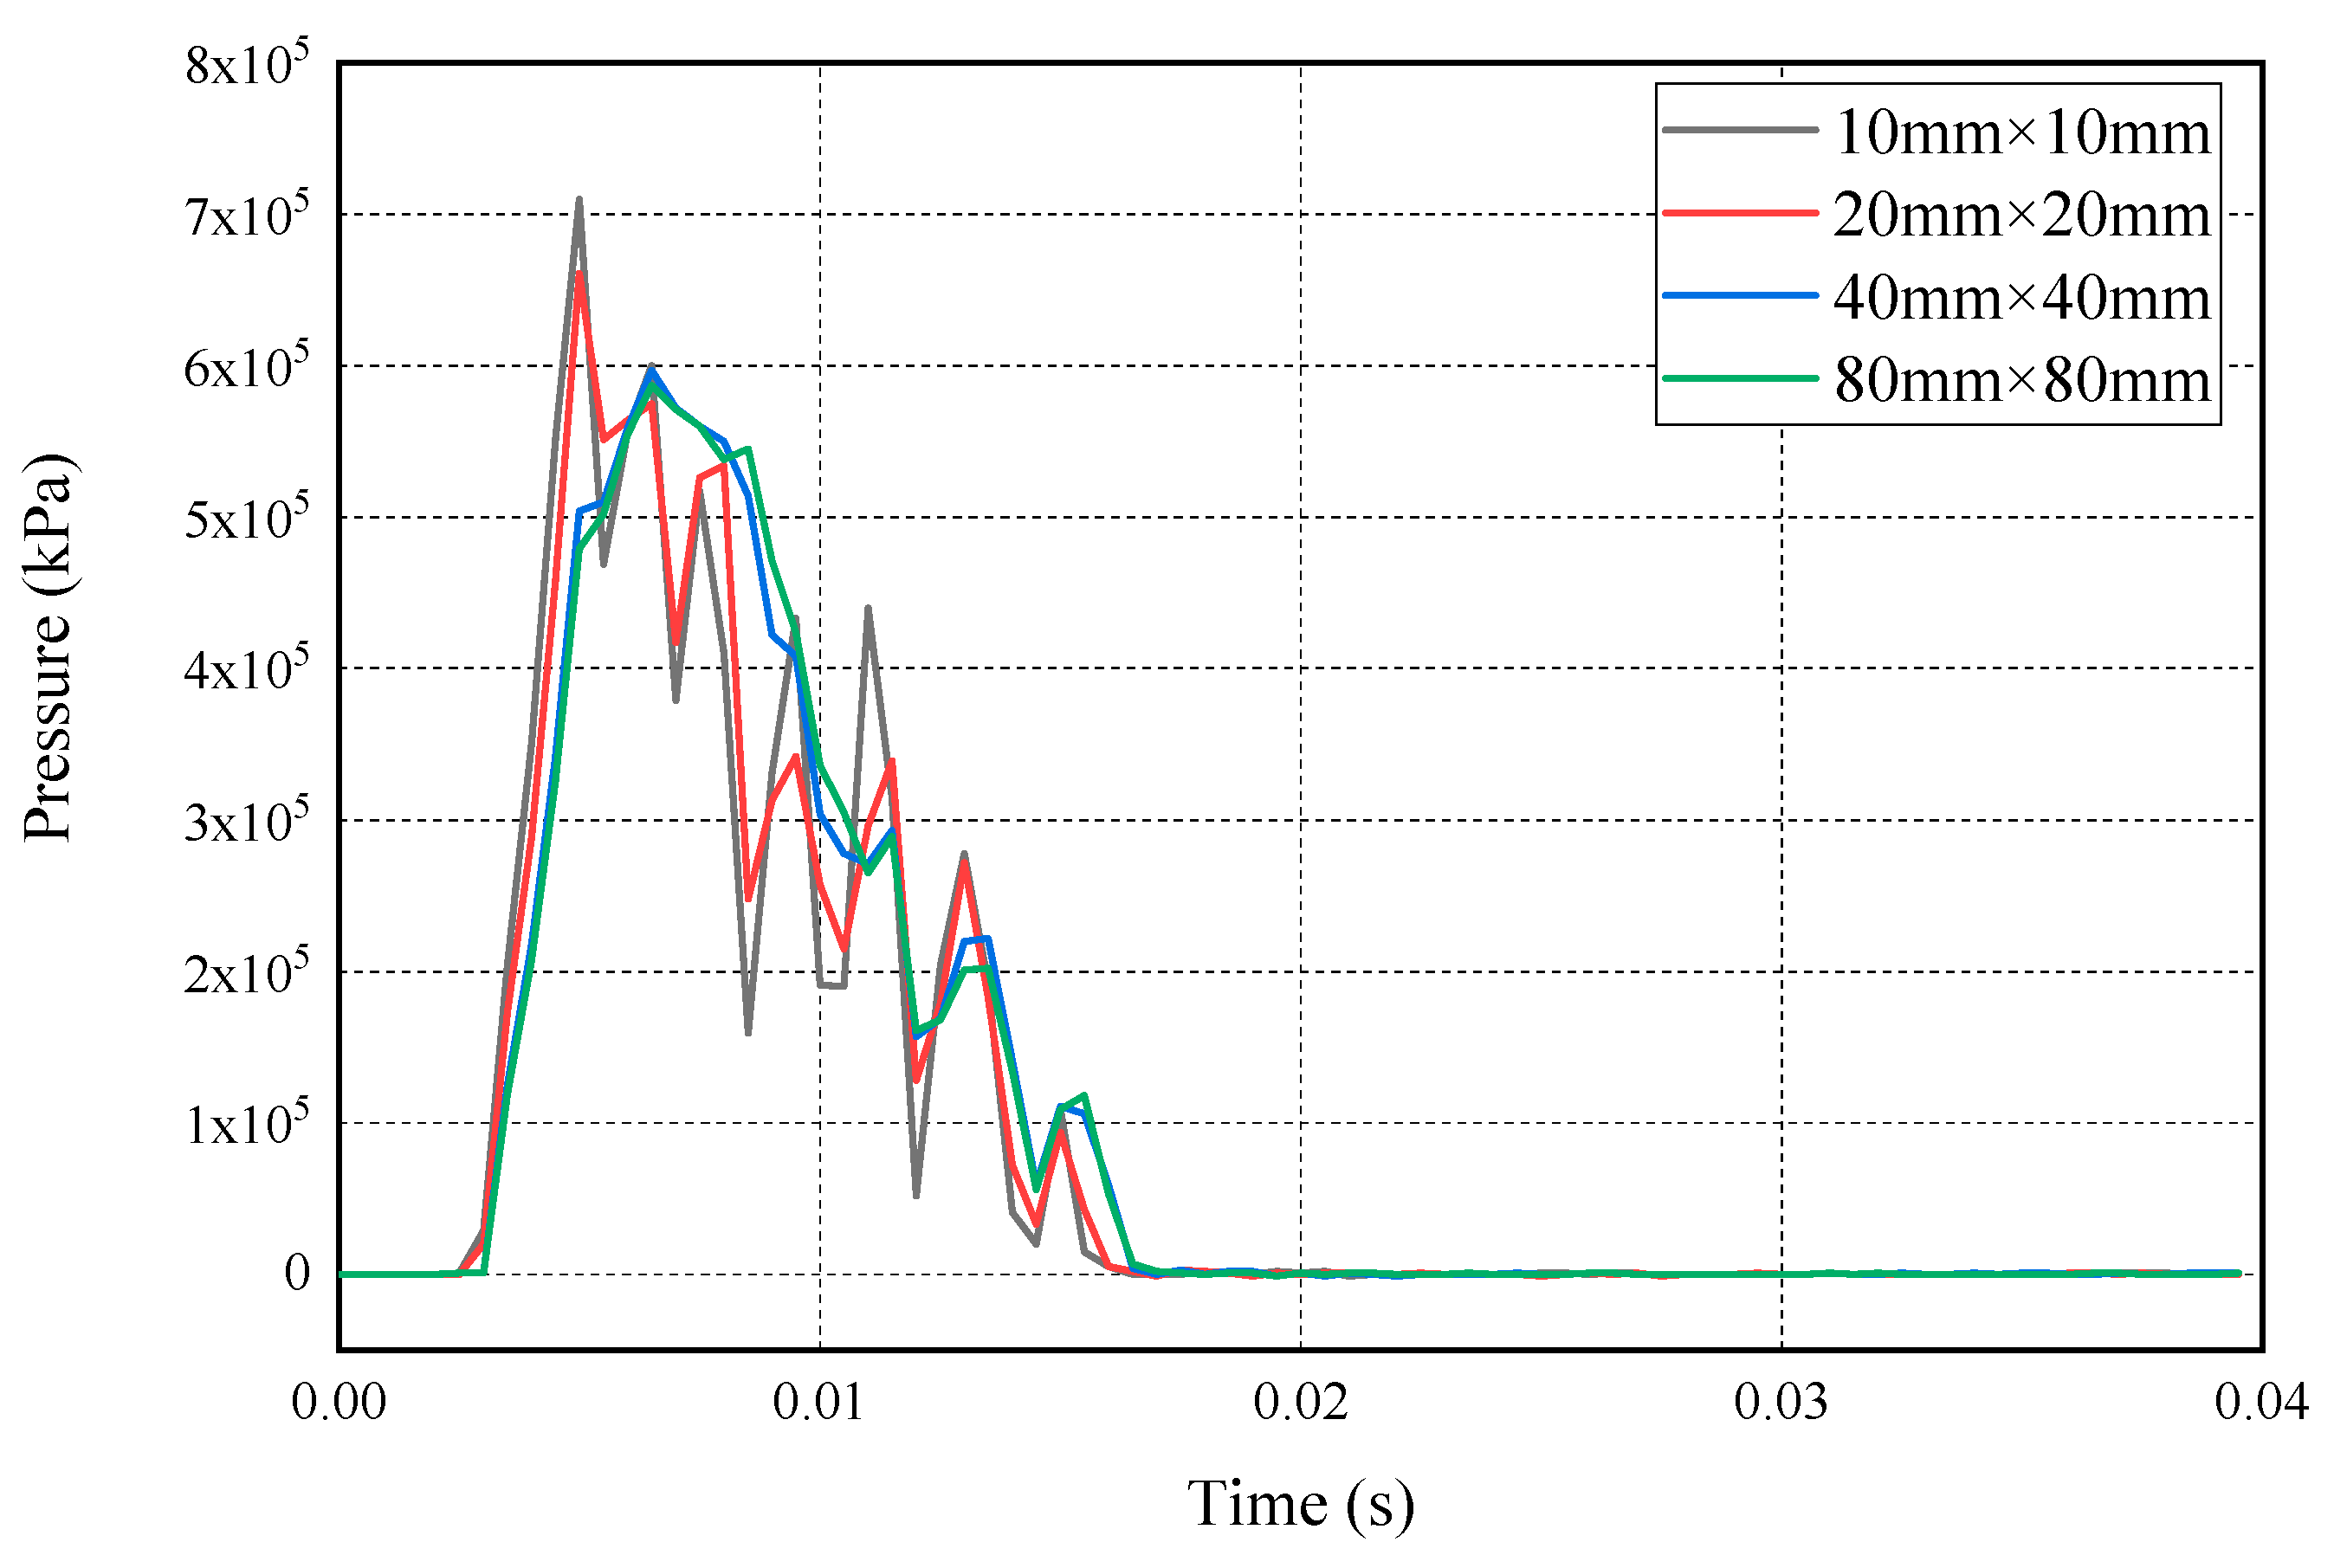
4.1. Convergence Study
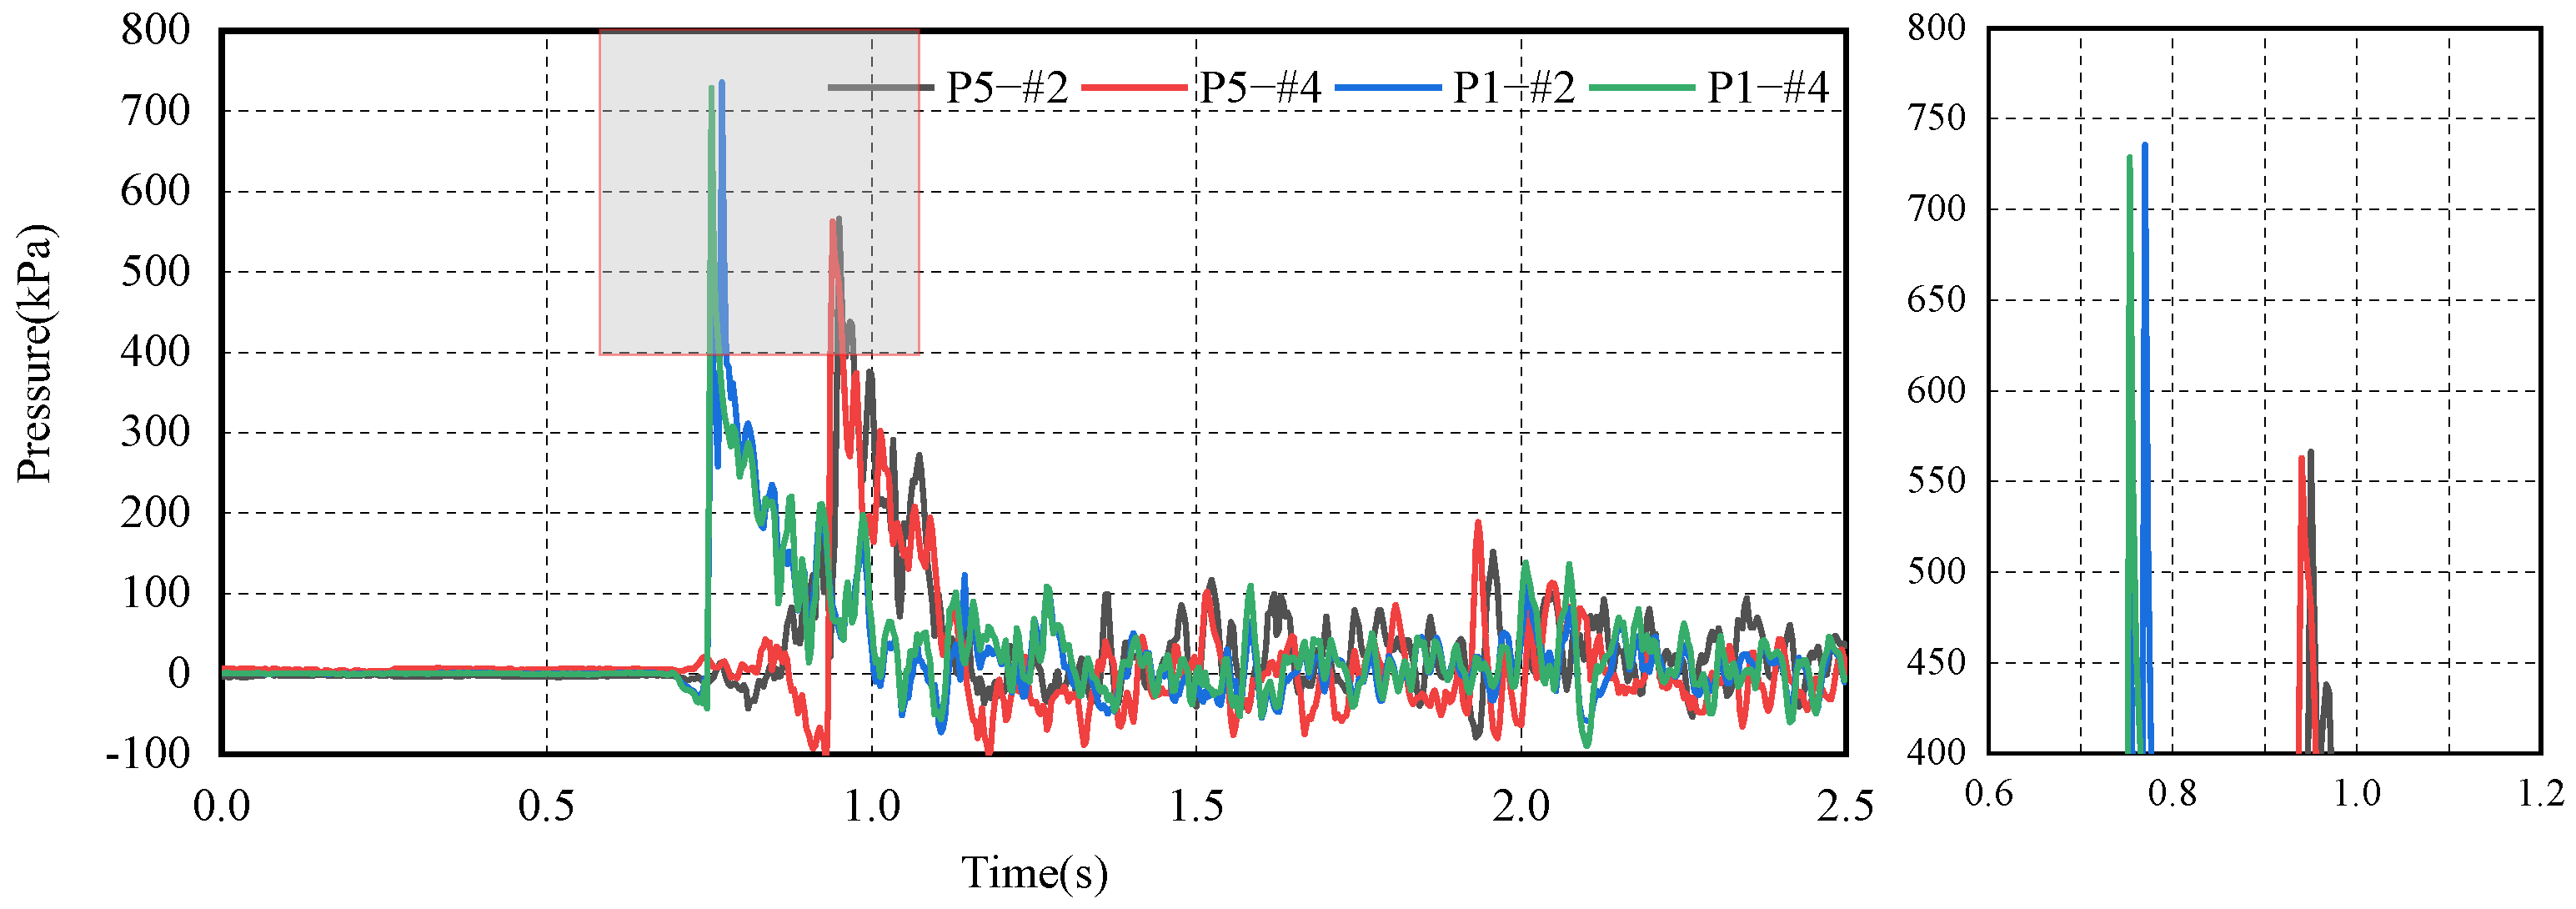
4.2. Symmetry Verification
4.3. Independence of the Different Models
5. Results and Discussion
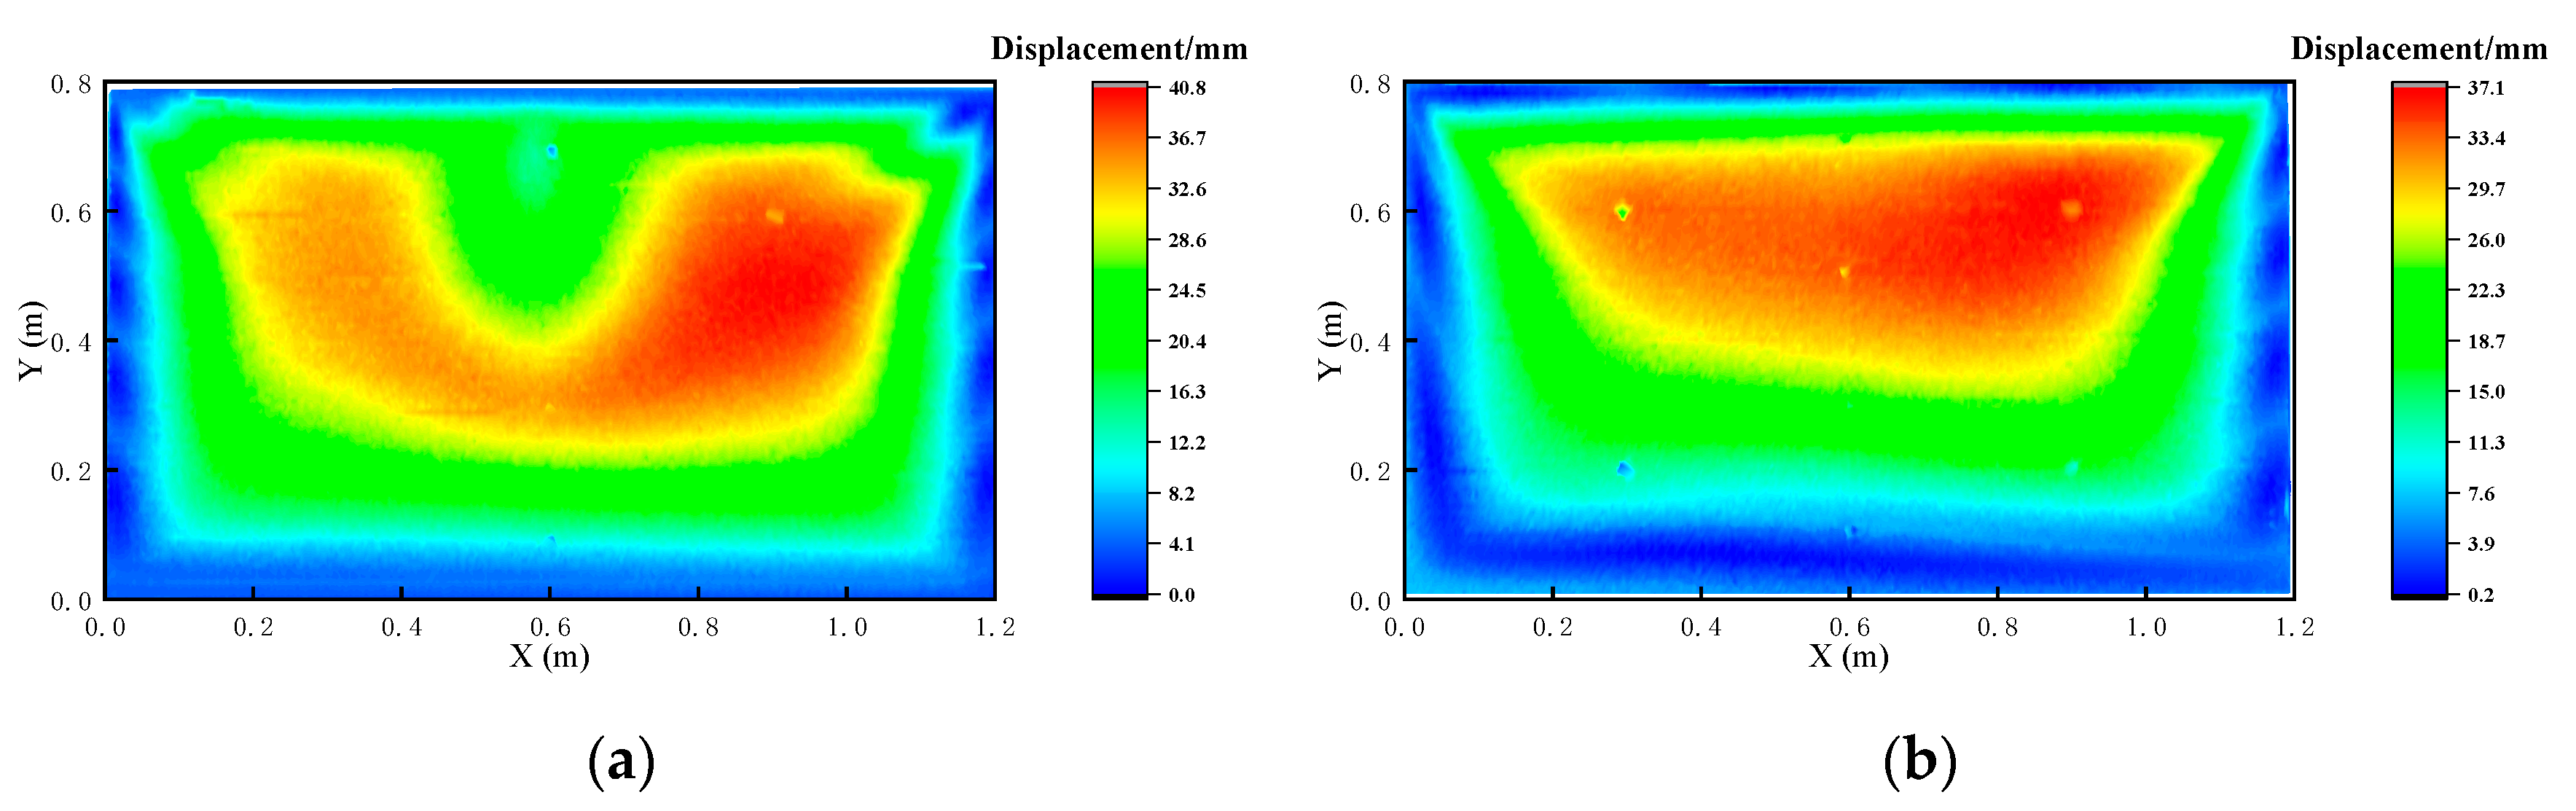
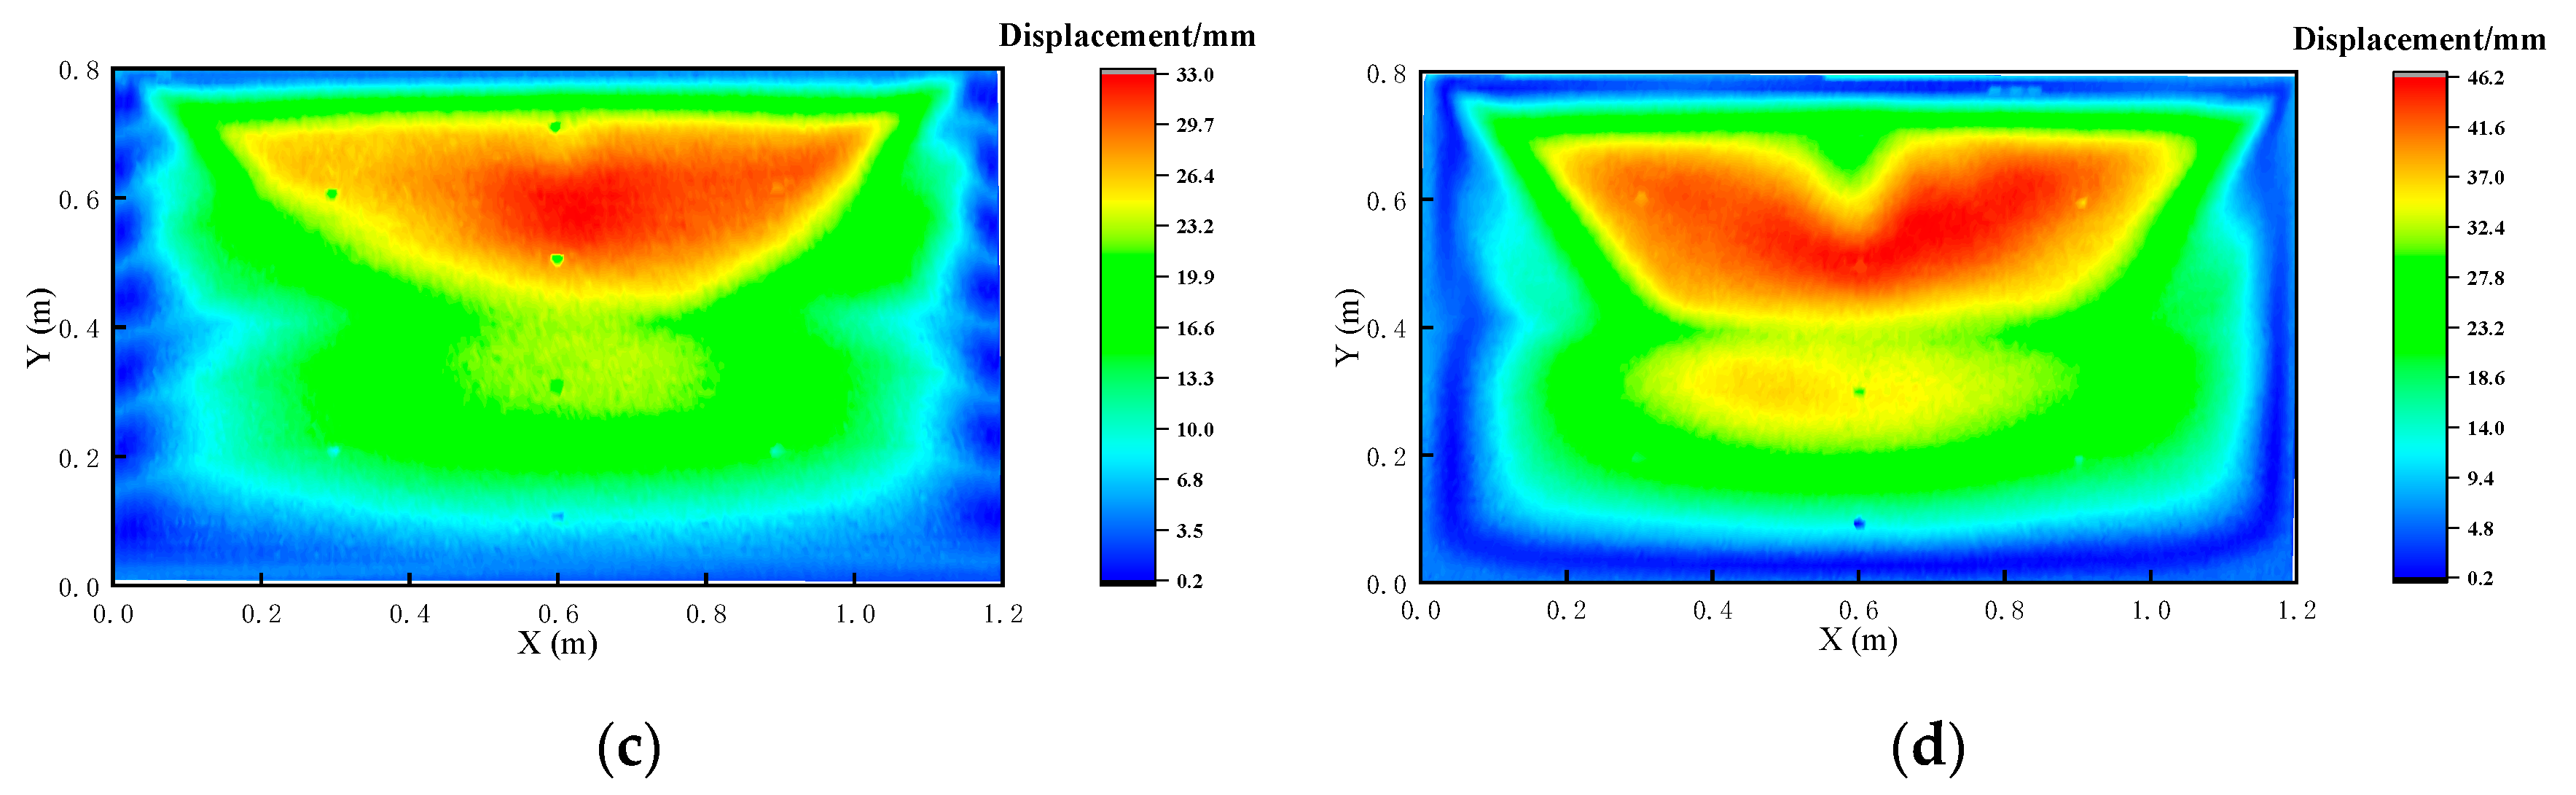
5.1. Distribution Pattern of Structural Strain
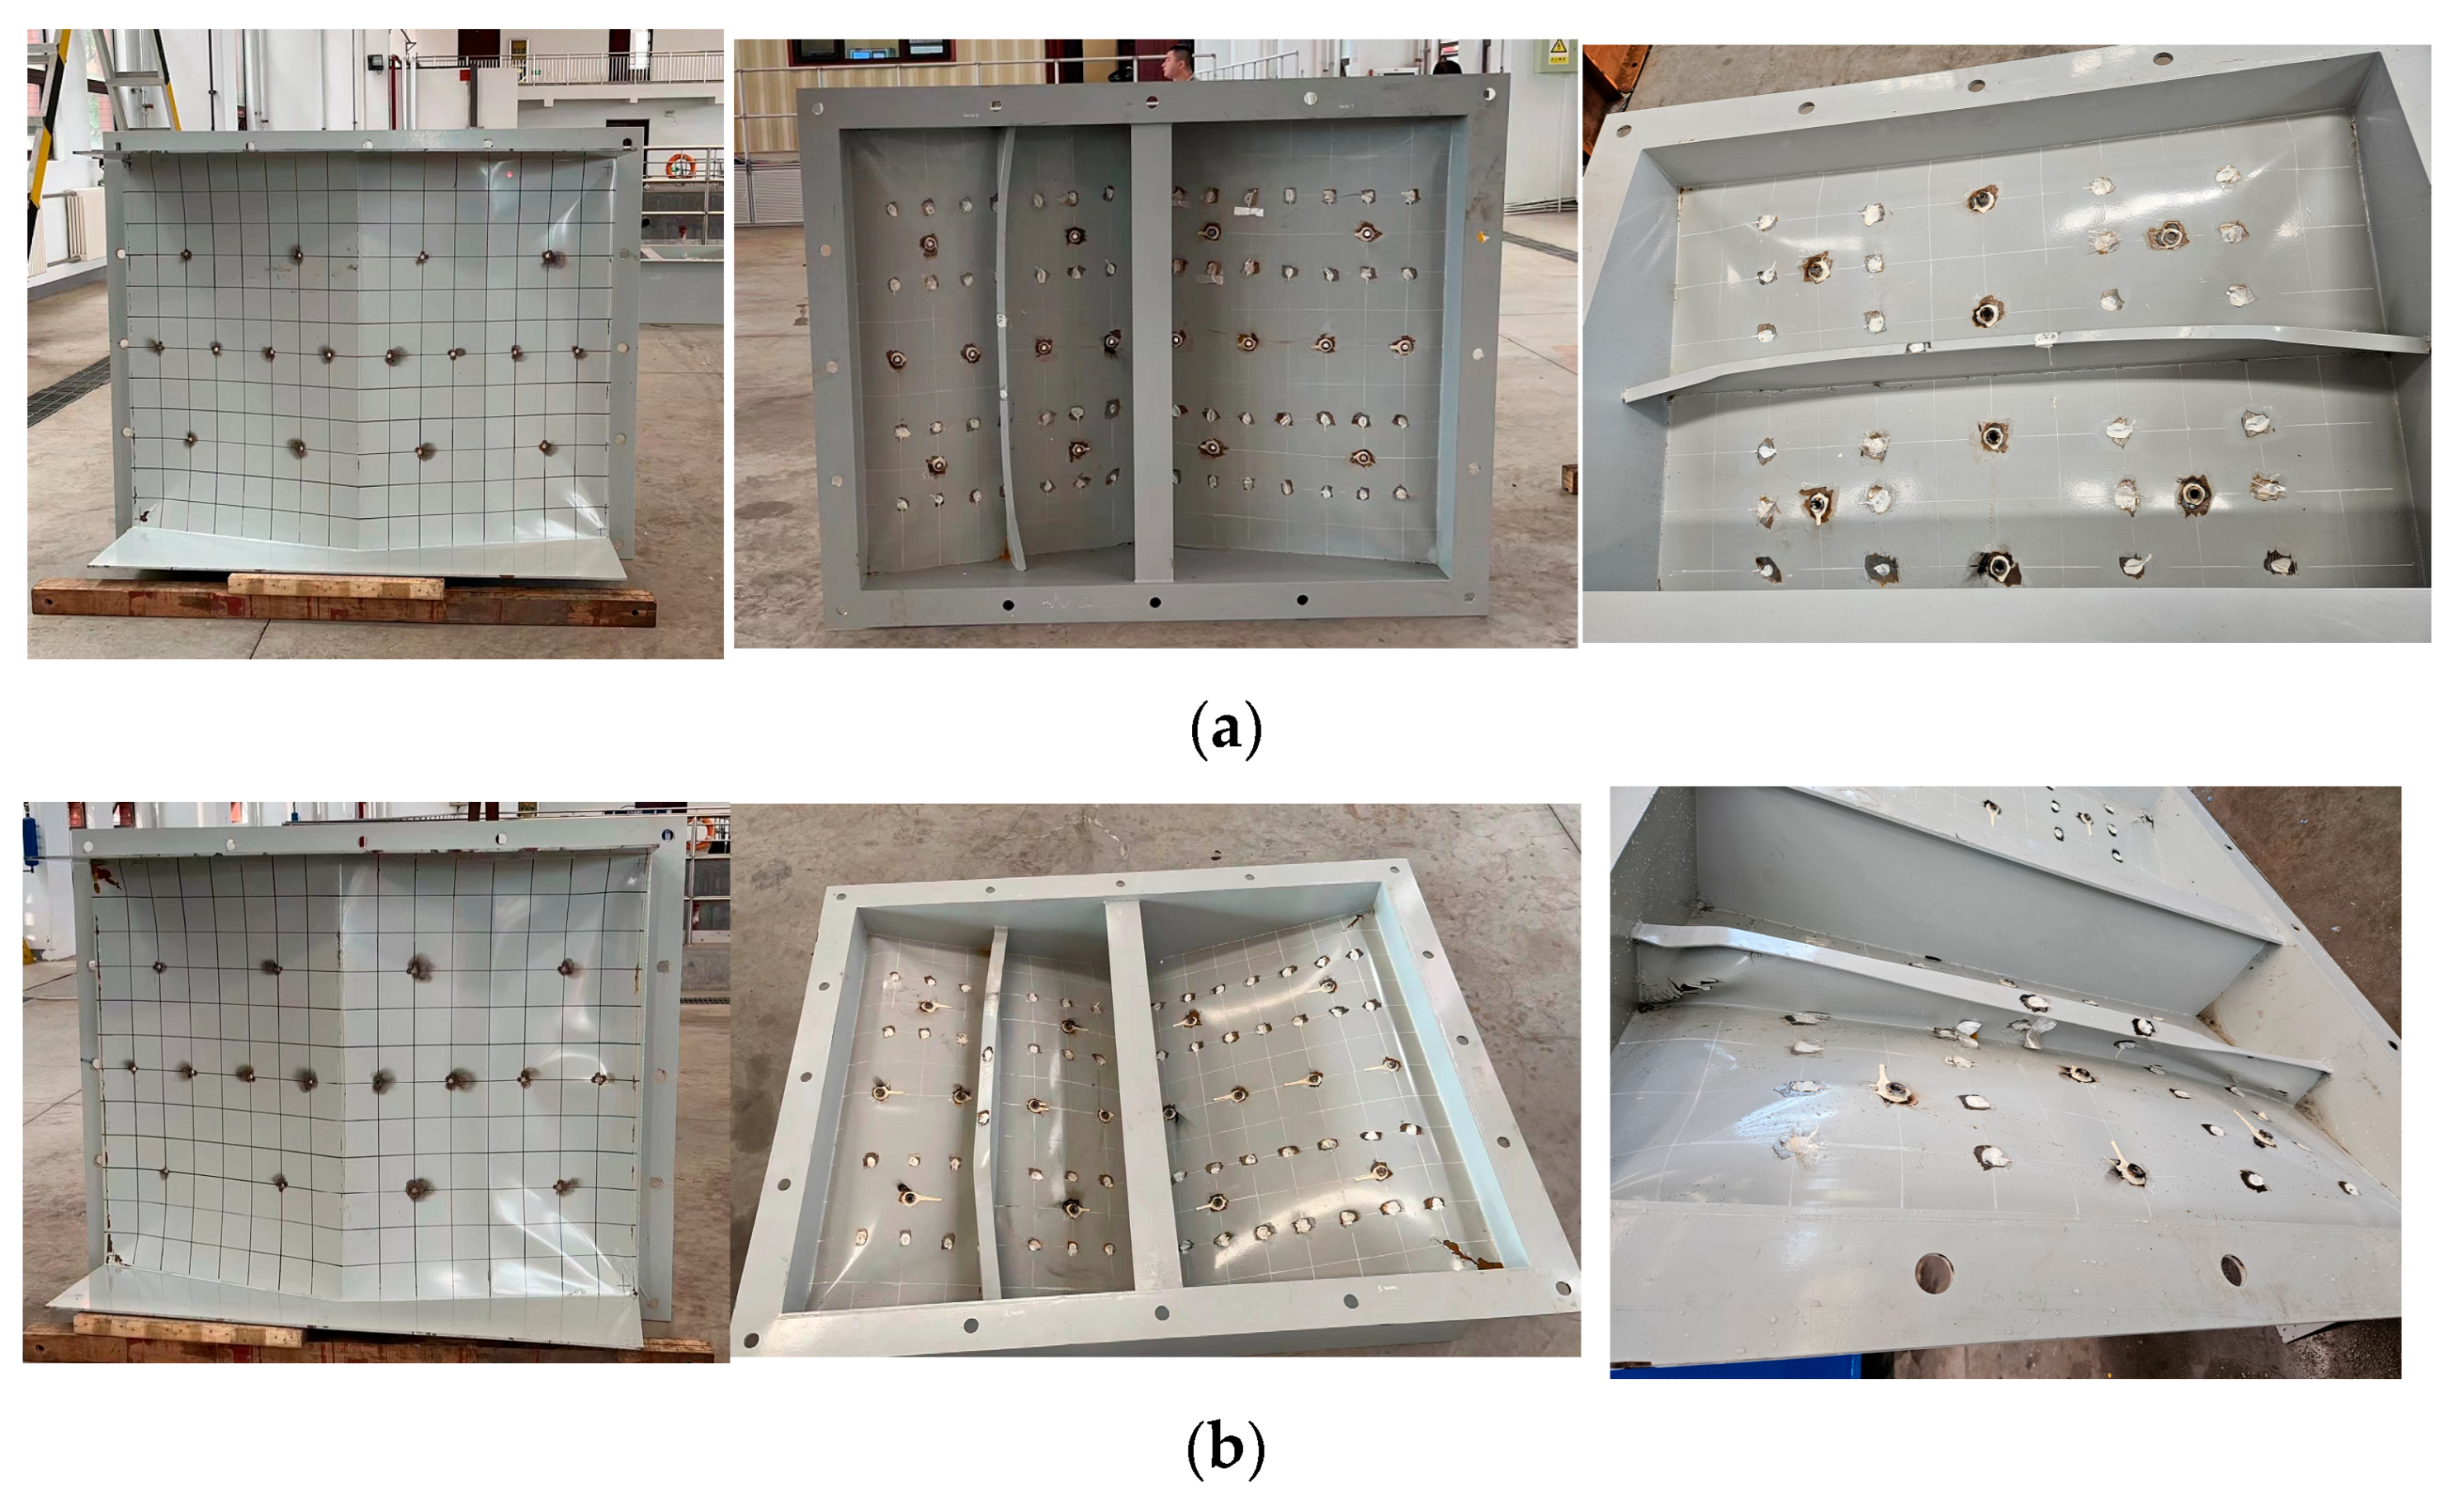
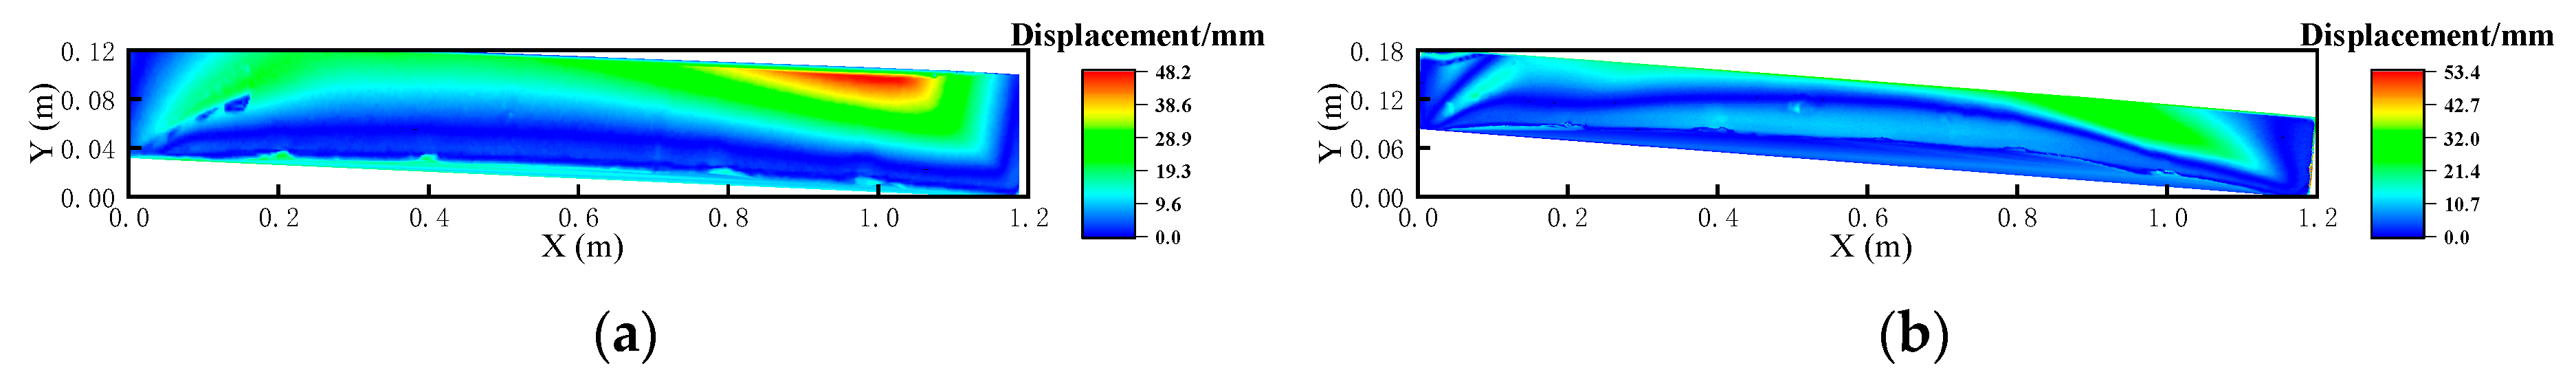
5.2. Analysis of Plastic Deformation of Stiffened Plates under Lateral Slamming Loads
6. Conclusions
- (1)
- The time distribution pattern of slamming pressure resembles a pulse load, with the pressure reaching its maximum at the moment of water entry. The spatial distribution of slamming pressure is related to the order of water entry. Points entering the water simultaneously at the same vertical height have similar peaks of slamming pressure, with earlier entry points experiencing higher peak pressures. Points entering later may have multiple peaks due to splashing water.
- (2)
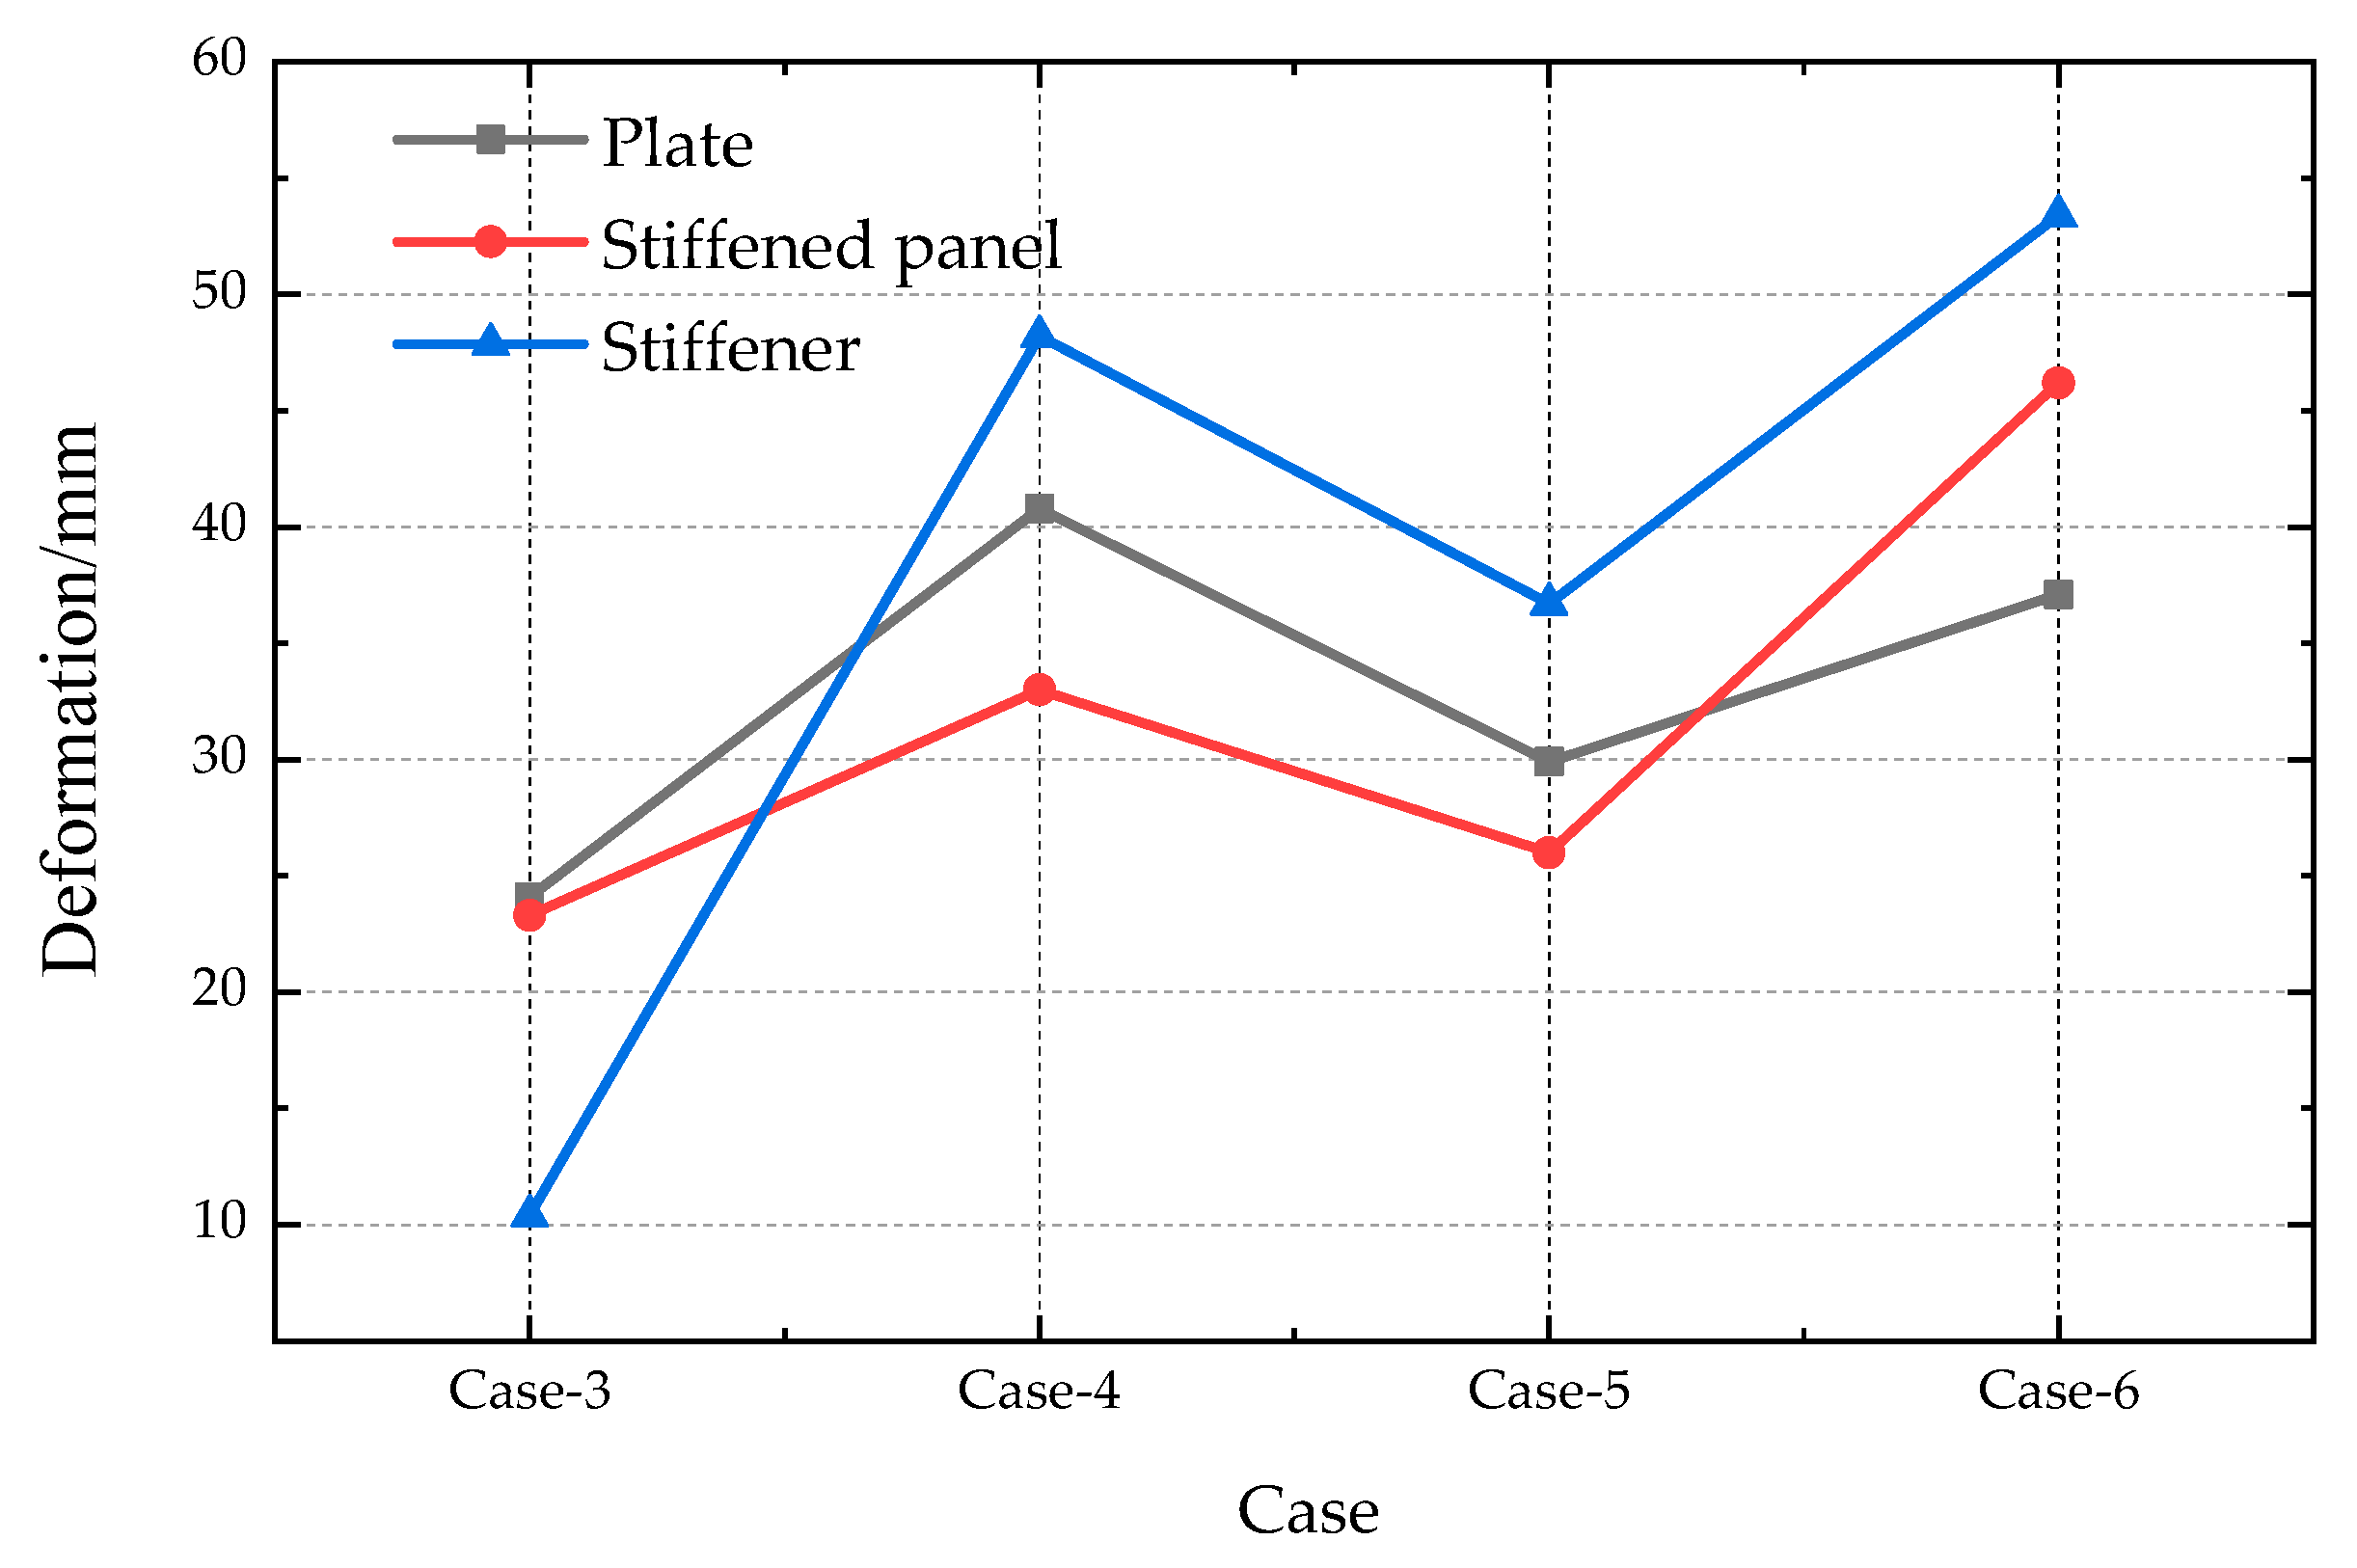
- The time series of microstrain is synchronized with the slamming pressure, and plastic deformation occurs in the structure. The spatial distribution shows that the plastic deformation on the stiffened panel is the highest.
- (3)
- Under slamming loads, the failure mode of the plate and stiffened plate grids involves the formation of plastic hinges along the plate edge diagonals, with concave deformation occurring in the middle of the plate grids. The failure mode of the stiffener involves the formation of plastic hinges at the ends (boundaries) first, followed by stiffener lateral deformation.
- (4)
- Stiffeners can enhance the ability of stiffened plates to resist plastic deformation under slamming loads, with T-section stiffeners providing stronger resistance to plastic deformation. Increasing the plate thickness can improve the ability to resist plastic deformation.
Author Contributions
Funding
Institutional Review Board Statement
Informed Consent Statement
Data Availability Statement
Conflicts of Interest
References
- AbuBakar, A.; Dow, R.S. Simulation of ship grounding damage using the finite element method. Int. J. Solids Struct. 2013, 50, 623–636. [Google Scholar] [CrossRef]
- Ehlers, S. The influence of the material relation on the accuracy of collision simulations. Mar. Struct. 2010, 23, 462–474. [Google Scholar] [CrossRef]
- Liu, B.; Pedersen, P.T.; Zhu, L.; Zhang, S. Review of experiments and calculation procedures for ship collision and grounding damage. Mar. Struct. 2018, 59, 105–121. [Google Scholar] [CrossRef]
- Howison, S.D.; Ockendon, J.R.; Wilson, S.K. Incompressible water entry problems at small deadrise angles. J. Fluid Mech. 1991, 222, 215–230. [Google Scholar] [CrossRef]
- Stenius, I.; Rosén, A.; Kuttenkeuler, J. Explicit FE-Modelling of Fluid-Structure Interaction in Hull-Water Impacts. Int. Shipbuild. Prog. 2006, 53, 103–121. [Google Scholar]
- Ren, H.; Yu, P.; Wang, Q.; Li, H. Dynamic response of the bow flare structure under slamming loads. In Proceedings of the 34th International Conference on Ocean, Offshore and Arctic Engineering (ASME 2015), St. John’s, NL, Canada, 31 May–5 June 2015. [Google Scholar]
- Iijima, K.; Fujikubo, M. Hydro-elastoplastic behaviour of VLFS under extreme vertical bending moment by segmented beam approach. Mar. Struct. 2018, 57, 1–17. [Google Scholar] [CrossRef]
- Yang, L.; Peng, Z.L.; Wang, D.Y. Experimental and numerical investigation of material failure criterion with high-strength hull steel under biaxial stress. Ocean Eng. 2018, 155, 24–41. [Google Scholar] [CrossRef]
- Yang, B.; Soares, C.G.; Wang, D.Y. Dynamic ultimate compressive strength of simply supported rectangular plates under impact loading. Mar. Struct. 2019, 66, 258–271. [Google Scholar] [CrossRef]
- Yang, B.; Wang, D. Buckling strength of rectangular plates with elastically restrained edges subjected to in-plane impact loading. Proc. Inst. Mech. Eng. Part C J. Mech. Eng. Sci. 2017, 231, 3743–3752. [Google Scholar] [CrossRef]
- Zhu, S.J.; Wu, M.K.; Moan, T. Experimental investigation of hull girder vibrations of a flexible backbone model in bending and torsion. Appl. Ocean Res. 2011, 33, 252–274. [Google Scholar] [CrossRef]
- Stenius, I.; Rosén, A.; Battley, M.; Allen, T. Experimental hydroelastic characterization of slamming loaded marine panels. Ocean Eng. 2013, 74, 1–15. [Google Scholar] [CrossRef]
- Chen, Z.Y.; Jiao, J.L.; Li, H. Time-domain numerical and segmented ship model experimental analyses of hydroelastic responses of a large container ship in oblique regular waves. Appl. Ocean Res. 2017, 67, 78–93. [Google Scholar] [CrossRef]
- Chen, Z.Y.; Gui, H.B. Research on Whipping and Springing Responses of Hull based on Different Experimental Method and Nonlinear Hydroelastic Time-domain Theory. J. Ship Mech. 2017, 21, 1143–1158. [Google Scholar]
- Luo, H.; Liu, X.; Dong, D.; Zhao, Z.; Ji, H.; Gao, Y.; Lin, W. Experimental investigation of water impact of one free-drop wedge with stiffened aluminum panels. Chin. J. Hydrodyn. 2014, 29, 460–468. [Google Scholar]
- Si, H.L.; Zhao, N.; Hu, J.J. Experimental study of slamming loads on ship bow during free water entry. J. Ship Mech. 2020, 24, 445–455. [Google Scholar]
- Mo, L.X.; Wang, H.; Jiang, C.X.; Xu, C. Study on dropping test of wedge grillages with various types of stiffeness. J. Ship Mech. 2011, 15, 394–401. [Google Scholar]
- Chen, X.P.; Li, J.W.; Wang, H.; Qi, E.R. Experiments and numerical investigation of water entry of large-scale steel wedge models. J. Ship Mech. 2012, 16, 1152–1163. [Google Scholar]
- Wang, Q.; Yu, P.Y.; Fan, G.J.; Li, G.Z. Experimental drop test investigation into cross deck slamming loads on a trimaran. Ocean Eng. 2021, 240, 109999. [Google Scholar] [CrossRef]
- Li, H.; Deng, B.L.; Zou, J.; Dong, C.R.; Liu, C.L.; Liu, P.L. Experimental free-drop test investigation into wet-deck slamming loads on a generic trimaran section considering the influence of main hull profile. Ocean Eng. 2021, 242, 110114. [Google Scholar] [CrossRef]
- Duan, W.Y.; Liu, J.Y.; Liao, K.P.; Ma, S. Experimental study of slamming pressure for a trimaran section with different drop heights and heel angles. Ocean Eng. 2022, 263, 112400. [Google Scholar] [CrossRef]
- Stavovy, A.B.; Chuang, S.L. Analititcal determination of slamming pressure for hign speed vehicals in waves. J. Ship Res. 1976, 20, 190–198. [Google Scholar] [CrossRef]
- Ochi, M.D.; Bonilla-Norat, J. Pressure-Velocity Relationship in Impact of a Ship Model Dropped onto the Water Surface and in Slamming in Waves; AD-709071; National Academy of Sciences: Washington, DC, USA, 1970. [Google Scholar]
- Stern, F.; Wilson, R.V.; Coleman, H.W.; Paterson, E.G. Comprehensive approach to verification and validation of CFD simulations—Part 1: Methodology and procedures. J. Fluids Eng. 2001, 123, 793–802. [Google Scholar] [CrossRef]


| No. | Length (mm) | Width (mm) | Thickness (mm) | Number of Stiffeners | Height of Web (mm) | Thickness of Web (mm) | Width of Plate (mm) | Thickness of Plate (mm) |
|---|---|---|---|---|---|---|---|---|
| #1 (Non-stiffened) | 1200 | 800 | 2 | 0 | -- | -- | -- | -- |
| #2 (Non-stiffened) | 1200 | 800 | 3 | 0 | -- | -- | -- | -- |
| #3 (Angled steel) | 1200 | 800 | 2 | 1 | 100 | 2 | 20 | 3 |
| #4 (T-section stiffener) | 1200 | 800 | 2 | 1 | 100 | 2 | 40 | 3 |
| Model | Case | Water Entry Angle (deg) | Drop Height (m) | Water Entry Velocity (m/s) |
|---|---|---|---|---|
| 1 | 1 | 15 | 1.00 | 4.43 |
| 2 | 15 | 1.50 | 5.42 | |
| 3 | 15 | 2.50 | 7.00 | |
| 4 (Structure failure) | 15 | 5.10 | 10.00 | |
| 2 | 5 | 15 | 5.10 | 10.00 |
| 6 (Structure failure) | 15 | 7.34 | 12.00 |
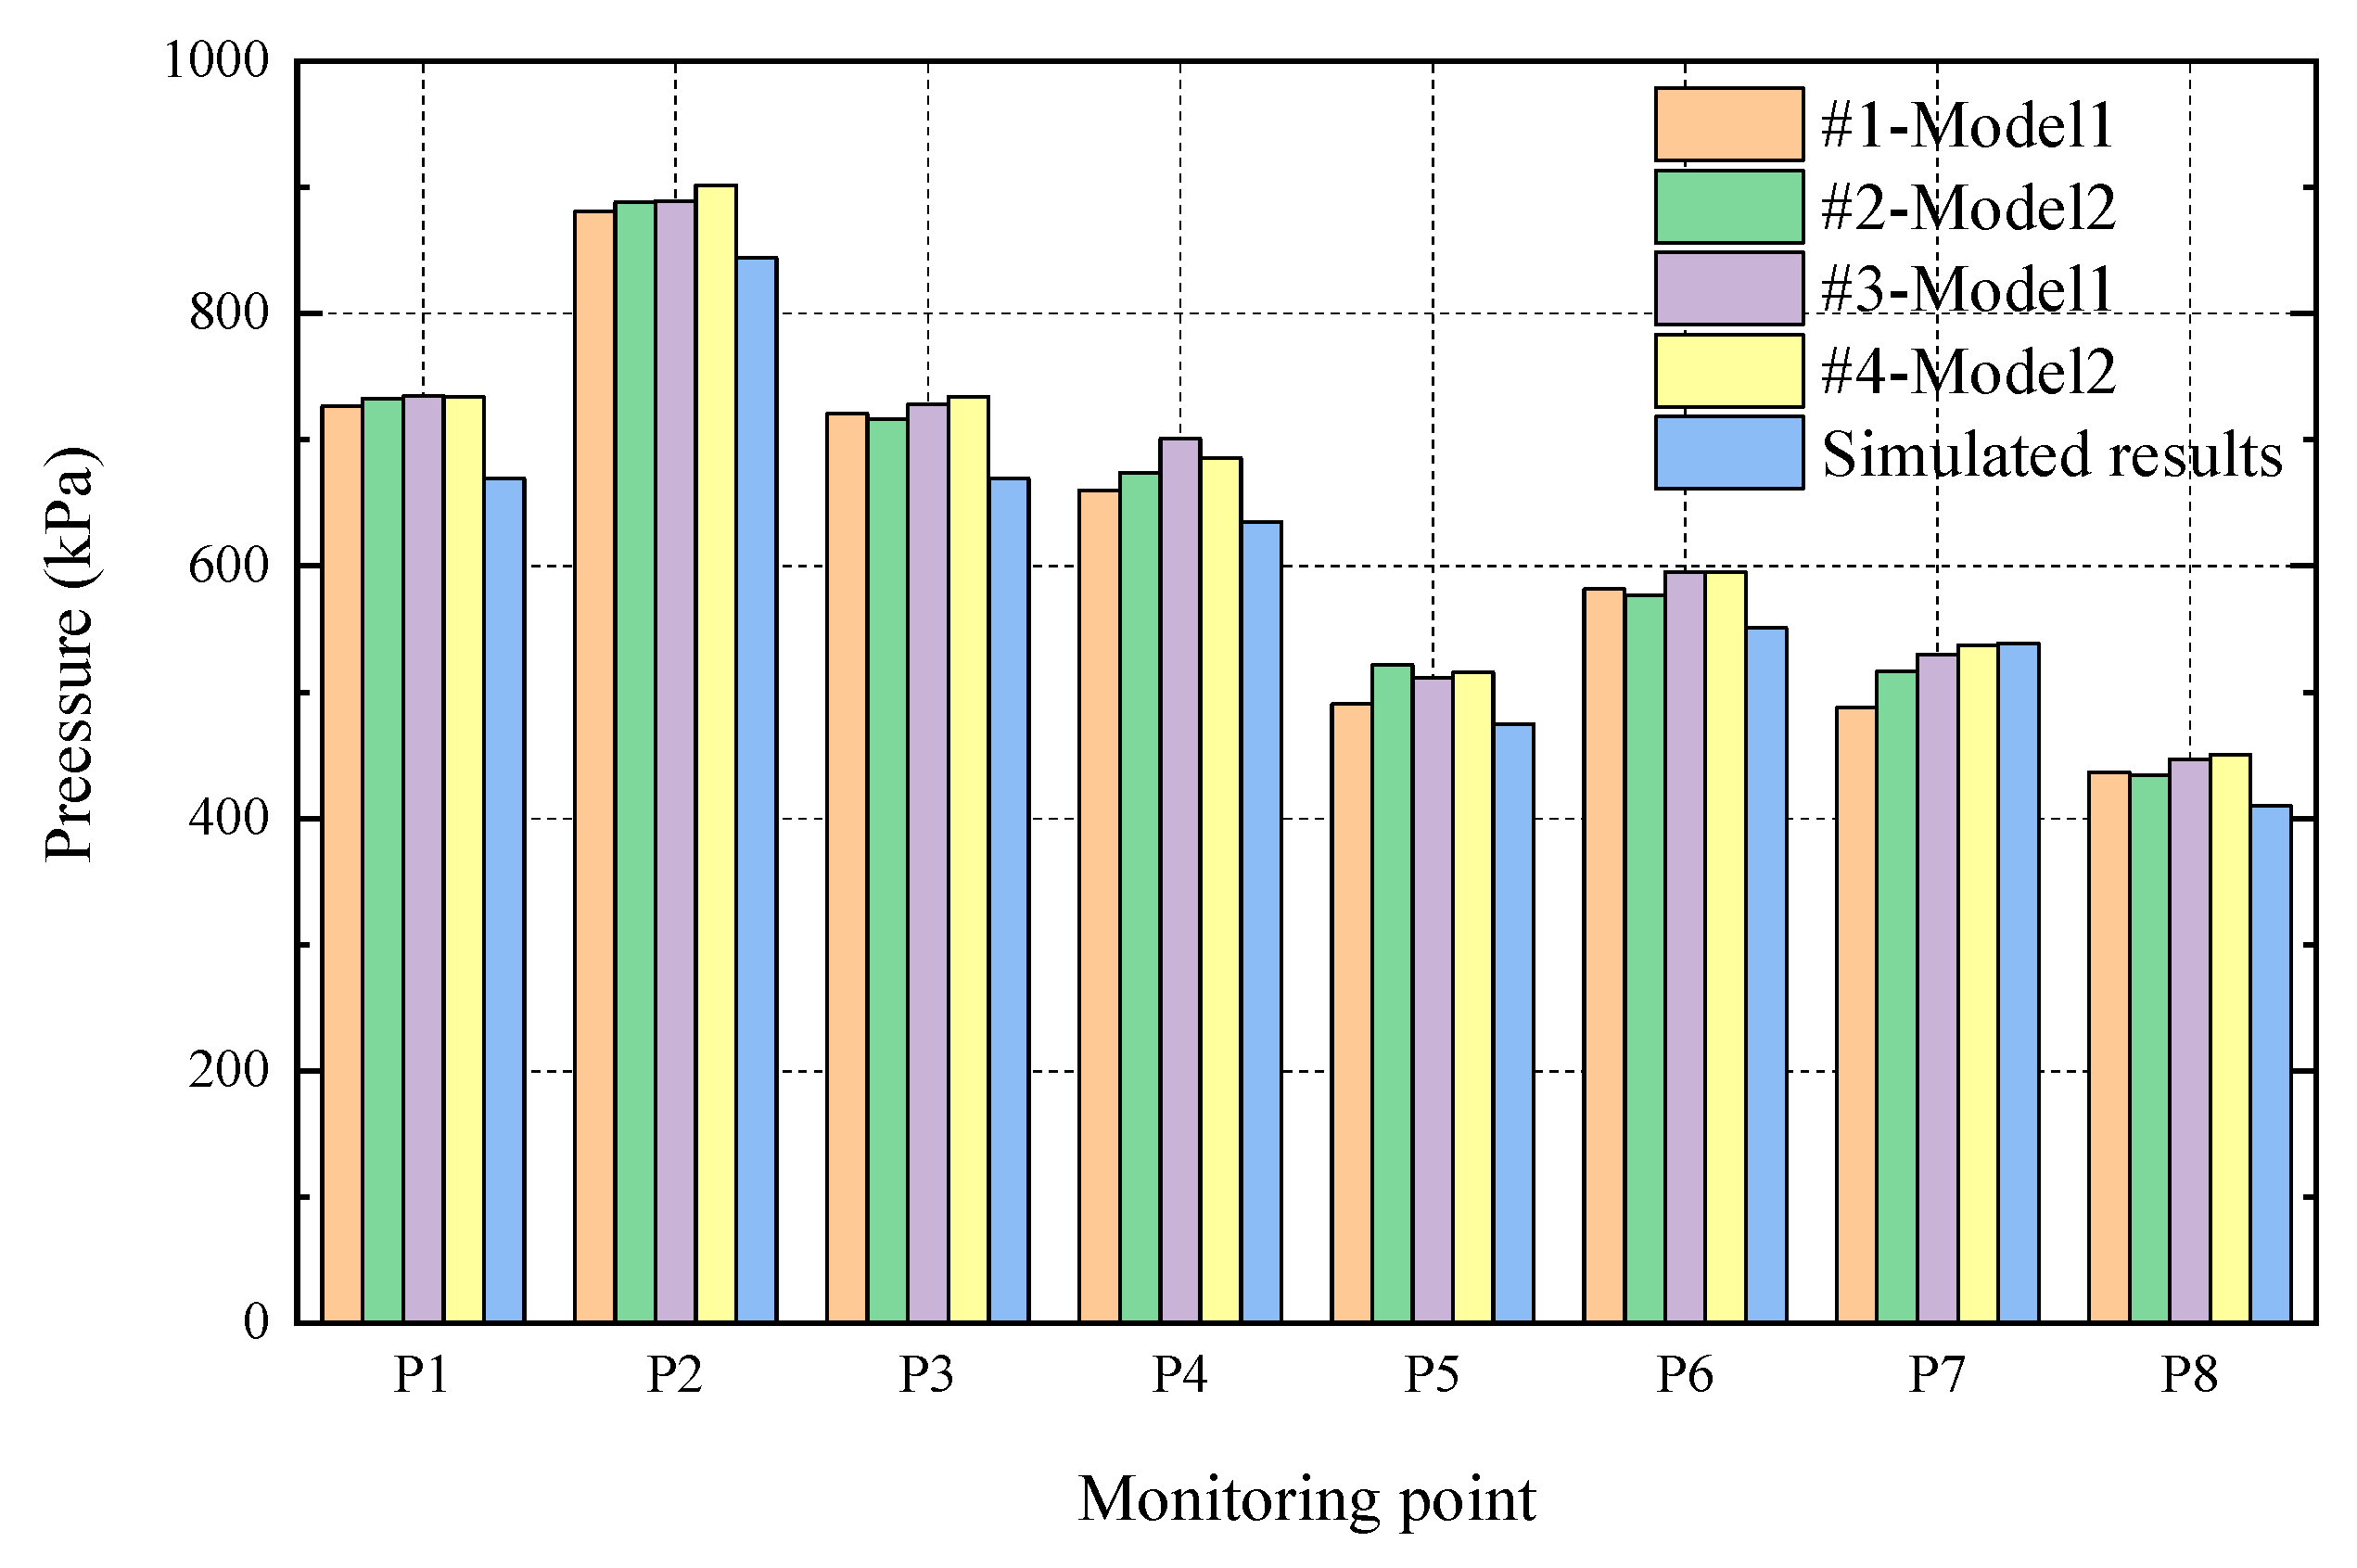
| Point | #1-Model 1 | #2-Model 2 | #3-Model 1 | #4-Model 2 | Simulations | Deviation 1 | Deviation 2 | Deviation 3 | Deviation 4 |
|---|---|---|---|---|---|---|---|---|---|
| P1 | 726.28 | 732.76 | 734.53 | 733.76 | 669.00 | 8.56% | 9.53% | 9.79% | 9.68% |
| P2 | 880.72 | 888.01 | 889.00 | 901.84 | 844.00 | 4.35% | 5.21% | 5.33% | 6.85% |
| P3 | 720.69 | 716.19 | 727.97 | 734.07 | 669.00 | 7.73% | 7.05% | 8.82% | 9.73% |
| P4 | 659.85 | 673.92 | 700.80 | 685.21 | 635.00 | 3.91% | 6.13% | 10.36% | 7.91% |
| P5 | 490.66 | 521.66 | 511.55 | 515.64 | 475.00 | 3.30% | 9.82% | 7.69% | 8.56% |
| P6 | 581.92 | 576.74 | 595.45 | 595.25 | 551.00 | 5.61% | 4.67% | 8.07% | 8.03% |
| P7 | 487.62 | 516.41 | 529.82 | 537.20 | 539.00 | 9.53% | 4.19% | 1.70% | 0.33% |
| P8 | 436.65 | 434.39 | 446.93 | 450.70 | 410.00 | 6.50% | 5.95% | 9.01% | 9.93% |
Disclaimer/Publisher’s Note: The statements, opinions and data contained in all publications are solely those of the individual author(s) and contributor(s) and not of MDPI and/or the editor(s). MDPI and/or the editor(s) disclaim responsibility for any injury to people or property resulting from any ideas, methods, instructions or products referred to in the content. |
© 2024 by the authors. Licensee MDPI, Basel, Switzerland. This article is an open access article distributed under the terms and conditions of the Creative Commons Attribution (CC BY) license (https://creativecommons.org/licenses/by/4.0/).
Share and Cite
Xia, J.; Chen, Z.; Zhao, N.; Zhao, W.; Tang, Q.; Cai, S. Free-Drop Experimental and Simulation Study on the Ultimate Bearing Capacity of Stiffened Plates with Different Stiffnesses under Slamming Loads. J. Mar. Sci. Eng. 2024, 12, 1291. https://doi.org/10.3390/jmse12081291
Xia J, Chen Z, Zhao N, Zhao W, Tang Q, Cai S. Free-Drop Experimental and Simulation Study on the Ultimate Bearing Capacity of Stiffened Plates with Different Stiffnesses under Slamming Loads. Journal of Marine Science and Engineering. 2024; 12(8):1291. https://doi.org/10.3390/jmse12081291
Chicago/Turabian StyleXia, Jinsong, Zhanyang Chen, Nan Zhao, Weidong Zhao, Qin Tang, and Shijian Cai. 2024. "Free-Drop Experimental and Simulation Study on the Ultimate Bearing Capacity of Stiffened Plates with Different Stiffnesses under Slamming Loads" Journal of Marine Science and Engineering 12, no. 8: 1291. https://doi.org/10.3390/jmse12081291
APA StyleXia, J., Chen, Z., Zhao, N., Zhao, W., Tang, Q., & Cai, S. (2024). Free-Drop Experimental and Simulation Study on the Ultimate Bearing Capacity of Stiffened Plates with Different Stiffnesses under Slamming Loads. Journal of Marine Science and Engineering, 12(8), 1291. https://doi.org/10.3390/jmse12081291