Beach Nourishment Protection against Storms for Contrasting Backshore Typologies


Abstract
:1. Introduction
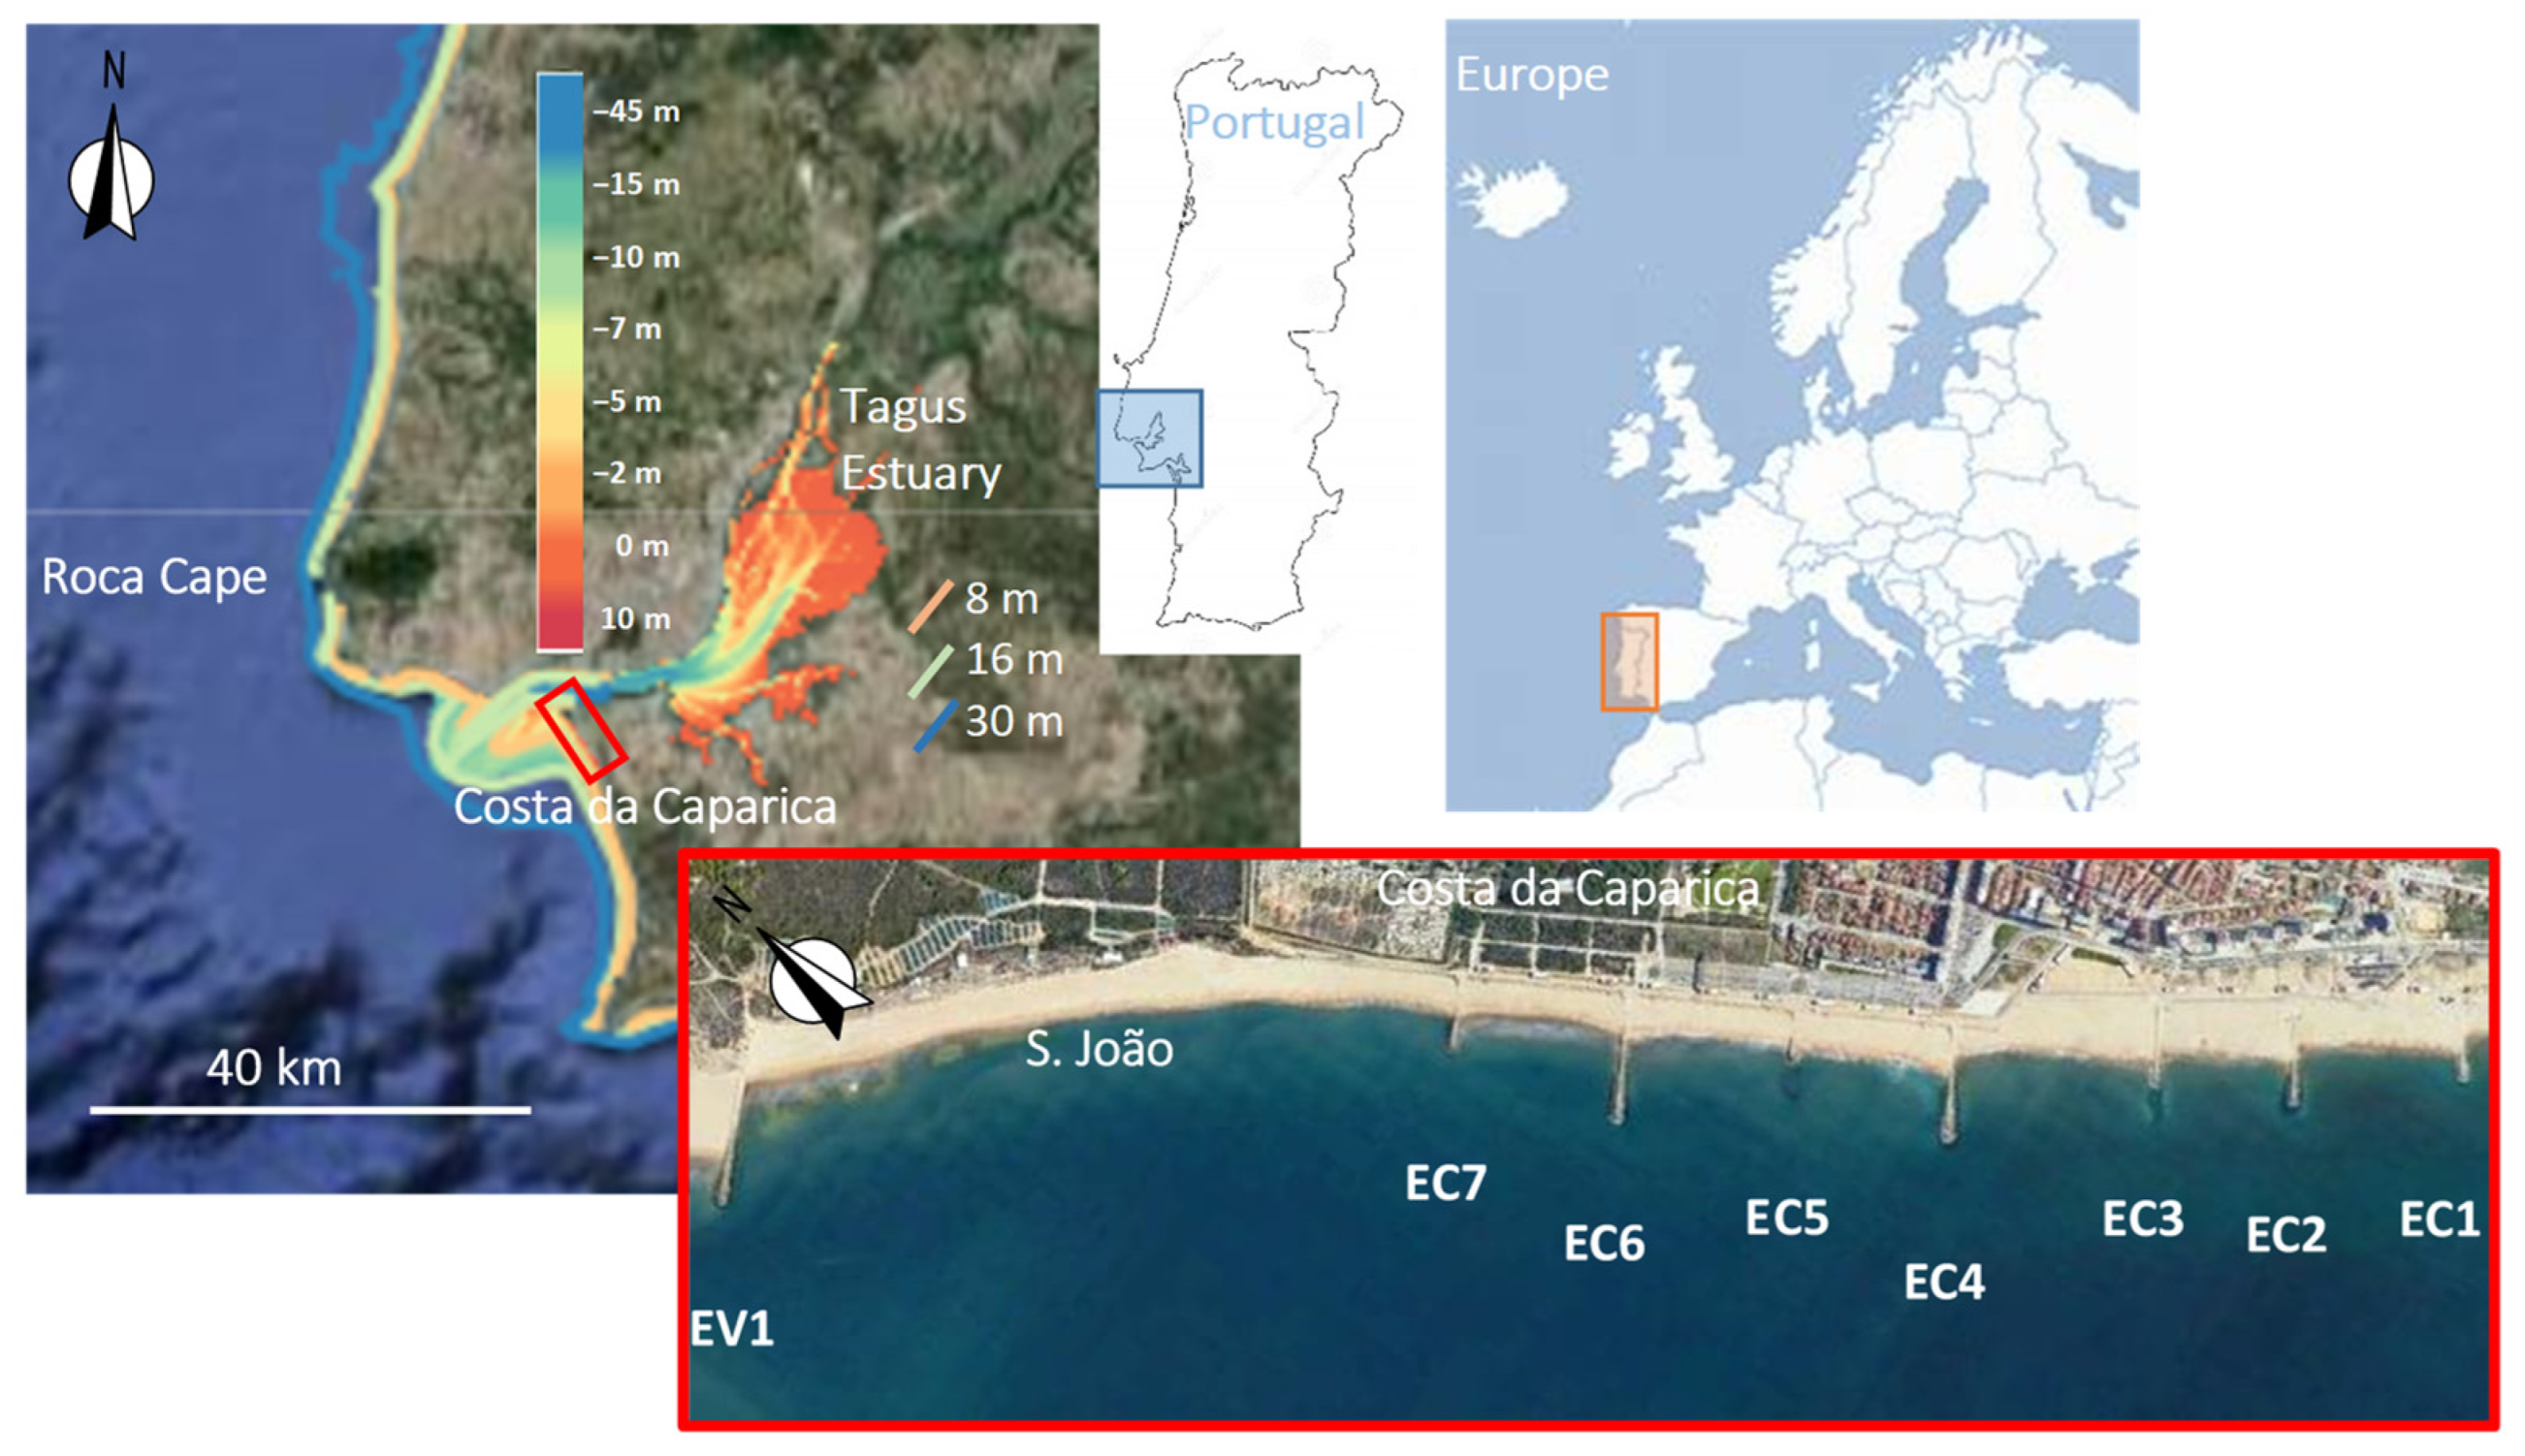
2. Study Site
3. Materials and Methods
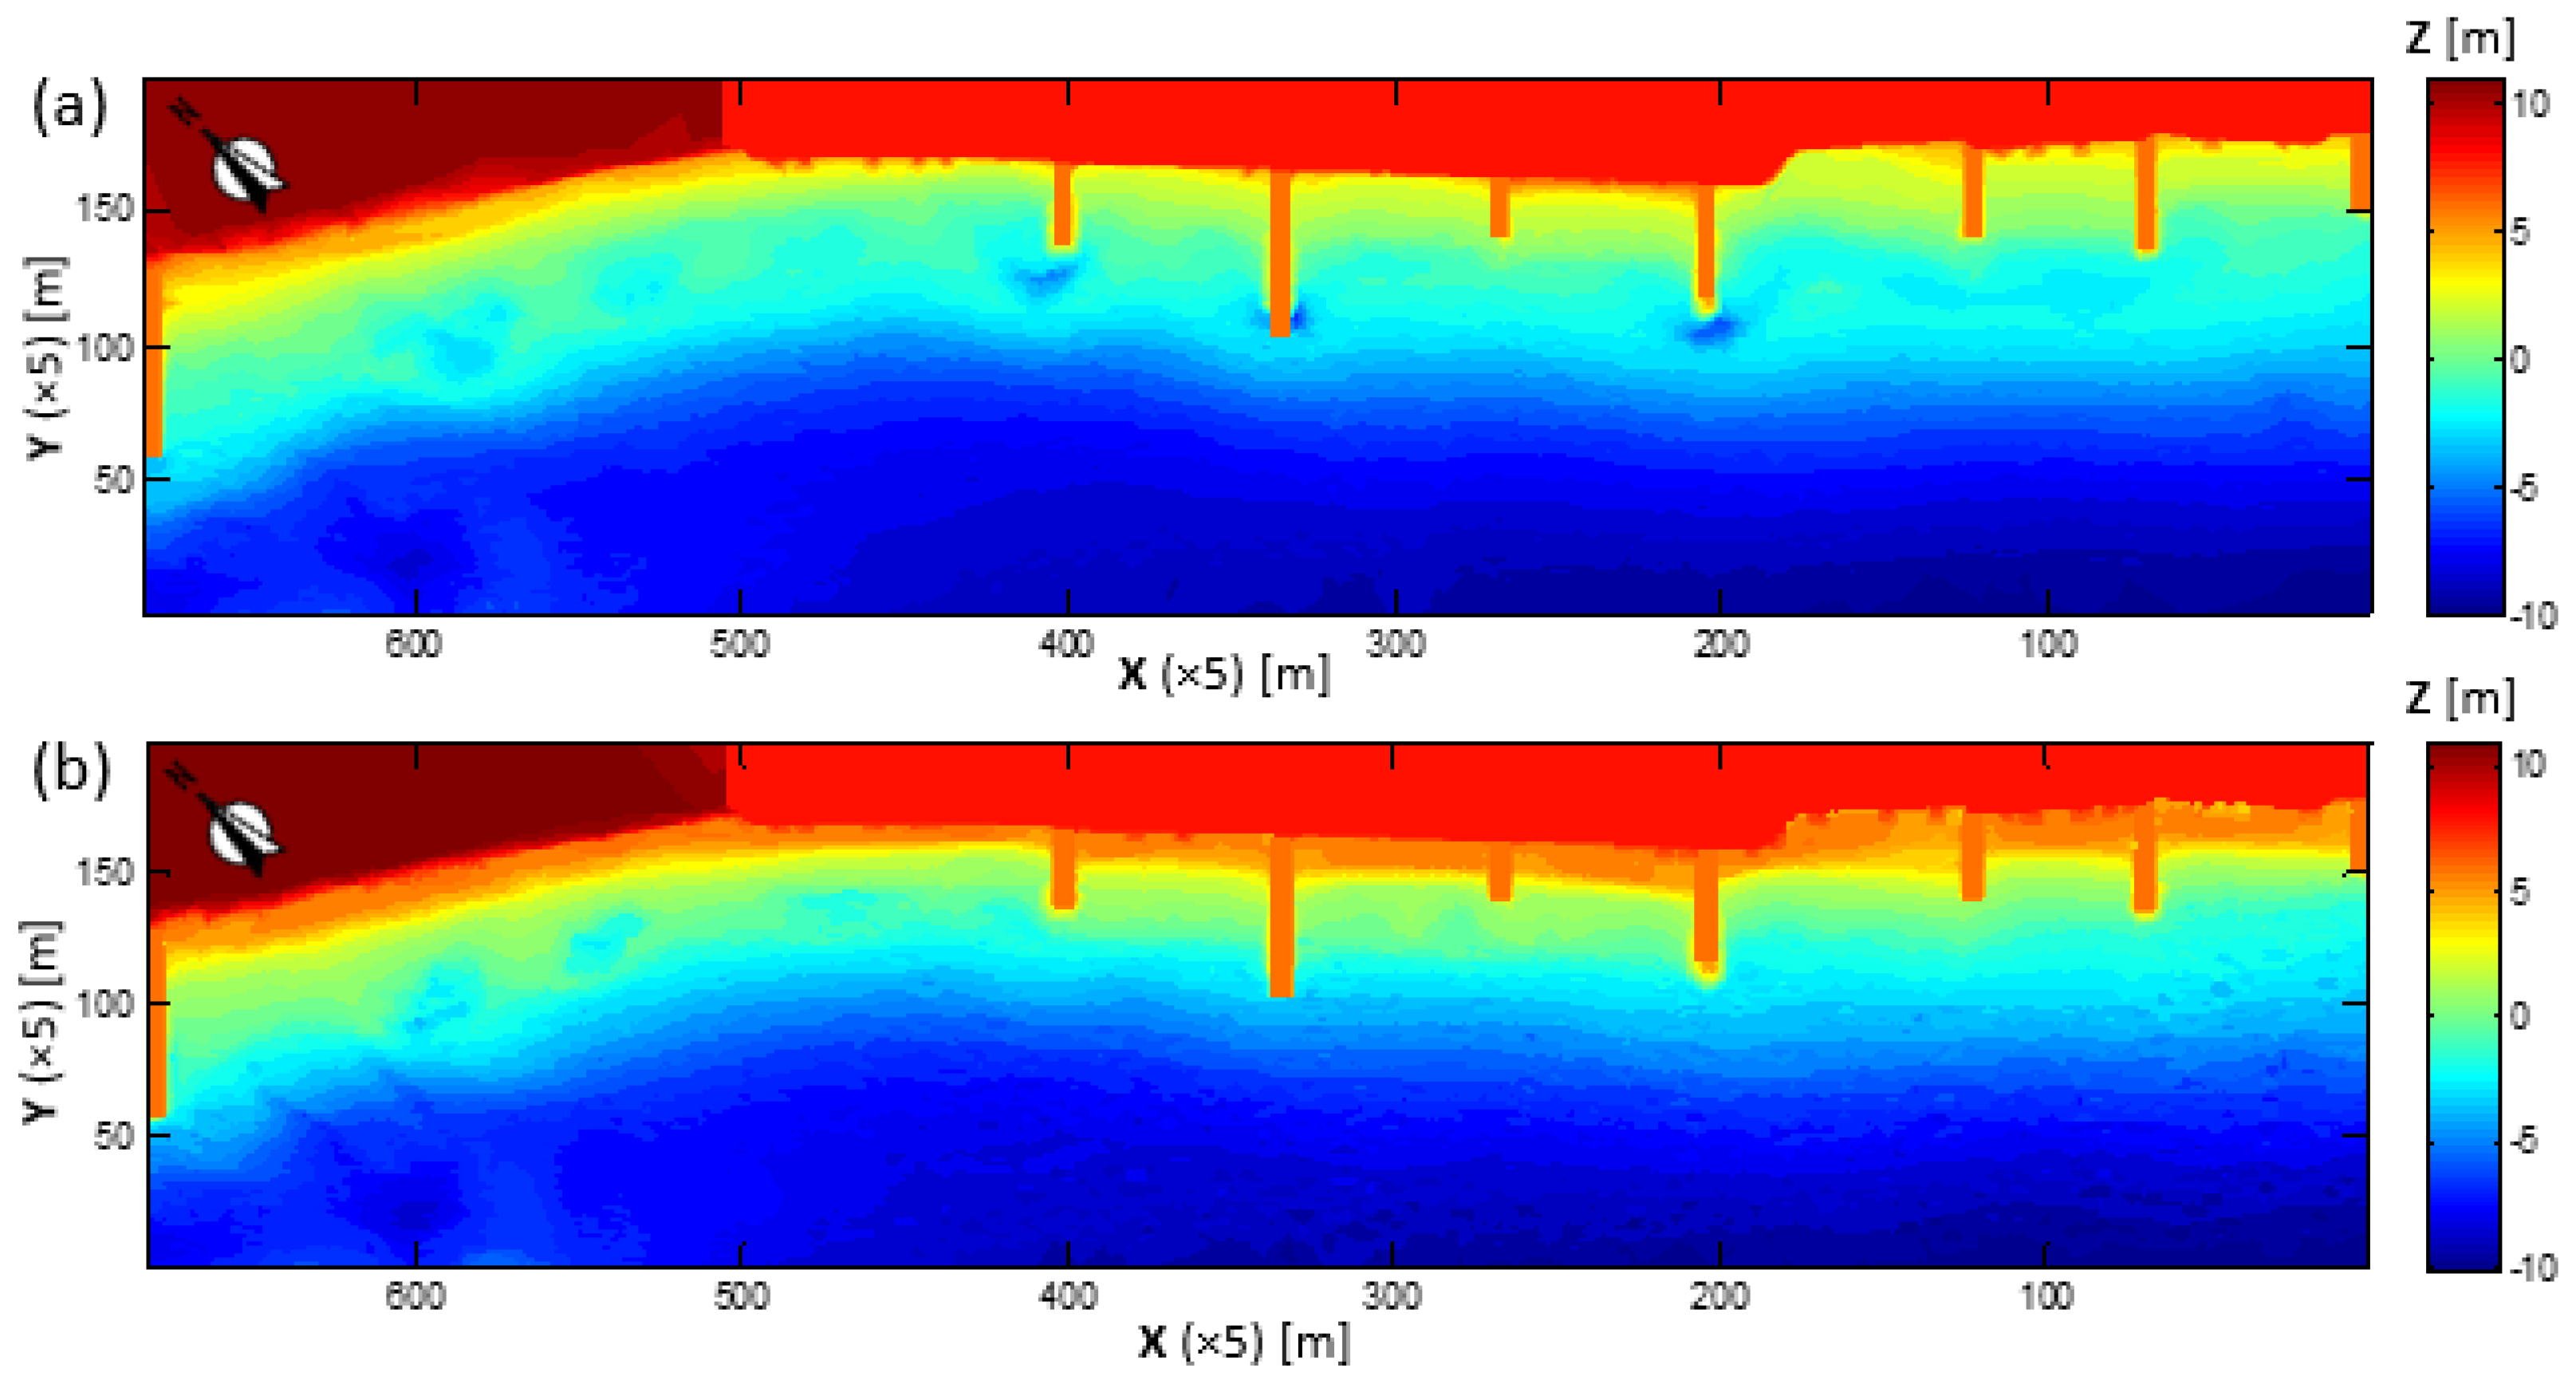
3.1. Pre- and Post-Nourishment Topo-Bathymetric Conditions
3.2. Hydrodynamic Storm Conditions
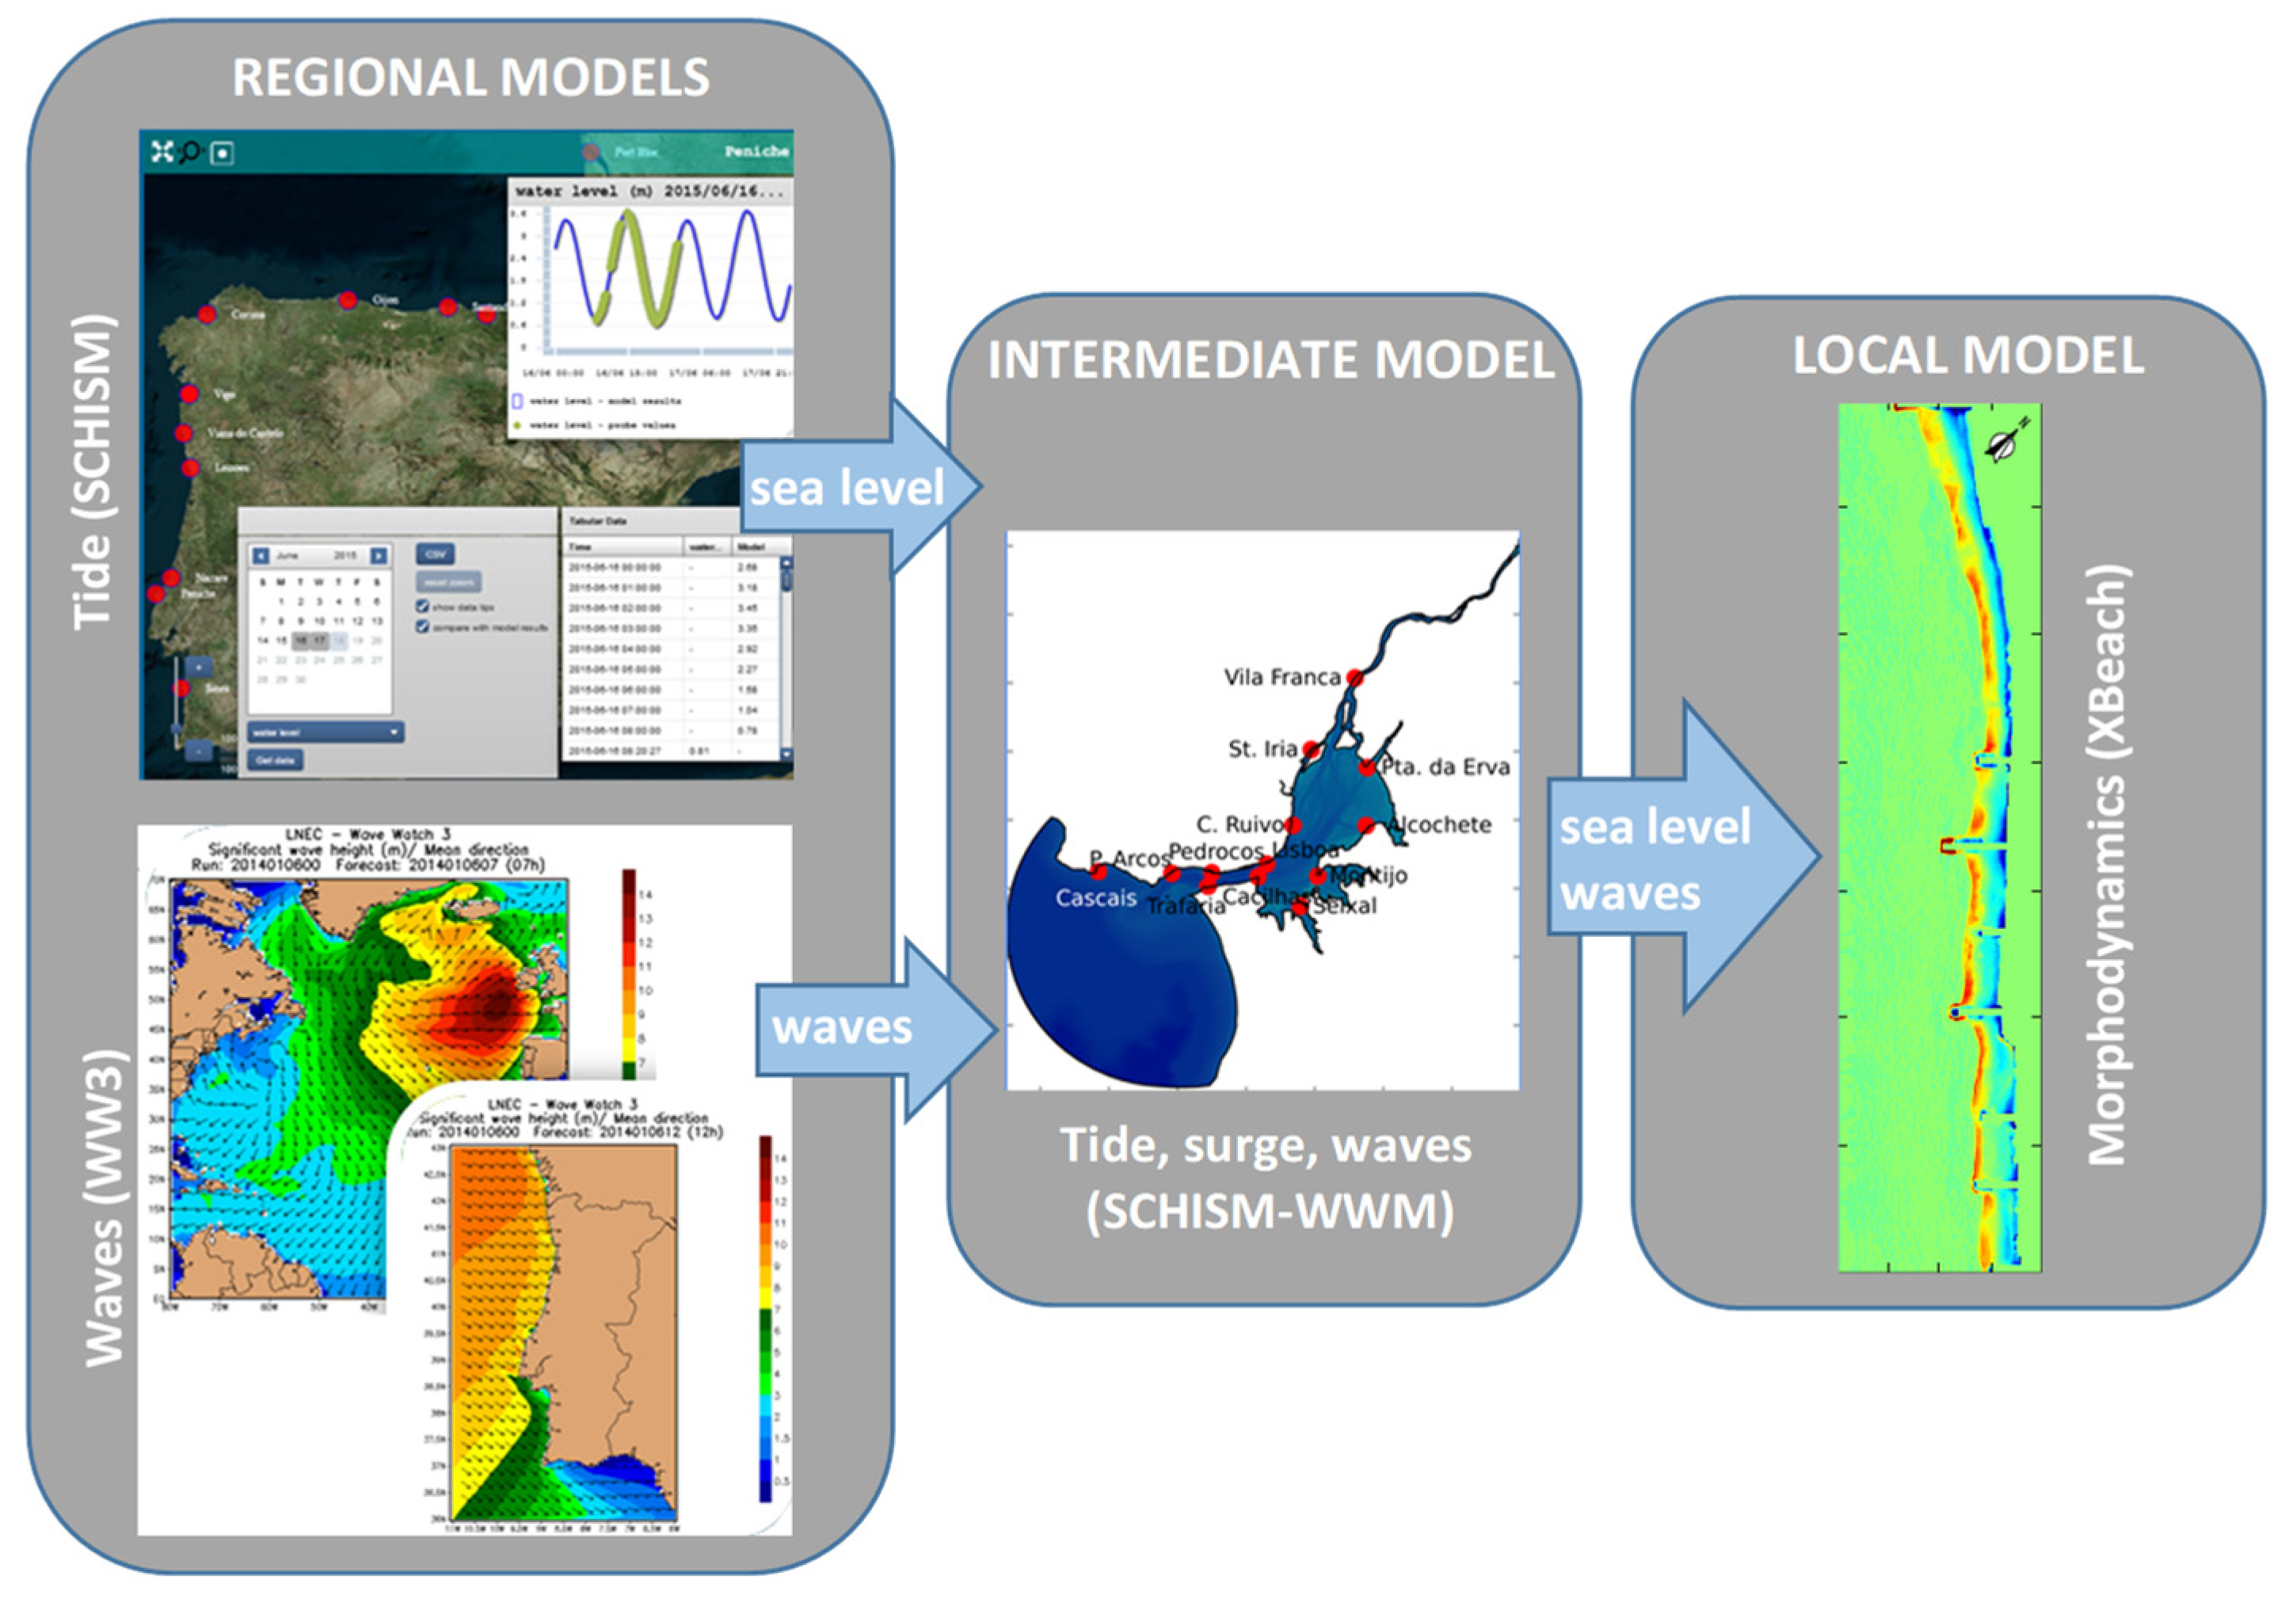
3.3. Numerical Modelling
4. Results
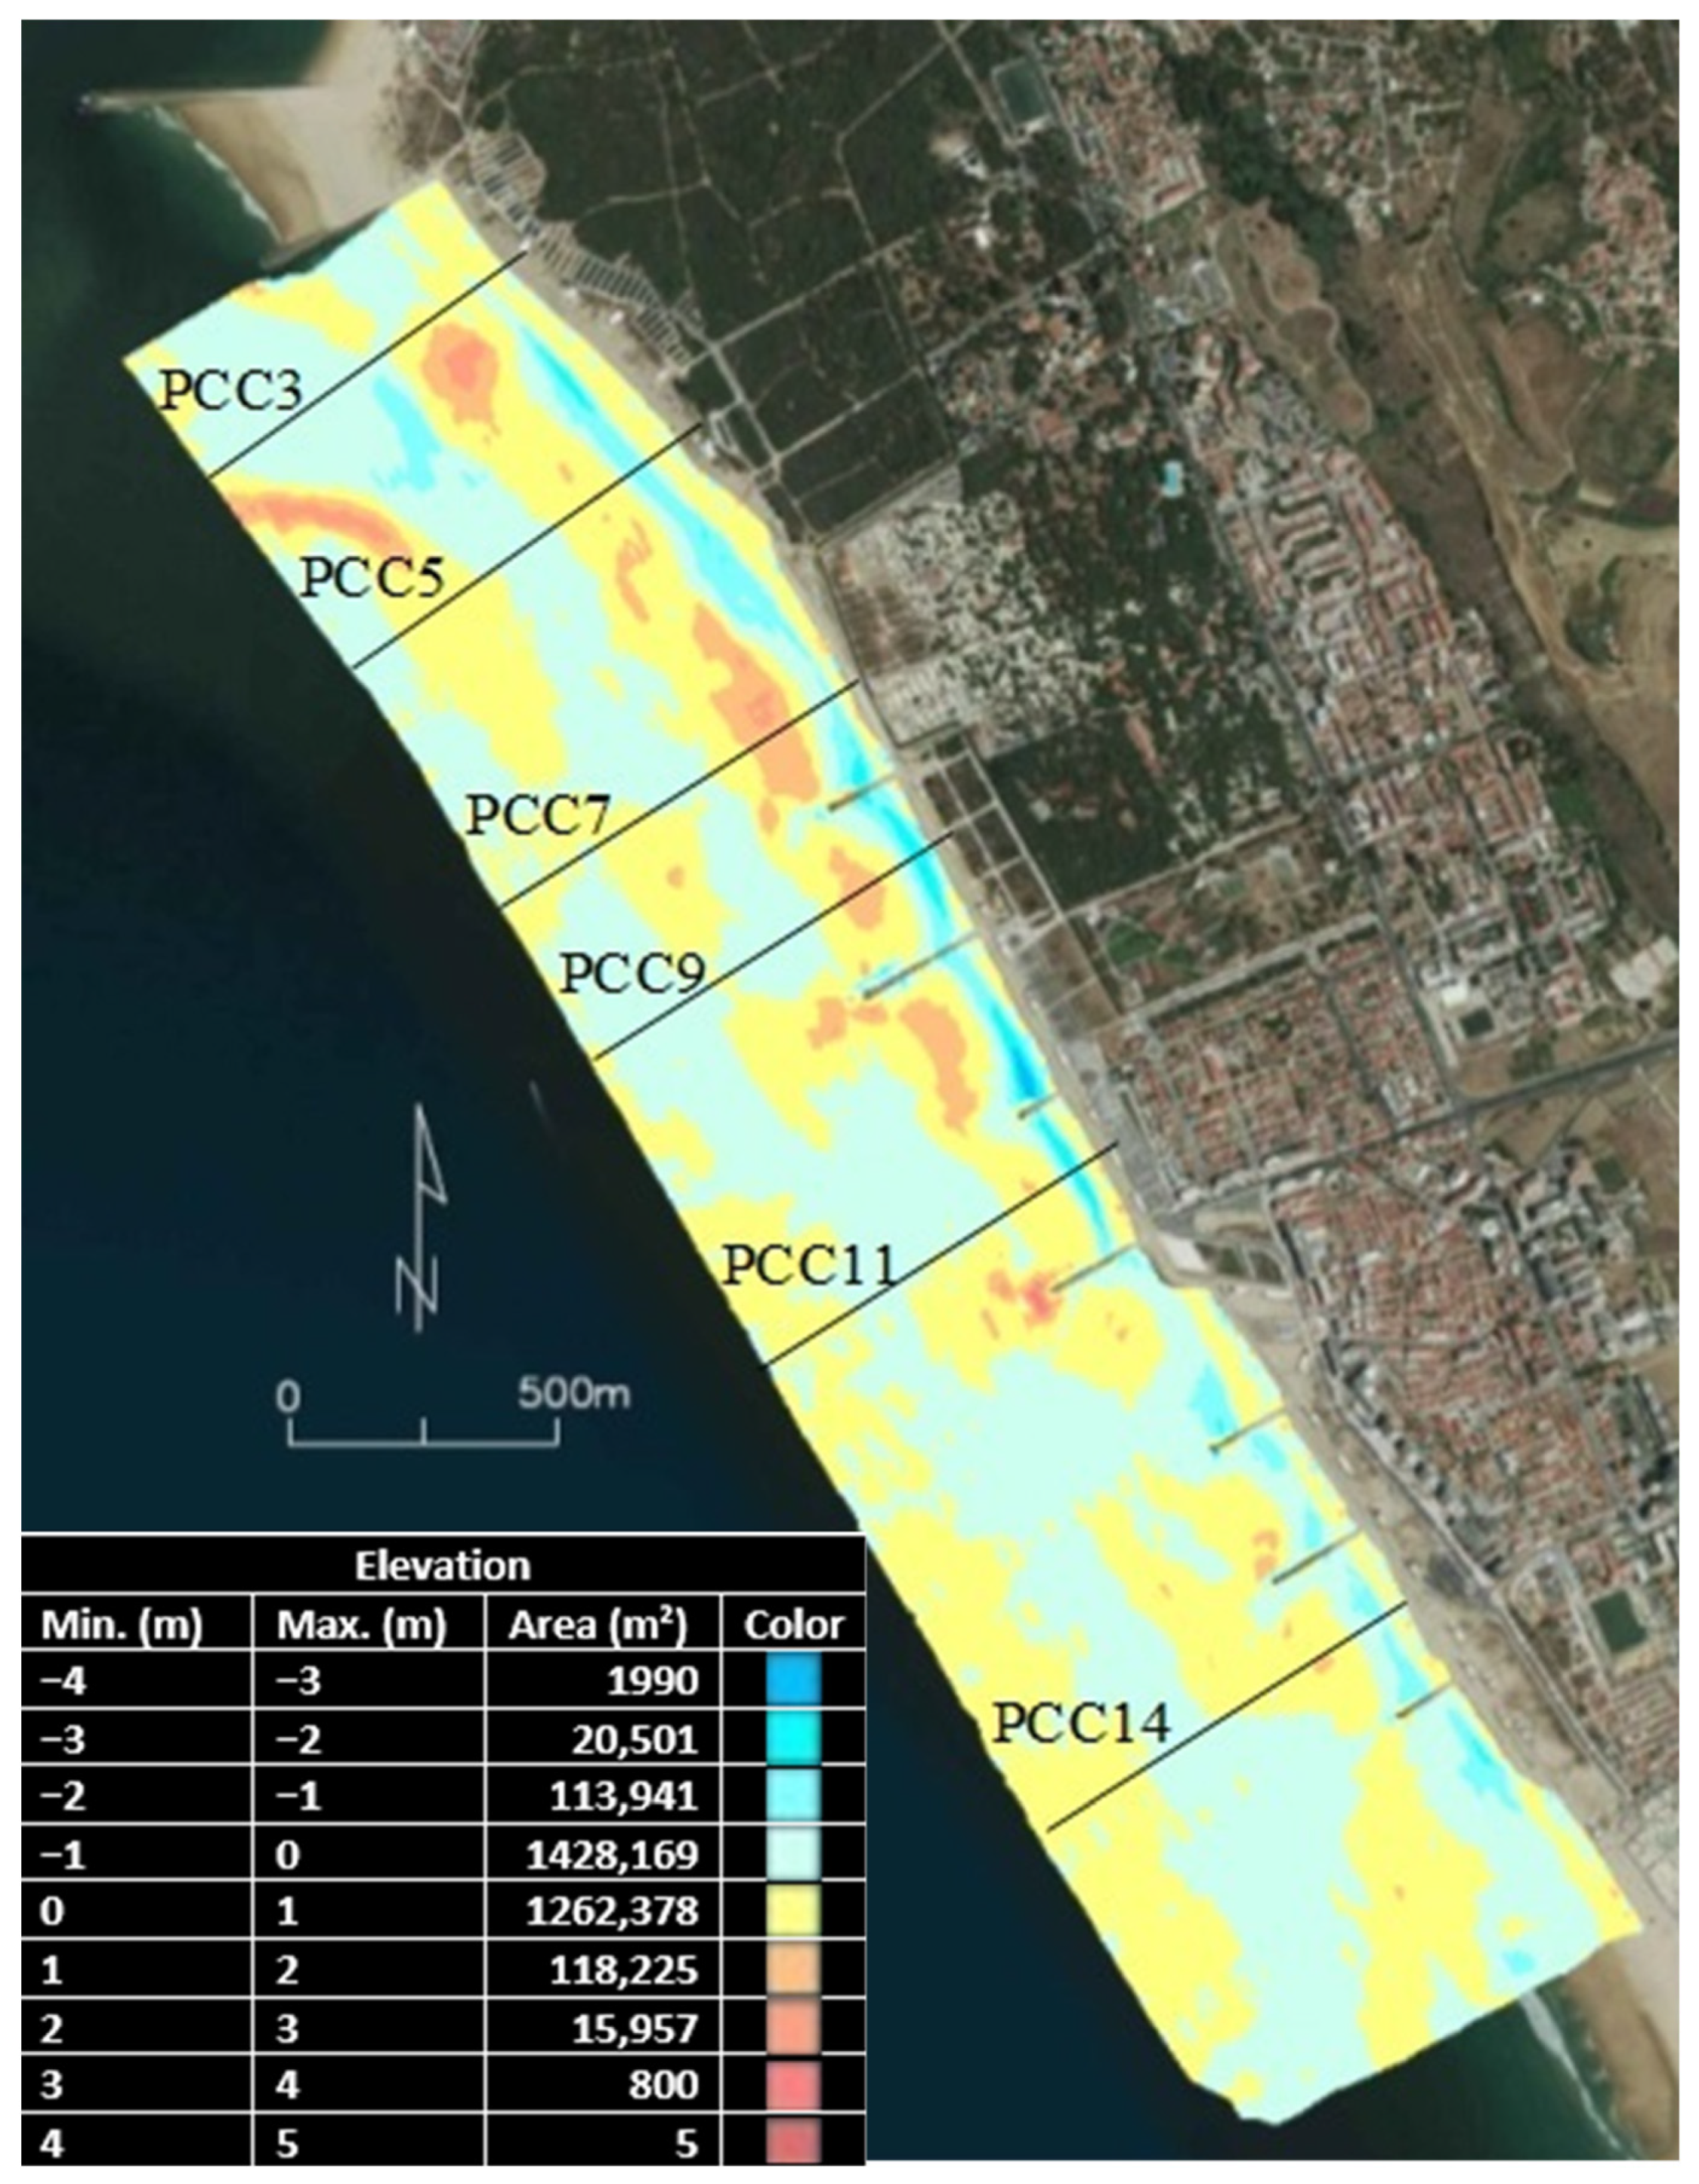
4.1. Spatial Distribution of the Nourishment
4.2. Wave Climate and Sea Level
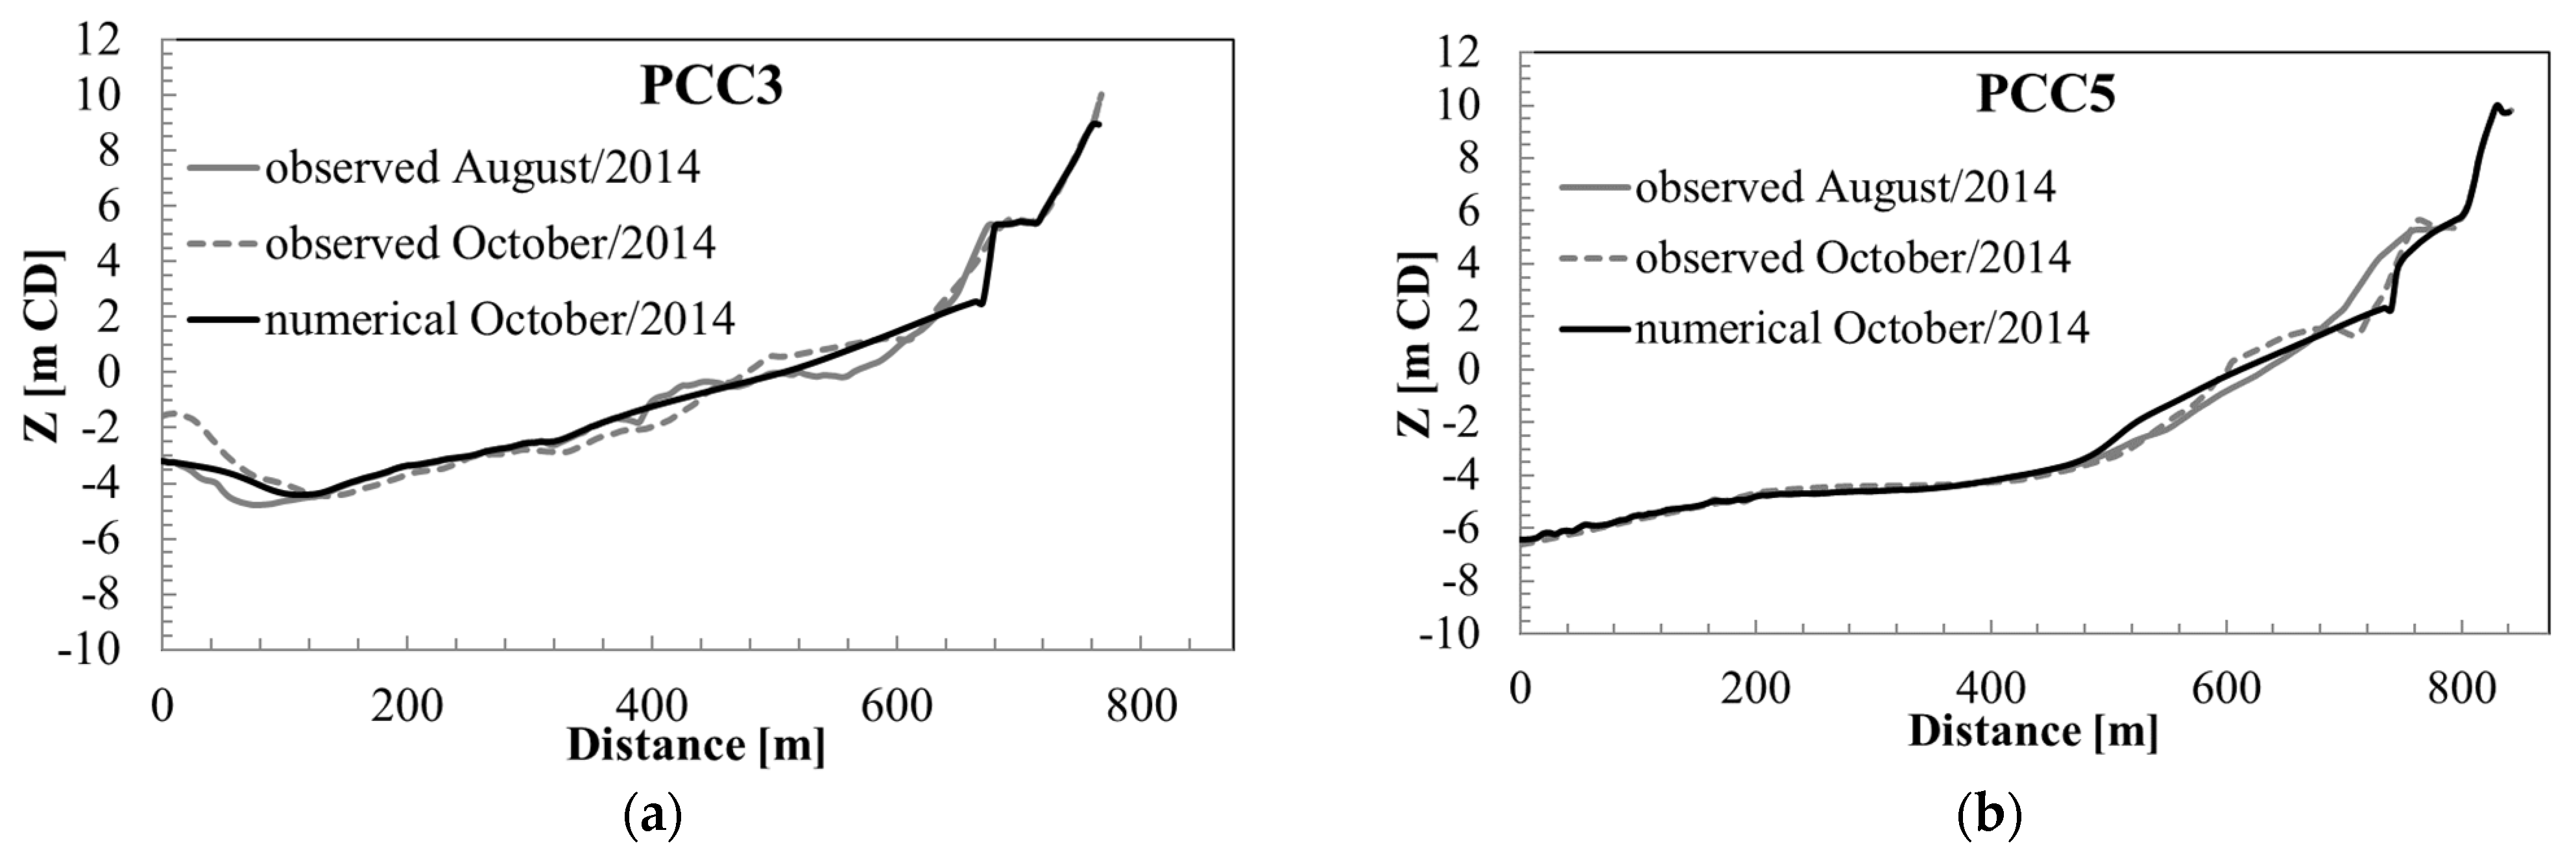
4.3. Morphodynamic Model Validation
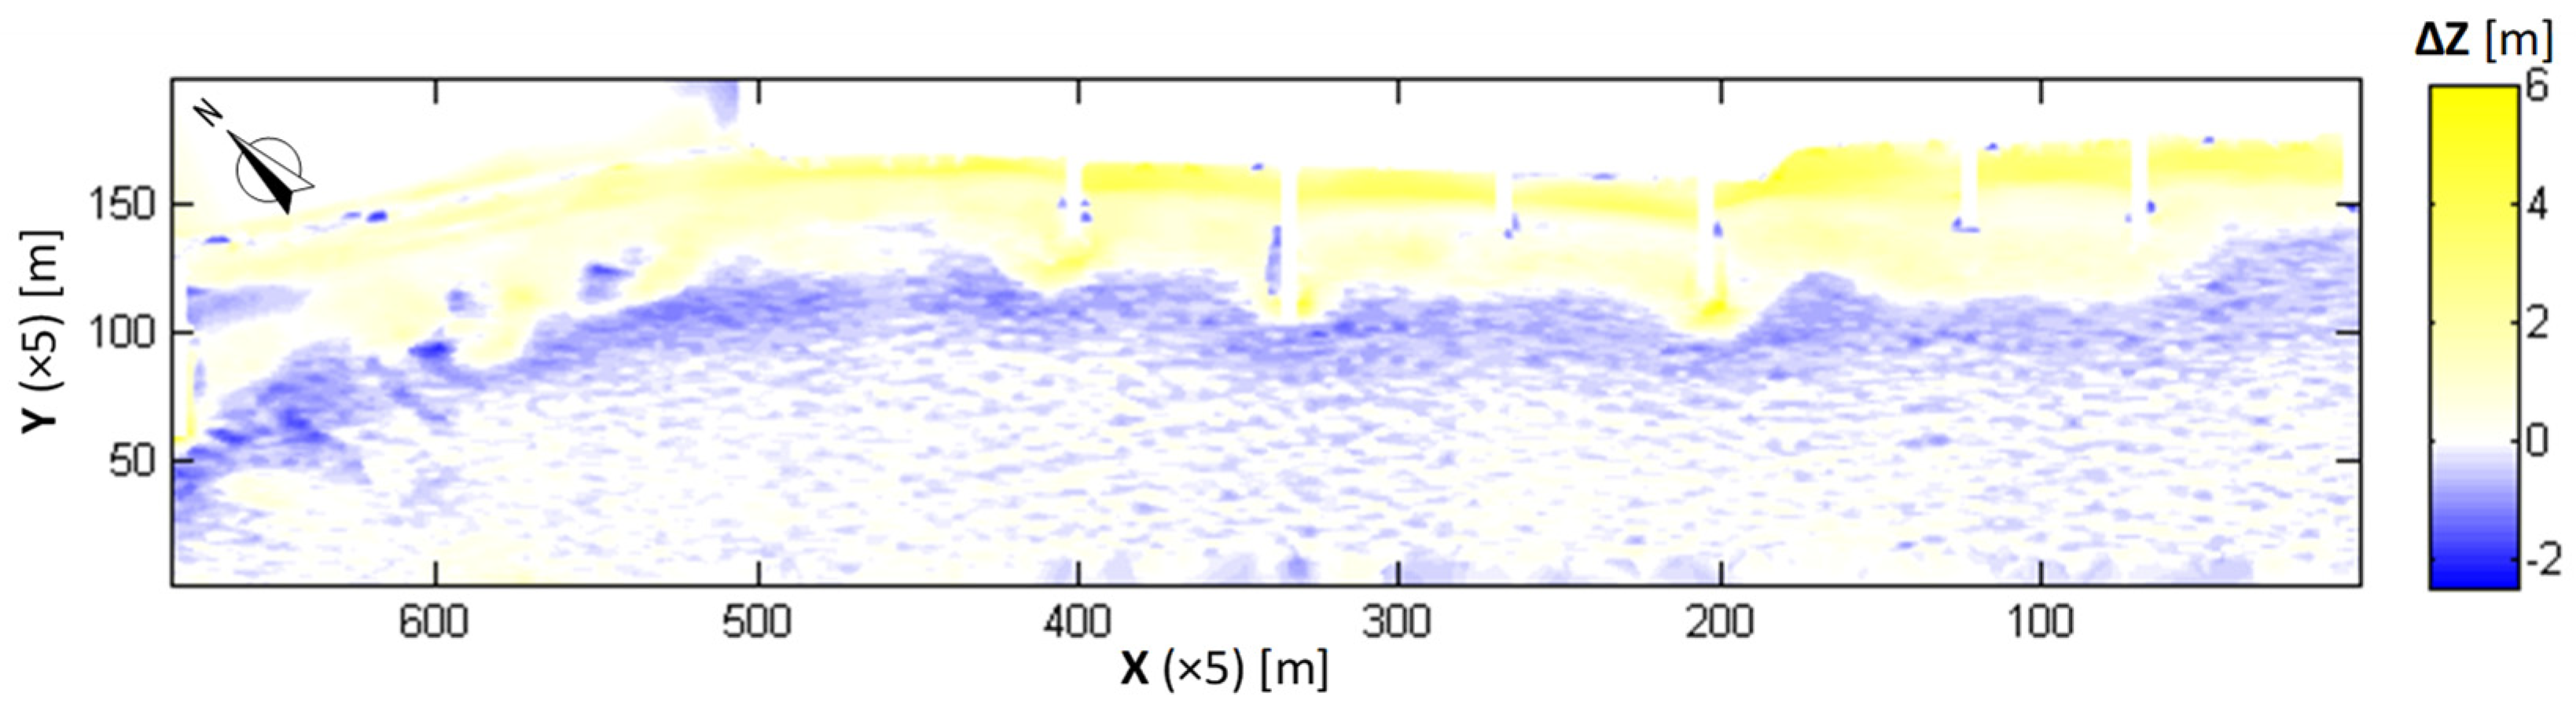
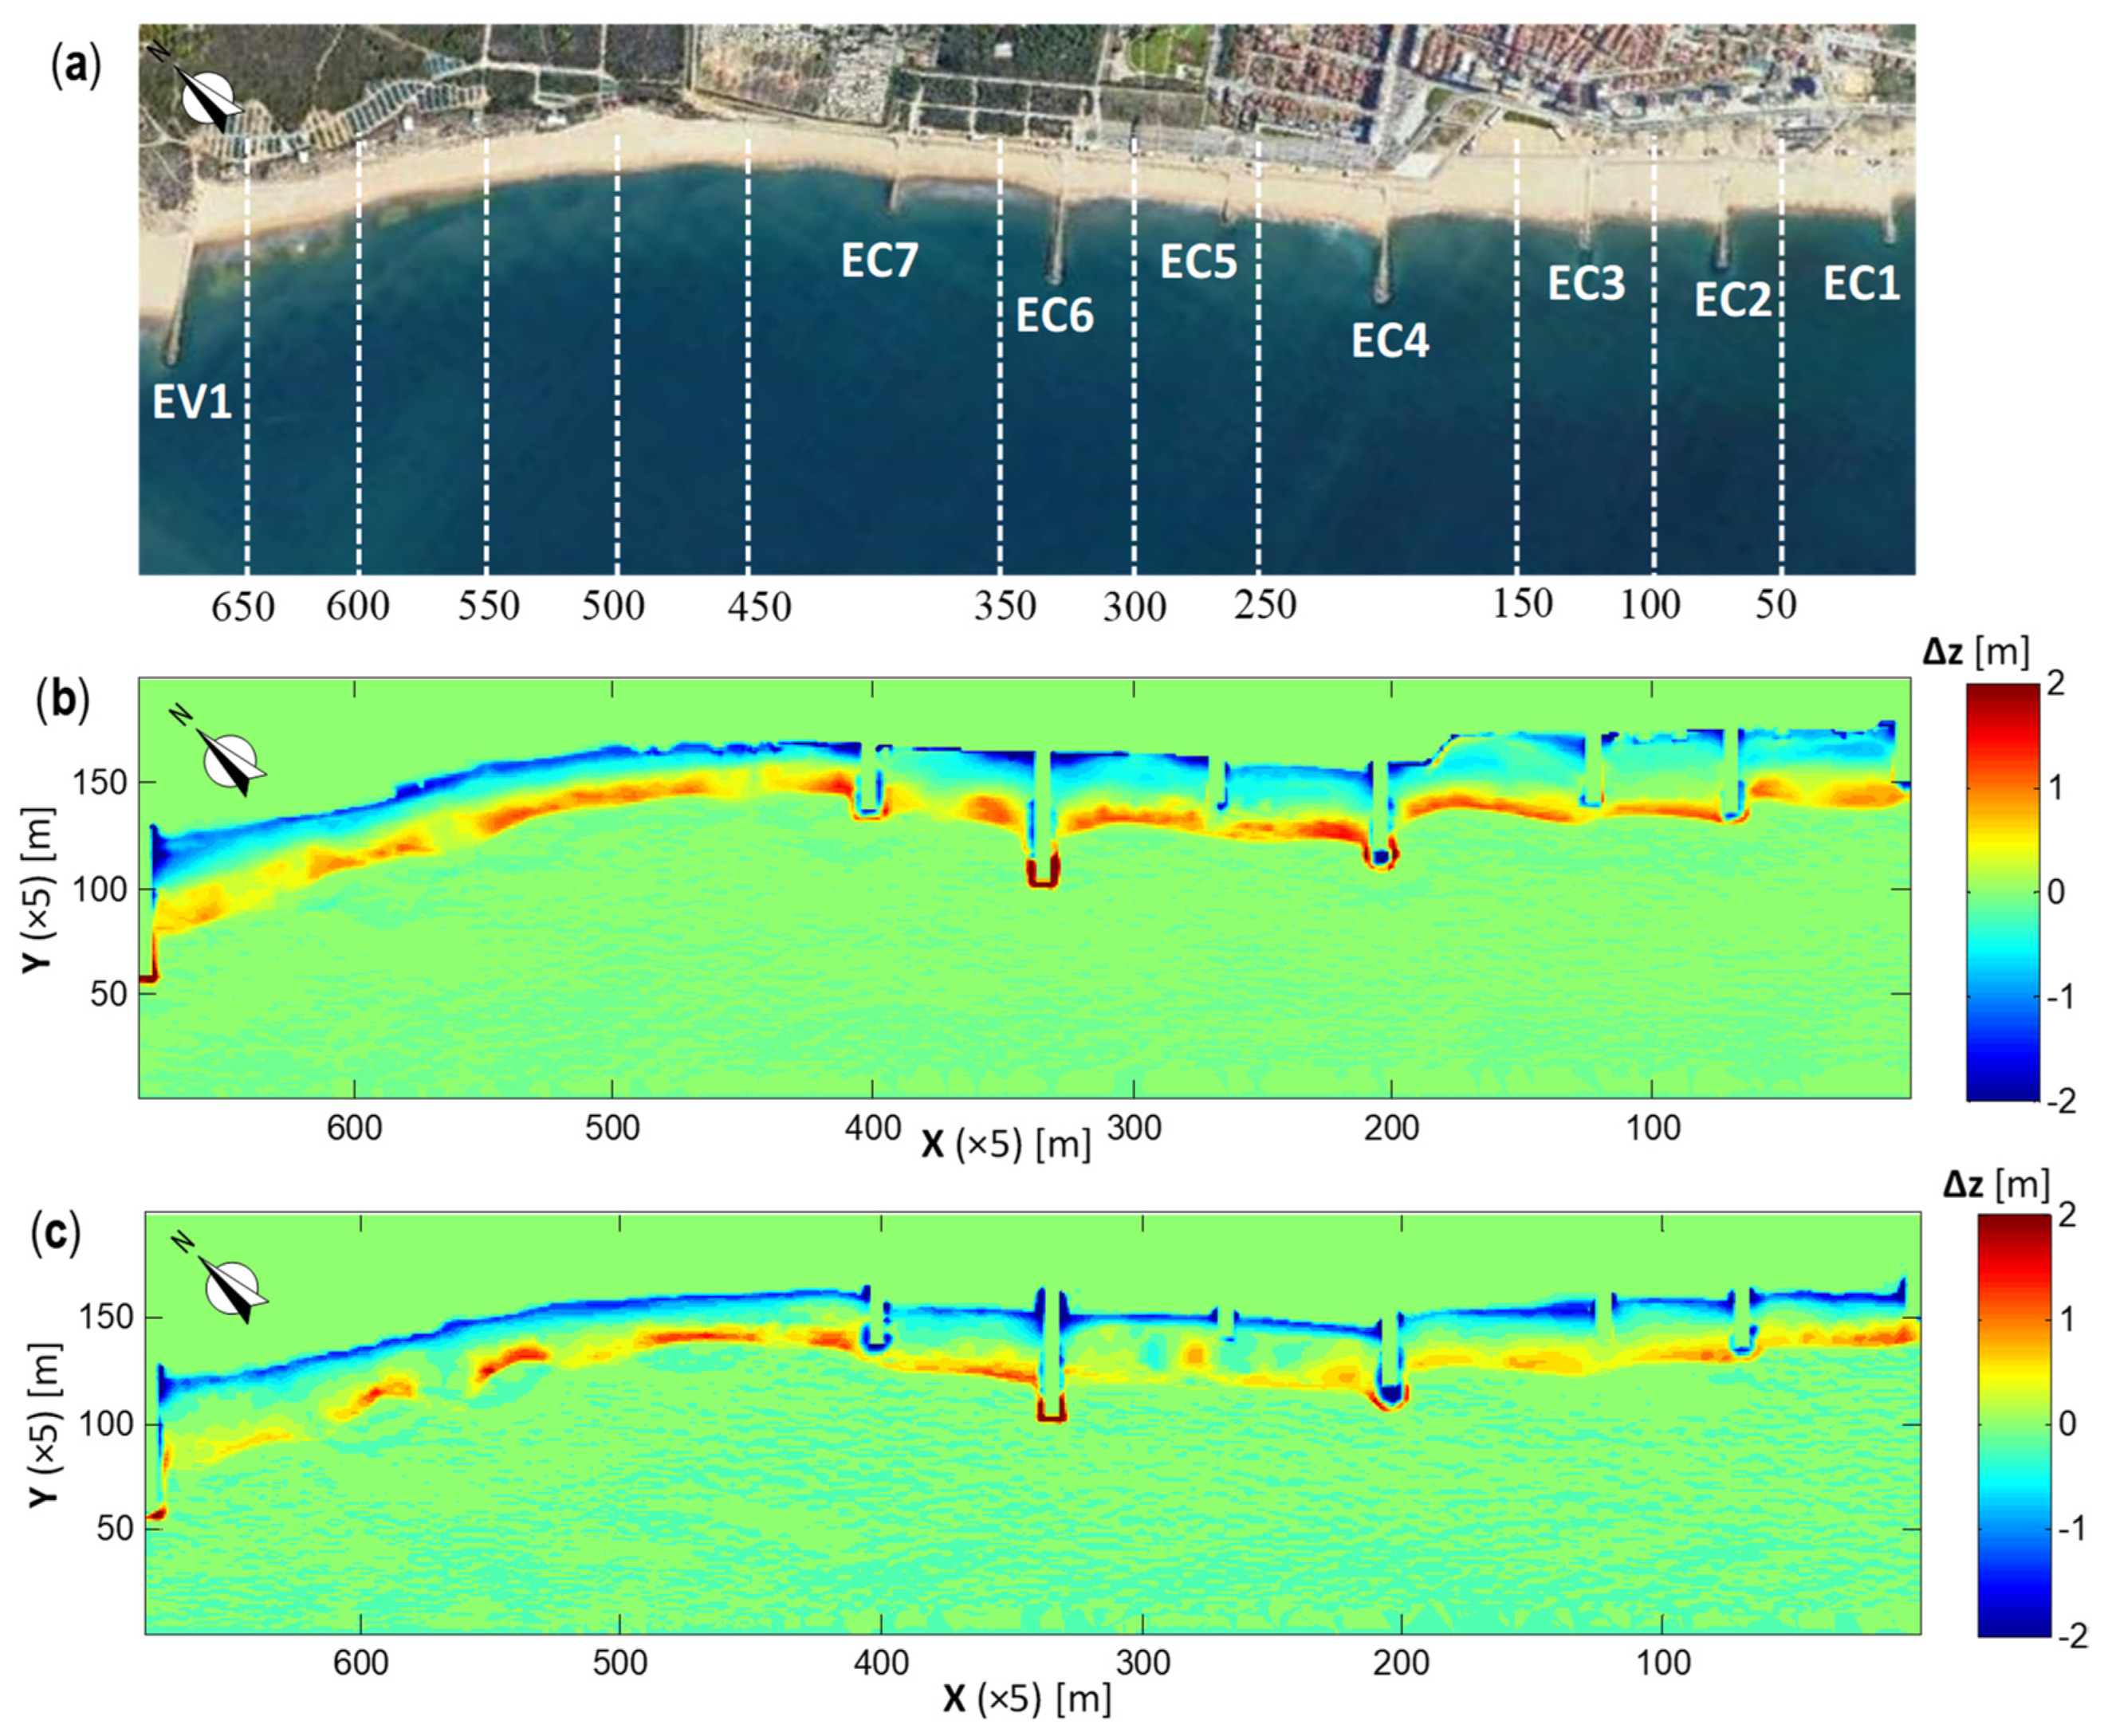
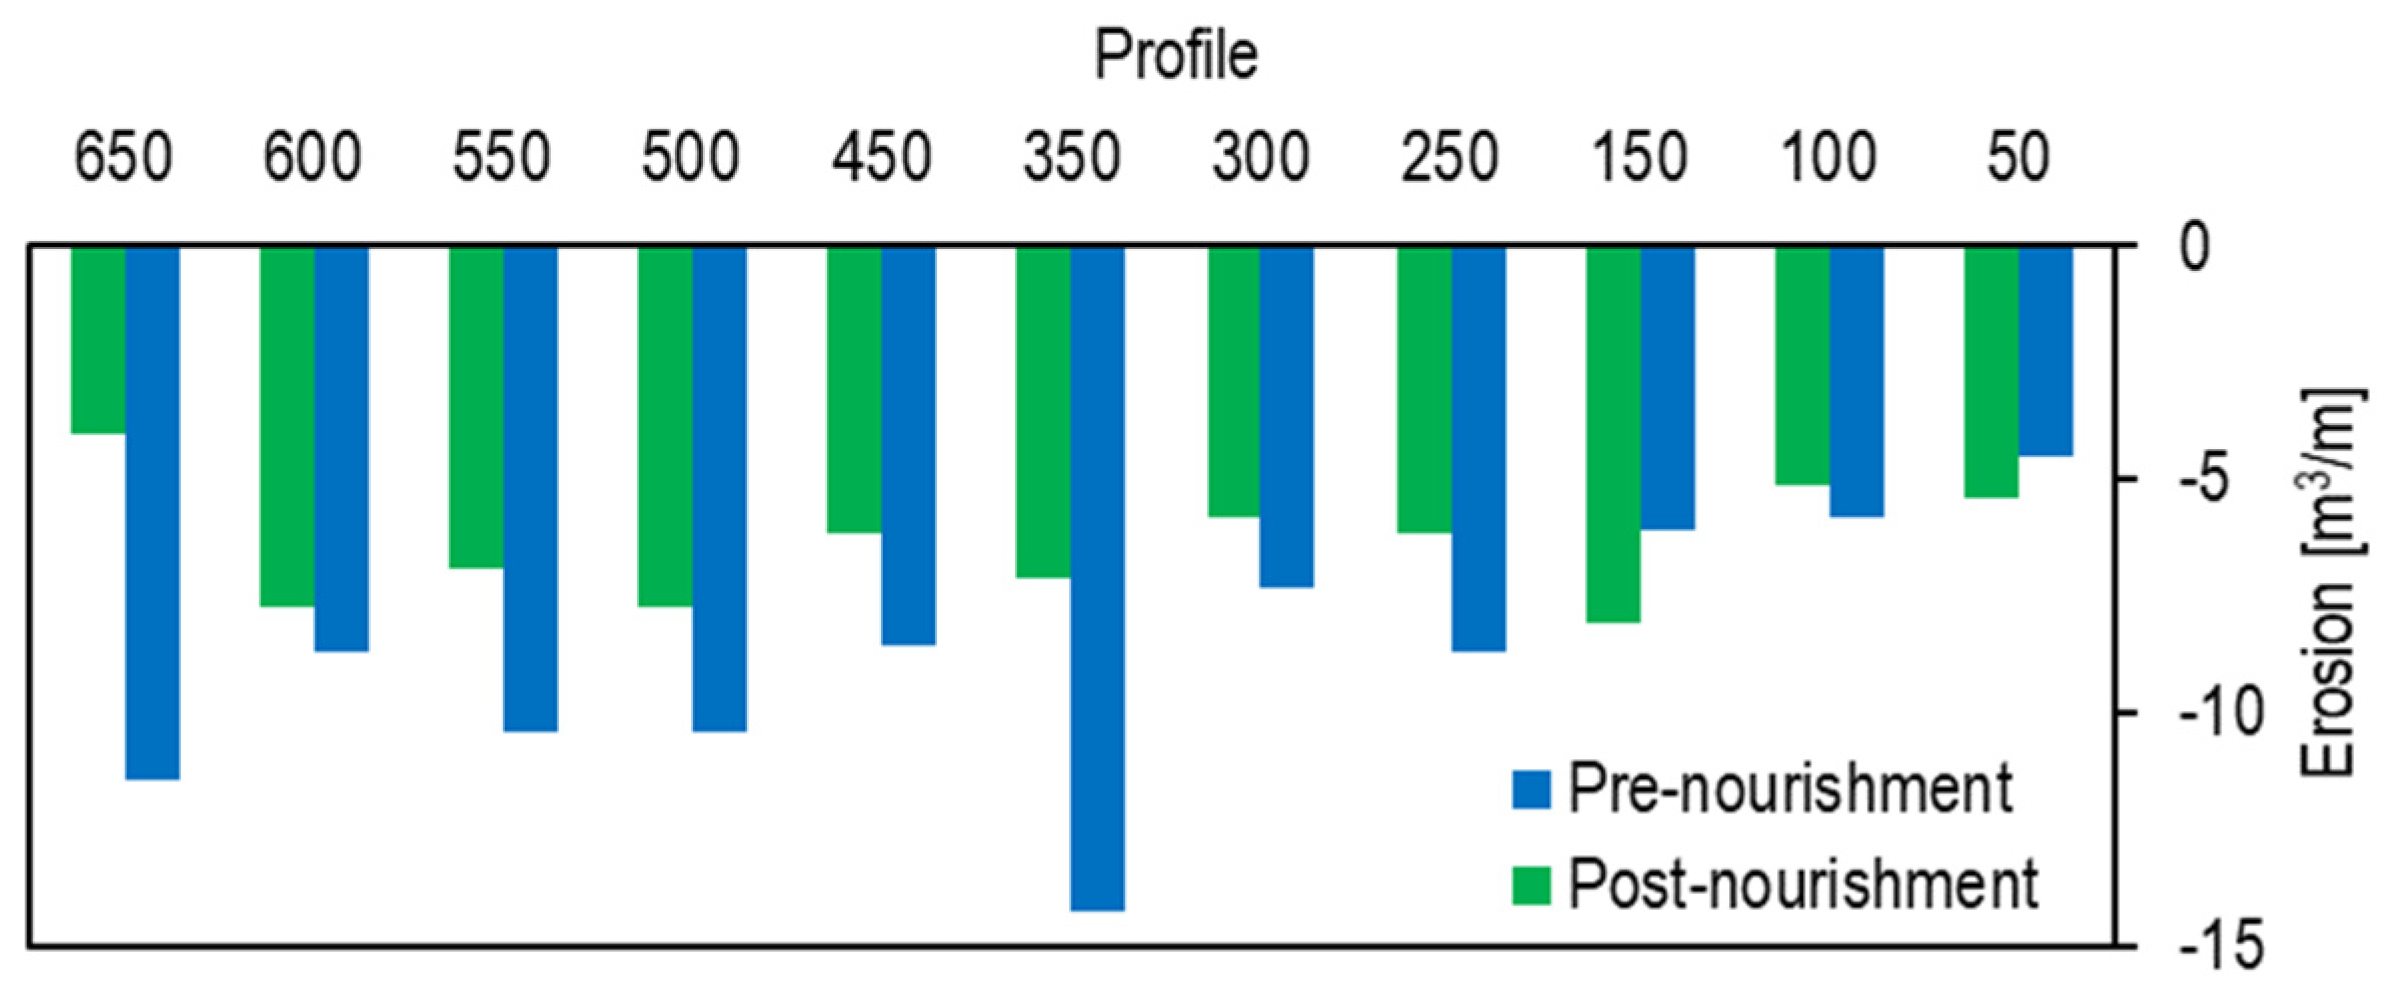
4.4. Storm Impact in the Pre- and Post-Nourished Conditions
5. Discussion
- (i)
- Shoreline retreat: the nourishment effectively reduced the retreat of the beach face observed in the absence of intervention, thereby protecting the shoreline.
- (ii)
- Enhanced beach resistance: a post-storm evaluation of the nourished beach revealed a significant volume of sand remaining on the beach face and backshore, suggesting that the nourishment project has been effective in resisting erosion.
- (iii)
- Seawall protection: by avoiding or limiting the direct wave action on the seawall, the nourishment mitigates potential structural damage and erosion.
- (iv)
- Safeguarding infrastructure: the nourished beach reduces the risk of overtopping and inundation events, which have historically affected the area [39], and provides a protective buffer for the beach and urban support infrastructure located landward of the seawall.
- (i)
- The validation was restricted to the morphological evolution because of nonexistent measured synoptic hydrodynamic data. Despite the inherent hydrodynamic action of morphological evolution, the two components of morphodynamics should be validated separately to control the largest possible number of site-dependent parameters. For a study site 200 km north of Costa da Caparica, ref. [40] concluded that the numerical scheme used to propagate short waves and the breaking criterion were important calibration parameters to improve the surfbeat model performance. In our study, unlike [40], who used the original second-order upwind scheme, we used the warmbeam scheme to improve the surfbeat solver stability as suggested by [35], and we used the same formulation for the wave dissipation by breaking the [34] formulation, but without adjusting the breaking criterion parameter as performed by the authors.
- (ii)
- The current numerical domain is restricted by the limitations of the existing topo-bathymetric monitoring area. Expanding the monitoring area laterally and further offshore would be beneficial. This expanded data collection would enable a more accurate representation of the physical processes, particularly the influence of long waves [7,32].
- (iii)
- The selection of the 1DH stationary solver [7] for model validation was driven by a combination of factors: the study area’s size, the need for high grid resolution, the two-month simulation period, and the prevailing low-energy wave conditions. While strategically chosen application profiles minimized errors caused by longitudinal morphodynamic variability, the 2DH model version [7,32] is likely to yield more accurate results overall.
6. Conclusions
Author Contributions
Funding
Institutional Review Board Statement
Informed Consent Statement
Data Availability Statement
Acknowledgments
Conflicts of Interest
References
- Vousdoukas, M.I.; Ranasinghe, R.; Mentaschi, L.; Plomaritis, T.A.; Athanasiou, P.; Luijendijk, A.; Feyen, L. Sandy coastlines under threat of erosion. Nat. Clim. Change 2020, 10, 260–263. [Google Scholar] [CrossRef]
- Defeo, O.; McLachlan, A.; Armitage, D.; Elliott, M.; Pittman, J. Sandy beach social-ecological systems at risk: Regime shifts, collapses, and governance challenges. Front. Ecol. Environ. 2021, 19, 564–573. [Google Scholar] [CrossRef]
- Almar, R.; Ranasinghe, R.; Bergsma, E.W.J.; Diaz, H.; Melet, A.; Papa, F.; Vousdoukas, M.; Athanasiou, P.; Dada, O.; Almeida, L.P.; et al. A global analysis of extreme coastal water levels with implications for potential coastal overtopping. Nat. Commun. 2021, 12, 3775. [Google Scholar] [CrossRef]
- Cabrita, P.; Montes, J.; Duo, E.; Brunetta, R.; Ciavola, P. The Role of Different Total Water Level Definitions in Coastal Flood Modelling on a Low-Elevation Dune System. J. Mar. Sci. Eng. 2024, 12, 1003. [Google Scholar] [CrossRef]
- Harris, L.R.; Defeo, O. Sandy shore ecosystem services, ecological infrastructure, and bundles: New insights and perspectives. Ecosyst. Serv. 2022, 57, 101477. [Google Scholar] [CrossRef]
- Atkinson, A.L.; Baldock, T.E. Laboratory investigation of nourishment options to mitigate sea level rise induced erosion. Coast. Eng. 2020, 161, 103769. [Google Scholar] [CrossRef]
- Roelvink, D.; Reniers, A.; van Dongeren, A.; van Thiel de Vries, J.; McCall, R.; Lescinski, J. Modelling storm impacts on beaches, dunes and barrier islands. Coast. Eng. 2009, 56, 1133–1152. [Google Scholar] [CrossRef]
- Winter, R.C.; Ruessink, B.G. Sensitivity analysis of climate change impacts on dune erosion: Case study for the Dutch Holland coast. Clim. Change 2017, 141, 685–701. [Google Scholar] [CrossRef]
- Santos, F.D.; Lopes, A.M.; Moniz, G.; Ramos, L.; Taborda, R. Gestão da Zona Costeira–O Desafio da Mudança; Santos, F.D., Penha-Lopes, G., Lopes, A.M., Eds.; Grupo de Trabalho do Litoral: Lisboa, Portugal, 2017; ISBN 978-989-99962-1-2. (In Portuguese)
- Fortunato, A.B.; Freire, P.; Menguel, B.; Bertin, X.; Pinto, C.; Martins, K.; Guérin, T.; Azevedo, A. Sediment dynamics and morphological evolution in the Tagus Estuary inlet. Mar. Geol. 2021, 440, 106590. [Google Scholar] [CrossRef]
- Barceló, J.P. Estudo Experimental do Funcionamento Hidráulico de Campos de Esporões Marítimos Inclinados; Memória nº 372 do Laboratório Nacional de Engenharia Civil; Ministério das Obras Públicas: Lisboa, Portugal, 1970. (In Portuguese)
- Veloso-Gomes, F.; Taveira-Pinto, F.; Pais-Barbosa, J.; Costa, J.; Rodrigues, A. Estudo das intervenções na Costa da Caparica. J. Hidráulica Recur. Hídricos Ambiente 2006, 1, 27–35. (In Portuguese) [Google Scholar]
- Lira, C.P.; Nobre-Silva, A.; Taborda, R.; Andrade, C.F. Coastline evolution of Portuguese low-lying sandy coast in the last 50 years: An integrated approach. Earth Syst. Sci. Data 2016, 8, 265–278. [Google Scholar] [CrossRef]
- Silva, S.F.; Martinho, M.; Capitão, R.; Reis, T.; Fortes, C.J.; Ferreira, J.C. An index based method for coastal-flood risk assessment in low-lying areas (Costa de Caparica, Portugal). Ocean Coast. Manag. 2017, 144, 90–104. [Google Scholar] [CrossRef]
- Veloso-Gomes, F.; Taveira-Pinto, F.; Pais-Barbosa, J. Rehabilitation study of coastal defense works and artificial sand nourishment at Costa da Caparica, Portugal. In Proceedings of the 29th International Conference of Coastal Engineering, Lisboa, Portugal, 19–24 September 2004; pp. 3429–3440. [Google Scholar]
- Pinto, C.A.; Silveira, T.; Teixeira, S.B. Beach nourishment practice in mainland Portugal (1950–2017): Overview and retrospective. Ocean Coast. Manag. 2020, 192, 105211. [Google Scholar] [CrossRef]
- Dodet, G.; Bertin, X.; Bruneau, N.; Fortunato, A.B.; Nahon, A.; Roland, A. Wave-current interactions in a wave-dominated tidal inlet. J. Geophys. Res. Ocean. 2013, 118, 1587–1605. [Google Scholar] [CrossRef]
- Mendes, D.; Oliveira, T.C.A. Deep-water spectral wave steepness offshore mainland Portugal. Ocean Eng. 2021, 236, 109548. [Google Scholar] [CrossRef]
- Fortunato, A.B.; Freire, P.; Bertin, X.; Rodrigues, M.; Ferreira, J.; Liberato, M.L. A numerical study of the February 15, 1941 storm in the Tagus estuary. Cont. Shelf Res. 2017, 144, 50–64. [Google Scholar] [CrossRef]
- Guerreiro, M.; Fortunato, A.B.; Freire, P.; Rilo, A.; Taborda, R.; Freitas, M.C.; Andrade, C.; Silva, T.; Rodrigues, M.; Bertin, X.; et al. Evolution of the hydrodynamics of the Tagus Estuary (Portugal) in the 21st century. Rev. Gestão Costeira Integr. 2015, 15, 65–80. [Google Scholar] [CrossRef]
- Diogo, Z.S.; Silveira, T.M.; Sousa, H.; Carapuço, A.M.; Silva, A.N.; Lira, C.; Taborda, R.; Andrade, C.F. Estudo de Caso da Costa da Caparica. In Caracterização da Variabilidade Morfodinâmica Sazonal e Pós-Temporal das Praias da Costa da Caparica; Entregável 2.2.c; Relatório da Faculdade de Ciências da Universidade de Lisboa: Lisboa, Portugal, 2013; 119p. (In Portuguese) [Google Scholar]
- Sancho, F. Evaluation of coastal protection strategies at Costa da Caparica (Portugal): Nourishments and structural interventions. J. Mar. Sci. Eng. 2023, 11, 1159. [Google Scholar] [CrossRef]
- Silveira, T.M.; Sousa, H.; Carapuço, A.M.; Diogo, Z.S.; Silva, A.N.; Taborda, R.; Andrade, C.F. Estudo de caso da Costa da Caparica. In Caracterização das Evoluções Morfológicas e Volumétricas da Praia de S. João da Caparica; Entregável 2.3.b; Agência Portuguesa do Ambiente: Lisboa, Portugal, 2013; 24p. (In Portuguese) [Google Scholar]
- Agência Portuguesa do Ambiente. Programa COSMO. Available online: https://cosmo.apambiente.pt (accessed on 9 April 2024).
- Oliveira, A.; Fortunato, A.B.; Rodrigues, M.; Azevedo, A.; Rogeiro, J.; Bernardes, S.; Lavaud, L.; Bertin, X.; Nahon, A.; Jesus, G.; et al. Forecasting contrasting coastal and estuarine hydrodynamics with OPENCoastS. Environ. Model. Softw. 2021, 143, 105132. [Google Scholar] [CrossRef]
- Santos, I.; Oliveira, F.S.B.F.; Trigo-Teixeira, A. Characterization of maritime storms and analysis of their effect on the beaches south of the Mondego river (Portugal). J. Coast. Res. 2018, 85, 266–270. [Google Scholar] [CrossRef]
- Tolman, H.L. User Manual and System Documentation of WAVEWATCH III, Version 3.14; Technical Note NOAA/NWS/NCEP/MMAB; National Oceanic and Atmospheric Administration: College Park, MD, USA, 2009; Volume 276, 194p.
- Zhang, Y.J.; Ye, F.; Stanev, E.V.; Grashorn, S. Seamless cross-scale modeling with SCHISM. Ocean. Model. 2016, 102, 64–81. [Google Scholar] [CrossRef]
- Fortunato, A.B.; Meredith, E.P.; Rodrigues, M.; Freire, P.; Feldmann, H. Near-future changes in storm surges along the Atlantic Iberian coast. Nat. Hazards 2019, 98, 1003–1020. [Google Scholar] [CrossRef]
- Mengual, B.; Bertin, X.; Place, F.; Pezarat, M.; Coulombier, T.; Mendes, D.; Fortunato, A.B. Wave-current interactions at the Tagus Estuary Mouth (Portugal) under storm wave conditions. Ocean. Model. 2022, 175, 102035. [Google Scholar] [CrossRef]
- Rusu, L.; Bernardino, M.; Guedes Soares, C. Modelling the influence of currents on wave propagation at the entrance of the Tagus estuary. Ocean Eng. 2011, 38, 1174–1183. [Google Scholar] [CrossRef]
- McCall, R.; Van Thiel de Vries, J.S.M.; Plant, N.G.; Van Dongeren, A.R.; Roelvink, J.A.; Thompson, D.M.; Reniers, A.J.H.M. Two-dimensional time dependent hurricane overwash and erosion modeling at Santa Rosa Island. Coast. Eng. 2010, 57, 668–683. [Google Scholar] [CrossRef]
- Splinter, K.D.; Palmsten, M.L. Modeling dune response to an east coast low. Mar. Geol. 2012, 329–331, 46–57. [Google Scholar] [CrossRef]
- Roelvink, J.A. Dissipation in random wave groups incident on a beach. Coast. Eng. 1993, 19, 127–150. [Google Scholar] [CrossRef]
- Roelvink, D.; McCall, R.; Mehvar, S.; Nederhoff, K.; Dastgheib, A. Improving predictions of swash dynamics in XBeach: The role of groupiness and incident-band runup. Coast. Eng. 2018, 134, 103–123. [Google Scholar] [CrossRef]
- Van Rijn, L.C.; Walstra, D.J.R.; Grasmeijer, B.; Sutherland, J.; Pan, S.; Sierra, J.P. The predictability of cross-shore bed evolution of sandy beaches at the time scale of storms and seasons using process-based profile models. Coast. Eng. 2003, 47, 295–327. [Google Scholar] [CrossRef]
- Oliveira, F.S.B.F.; Oliveira, J.N.C. Topo-bathymetric behaviour of a beach controlled by a groyne field and a dune-seawall backshore. J. Coast. Conserv. 2023, 27, 10. [Google Scholar] [CrossRef]
- Bernatchez, P.; Fraser, C. Evolution of coastal defence structures and consequences for beach width trends, Québec, Canada. J. Coast. Res. 2012, 28, 1550–1566. [Google Scholar] [CrossRef]
- Ferreira, J.C.; Cardona, F.S.; Jóia-Santos, C.; Tenedório, J.A. Hazards, vulnerability, and risk analysis on wave overtopping and coastal flooding in low-lying coastal areas: The case of Costa da Caparica, Portugal. Water 2021, 13, 237. [Google Scholar] [CrossRef]
- Nahon, A.; Fortunato, A.; Oliveira, F.S.B.F.; Azevedo, A.; Henriques, M.J.; Silva, P.A.; Baptista, P.; Freire, P. 2DH modelling and mapping of surfbeat-driven flooding in the shadow of a jettied tidal inlet. Coast. Eng. 2003, 184, 104342. [Google Scholar] [CrossRef]


| Intervention Date | Volume Deposited in the Beach Face and Berm [m3] | Location of the Deposit |
|---|---|---|
| August 2007 | 0.5 × 10⁶ | between EV1 and EC4 (extension 2.4 km) |
| August 2008 | 106 | between EV1 and about 500 m south of EC1 (extension 3.8 km) |
| August 2009 | 106 | between EV1 and about 500 m south of EC1 (extension 3.8 km) |
| 26 June–25 August 2014 | 106 | between EV1 and about 500 m south of EC1 (extension 3.8 km) |
| August 2019 | 106 | between EV1 and about 500 m south of EC1 (extension 3.8 km) |
| Volume × (103) [m3] | |||||
|---|---|---|---|---|---|
| Topo-Bathymetric Survey | Above −9 m CD | Above −1 m CD | Below −1 m CD | Above +2 m CD | Below +2 m CD |
| July–August 2008 | 16.03 | 1.74 | 14.29 | 0.30 | 15.73 |
| November 2008 | 16.75 | 2.73 | 14.02 | 0.94 | 15.81 |
| Profile | Performance Indicators | ||||
|---|---|---|---|---|---|
| Impact (Numerical/Observed) | Error | ||||
| Retreat [m] at the Levels | Erosion Volume [m3/m] | BSS (δ = 0.15/0.3) | |||
| −1 m CD | 0 m CD | +2 m CD | |||
| PCC3 | 20/40 | −55/−85 | 0/0 | 77/141 | 0.5/0.6 |
| PCC5 | −30/−15 | −25/−35 | 25/30 | 100/113 | 0.7/0.8 |
| PCC7 | −70/−75 | −45/−65 | 15/10 | 157/77 | 0.7/0.8 |
| PCC9 | −95/−60 | −70/−40 | −10/25 | 199/215 | 0.7/0.8 |
| PCC11 | −65/−35 | −45/−30 | 20/15 | 143/153 | 0.6/0.6 |
| PCC14 | −45/−30 | −30/−35 | −10/25 | 135/86 | 0.4/0.6 |
| Erosion [m3/m] | |||
|---|---|---|---|
| Cell | Beach Length [m] | Pre-Nourishment | Post-Nourishment |
| EC1-EC2 | 295 | 10.6 | 9.5 |
| EC2-EC3 | 230 | 8.1 | 7.8 |
| EC3-EC4 | 375 | 9.5 | 8.9 |
| EC4-EC5 | 280 | 10.2 | 7.3 |
| EC5-EC6 | 300 | 13.2 | 8.8 |
| EC6-EC7 | 300 | 12.0 | 10.1 |
| EC7-EV1 | 1400 | 9.9 | 7.7 |
Disclaimer/Publisher’s Note: The statements, opinions and data contained in all publications are solely those of the individual author(s) and contributor(s) and not of MDPI and/or the editor(s). MDPI and/or the editor(s) disclaim responsibility for any injury to people or property resulting from any ideas, methods, instructions or products referred to in the content. |
© 2024 by the authors. Licensee MDPI, Basel, Switzerland. This article is an open access article distributed under the terms and conditions of the Creative Commons Attribution (CC BY) license (https://creativecommons.org/licenses/by/4.0/).
Share and Cite
Oliveira, F.S.B.F.; Fortunato, A.B.; Freire, P. Beach Nourishment Protection against Storms for Contrasting Backshore Typologies. J. Mar. Sci. Eng. 2024, 12, 1465. https://doi.org/10.3390/jmse12091465
Oliveira FSBF, Fortunato AB, Freire P. Beach Nourishment Protection against Storms for Contrasting Backshore Typologies. Journal of Marine Science and Engineering. 2024; 12(9):1465. https://doi.org/10.3390/jmse12091465
Chicago/Turabian StyleOliveira, Filipa S. B. F., André B. Fortunato, and Paula Freire. 2024. "Beach Nourishment Protection against Storms for Contrasting Backshore Typologies" Journal of Marine Science and Engineering 12, no. 9: 1465. https://doi.org/10.3390/jmse12091465
APA StyleOliveira, F. S. B. F., Fortunato, A. B., & Freire, P. (2024). Beach Nourishment Protection against Storms for Contrasting Backshore Typologies. Journal of Marine Science and Engineering, 12(9), 1465. https://doi.org/10.3390/jmse12091465