Abstract
Direct wireless communication through sea–air media is essential for constructing an integrated communication network that spans space, air, land, and sea. The amplitude of acoustically induced micromotion surface waves is much smaller than the noise interference in complex sea states, making the accurate extraction of these signals from the raw signals detected by an FMCW millimeter-wave radar a major challenge. In this paper, Butterworth filtering is used to extract underwater acoustic signals from the surface waves detected by radar. The physical processes of the channel were simulated theoretically and verified experimentally. The results demonstrate a fitting coefficient of 0.99 between the radar-detected water surface waves and the simulation outcomes, enabling the effective elimination of noise interference and the extraction of acoustically induced micromotion signals in environments with a signal-to-noise ratio (SNR) of −20 dB to −10 dB. Experiments modifying frequency and linear frequency modulation have verified that the usable frequency range for underwater acoustic signals is at least 400 Hz, meeting the frequency requirements of Binary Frequency Shift Keying (2FSK) modulation encoding methods. This research confirms the accuracy of the simulation results and the feasibility of filtering and extracting underwater acoustic signals, providing a theoretical basis and an experimental foundation for building cross-media communication links.
1. Introduction
Integrated communication between space, air, land, and sea is an important tool for human exploration of the deep sea [1,2]. Wireless signals in different media have different propagation properties, making cross-media wireless communication using a single type of signal extremely challenging. Therefore, bridging the sea–air interface becomes a key part of constructing an integrated communication network that spans space, air, land, and sea [3,4]. Seawater’s strong absorption and scattering of electromagnetic waves severely limit the effective range of underwater to sea–air interface communications [5,6]. Acoustic signals, which experience much less absorption in seawater compared to electromagnetic waves, have been widely used in underwater communications. However, significant scattering occurs in air channels. The acoustic signals emitted by an underwater sound source generate acoustically induced water surface micromotion waves on the sea surface upon reaching it. These micromotion waves are consistent with the vibration frequency of the underwater sound source [7]. This is an innovative approach to automatically converting signals at the sea–air interface without the need for relay devices. A Frequency Modulated Continuous Wave (FMCW) millimeter-wave radar [8], due to its low collimation and strong anti-deviation capabilities, can be employed for detecting micrometer-level vibrations on the water surface from the air. This enables the acquisition of underwater sound field information, thereby achieving the cross-media communication of sound waves and millimeter waves from underwater to air.
As early as 1930 [9], Butterworth proposed the Butterworth filter that could achieve a smooth frequency response. Furthermore, in 1979 [10], Weisbuch and Garbay first experimentally illustrated the physical concept of the interaction between light waves and surface tension waves, providing a new method for measuring surface tension. Furthermore, in 1998 [11], Lee et al. from Drexel University in the United States proposed a technique for detecting underwater sound signals through water surface disturbances, and experimentally demonstrated the feasibility of detecting underwater sound signals using the amplitude modulation effect of laser beams. Moreover, in 2018 [8], Tonolini and Adib proposed a translation sound–radio frequency communication scheme based on microwave vibration measurements for direct communication across sea–air media, realizing the first practical communication link across sea–air media. In 2020 [12], Khan et al. made a summary of channel models, channel estimation, methods, and algorithms for the equalization of hydroacoustic communications and discussed the prospects of application from time-varying hydroacoustic multipath models to multipath underwater channel models in a MIMO-OFDM environment. Furthermore, in 2021 [13], Yang and Zhou from Harbin Institute of Technology constructed a communication system based on the Binary Frequency Shift Keying (2FSK) modulation method, providing a modulation and coding scheme for uplink communication across sea–air media. In 2022 [14], Qu et al. from Zhejiang University conducted an experiment on sea–air media communication, combining sound waves and millimeter-waves and introducing and experimentally verifying an end-to-end channel in closed form, but the communication distance was only 15 cm, and the highest wave was only 5 cm. Moreover, in 2023 [15], Qian et al. proposed a multi-input, single-output Cross-Medium Focusing Phased Array (CMFPA) model for sea–air media, which can expand the detection area and increase the overall wave amplitude of the water surface, effectively reducing the impact of misalignment on the quality of cross-media communication. In the same year [16], Deng et al. used a terahertz radar, based on the radar echo model and the sound-induced water surface vibration model, to extract the sound-induced water surface vibration signal in the pool experiment. Furthermore, Shi et al. [17] used the finite element method to model and analyze the variation of low-frequency acoustic signals at the surface of the water. Gai et al. [18] proposed an SNR evaluation model to assess the performance of the uplink communication link from underwater to the air. Luo et al. [19] proposed a wave interference suppression method with CEEMDAN and WT, which can reduce the sea surface wave impact on communication.
However, cross-sea–air media communication faces challenges due to the complexity of sea states. Natural wave fluctuations on the water surface are much larger than the acoustically induced micromotion waves at the micrometer level, and seawater has a complex noise environment. This poses significant challenges to the construction of a complete uplink communication link. There is an urgent need for effective filtering methods to separate the acoustically induced micromotion signals from significant noise interference. Additionally, studying the applicability of the 2FSK modulation coding scheme in this system is crucial for its potential use in information transmission.
In this study, underwater acoustic signals were extracted from the surface waves of water that were detected by a millimeter-wave radar based on the principle of Butterworth filtering. An experimental system was established to study the correlation between the theoretical model simulation results and experimental results, verifying the accuracy of the simulation results and the feasibility of cross-media communication. This provides a theoretical basis and experimental foundation for the construction of a cross-media communication link from underwater to the air.
2. The Theoretical Modeling of Underwater Acoustic Signal Detection across Sea–Air Media
In cross-media communication links from underwater to air, the propagation of underwater acoustic signals is primarily affected by spreading loss, absorption loss, scattering, and reflection loss [20,21]. When the acoustic signal reaches the sea–air interface, it excites the formation of surface ripples on the water. The vibration frequency of these surface ripples remains consistent with the frequency of the acoustic signal [7]. A millimeter-wave radar emits FMCW signals and receives their reflected echoes. After filtering the intermediate frequency (IF) signal, the underwater acoustic field information can be resolved.
2.1. The Theoretical Modeling of Cross-Sea–Air Media Communication Channels
2.1.1. The Modeling of Underwater Acoustic Signals
The propagation of sound underwater attenuates with the passage of time and the propagation distance, and the propagation loss is defined as TL. It mainly consists of two parts: expansion loss TL1 and absorption loss TL2. According to TL = TL1 + TL2, this relationship can be expressed as follows:
where r is the distance to the center of the equivalent sound source in m. I(1) and I(r) are the sound intensity 1 m and r m away from the center of the sound source; n is a constant and changes with the propagation conditions. The far field can be 0 according to the plane wave, and the near field can be 2 according to the spherical wave.
The absorption coefficient of an acoustic signal in seawater, denoted as α, is defined as , where TL2 represents the absorption loss in dB, and r is the propagation distance in meters. The unit of the absorption coefficient is dB/m, indicating that when the acoustic signal propagates by 1 m, the sound pressure level decreases by α dB. The empirical equation for the absorption coefficient can be described by
where f is the acoustic frequency in kHz; α0(f) is the relationship between the absorption coefficient and the acoustic frequency f in dB/m, which applies to the horizontal propagation of acoustic signals in water. If the vertical propagation of acoustic signals in water is to be considered, the effect of pressure cannot be neglected. The absorption coefficient α of acoustic signals in seawater decreases with increasing pressure [14,21,22], the unit is still dB/m. For an acoustic signal at the same frequency f, the absorption coefficient decreases by 6.67% for every 1000 m increase in depth h. The relationship between the absorption coefficient α and the depth h can be expressed as follows:
where h is the depth in meters (m). By associating Equations (2) and (3), we obtain that the relationship between the absorption coefficient α and the depth h can be described by
The propagation loss of the hydroacoustic signal in the vertical direction can be expressed as follows:
where h is the water depth in m and α(h) is the absorption coefficient in dB/m.
The variation of the wave pressure pi of an acoustic signal with propagation loss TL can be described by [22,23]
where pi is the acoustic signal wave pressure in Pa; Lp is the initial sound pressure level and TL is the propagation loss, both in dB; Pref is the reference sound pressure, and the reference sound pressure in the water is .
2.1.2. The Modeling of the Sea–Air Interface
When sound waves travel from water to the sea–air interface, they cause disturbances at this boundary, resulting in microwaves spreading laterally across the water’s surface. The ripples on the surface, induced by the sound waves, are classified as surface capillary waves [24]. Considering the relationship between water depth h and wavelength λ, these low-amplitude waves are categorized as deep-water waves.
The sound pressure reaching the water surface is pi in Pa, the incidence Angle is 0°, and the acoustically induced fluctuation of the water surface position changes can be described by
where ρ is the density of water in kg/m3; k is the wave number of the surface wave; ω is the angular frequency in rad/s; and c is the speed of sound in water in m/s.
The three-dimensional mathematical model of water surface ripples can be expressed as follows [22]:
where y is the position of the water surface in the x-vertical direction and t is the acoustic signal propagation time in s. The higher the frequency of the acoustic signal, the smaller the amplitude of the excited water surface microformat wave, and the amplitude will also decay from the center to the surrounding area.
2.1.3. The Modeling of the Air RF Signal
An FMCW millimeter-wave radar utilizes linear frequency-modulated pulse signals, where the signal frequency increases linearly over time. After inputting the radar’s transmitted signal (TX) and received signal (RX) into the mixer, an intermediate frequency signal (IF) is output. The instantaneous frequency of the IF signal is the difference in instantaneous frequency between the TX and RX signals. The received signal (RX) corresponds to a delayed version of the transmitted signal (TX).
For a point at a distance d from the FMCW millimeter-wave radar, the IF signal is a sine wave, which can be expressed as follows:
where , , S is the frequency rate of change of the FMCW signal, and τ is the delay between receiver (RX) and transmitter (TX) in s; λ is the wavelength of the signal in m; d is the distance from the surface of the water to the millimeter-wave radar plate in m; cl is the speed of light; and φ0 is the initial phase of the IF signal.
By combining Equation (8) with φ0, the influence of water surface vibration on the phase change of the IF signal can be described as follows:
where φif is the change of the IF signal phase with time, and δ is the change in displacement in m at the sea–air media surfaces. The change of displacement at the surface of the water can be obtained through the change of phase of the IF signal in the RF channel, and then the information of underwater acoustic signal can be obtained.
2.2. The Detection and Extraction of Acoustic Micromotion Signals
In the actual measurement process, the extraction of the phase from the range gate is obtained through the combination of IQ dual-channel signals by calculating the arctangent function, with the results confined within ±π. When the amplitude of surface water vibrations exceeds half the wavelength, the actual phase change will surpass 2π. Under such circumstances, the extracted phase results do not accurately reflect the fluctuations of the water surface, and phase discontinuities may occur [13]. This can lead to the submersion of frequency components corresponding to phase changes caused by acoustically induced micromotion. After obtaining the phase change results of the IF signal, it is necessary to perform phase unwrapping on the acquired phase data.
The amplitude of the surface waves stimulated by underwater acoustic signals at the water surface is significantly smaller than that of the interference signals and noise signals [25]. Accurately extracting phase information from surface wave motion requires the elimination of noise interference. Initially, the raw signal undergoes the extraction of the IF signal, averaging two chirps within a frame, followed by frame accumulation. After extracting the phase changes and performing unwrapping, the relationship between amplitude and sampling points is established. To distinguish acoustically induced micromotion surface wave signals from noise, a suitable filtering method must be selected. Compared to Chebyshev filters and elliptic filters, Butterworth filters have the advantage of maximally flat frequency response curves within the passband. In contrast, Chebyshev filters and elliptic filters exhibit unstable fluctuations in amplitude–frequency characteristics within the passband, leading to irregular errors between different frequencies and amplitudes [26]. Based on Butterworth filtering theory, the acoustically induced micromotion surface wave signals at the water surface, induced by underwater sound sources, are separated from the noise signals. This process filters out low-frequency noise on the water surface and eliminates phase spikes from radar, ultimately extracting the surface wave signals stimulated by the underwater acoustic signals.
3. The Theoretical Simulation and Analysis of Underwater Acoustic Signals for Cross-Sea–Air Media Detection
In order to study the accuracy of the theoretical model of cross-sea–air media detection, MATLAB R2024a software was used to simulate the theoretical model of a cross-media communication channel, and the process of the acoustic excitation of water surface waves and the millimeter-wave radar to detect underwater sound field information under the action of surface tension was simulated and analyzed, which verified the accuracy of the theoretical model and provided guidance for the selection of experimental parameters.
3.1. The Simulation of Acoustic Water Surface Micromotion
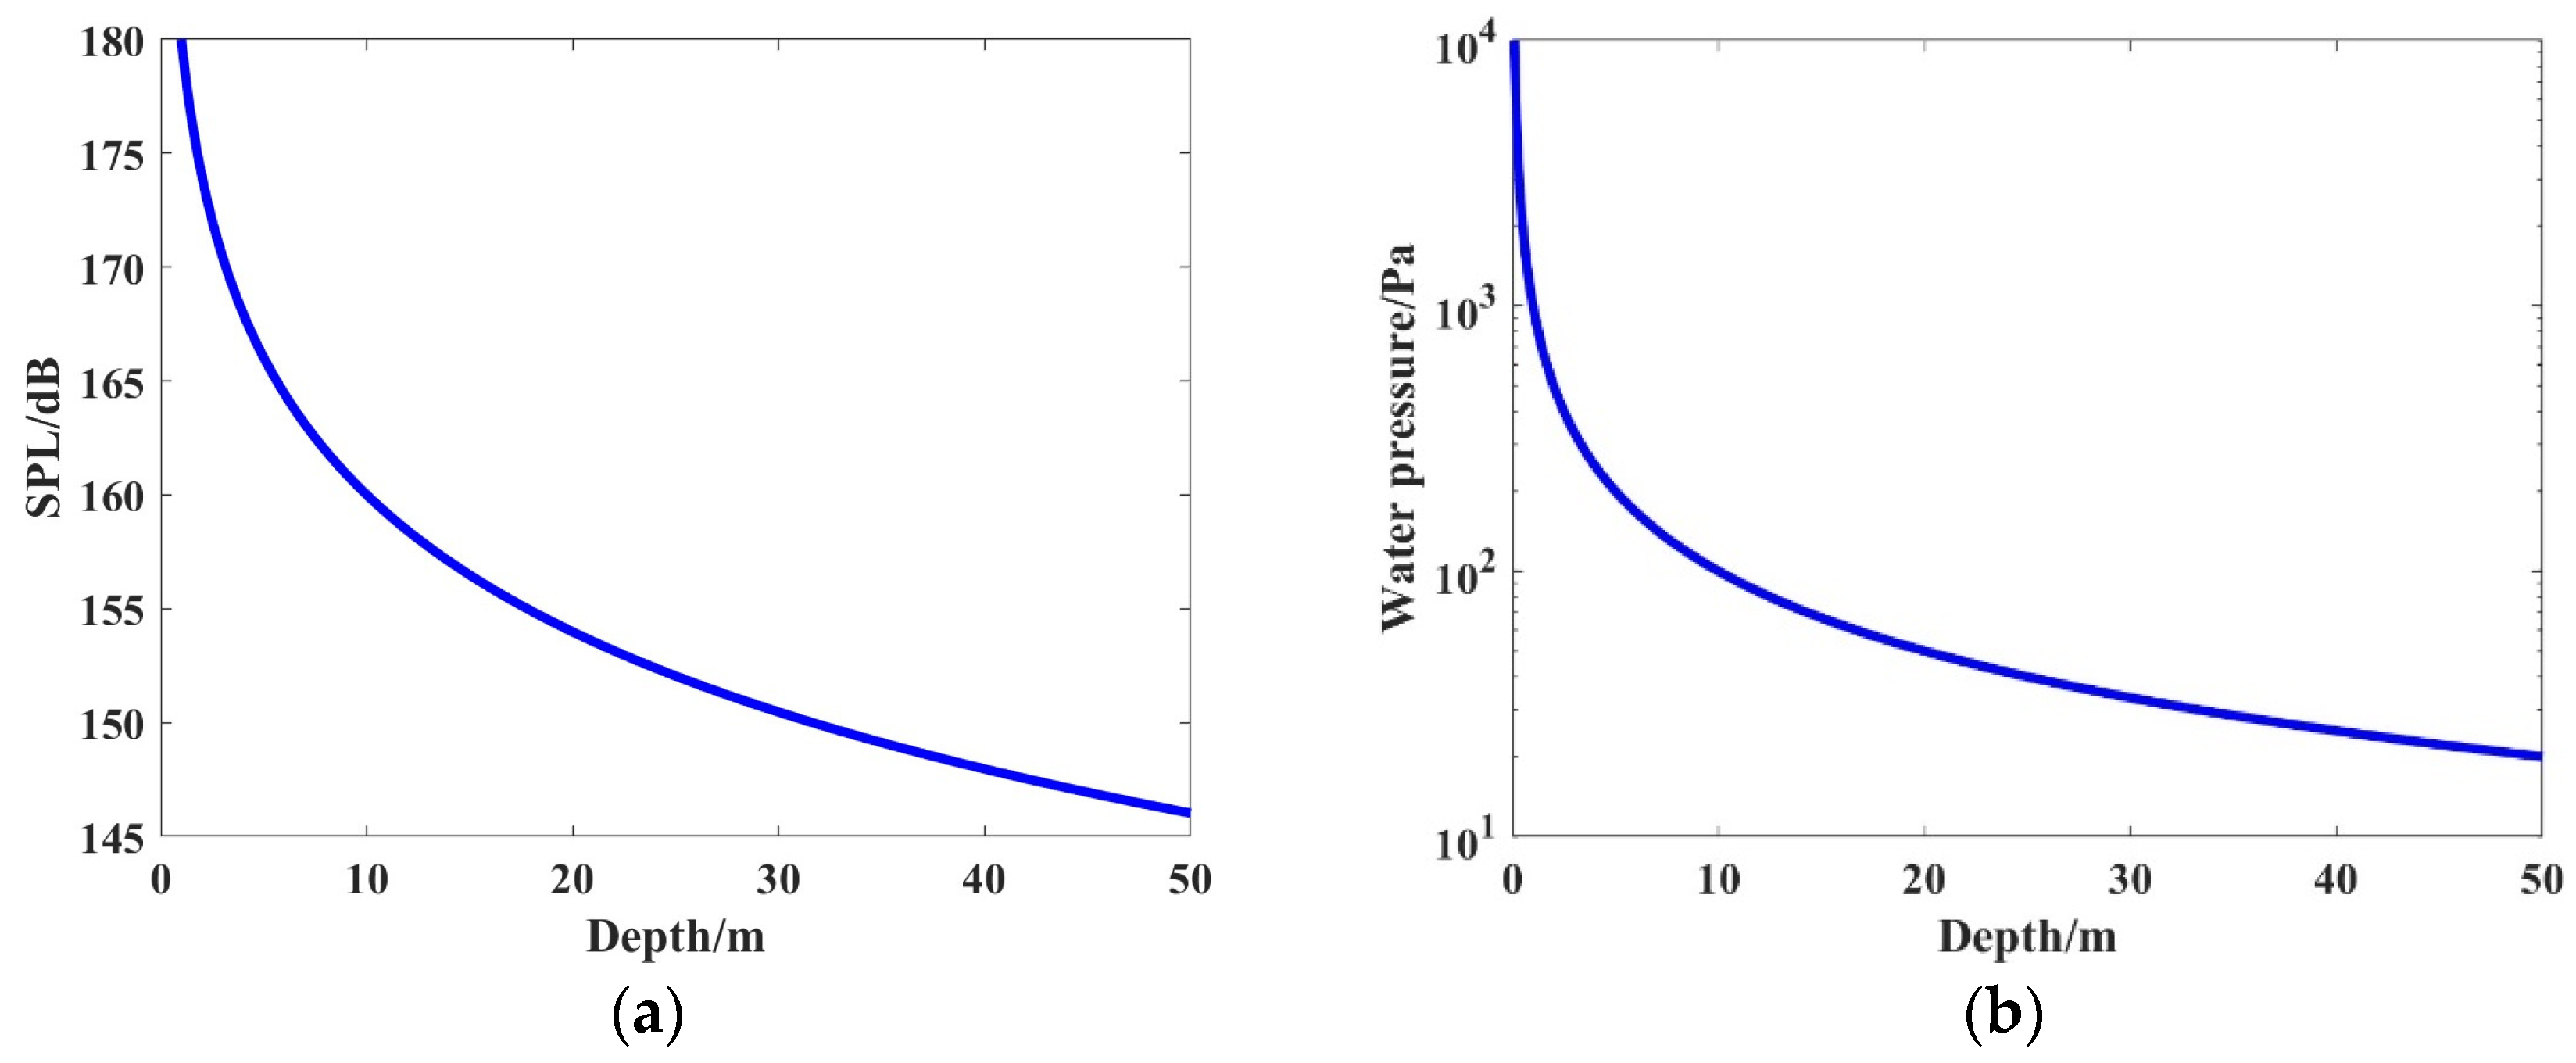
According to Equations (6) and (8), the effect of underwater acoustic signals on the water surface can be divided into two processes: acoustic excitation and water surface propagation. The underwater sound source level was set to 180 dB, the density ρ of water was , and the sound velocity c was 1485.2 m/s. This process was simulated using MATLAB software. The changes in the sound pressure level and wave pressure at the water surface with depth are shown in Figure 1.
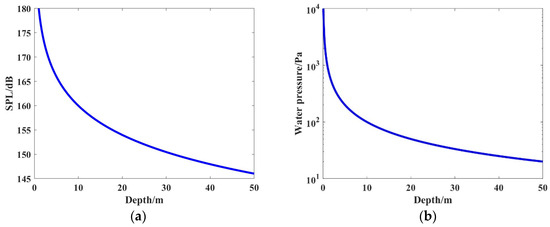
Figure 1.
Changes of water surface sound pressure level and wave pressure with depth. (a) Sound pressure level varies with depth; (b) wave pressure varies with depth.
As can be seen from Figure 1, the sound pressure level and wave pressure reaching the water surface decreased with increasing depth, and the wave pressure directly affected the maximum amplitude at the center of the wave on the water surface that was excited by sound waves. The relationship between the maximum amplitude of the surface wave center and the depth at the frequency of 50~1000 Hz is shown in Figure 2.
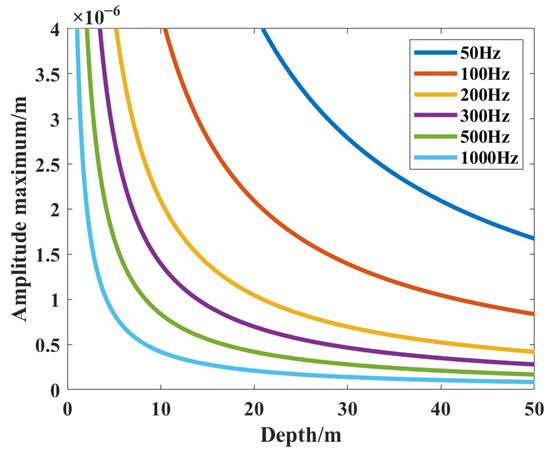
Figure 2.
Variation of the maximum amplitude of the water surface waves with depth at different frequencies.
As can be seen from Figure 2, at the same depth, the higher the frequency of the sound source, the smaller the amplitude of the surface wave was, and the more difficult it was to detect the underwater sound field information from the air across the media. Therefore, it is necessary to comprehensively consider the actual situation of the water surface, and it is not possible to blindly increase the signal frequency for the one-sided pursuit of high speed.
After obtaining the acoustic wave pressure data at the water surface and considering the role of water surface tension, combined with Equation (8), the sound source frequencies were set to 50 Hz, 100 Hz, 150 Hz, and 200 Hz, respectively. At a depth h of 1.5 m, the amplitude attenuation coefficients were 153.1736, 755.9125, 1872.3, and 3504.2, respectively. The wave numbers of surface waves were 1073.9, 1744.9, 2301, and 2795.2, respectively. The propagation of the water surface waves stimulated by the acoustic waves is shown in Figure 3.
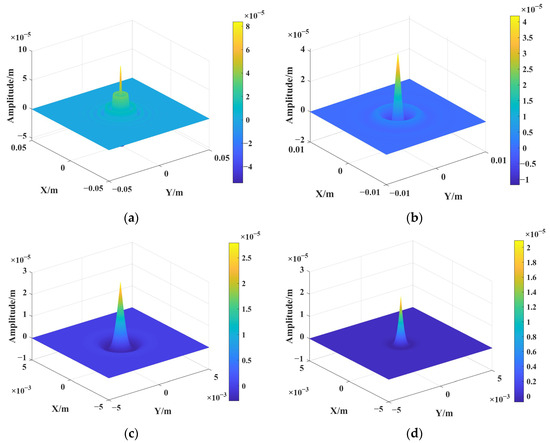
Figure 3.
Propagation of the water surface waves stimulated by sound waves of different frequencies. (a) 50 Hz; (b) 100 Hz; (c) 150 Hz; (d) 200 Hz.
In Figure 3, the X-axis and Y-axis represent the position coordinates of the water surface, while the Z-axis represents the amplitude of the water surface waves, with the unit being m. According to the dispersion relation of the acoustically induced water surface waves, the wave number of the water surface waves increased with frequency, and the attenuation coefficient of water surface wave amplitude was mainly affected by the wave number, which in turn affected the amplitude and spreading range [23]. As can be observed from the figure, under the same sound source level and depth, the propagation range and amplitude gradually decreased with the increase in frequency, thus increasing the difficulty of cross-media detection. At the same frequency, the amplitude at the center of the water surface wave was the highest and decreased exponentially towards the surroundings. Therefore, it is important for the millimeter-wave radar to aim near the center of the water surface waves for cross-sea–air media detection.
Figure 4 shows the change in the amplitude of the water surface waves with different frequencies over time. The depth h was still 1.5 m, which is consistent with Figure 3. It can be seen from the figure that as time passes, the fluctuation of the water surface wave amplitude attenuated to 0. Radar detection is a real-time process, in which the time for a single chirp signal is in the μm range, and the time for a very low frequency signal to decay to 0 is several hundred seconds. This characteristic has no impact on the cross-media detection of single frequency signals, but it can cause serious aliasing interference in the detection of signals such as linear frequency modulation and 2FSK. Therefore, when selecting signal frequencies, it is necessary to comprehensively consider the actual situation of the sound source signal and not blindly choose low-frequency signals for the sake of blindly pursuing the propagation range of water surface waves.
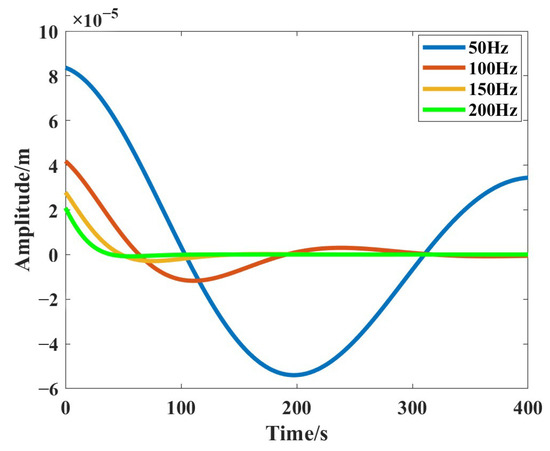
Figure 4.
Changes in the amplitude of the water surface waves of different frequencies with time.
3.2. The Simulation of Cross-Sea–Air Media Detection
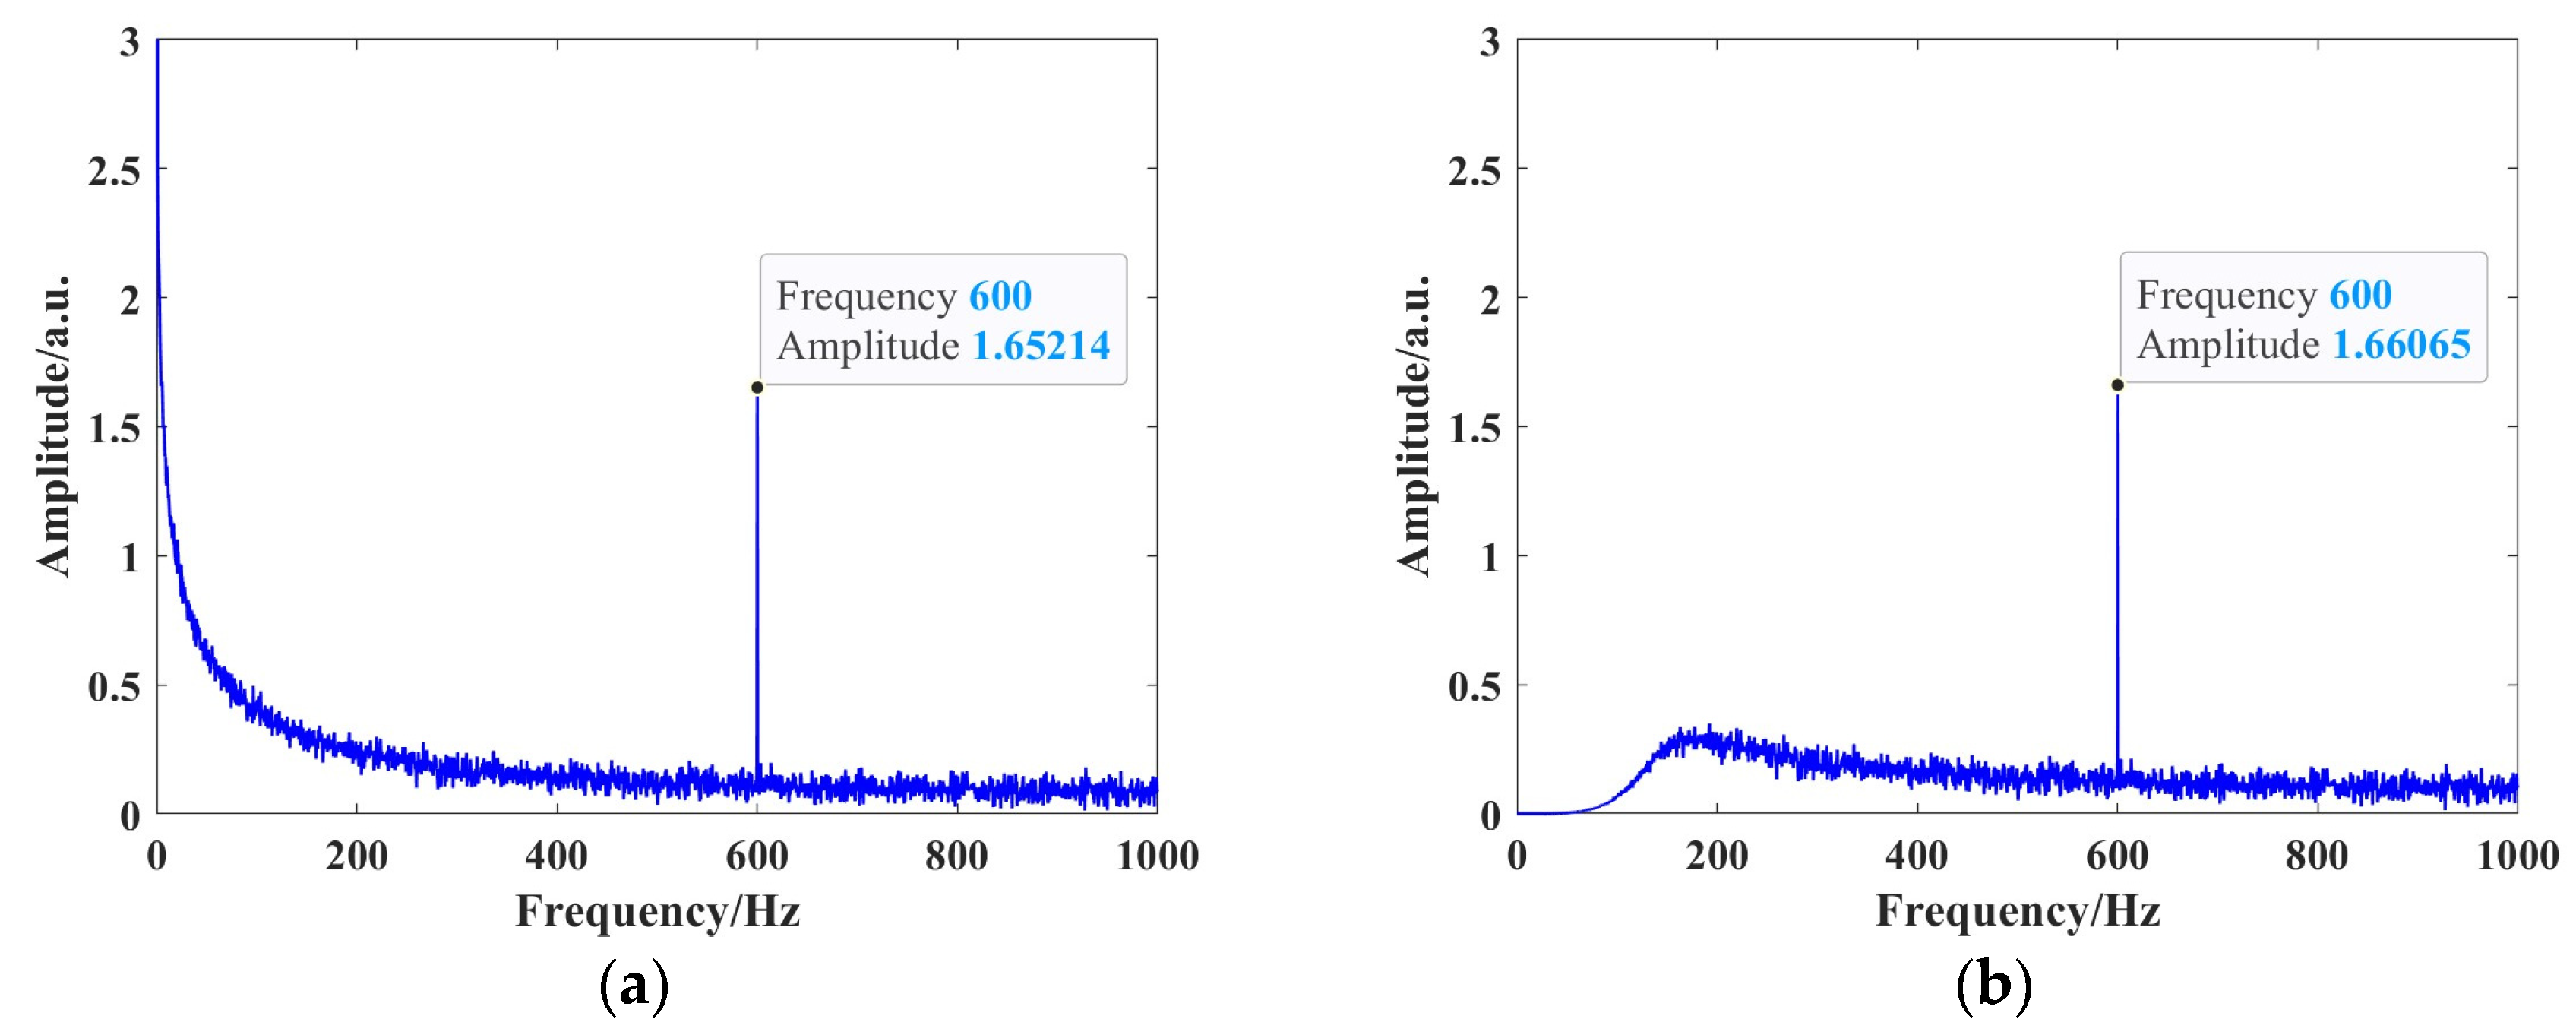
The noise interference present in water primarily includes surface wave interference, very low-frequency noise, 1/f noise, high-frequency noise, and white noise. The sources of these noises are a combination of mechanical noise, hydrodynamic noise, wave noise, thermal noise from seawater, and biological noise [20,21,27]. It can be seen from Figure 2 that at the same depth, the amplitude of the water surface wave stimulated by the low-frequency acoustic signal at the water surface was higher than that of the high-frequency signal. In order to find a suitable filtering method and achieve the underwater acoustic signal detection by a millimeter-wave radar from the air, the process of detecting the water surface by a millimeter-wave radar and the process of processing the original signal by Butterworth filtering were simulated and analyzed. The simulation results of 600 Hz single frequency signal are shown in Figure 5.
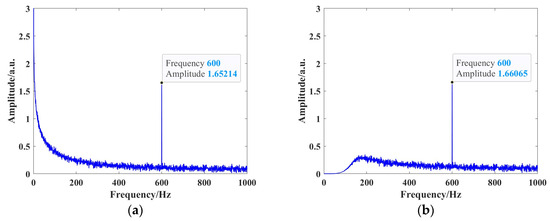
Figure 5.
The theoretical simulation of single-frequency signal cross-media detection. (a) Water surface raw signal; (b) filtered signal.
In the figure, the horizontal axis represents frequency, measured in Hz, and the vertical axis represents the amplitude of surface waves. From Figure 5a, it can be observed that the amplitude of surface waves and very low-frequency noise was significantly greater than the amplitude of acoustically induced surface micromotion waves at 600 Hz. According to the spectral characteristics of the wave noise, the wave exhibited significant 1/f noise characteristics in the low-frequency band. The variation in amplitude with frequency in the graph shows a clear inverse proportionality, which is also illustrated by the raw collected data in a figure in Section 4.2.1 (the experimental section). The Butterworth filter was used to filter the original signal on the water surface: the order was set to 5. The attenuation rate at this setting was 30 dB/oct, allowing the stopband to attenuate quickly and avoiding signal distortion due to a long transition band. The poles ware at −0.31 ± 0.95i, −0.81 ± 0.59i, and −1 + 0i. The cutoff frequency was set to 120 Hz, and the filtered signal is shown in Figure 5b. From the figure, it is evident that most of the low-frequency noise was filtered out. The amplitude of the 600 Hz single-frequency noise was 1.66, which is greater than the average amplitude of 0.25 for white noise. Theoretically, this allows for the direct detection of underwater single-frequency acoustic signals from the air, meeting the requirements for cross-media communication.
To avoid aliasing interference caused by excessively long signal attenuation times, the theoretical model simulation of linear frequency modulation signals requires the selection of a sweep frequency band greater than 200 Hz. The set sweep frequency range is 400 Hz to 800 Hz, with a sweep time of 1 s. The simulation results for the detection of underwater linear frequency modulation signals across sea–air media are shown in Figure 6.
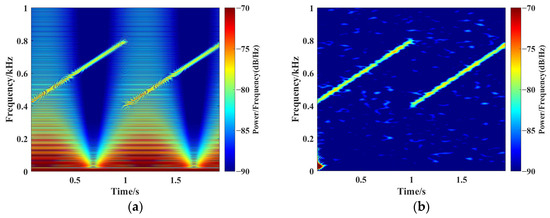
Figure 6.
Time–frequency diagram of the theoretical simulation of the cross-media detection of linear FMCW signals. (a) Water surface raw signal; (b) filtered signal.
In Figure 6, the horizontal axis represents time in seconds (s), and the vertical axis represents the frequency of water surface vibrations detected from the air, measured in kilohertz (kHz). The colored bar represents the power frequency ratio in decibels per hertz (dB/Hz). Figure 6a shows that the original signal was affected by periodic wave interference with a period of 2 s and 1/f noise interference, both of which have a power frequency ratio greater than that of the linear frequency modulation signal between 400 Hz and 800 Hz. Figure 6b demonstrates that after Butterworth filtering, the wave interference and 1/f noise interferences were completely eliminated, and most of the white noise was filtered out. A clear linear frequency modulation signal at −75 dB/Hz can be observed, proving that the aliasing interference caused by delays in the frequency range above 400 Hz was negligible. This allows for the cross-media detection of frequency-modulated signals from the air. Further experimental studies will be designed to investigate this further.
4. The Experimental Process and Results of Detecting Underwater Acoustic Signals across Sea–Air Media
To further investigate the correctness of the cross-sea–air media channel theoretical model and assess the feasibility of detecting underwater acoustic signals across sea–air media, experiments were conducted to detect the single-frequency signals of different sound source levels and signals of different frequencies. The experimental results were compared with the theoretical simulations to evaluate and refine the accuracy of the model.
4.1. Introduction to the Experimental Environment
The experiments were conducted at the Ocean Observation and Detection Experimental Base, which can be analogized to an artificial lake simulating level 1 sea conditions. The environment maintained a constant water temperature of 25 °C, had no solar heating, and exhibited a water transparency of more than 7 m. This controlled environment ensured the accuracy and reliability of the measurement data, aided in studying the theoretical mechanisms, and helped evaluate and optimize the performance of the equipment. Furthermore, it provided a reliable experimental basis and technical verification for subsequent sea experiments and practical applications.
The experimental system was divided into two main components: the above-water part and the underwater part. The innovation of this system lies in the pure physical process of loading underwater acoustic signals onto the airborne RF signals emitted by the FMCW millimeter-wave radar on the water–air media surfaces, achieving the detection of underwater acoustic signals through the air and enabling cross-media communication from underwater to the air. The millimeter wave radar was selected from TI’s AWR1642 millimeter wave sensor, whose corporate headquarters are located in Dallas, TX, USA. The underwater component consisted of a computer, data acquisition and transmission system, power amplifier, and underwater speaker. The computer controlled the signal form output by the underwater speaker, generating underwater acoustic signals that met the experimental requirements, and set up a hydrophone to monitor the underwater sound field in real-time. The above-water component comprised an FMCW millimeter-wave radar and a computer. The radar operates at a frequency of 77 to 81 GHz, with the frequency slope set to 29.982 MHz/μs and ADC samples set to 128. The collected data were input into the computer for subsequent processing. The experiment was conducted in the Ocean Observation and Detection Experimental Base, and the specific models of the experimental equipment are shown in Table 1. In the experiment, the underwater acoustic signal propagation process was considered as point source spherical radiation, with n in Equation (1) taking the value of 2. Hydrophones were primarily used for the real-time monitoring of the underwater acoustic field environment, calibrating the sound source level, determining the actual underwater sound source parameters, and ensuring the accuracy of the calculation results.

Table 1.
Models of the experimental equipment.
The block diagram of the experimental system is shown in Figure 7. The FMCW millimeter-wave radar was placed at 0.5 m above the water surface to scan the water surface vertically, and the underwater loudspeaker was placed at a water depth of 1.5 m, which was deeper than the index of 0.15~1 m in the existing research results. The hydrophone was placed at a horizontal distance of 1 m from the center of the underwater speaker, and the underwater speaker had good omnidirectionality underwater.
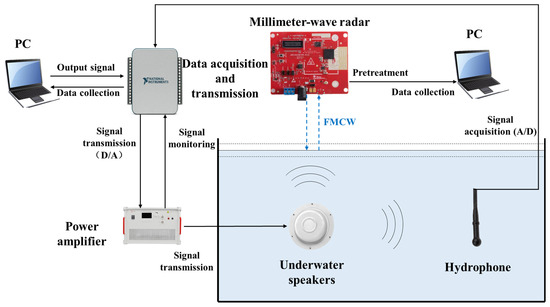
Figure 7.
Experimental system block diagram.
4.2. Experimental Result
4.2.1. The Effect of the Sound Source Level on the Amplitude and SNR of Water Surface Waves
The underwater speaker was placed 1.5 m underwater, and the millimeter-wave radar board was placed 0.5 m above the water surface to illuminate the water surface vertically. We set the frequency to 600 Hz, changed the voltage amplitude of the input signal from 1.5 V to 0.5 V, saved and analyzed the experimental data, and obtained the experimental results when the input signal voltage amplitude was 1.5 V, as shown in Figure 8.
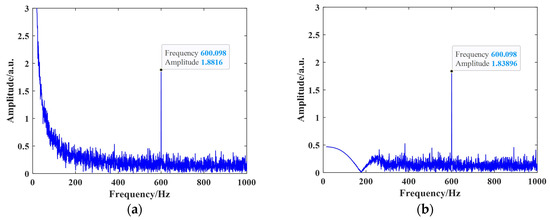
Figure 8.
Millimeter-wave radar acquisition signal with input signal amplitude of 1.5 V. (a) The original acquired signal; (b) the filtered signal.
Figure 8 shows the variation of the water surface wave amplitude with the frequency of the sound source when the amplitude of the input signal voltage was 1.5 V, where Figure 8a shows the original signal collected by the radar board, and Figure 8b shows the acoustic micromotion signal as separated after the filtering process. From Figure 8a, it can be seen that the amplitude of the noise signal was much larger than that of the acoustic micromotion signal, and the noise signal was mainly distributed in the low-frequency band. In Figure 8b, the original acquired signals were processed using the fifth-order Butterworth filtering method, and the pole column vectors were still −0.31 ± 0.95i, −0.81 ± 0.59i, and −1 + 0i. Figure 8 shows the data collected at the experimental site, reflecting the real situation of ambient noise in the water in its natural state. These data help us determine the dominant interference factors in both the low- and high-frequency bands and allows for a more accurate assessment of the influence of different interference factors such as sea surface waves, a very low frequency, 1/f noise, high-frequency noise, and white noise on the underwater environment. As can be seen from the figure, the experimental results are similar to the simulation results in Figure 5b. After filtering, the amplitude of the 600 Hz single-frequency signal was 1.84, which was larger than the noise signal with an average amplitude of 0.3, and the acoustically induced micromotion water surface wave was effectively separated.
In order to investigate the fit between the theoretical model and the experimental results, a side-by-side comparison of the experimental results when the input signal voltage amplitude was varied from 1.5~0.5 V is shown in Figure 9, in which the signals are all acoustic micromotion signals that were separated and extracted from the raw signals collected by the millimeter-wave radar.
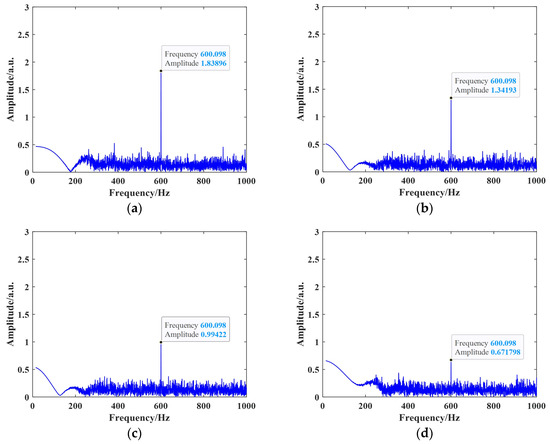
Figure 9.
Spectra analyses of acoustically induced micromotion signals after filtering at different input amplitudes. (a) 1.5 V; (b) 1.2 V; (c) 0.8 V; (d) 0.5 V.
Figure 9a shows the variations in the acoustic micromotion water surface wave amplitude with the frequency of the sound source that were obtained when the input signal voltage amplitude was 1.5 V. From Figure 9a, it can be seen that the acoustic micromotion signal had a frequency of 600 Hz and an amplitude of 1.84. Figure 9b–d shows the results of the experiments when the input signal voltage was 1.2 V, 0.8 V, and 0.5 V, respectively, and from the figure, it can be seen that the frequency of the signal kept the signal frequency constant at 600 Hz, the amplitude of the acoustic micromotion water surface wave decreased to 1.34, 0.99, and 0.67 with the decrease of the input signal voltage amplitude, but the amplitude and frequency range of the noise interference remained basically unchanged.
Based on the data collected by the hydrophone, the magnitude of the sound source level could be accurately calculated, and the calculation can be expressed as follows:
Based on Equations (1), (8), and (11), the theoretical simulation results for the amplitude of the acoustically induced micromotion water surface waves as a function of the amplitude of the sound source were obtained. These results were compared with the experimental values collected by the radar board, which measured the amplitude of the acoustically induced micromotion water surface waves as a function of the amplitude of the sound source. The relationship between the surface wave amplitude and the sound source amplitude is shown in Figure 10. From the figure, it can be seen that when the input signal voltage amplitude varied between 0.5 V and 1.5 V, the water surface wave amplitude changed between 13 μm and 42 μm. The theoretical values of the water surface wave amplitude exhibited a linear relationship with the amplitude of the sound source, with a correlation coefficient of 0.99 between the theoretical and experimental values. This indicates that the FMCW millimeter-wave radar’s detection of the amplitude variations of acoustically induced micromotion water surface waves from the air is consistent with the theoretical simulation results, thereby validating the correctness of the theoretical model.
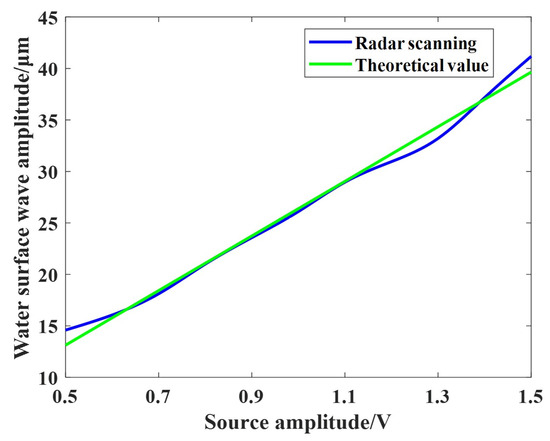
Figure 10.
Variation of water surface wave amplitude with sound source amplitude.
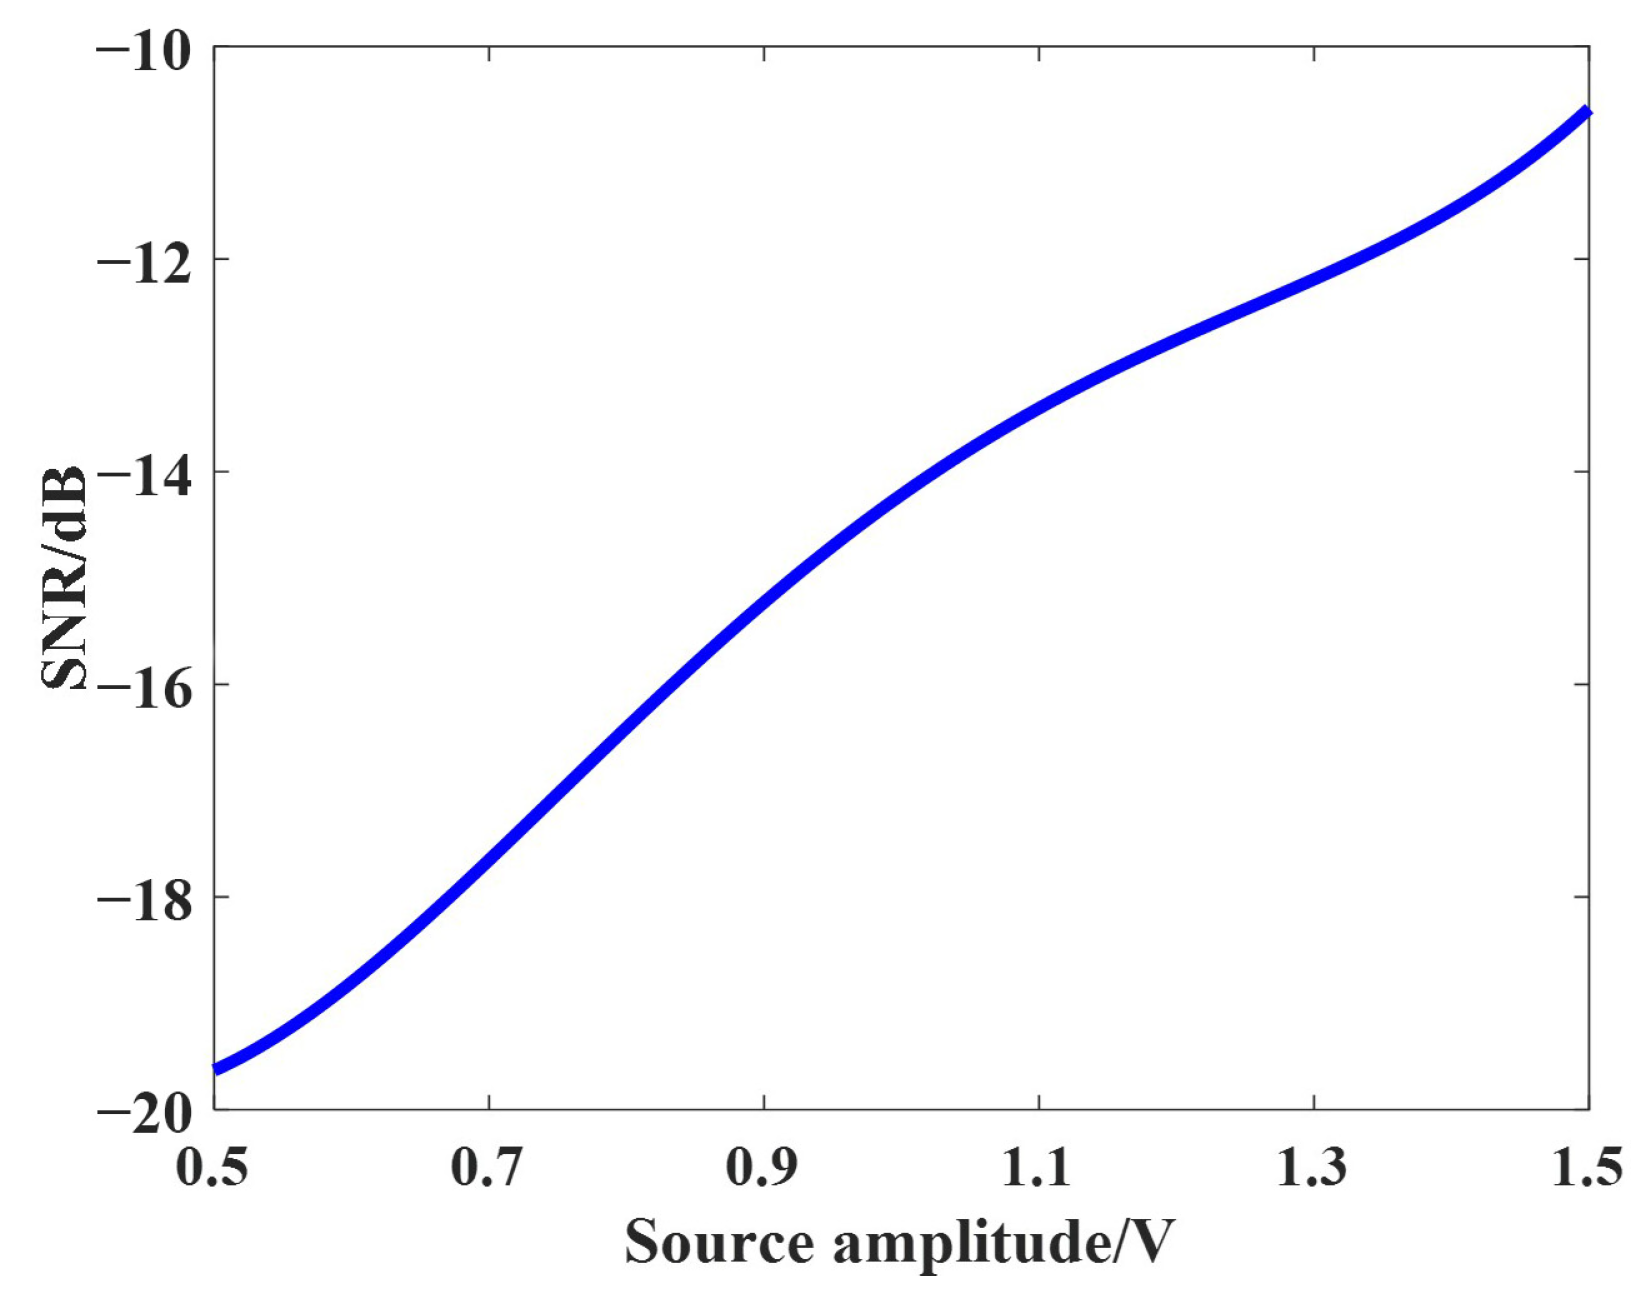
In order to evaluate the filtering algorithm and the actual effect of cross-media communication from underwater to air, an SNR channel model was used to study the millimeter-wave radar sweep frequency data of the above experiments, and the variation of SNR with the amplitude of the sound source is shown in Figure 11.
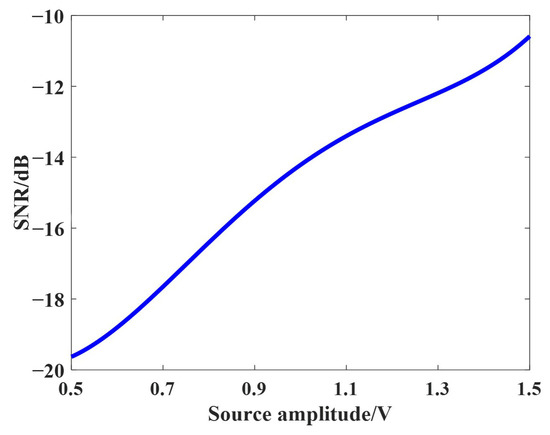
Figure 11.
Signal to noise ratio under different sound source amplitudes.
As can be seen from Figure 11, the larger the amplitude of the sound source, the larger the signal-to-noise ratio, and the larger the proportion of signal power. In the range of 0.5 V to 1.5 V, the signal-to-noise ratio was −20 dB to −10 dB, and the noise power was 10 to 100 times the signal power. This shows that the filtering algorithm can still separate the acoustically induced micromotion water surface wave signal from the complex sea state when the noise power is much larger than the signal power, so as to ensure that the communication system can transmit information effectively.
4.2.2. The Effect of Frequency Variation on the Amplitude and Signal Power of Water Surface Waves
The modulation encoding principle of Two-Frequency Shift Keying (2FSK) involves using two carrier frequencies to transmit Binary Frequency Shift Keying symbols. Each transmitted symbol represents its respective carrier frequency. This method holds significant application value in cross-media communication from underwater to air. Experiments conducted using only a single frequency of 600 Hz are insufficient to demonstrate that the system can effectively transmit information across sea–air media communication links. It is necessary to alter the signal form to study communication conditions across different frequency bands.
The underwater loudspeaker was located at 1.5 m underwater, and the millimeter-wave radar board was located at 0.5 m above the water surface. The voltage amplitude of the input signal was maintained at 1.5 V, and the signal frequency was changed to 500 Hz, 700 Hz, 400 Hz, and 800 Hz, respectively. The experimental results obtained after processing are shown in Figure 12.
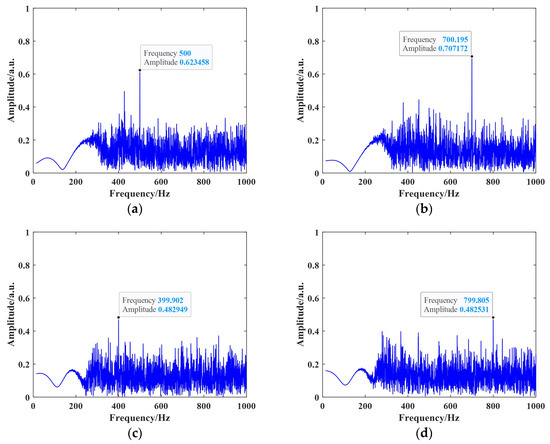
Figure 12.
Spectra analyses of acoustically induced micromotion surface waves after filtering at different sound source frequencies. (a) 500 Hz; (b) 700 Hz; (c) 400 Hz; (d) 800 Hz.
Figure 12 shows the spectra analyses of the experimental results of acoustic micromotion signals at different frequencies, and the significance of the horizontal and vertical coordinates is the same as that of Figure 9. From Figure 12, it can be seen that when the underwater speaker emitted sound signals of different frequencies, the corresponding frequency of the acoustic micromotion water surface waves could be scanned from the water surface, while interference signals such as natural water surface fluctuations remained consistent. When the frequency was 500 Hz in Figure 12a and 700 Hz in Figure 12b, the acoustic micromotion signal was effectively separated, with amplitudes of 0.62 and 0.71, respectively. When the frequencies were 400 Hz in Figure 12c and 800 Hz in Figure 12d, the amplitude of the acoustic micromotion signals was only 0.11 and 0.08 higher than the maximum amplitude of the noise signals, which were both less than 0.5, and the acoustic micromotion signals were almost annihilated in the noise.
The relationship between the amplitude of the water surface waves and the frequency of the sound source is shown in Figure 13. It can be seen from the figure that the amplitude of the water surface microwaves that were excited at the center frequency of 600 Hz reached the maximum value of 40.1 μm. The correlation coefficient between the theoretical and experimental values is 0.977, indicating that the amplitude data detected by the radar are consistent with the theoretical model, which verifies the correctness of the theoretical model. Values of 500~700 Hz represent a window with high amplitude, while amplitudes below 500 Hz or above 700 Hz are below 15 μm, indicating a relatively weak anti-interference ability. Choosing an appropriate frequency window as the communication frequency is of great significance for cross-sea–air media communication.
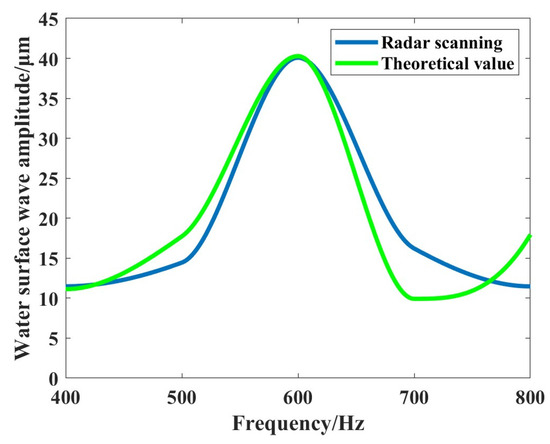
Figure 13.
The amplitude of the water surface waves varies with the frequency of the sound source.
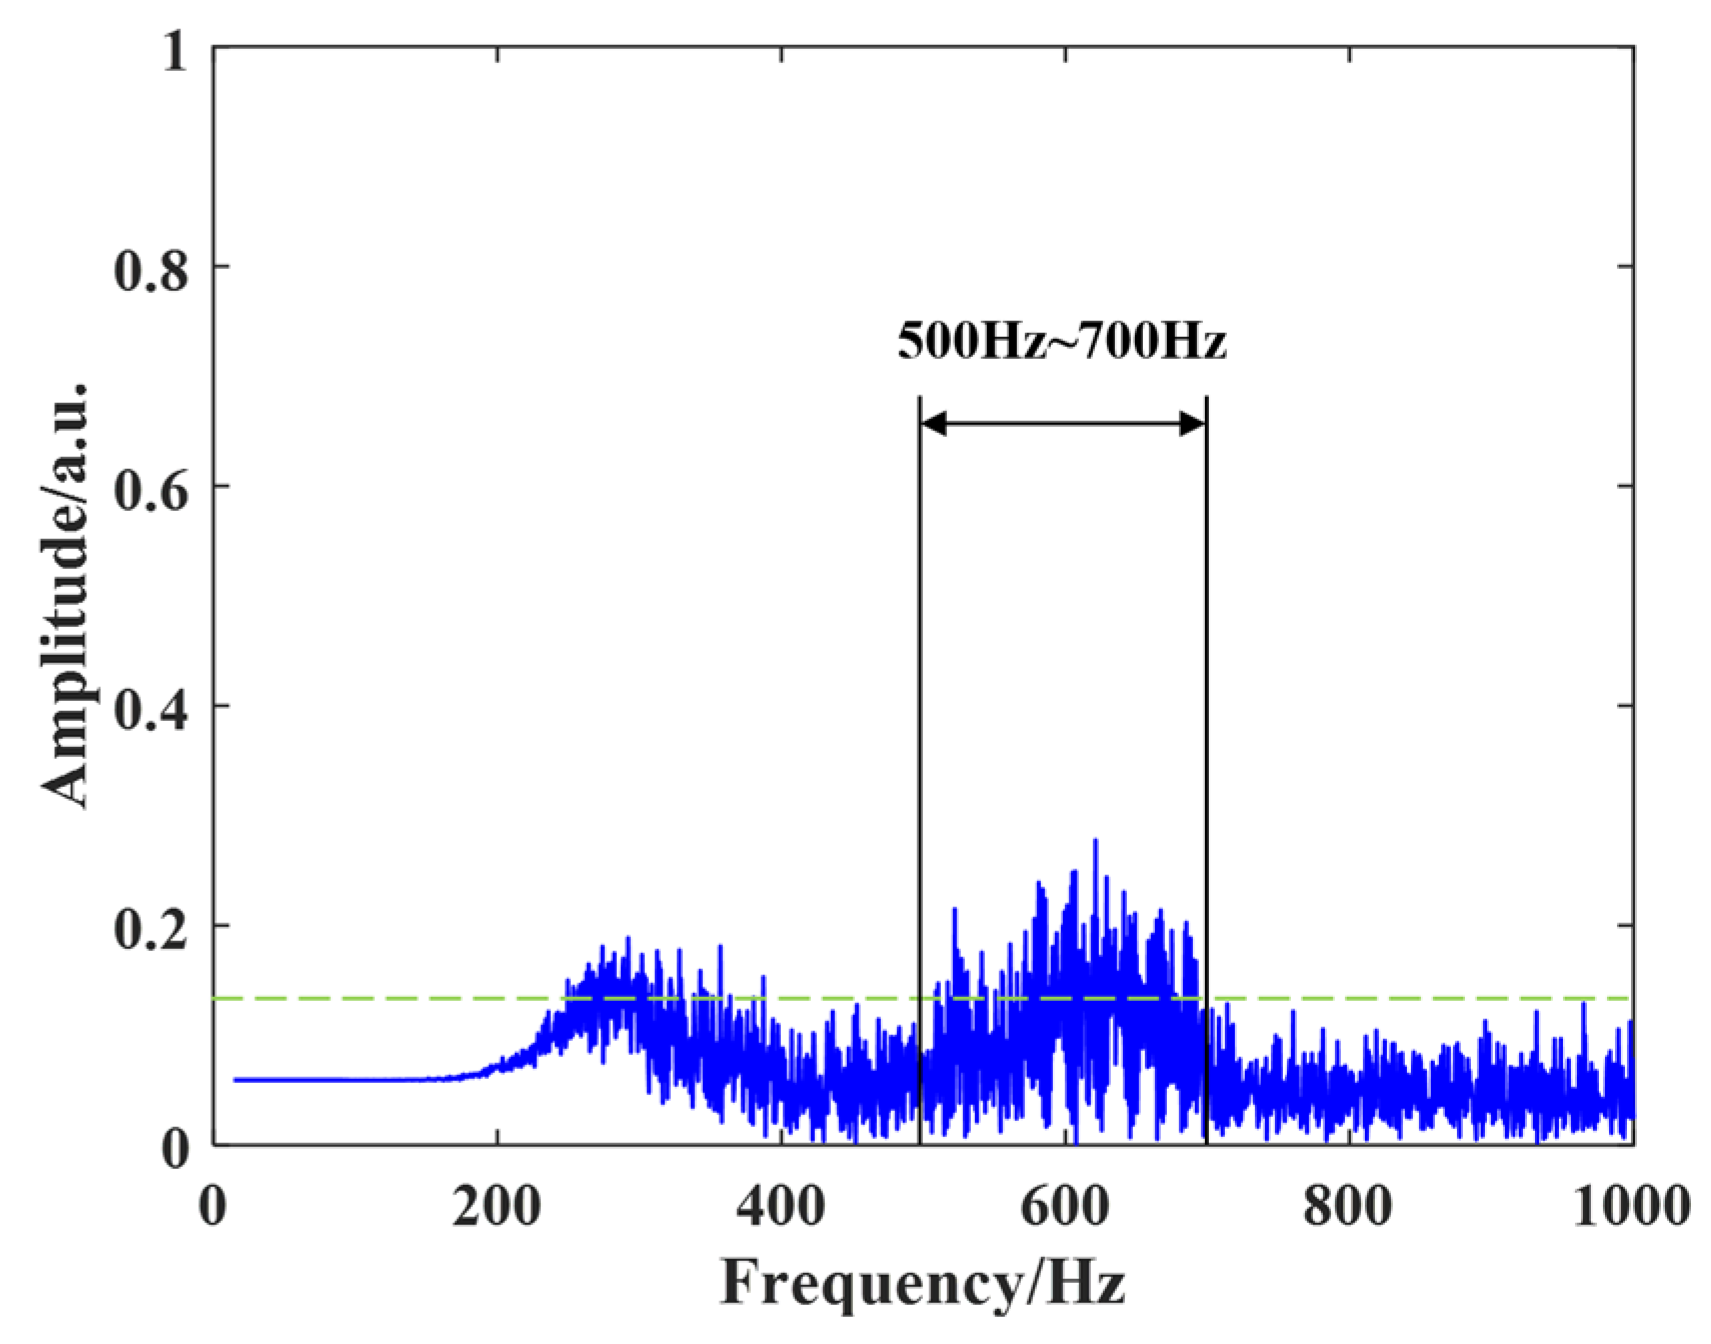
To study the cross-media detection effect of continuous changes in sound source frequency, the signal form was changed to a linear frequency modulation signal with a frequency range of 500 Hz to 700 Hz and a scanning time of 1 s. The frequency spectrum and time–frequency spectrum obtained from the repeated experiments are shown in Figure 14 and Figure 15, respectively.

Figure 14.
Spectrum analysis of a 500~700 Hz linear frequency modulation signal.
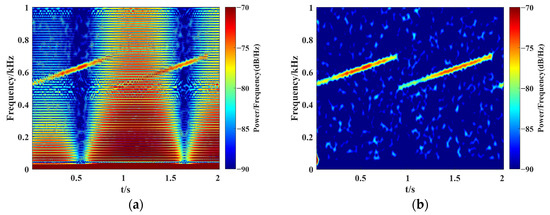
Figure 15.
Time–frequency diagrams of a 500~700 Hz linear frequency modulation signal. (a) The original acquired signal; (b) the filtered signal.
Figure 14 shows the variation in the surface wave amplitude of acoustically induced micromotion water with the frequency of the sound source when inputting a linear frequency modulation signal from 500 Hz to 700 Hz. The interval marked in the figure is the frequency range containing the acoustic micromotion signal. From Figure 14, it can be seen that the amplitude of the acoustic micromotion signal was at its maximum at the center frequency of 600 Hz, and gradually decreased from 600 Hz to both sides. The amplitude of noise signals such as natural water surface fluctuations remained unchanged. After filtering, the amplitude of the acoustically induced micromotion signal in the frequency range of 500~700 Hz was 0.18~0.09 higher than that of noise interference such as natural water surface fluctuations. The changes in the Figure 14 show a stepped shape, and the SNR at this time was −10.62.
Figure 15 is a time–frequency diagram of the information scanned by the radar board when inputting a 500 Hz to 700 Hz linear frequency modulation signal. The meanings of the horizontal and vertical coordinates and colored bars are consistent with Figure 6. Figure 15a is the original signal collected by the radar board, and Figure 15b is the filtered signal. From Figure 15a, it can be seen that the power of low-frequency noise interference signals is much greater than that of acoustically induced micromotion signals. Noise below 30 Hz had a maximum power frequency ratio of −20 dB/Hz, while the power frequency ratio of acoustic micromotion signals was −70 dB/Hz, which was much smaller than low-frequency noise. From Figure 15b, the processing effect of the filtering algorithm can be seen. After eliminating low-frequency noise, the power frequency ratio of low-frequency noise was reduced to −150 dB/Hz, and the power frequency ratio of other clutter was also reduced to −90 dB/Hz. Acoustically induced micromotion signals with power frequency ratios at −70 dB/Hz in 1.5 m water depth were extracted, which was greater than the existing research metric of −144 dB/Hz in 0.15~1 m water depth. The red linear frequency modulation signal can be observed in the figure, and the acoustically induced micromotion signal was effectively separated.
The frequency was changed to 400~800 Hz, and the frequency scanning time was still 1 s. The spectrum and time–frequency graphs obtained by repeated experiments are shown in Figure 16 and Figure 17, respectively.
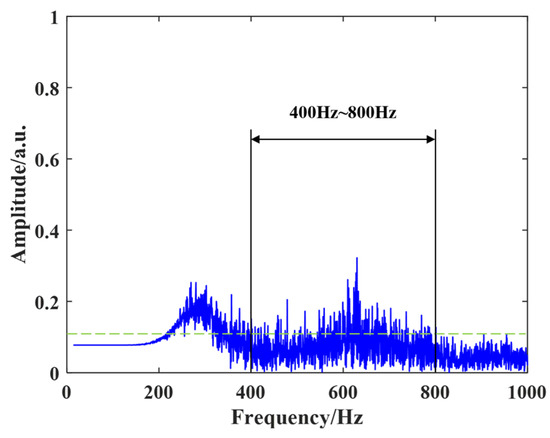
Figure 16.
Spectrum analysis of a 400~800 Hz linear frequency modulation signal.
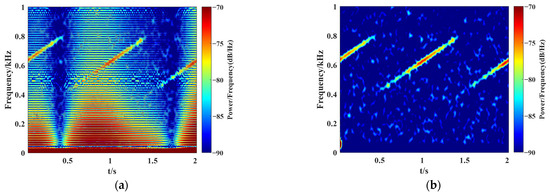
Figure 17.
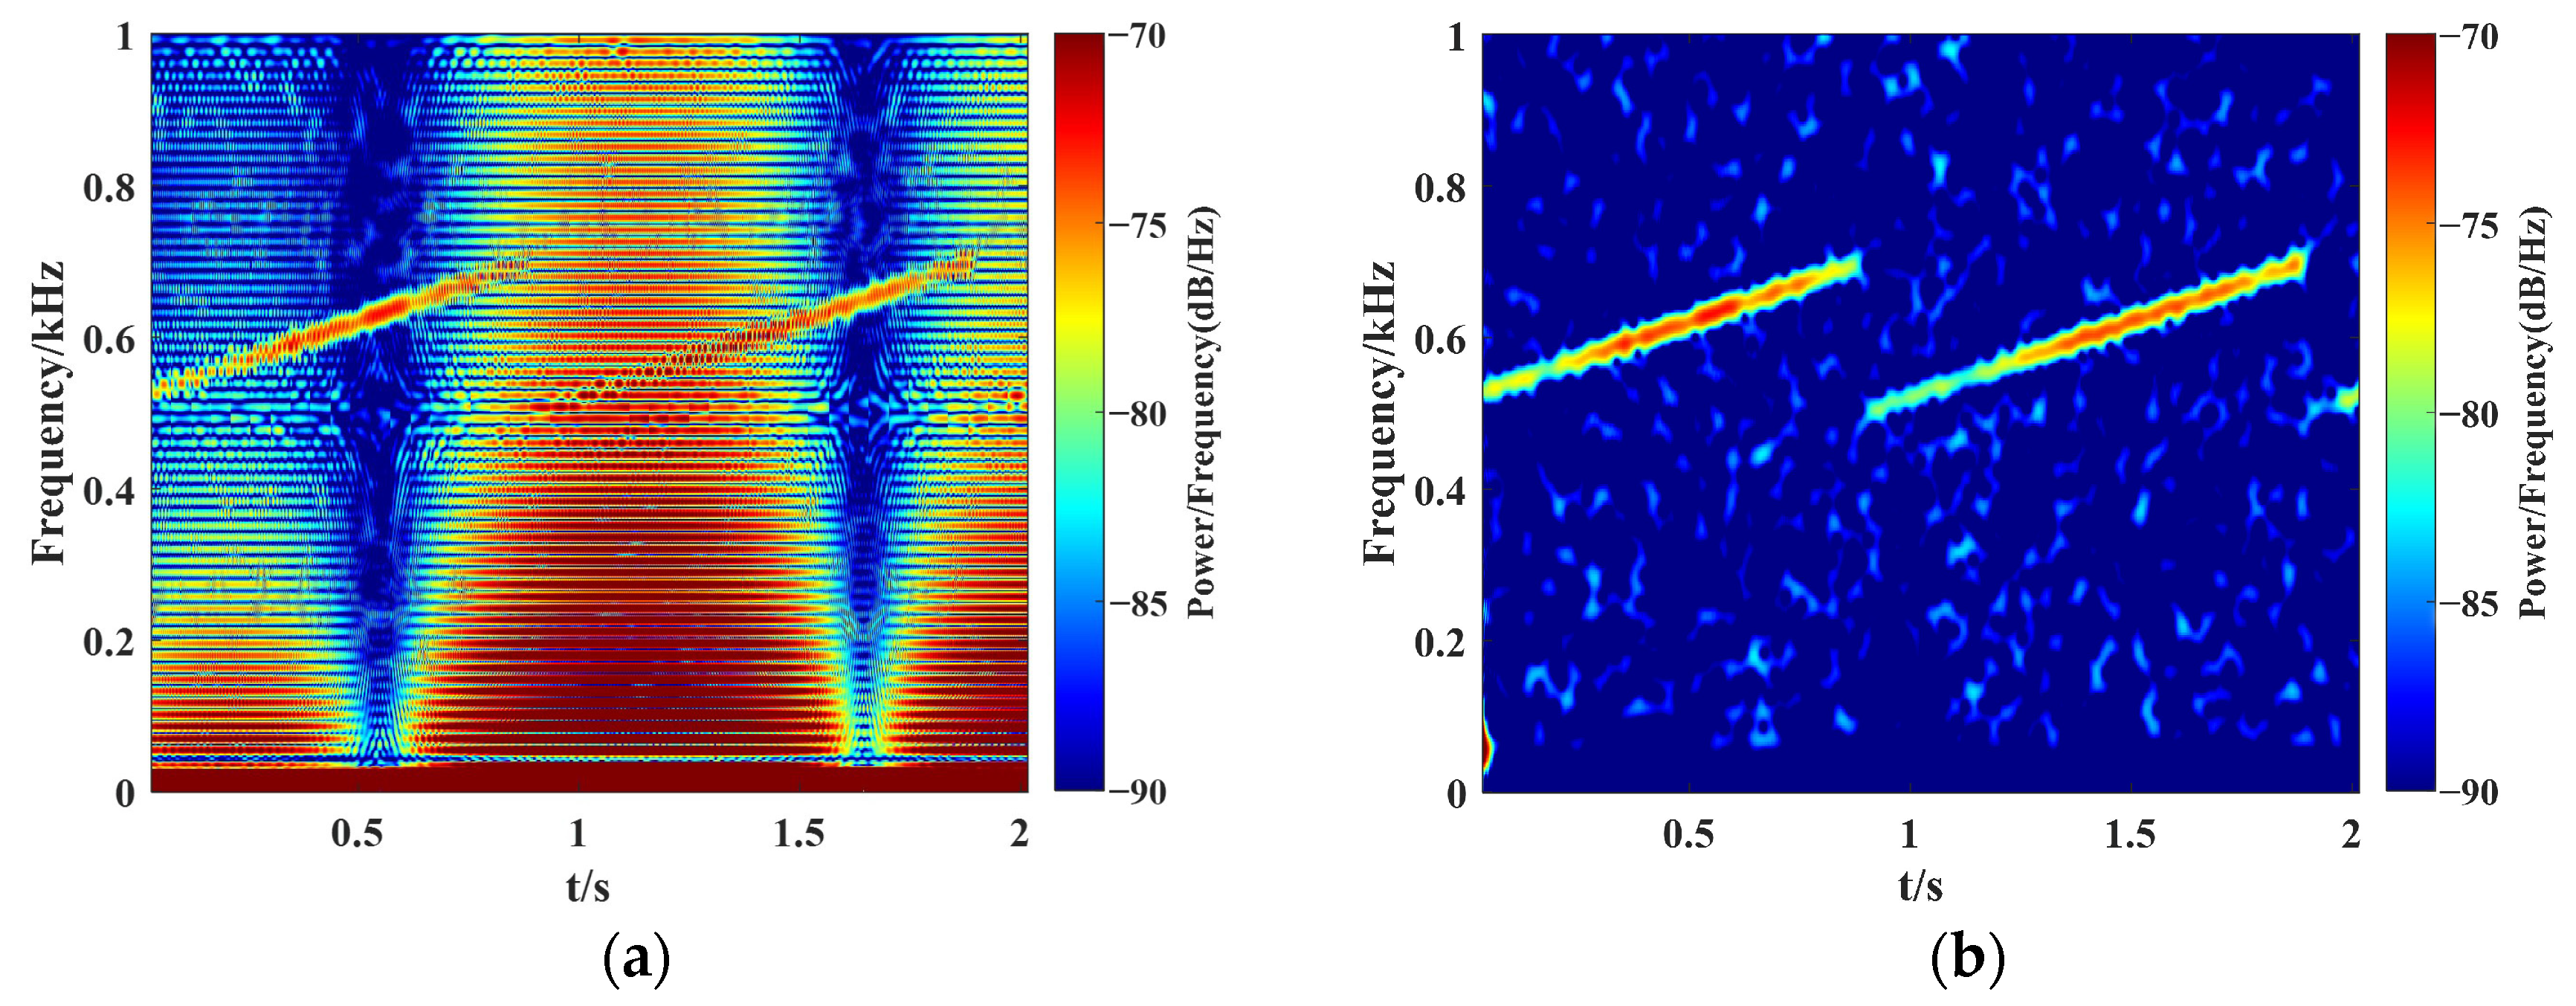
Time–frequency diagrams of a 400~800 Hz linear frequency modulation signal. (a) The original acquired signal; (b) the filtered signal.
Figure 16 shows the water surface vibration information scanned by the radar board when inputting a 400 Hz to 800 Hz linear frequency modulation signal. The meaning of its coordinate axis and labeled interval is consistent with Figure 14. From Figure 16, it can be seen that the amplitude of the acoustically induced micromotion water surface wave decreased from the center frequency of 600 Hz to both ends, consistent with Figure 14. The amplitude of noise signals such as natural water surface fluctuations remained unchanged, and the SNR at this time was −4.919. Differently, the amplitude in Figure 14 decreased in a step like manner at the 700 Hz edge, while the amplitude change trend in Figure 16 at the 800 Hz edge was relatively gentle. This indicates that in order to avoid communication errors caused by reaching the limit of the system amplitude, the frequency selected for communication cannot be lower than 400 Hz or higher than 800 Hz.
Figure 17 shows time–frequency diagrams of the information scanned by the radar board when a 400 Hz to 800 Hz linear frequency modulation signal is input. The meaning of the coordinates and color changes is the same as in Figure 6. Figure 17a shows that the power of low-frequency noise signals is significantly greater than that of acoustically induced micromotion signals. The power frequency ratio of noise below 30 Hz reached −20 dB/Hz, which is consistent with Figure 15. In contrast to Figure 17b, the power frequency ratio of the deep red linear frequency modulation signal decreased from −70 dB/Hz to −85 dB/Hz as it approached 400 Hz or 800 Hz. This is reflected in the thinning of the line segments at both ends and the fading of the red color, indicating that the system is nearing its limit.
Therefore, to ensure communication quality during cross-media detection, the communication frequency should not deviate significantly from the central frequency to prevent most acoustically induced micromotion signals from being submerged in noise, thereby affecting communication effectiveness. Through single-frequency and sweep-frequency experiments to test the communication system and filtering algorithms, the accuracy of the theoretical model simulations was verified. This proves that the experimental system is effective in detecting and extracting surface waves induced by underwater acoustic signals. It efficiently filters out disturbances such as wave noise, which has a much larger amplitude than the acoustically induced micromotion signals, as well as 1/f noise and white noise. A frequency window from 200 Hz to 400 Hz is suitable for cross-media communication from underwater to air, meeting the requirements for communication using 2FSK modulation. This provides a theoretical basis and experimental foundation for establishing cross-media communication links and transmitting information.
5. Conclusions
In this paper, underwater acoustic signals were extracted from surface waves detected by millimeter-wave radar using Butterworth filtering, with both theoretical simulations and experimental validations conducted. Following the phase extraction and unwrapping of the IF signal obtained from the FMCW millimeter-wave radar, micrometer-level vibrations of acoustically induced water surface micromotion were successfully detected, with amplitudes ranging from 13 μm to 42 μm. These results closely match with the theoretical model simulations, with a fitting coefficient of 0.99, confirming the accuracy of the theoretical model. Communication effects were evaluated using the signal-to-noise ratio (SNR) channel model, with SNRs ranging from −20 dB to −10 dB. This indicates that acoustically induced micromotion information can still be effectively extracted even when the noise power is 10 to 100 times the signal power. Experiments with different frequency signals confirmed that the FMCW millimeter-wave radar can effectively detect underwater acoustic signals in the range of 400 Hz to 800 Hz, with a fitting coefficient of 0.987 when compared to simulation results, thereby verifying the correctness of the theoretical model. A frequency window with a bandwidth of 200 Hz to 400 Hz is available for communication. The experimental validation shows that this frequency range can effectively overcome aliasing interference, making it suitable for real-time communication and meeting the requirements of 2FSK modulation. This demonstrates the feasibility of constructing a cross-media communication link from underwater to air. This provides significant technical support for subsequent bidirectional communication across sea–air media.
Author Contributions
Conceptualization, T.C., X.C. and J.Y. (Jianquan Yao); funding acquisition, X.C., Y.Y. and J.Y. (Jianquan Yao); methodology, T.C., X.C. and Q.T.; project administration, X.C., Y.Y. and J.Y. (Jianquan Yao); software, T.C. and Q.T.; validation, T.C., Y.D., T.Z., J.Y. (Jiaqi Yuan) and Z.Z.; writing—original draft, T.C.; writing—review & editing, T.C. and X.C. All authors have read and agreed to the published version of the manuscript.
Funding
This work was supported by the Opening Funding of National Key Laboratory of Electromagnetic Space Security, and Laoshan Laboratory Science and Technology Innovation Project (No. LSKJ202200801).
Institutional Review Board Statement
Not applicable.
Informed Consent Statement
Not applicable.
Data Availability Statement
The data are contained within the article.
Conflicts of Interest
The authors declare no conflicts of interest.
References
- Luo, H.; Wang, J.; Bu, F.; Ruby, R.; Wu, K.; Guo, Z. Recent progress of air/water cross-boundary communications for underwater sensor networks: A review. IEEE Sens. J. 2022, 22, 8360–8382. [Google Scholar] [CrossRef]
- Kong, M.; Kang, C.H.; Alkhazragi, O.; Sun, X.; Guo, Y.; Sait, M.; Holguin-Lerma, J.A.; Ng, T.K.; Ooi, B.S. Survey of energy-autonomous solar cell receivers for satellite-air-ground-ocean optical wireless communication. Prog. Quantum Electron. 2020, 74, 100300. [Google Scholar] [CrossRef]
- Saeed, N.; Celik, A.; Al-Naffouri, T.Y.; Alouini, M.S. Underwater optical wireless communications, networking, and localization: A survey. Ad Hoc Netw. 2019, 94, 101935. [Google Scholar] [CrossRef]
- Mohsan, S.A.H.; Li, Y.L.; Sadiq, M.; Liang, J.; Khan, M.A. Recent Advances, Future Trends, Applications and Challenges of Internet of Underwater Things (IoUT): A Comprehensive Review. J. Mar. Sci. Eng. 2023, 11, 124. [Google Scholar] [CrossRef]
- Qu, Z.; Lai, M. A Review on Electromagnetic, Acoustic and New Emerging Technologies for Submarine Communication. IEEE Access 2024, 12, 12110–12125. [Google Scholar] [CrossRef]
- Jamali, M.V.; Mirani, A.; Parsay, A.; Abolhassani, B.; Nabavi, P.; Chizari, A.; Khorramshahi, P.; Abdollahramezani, S.; Salehi, J.A. Statistical Studies of Fading in Underwater Wireless Optical Channels in the Presence of Air Bubble, Temperature, and Salinity Random Variations. IEEE Trans. Commun. 2018, 66, 4706–4723. [Google Scholar] [CrossRef]
- Dai, Z.; Sun, J.; Sui, P. Theoretical study of transverse microwaves on water surface caused by underwater sound source. J. Natl. Univ. Def. Technol. 2004, 26, 95–98. [Google Scholar]
- Tonolini, F.; Adib, F. Networking across boundaries: Enabling wireless communication through the water-air interface. In Proceedings of the 2018 Conference of the ACM Special Interest Group on Data Communication, Budapest, Hungary, 20–25 August 2018; pp. 117–131. [Google Scholar]
- Butterworth, S. On the theory of filter amplifiers. Wirel. Eng. 1930, 7, 536–541. [Google Scholar]
- Weisbuch, G.; Garbay, F. Light Scattering by Surface Tension Waves. Am. J. Phys. 1979, 47, 355–356. [Google Scholar] [CrossRef]
- Lee, M.; Bourgeois, B.; Hsieh, S.; Martinez, A.; Hsu, L.; Hickman, G. A laser sensing scheme for detection of underwater acoustic signals. In Proceedings of the Conference Proceedings’ 88, IEEE Southeastcon, Knoxville, TN, USA, 10–13 April 1988; pp. 253–257. [Google Scholar]
- Khan, M.R.; Das, B.; Pati, B.B. Channel estimation strategies for underwater acoustic (UWA) communication: An overview. J. Frankl. Inst.-Eng. Appl. Math. 2020, 357, 7229–7265. [Google Scholar] [CrossRef]
- Yang, S. Research on Air-Water Cross-Medium Communication Based on Microwave-Acoustic System. Master’s Thesis, Master of Engineering, Harbin Institute of Technology, Harbin, China, 2021. [Google Scholar]
- Qu, F.; Qian, J.; Wang, J.; Lu, X.; Zhang, M.; Bai, X.; Ran, Z.; Tu, X.; Liu, Z.; Wei, Y. Cross-Medium Communication Combining Acoustic Wave and Millimeter Wave: Theoretical Channel Model and Experiments. IEEE J. Ocean. Eng. 2022, 47, 483–492. [Google Scholar] [CrossRef]
- Qian, J.; Qu, F.; Su, J.; Wei, Y.; Cheng, M.; Guo, H.; Zhu, J.; Wang, J. Theoretical Model and Experiments of Focused Phased Array for Cross-Medium Communication in Misaligned Transmitter/Receiver Scenarios. IEEE J. Ocean. Eng. 2023, 48, 1348–1361. [Google Scholar] [CrossRef]
- Deng, B.; Li, T.; Tang, B.; Yi, J.; Wang, H.; Yang, Q. Acoustic sea surface micromotion detection based on Terahertz radar. J. Radar 2023, 12, 817–831. [Google Scholar]
- Shi, Q.; He, Z.; Xu, H.; Gao, J.; Zhao, P. Research on Information Transmission Technology Through the Water–Air Interface Combining a Sonar and a Radar. IEEE Sens. J. 2023, 23, 7616–7625. [Google Scholar] [CrossRef]
- Gai, Y.; Tan, Q.; Zhang, Y.; Zhao, Z.; Yang, Y.; Liu, Y.; Zhang, R.; Yao, J. A Cross-Medium Uplink Communication Model Merging Acoustic and Millimeter Waves. J. Mar. Sci. Eng. 2023, 11, 2102. [Google Scholar] [CrossRef]
- Luo, J.; Liang, X.; Guo, Q.; Zhang, L.; Bu, X. Combined Improved CEEMDAN and Wavelet Transform Sea Wave Interference Suppression. Remote Sens. 2023, 15, 2007. [Google Scholar] [CrossRef]
- Liu, B.; Lei, J. Principles of Underwater Acoustics, 2nd ed.; Harbin Engineering University Press: Harbin, China, 2010; pp. 23–57, 235–283. [Google Scholar]
- Brekhovskikh, L.M.; Lysanov, Y.P. Fundamentals of Ocean Acoustics; Springer Science & Business Media: New York, NY, USA, 2006; pp. 3–36, 661–767. [Google Scholar]
- Zhang, L. Research on Optical Heterodyne Detection Technology of Water Surface Micro-Wave Excited by Acoustic Wave. Doctor’s Thesis, Harbin Institute of Technology, Harbin, China, 2017. [Google Scholar]
- Guo, C. Research on Acoustic Surface Micromotion Feature Extraction by Terahertz Radar. Master’s Thesis, National University of Defense Technology, Changsha, China, 2020. [Google Scholar]
- Ionescu-Kruse, D. Exact solutions for small-amplitude capillary-gravity water waves. Wave Motion 2009, 46, 379–388. [Google Scholar] [CrossRef]
- Zhao, X. Research on Simulation and Algorithm of Water-Air Cross-Media Communication Based on Acoustic-Optical System. Master’s Thesis, Harbin Institute of Technology, Harbin, China, 2022. [Google Scholar]
- Lu, J.; Lou, J.; Liu, S.; Mao, W. Near-field acoustic holographic filtering method based on Butterworth Filter. Ship Sci. Technol. 2023, 45, 160–165. [Google Scholar]
- Wenz, G.M. Acoustic ambient noise in the ocean: Spectra and sources. J. Acoust. Soc. Am. 1962, 34, 1936–1956. [Google Scholar] [CrossRef]


Disclaimer/Publisher’s Note: The statements, opinions and data contained in all publications are solely those of the individual author(s) and contributor(s) and not of MDPI and/or the editor(s). MDPI and/or the editor(s) disclaim responsibility for any injury to people or property resulting from any ideas, methods, instructions or products referred to in the content. |
© 2024 by the authors. Licensee MDPI, Basel, Switzerland. This article is an open access article distributed under the terms and conditions of the Creative Commons Attribution (CC BY) license (https://creativecommons.org/licenses/by/4.0/).