Abstract
Internal tides are pivotal dynamic processes enhancing the mixing of oceanic waters and facilitating energy transfer across various scales within the ocean. In recent years, the proliferation of satellite altimetry observations has enabled global predictions of the elevation and phase of internal tides. This study, leveraging the advanced global internal tide prediction model known as the Multivariate Inversion of Ocean Surface Topography-Internal Tide Model (MIOST-IT), employs a two-dimensional Fourier bandpass filtering approach to decompose the internal tides in the Luzon Strait, thereby addressing the east–west directional blind zones inherent in along-track satellite altimetry-based modal decomposition. To further elucidate the propagation trajectories of individual tidal modes in different directions, we introduce the directional Fourier filter method to characterize the spatial distribution features of each modal internal tide in the vicinity of the Luzon Strait. This work significantly enhances the accuracy and reliability of extracting parameters for distinct modal internal tides, furnishing a scientific basis for subsequent studies on internal tide dynamics and model refinement.
1. Introduction
Internal tides are ubiquitous internal waves present in the stratified oceans [1,2,3], typically generated through the interaction of barotropic tides with submerged topographies, and are notably influenced by ocean stratification [4], capable of propagating over substantial distances [1,5,6]. They play a pivotal role in energy transfer across multiple scales in the ocean, vertical mixing processes, and the generation of intense nonlinear internal waves [7,8,9]. Internal tides are classified into distinct vertical modes based on the number of extrema in their eigenfunctions. Mode-1 internal tides induce isopycnal surface fluctuations that are in-phase throughout the entire depth, whereas mode-2 internal tides cause opposite phase isopycnal surface fluctuations above and below the eigenfunction’s zero point. Due to the instability of mode-2 internal tides’ vertical structure, it is challenging for them to propagate over long distances, resulting in fewer in situ observations, and they have smaller sea surface amplitudes compared to mode-1 [10]. Lefauve et al. [11] found that at some mid-ocean ridges, high-mode internal tides account for approximately 75% of the internal tide energy and dominate local dissipation.
The application of sophisticated three-dimensional numerical models facilitates refined simulations of internal tides in specific regions [11,12,13,14,15]. Furthermore, long-term satellite-based observations of sea surface height have enabled global-scale predictions of these phenomena [16,17,18]. Nonetheless, the challenge arises from the relatively small amplitudes of high-mode internal tides in sea surface height measurements, typically on the order of millimeters to centimeters, which complicates their modal decomposition using satellite altimetry data. Pioneering work by Zhao [19] employed along-track satellite altimetry data to investigate high-mode internal tides, introducing a planar wave fitting technique that successfully extracted the global mode-2 M2 internal tide from the dataset and conducted a fairly detailed analysis of its energy distribution. Nevertheless, this planar wave fitting methodology is beset with a 120° blind zone (spanning 60° to the east and west), introducing errors in both amplitude and orientation estimates of the mode-2 internal tide during the separation process.
In recent years, coinciding with the proliferation of enhanced satellite altimetry datasets, several internal tide prediction models have emerged. Among these, MIOST-IT stands as one of the more user-friendly and widely applied models, proven to encapsulate amplitude and phase information of at least two modal internal tides [18]. The model utilizes satellite altimeter data from 1992 to 2017 to invert the sea surface height of global internal tides, which is further validated by independent satellite altimeter data after 2017. Cui et al. [16] evaluated its prediction results and applied them to forecasting internal tides and internal solitary waves in the Luzon Strait. Nevertheless, it must be acknowledged that MIOST-IT still necessitates extensive in situ observations for validation to minimize potential errors in predicting regions dominated by mesoscale signals. Leveraging the MIOST-IT framework enables an effective segregation of different modal internal tides. Compared to conventional along-track satellite altimetry-based separation techniques, this approach theoretically circumvents the issue of blind zones, thereby markedly enhancing the accuracy and reliability of extracted internal tide parameters.
The Luzon Strait, serving as a principal breeding ground for internal tides in the northern South China Sea and the western Pacific [20,21], plays a pivotal role in the generation and propagation of numerous nonlinear internal waves in the northern South China Sea [22,23], and generates eastward-propagating Lee waves and near-inertial waves [24]. According to Yang et al. [10], the Luzon Strait exhibits a distinct two layer vertical pattern, which significantly facilitates the stable propagation of internal tides. Owing to its distinctive double-ridge topography, as well as the influence of the Kuroshio Current, abundant mesoscale eddies [25], and significant seasonal variations in transport [26], simulating higher-mode internal tides in this region poses significant challenges. Capitalizing on the MIOST-IT model, this study endeavors to isolate the mode-1 and mode-2 internal tides within the Luzon Strait area and, subsequently, to investigate their energy distribution patterns across various propagation directions.
2. Materials and Methods
2.1. Internal Tide Model: MIOST-IT
The Multivariate Inversion of Ocean Surface Topography-Internal Tide Model (MIOST-IT) is a predictive model designed to elucidate the characteristics of internal tide signatures in sea surface height, leveraging a 25-year span of global along-track altimetry datasets. Employing the Conjugate Gradient Algorithm, it disentangles the sea surface height components attributable to both internal tides and mesoscale eddies simultaneously. This approach mitigates aliasing effects that can arise between internal tides and mesoscale eddies due to the uneven satellite altimetry sampling schedule by reducing the computational basis and implementing a conjugate gradient solution strategy. Focusing on the four primary internal tide constituents (M2, K1, S2, O1), MIOST-IT encompasses global oceanic regions from 1992 to 2017, offering a spatial resolution of 0.1° [18].
Internal tides, being long gravity waves with horizontal scales vastly exceeding ocean depths, are often simplified using the hydrostatic approximation through the technique of variable separation. Consequently, the solution is formulated as a summation of orthogonal vertical modes, where each mode possesses a fixed vertical modal structure and freely propagates horizontally, akin to waves in a homogeneous fluid. The internal tide sea surface height elevation (SSHA) η1 provided by MIOST-IT can be expressed as [27]:
The elevation of internal tides below the sea surface η is usually orders of magnitude larger:
where a is the amplitude, k is the internal tide wave number, g is the gravity acceleration, ω is the tidal frequency, N is the buoyancy frequency, and ρ0 is the average density of seawater. The relationship between the vertical structure of pressure perturbations Π and the vertical structure of vertical velocity of the internal wave W is [28]:
where c is the linear phase velocity.
According to Equations (1)–(3), the relationship between the full water depth elevation and the SSHA can be further deduced [15]:
In the case where the full water depth elevation is known, the energy can be further calculated [29]:
where H is the maximum water depth.
2.2. Two-Dimensional Fourier Bandpass Filtering
This study employs the two-dimensional Fourier bandpass filtering method [30] for modal decomposition of the internal tide SSHA predicted by MIOST-IT. A pivotal concept in image processing and signal analysis, the two-dimensional Fourier bandpass filter extends classical Fourier transformation and filtering principles into two dimensions, commonly utilized for image data manipulation. The two-dimensional Fourier transform shifts images from the spatial domain to the wavenumber domain, where distinct wavenumber components correlate with different image features. The modal decomposition of internal tide SSHA at a given instant proceeds through the following steps:
① Spatial to Wavenumber Domain Transformation: Conduct a two-dimensional Fourier transform on the matrix representing the internal tide SSHA at the specified time. This step decomposes the matrix into its wavenumber domain representation, where each grid point corresponds to a particular wavenumber and orientation.
② Filter Window Design in Wavenumber Domain: Based on the desired passband range, corresponding to the wavelengths of the mode-1 or mode-2 internal tide waves, a filtering window is tailored in the wavenumber domain. This design selectively retains the relevant wavenumber components.
③ Wavenumber Domain Filtering: Multiply the tailored filter with the matrix after the Fourier transform. This operation effectively filters the matrix in the wavenumber domain, boosting wavenumbers within the passband while suppressing or eliminating those in the stopband.
④ Reconstruction in Spatial Domain: Transform the filtered wavenumber domain matrix back into the spatial domain via a two-dimensional inverse Fourier transform, yielding the final results of the internal tide modal decomposition.
Prior to implementing the two-dimensional Fourier bandpass filtering technique, a crucial preliminary step involves precisely defining the filter bands based on the wavelengths of the mode-1 and mode-2 internal tides. Ideally, when bandpass filtering for the mode-2 internal tide, measures should be taken to prevent the unintended filtration of information pertaining to the mode-1. However, in practice, water depth exerts a profound influence on the phase velocity of internal tides, causing the wavelengths of different modes to fluctuate rapidly across different oceanic regions. Given this scenario, it is imperative to establish a clear relationship among wavelength, phase velocity, and the filter window to preclude intermodal confusion during the filtering process, thereby ensuring the accuracy of the filtered data and the reliability of subsequent analyses.
Considering the Earth’s rotation, the group velocity of the internal tide can be expressed as [20]:
where f is the Coriolis parameter. The cn is the linear phase velocity of the n-th mode, which can be solved by solving the eigenvalue equation [28]:
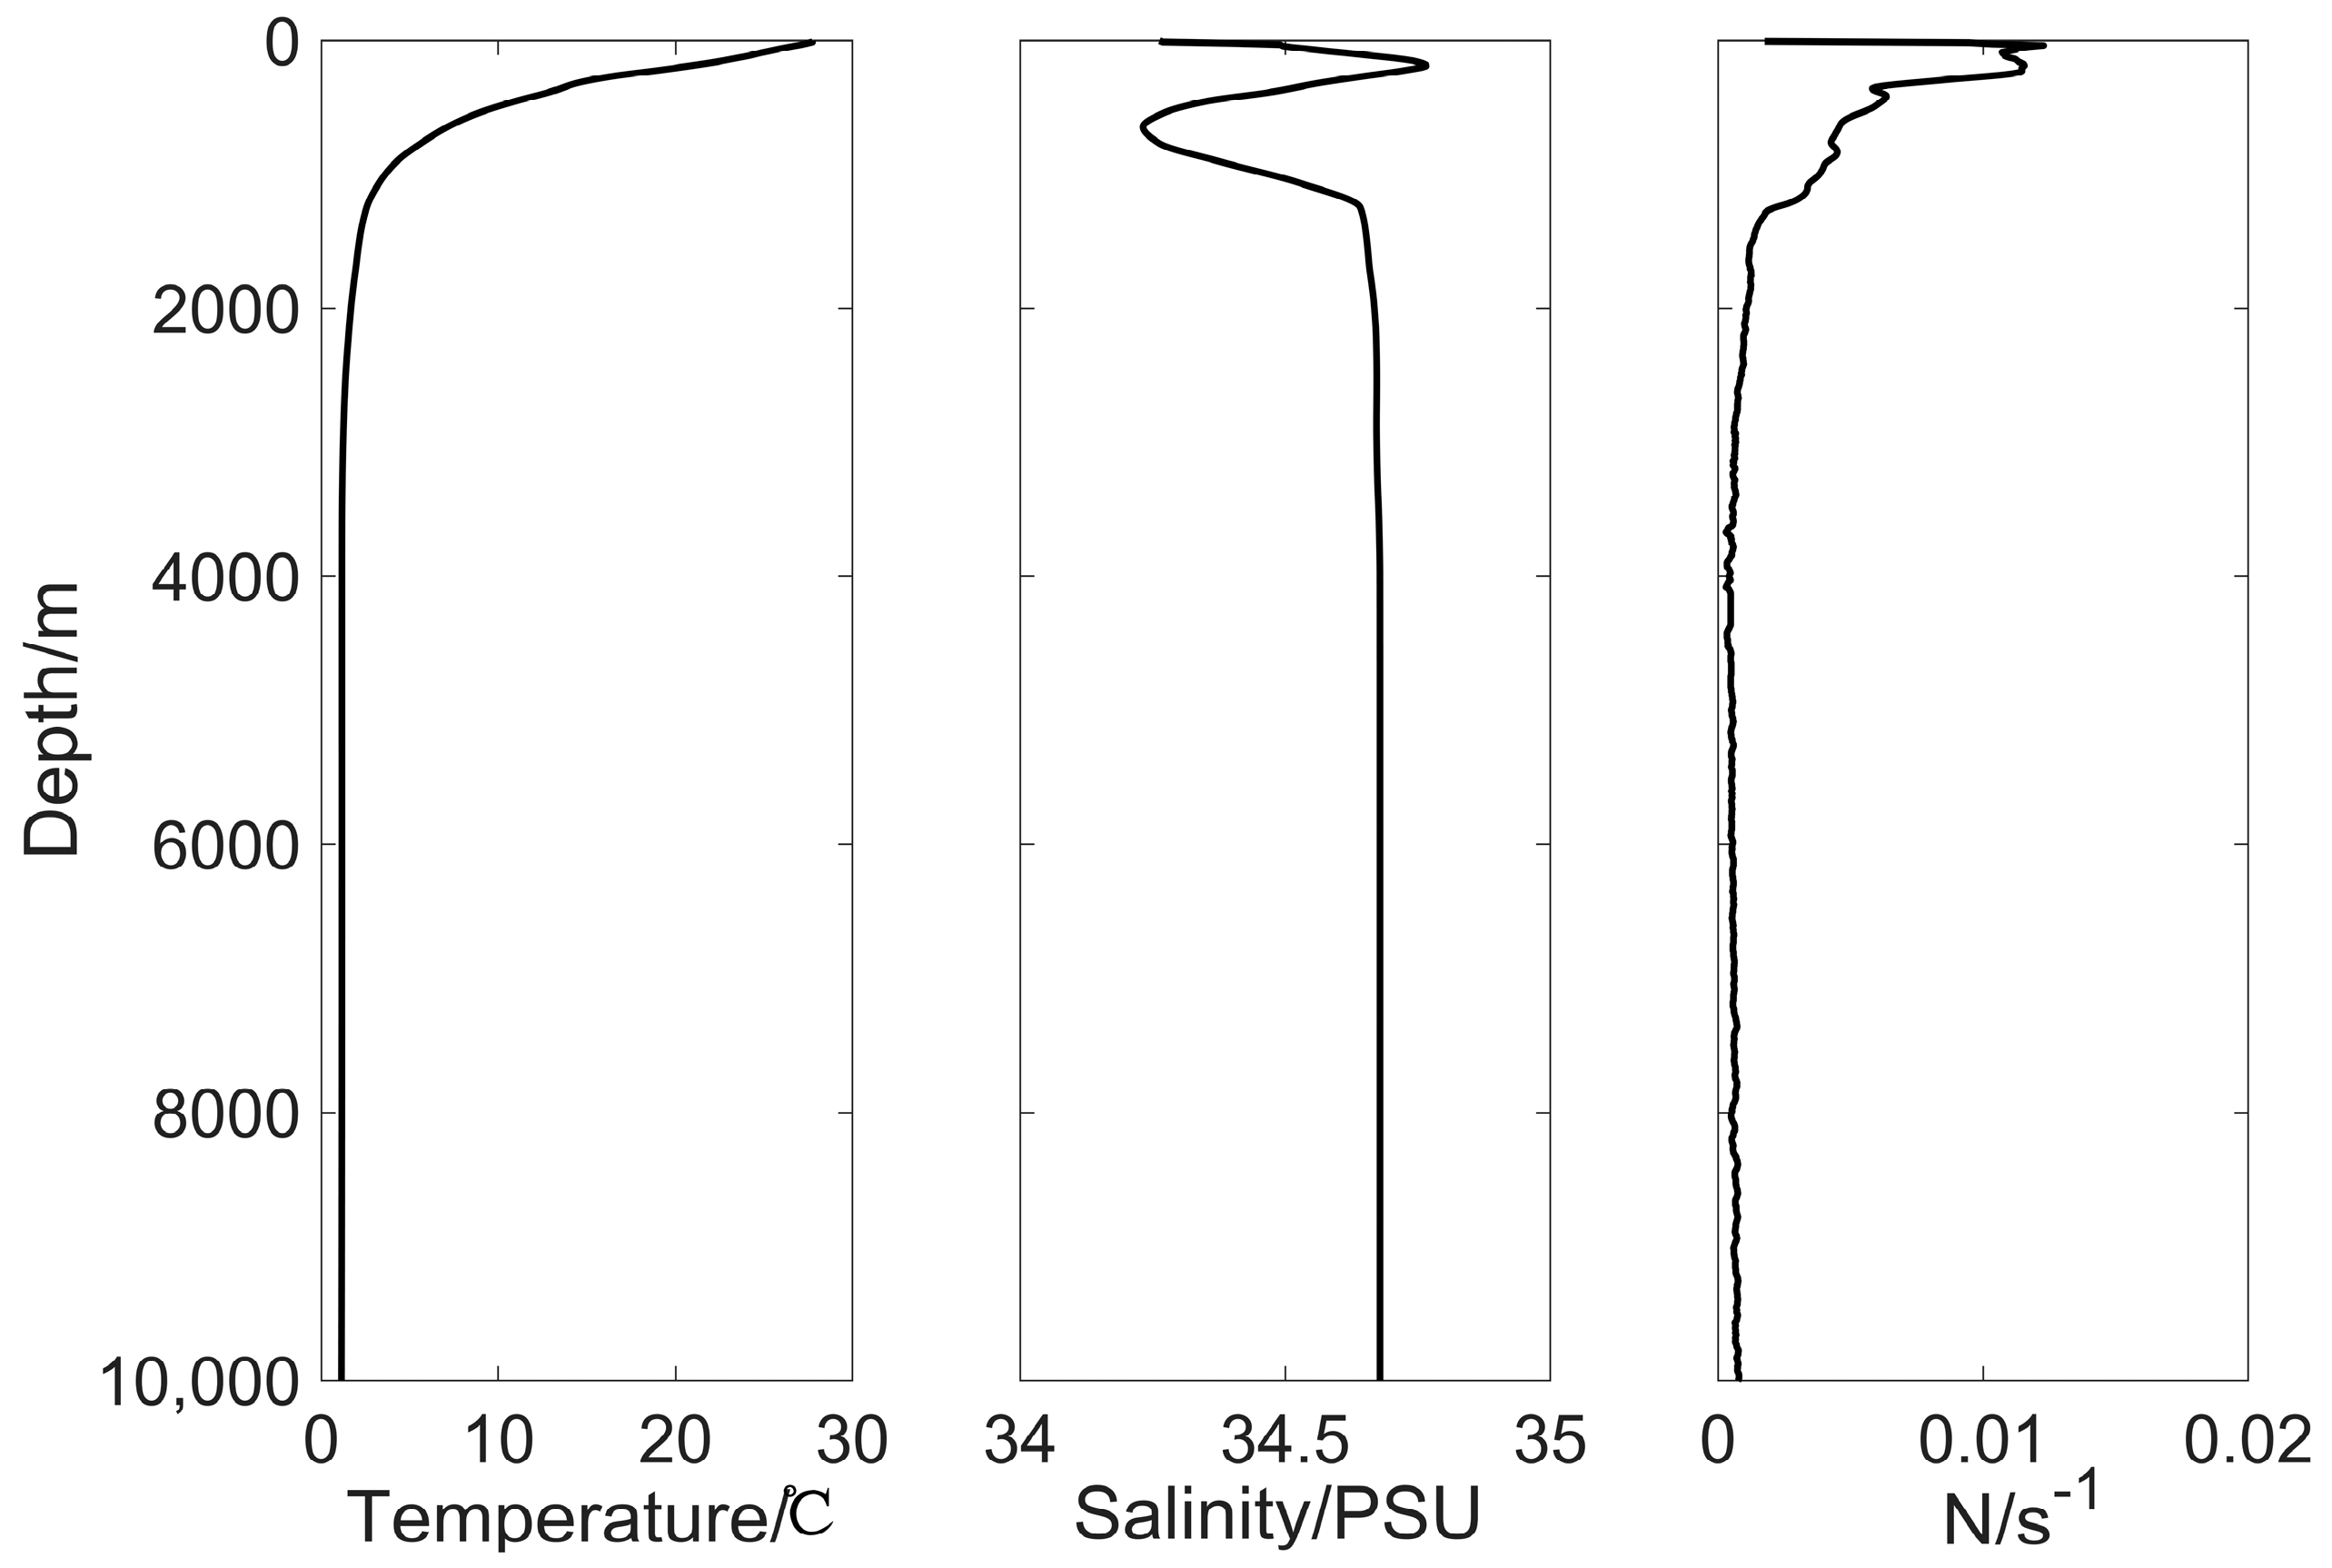
In estimating the ocean stratification, specifically the vertical profile of the buoyancy frequency N, this study utilizes the global reanalysis temperature and salinity datasets from the HYbrid Coordinate Ocean Model (HYCOM, accessible at https://tds.hycom.org/, accessed on 21 August 2024) [31]. Focusing on a grid point within the northern South China Sea characterized by considerable water depth, the vertical profile of the buoyancy frequency was calculated. Acknowledging the presence of a deep-sea trench east of the Luzon Strait, temperature, salinity, and the buoyancy frequency profiles were further interpolated down to a depth of 10,000 m. The outcomes of these calculations are depicted in Figure 1.
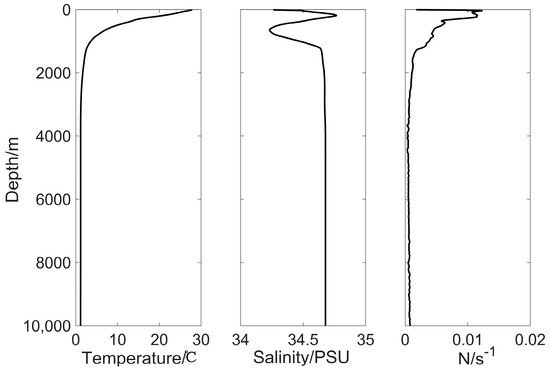
Figure 1.
The vertical profiles of temperature, salinity, and the buoyancy frequency utilized in the computation of internal tide phase velocity.
Assuming the vertical stratification patterns in the Luzon Strait and its adjacent waters follow the trends depicted in Figure 1, we can utilize Equations (6) and (7) to derive the variation of the phase velocities for the mode-1 and mode-2 internal tides as a function of the maximum depth H, as illustrated in Figure 2. It is evident that the phase velocities increase with the maximum depth H, rapidly for small H (<1500 m) and slowly for large H. The maximum phase velocity for the mode-2 reaches 1.87 m/s (y1, assuming a water depth not exceeding 10,000 m), implying that the phase velocity (y1) above which the mode-1 will not be confused with the mode-2 during filtering, corresponds to a water depth (x1) of approximately 700 m based on the mode-1’s phase velocity curve. Moreover, it can be inferred that the confusion between the two modes is also avoided in the filtering process for depths ranging from 250 m (x2) to 700 m, as the maximum of the mode-2’s phase velocity (y2 = 0.85 m/s) within this interval equals the minimum of the mode-1’s phase velocity. Extrapolating this logic, distinct filtering windows are demarcated according to variations in depth. However, considering MIOST-IT’s spatial resolution of 0.1°, further subdivision of the filtering window in depths less than 250 m is deemed impractical.
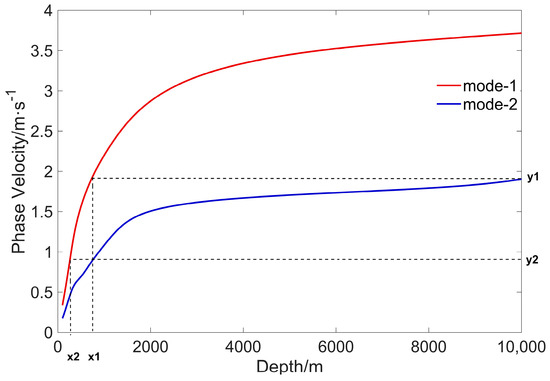
Figure 2.
The variation in phase velocities of two modal internal tides with respect to water depth. x1 and x2 denote the critical water depths beneath which no ambiguity occurs between the phase velocities of the two modes. Likewise, y1 and y2 represent the respective critical phase velocities.
Based on the phase velocity ranges depicted in Figure 2, we proceed to compute the modal and constituent-specific wavelengths for varying water depths. Taking the M2 and K1 internal tides as examples, for the M2 constituent with a period T1 = 12.42 h, the wavelength of the mode-2 M2 internal tide in waters deeper than 700 m spans from y2 × T1 to y1 × T1, delineating a bandpass filter window of (38.23 km, 83.70 km). Similarly, in areas where the water depth ranges from 250 m to 700 m, the bandpass filter window narrows to (19.63 km, 38.23 km). Regarding the K1 constituent with a period T2 = 23.93 h, the corresponding bandpass filter windows are established as (73.66 km, 161.27 km) for depths greater than 700 m and (37.82 km, 73.66 km) for depths between 250 m and 700 m.
2.3. The Directional Fourier Filter Method
This study proceeds by employing directional Fourier filter method to decompose internal tides of different orientations and modes, with the objective of elucidating the propagation directions of the first and second mode internal tides generated in the Luzon Strait. Directional Fourier filter method constitutes a signal processing technique particularly well-suited for analyzing and disentangling internal tide signals originated from multiple sources within complex oceanic environments, as reported in Gong [32]. Rooted in Fourier transformation, this methodology operates in the wavenumber domain to effectively segregate distinct directional components embedded within the signal, thereby enhancing our capability to discern the intricate patterns of energy propagation.
3. Results
3.1. Modal Decomposition of Internal Tides within the Luzon Strait
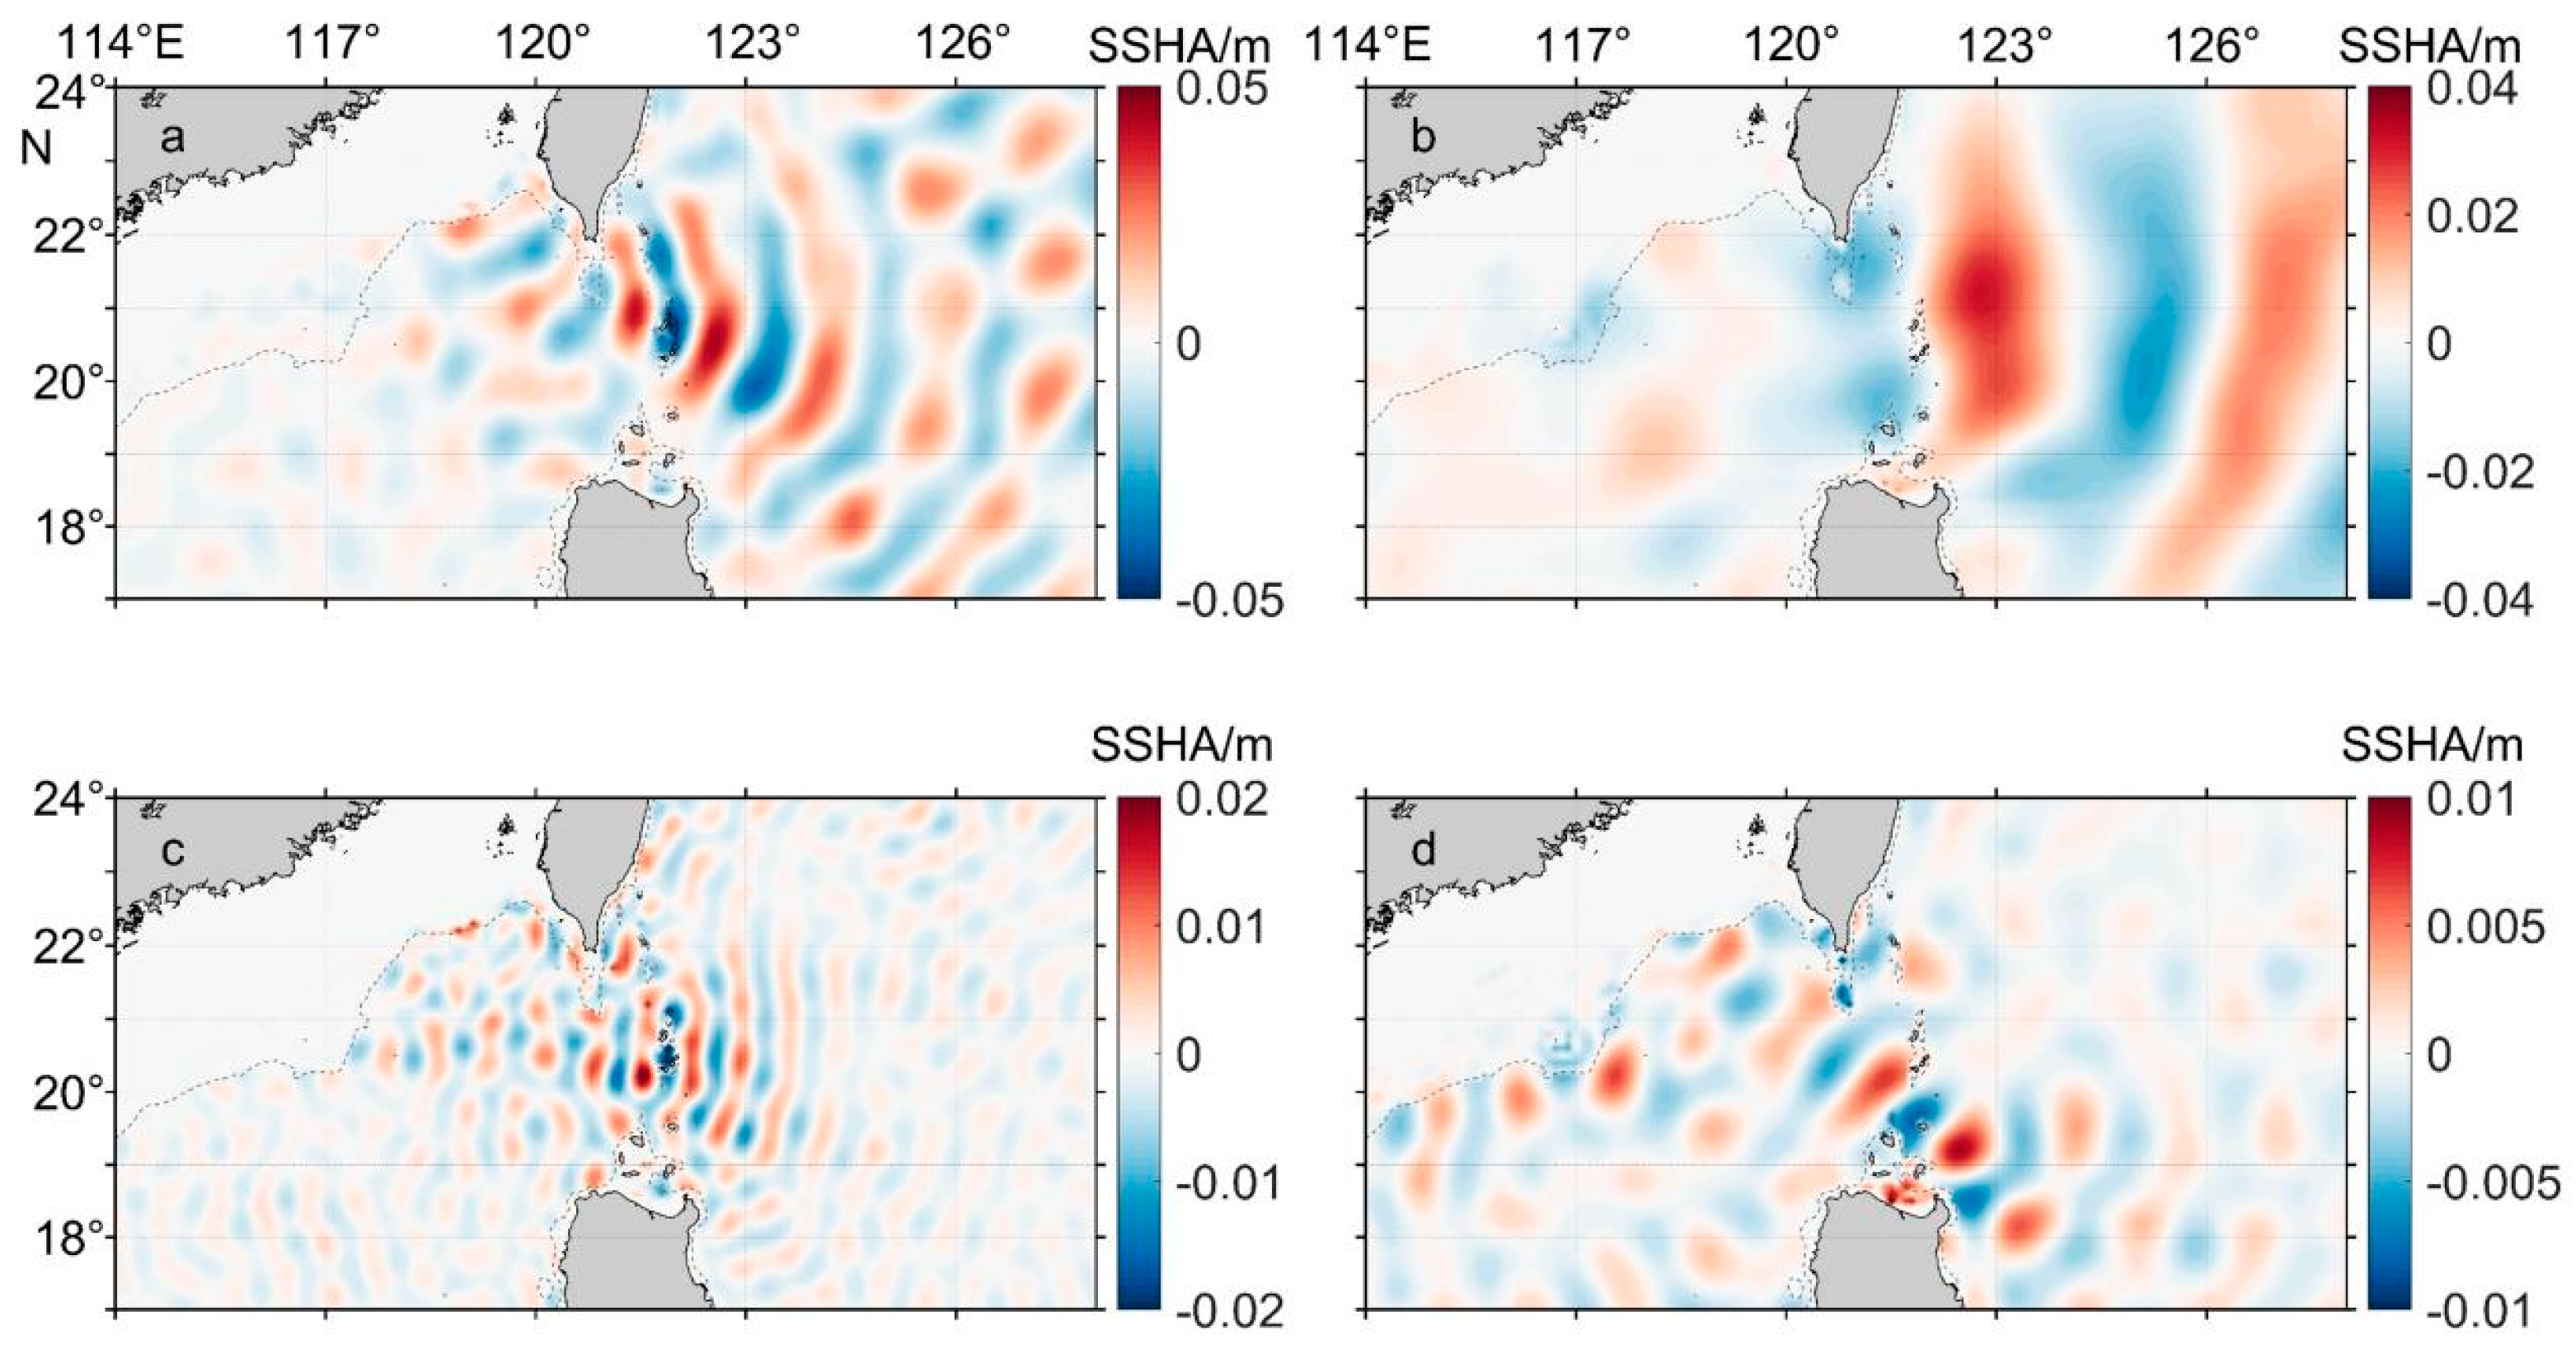
The two-dimensional Fourier bandpass filtering was separately applied to the regions with depth exceeding 700 m and within the 250 m–700 m depth range in the vicinity of the Luzon Strait. By superimposing these filtered results, the mode-2 internal tides were obtained, as illustrated in Figure 3b,d. Owing to the exceedingly small SSHA associated with higher modal internal tides, which are barely discernible in the MIOST-IT, subtracting the SSHA of the mode-2 internal tide (post-filtering) from the raw internal tide SSHA yields the SSHA of the mode-1 internal tide, as depicted in Figure 3a,c. It is evident that the SSHA of both modal internal tides are merely on the order of millimeters to centimeters, aligning with the computational outcomes reported by Zhao [19]. The SSHA of the mode-2 internal tide in the Luzon Strait is significantly smaller than that of the mode-1, approximately ranging from 1/5 to 1/3 of the latter’s SSHA. For the M2 internal tide, both modal SSHA surpass those of the K1 internal tide, and they feature shorter wavelengths.
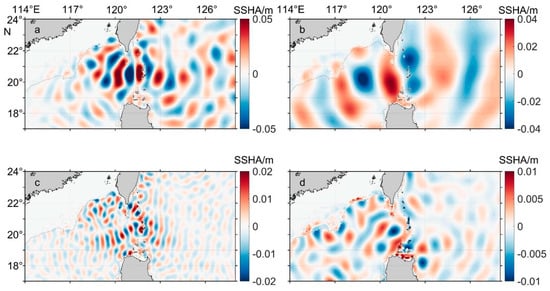
Figure 3.
The SSHA snapshot of the mode-1 M2 (a) and K1 (b), internal tides, and mode-2 M2 (c) and K1, (d) internal tides.
Moreover, the internal tide modal decomposition based on MIOST-IT overcomes the issue of blind zones in the east–west direction inherent to the planar wave fitting technique [19], thereby addressing limitations of previous studies. Figure 4 illustrate the mode-2 internal tide SSHA calculated using both the planar wave fitting technique and the two-dimensional Fourier bandpass filtering method for the Luzon Strait and the northeastern Pacific Ocean regions, respectively. The topography gradient near the Luzon Strait is notably steep along the latitudinal direction, leading to the predominant eastward and westward propagation of internal tides. Conversely, in the northeastern Pacific, where the topographic gradient is more pronounced along the longitudinal direction, internal tides primarily propagate southward and northward.
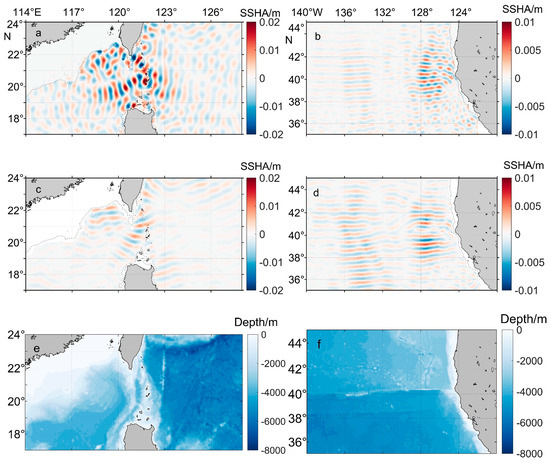
Figure 4.
Mode-2 internal tides calculated using the two-dimensional Fourier bandpass filtering method for the Luzon Strait (a) and the northeastern Pacific (b), compared with results obtained using the planar wave fitting technique (c) for the Luzon Strait and (d) for the northeastern Pacific. (e,f) are the topographies of corresponding areas.
Evidently, due to the orientational blind zones of the planar wave fitting technique in the east–west direction, its estimations of the mode-2 internal tides in the vicinity of the Luzon Strait exhibit substantial discrepancies with our results in terms of both amplitude and propagation direction. In contrast, for the northeastern Pacific region where internal tides mainly travel north and south, the outcomes derived from both methodologies show closer agreement. It is Luzon Strait that highlights the effectiveness of the MIOST-IT approach in overcoming the directional limitations of conventional techniques.
3.2. Directional Decomposition of the Internal Tides in the Luzon Strait
As illustrated in Figure 3, the M2 and K1 internal tides radiate eastward and westward from the Luzon Strait; however, the amplitudes of these tidal components in the two directions are notably asymmetric. This asymmetry is primarily attributed to topographic influences: the water depth gradually decreases over the continental shelf region west of the Luzon Strait, whereas it increases eastward of the strait. This geographical configuration leads to a higher energy density of the internal tides on the western side. To further investigate the distribution of internally generated tides emanating from the Luzon Strait towards the east and west, a two-dimensional Fourier bandpass filtering was initially applied to the SSHA data of the internal tides. Subsequently, a directional Fourier filter was employed to further process the SSHA characteristics of these two modal components.
The westward propagation of M2 and K1 internal tides is depicted in Figure 5. Evidently, the mode-1 M2 internal tide exhibits two distinct westward pathways, one veering northwest and the other southwest, which aligns closely with the results simulated by Xu et al. [21] using a three-dimensional numerical model. In contrast, the westward-propagating mode-1 K1 internal tide does not exhibit this dual-path characteristic. For both tidal constituents, the second mode internal tide paths are notably more intricate, a feature primarily attributable to their shorter wavelengths and phase lines. This increased complexity in their trajectories is exacerbated by the uncertain propagation over the intricate topography.
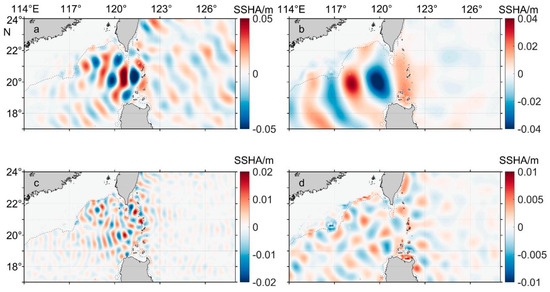
Figure 5.
Snapshots of SSHA illustrating westward propagation: mode-1 M2 (a) and K1 (b), and mode-2 M2 (c) and K1 (d) internal tides.
The eastward propagating M2 and K1 internal tides are depicted in Figure 6. It is evident that the phase lines of the mode-1 M2 and K1 internal tides remain relatively continuous. However, the attenuation rate of the mode-2 SSHA is observed to be faster compared to their westward counterparts. Remarkably, a substantial presence of the mode-2 internal tides persists to the west of the Luzon Strait, which likely signifies local generation or reflection of these modes over the continental shelf region.
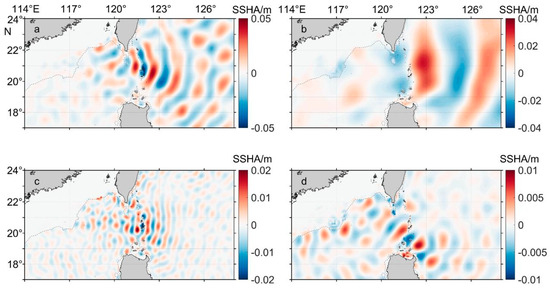
Figure 6.
Snapshots of SSHA illustrating eastward propagation: mode-1 M2 (a) and K1 (b), and mode-2 M2 (c) and K1 (d) internal tides.
In summary, through successive application of two-dimensional Fourier bandpass filtering and directional Fourier analysis onto the MIOST-IT predicted SSHA data of internal tides, we are able to discern distinct components pertaining to different tidal constituents, modal structures, and propagation directions. These methodologies are efficacious approaches for systematic analysis of internal tide dynamics.
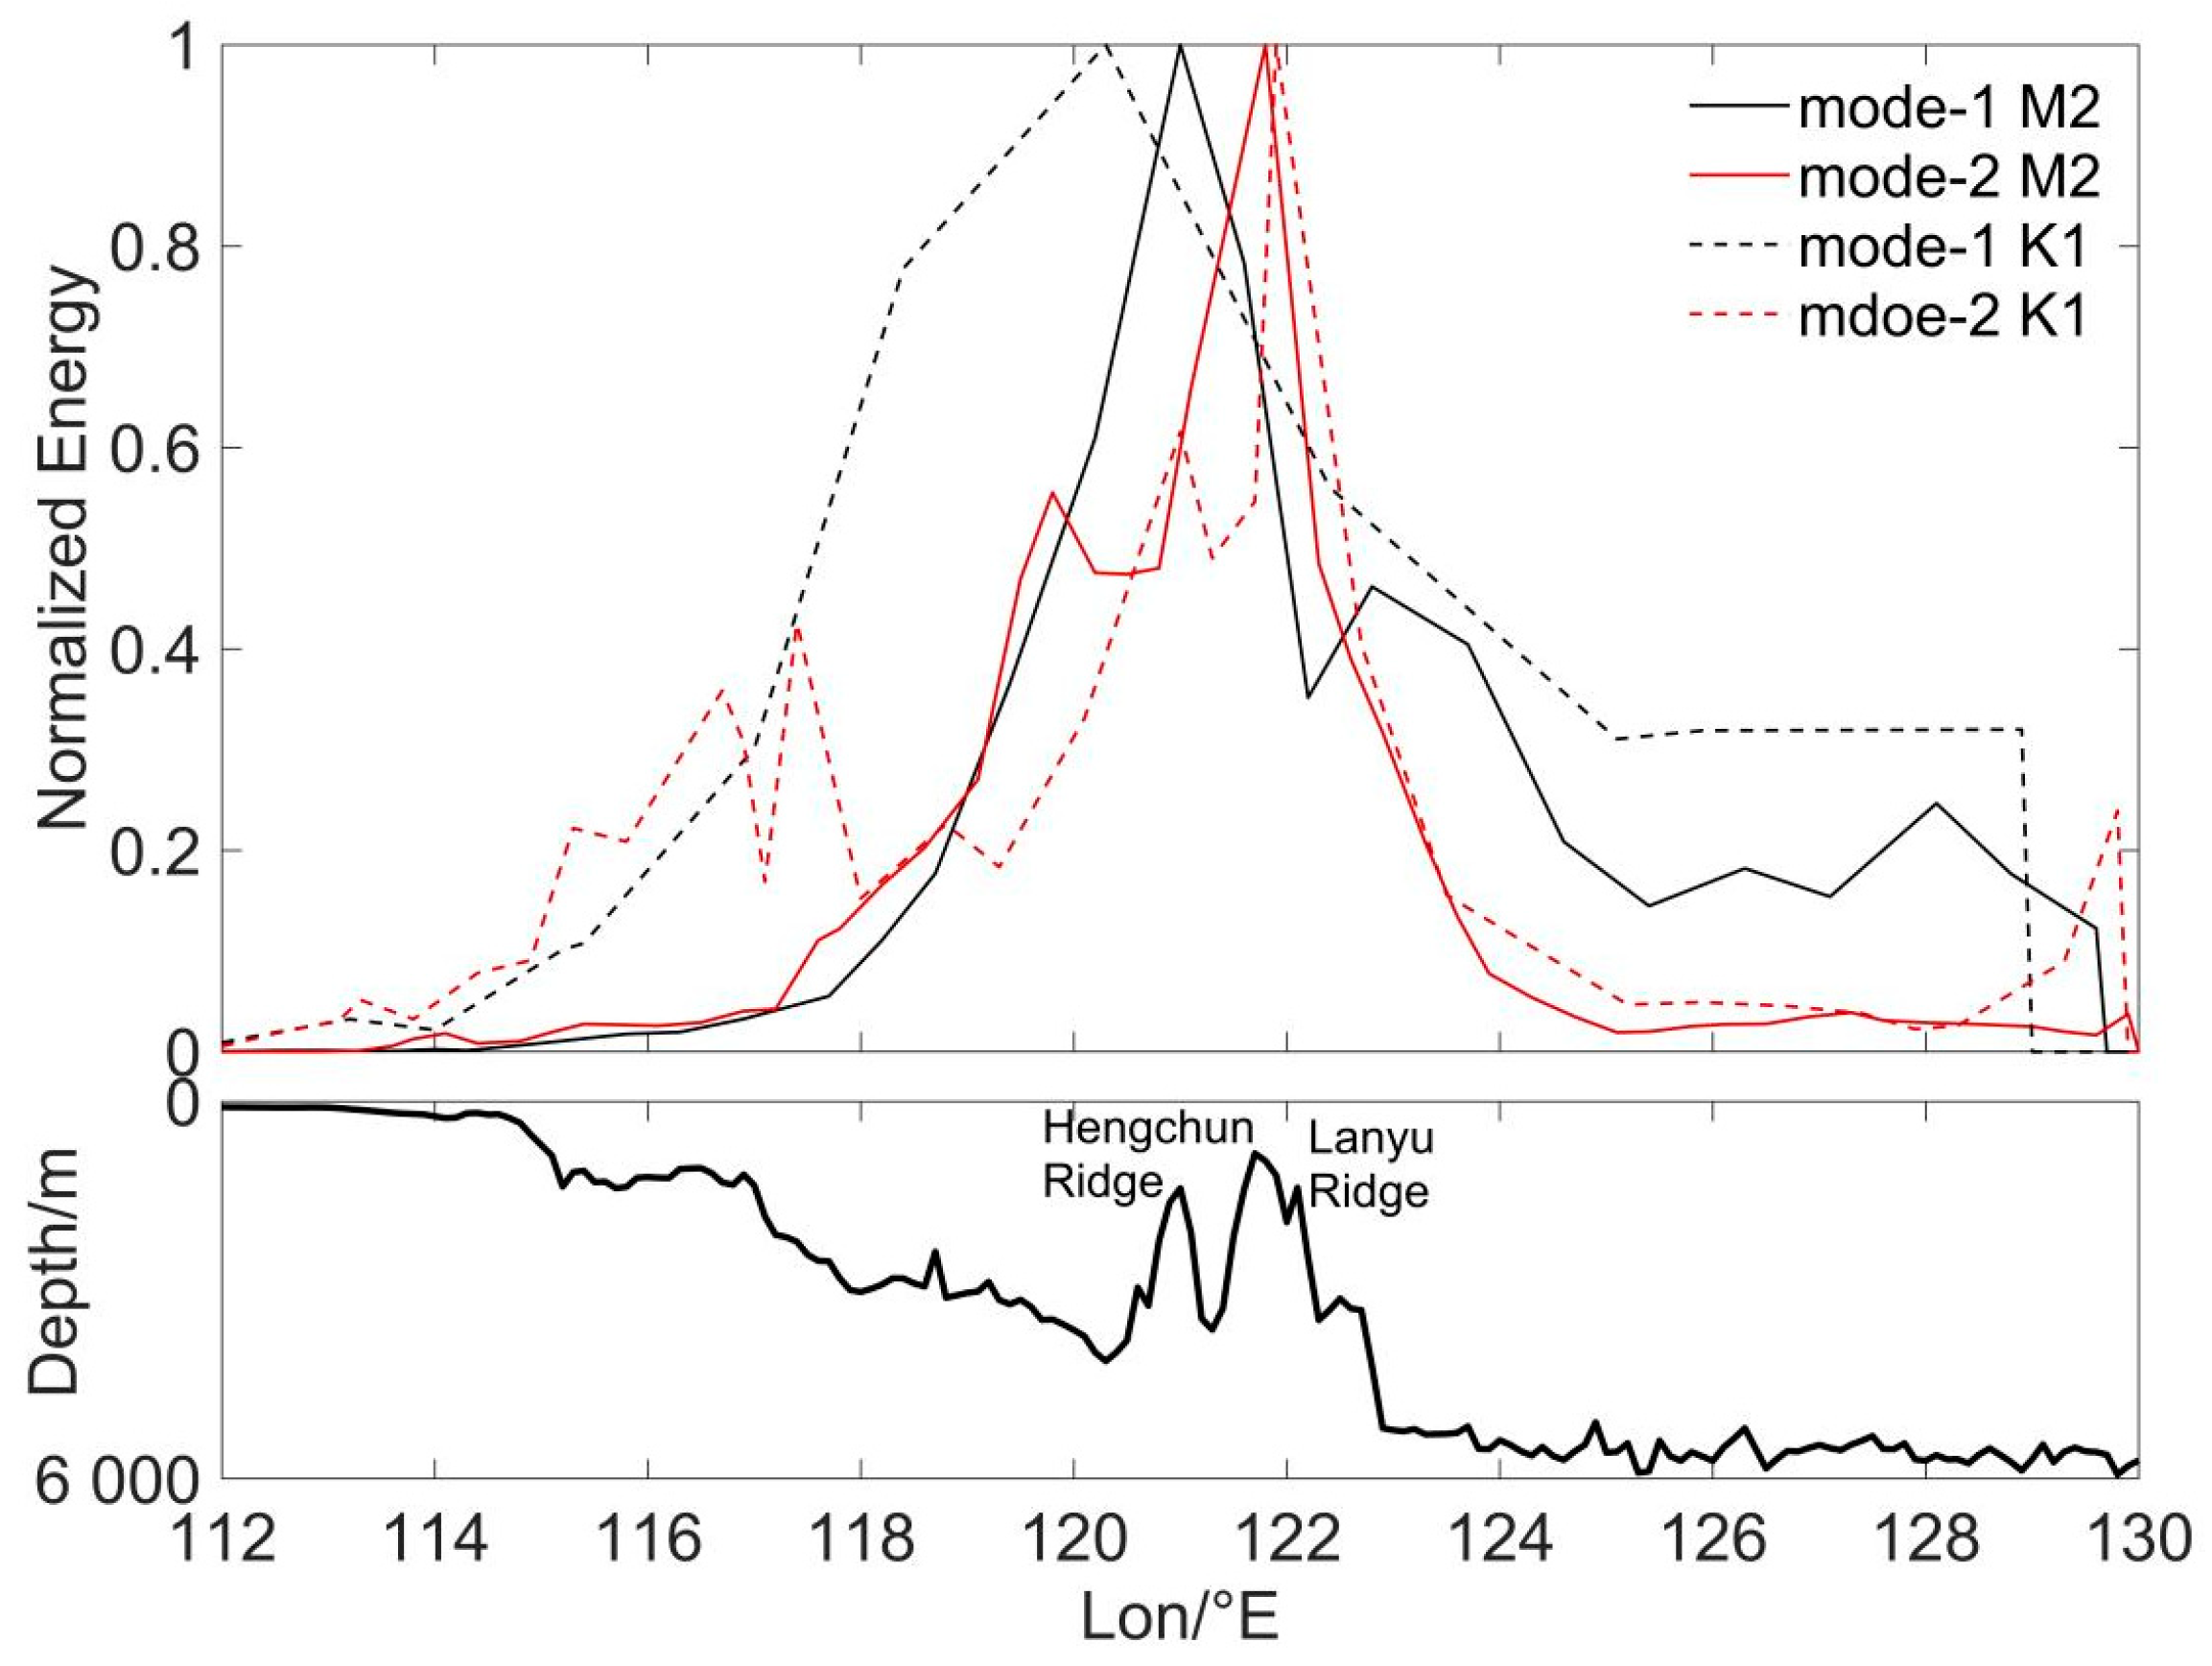
Based on Equation (5), further calculations of the energy attenuation of internal tides in the vicinity of the Luzon Strait were conducted. The averaged energy values for two modes and two constituent tides of the internal tide were computed within the latitudinal range of 19° N to 21° N, with the results depicted in Figure 7. For purposes of straightforward comparison, the internal tide energies were normalized. It is evident that the energy peak for the mode-1 internal tide is situated near the Hengchun Ridge, with the K1 internal tide occurring to the west of the Hengchun Ridge. Conversely, the energy peak for the mode-2 internal tide is found in proximity to the Lanyu Ridge. The dynamical mechanisms underlying these patterns warrant further investigation. Notably, the energy attenuation rate of the mode-2 internal tide across both ridges exceeds that of the mode-1, with the K1 constituent displaying a more pronounced effect. This finding aligns with previous research conclusions [33,34].
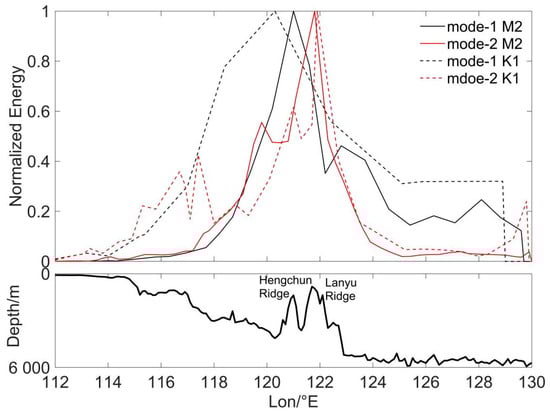
Figure 7.
Normalized energy distribution of internal tides averaged between 19° N and 21° N, with the cross-section of topography at 20° N shown below.
4. Conclusions and Discussion
This study successfully achieves a refined isolation of the mode-1 and mode-2 internal tides, along with an exploration of their propagation directions, in the Luzon Strait through the application of the MIOST-IT, complemented by two-dimensional Fourier bandpass filtering and directional Fourier filter method. The research demonstrates that the modal decomposition based on the MIOST-IT not only overcomes the observational blind zone issue along the east–west direction inherent in planar wave fitting techniques but also precisely captures the SSHA disparities among different modal internal tides and their propagation characteristics within intricate seafloor topographies. Specifically, the SSHA of the mode-1 internal tide within the Luzon Strait is significantly greater than that of the mode-2, with the M2 constituent exhibiting larger SSHA and shorter wavelengths compared to the K1 constituent. Furthermore, the computations of internal tide energy reveal a peak in the energy of the mode-1 near the Hengchun Ridge, while the energy of the mode-2 is found to be more concentrated in the vicinity of the Lanyu Ridge. These findings bolster our understanding of the Luzon Strait as a pivotal origin for internal tides in the northern South China Sea and the western Pacific, and they underscore the decisive role of topography in dictating the distribution and propagation directions of internal tide energy.
This study has marked significant progress in the modal decomposition of internal tides through advanced signal processing techniques, albeit with several scientific questions and avenues for future inquiry remaining. While the current modal decomposition methodologies prove effective, they await direct validation from observational data. Given the minute SSHA of internal tide expressions and their susceptibility to a multitude of influencing factors, it is recommended that future endeavors incorporate a synergistic approach of in situ measurements and satellite remote sensing data to empirically verify the model-predicted characteristics of internal tides. This would enhance the credibility and practical utility of model outcomes. Moreover, the integration of experimental data can facilitate the recalibration of model parameters, thereby refining the precision of internal tide predictions.
This investigation encountered limitations in the filtering window demarcation in depths less than 250 m, a constraint imposed by the spatial resolution of the MIOST-IT, which precluded a more nuanced analysis at shallower depths. Subsequent research should contemplate the utilization of internal tide prediction models with heightened resolutions or the development of novel filtering methodologies to surmount this limitation, thereby enabling a more exhaustive exploration of the modal structure of internal tides in shallow water environments.
Author Contributions
Conceptualization, Z.C.; methodology, Z.C. and W.J.; validation, B.X.; data curation, Q.Z.; writing—original draft preparation, B.X.; writing—review and editing, F.L. All authors have read and agreed to the published version of the manuscript.
Funding
This research received no external funding.
Data Availability Statement
The HYCOM data are available at https://tds.hycom.org/ (accessed on 21 August 2024); The ETOPO2 data at http://www.ngdc.noaa.gov/mgg/global/etopo2.html (accessed on 21 August 2024); The MIOST-IT doi: https://doi.org/10.24400/527896/a01-2022.003 (accessed on 21 August 2024). Those products were designed, implemented and validated by CLS, OCEAN-NEXT and LEGOS and distributed by AVISO+ (https://www.aviso.altimetry.fr, accessed on 21 August 2024) with support from CNES.
Conflicts of Interest
Authors Botao Xie and Qi Zhang were employed by the company CNOOC Research Institute Co., Ltd. The remaining authors declare that the research was conducted in the absence of any commercial or financial relationships that could be construed as a potential conflict of interest.
Abbreviations
| List of Variables | |
| η1 | sea surface height elevation of internal tide. |
| η | elevation of internal tide below the sea surface. |
| a | amplitude. |
| k | wave number of internal tide. |
| g | gravity acceleration. |
| ω | tidal frequency. |
| N | buoyancy frequency. |
| ρ0 | average density of seawater. |
| Π | vertical structure of pressure perturbations. |
| W | vertical structure of vertical velocity of the internal wave. |
| c | linear phase velocity. |
| H | the maximum water depth. |
| f | Coriolis parameter. |
| cn | linear phase velocity of the n-th mode. |
| cp | group velocity of the internal tide. |
References
- Alford, M.H. Redistribution of energy available for ocean mixing by long-range propagation of internal waves. Nature 2003, 423, 159–162. [Google Scholar] [CrossRef]
- Egbert, G.D.; Ray, R.D. Tidal prediction. J. Mar. Res. 2017, 75, 189–237. [Google Scholar] [CrossRef]
- Wunsch, C. Internal tides in the ocean. Rev. Geophys. 1975, 13, 167–182. [Google Scholar] [CrossRef]
- Yadidya, B.; Rao, A.D. Interannual variability of internal tides in the Andaman Sea: An effect of Indian ocean dipole. Sci. Rep. 2022, 12, 11104. [Google Scholar] [CrossRef]
- Baines, P.G. On internal tide generation models. Deep. Sea Res. Part A Oceanogr. Res. Pap. 1982, 29, 307–338. [Google Scholar] [CrossRef]
- Rudnick, D.L.; Boyd, T.J.; Brainard, R.E.; Carter, G.S.; Egbert, G.D.; Gregg, M.C.; Holloway, P.E.; Klymak, J.M.; Kunze, E.; Lee, C.M.; et al. From tides to mixing along the Hawaiian Ridge. Science 2003, 301, 355–357. [Google Scholar] [CrossRef]
- Munk, W.; Wunsch, C. Abyssal recipes II: Energetics of tidal and wind mixing. Deep. Sea Res. Part I Oceanogr. Res. Pap. 1998, 45, 1977–2010. [Google Scholar] [CrossRef]
- Wunsch, C.; Ferrari, R. Vertical mixing, energy, and the general circulation of the oceans. Annu. Rev. Fluid Mech. 2004, 36, 281–314. [Google Scholar] [CrossRef]
- Cui, Z.; Jin, W.; Ding, T.; Liang, C.; Lin, F.; Zhou, B.; Guo, B.; Liang, Q. Observations of anomalously strong mode-2 internal solitary waves in the central Andaman Sea by a mooring system. Deep. Sea Res. Part I Oceanogr. Res. Pap. 2024, 208, 104300. [Google Scholar] [CrossRef]
- Yang, Q.; Tian, J.; Zhao, W. Observation of Luzon Strait transport in summer 2007. Deep. Sea Res. Part I Oceanogr. Res. Pap. 2010, 57, 670–676. [Google Scholar] [CrossRef]
- Lefauve, A.; Muller, C.; Melet, A. A three-dimensional map of tidal dissipation over abyssal hills. J. Geophys. Res. Ocean. 2015, 120, 4760–4777. [Google Scholar] [CrossRef]
- Arbic, B.K.; Richman, J.G.; Shriver, J.F.; Timko, P.G.; Metzger, E.J.; Wallcraft, A.J. Global modeling of internal tides: Within an eddying ocean general circulation model. Oceanography 2012, 25, 20–29. [Google Scholar] [CrossRef]
- Buijsman, M.C.; Arbic, B.K.; Richman, J.G.; Shriver, J.F.; Wallcraft, A.J.; Zamudio, L. Semidiurnal internal tide incoherence in the equatorial pacific. J. Geophys. Res. Ocean. 2017, 122, 5286–5305. [Google Scholar] [CrossRef]
- Buijsman, M.C.; Stephenson, G.R.; Ansong, J.K.; Arbic, B.K.; Mattias, J.A.; Richman, J.G.; Shriver, J.F.; Vic, C.; Wallcraft, A.J.; Zhao, Z. On the interplay between horizontal resolution and wave drag and their effect on tidal baroclinic mode waves in realistic global ocean simulations. Ocean Model. 2020, 152, 101656. [Google Scholar] [CrossRef]
- Savage, A.C.; Arbic, B.K.; Alford, M.H.; Ansong, J.K.; Thomas, J.; Menemenlis, D.; O’Rourke, A.K.; Richman, J.G.; Shriver, J.F.; Voet, G.; et al. Spectral decomposition of internal gravity wave sea surface height in global models. J. Geophys. Res. Ocean. 2017, 122, 7803–7821. [Google Scholar]
- Cui, Z.; Liang, C.; Lin, F.; Chen, S.; Ding, T.; Zhou, B.; Jin, W.; Yang, W. Construction of a wavefront model for internal solitary waves and its application in the Northern South China Sea. Ocean Model. 2024, 189, 102366. [Google Scholar] [CrossRef]
- Zhao, Z.; Alford, M.H.; Girton, J.B.; Rainville, L.; Simmons, H.L. Global observations of open-ocean mode-1 M2 internal tides. J. Phys. Oceanogr. 2016, 46, 1657–1684. [Google Scholar] [CrossRef]
- Zaron, E.D. Baroclinic tidal sea level from exact-repeat mission altimetry. J. Phys. Oceanogr. 2019, 49, 193–210. [Google Scholar] [CrossRef]
- Ubelmann, C.; Carrere, L.; Durand, C.; Dibarboure, G.; Faugère, Y.; Ballarotta, M.; Briol, F.; Lyard, F. Simultaneous estimation of ocean mesoscale and coherent internal tide sea surface height signatures from the global altimetry record. Ocean Sci. 2022, 18, 469–481. [Google Scholar] [CrossRef]
- Zhao, Z. The global mode-2 M2 internal tide. J. Geophys. Res. Ocean. 2018, 123, 7725–7746. [Google Scholar] [CrossRef]
- Wang, Y.; Xu, Z.; Hibiya, T.; Yin, B.; Wang, F. Radiation path of diurnal internal tides in the northwestern Pacific controlled by refraction and interference. J. Geophys. Res. Ocean. 2021, 126, e2020JC016972. [Google Scholar] [CrossRef]
- Xu, Z.; Liu, K.; Yin, B.; Zhao, Z.; Wang, Y.; Li, Q. Long-range propagation and associated variability of internal tides in the South China Sea. J. Geophys. Res. Ocean. 2016, 121, 8268–8286. [Google Scholar] [CrossRef]
- Warn-Varnas, A.; Hawkins, J.; Lamb, K.G.; Piacsek, S.; Chin-Bing, S.; King, D.; Bur-gos, G. Solitary wave generation dynamics at Luzon Strait. Ocean Model. 2010, 31, 9–27. [Google Scholar] [CrossRef]
- Zheng, K.; Zhang, Z.; Yang, Z.; Sun, H.; Guan, S.; Huang, X.; Zhou, C.; Zhao, W.; Tian, J. Influence of Lee Wave Breaking on Far-Field Mixing in the Deep Ocean. J. Geophys. Res. Ocean. 2024, 129, e2023JC020386. [Google Scholar] [CrossRef]
- Sheu, W.; Wu, C.; Oey, L. Blocking and westward passage of eddies in the Luzon Strait. Deep. Sea Res. Part II Top. Stud. Oceanogr. 2010, 57, 1783–1791. [Google Scholar] [CrossRef]
- Hsin, Y.; Wu, C.; Chao, S. An updated examination of the Luzon Strait transport. J. Geophys. Res. Ocean. 2012, 117, C03022. [Google Scholar] [CrossRef]
- Chiswell, S.M. Altimeter and current meter observations of internal tides: Do they agree? J. Phys. Oceanogr. 2006, 36, 1860–1872. [Google Scholar] [CrossRef]
- Gill, A.E. Atmosphere-Ocean Dynamics; Academic Press: London, UK, 1982. [Google Scholar]
- Zhou, X.; Grimshaw, R. The effect of variable currents on internal solitary waves. Dyn. Atmos. Ocean. 1989, 14, 17–39. [Google Scholar] [CrossRef]
- Doblas-Reyes, F.J.; Déqué, M. A flexible bandpass filter design procedure applied to midlatitude intraseasonal variability. Mon. Weather. Rev. 1998, 126, 3326–3335. [Google Scholar] [CrossRef]
- Bleck, R.; Boudra, D. Initial testing of a numerical ncean circulation model using a hybrid (quasi-isopycnic) vertical coordinate. J. Phys. Oceanogr. 1981, 11, 755–770. [Google Scholar] [CrossRef]
- Gong, Y.; Rayson, M.D.; Jones, N.L.; Ivey, G.N. Directional decomposition of internal tides propagating from multiple generation sites. Ocean Model. 2021, 162, 101801. [Google Scholar] [CrossRef]
- Alford, M.H.; Peacock, T.; MacKinnon, J.A.; Nash, J.D.; Buijsman, M.C.; Centurioni, L.C.; Chao, S.-Y.; Chang, M.-H.; Farmer, D.M.; Fringer, O.B.; et al. The formation and fate of internal waves in the South China Sea. Nature 2015, 521, 65–69. [Google Scholar] [CrossRef] [PubMed]
- Xu, Z.; Yin, B.; Hou, Y.; Xu, Y. Variability of internal tides and near-inertial waves on the continental slope of the northwestern South China Sea. J. Geophys. Res. Ocean. 2013, 118, 197–211. [Google Scholar] [CrossRef]


Disclaimer/Publisher’s Note: The statements, opinions and data contained in all publications are solely those of the individual author(s) and contributor(s) and not of MDPI and/or the editor(s). MDPI and/or the editor(s) disclaim responsibility for any injury to people or property resulting from any ideas, methods, instructions or products referred to in the content. |
© 2024 by the authors. Licensee MDPI, Basel, Switzerland. This article is an open access article distributed under the terms and conditions of the Creative Commons Attribution (CC BY) license (https://creativecommons.org/licenses/by/4.0/).