Article

Response of a Coral Reef Sand Foundation Densified through the Dynamic Compaction Method

1
Department of Emergency Support, Nanjing University of Science and Technology, Nanjing 210094, China
2
School of Mechanical Engineering, Nanjing University of Science and Technology, Nanjing 210094, China
3
Naval Research Institute of PLA, Beijing 100161, China
4
Department of Civil Engineering, Shanghai Jiaotong University, Shanghai 200030, China
*
Author to whom correspondence should be addressed.
J. Mar. Sci. Eng. 2024, 12(9), 1479; https://doi.org/10.3390/jmse12091479
Submission received: 18 July 2024 / Revised: 21 August 2024 / Accepted: 23 August 2024 / Published: 26 August 2024
(This article belongs to the Special Issue Advances in Marine Geological and Geotechnical Hazards)

Abstract

:
Dynamic compaction is a method of ground reinforcement that uses the huge impact energy of a free-falling hammer to compact the soil. This study presents a DC method for strengthening coral reef foundations in the reclamation area of remote sea islands. Pilot tests were performed to obtain the design parameters before official DC operation. The standard penetration test (SPT), shallow plate-load test (PLT), and deformation investigation were conducted in two improvement regions (A1 and A2) with varying tamping energies. During the deformation test, the depth of the tamping crater for the first two points’ tamping and the third full tamping was observed at two distinct sites. The allowable ground bearing capacity at two disparate field sites was at least 360 kPa. The reinforcement depths were 3.5 and 3.2 m in the A1 and A2 zones, respectively. The DC process was numerically analyzed by the two-dimensional particle flow code, PFC2D. It indicated that the reinforcement effect and effective reinforcement depth were consistent with the field data. The coral sand particles at the bottom of the crater were primarily broken down in the initial stage, and the particle-crushing zone gradually developed toward both sides of the crater. The force chain developed similarly at the three tamping energies (800, 1500, and 2000 kJ), and the impact stress wave propagated along the sand particles primarily in the vertical direction.

1. Introduction

Coral reefs are a special type of rock mass formed after the death of reef-building coral communities through long geological processes [1]. Coral backfill is typically located on the surface of coral reefs and comprises biological debris from primary or secondary coral reef rocks, corals, and shells that have been eroded, broken, and deposited in nearshore environments [2]. Coral reef sand (CRS) is a widely graded soil with a distribution ranging from silt to gravel. The remote sea reef areas contain a large number of islands with loose deposits dominated by coral fragments and coral reef sand, accounting for 60–80% of the total. Using CRS as a reclamation material can effectively solve the problem of coral reef debris dumps and alleviate the shortage of reclamation fillers [3]. CRS is a particular type of soil with low particle hardness and high porosity and friability, making it challenging to use as the construction ground and backfill material for road embankments and airfield runways [4]. Thus, a CRS foundation cannot directly support structures or roads, necessitating an appropriate improvement method to strengthen it.
Research interest in improving coral sand foundations has increased in recent years. Traditional foundation reinforcement techniques, such as pile driving [5], which have been successfully adopted for other types of soils, have been proven to be ineffective for CRS owing to its crushability. Depending on the engineering requirements, a variety of additives, including gypsum, limestone, calcite [6], Portland cement [7], and a chemical grout [8], can be utilized to stabilize CRS. In addition, various methods of improving soil, like microbially induced calcite precipitation (MICP) [9], which uses biomineralization processes to induce cementation, have significant advantages in decreasing subsidence [10], mitigating liquefaction [11], and reinforcing the foundation [12]. Stabilization and MICP improvement techniques could reinforce the mechanical capacity of CRS. However, they are generally not suitable for large built-up regions on islands and reefs owing to economic and environmental issues.
Among the aforementioned techniques, dynamic compaction (DC) is an appropriate reinforcement technique for large-scale foundation reinforcement owing to its feasibility, cost-effectiveness, and controllable thickness [13,14]. The DC technique involves repeatedly impacting a ground surface with a heavy steel or concrete rammer (generally 100–300 kN) dropped from a height of 10–40 m. The enormous stress exerted by the hammer’s impact destroys the structure of the original soil particles and decreases the void ratio of the soil, effectively compacting the foundation. This decreases the compressibility and enhances the bearing capacity of the foundation. As a relatively mature foundation improvement method, it has been widely applied to sandy grounds. The DC approach was applied to reinforce the sandy foundation by Hu et al. [15], Zhou et al. [16], and Feng et al. [17], indicating its advantage for dissipating pore water pressure and strengthening deep sandy materials. Various coupling and nonlinear problems associated with the dynamic response of the DC process have led to the development of analytical and numerical models for demonstrating complex soil behavior during DC. Nashaed et al. [18] determined the post-improvement density and penetration resistance of sandy soils using energy-based numerical methods. The void ratio of granular soil can be effectively ascertained through the utilization of the discrete element method (DEM) in conjunction with a discontinuous deformation analysis methodology. Cundall and Strack [19] introduced an innovative algorithm called the particle flow code (PFC). The mechanical properties of material with granularity can be readily simulated by the implementation of the particle flow discrete element method. Wada et al. [20] analyzed the tampering crater on granular materials through a two-dimensional (2D) particle flow discrete element method. Ma et al. [21] employed the particle flow discrete element method to analyze the reinforcement effect of the gravelly soil foundation resulting from DC. Jia et al. [22] determined the granular soil mechanism during DC using the PFC/FLAC coupled method. Studies on the DC mechanism have mainly concentrated on terrigenous sand, while engineering experience and theoretical guidance on the reinforcement effect of CRS through DC remains in shortage. Thus, no matter whether from the perspective of forward-looking construction of island and reef projects, or from the perspective of promoting the comprehensive development of theory and technology in the field of engineering geology, it is greatly significant to investigate the scientific treatment of coral reef detrital sediments and the application of an engineering filler for DC.
This study comprehensively described a field investigation combined with a two-dimensional particle flow numerical analysis (PFC2D) method to study the effectiveness of DC on coral debris foundations in the remote sea islands. The field study consisted of a deformation test, shallow plate load test, and standard penetration test. The depth of a crater after each tamping pass in the two test zones after DC was measured during the deformation tests. On the basis of the data of the shallow plate load test, the CRS foundation’s permissible bearing capacity reinforced through DC was acquired. In addition, the blow count was explored according to the SPT results in the investigation area, and the depth of reinforcement for DC was determined with respect to the variation in the blow count with depth. Numerical computations were performed to reproduce the DC process, and the reinforcement effect of the coral sand foundation was estimated.

2. On-Site Test Position and Test Procedures

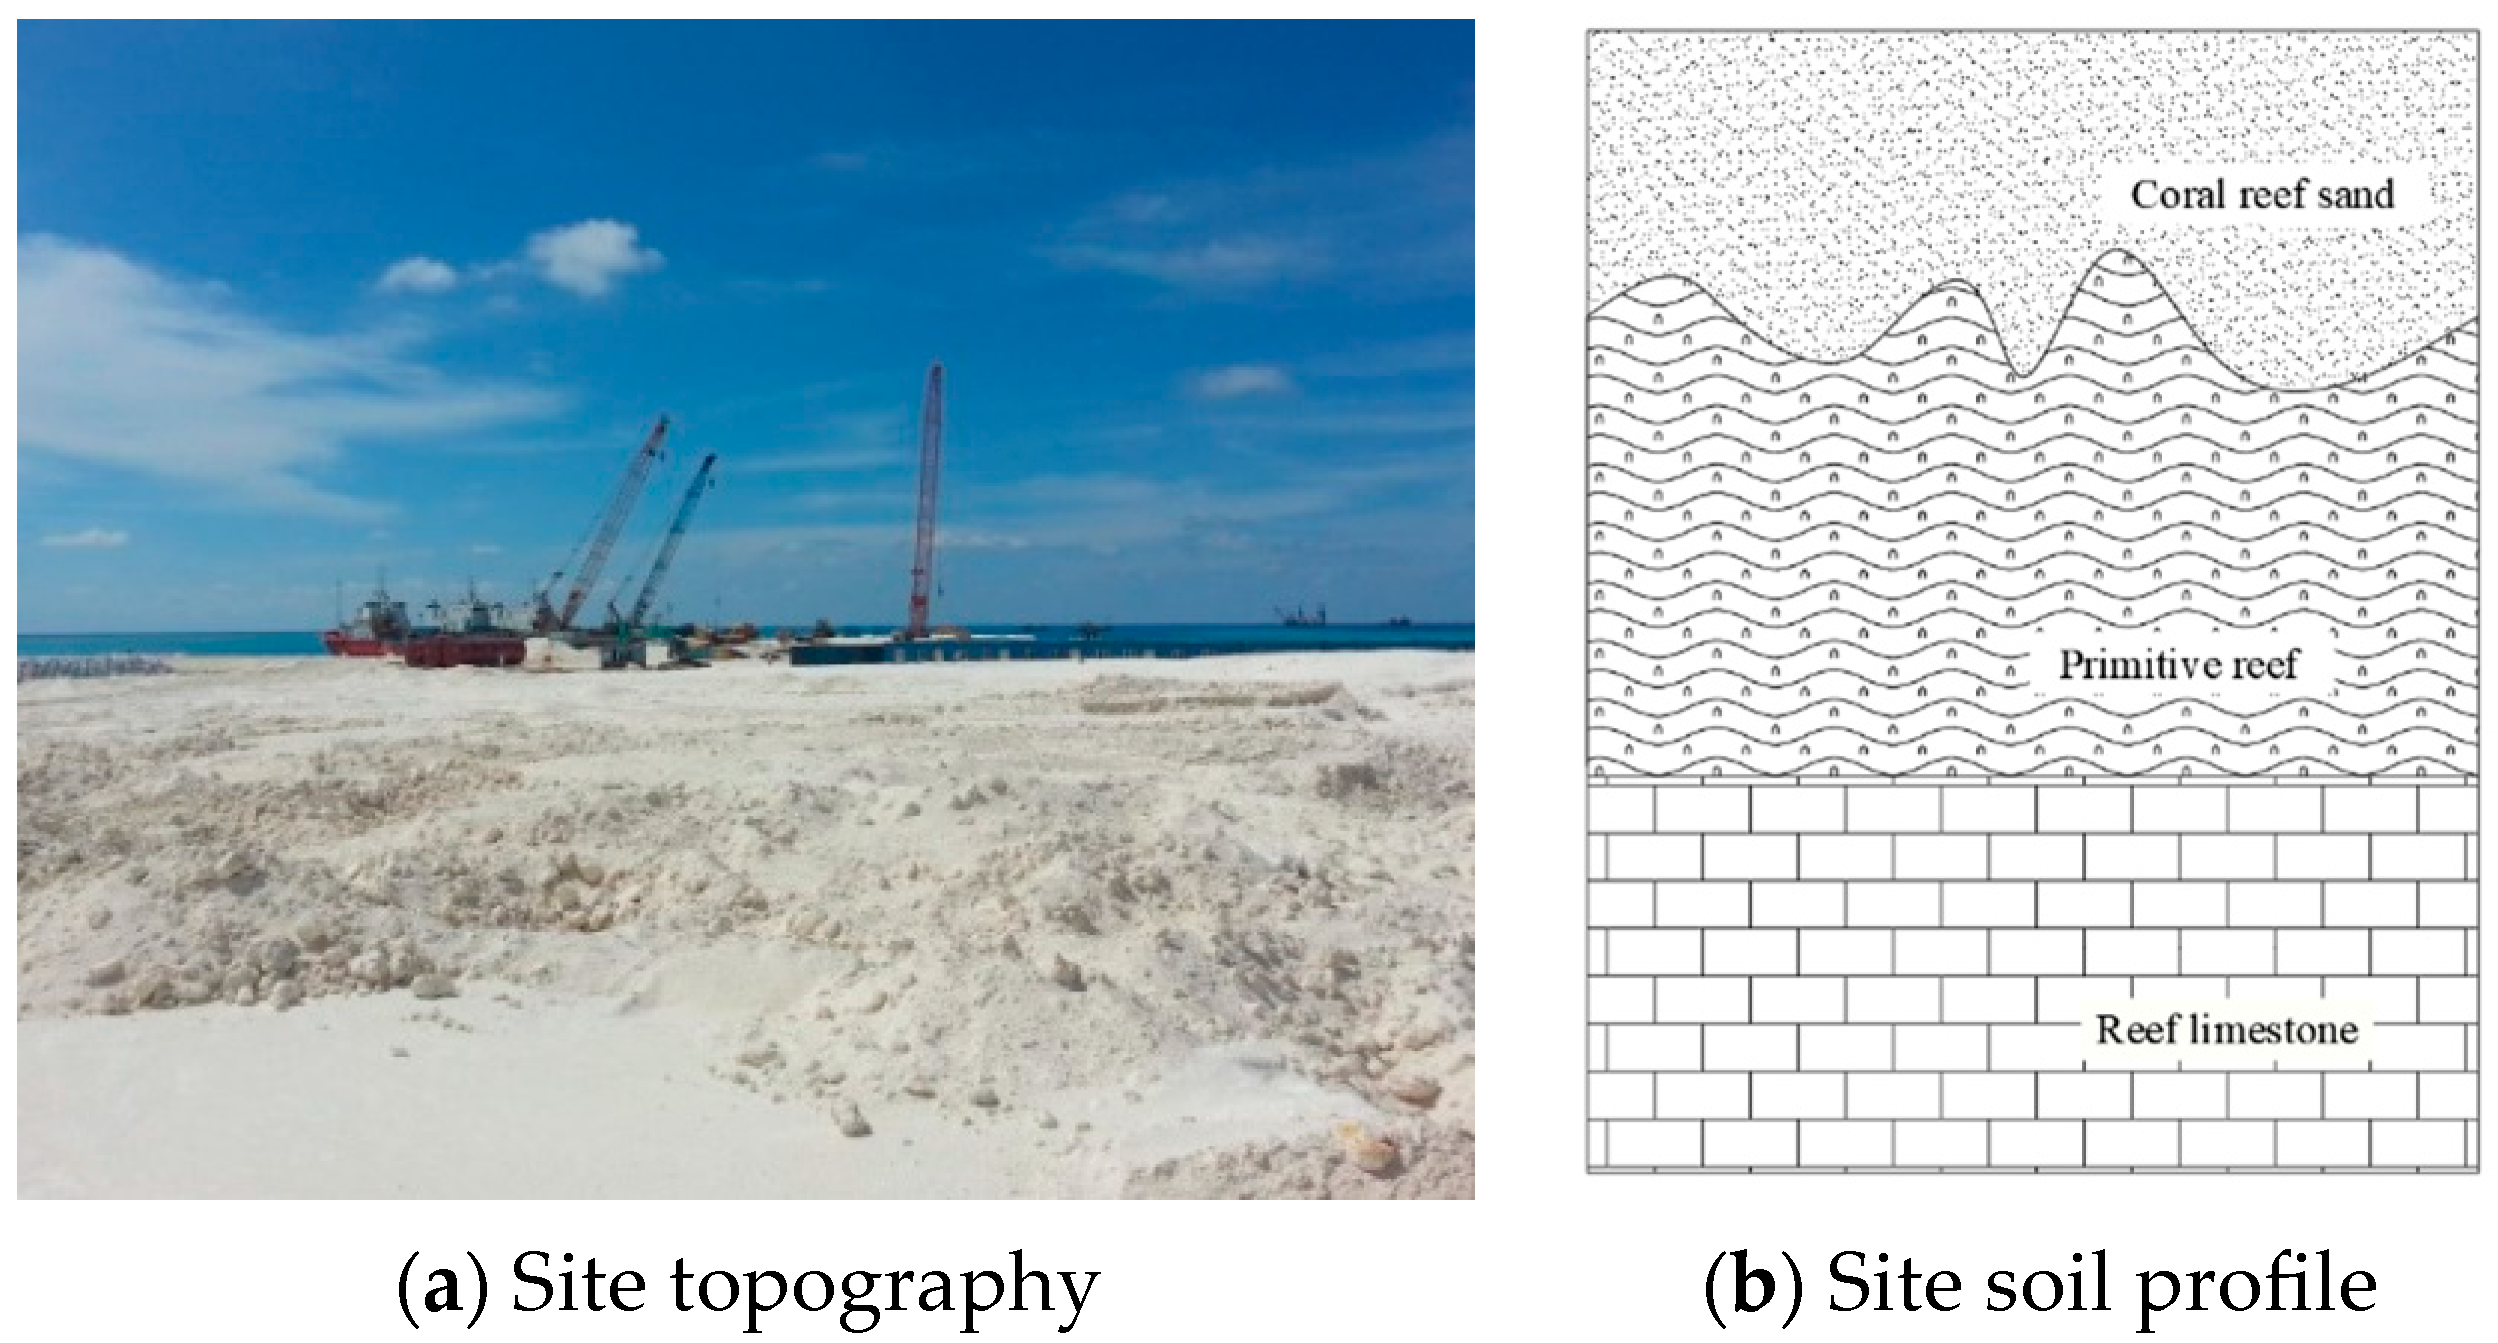
2.1. Field Zones’ Description and Subsoil Condition

The project proposed in the study is situated at a remote sea island and comprises many coral reefs, which are ideal platforms for oceanic resource exploitation. The site is underlain by overlying reclaimed coral sand and a primitive reef and reef limestone formed by biological skeletons, as shown in Figure 1. The average thickness of the upper reclamation layer was approximately 6 m, which was loose and uneven, comprising coral sand dredged from the harbor pond. The original reef in the lower layer was undulating with approximately 10 m thickness, and the reef-limestone layer of cemented rock lay beneath the reef. The surface coral sand is a Holocene uncemented loose sedimentary layer, mainly composed of coral limbs, fragments, and biological gravel. It could be termed coral coarse-grained soil according to the national standard Geotechnical Engineering Investigation Code [23]. The engineering mechanical property of CRS is markedly poor, failing to meet the requirements for bearing capacity of the coral sand foundation. These defects can lead to foundation settlement and cracking of the superstructure. In this case, the foundation reinforcement needs to be implemented; otherwise, infrastructural construction on the reclaimed islands and reefs cannot be performed.
Considering the large construction area to be reinforced, two test zones, A1 and A2 (both at 30 m × 30 m), were sampled for particle sieving tests. According to the grading curve (Figure 2), the CRS gradings in the two disparate areas were approximately the same, with a coarse grain content of over 94%. The coefficient of curvature (Cc) ranged from 0.43 to 1.07, and the range of values for the coefficient of uniformity (Cu) were 3.84 to 16.70, respectively. The reclaimed coral sand layer at the study site was poorly graded. For the large area of reclaimed islands and reefs to be improved, DC was selected to treat the coral sand grounds for economic reasons. However, pilot tests were necessary before formal DC implementation to identify the crucial technical data. The design criterion for the allowable ground bearing capacity and reinforcement thickness after the DC reinforcement techniques were over 360 kPa and 3.0 m, respectively.

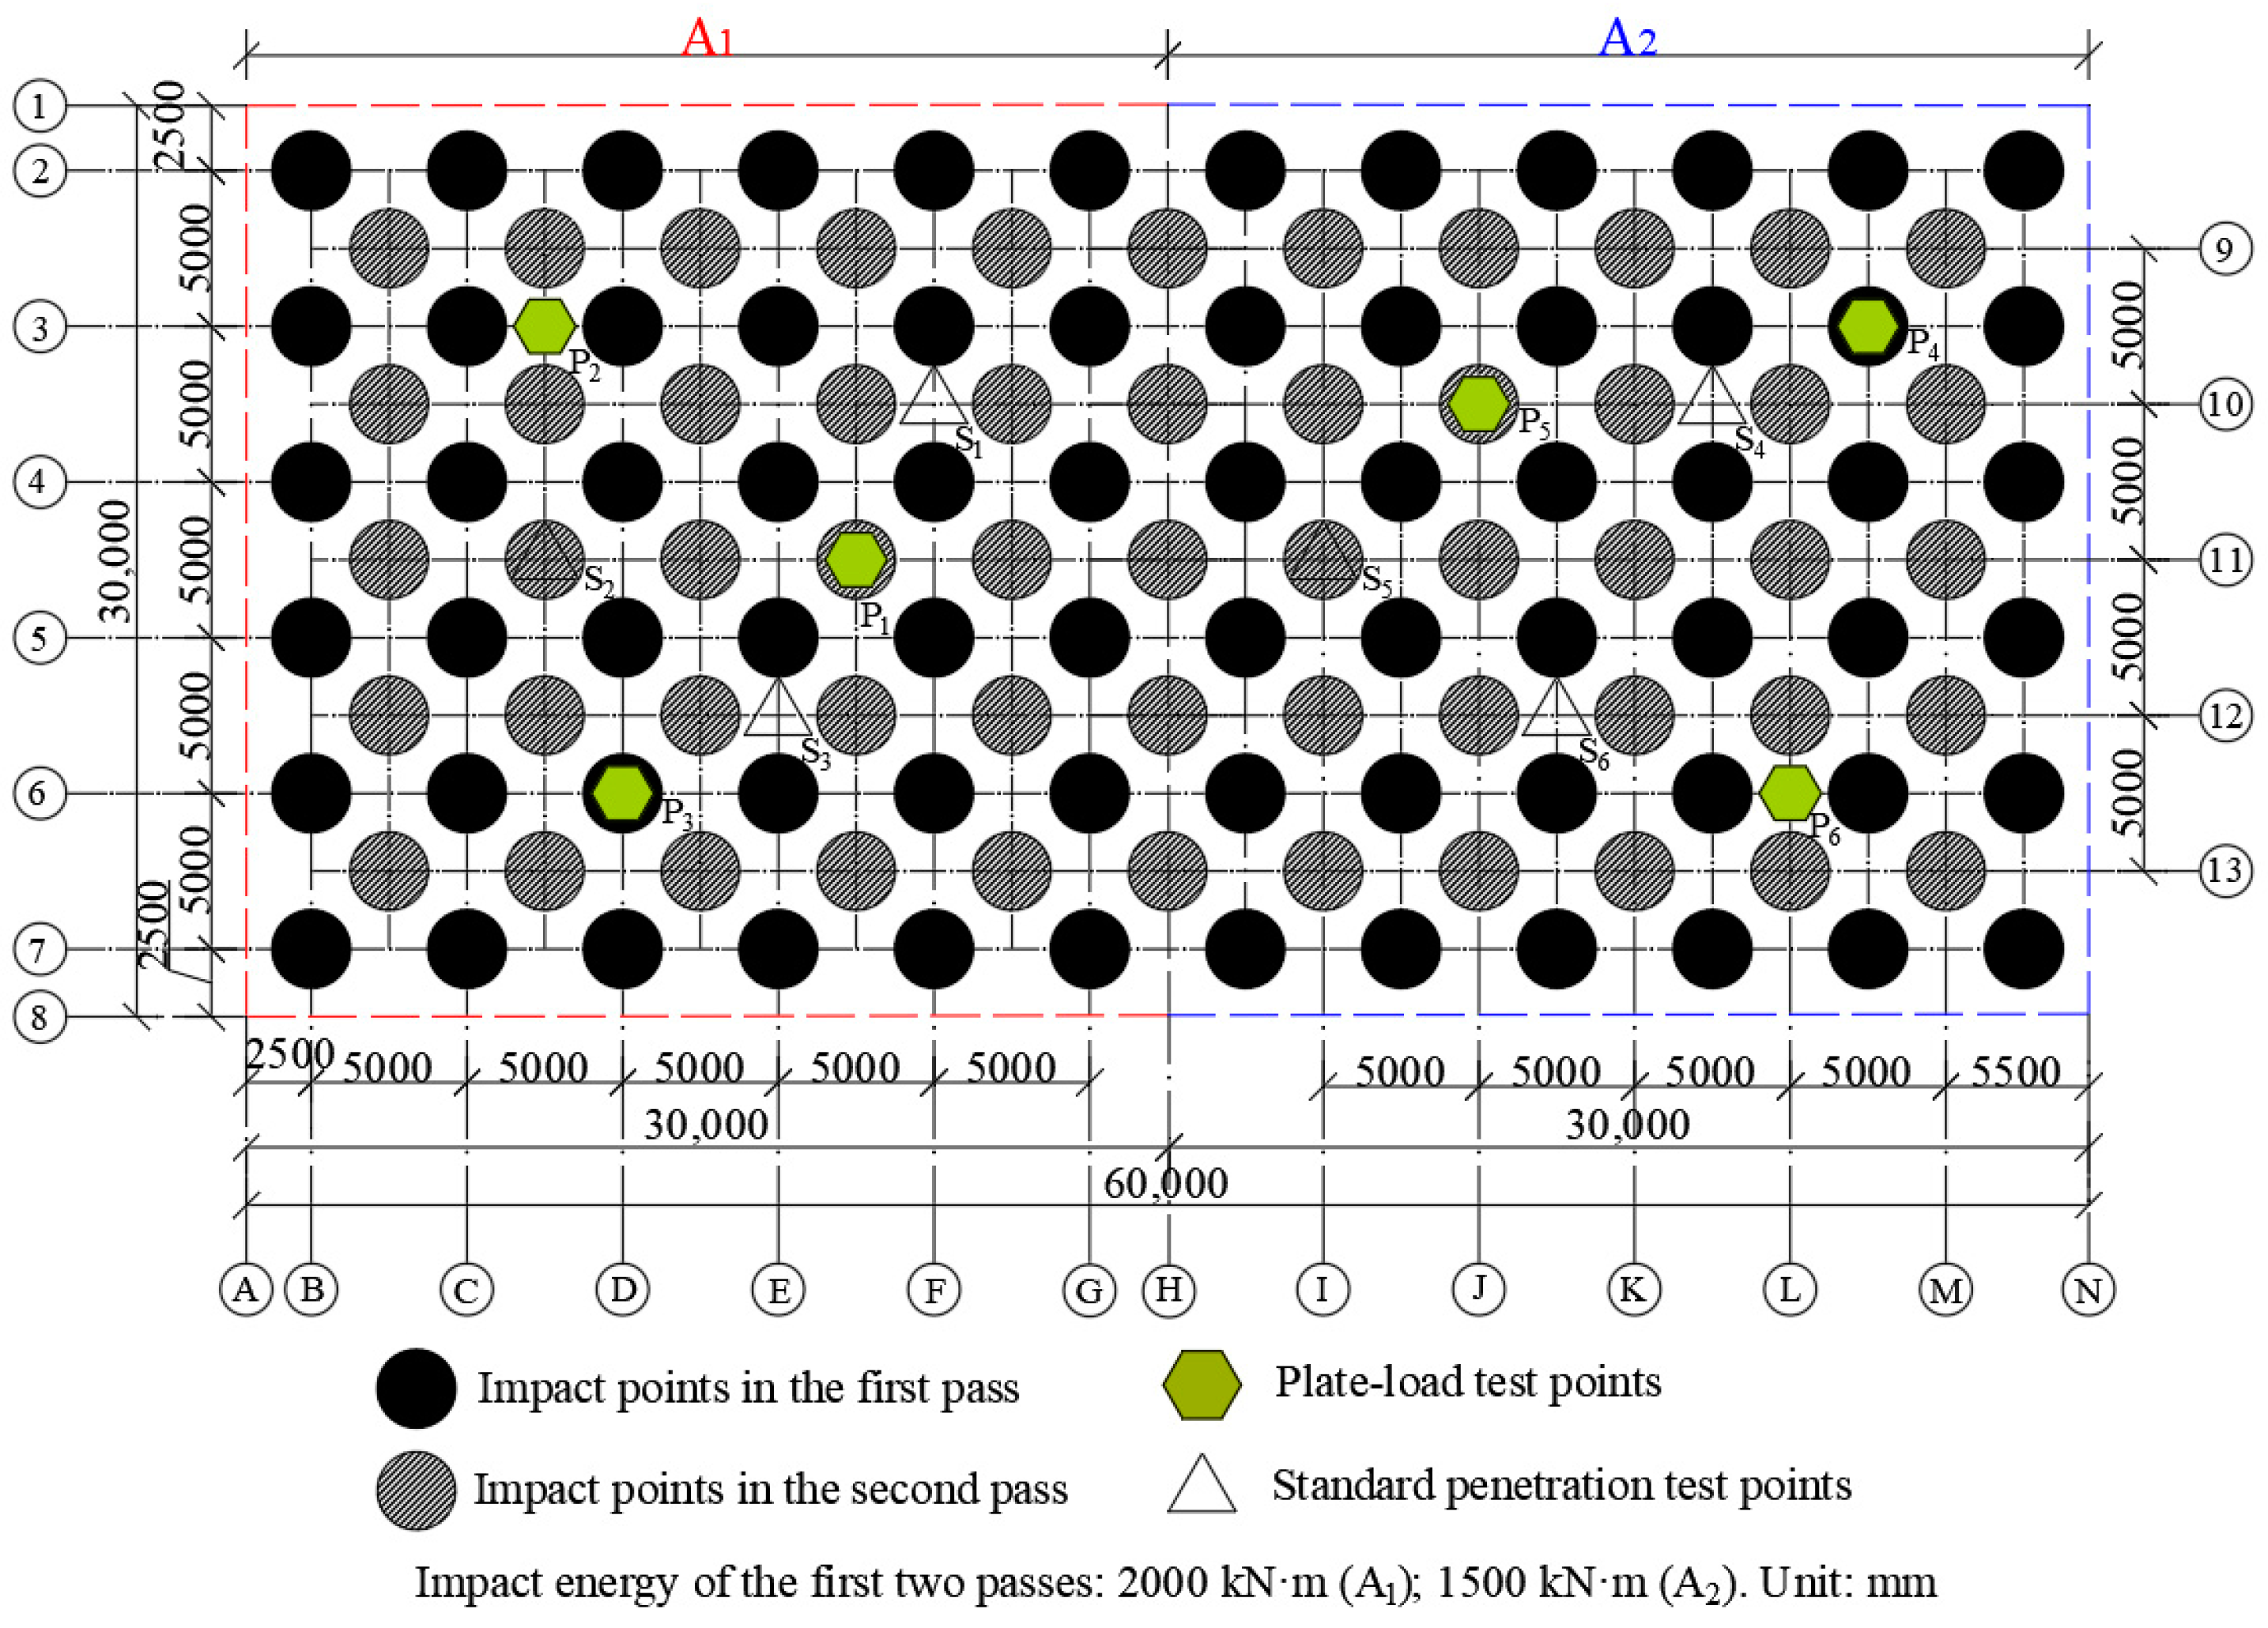
2.2. DC Process on Coral Reef Sand

DC is a densification process; that is, the hammering energy produced by DC completely destroys the original structure of the soil sample and forces water and air out of the pores of the soil particles, causing the ground to become denser through a consolidation process. Lots of factors, including the tamper mass, fall height, tamping point sequence pass, pass numbers, the spacing of tamping points, the interval between each pass, and the ending rule of each tamping, can influence DC design. Owing to complex site-dependent conditions, the abovementioned construction data are often unavailable and are generally determined according to prior engineering experience. Therefore, field pilot tests were performed to ascertain the main technical parameters.
The overall configuration of the tamping points for the two sites (A1, A2) is shown in Figure 3. Three impact passes were conducted, and test tamping was performed to determine the impact times. During the first pass, hammering energy was applied to the impact points, as displayed by the solid circle. During the second pass, the heavy hammer’s drop point position was halfway between the locations of the two adjacent tamping pits in the first pass. Finally, During the third pass, the tamping process was carried out thoroughly across the entire site. Table 1 lists the impact energy levels in the two DC zones. Figure 4 shows the cranes and tampers used in the pilot tests. The tamping energy applied to the A1 region during the first two episodes of ramming reached 2000 kN·m per drop, which is roughly the free fall of a 200 kN hammer from a height of 10 m. As for the third full run of tamping, the tamping energy per drop was 800 kN·m, equivalent to an 80 kN rammer dropped from a 10 m height. The tamping energy for A2 was 1500 kN·m for each drop in the two main tampings, with a full tamping of 600 kN·m per drop. The tamping points for the first two tampings were set up in a square-grid design with each center located 5 m apart. During the last full hammering, approximately one-quarter of the bottom area of the rammer was overlapped. For the last two impacts in the test tamping, the average tamping pit subsidence should have been less than 50 mm.
The average subsidence of the tamping pit for the last two drops in the test tamping should have been less than 50 mm, and the ground around the crater should not have bulged excessively. The drop numbers of the rammer were six for the first two passes and two for the last full pass.

3. Field Test Results

To assess the tamping impact of the DC, lots of geological investigation methods have been employed to evaluate different aspects. Figure 3 illustrates the primary design and configuration of the investigation points. The settlement of tamping pits was monitored to assess the hammering energy applied during each pass. Through the execution of a shallow plate-load test, the permitted ground bearing capacity following DC implementation was verified. Meanwhile, the SPT was also performed to assess the improvement in depth after DC.

3.1. Ground Deformation

Ground settlement and the crater depth are the general and most direct indices of the reinforcement effect induced by the DC, as shown in Figure 4b. The initial position elevations were supplied with investigation points in the two testing regions. Thirty-two elevation observation points were installed in each zone. Following every tamping pass, the elevation of the observation points was recorded. The average aggregate settlement of the two distinct tamping areas after DC is depicted in Figure 5. The depth of tamping pits for the initial pass was the greatest, reaching averages of 0.224 and 0.188 m for zones A1 and A2, respectively. The depth increments of tamping pits for the second pass were significantly smaller than those for the first pass owing to the original tamping energy obtained by the first pass. The impact of compaction energy on the improvement effect gradually waned with point tamping during DC. After the third pass, the two sites were well-compacted, as demonstrated by the larger crater depth differences between the second and third passes. The last full tamping was essential and significant for strengthening the reclaimed sandy coral layer. According to the elevation measurements after the third full tamping in those two zones, the average total subsidence for A1 and A2 were 0.419 and 0.379 m, respectively, denoting that the coral sand ground underwent significant settlement. Thus, a higher tamping energy produces foundation compression more efficiently than a lower tamping energy.

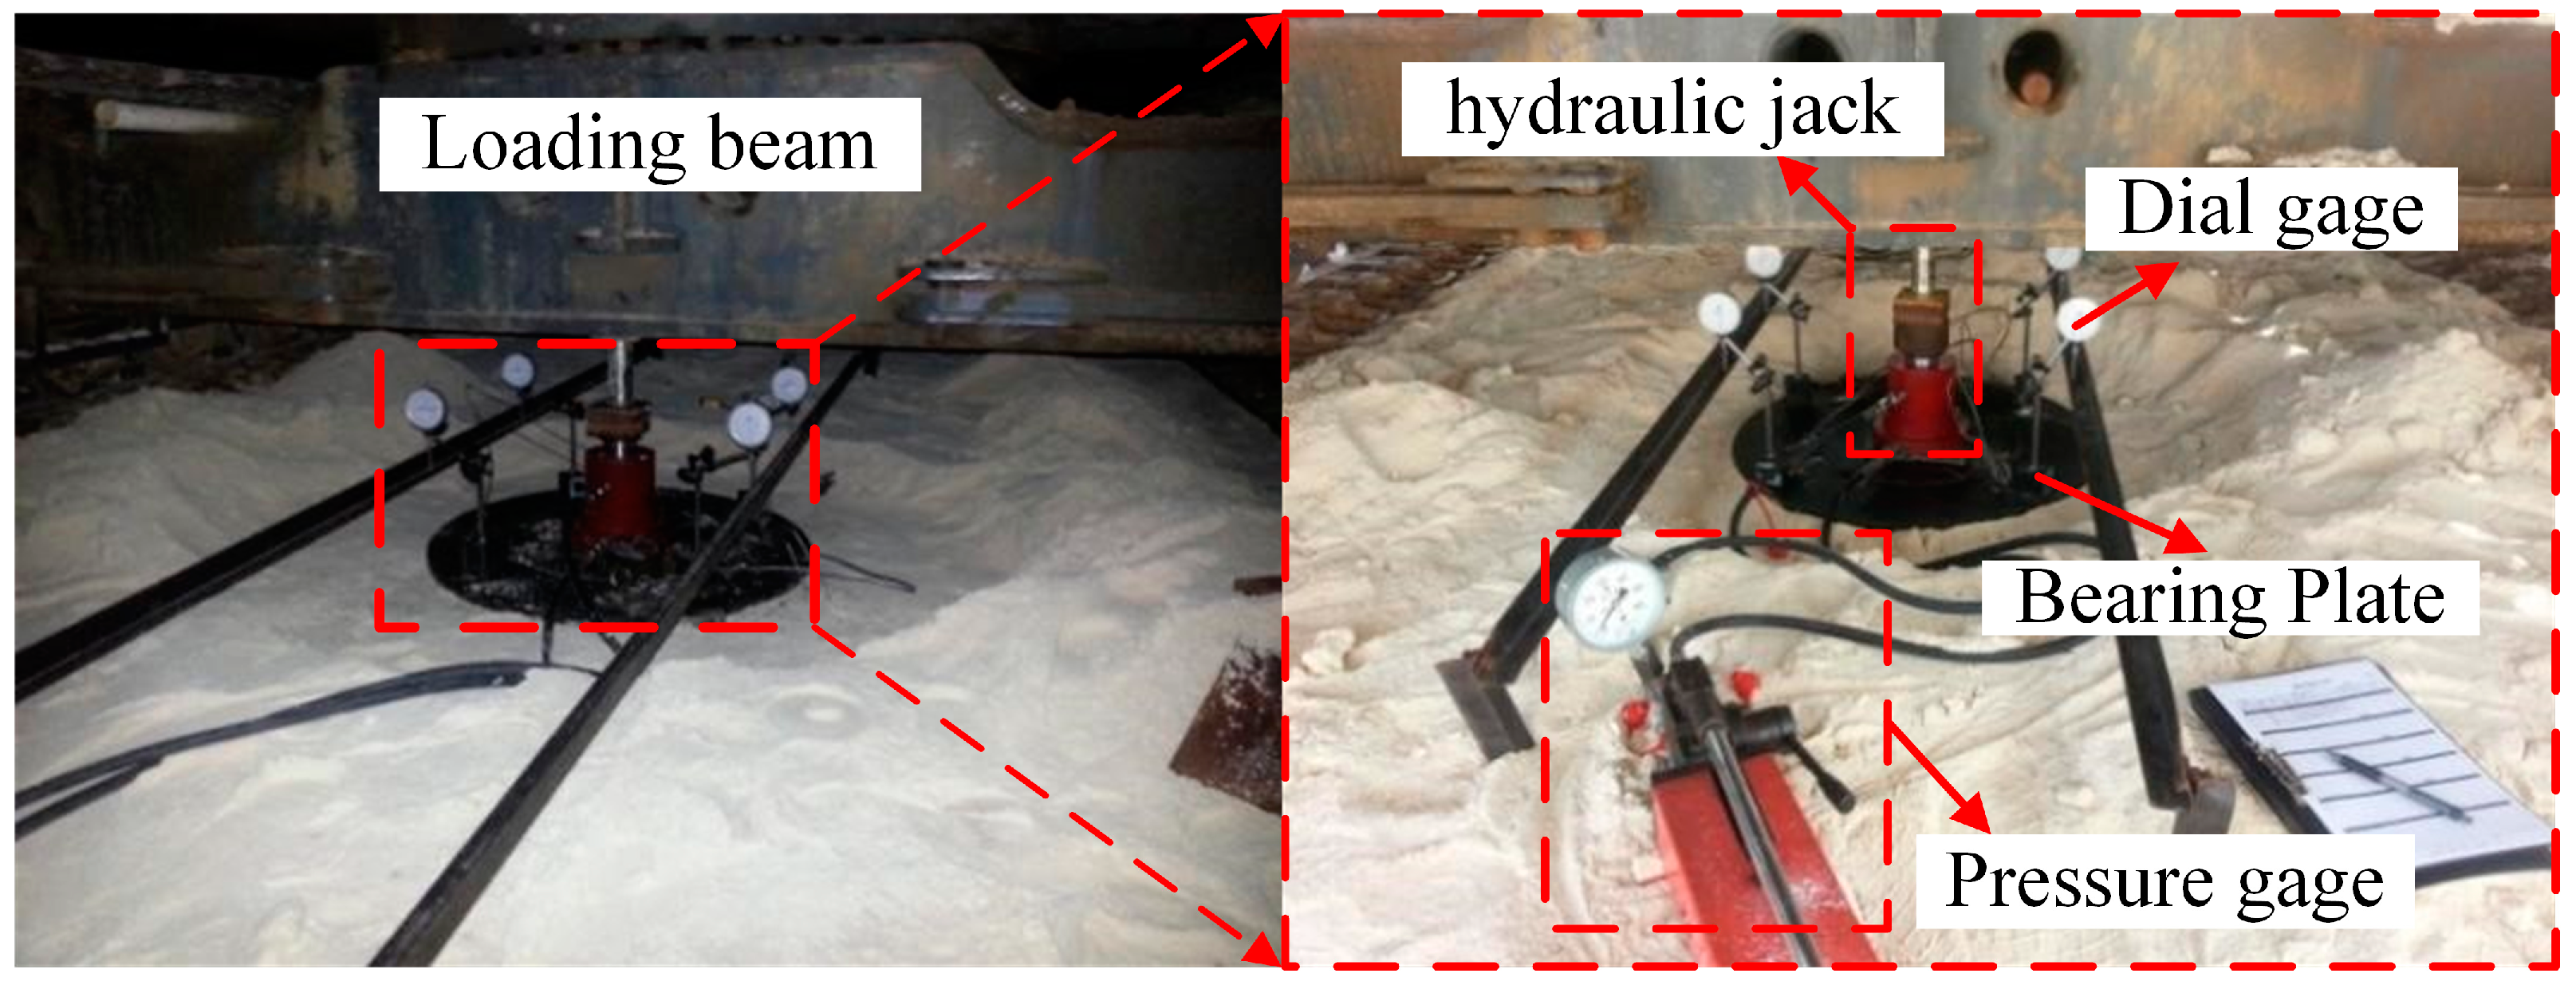
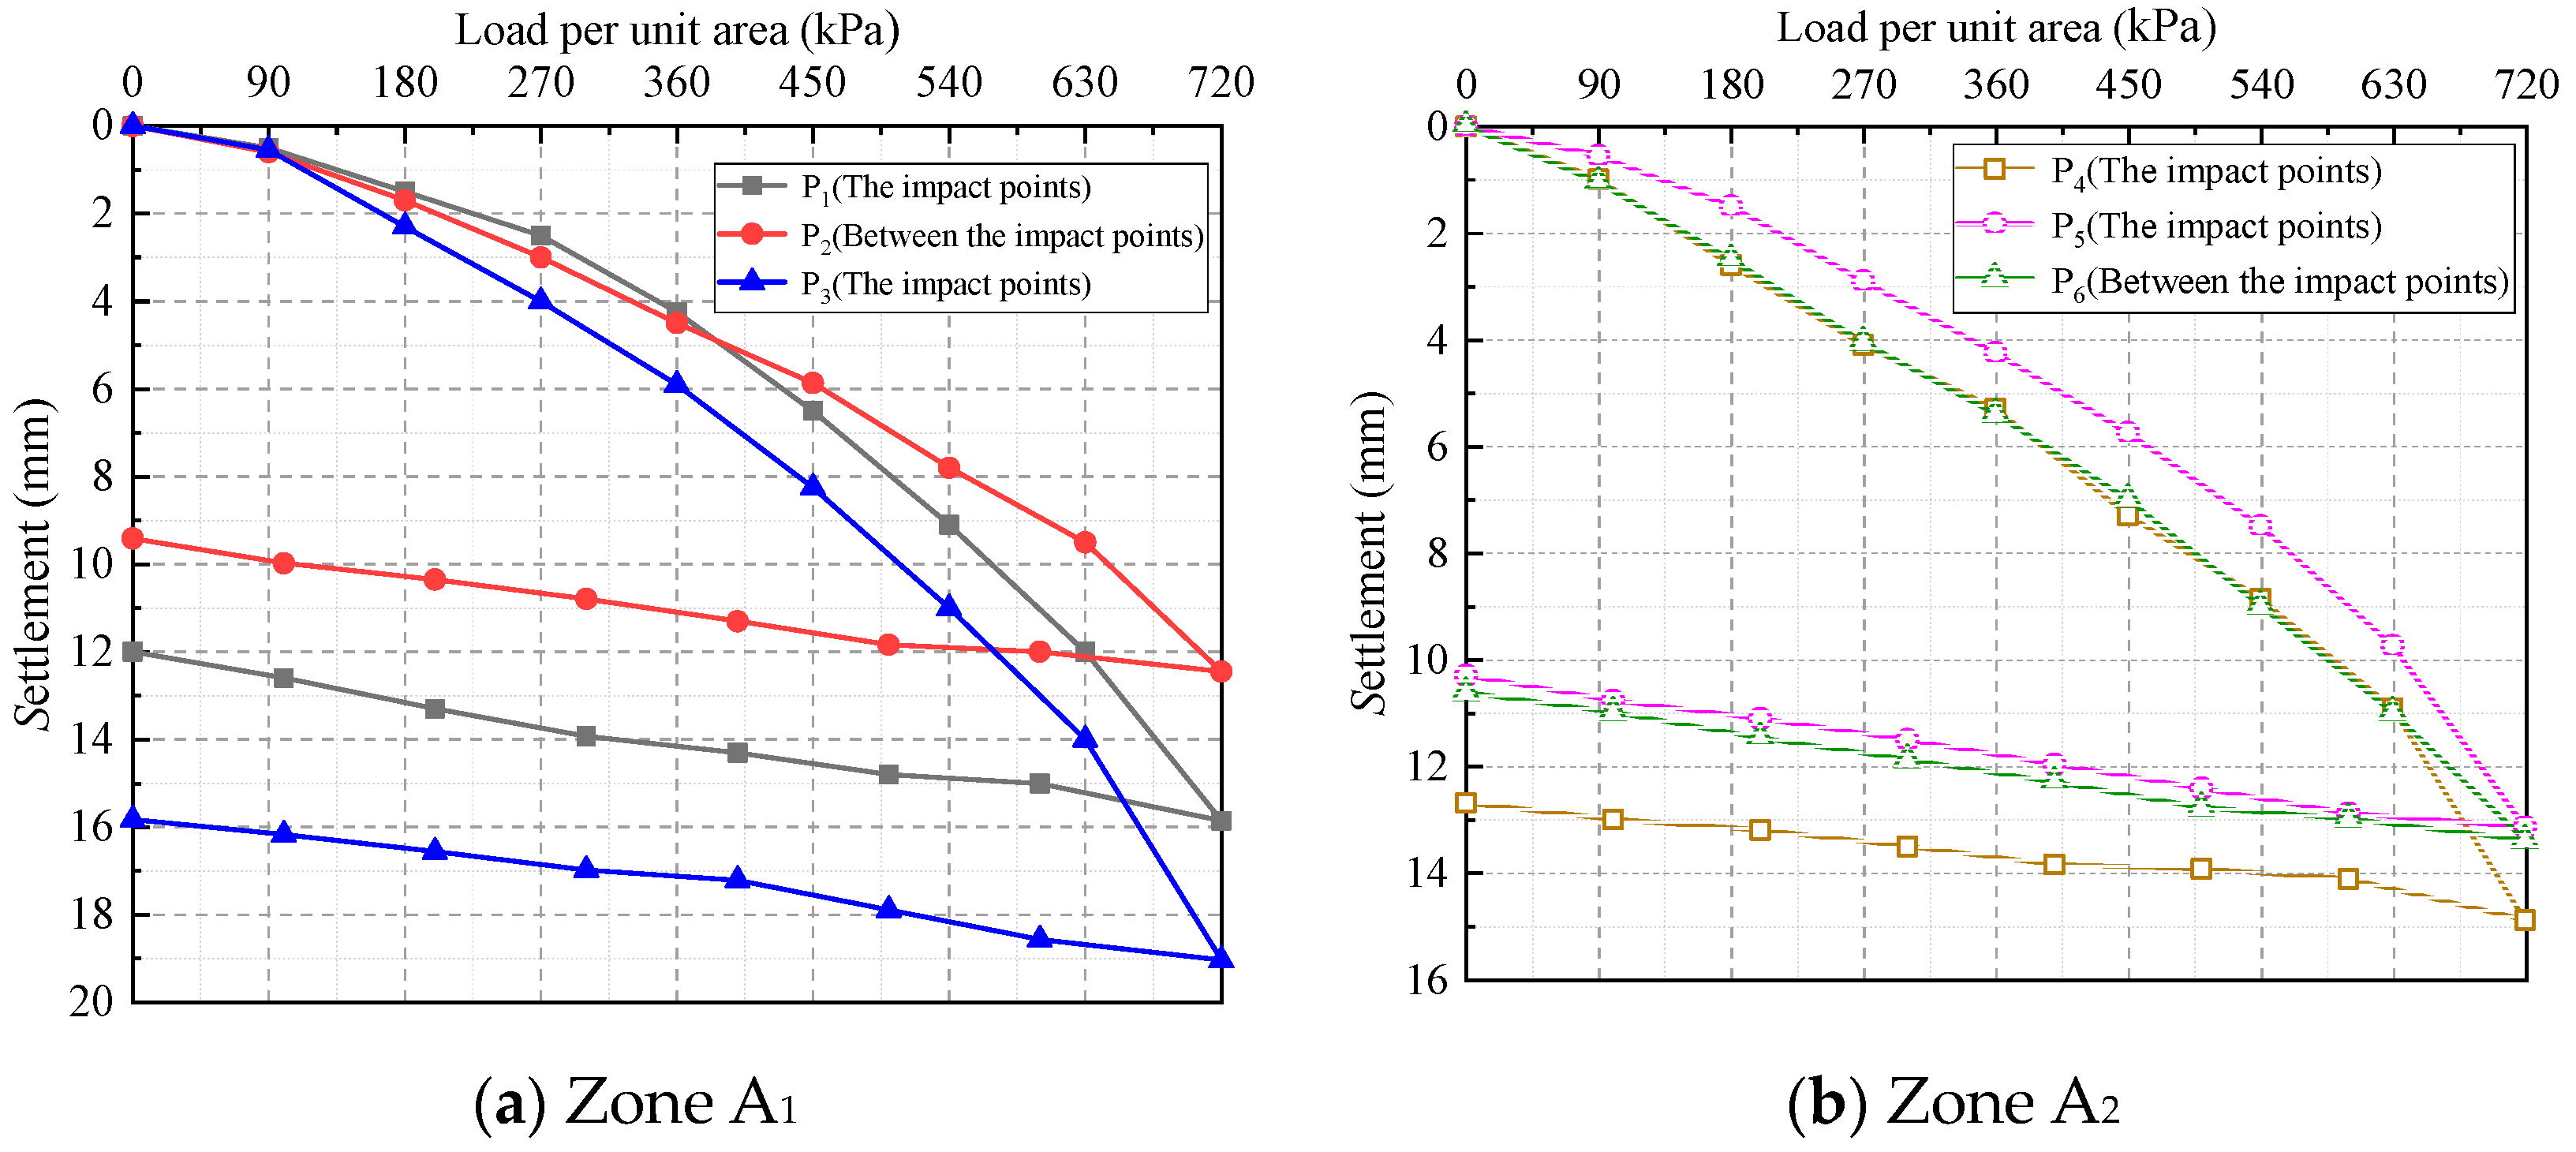
3.2. Shallow Plate-Load Test and Foundation Bearing Capacity

Field load testing validated the coral sand foundation’s bearing capabilities utilizing the ultimate load method. After DC implementation, three shallow plate load tests were performed in those two test zones, as illustrated in Figure 6. As illustrated in Figure 3, the two shallow plate load tests (P2 and P6) were conducted at the tamping points, while the other four plate load tests (P1, P3, P4, and P5) were performed in the middle of two adjacent tamping points. A circular loading plate with a 0.5 m2 area was applied in each test region. The tests started from a plane 50 mm beneath the ground. A coarse sandy layer of 10–20 mm thickness was placed underneath circular loading plates to maintain the loading plate level, structure, and natural moisture content of the test soil. The maximum load applied was 720 kPa, which was twice the design’s permitted bearing capability. The load was applied to the load plate incrementally, with each stage of the load generating settlement deformation larger than a tenth of the maximum load. When the settlement was stabilized, within two hours, the settlement per hour was less than 0.1 mm, then the next level of loading increment was imposed. Load-settlement curves can be utilized to determine the bearing capacity of the coral sand foundation after DC reinforcement according to shallow plate-load tests.
Table 2 lists detailed test data of the shallow plate-load test, and Figure 7 displays the load-settlement curves acquired from the shallow plate-load tests in six different test areas. At the maximum load of 720 kPa, the settlement values of test pits P1, P2, and P3 in the A1 area were 15.86, 12.45, and 19.03 mm, respectively. The corresponding settlements for test pits P4, P5, and P6 in A2 were 14.9, 13.15, and 13.39 mm, respectively. In these two testing regions, none of the six test pits exhibited significant failure during loading to maximum loads. All the six load-settlement curves gradually decreased during the loading process. Smaller deviations were observed among curves P4, P5, and P6, indicating a more homogeneous DC effect in A2 than in A1. Design requirements indicate that the characteristic value of the bearing capacity should be 50% of the value of the maximum loading. The allowable foundation bearing capacity of all six test pits exceeded 360 kPa, meeting the design requirement.

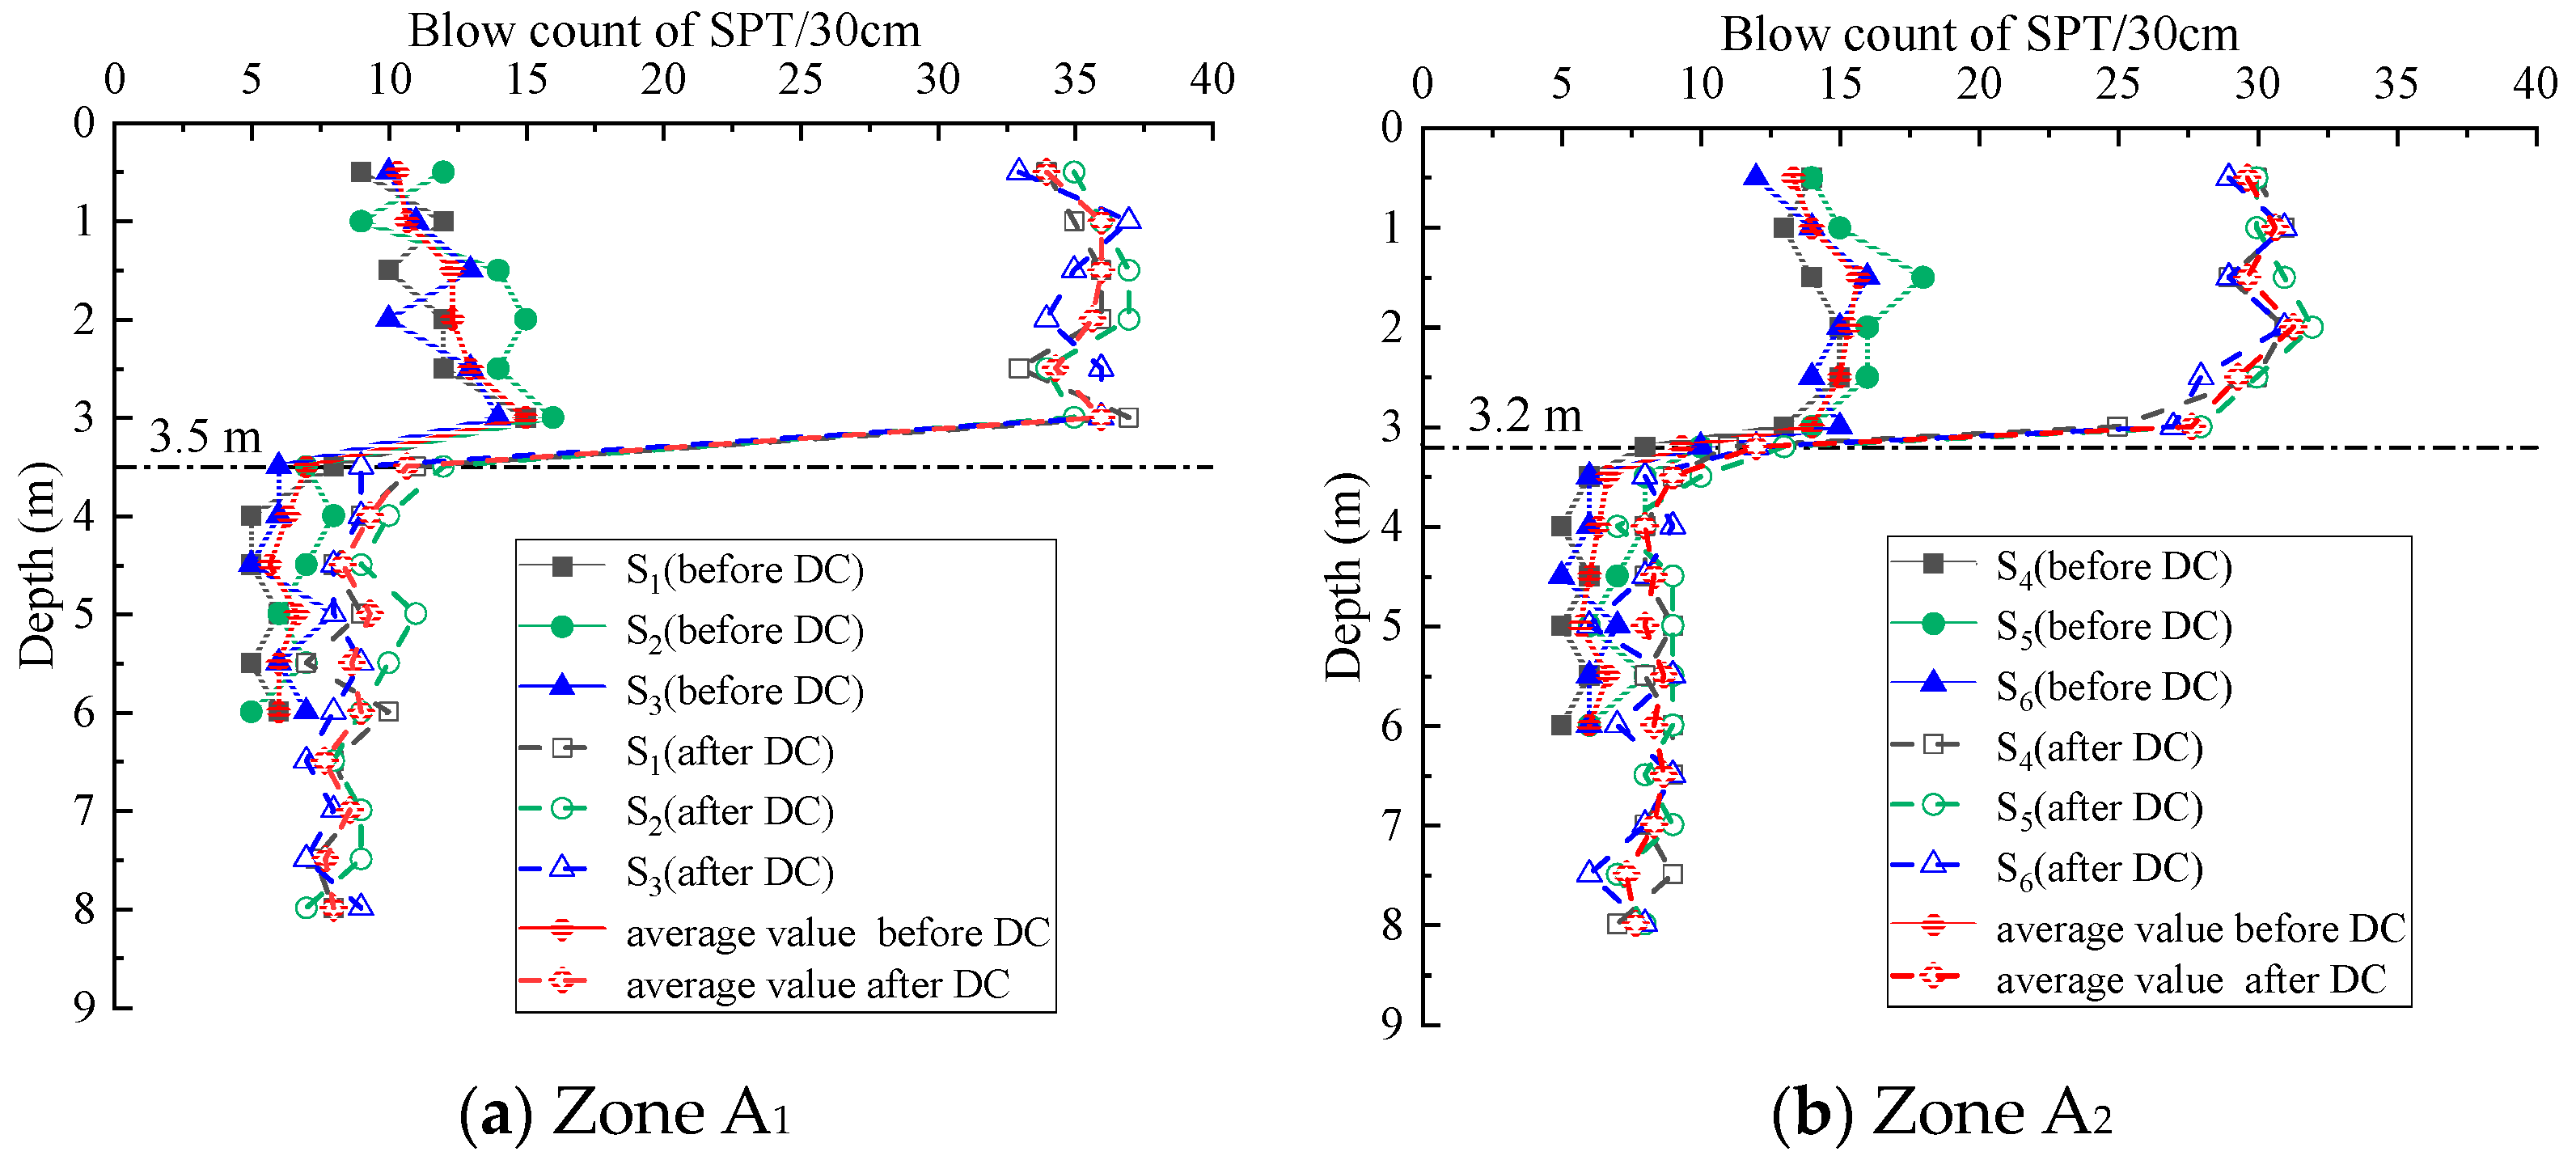
3.3. Standard Penetration Test (SPT) and Reinforcement Depth

The SPT is a commonly employed field investigation method for evaluating the reinforcement depth by DC under sandy ground conditions. Each zone had three different test pits. The SPT was performed on the basis of the Chinese National Code for the design of a building foundation (GB50007-2011) [24]. During the test, the 63.5 kg donut hammer was lifted to a 0.76 m position, and the standard perforator with a length of 51 cm, an outer diameter of 5.1 cm, and an inner diameter of 3.49 cm was hit into the soil through free fall. Theoretically, the total potential energy of the drop hammer was 0.473 kN·m. Blow counts were directly used, considering that the SPT was performed to assess the compressibility of the subsoil after DC in the identical test area. Figure 8 shows the blow count curves at different depths in the two areas. The strengthening effect could be assessed by comparing the number of blows before and after DC. In the A1 area, The SPT blow number grew to double within a depth of 3.5 m from the ground surface, demonstrating a significant reinforcing impact, and the average blow count reached approximately 36 after DC. In the A2 area, the curves also exhibited a discrepancy before and after DC until the depth of about 3.2 m was achieved. The average blow count increased to approximately 30 at depths over 3.2 m. Based on the blow count data of standard penetration tests, the effective reinforcement depths of the two test areas were 3.5 and 3.2 m, respectively. The blow count gradually decreased with an increasing depth until the density state of the ground soil before and after DC became homogeneous. The effective reinforcement depth was strongly correlated with the input energy; a higher tamping energy (2000 kJ) produced a larger effective reinforcement depth and better deep reinforcement effect on the coral reef foundation. Furthermore, on average, the locations at the impact points (S2 in A1 region, S5 in A2 region) underwent a better reinforcement effect than those between the impact points (S1 and S3 in A1 region, S4 and S6 in A2 region).

4. Numerical Study of DC Mechanism

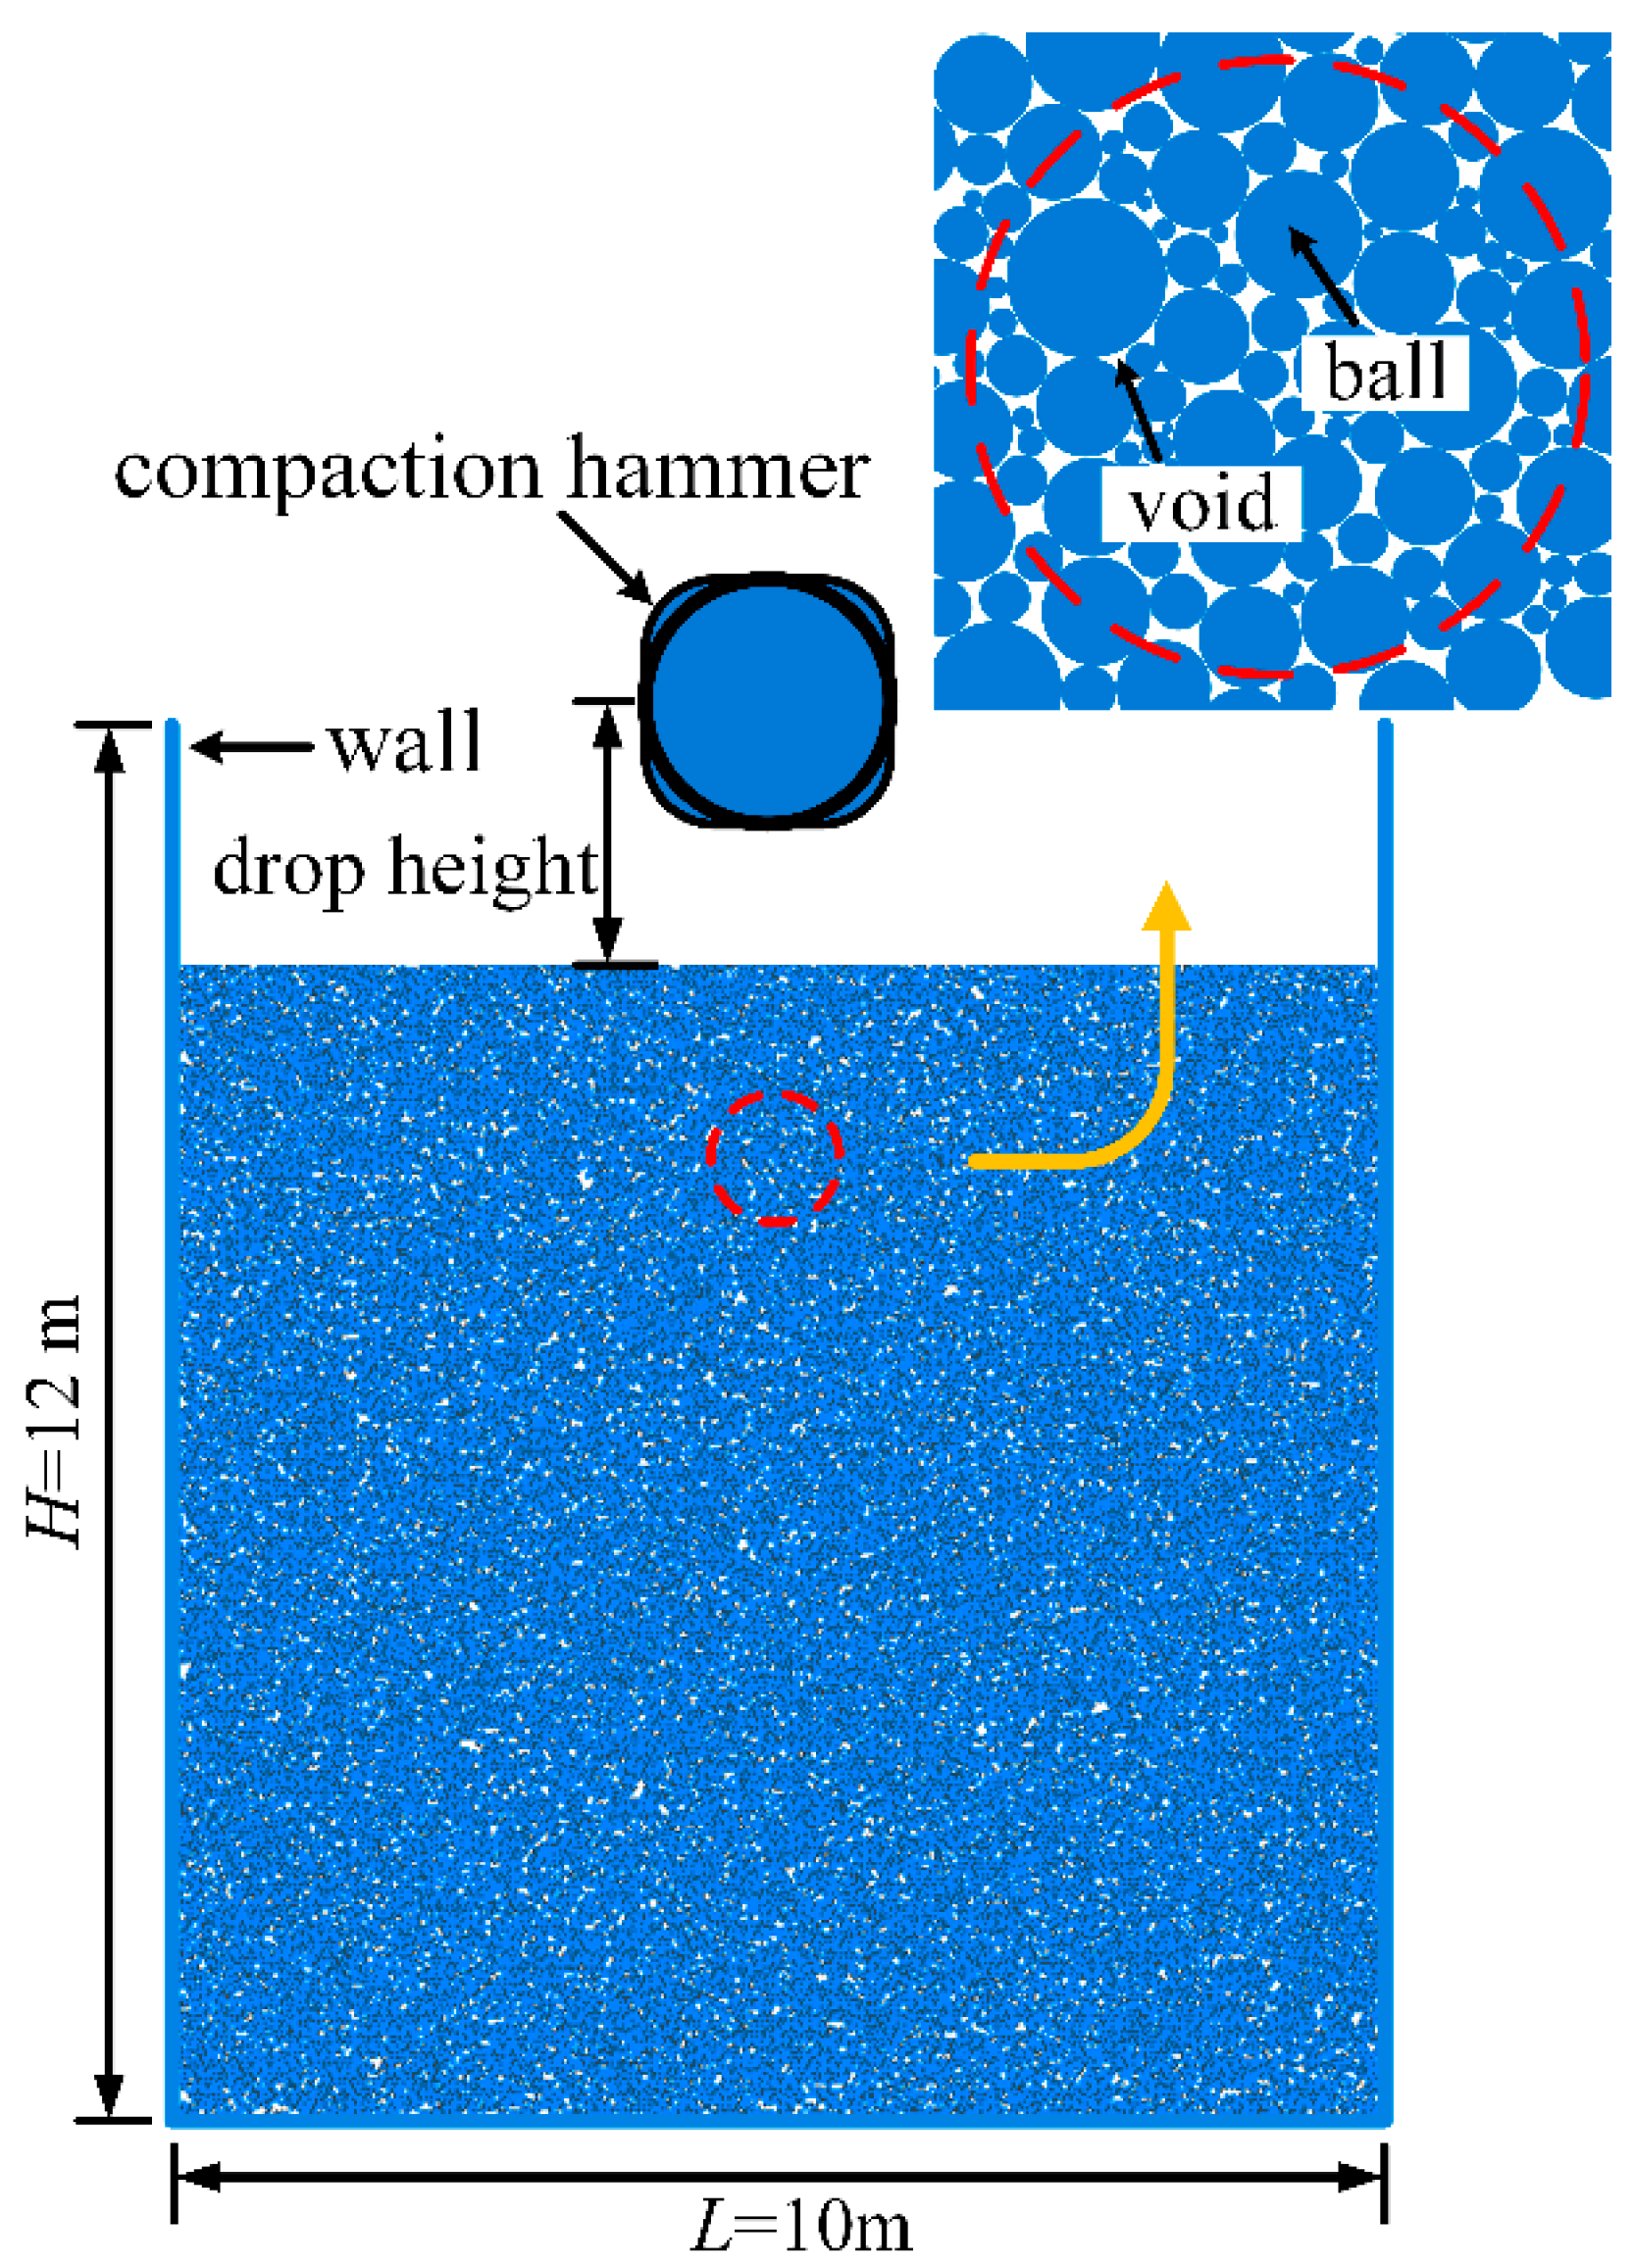
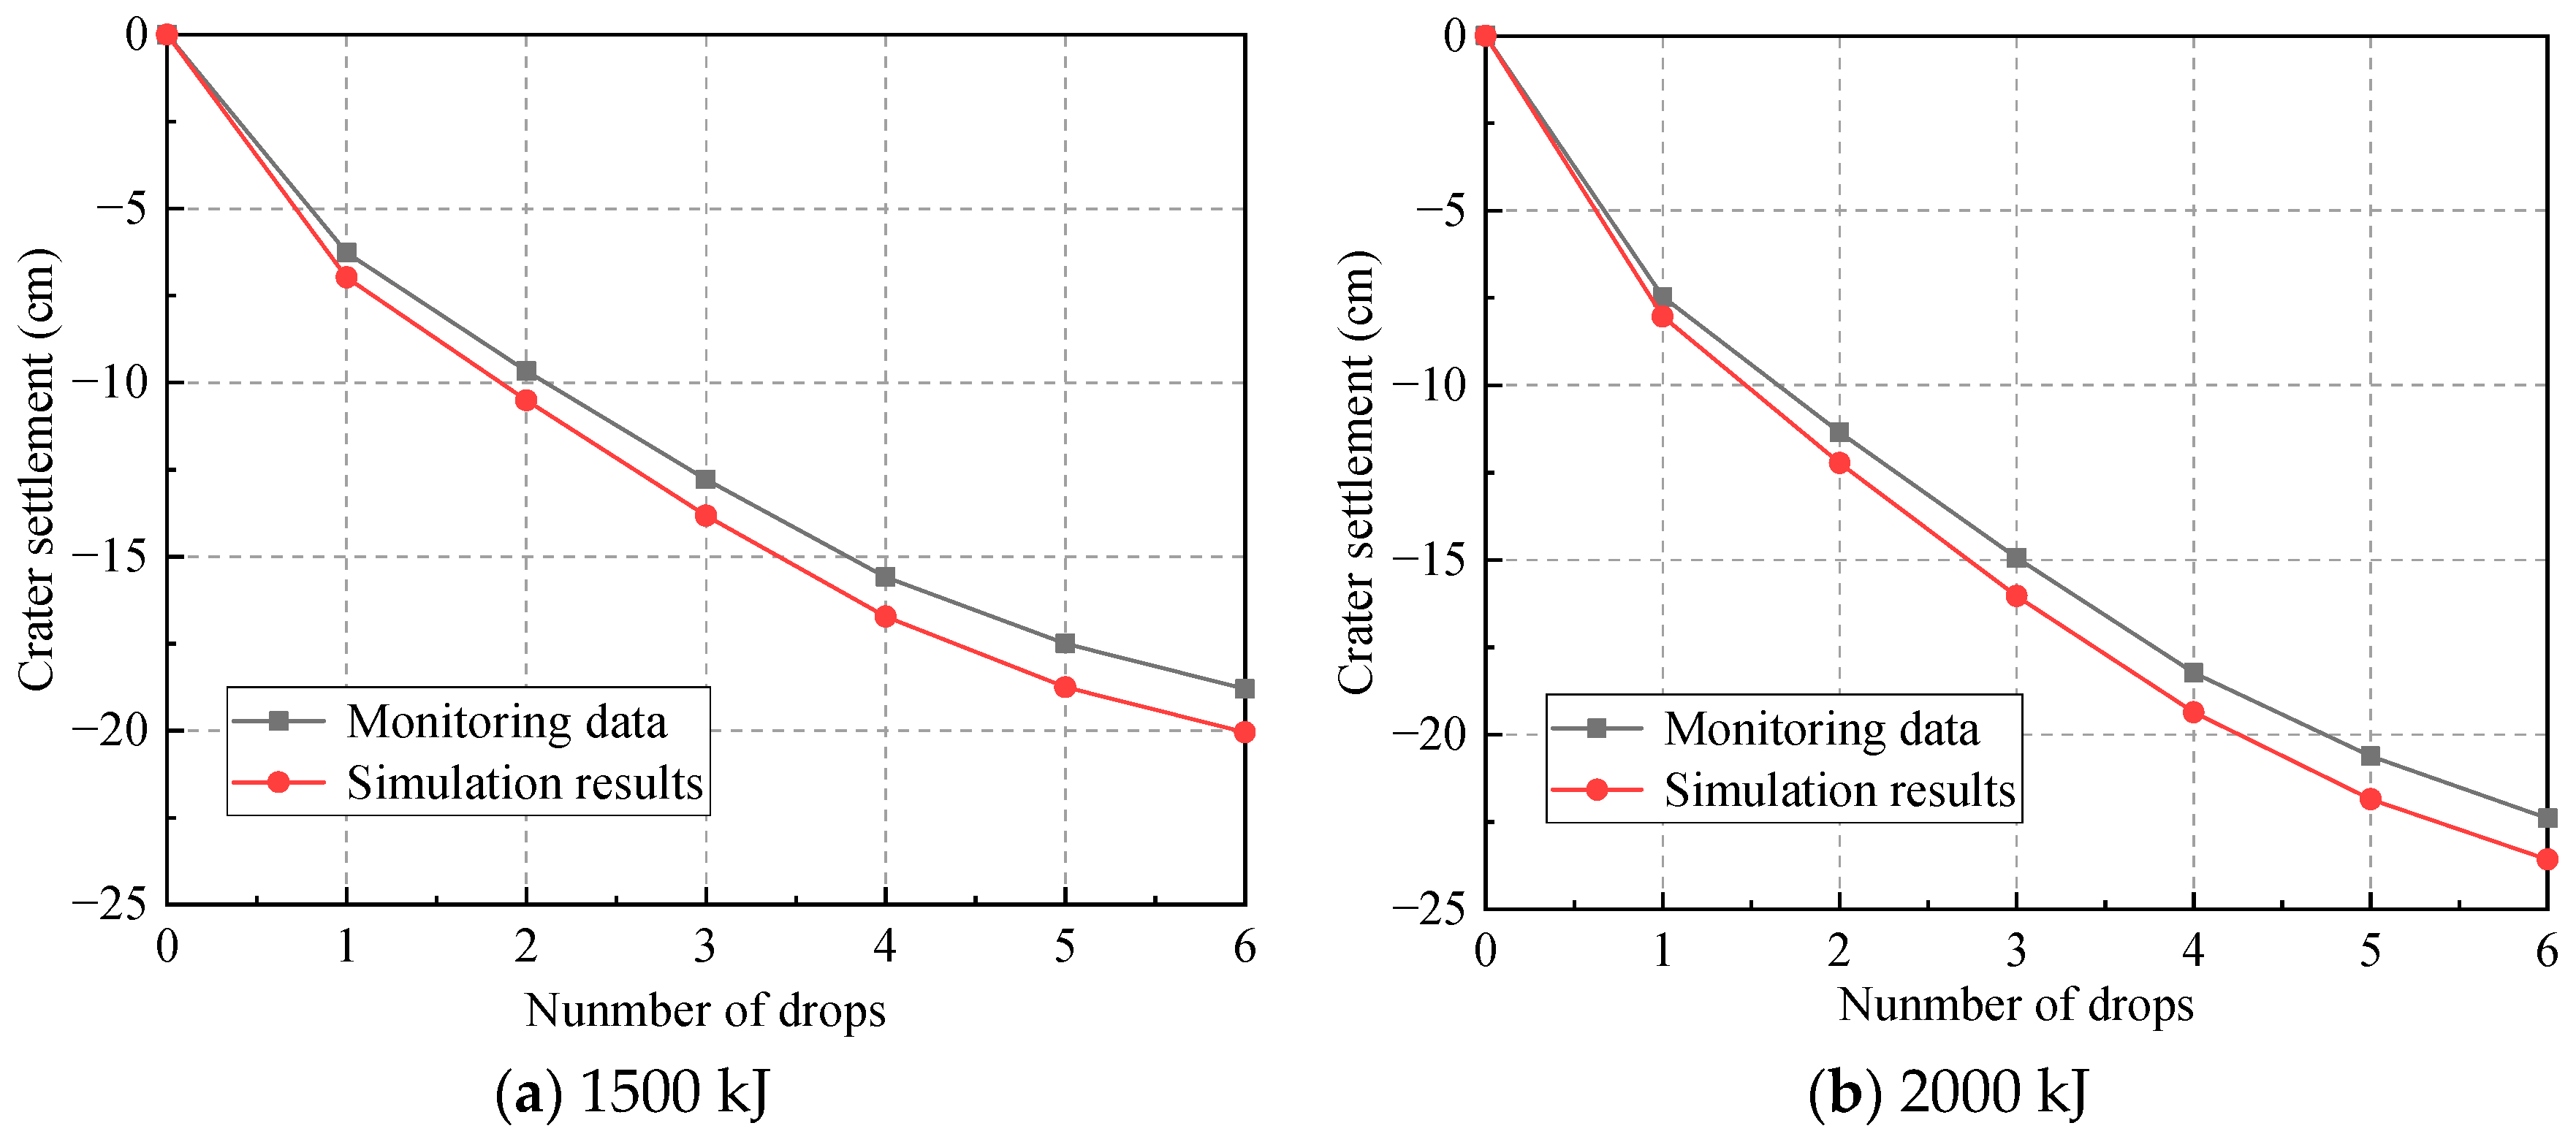
4.1. Numerical Algorithm and Validation

PFC2D is a discrete element code for two-dimensional particle flow that uses a specific computational method. The motions and interactions for particles with the shape of a circle are computed in a large-deformation model, where the mechanical interactions between the particles in contact are considered. The linear contact relationship is defined by the contact stiffness in the tangential and radial directions between circular particles in PFC2D. This study adopted a parallel bonding contact model; that is, a parallel bonding contact was added. The advantage of a parallel bonding contact is that the determination method of particle breakage is simple and it is not necessary to manually select the flexible cluster failure criterion and sub-particle replacement mode. This can be used to characterize the complex and irregular particles to a certain extent and can solve the problem of large deformation [25,26,27]. The parallel bond contact adopted among particle elements is to bond sub-particles into a larger flexible cluster through bonds with a certain tensile strength and shear strength. When the surface spacing is less than 0, the parallel bonding contact is activated. A bonding force is generated between the circular particle elements. There are two forms of bonding force: a tensile stress and a shearing stress. When the maximum tensile stress is greater than the preset parallel bond tensile strength, the bond will have tensile failure; when the maximum shear stress is greater than the preset parallel bond shear strength, the bond will have shear failure. At this time, the bond breaks, and the flexible clusters are broken into a number of smaller sub-particles, forming a number of cracks. Under the continuous action of external force, these cracks will be linked; the macro performance is a certain number of broken zones. The number of cracks is monitored through the built-in FISH language to evaluate the breakage. A particle model of a coral sand foundation was developed according to gravitational deposition in a restricted space by walls. The soil particles were released and suspended in the assigned space, unaffected by gravitational forces, subsequently settling at the bottom of the container upon activation of gravity (with a gravitational acceleration of 9.8 m/s2 as per this study). Figure 9 shows the two-dimensional particle model of the coral sand foundation produced through gravity deposition. The calculation accuracy and calculation rate must be considered when using PFC2D for model test analysis. If the initial gradation is employed directly, the particle number will be large, and the calculation efficiency will be relatively low. Thus, the step-by-step method of equal-mass replacement of the finest particles was used to correct the initial gradation, and the final grain set used for modeling was obtained, as shown in Table 3.
In the PFC2D program, a flexible cluster was used to simulate the coral sand, and a hammer model was formed using clump blocks combined with three ball elements with a 1 m radius. The hammer was set above the centerline of the model, which fell freely under the action of gravity, and its height was controlled to achieve different ramming energies. The hammer was deleted after each tamping was completed, and the model was self-balanced for a period to ensure the rebound time of the foundation. Monitoring points were set up at each depth to monitor the vertical displacement of the soil. Considering the influence of the tamping energy, hammer diameter, and particle size on the impact range and numerical calculation efficiency of DC, the model adopted a wall with a 12 m height and 10 m width to simulate the boundary of the numerical model. With both ball-to-ball and ball-to-wall contacts, the shear and normal stiffness (ks, kn) exhibited identical magnitudes. Table 4 lists the initial value of the microscopic variables used in the numerical calculations.
The numerical simulation of DC using PFC2D at a single point multiple times at 800, 1500, and 2000 kJ tamping energies was carried out to exhibit the development of crater settlement and breakage of coral reef sand. The results of the numerical calculation were contrasted with the data from the field investigation to verify the credibility of the numerical model. The proposed numerical methodology was employed to simulate the initial six drops of the point tamping process during the first pass. The parameters in the numerical simulation were consistent with the field construction parameters. Figure 10 shows the comparative results of the average crater depth of each drop of tamping during the first pass. The crater settlement differences at the last drop for 2000 and 1500 kJ were 2.1 and 1.5 cm, respectively. There was only a slight discrepancy observed between the investigation data and the results of simulation, indicating that the numerical simulation results were credible and highly reliable.

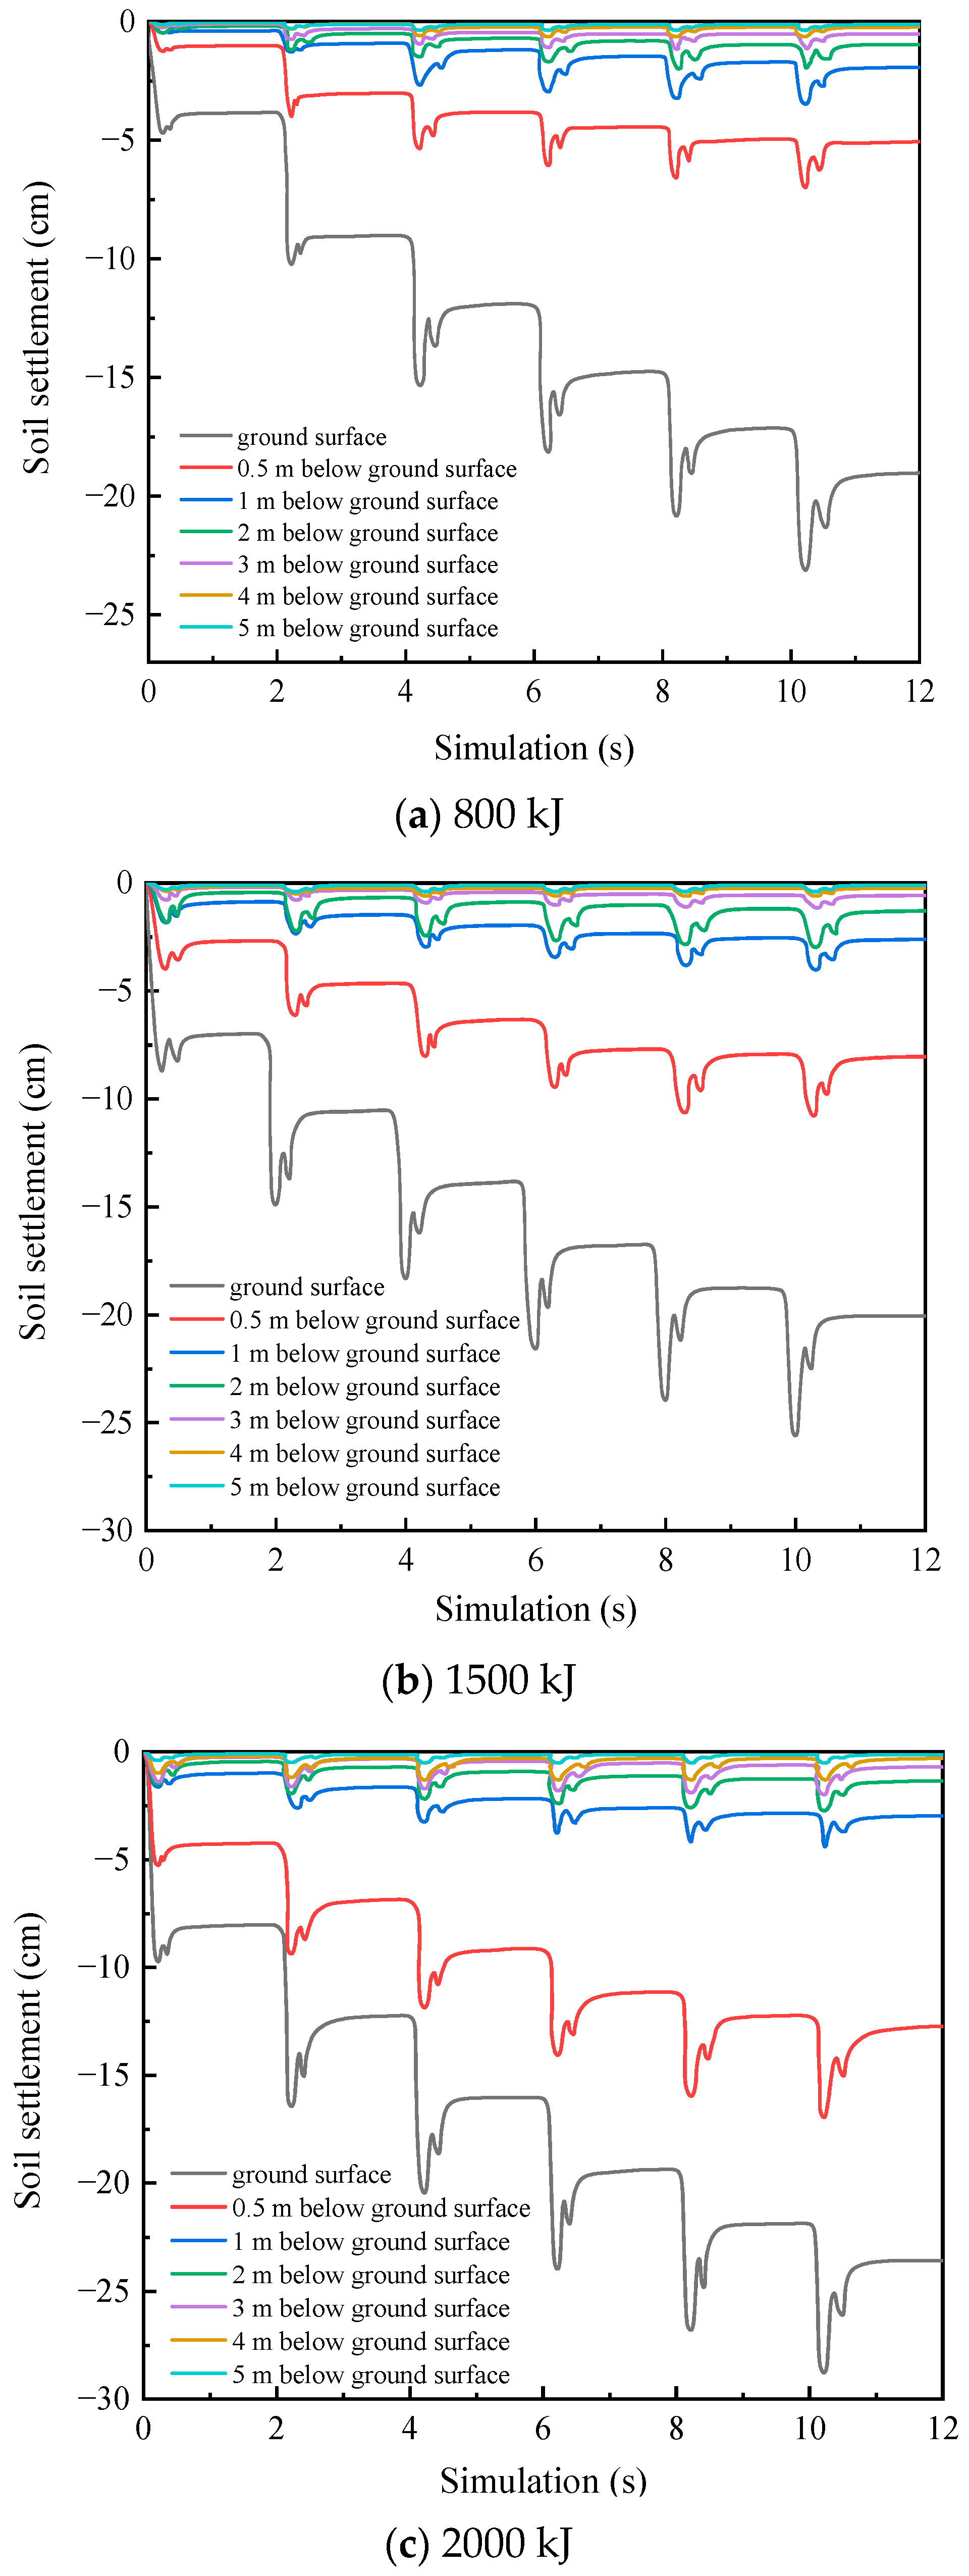
4.2. Numerical Analysis of Crater Settlement

In the numerical model, seven monitoring points were arranged at different depths below the centerline to monitor the crater settlement after six drops of tamping. Figure 11 shows the crater settlement curves for different tamping energies (800, 1500, and 2000 kJ). The deformation curves oscillated significantly under the three input energies and could be divided into three main stages: tamping settlement, resilient deformation, and soil equilibrium. After each drop of tamping, the coral sand foundation experienced resilient deformation, and the compaction of the foundation soil, plastic deformation, and an increase in soil density were all caused by the tamping energy. The first drop of tamping was extraordinary, producing a significantly larger crater depth than the other five drops; however, the individual settlement in the second drop appeared to be larger at a low input energy (800 kJ). This may have been because the coral sand in the first drop of tamping was partially broken when the energy was low (800 kJ), and it developed significant crushability and subsidence in the second tamping. With the increase in the tamping drops, the stiffer the foundation soil, the smaller the subsidence deformation and lager the rebound deformation. This trend became more pronounced as the depth increased.
The vertical deformation response to the tamping energy varied at different depths. The surface subsidence was the largest and gradually decreased until it disappeared as the stress wave generated by the tamping energy propagated along the depth and was constantly attenuated. Furthermore, when the soil was compacted to its maximum possible density under the applied tamping energy, the rigid soil in the reinforced zone did not absorb the tamping energy but rather transmitted it. Moreover, most of the energy was consumed during the damping or shear deformation of the reinforced soil. This implies that additional drops of tamping would no longer produce compaction; thus, no further improvement would be achieved. When the soil depth reached 3 m, the crater settlements at 800, 1500, and 2000 kJ tamping energies were only 0.50, 0.55, and 0.65 cm, respectively. The effective reinforcement depths under the three tamping energies were generally within the range of 3.0 m underground, which is consistent with the SPT data.
Figure 12 shows the displacement vector diagram of the coral sand foundation after tamping at different energies. The coral sand particles splashed around the tamping pit when the tamping energy was large (2000 kJ), and a certain degree of uplift on both sides of the crater was observed. This was because the coral sand on both sides was squeezed by the sand in the central reinforced area, resulting in an uplift caused by shear failure. The higher the tamping energy, the more noticeable the bulge. The displacement below the crater exhibited a radioactive distribution centered on the tamping point. The zone affected by tamping was primarily vertical, and the horizontal extension was subordinate. The settlement immediately below the rammer was the largest. The vertical deformation was smaller at a distance from the tamping center.

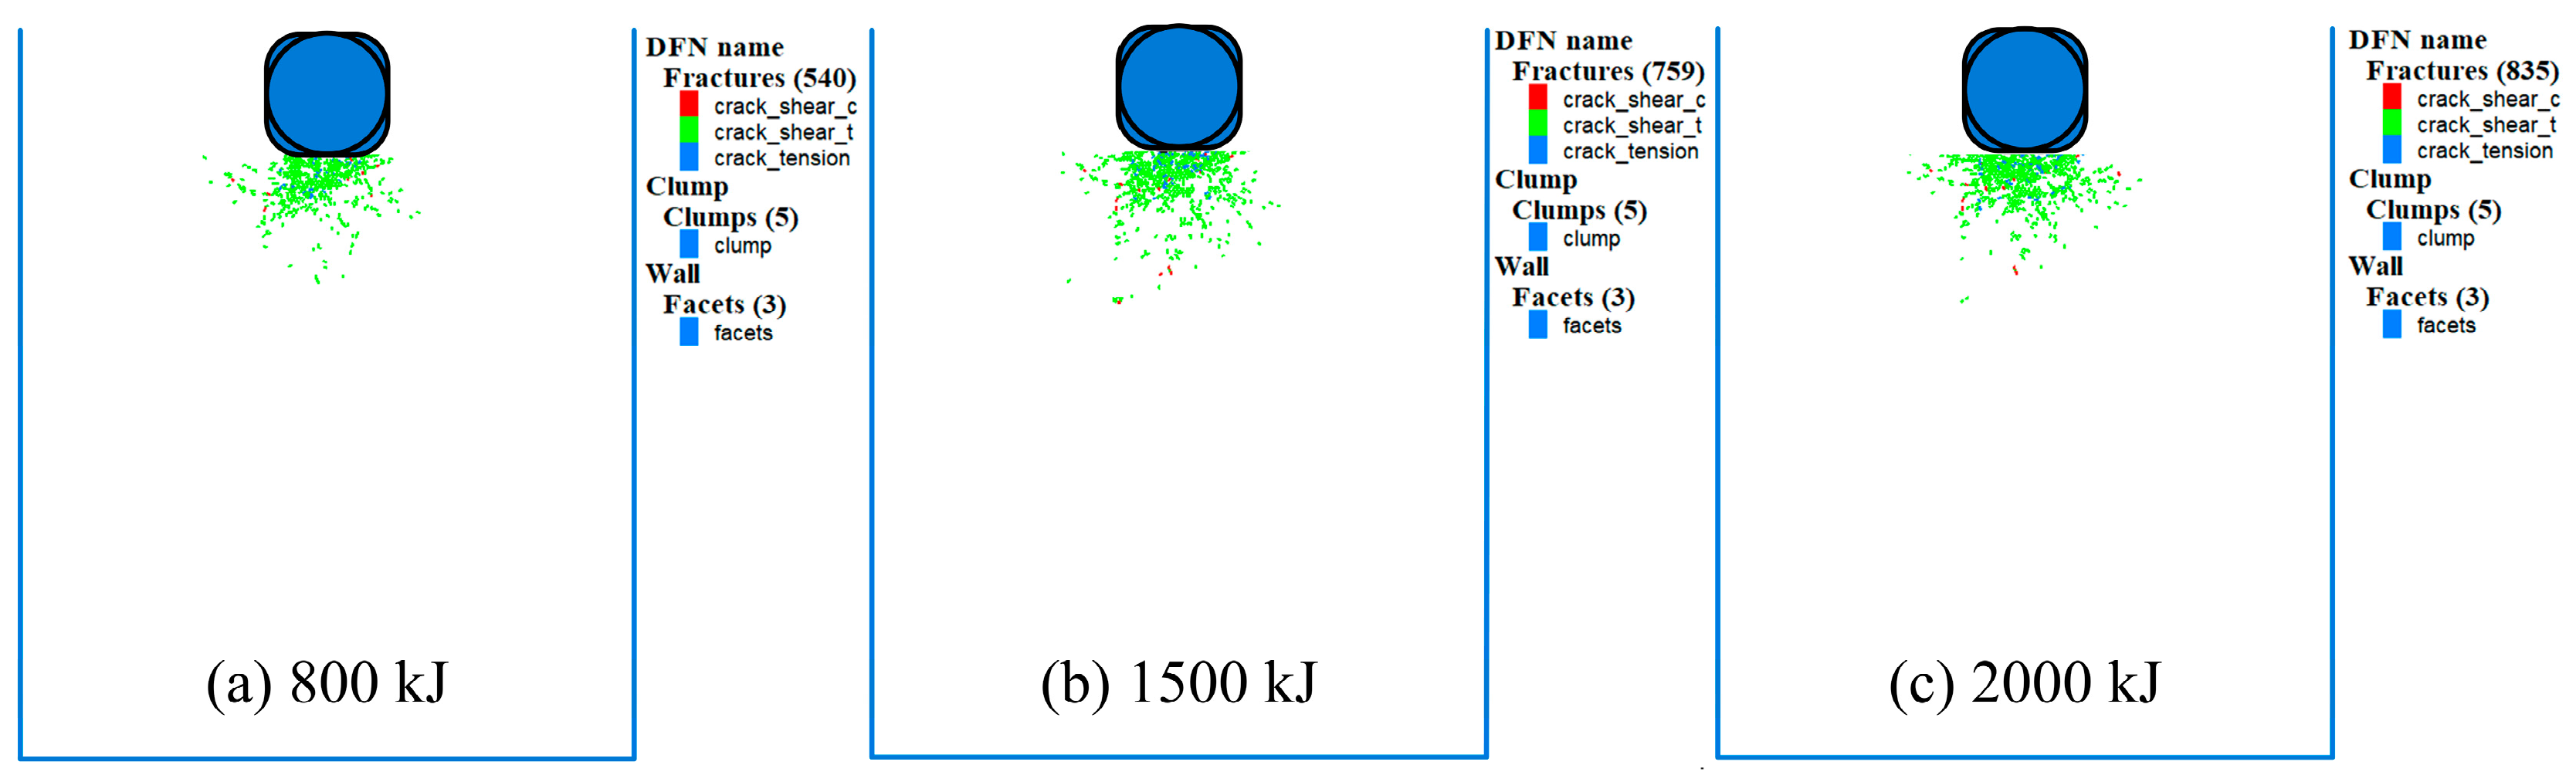
4.3. Numerical Analysis of Particle Breakage

Coral sand, a crushable granular material, produces large amounts of particle breakage at DC power. Therefore, investigating the development and evolution of particle breakage during DC is crucial. The number of cracks is monitored through the built-in FISH language to evaluate the breakage of the CRS. Figure 13 shows a cloud image of the particle breakage distribution under different hammering energies. At the end of tamping, the CRS particles were obviously broken, mainly by shear failure, indicating that the external force on the coral sand particles at this time was much greater than the parallel bond shear strength. With the increase in tamping energy d, the more thoroughly the coral sand was broken, the more cracks were significantly increased; the numbers of cracks under the three tamping energies were 540, 759, and 835, respectively. Under the tamping impact, the particle crushing zone was initially distributed below the ramming point, and it gradually developed toward both sides of the crater as the ramming number increased. The compaction energy also significantly influenced the particle breakage, primarily reflected in the depth and breadth of the coral sand ground. The particle crushing under 2000 kJ compaction was the highest; that is, the number of particles crushed after DC was the largest, with a wider impact range. Based on the coordinate data of the fracture zone, the depth at which the coral sand particles were broken under a 2000 kJ tamping energy was primarily distributed at approximately 3 m at the bottom of the crater.
Particle overlap occurred among the coral sands under impact loading, and contact stress was generated. The numerical results revealed that the force chain development was relatively similar for all three hammering energies. Figure 14 shows that the force chains were tree-shaped and developed toward the ground depth. The thicknesses of the lines represent the contact stress between the particles. The force chains were primarily concentrated immediately below the tamping point, and the amount of vertical force chains started to increase, gradually thickened, and developed toward both sides as the ramming energy increased. This indicates that the dynamic stress squeezed the soil on both sides, forming a strong chain under the tamping crater and a weak force chain on both sides. The impact stress wave primarily propagated vertically along the sand particles, and the vertical dynamic stress was significantly higher than the horizontal dynamic stress. The pores of the soil below the tamping point decreased with closer contact, and vertical compression dominated. The particle contact force chains increased and developed deeply toward the ground with increased tamping energy until the damping of the soil completely expanded the dynamic stress.

5. Conclusions

This study performed a series of field tests combined with the two-dimensional particle flow discrete element method to investigate the whole process of coral sand ground compacted by DC and demonstrated the reinforcement effect. The conclusions obtained are given below:
(1)
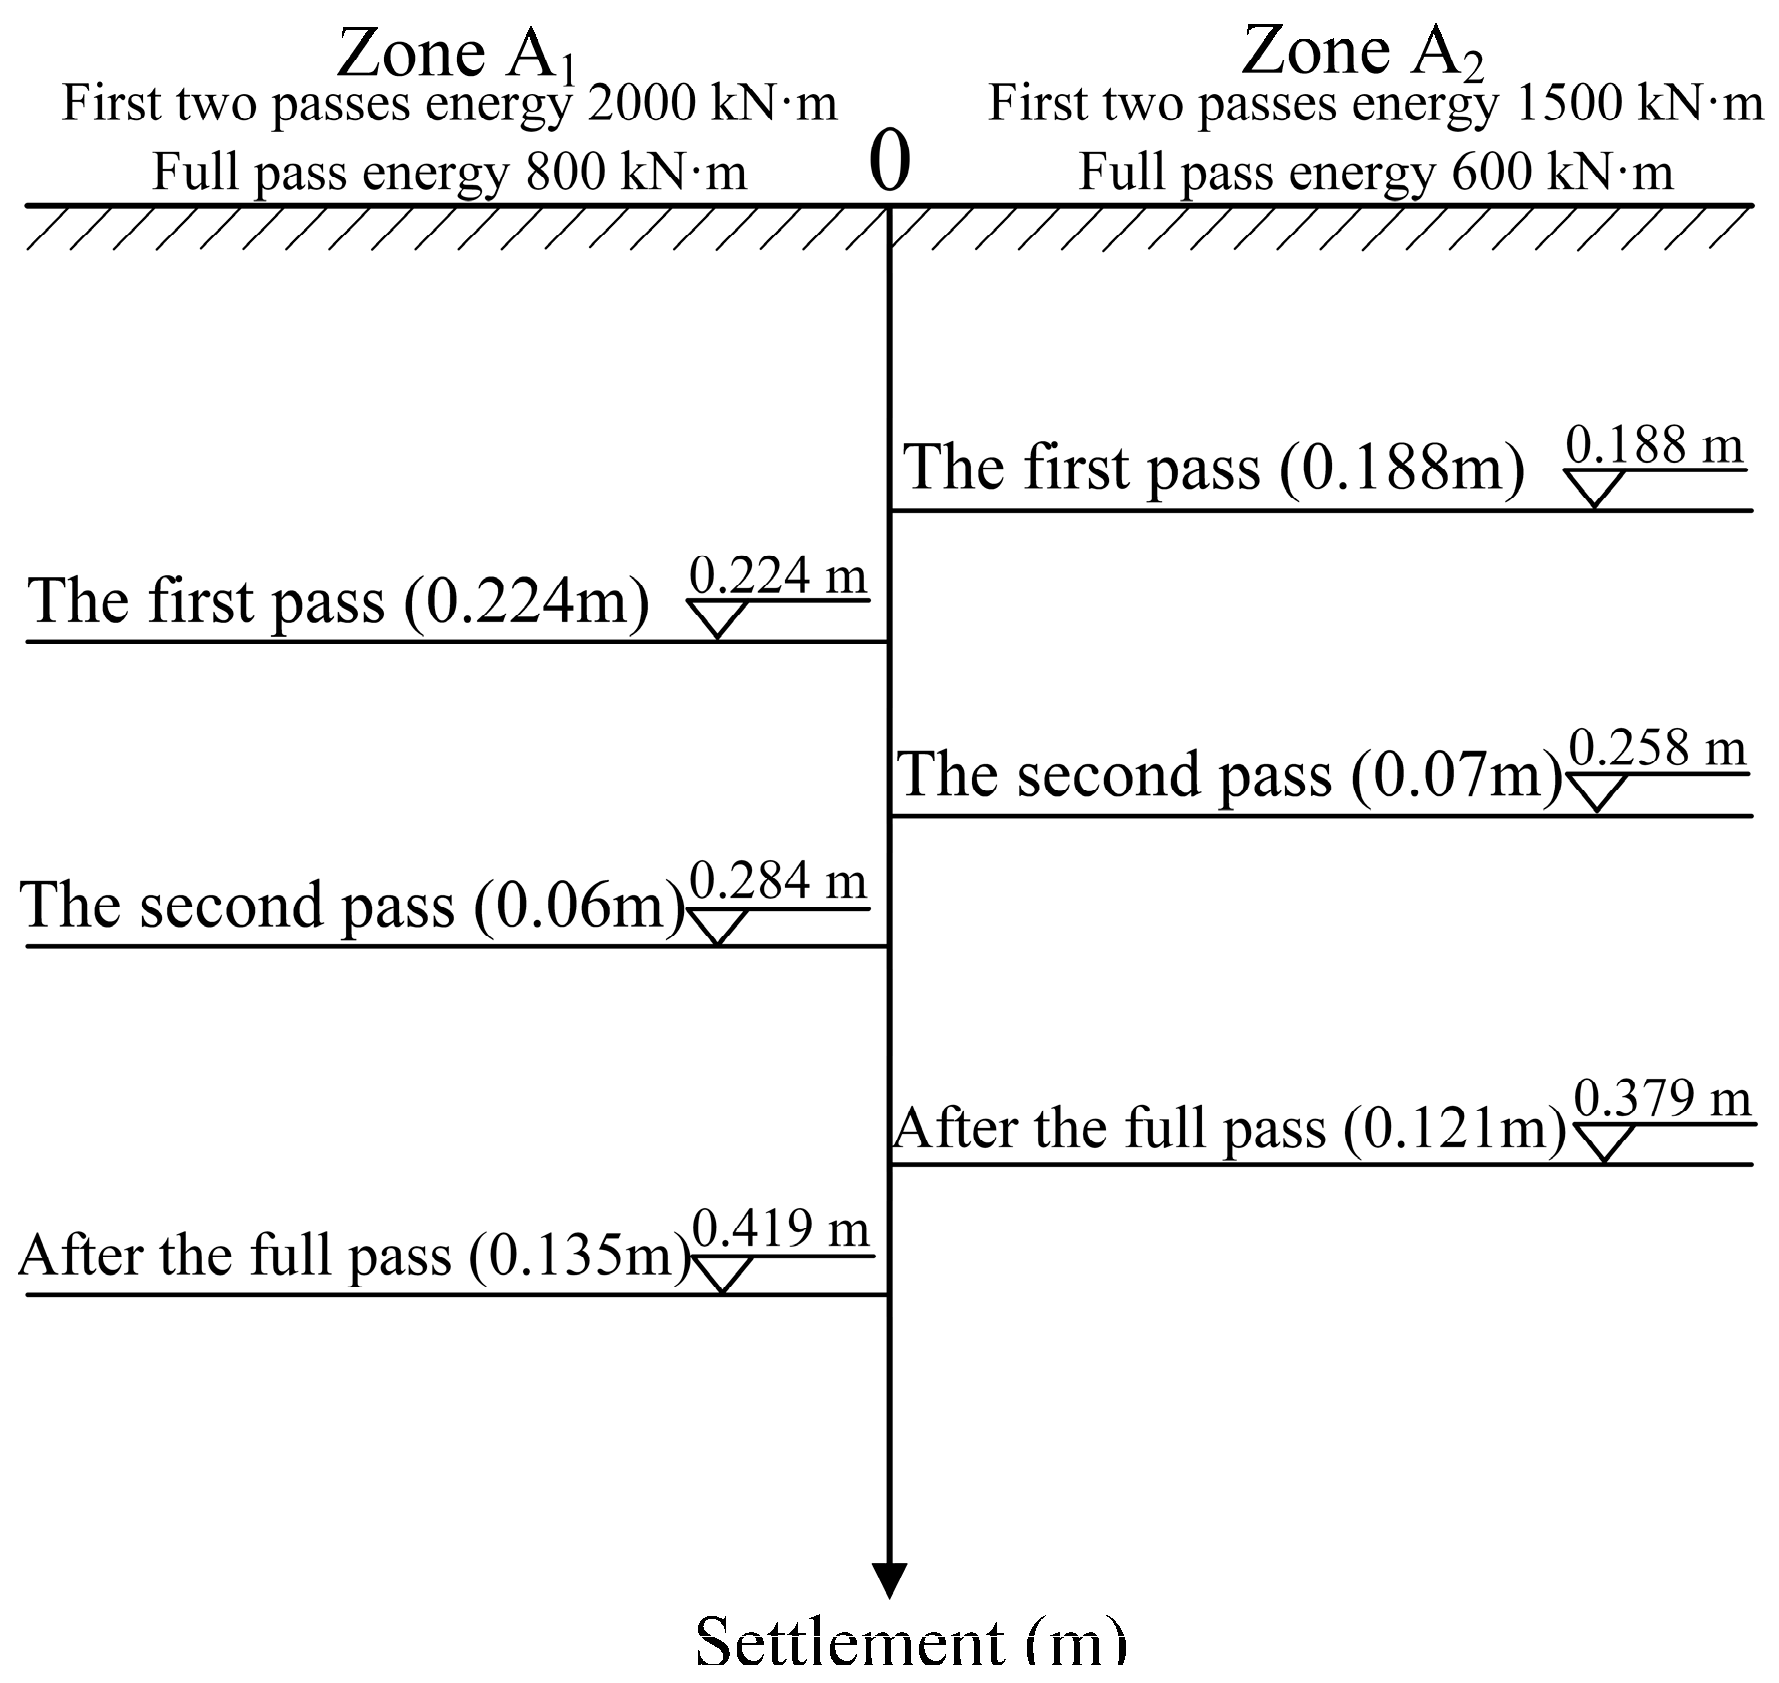
In both reinforced regions (A1 and A2), the first drop in impact during the three passes (first two tamping points and last full tamping) produced the largest crater settlement, and the crater settlement gradually increased. Full tamping was necessary for the final tamping; the coral sand was well strengthened, and the average total settlements for A1 and A2 were 0.379 and 0.419 m, respectively.
(2)
After ground treatment by DC, the allowable ground bearing capacity in both reinforced regions was at least 360 kPa, satisfying the design requirements. The DC method proved to be valid for dealing with reclaimed coral sand.
(3)
The SPT field data indicated that the DC reinforcement depths at A1 and A2 were 3.5 and 3.2 m, respectively. The improvement at the impact points was commonly superior to that in the regions between the impact points in the two testing regions. Appropriate spacing of the impact points was necessary to guarantee a uniform strengthening effect in the construction areas.
(4)
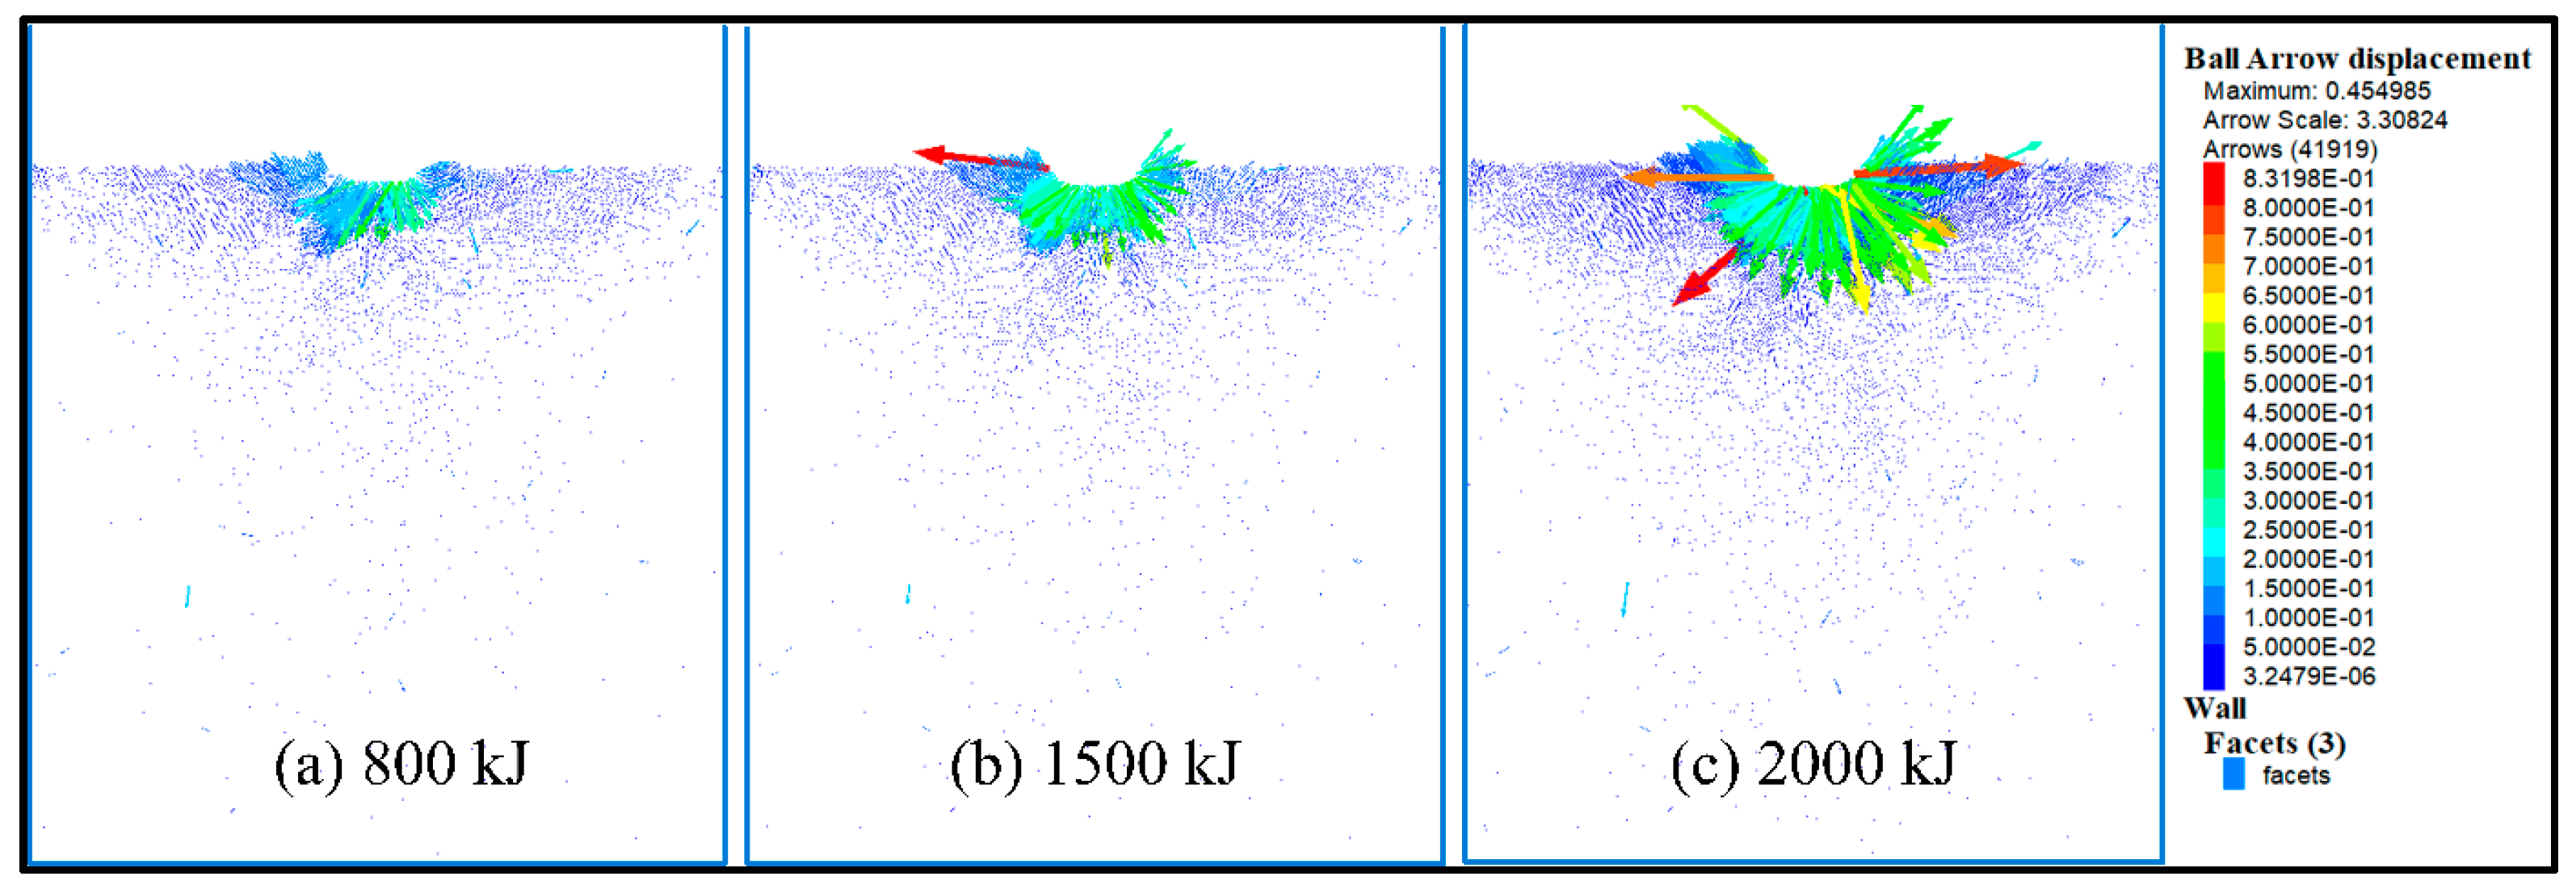
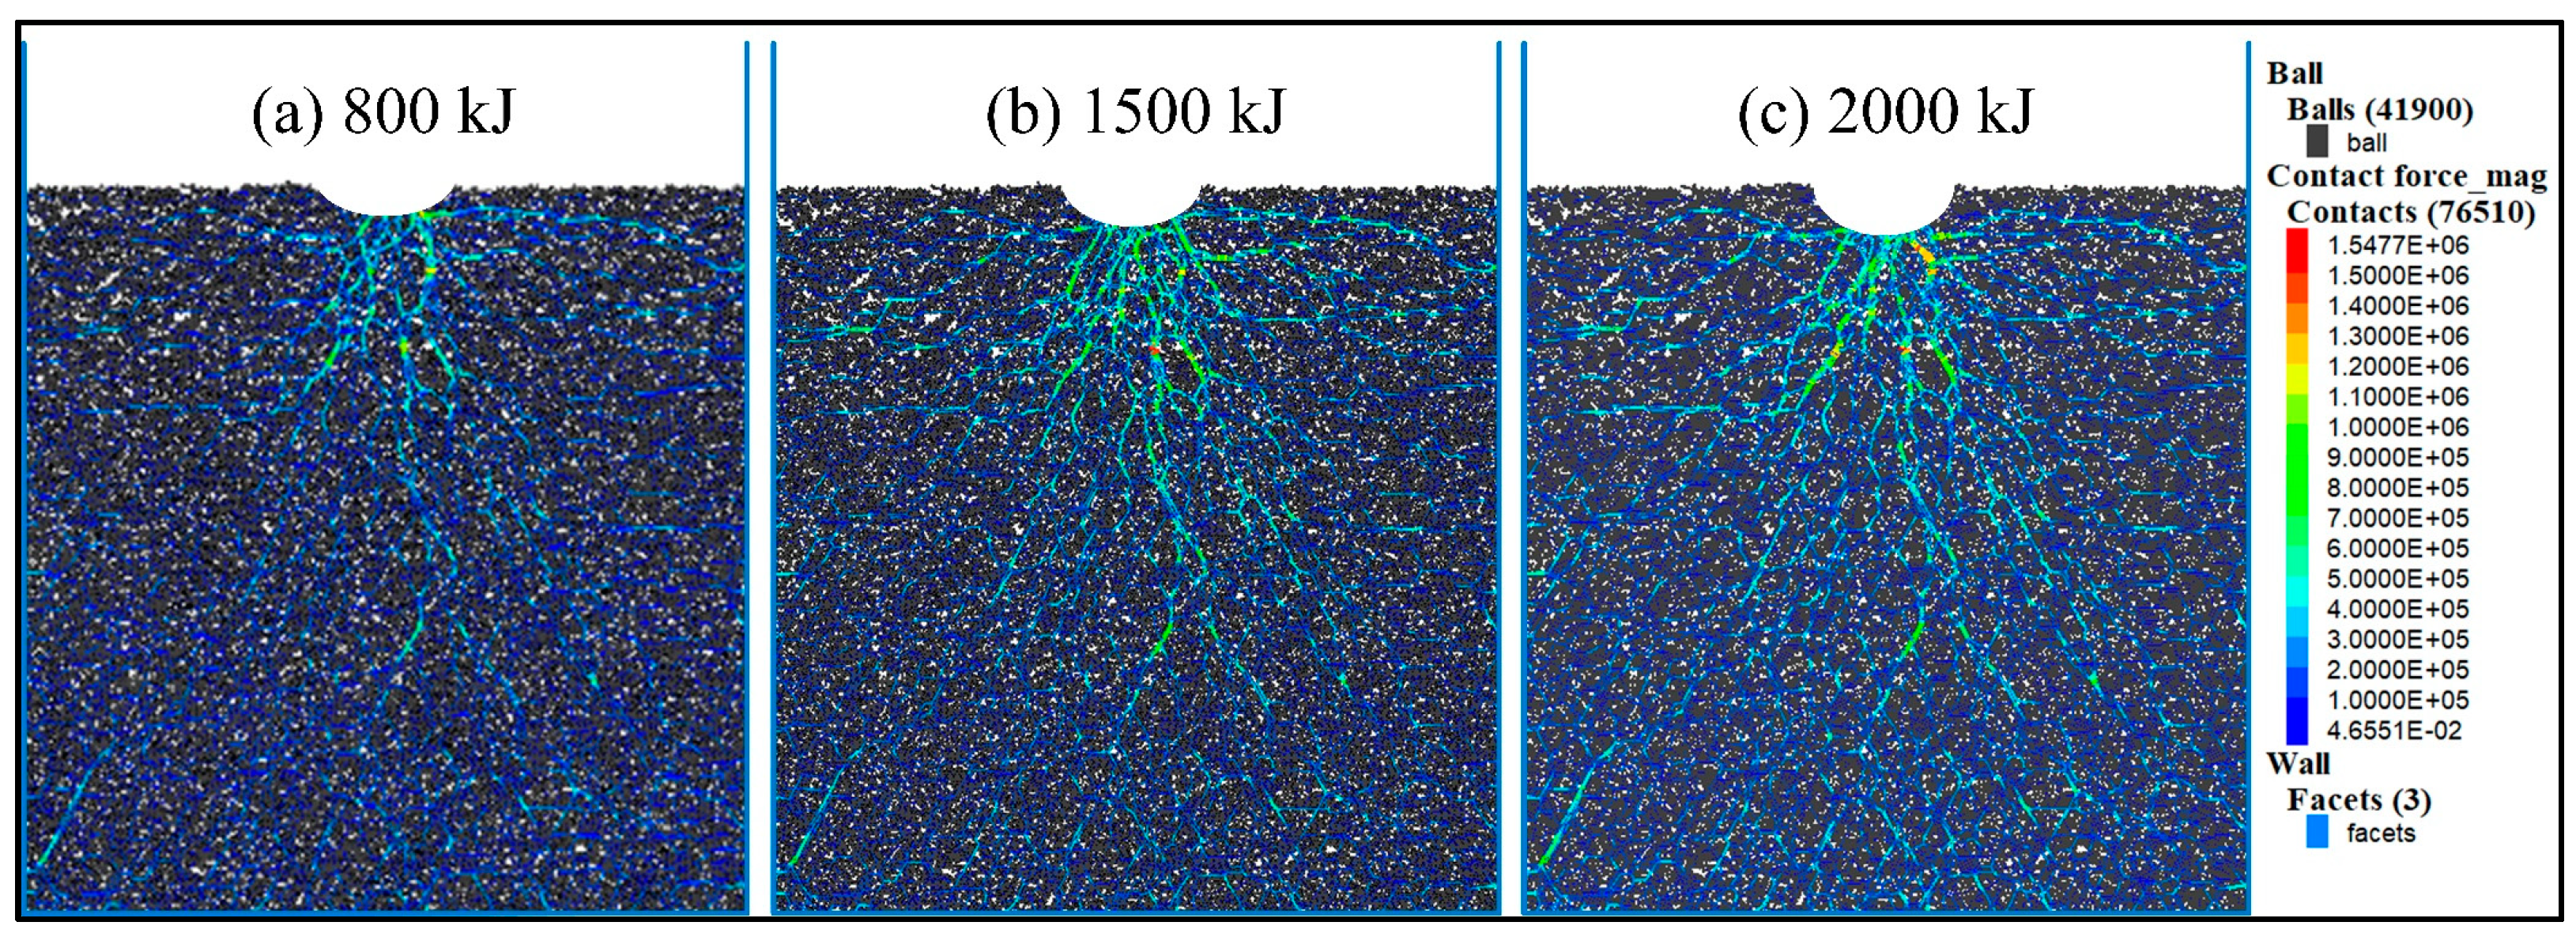
The DC process for coral sand grounds was reproduced using the particle flow discrete element method. The reinforcement effect and effective reinforced depth were numerically analyzed. The numerical results were consistent with the field investigation data. The fragmentation zone of coral sand caused by DC was primarily distributed immediately below the crater and gradually developed on both sides of the crater with increasing compaction time. The particle force chains after tamping were strong chains in the vertical direction of the crater and weak chains on both sides. This indicates that the particles directly below the ramming point were broken more thoroughly, and the contact between the particles was closer. The dynamic stress wave from the DC energy propagated primarily in the vertical direction.
The scientific results of this research serve as a relevant reference for further study on the DC mechanism involving CRS as a foundation for structures.

Author Contributions

Methodology, L.G.; Writing—original draft, L.G. and W.Y.; Writing—review & editing, L.G., W.Y., Z.W., J.W. and G.Y. All authors have read and agreed to the published version of the manuscript.

Funding

This research was funded by [The National Key Research and Development Program] grant number [No. 2023YFC3106502], [The National Natural Science Foundation of China] grant number [No. 42002266] and [The Fundamental Research Funds for the Central Universities] grant number [No. 30924010840]. And The APC was funded by [The Fundamental Research Funds for the Central Universities].

Institutional Review Board Statement

Not applicable.

Informed Consent Statement

This study did not involve humans.

Data Availability Statement

Data are contained within the article.

Acknowledgments

The authors would like to thank the worker who completed the sampling and field test for coral reef sand.

Conflicts of Interest

The authors declare no conflicts of interest.

References

  1. Zhao, H.T. Researched of coral reef in modern China. World SCI-Tech R&D 1998, 4, 98–105. (In Chinese) [Google Scholar]
  2. Mejia, L.; Yeung, R. Liquefaction of coralline soils during the 1993 Guam earthquake. Session on Seismically-Induced Movements of Foundations and Abutments. In Proceedings of the 1995 ASCE National Convention, San Diego, CA, USA, 22–26 October 1995; pp. 33–48. [Google Scholar]
  3. Qiu, W.J.; Yang, H.P.; He, Y.X.; Yu, D.H. Experimental study on coral reef sand as foundation filling material and vibroflotation reinforcement. J. Geotech. Eng. 2017, 39, 1517–1523. (In Chinese) [Google Scholar]
  4. Ohno, S.; Ochiai, H.; Yasufuku, N. Estimation of pile settlement in Calcareous sands. In Engineering for Calcareous Sediments; Al-Shafei, K.A., Ed.; Baklkema: Rotterdam, The Netherlands, 1999; pp. 1–6. [Google Scholar]
  5. Lee, C.Y.; Poulos, H.G. Tests on model instrumented grouted piles in offshore calcareous soil. J. Geotech. Eng. 1991, 117, 1738–1753. [Google Scholar] [CrossRef]
  6. Ismail, M.A.; Joer, H.A.; Sim, W.H.; Randolph, M.F. Effect of cement type on shear behavior of cemented calcareous soil. J. Geotech. Geoenviron. Eng. 2002, 128, 520–529. [Google Scholar] [CrossRef]
  7. Consoli, N.C.; Cruz, R.C.; Floss, M.F.; Festugato, L. Parameters controlling tensile and compressive strength of artificially cemented sand. J. Geotech. Geoenviron. Eng. 2010, 136, 759–763. [Google Scholar] [CrossRef]
  8. Xiao, Y.; Stuedlein, A.W.; Chen, Q.; Liu, H.L.; Liu, P. Stress-strain strength response and ductility of gravels improved by polyurethane foam adhesive. J. Geotech. Geoenviron. Eng. 2018, 144, 04017108. [Google Scholar] [CrossRef]
  9. Liu, L.; Liu, H.L.; Stuedlein, A.W.; Evans, T.M.; Xiao, Y. Strength, stiffness, and microstructure characteristics of biocemented calcareous sand. Can. Geotech. J. 2019, 56, 1502–1513. [Google Scholar] [CrossRef]
  10. DeJong, J.T.; Soga, K.; Kavazanjian, E.; Burns, S.; van Paassen, L.A.; Al Qabany, A.; Aydilek, A.; Bang, S.S.; Burbank, M.; Caslake, L.; et al. Biogeochemical processes and geotechnical applications: Progress, opportunities and challenges. Géotechnique 2013, 63, 287–301. [Google Scholar] [CrossRef]
  11. Montoya, B.M.; DeJong, J.T.; Boulanger, R.W. Dynamic response of liquefiable sand improved by microbial-induced calcite precipitation. Géotechnique 2013, 63, 302–312. [Google Scholar] [CrossRef]
  12. Van Paassen, L.A.; Ghose, R.; van der Linden, T.J.M.; van der Star, W.R.L.; van Loosdrecht, M.C.M. Quantifying biomediated ground improvement by ureolysis: Large-scale biogrout experiment. J. Geotech. Geoenviron. Eng. 2010, 136, 1721–1728. [Google Scholar] [CrossRef]
  13. Feng, S.J.; Du, F.L.; Shi, Z.M.; Shui, W.H.; Tan, K. Field study on the reinforcement of collapsible loess using dynamic compaction. Eng. Geol. 2015, 185, 105–115. [Google Scholar] [CrossRef]
  14. Zhou, C.; Yang, C.; Qi, H.; Yao, K.; Yao, Z.; Wang, K.; Ji, P.; Li, H. Evaluation on improvement zone of foundation after dynamic compaction. Appl. Sci. 2021, 11, 2156. [Google Scholar] [CrossRef]
  15. Hu, B.; Wang, R.; Hu, M.J.; Wang, X.Z. Experimental study on dynamic compaction treatment of hydraulic reclamation sand foundation. Rock Soil Mech. 2007, 28, 89–92. (In Chinese) [Google Scholar]
  16. Zhou, J.; Cui, J.H.; Jia, M.C.; Shi, D.D. Experimental study on soft foundation treatment with hydraulic fill fine sand. Rock Soil Mech. 2008, 04, 859–864. (In Chinese) [Google Scholar]
  17. Feng, S.J.; Tan, K.; Shui, W.H.; Zhang, Y. Densification of desert sands by high energy dynamic compaction. Eng. Geol. 2013, 157, 48–54. [Google Scholar] [CrossRef]
  18. Nashed, R.; Thevanayagam, S.; Martin, G.R. Dynamic compaction of saturated sands and silty sands: Results. Ground Improv. 2009, 162, 69–79. [Google Scholar] [CrossRef]
  19. Cundall, P.A.; Strack, O.D.L. A discrete numerical model for granular assemblies. Géotechnique 1979, 29, 47–65. [Google Scholar] [CrossRef]
  20. Wada, K.; Senshu, H.; Matsui, T. Numerical simulation of impact cratering on granular material. Icarus 2006, 180, 528–545. [Google Scholar] [CrossRef]
  21. Ma, Z.Y.; Dang, F.N.; Liao, H.J. Numerical study of the dynamic compaction of gravel soil ground using the discrete element method. Granul. Matter 2014, 16, 881–889. [Google Scholar] [CrossRef]
  22. Jia, M.; Yang, Y.; Liu, B.; Wu, S.J. PFC/FLAC coupled simulation of dynamic compaction in granular soils. Granul. Matter 2018, 20, 76. [Google Scholar] [CrossRef]
  23. National Standard GB 50021-2001; Code for Geotechnical Engineering Investigation. Ministry of Housing and Urban-Rural Development of the People’s Republic of China: Beijing, China, 2001. (In Chinese)
  24. National Standard GB 50007-2011; Code for Design of Building Foundation. Ministry of Housing and Urban-Rural Development of the People’s Republic of China: Beijing, China, 2011. (In Chinese)
  25. Li, G.; Bodahi, F.; He, T.; Luo, F.; Duan, S.; Li, M. Sensitivity analysis of macroscopic mechanical behavior to microscopic parameters based on PFC simulation. Geotech. Geol. Eng. 2022, 40, 3633–3641. [Google Scholar] [CrossRef]
  26. Wu, H.; Dai, B.; Zhao, G.; Chen, Y.; Tian, Y. A novel method of calibrating micro-scale parameters of PFC model and experimental validation. Appl. Sci. 2020, 10, 3221. [Google Scholar] [CrossRef]
  27. Liu, X.Y. Macroscopic and Microscopic Study on Mechanical Properties and Fracture Mechanism of Volcanic Soil. Master’s Thesis, Jilin University, Changchun, China, 2024. (In Chinese). [Google Scholar]
Figure 1. Field site coral reef sand under dynamic compaction.
Jmse 12 01479 g001
Figure 2. Grain size distribution in the two test zones.
Jmse 12 01479 g002
Figure 3. Layout of impact points and investigation points in two test zones.
Jmse 12 01479 g003
Figure 4. DC site photos.
Jmse 12 01479 g004
Figure 5. Average settlement of the two tamping zones in different passes.
Jmse 12 01479 g005
Figure 6. Shallow plate-load test at the field sites.
Jmse 12 01479 g006
Figure 7. Load-settlement curves for shallow plate-load test at the field sites.
Jmse 12 01479 g007
Figure 8. Variation in SPT blows against depth at the field sites before and after DC.
Jmse 12 01479 g008
Figure 9. Two-dimensional particle model of coral sand foundation.
Jmse 12 01479 g009
Figure 10. Comparison between numerical results and field data.
Jmse 12 01479 g010
Figure 11. Settlement curves of three tamping energies.
Jmse 12 01479 g011
Figure 12. Displacement vector of coral foundation after tamping under different energy levels.
Jmse 12 01479 g012
Figure 13. Development of particle breakage after tamping under different energy levels.
Jmse 12 01479 g013
Figure 14. Cloud chart of force chain after tamping under different working conditions.
Jmse 12 01479 g014
Table 1. Impact energy levels in two test zones.
Passes of TampingImpact Energy Level (kN·m)Tamping Times
A1A2A1A2
First pass2000150066
Second pass2000150066
Third pass80060022
Table 2. Test results from shallow plate-load tests.
Test ZoneTest SiteUltimate Load Method
Maximum Load (kPa)Maximum Settlement (mm)Maximum Resilience
Value
(mm)
Resilience RateCharacteristic Value of Bearing Capacity
(kPa)
A1P172015.863.8624.34%>360
P272012.453.0424.42%>360
P372019.033.216.82%>360
A2P472014.92.214.77%>360
P572013.152.8421.60%>360
P672013.392.7620.61%>360
Table 3. Grain set used in the numerical simulation.
Grain Size (mm)≥6040~6020~4010~205~101~50.5~1.00~0.5
Content (%)3.953.416.75.935.0724.9927.9322.02
Table 4. Initial microscopic parameters of coral sand.
Density/ρ (kg/m3)2730
Maximum porosity ratio/emax1.84
Minimum porosity ratio/emin0.88
Elongation index/EI0.2–0.8
Effective modulus/E* (kPa)7.5 × 10⁶
Stiffness ratio/k*15
Frictional coefficient/μ0.65
Normal   stiffness   of   parallel   bond / k n ¯  (kN·m−3)8 × 10⁵
Tan gential   stiffness   of   parallel   bond / k s ¯  (kN·m−3)2 × 10⁵
Parallel   bond   tensile   strength / σ c ¯  (kPa)5 × 10³
Parallel   bond   cohesion / c ¯  (kPa)1 × 10³
Internal   friction   angle   of   parallel   bonding / ϕ ¯  (°)32
Disclaimer/Publisher’s Note: The statements, opinions and data contained in all publications are solely those of the individual author(s) and contributor(s) and not of MDPI and/or the editor(s). MDPI and/or the editor(s) disclaim responsibility for any injury to people or property resulting from any ideas, methods, instructions or products referred to in the content.

