Article

Impact Analysis of Welding Sequence to Reduce Weld Deformation in Aluminum Hulls

1
Purpose Built Mobility Group, Korea Institute of Industrial Technology, Gwangju 61012, Republic of Korea
2
Department of Metallurgical Engineering, Jeonbuk National University, Baekje-daero, Jeonju-si 54896, Republic of Korea
*
Author to whom correspondence should be addressed.
J. Mar. Sci. Eng. 2024, 12(9), 1604; https://doi.org/10.3390/jmse12091604
Submission received: 12 August 2024 / Revised: 27 August 2024 / Accepted: 3 September 2024 / Published: 10 September 2024
(This article belongs to the Section Ocean Engineering)

Abstract

:
Aluminum hulls, which are preferred in the marine industry due to their durability, corrosion resistance, and lightweight properties, face serious challenges due to thermal deformation during welding. This study aims to predict and minimize transverse deformations due to welding sequences for a transverse model in the lower part of an aluminum hull. To predict deformations, heat source dimensions obtained from actual weld beads were used as simulation conditions, and various welding sequence conditions were simulated through the developed finite element method (FEM). The simulation results were compared with actual deformation measurements to verify their reliability, and the optimal welding sequence which minimized deformation was derived. The simulation results show that by changing the welding sequence conditions, the maximum displacement can be reduced from a maximum of 52.1% to a minimum of 39.1%, and the effective plastic strain can be reduced from a maximum of 19.6% to a minimum of 4.8%. These results show that adjusting the welding sequence conditions can significantly improve structural integrity by minimizing deformation. The results of this study suggest that the control of the welding sequence can be used to reduce the deformation of aluminum hulls and promote a more sustainable marine industry with improved quality.

1. Introduction

Aluminum hulls have attracted much attention in the marine industry due to their excellent durability and corrosion resistance, light weight, and high-speed performance. While aluminum hulls have many advantages over steel as an eco-friendly and recyclable shipbuilding material, they also have many disadvantages and challenges in terms of buckling and deformation [1,2,3,4,5]. The inherent weakness of aluminum material to heat makes it susceptible to thermal deformation, which can compromise the quality of the hull [6,7]. Welding, which is essential to the fabrication of hull structures, causes localized, uneven temperature distribution within the material. The localized temperature gradient caused by repeated heating and cooling transients due to welding causes rapid thermal expansion and contraction in the weld and the surrounding heat-affected zone, resulting in deformation [8,9,10,11,12]. The heat applied during welding can cause distortion, lead to defects within the hull, and degrade structural quality, and thus predicting and managing thermal deformation in hull manufacturing is a critical step in ensuring the reliability and performance of aluminum hulls [13,14,15,16,17,18,19,20]. Welding deformation is determined by many factors, including the properties of the material, the design of the weld, and the welding process conditions, and under the process conditions, the welding sequence and equipment will affect the welding deformation [21,22]. For the welding deformation problem, selecting a reasonable welding sequence can improve production efficiency, and simulation technology can quickly analyze the relationship between a welding deformation and a welding sequence [23,24]. By analyzing the deformation tendency of different welding sequences through simulation, conditions can be derived to control and minimize deformations generated during welding.
As a an example of prior research on predicting the results of welds with different welding sequences through simulation, Fei Xu et al. [25] studied the effects of the welding sequence, welding speed, and curvature of a curved beam on the residual stresses and deformations induced by welding I-section beams using a simulation model, Navid Moslemi et al. [26] studied the effect of the welding sequence on residual stresses and radial distortion induced in the welding of AISI 316L stainless steel pipe using the FE model. Sun et al. [27] showed that in arc welding of thin plates, the welding sequence can prevent buckling deformation, and the transverse bending induced by a non-uniform temperature distribution along the thickness direction of a thin plate cannot be eliminated. Wang et al. [28] investigated the influence of the welding sequence on the residual stress distribution and deformation of Q345 steel H-section butt-welded joints based on simulations and experiments. The results of the study show that the welding sequence has a relatively small effect on the residual stress distribution in the flanges of H-shaped section joints, and it has a significant effect on the web. Thus, from the perspective of controlling a weld’s residual stress, it was found that when fabricating H-shaped section butt-welded joints, welding the web first is advantageous from the perspective of minimizing deformation. Gao et al. [29] studied the variations in residual stress with welding sequences by simulation the internal welding process of L415/316 L bimetal composite pipe with the aim of improving safety. Based on the research results, we analyzed how to determine the optimal welding sequence.
In various industries, many studies have been conducted to predict the results of welds according to the welding sequence conditions for the material and geometry of each product. Furthermore, many studies have been conducted to derive the optimal welding sequence. Cheng Li et al. [30] used the inherent strain method for double-layer shell parts to estimate the weld deformation. The simulation method showed that 13.6% of the welding deformation could be reduced by optimizing the welding sequence. Jang et al. [31] analyzed the influence of the welding sequence on the overlay weld deformation of pipe panels with simulations to minimize the overlay weld deformation. The validity of the study was verified by comparing the derived optimal welding sequence with the existing welding sequence. Su et al. [10] investigated the effects of the welding sequence, number of welds, and weld length on weld deformation and studied an optimization scheme to control the weld deformation. Based on the research results, they optimized the welding sequence for large cross-joint structures made of Invar steel.
In the context of shipbuilding and offshore industry, Woo et al. [32] introduced an efficient method for systematically determining the optimal welding sequence for the lowest deformation of ship side panels. Numerical simulations using the FEM based on the intrinsic strain, interface elements, and multipoint constraint functions validated the proposed systematic method for efficiently determining the optimal welding sequence and minimizing weld displacement. Although a number of studies have been conducted to analyze the influence of the welding sequence on weld deformation, there is a lack of research on deriving the tendency of weld deformation as a function of the welding sequence conditions for aluminum hulls by using welding heat sources obtained from actual welded beads as simulation conditions. It is essential to conduct relevant research to ensure the reliability and performance of thermally sensitive aluminum hulls.
This study focuses on predicting the tendency of weld deformations as a function of the welding sequence for transverse models actually used in aluminum hulls. The specific research objectives are to verify the predictability of weld deformations in the transverse model of an aluminum hull bottom and to explore whether deformation can be effectively minimized through control of the welding sequence. First, an FEM-based deformation prediction model is developed using simulation parameters derived from the heat source dimensions and geometries obtained from actual weld beads, and the deformation tendency of the structure under different welding sequence conditions is predicted and analyzed using the developed model for a transverse model actually used for the bottom of an aluminum hull. To verify that the simulation parameter conditions can be used reliably, the developed FEM-based deformation prediction model is compared with the actual welding experiment results. The results for the maximum displacement and effective plastic strain are obtained to determine the deformation tendency of the transverse welds in the lower part of an aluminum hull, depending on the welding sequence. The optimal welding sequence conditions which result in the minimum deformation of the entire structure are derived. Finally, the amount of welding deformation which can be reduced by changing the welding sequence conditions is quantitatively presented by establishing welding conditions and reducing deformation through this simulation-based deformation prediction method. We hope to improve the quality of aluminum hulls and contribute to the development of a more sustainable marine industry.

2. Experiment and Simulation Conditions

2.1. Materials

For the welding experiment and simulation, Al5083 base metal (DH Materials, B209 5083) and wire made of Al5183 (KISWEL, M-1583) as filler metal were used, which are used in real aluminum hulls. In the welding experiments, which were conducted to ensure the reliability of the simulation conditions before the simulation was performed, fillet welds were performed on Al5083 specimens with dimensions of 100 mm × 500 mm × 6 mm (t) with a 5 mm-thick Al5083 specimen vertically butted against them. The chemical composition of the used Al5183 material is shown in Table 1, and the chemical composition of the Al5083 material used as the base metal is shown in Table 2.

2.2. Welding Experiment Method

Considering the characteristic of aluminum material being weak to heat, we used the cold metal transfer (CMT) method to minimize deformation by reducing the amount of input heat for the fillet-shaped gas metal arc welding (GMAW) experiment. A CMT welding machine (Fronius (Austria), Advanced 4000 R) was attached to a 6 axis articulated robot (Yaskawa (Japan), MH6) to maintain constant welding conditions with the CMT method. Prior to welding, the surface of the Al5083 base metal was polished to remove the oxide film covering it. The strain caused by welding was measured by a digital vernier caliper (Insize (Japan), 1147–150) to determine the change in position before and after welding, and the difference between the two measured lengths was used as the deformation. After measuring the deformation, a high-speed cutting machine (AlliedAllied (CA, USA), Techcut5) was used to cut the surface perpendicular to the direction of welding progress, and etching was performed for 10 s at a water-to-hydrofluoric acid ratio of 100:3. The etched fillet welds were measured using a digital optical microscope (Leetech (Republic of Korea), portable welding microscope) with a resolution of 2 mega pixels. Table 3 shows the process parameters used in the fillet welding experiments.

2.3. Deformation Measurement

Simulations were performed using Simufact welding (MSC Software Corporation (v2021.1.0163955252, CA, USA), Marc solver) to predict the deformation due to the welding sequence, and MSC Apex (MSC Software Corporation (2023.1, CA, USA), Apex) was used for mesh modeling. For accurate simulation, a hexa-shaped mesh was used for modeling the uniform structure with left-right symmetry. A dense mesh was used for the critical welding zone. The mesh size gradually increased as it moved away from the weld. To model changes in the material properties due to welding heat treatment, we used JMatPro (Sente Software (7.0.0, England), JMatPro), a thermodynamics-based property calculation program, to derive changes in the material properties according to temperature changes. The analysis conditions through the FEM compared the deformation tendency according to the welding sequence, and detailed analysis conditions are shown in Section 4.2: Welding Sequence Conditions.

3. FEM Simulation Conditions

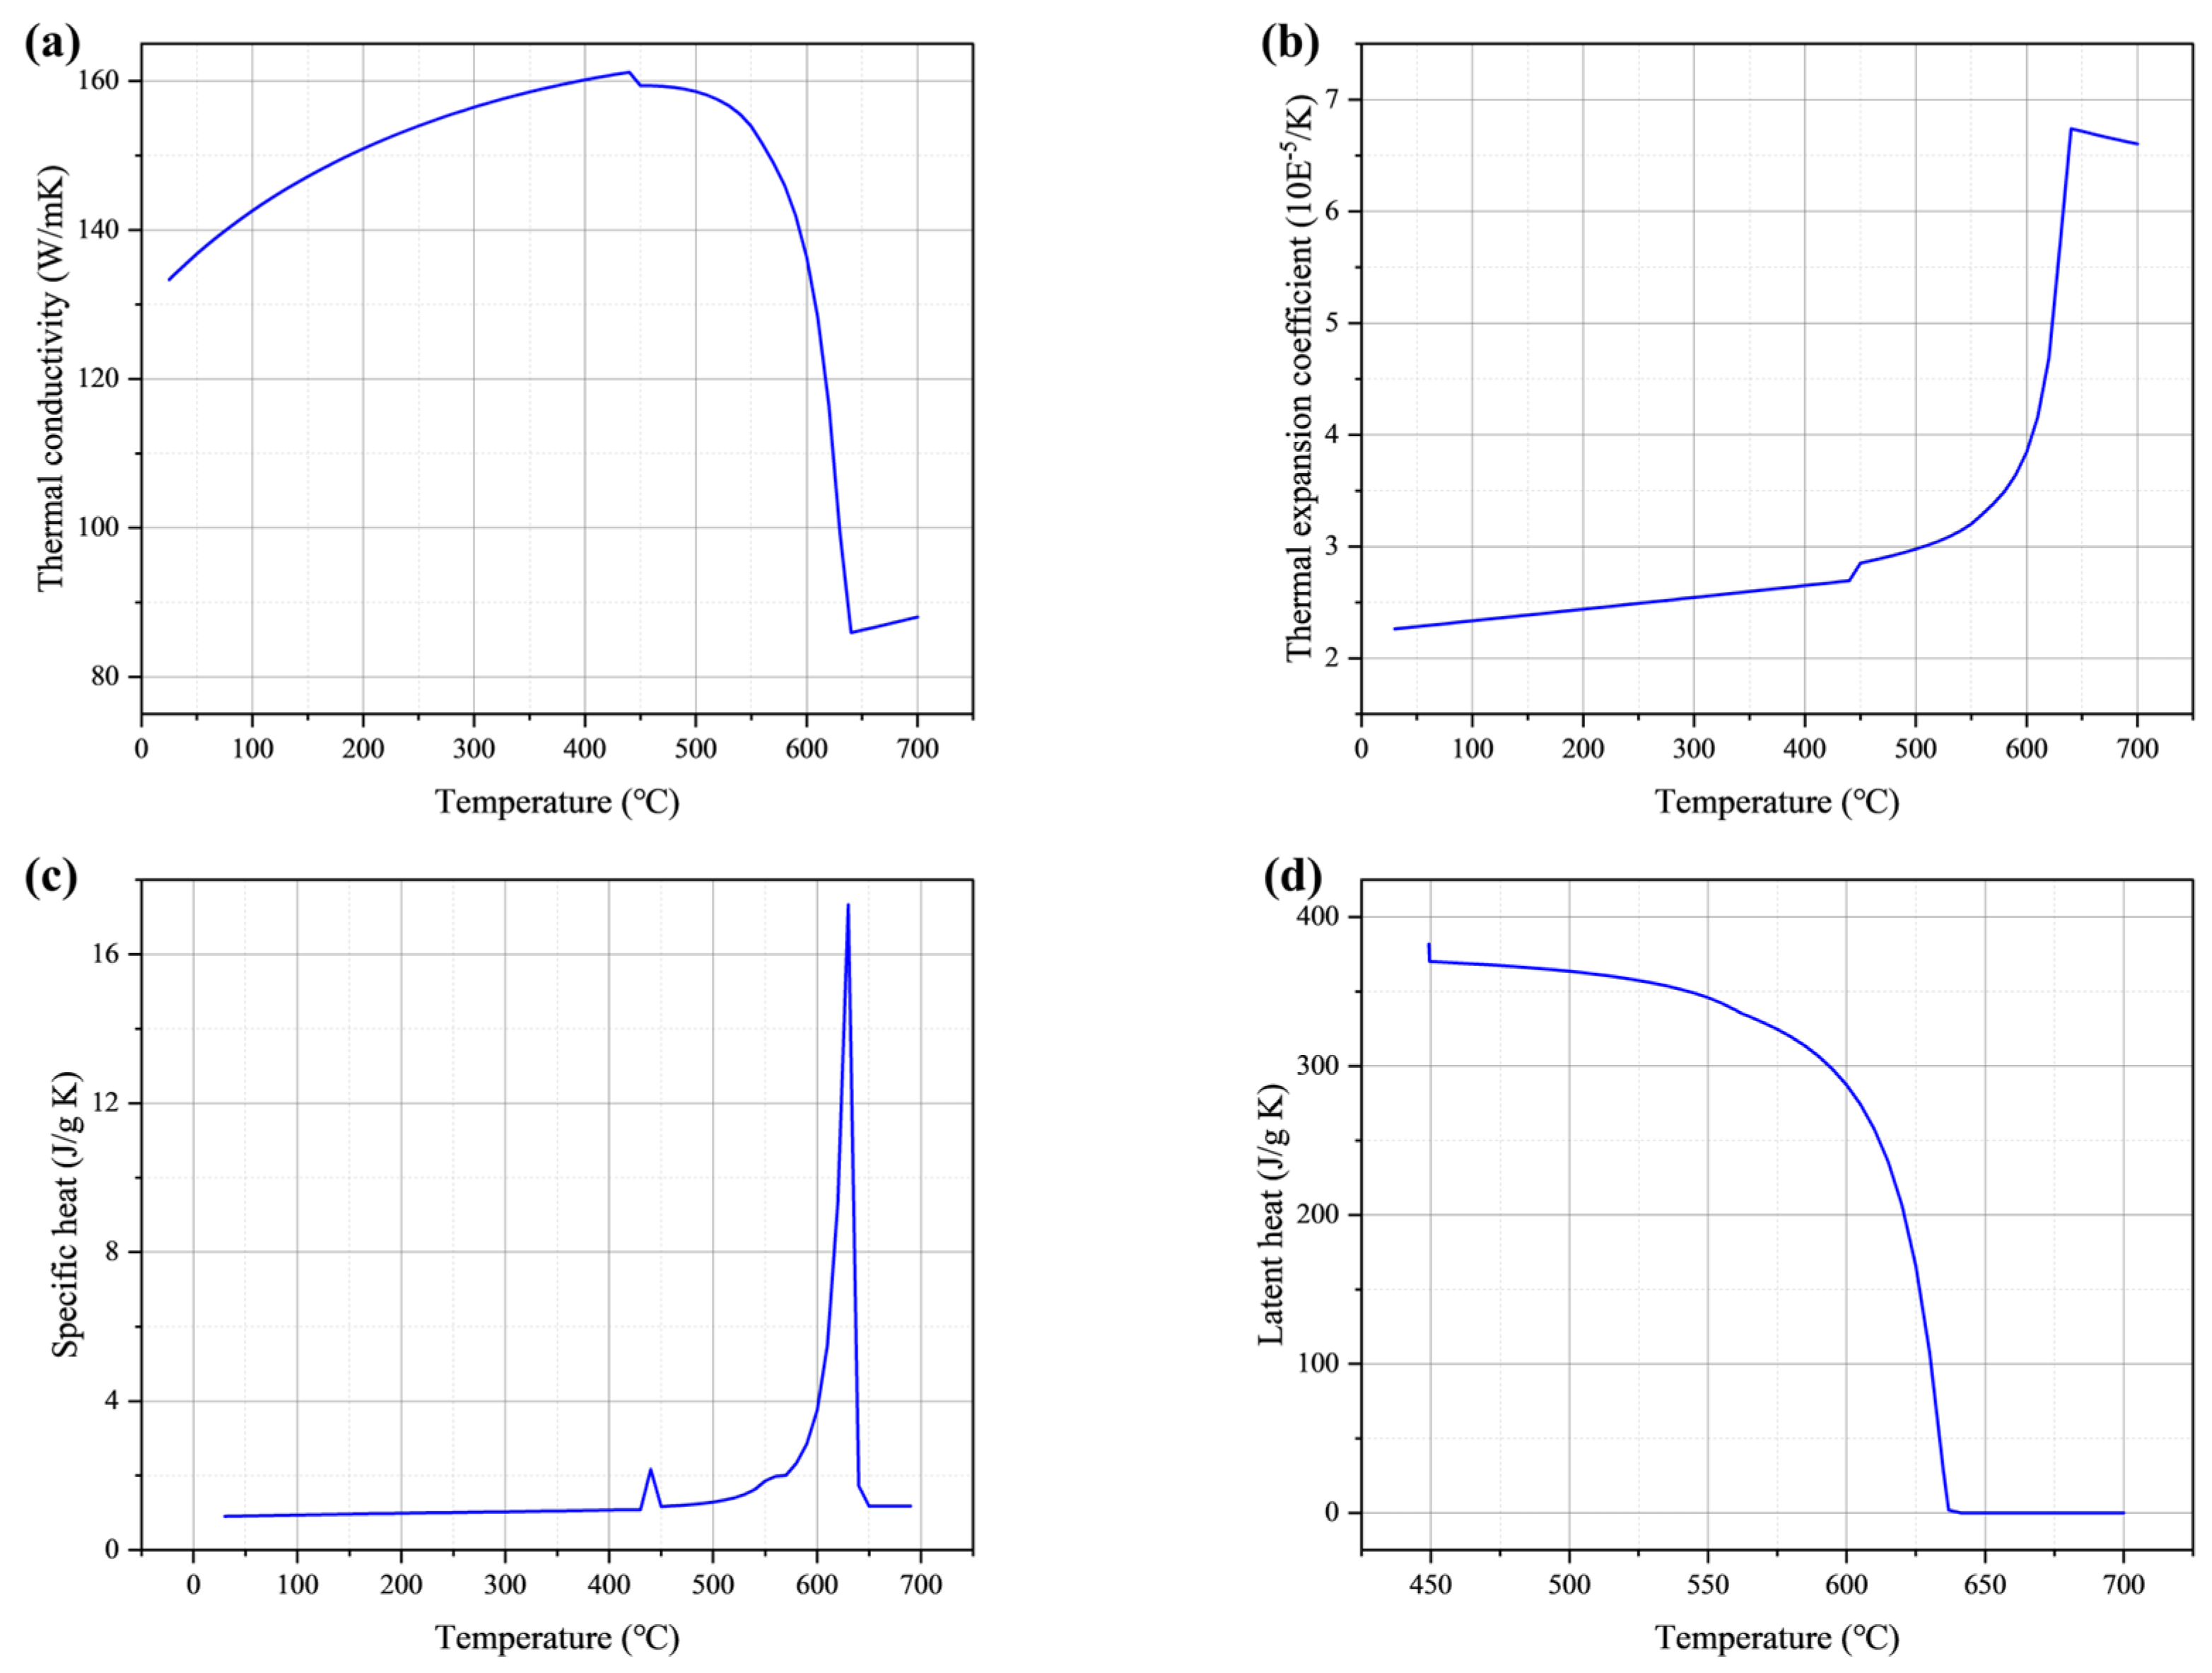
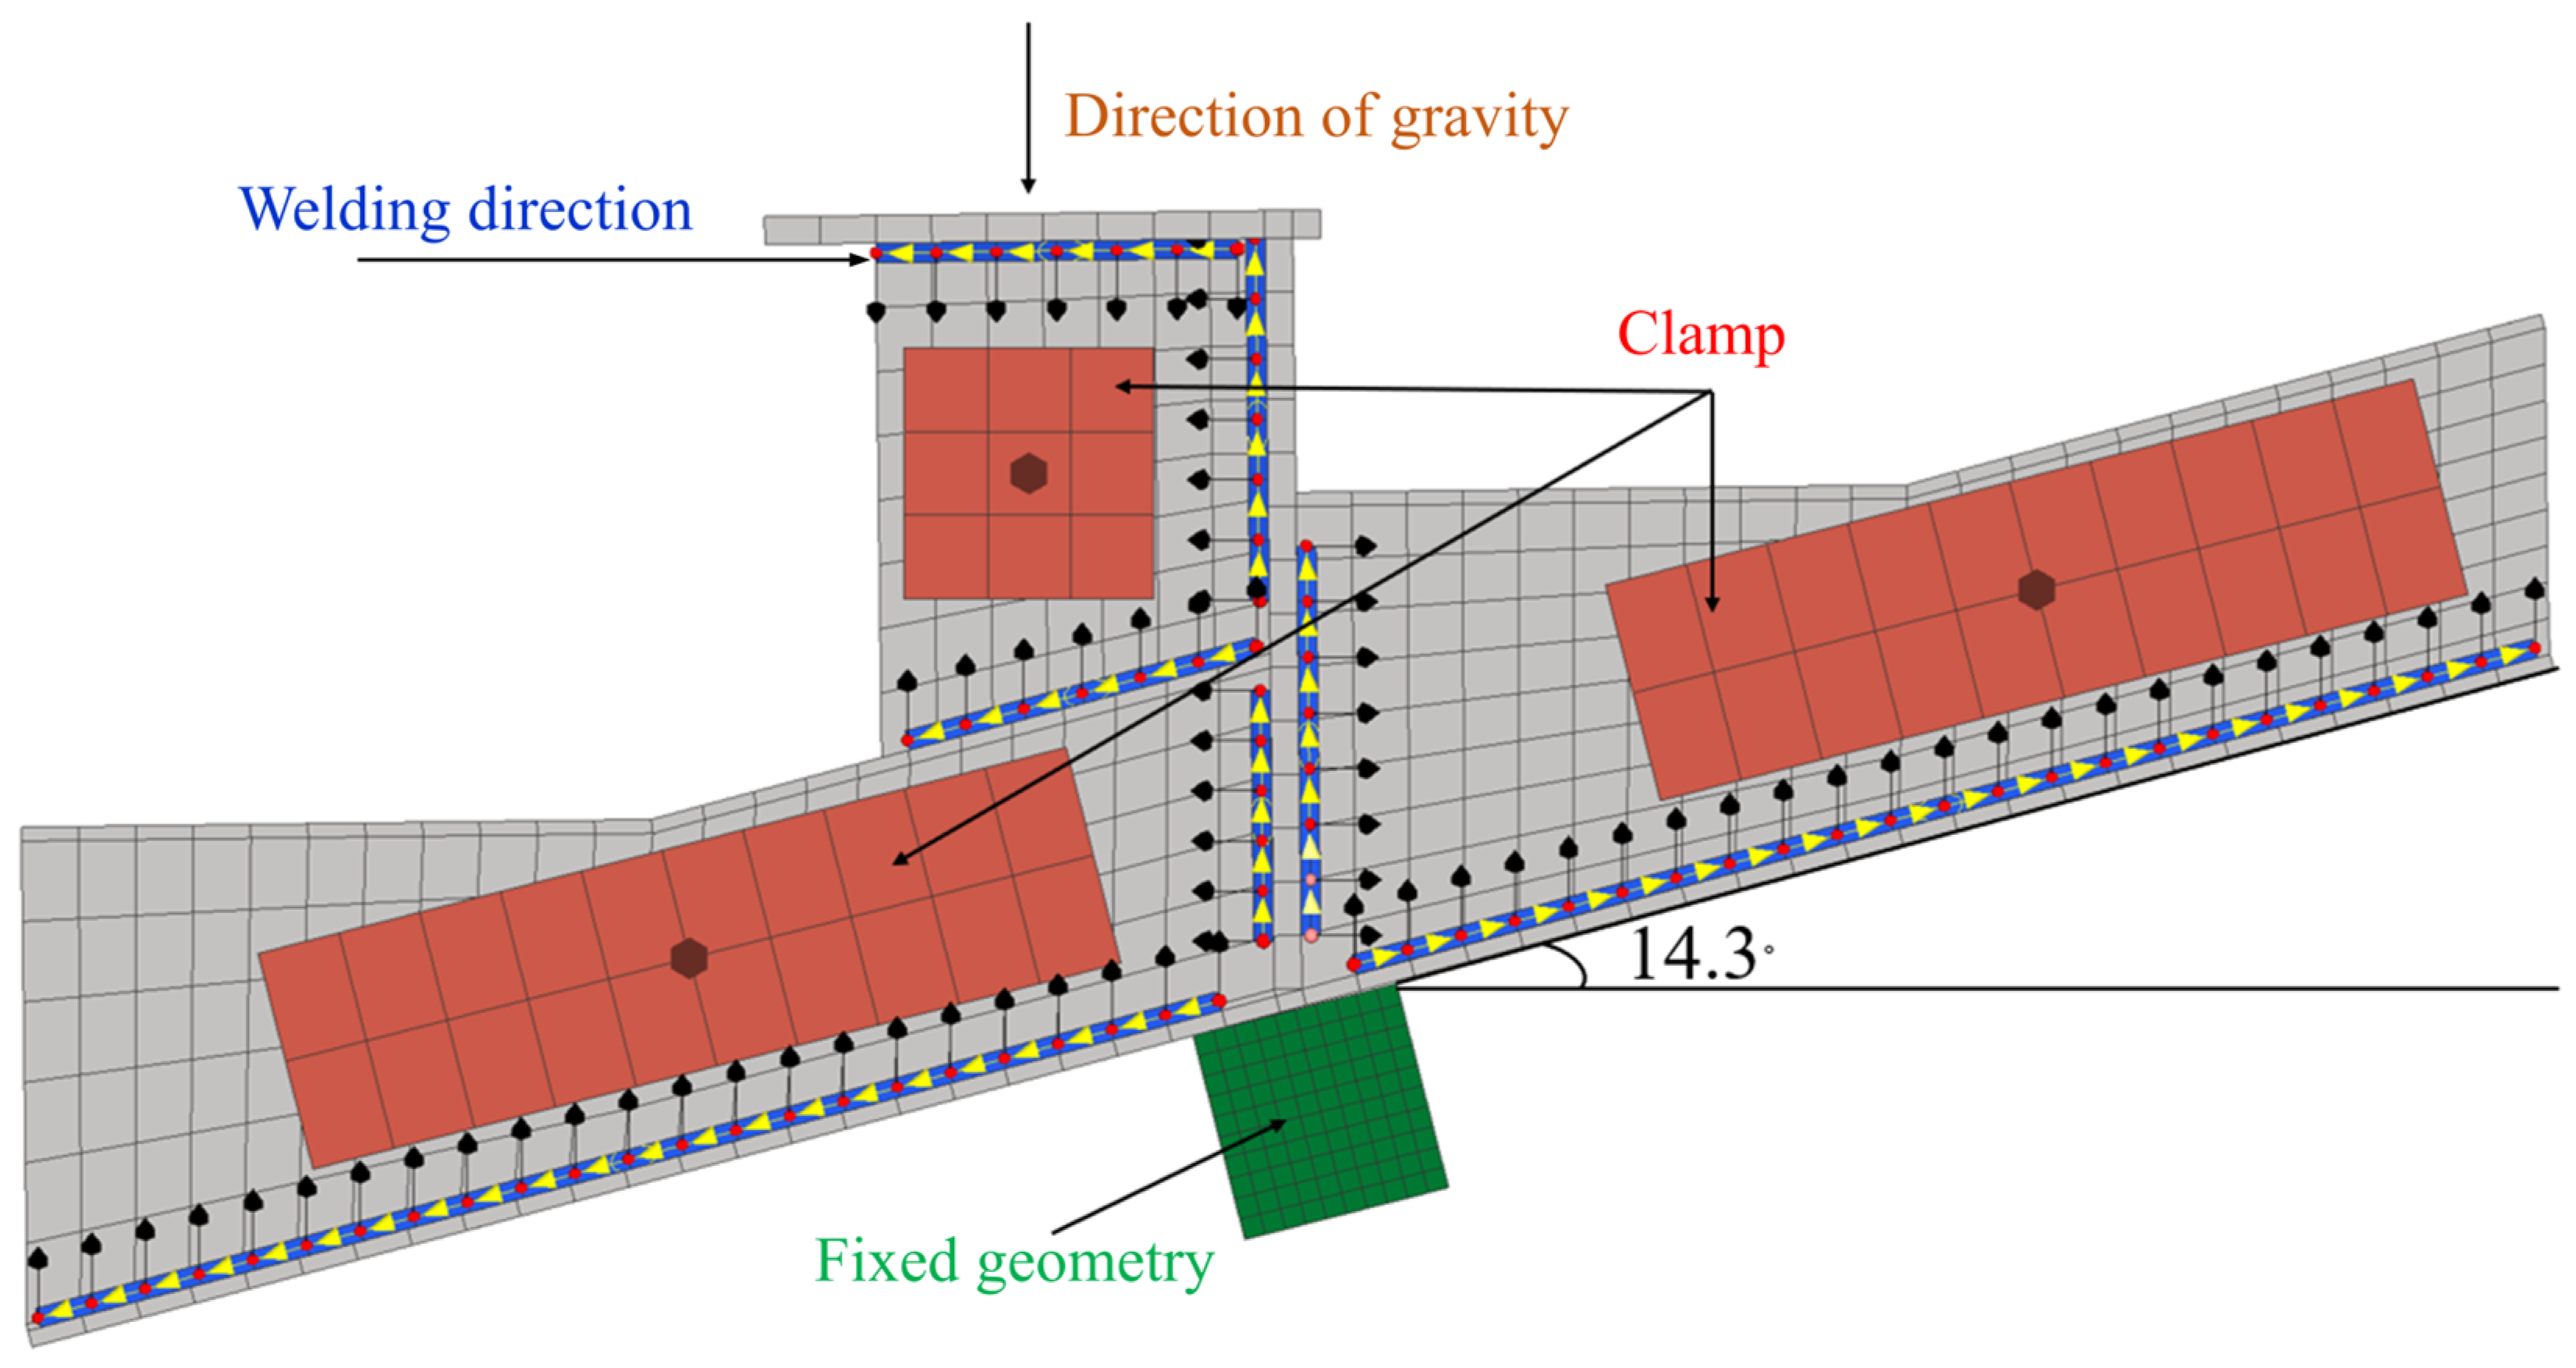
3.1. Physical Conditions

To develop an FEM-based deformation prediction model for the welding sequence, the physical properties of the Al5083 used in the welding experiments were derived. In order to derive the property change tendency according to the temperature conditions required for simulation, JMatPro (Sente Software (7.0.0, England), JMatPro) was used to derive the property change tendency of Al5083 as a function of the temperature. Figure 1 shows the physical properties of Al5083 as a function of the temperature. Physical property data within a temperature range selected to match the melting temperature of the actual Al5083 material were used as simulation conditions to predict the deformation due to the conditions of the welding sequence.

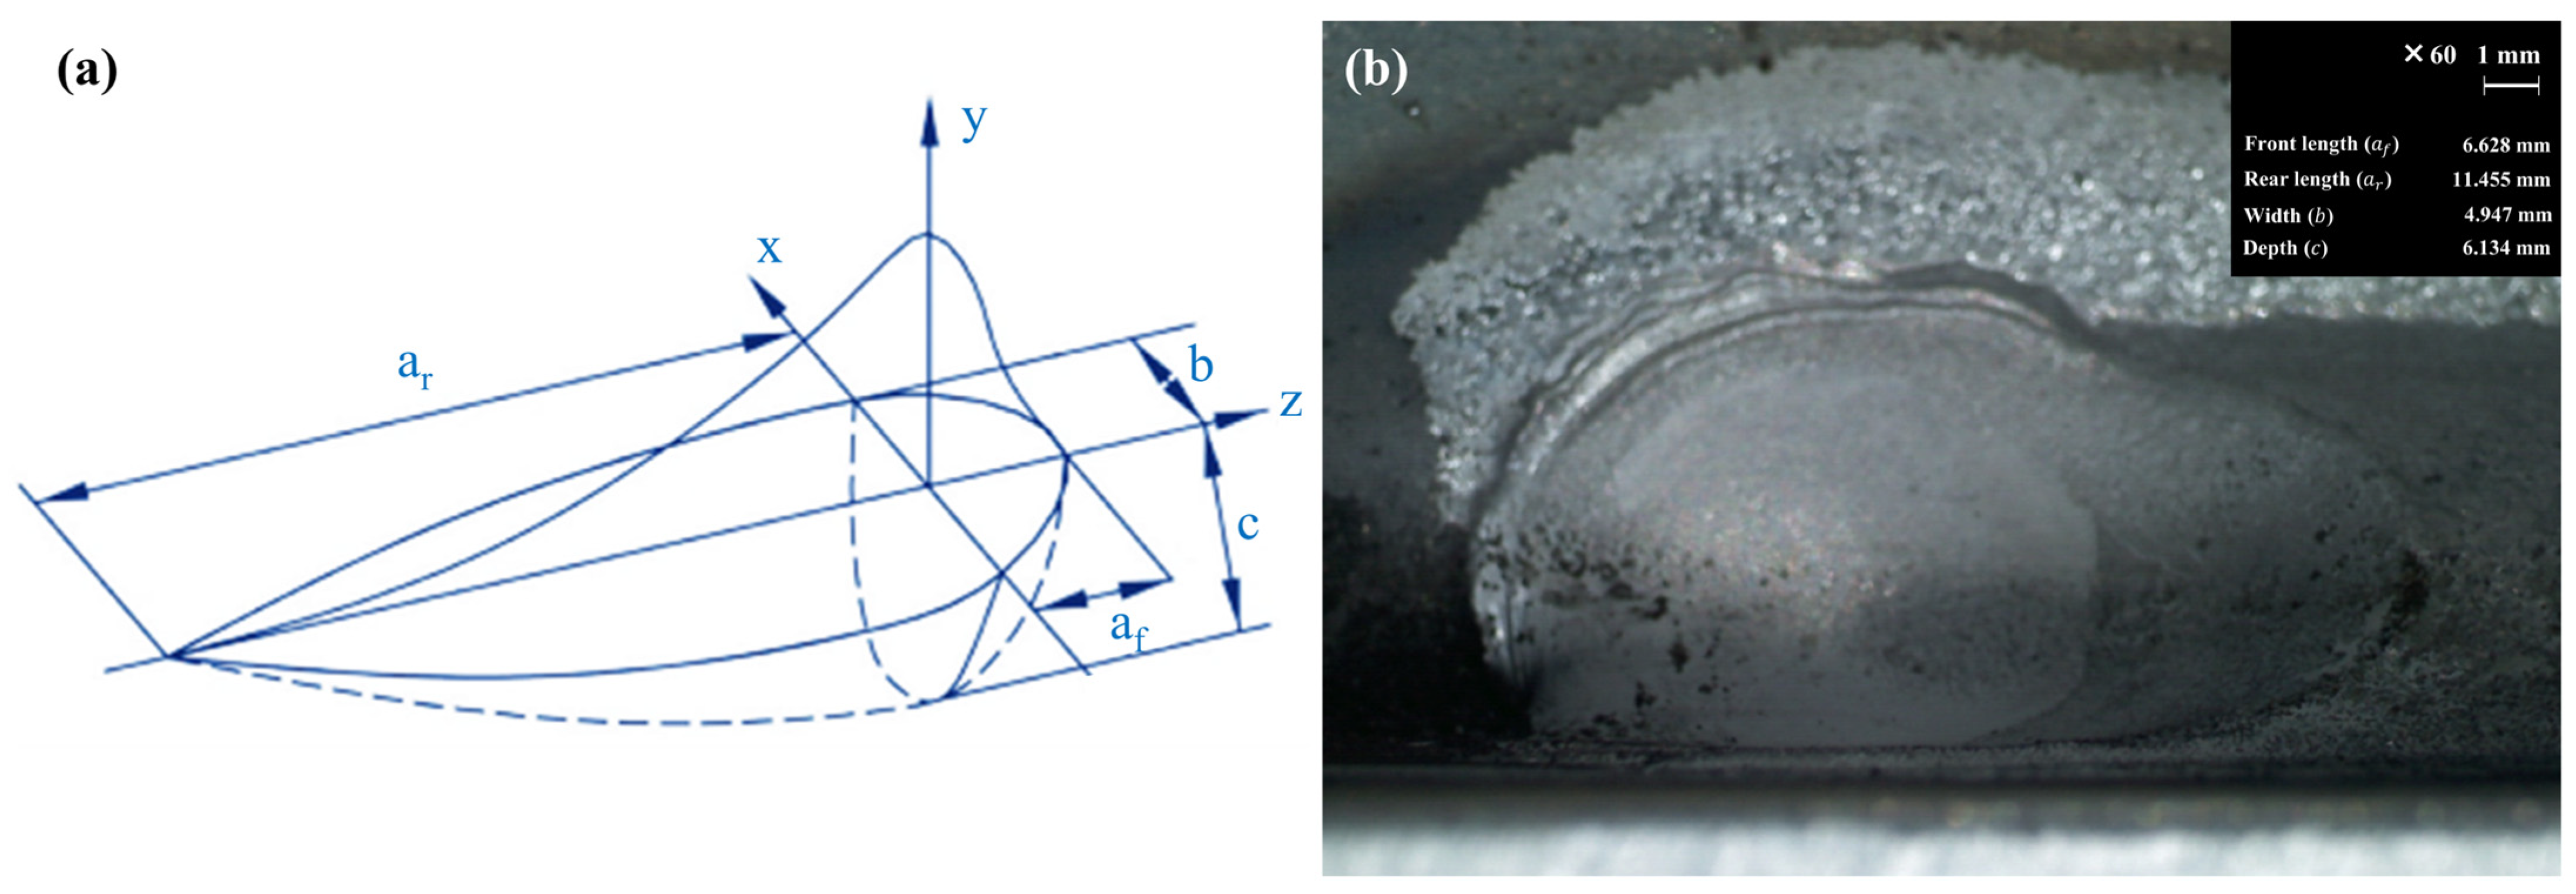
3.2. Welding Heat Source

The Gaussian heat source model has the advantage of transforming an infinite heat source into a finite heat source by applying the concept of effective diameter, which is suitable for simulation [33]. Since the reliability of the Goldak model has been verified by many studies, in this study, the double ellipsoid Goldak model was used for the simulation [34]. Figure 2a illustrates the Goldak model. The Goldak model consists of two ellipsoids of different sizes, where one ellipsoid represents the front heat source and the other ellipsoid represents the rear heat source. The governing equations are shown in Equations (1)–(5):
Q = μ V I
where Q is the effective heat energy, μ is the welding efficiency, and V and I are the voltage and current welding parameters, respectively, while
q f x , y , z , t = 3 6 f f Q a f b c π e x p ( 3 ( ( z v t z 0 ) 2 a f 2 + y 2 c 2 + x 2 b ) )
q r x , y , z , t = 3 6 f r Q a r b c π e x p ( 3 ( ( z v t z 0 ) 2 a r 2 + y 2 c 2 + x 2 b 2 ) )
f f = 2 a r a f + a r
f r = 2 a f a f + a r
Here, f f and f r represent the fraction of heat deposited at the ellipsoid for the front and rear, respectively, and v is the velocity of the heat source. In Equations (2) and (3), parameters a f , a r , b , and c are independent. Although the geometric dimensions of the heat source in the FEM are given as estimates based on the welding variables, actual welds may exhibit different trends. In this paper, the geometric dimensions of the actual welding heat source were measured for more reliable welding deformation prediction. The dimensions of the welding heat source obtained from the weld bead formed under the conditions of 177 A and 20.7 V with a 35 cm/min welding speed were derived and used as simulation conditions. Figure 2b shows the heat source shape of the weld bead and the heat source shape dimensions used in the Goldak model.

3.3. Arc Efficiency

A simplified simulation was performed to derive the arc efficiency condition for development of the deformation prediction model according to the welding sequence. The simulation results found for the derivation of the appropriate arc efficiency conditions under the condition of a normally distributed Gaussian parameter were compared with the geometry of the weld bead formed under the conditions of 177 A and 20.7 V with a 35 cm/min welding speed. The simplified simulation model used to derive the arc efficiency conditions is shown in Figure 3. The simulation results for a 50 mm section and a middle section of 100 mm in the direction of weld progression were compared to the actual weld bead’s cross-sectional geometry. The comparison of the weld geometry according to the arc efficiency shows that the molten weld bead geometry and penetration depth were similar to the actual welded geometry under the condition of 90% arc efficiency. Figure 4 shows the comparison between the simulation results and the bead geometry of the actual weld under the condition of 90% arc efficiency.

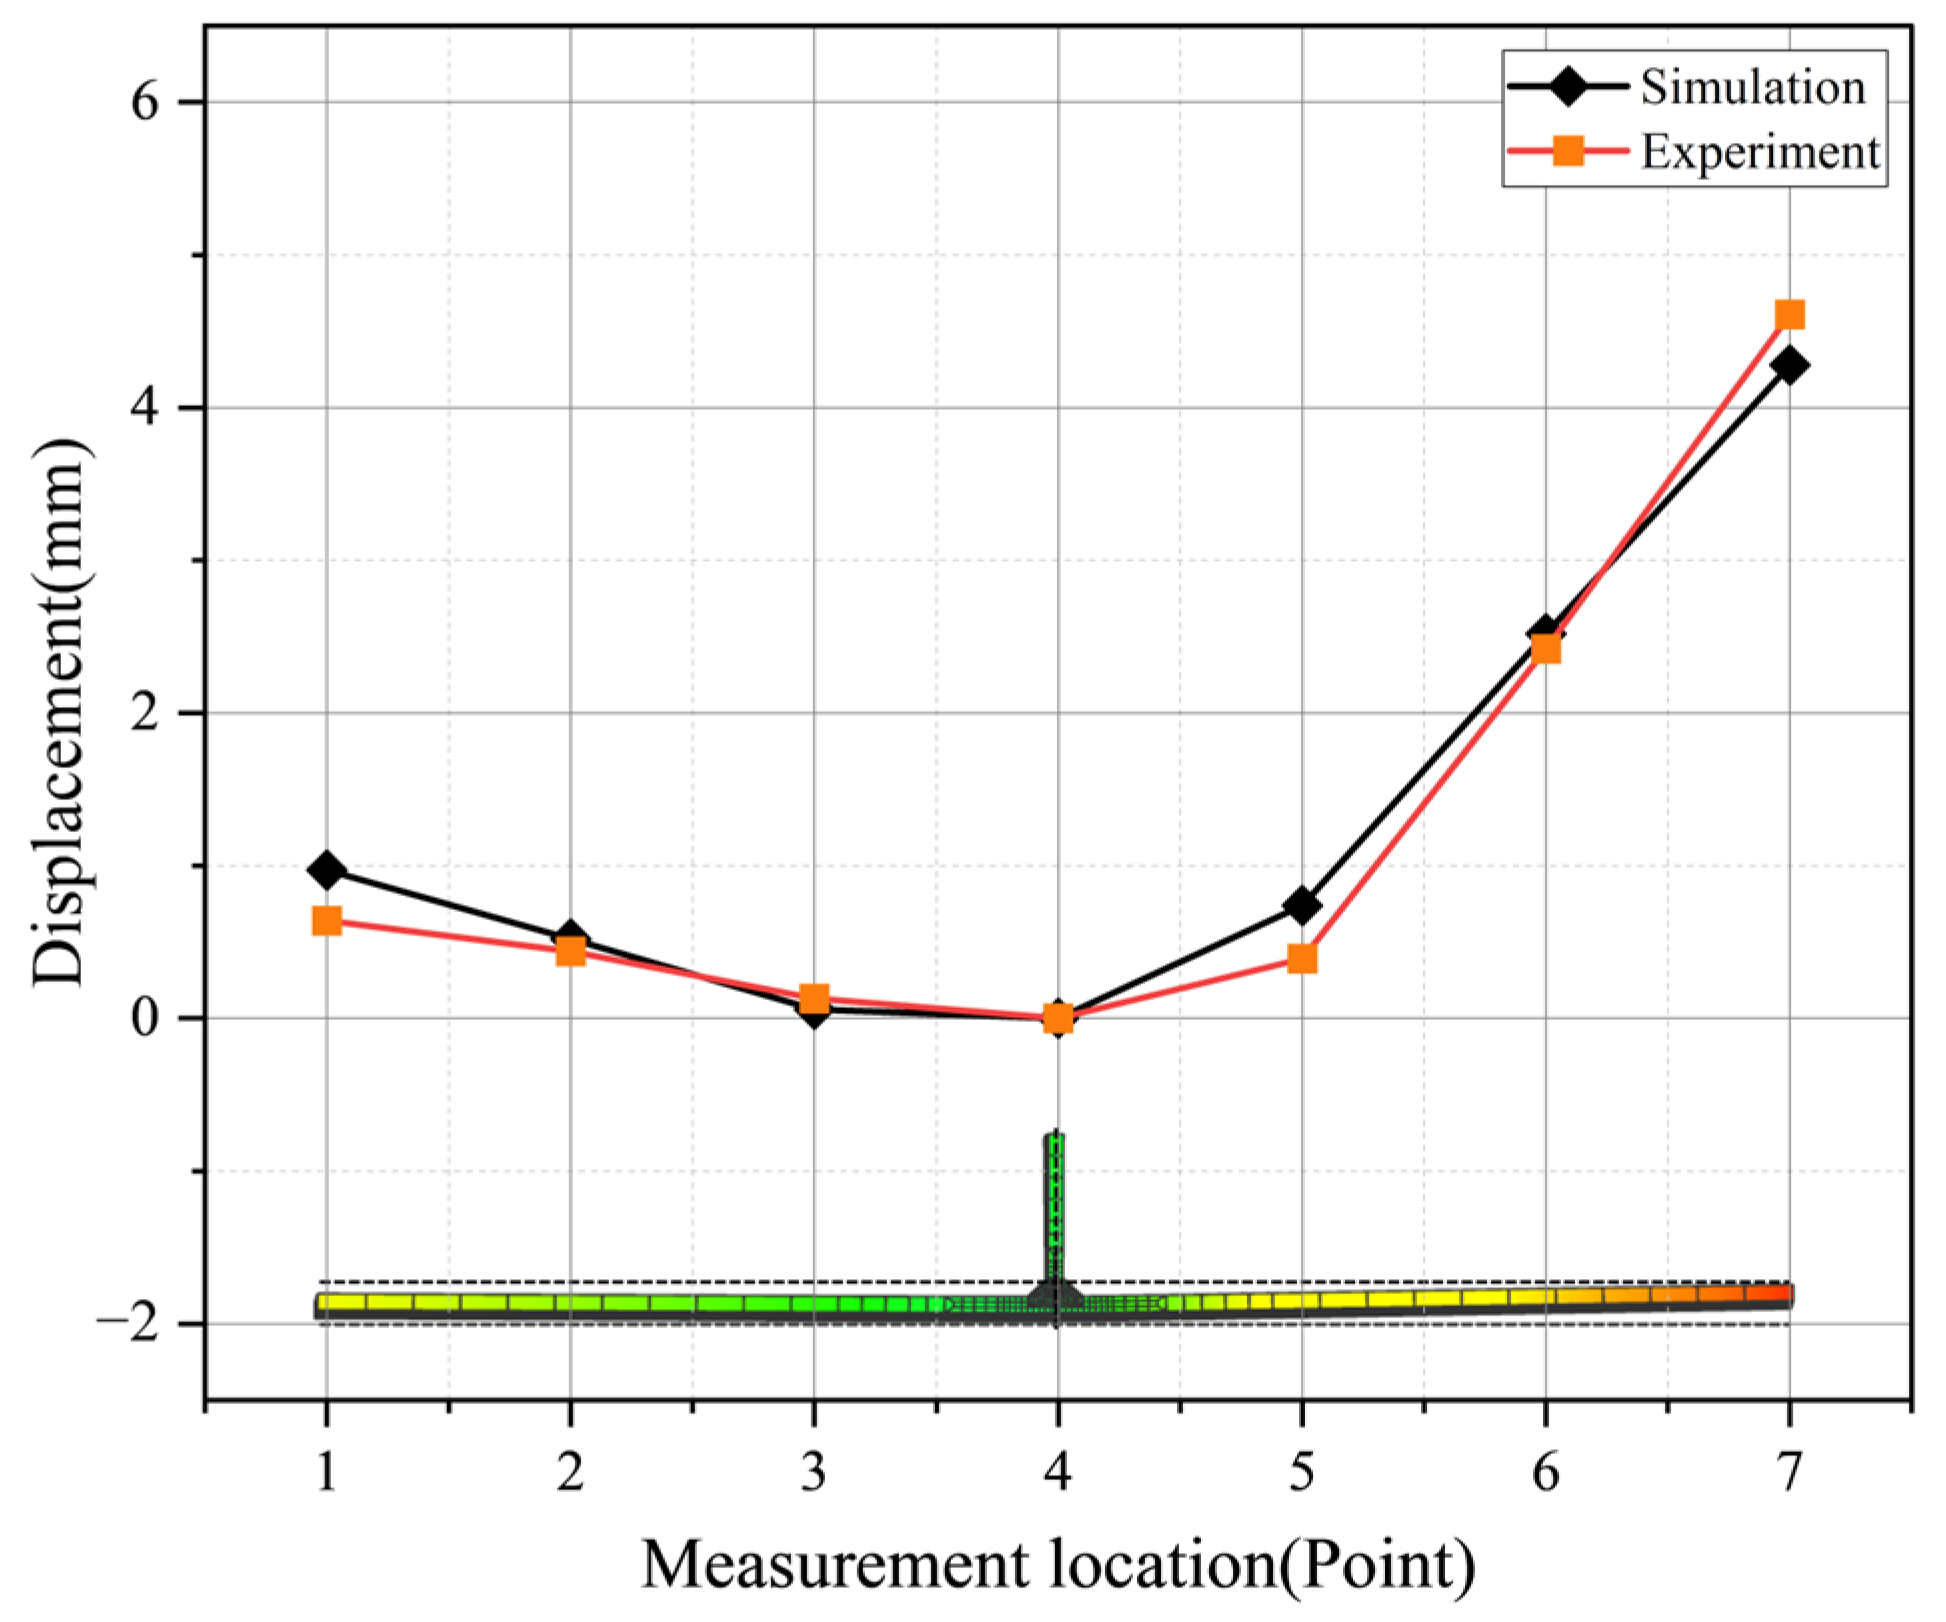
3.4. Simulation Condition Adequacy

Before performing the deformation prediction according to the welding sequence, a comparison with the actual welding results was performed to examine the appropriateness of the temperature-dependent properties, welding heat source, and arc efficiency conditions used as simulation conditions. To compare the deformation of the actual welding experiment results with the simulation results, the displacement was measured for a 50 mm section perpendicular to the welding direction, as shown in Figure 3. It can be seen that the deformation prediction results of the fillet weld based on the selected temperature-dependent properties, welding heat source, and arc efficiency conditions tended to be similar to the actual experimental values. The deformation varied from a minimum of 0.07 mm to a maximum of 0.35 mm. The welded right side was found to deform more than the unwelded left side. The weld deformation was found to be in the direction of the top of the material, where the weld was performed, rather than in the direction of gravity relative to a fixed center. It was determined that the deformation occurred in the direction of the weld bead as the shrinkage stress caused by the welding acted on the weld zone. The results of this simulation show that the deformation prediction results were similar to the actual experimental values, and thus it was determined that the selected temperature-dependent properties, the dimensional conditions of the heat source shape obtained from the weld bead, and the simulation conditions of 90% arc efficiency were appropriate. The deformation measurement results of the simulated and actual welds are shown in Figure 5.

4. FEM-Based Deformation Prediction
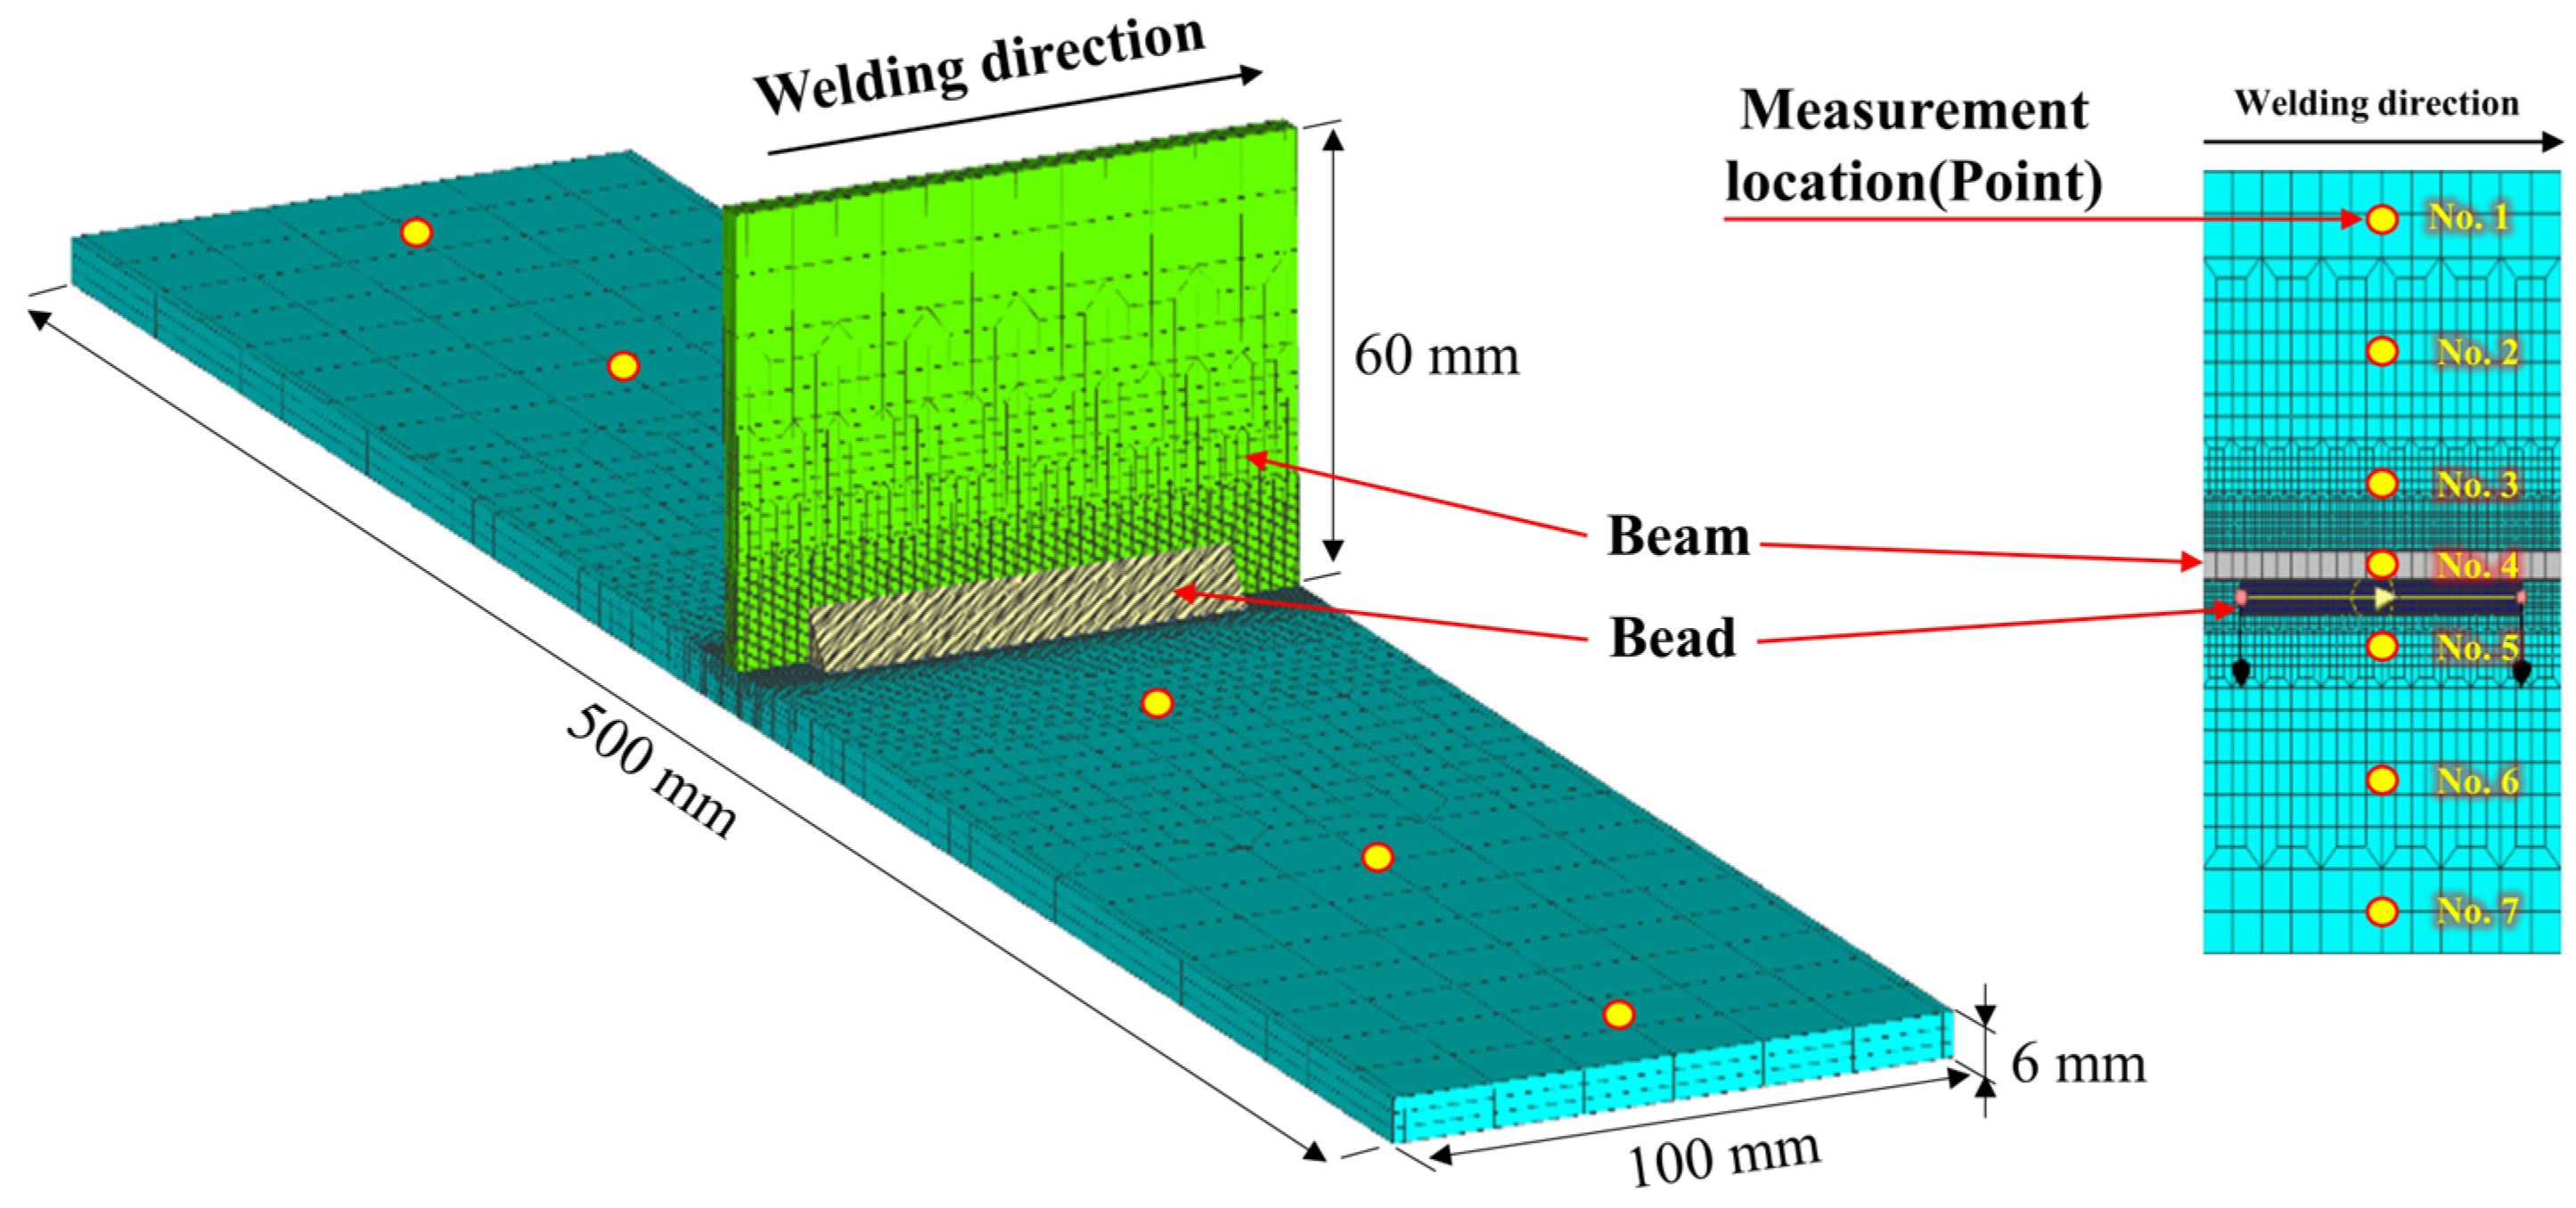
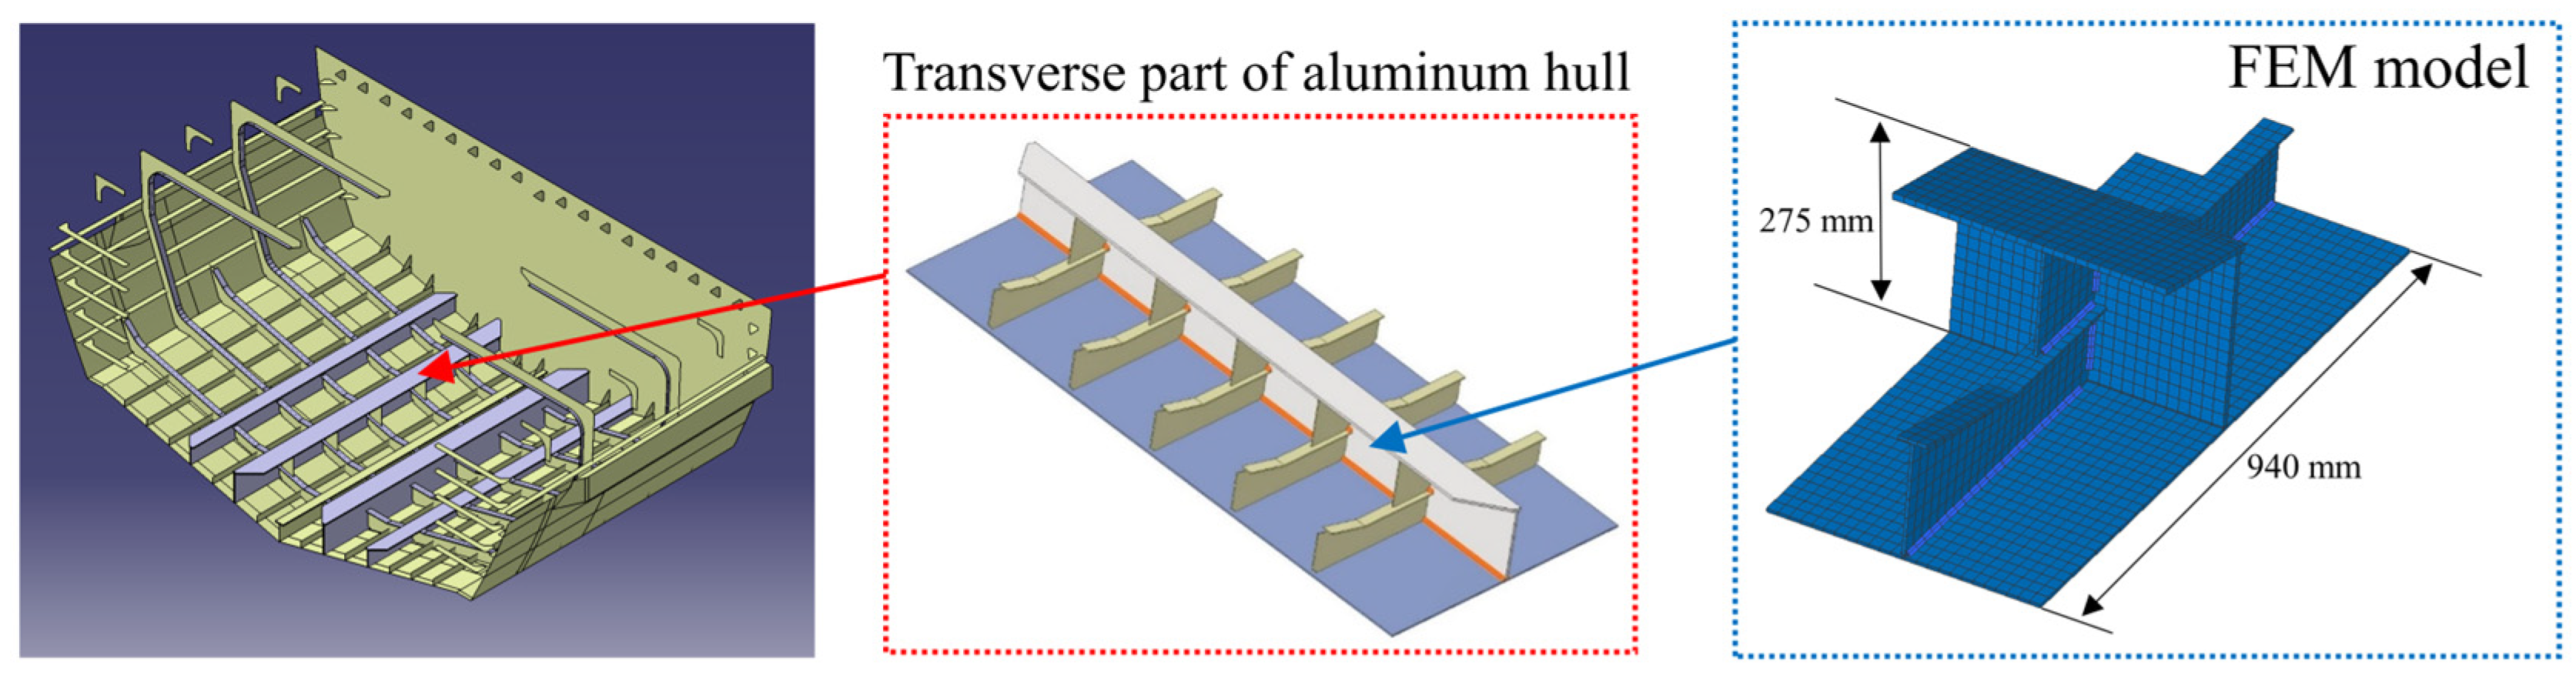
4.1. FEM Model

The welding sequence is a discrete variable, and a welding simulation with the FEM was used to predict the deformation, determine the relationship between the welding sequence and the deformation, and derive the conditions under which the deformation was minimized. A simulation model was developed to predict the welding deformation according to the welding sequence for the transverse model of the lower part of the aluminum hull. To prevent the number of experimental points from increasing exponentially with the number of welds, the simulation was simplified and partitioned. The mesh for the simulation was made to be as small as 5 mm and gradually increase in size away from the weld to a maximum size of 20 mm. The mesh for the weld bead was the same size as that shown previously in Figure 3 in order to use simulation conditions for the actual weld heat source. The model with the simulation location and mesh of the weld deformation for the aluminum hull is shown in Figure 6.

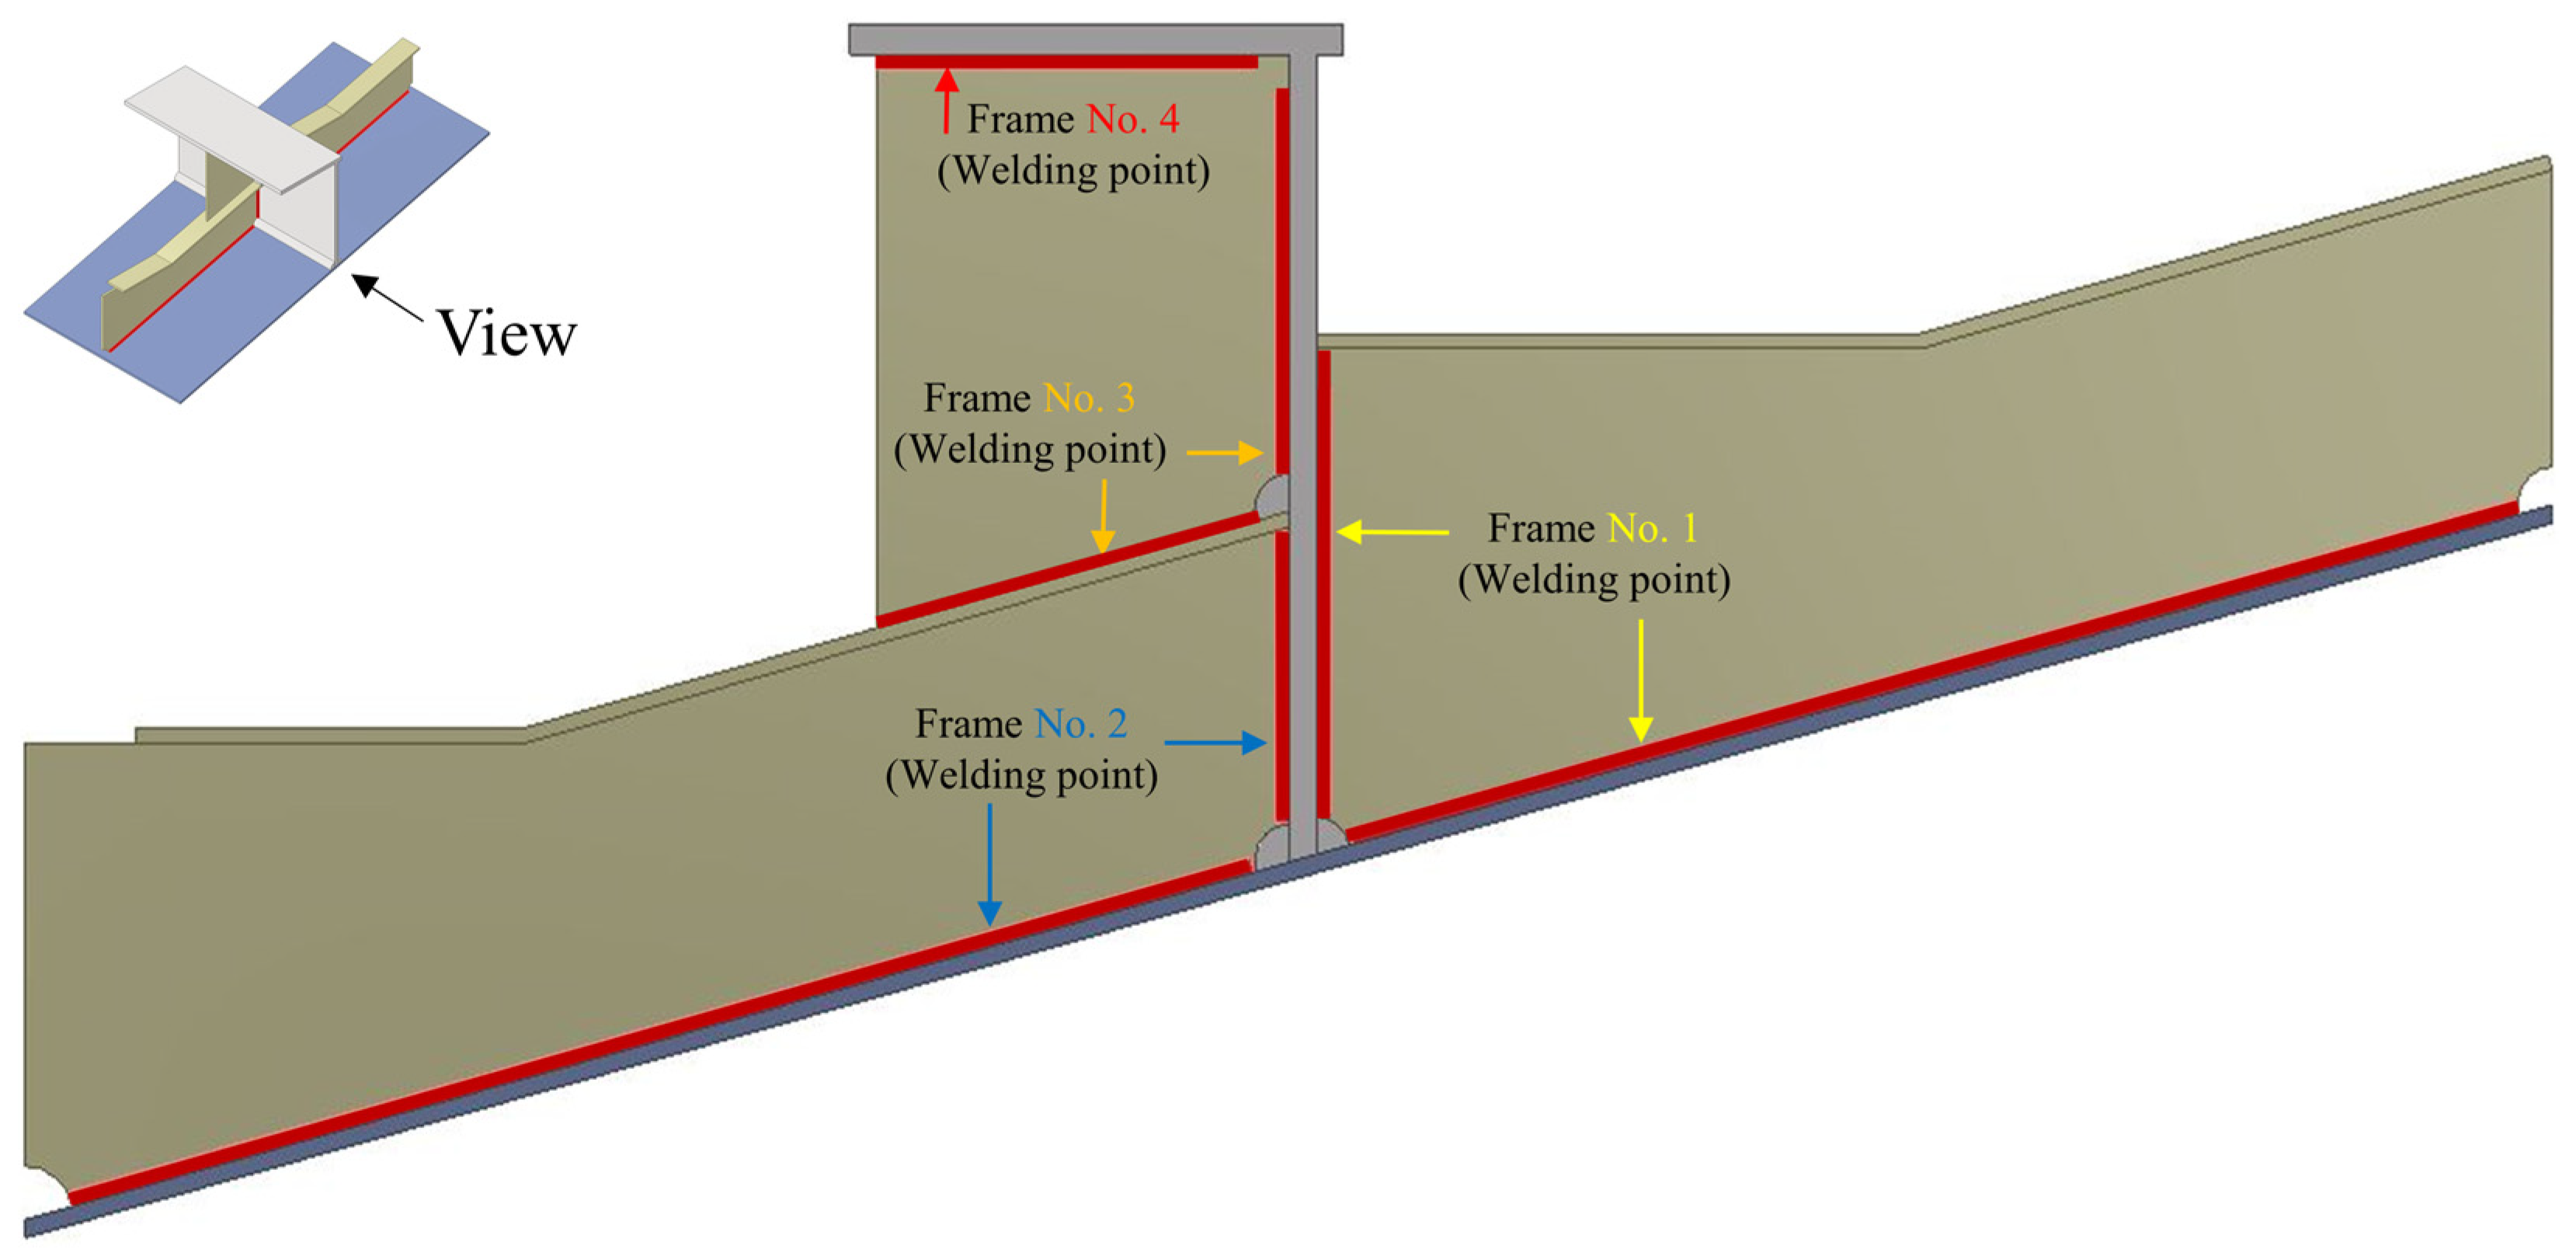
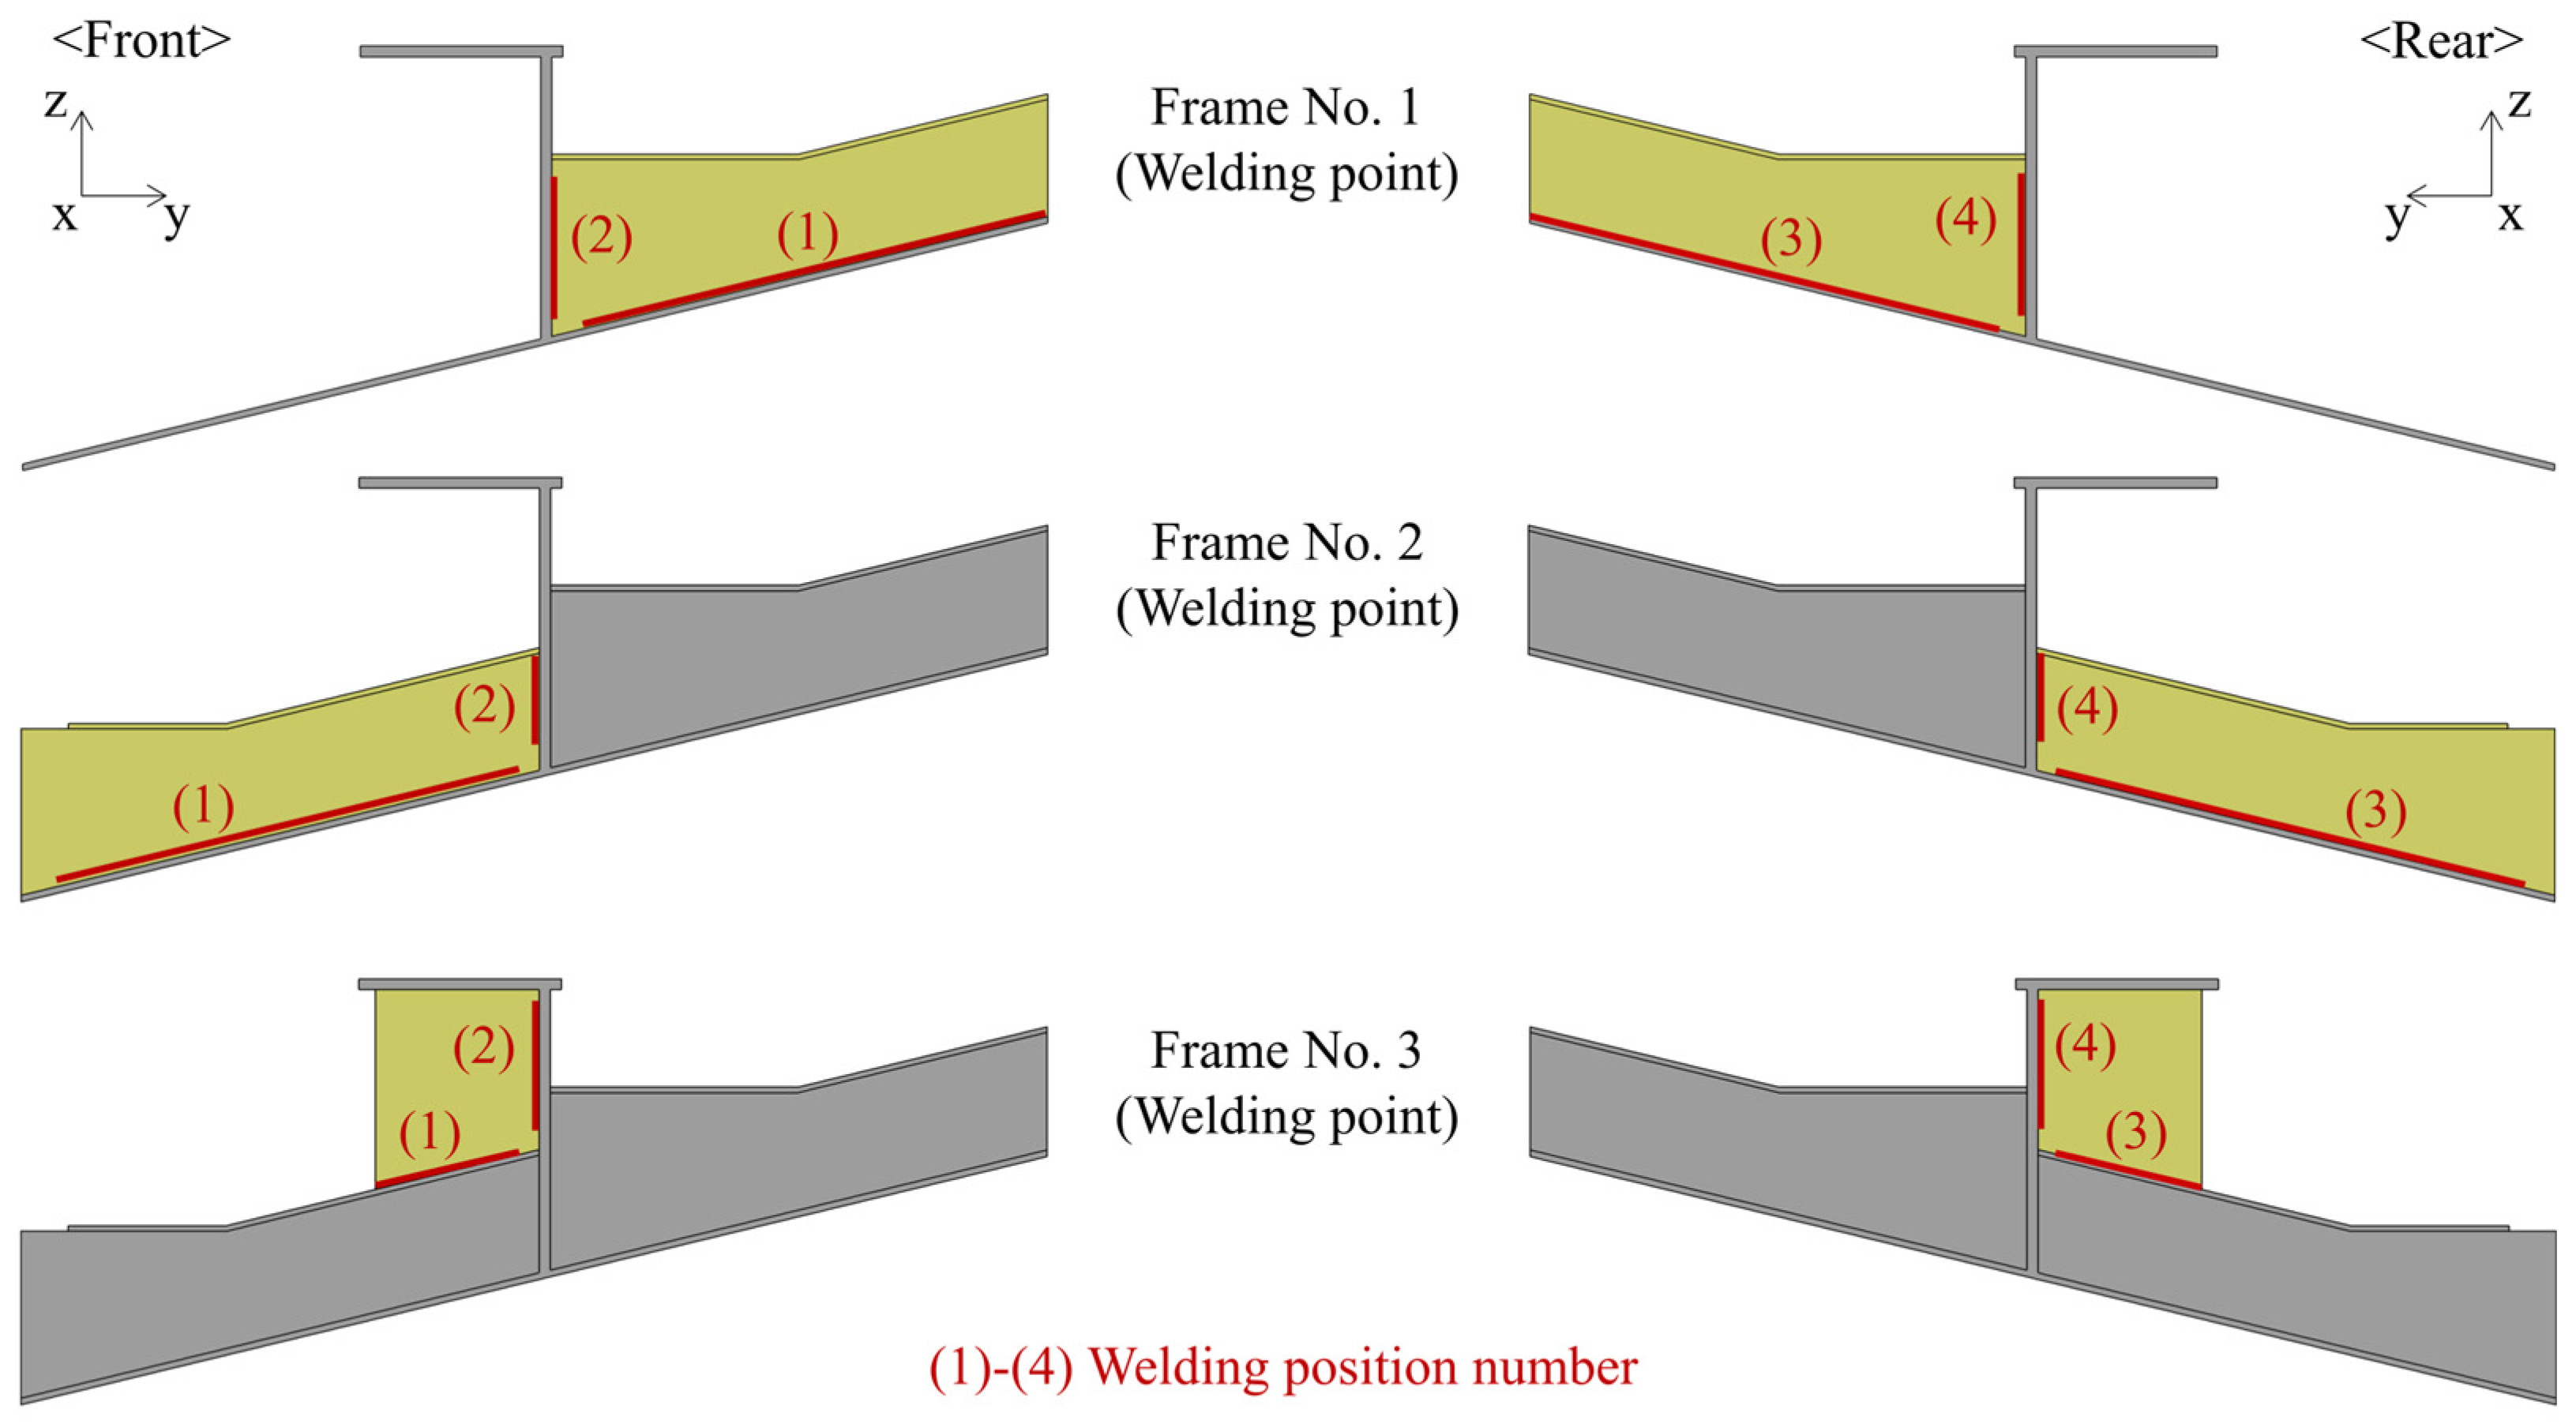
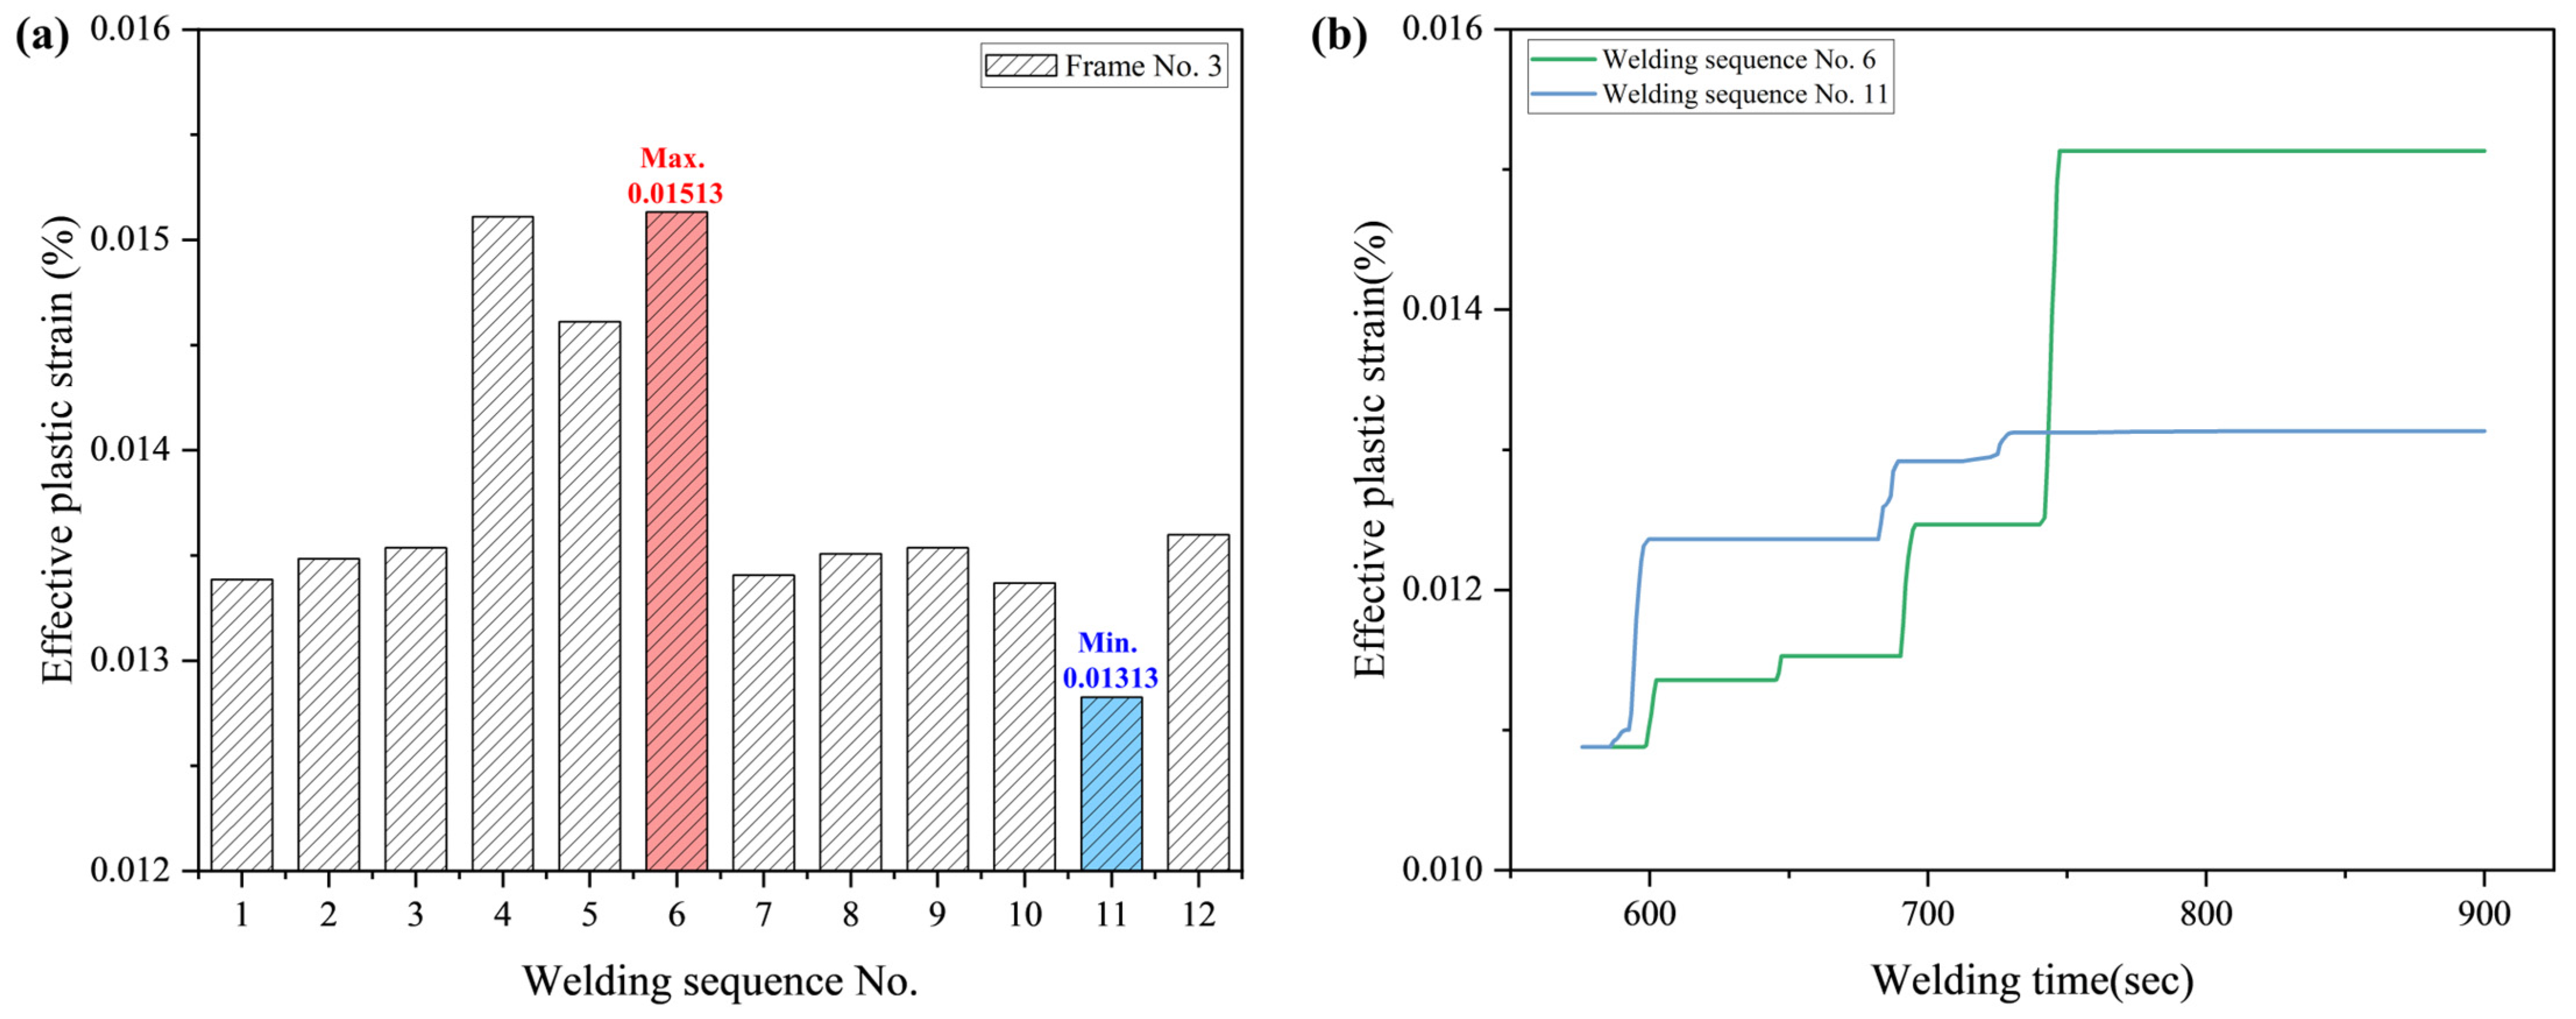
4.2. Welding Sequence Conditions

In the welding deformation simulation of the simplified transverse model of the aluminum hull bottom, considering that welding was performed for each frame at the actual site, a deformation simulation plan according to the welding sequence was established according to the order of right, left, and top based on experience. Also, in order to reduce the time during the simulation process, the welding sequence conditions of the simplified transverse model were not considered at once but rather frame by frame to reduce the time during the simulation process. The simplified transverse model, divided into frames, is shown in Figure 7.
To derive the minimum deformation condition for the simplified transverse model, the welding sequence condition representing the minimum deformation was derived using a model with only frame 1 welded to the transverse, with frames 2 and 3 excluded from the model. The welding sequence condition derived from frame 1 was applied to the model with frame 2’s geometry added, and a simulation was performed in the order of deriving the welding sequence condition corresponding to the minimum deformation of frame 2. Finally, the welding sequence conditions of the minimum deformation derived from frames 1 and 2 were used in the model with frame 3 to derive the welding sequence conditions representing the minimum deformation. For frame 4, we did not consider the welding sequence for the front and back in the same way that we did not consider the welding sequence for the front and back in frames 1–3. Figure 8 shows the considered welding sequence conditions according to the frame, and Table 4 shows the welding sequence design method. The same welding sequence design method was used regardless of the frame number because frames 1–3 had the same number of welds.
In the simulation, the migrating heat source of the weld caused the weld to be performed in an inside-out direction relative to the center of the structure. In the case of perpendicularity, welding was implemented from bottom to top. The boundary conditions used a total of six clamps and fixed geometry supports to simulate the actual welding process. To minimize the pressure on the weld, the clamps applied a force of 0 kN, and the fixed geometry was installed in a central position relative to the transverse model and rotated 14.3° relative to the ground surface. The simplified transverse model rotated relative to the fixed geometry was designed such that the top face of frame 4 was perpendicular to the direction of gravity. Figure 9 shows the boundary conditions used in the simulation.

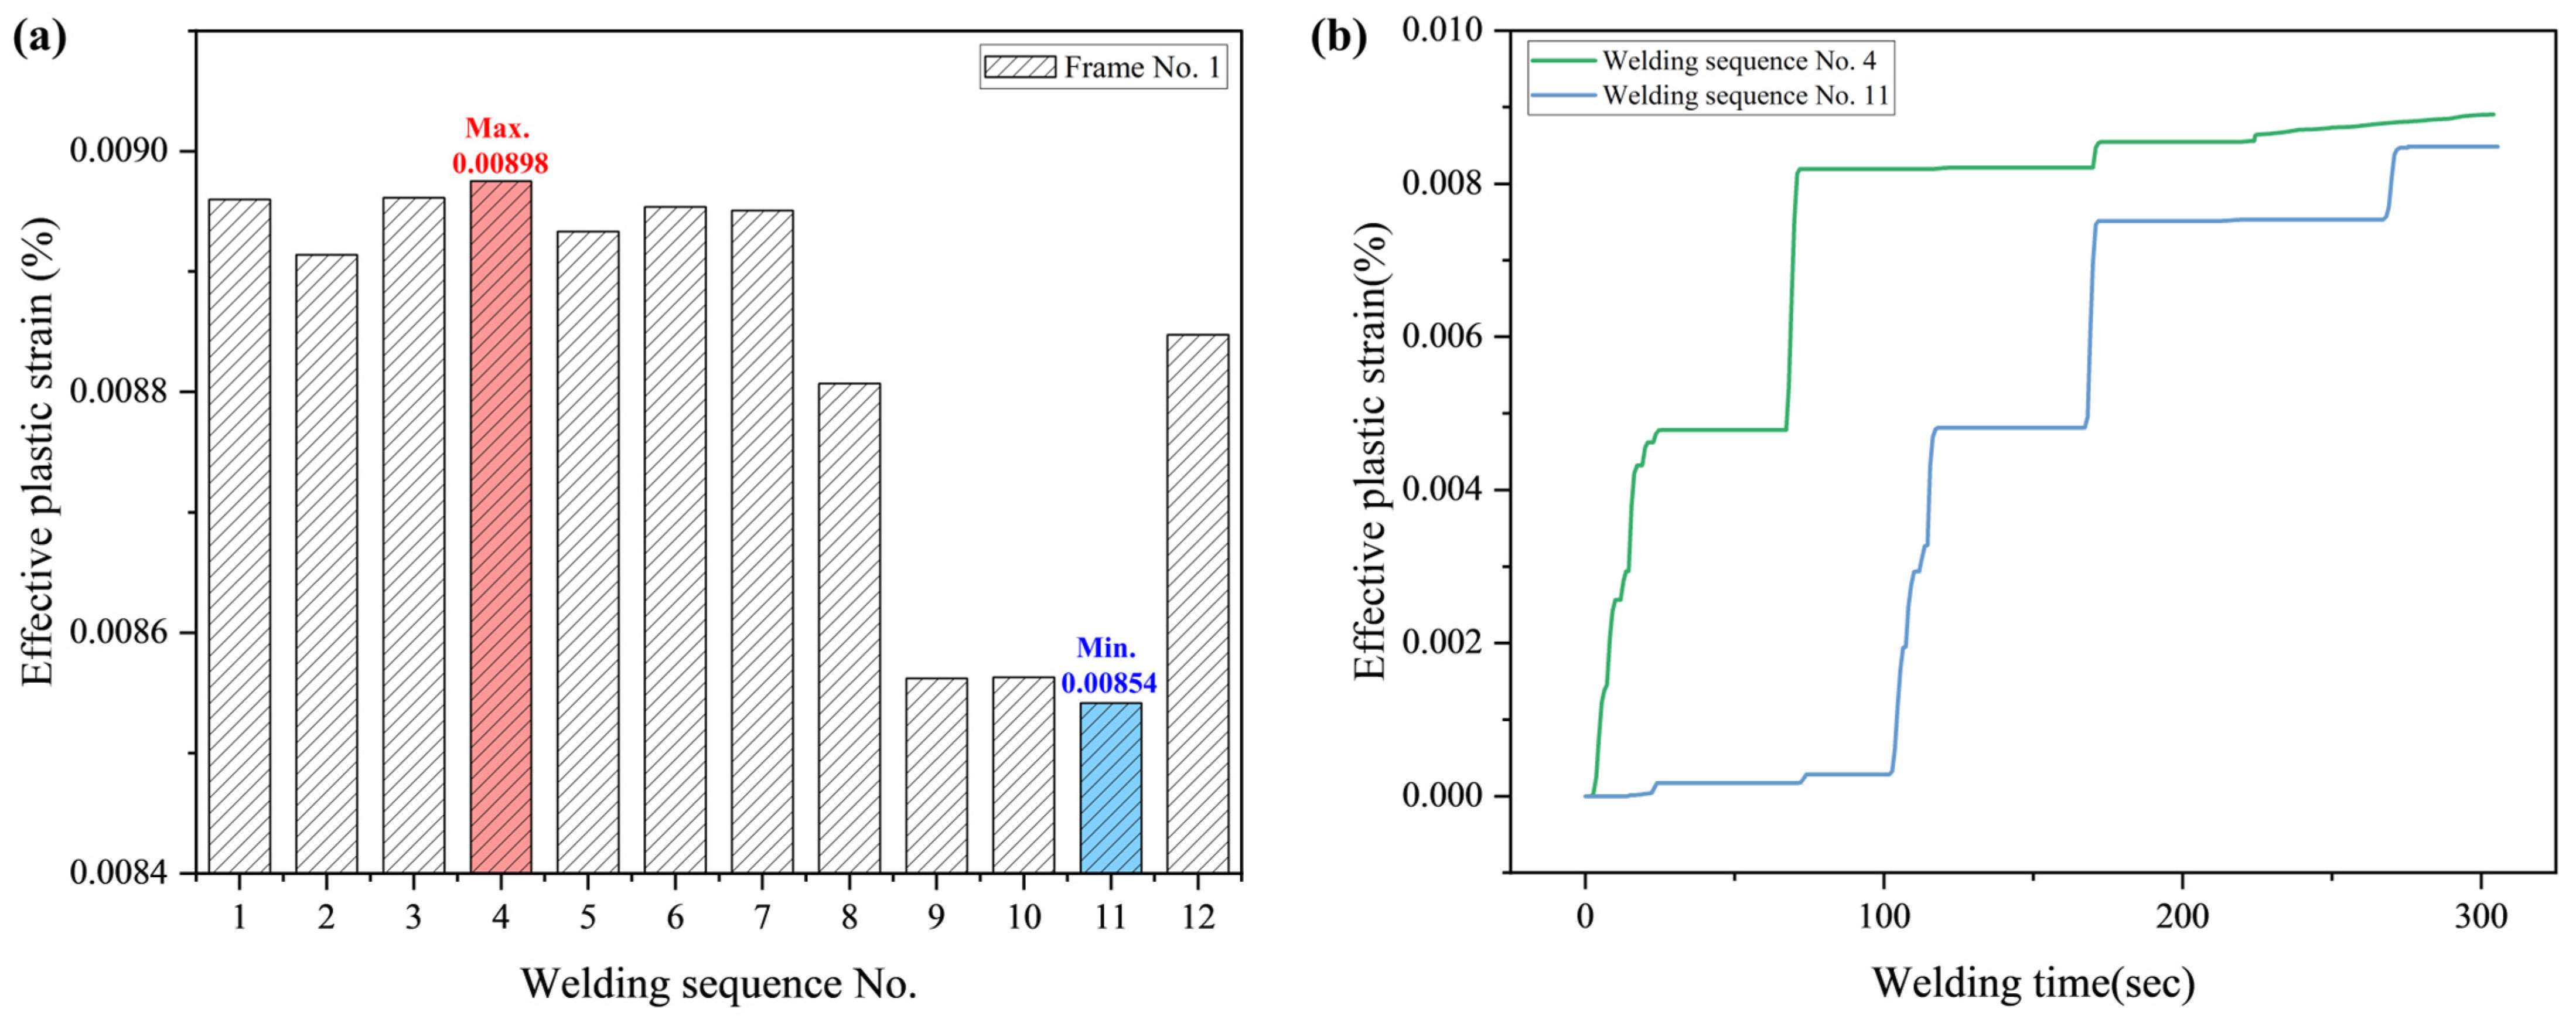
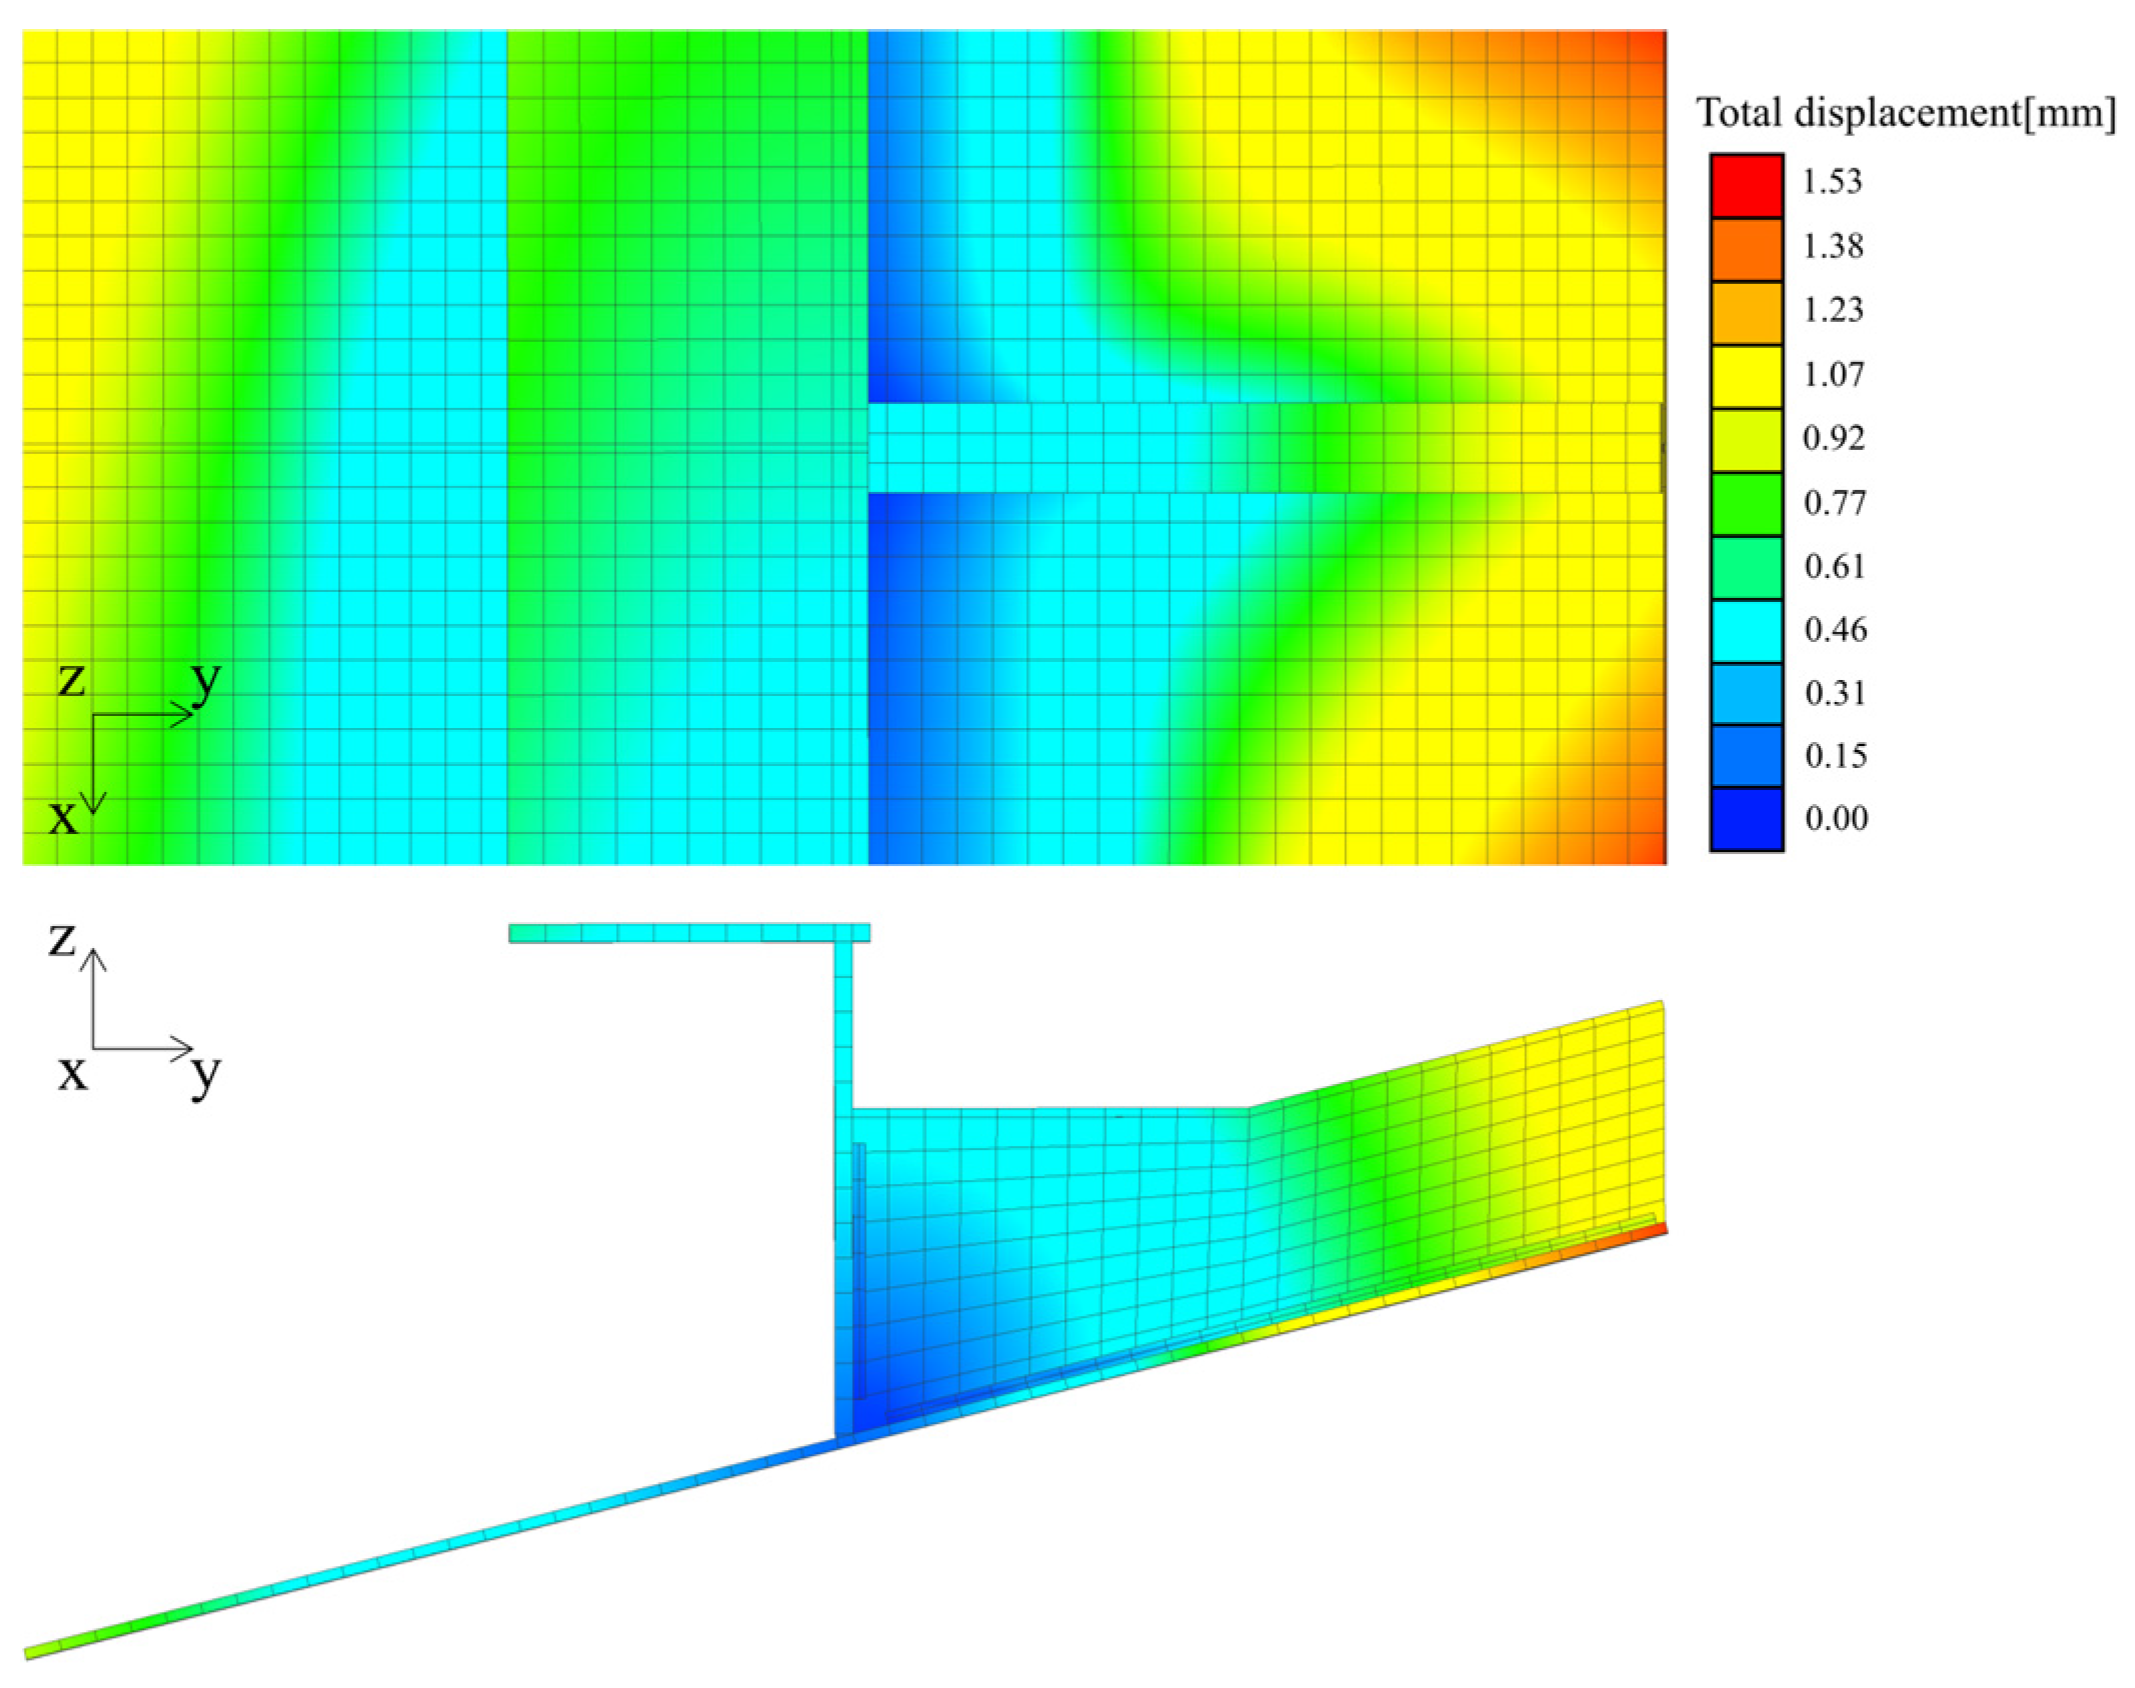
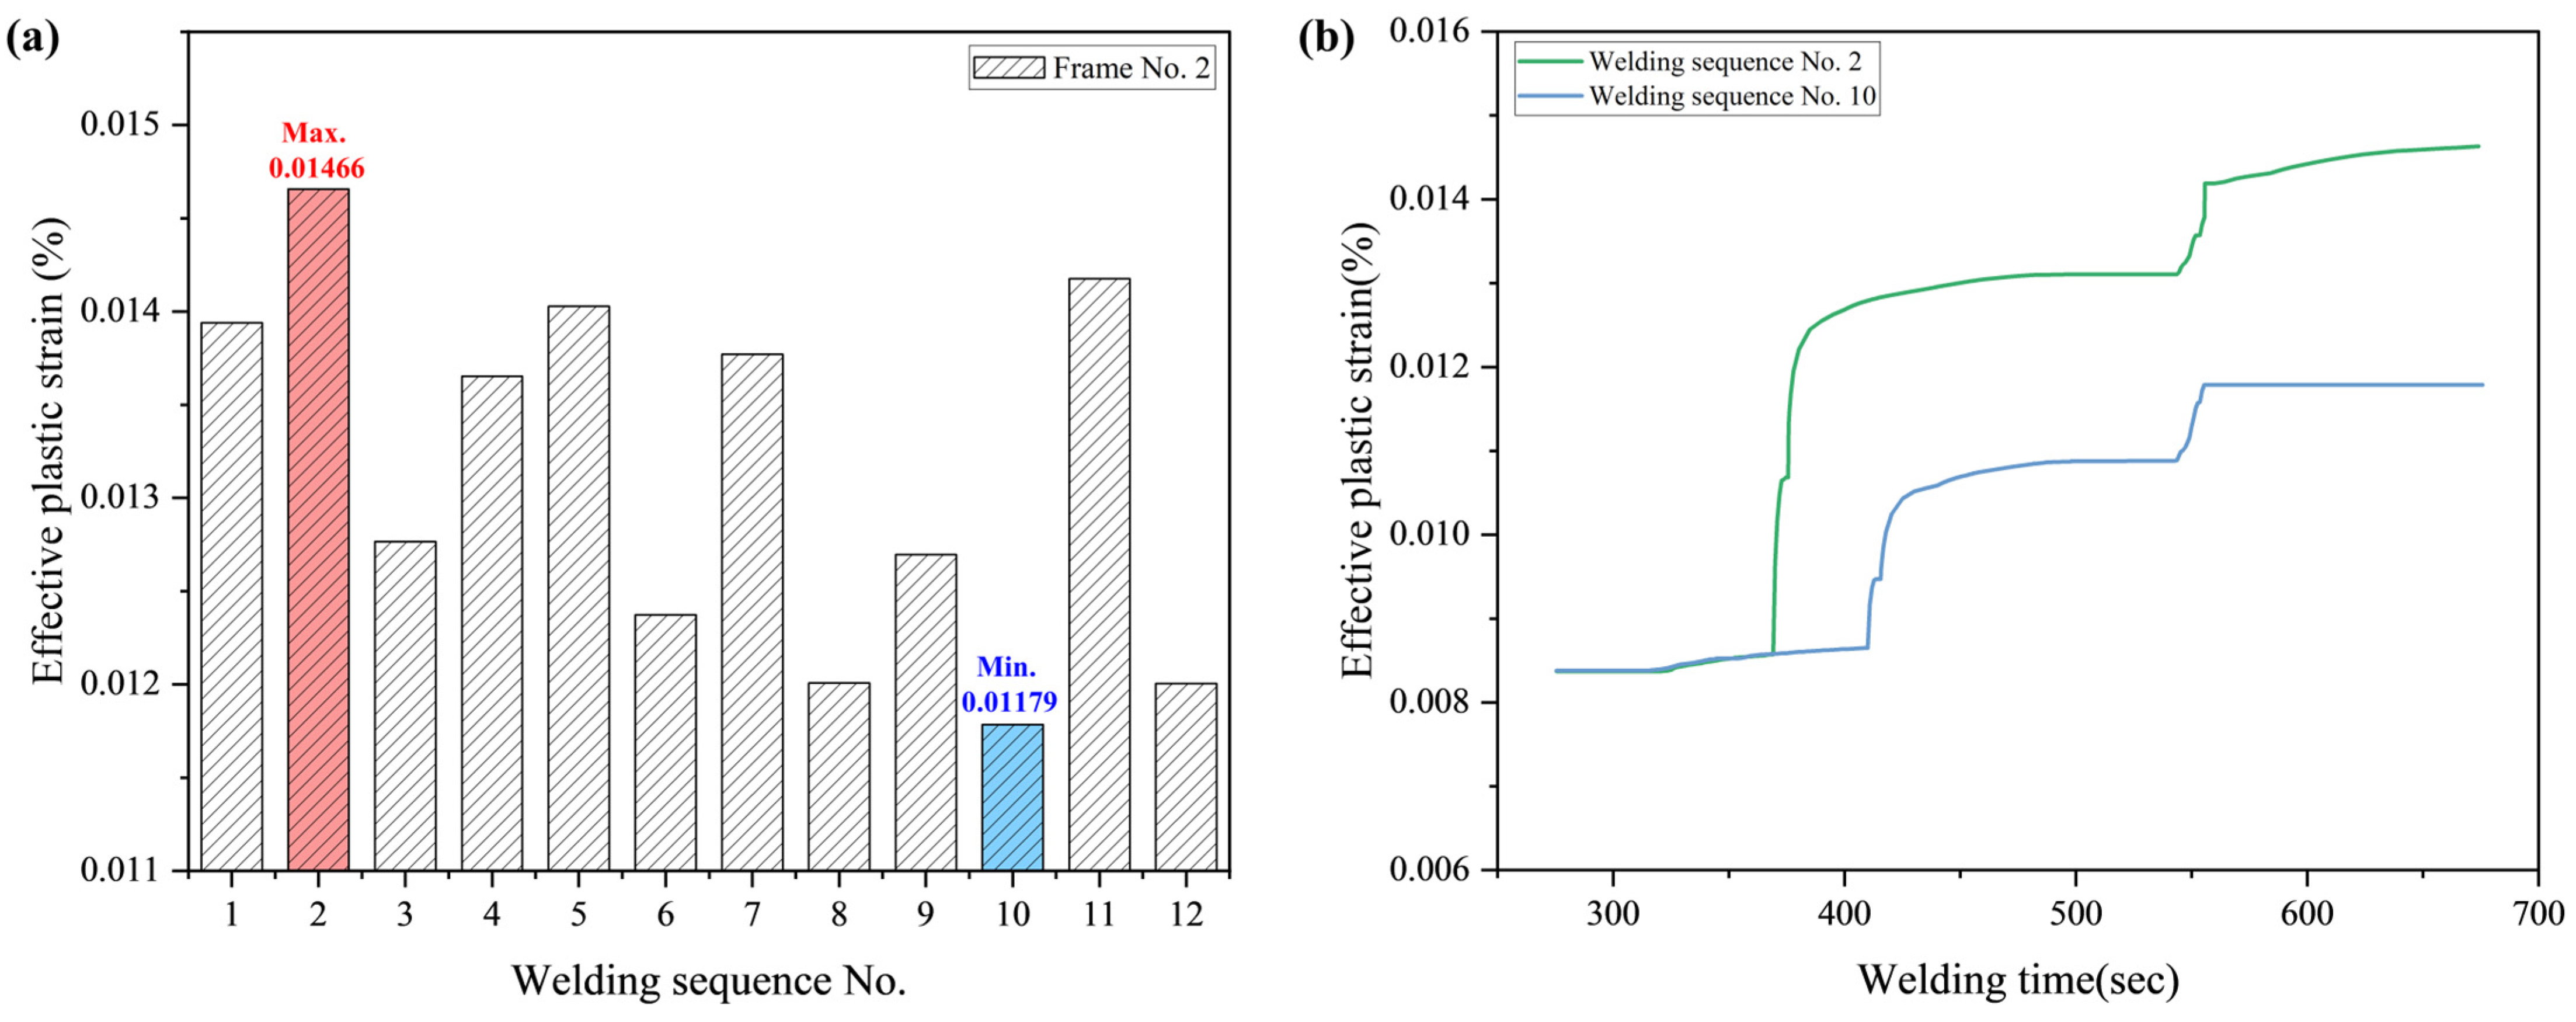
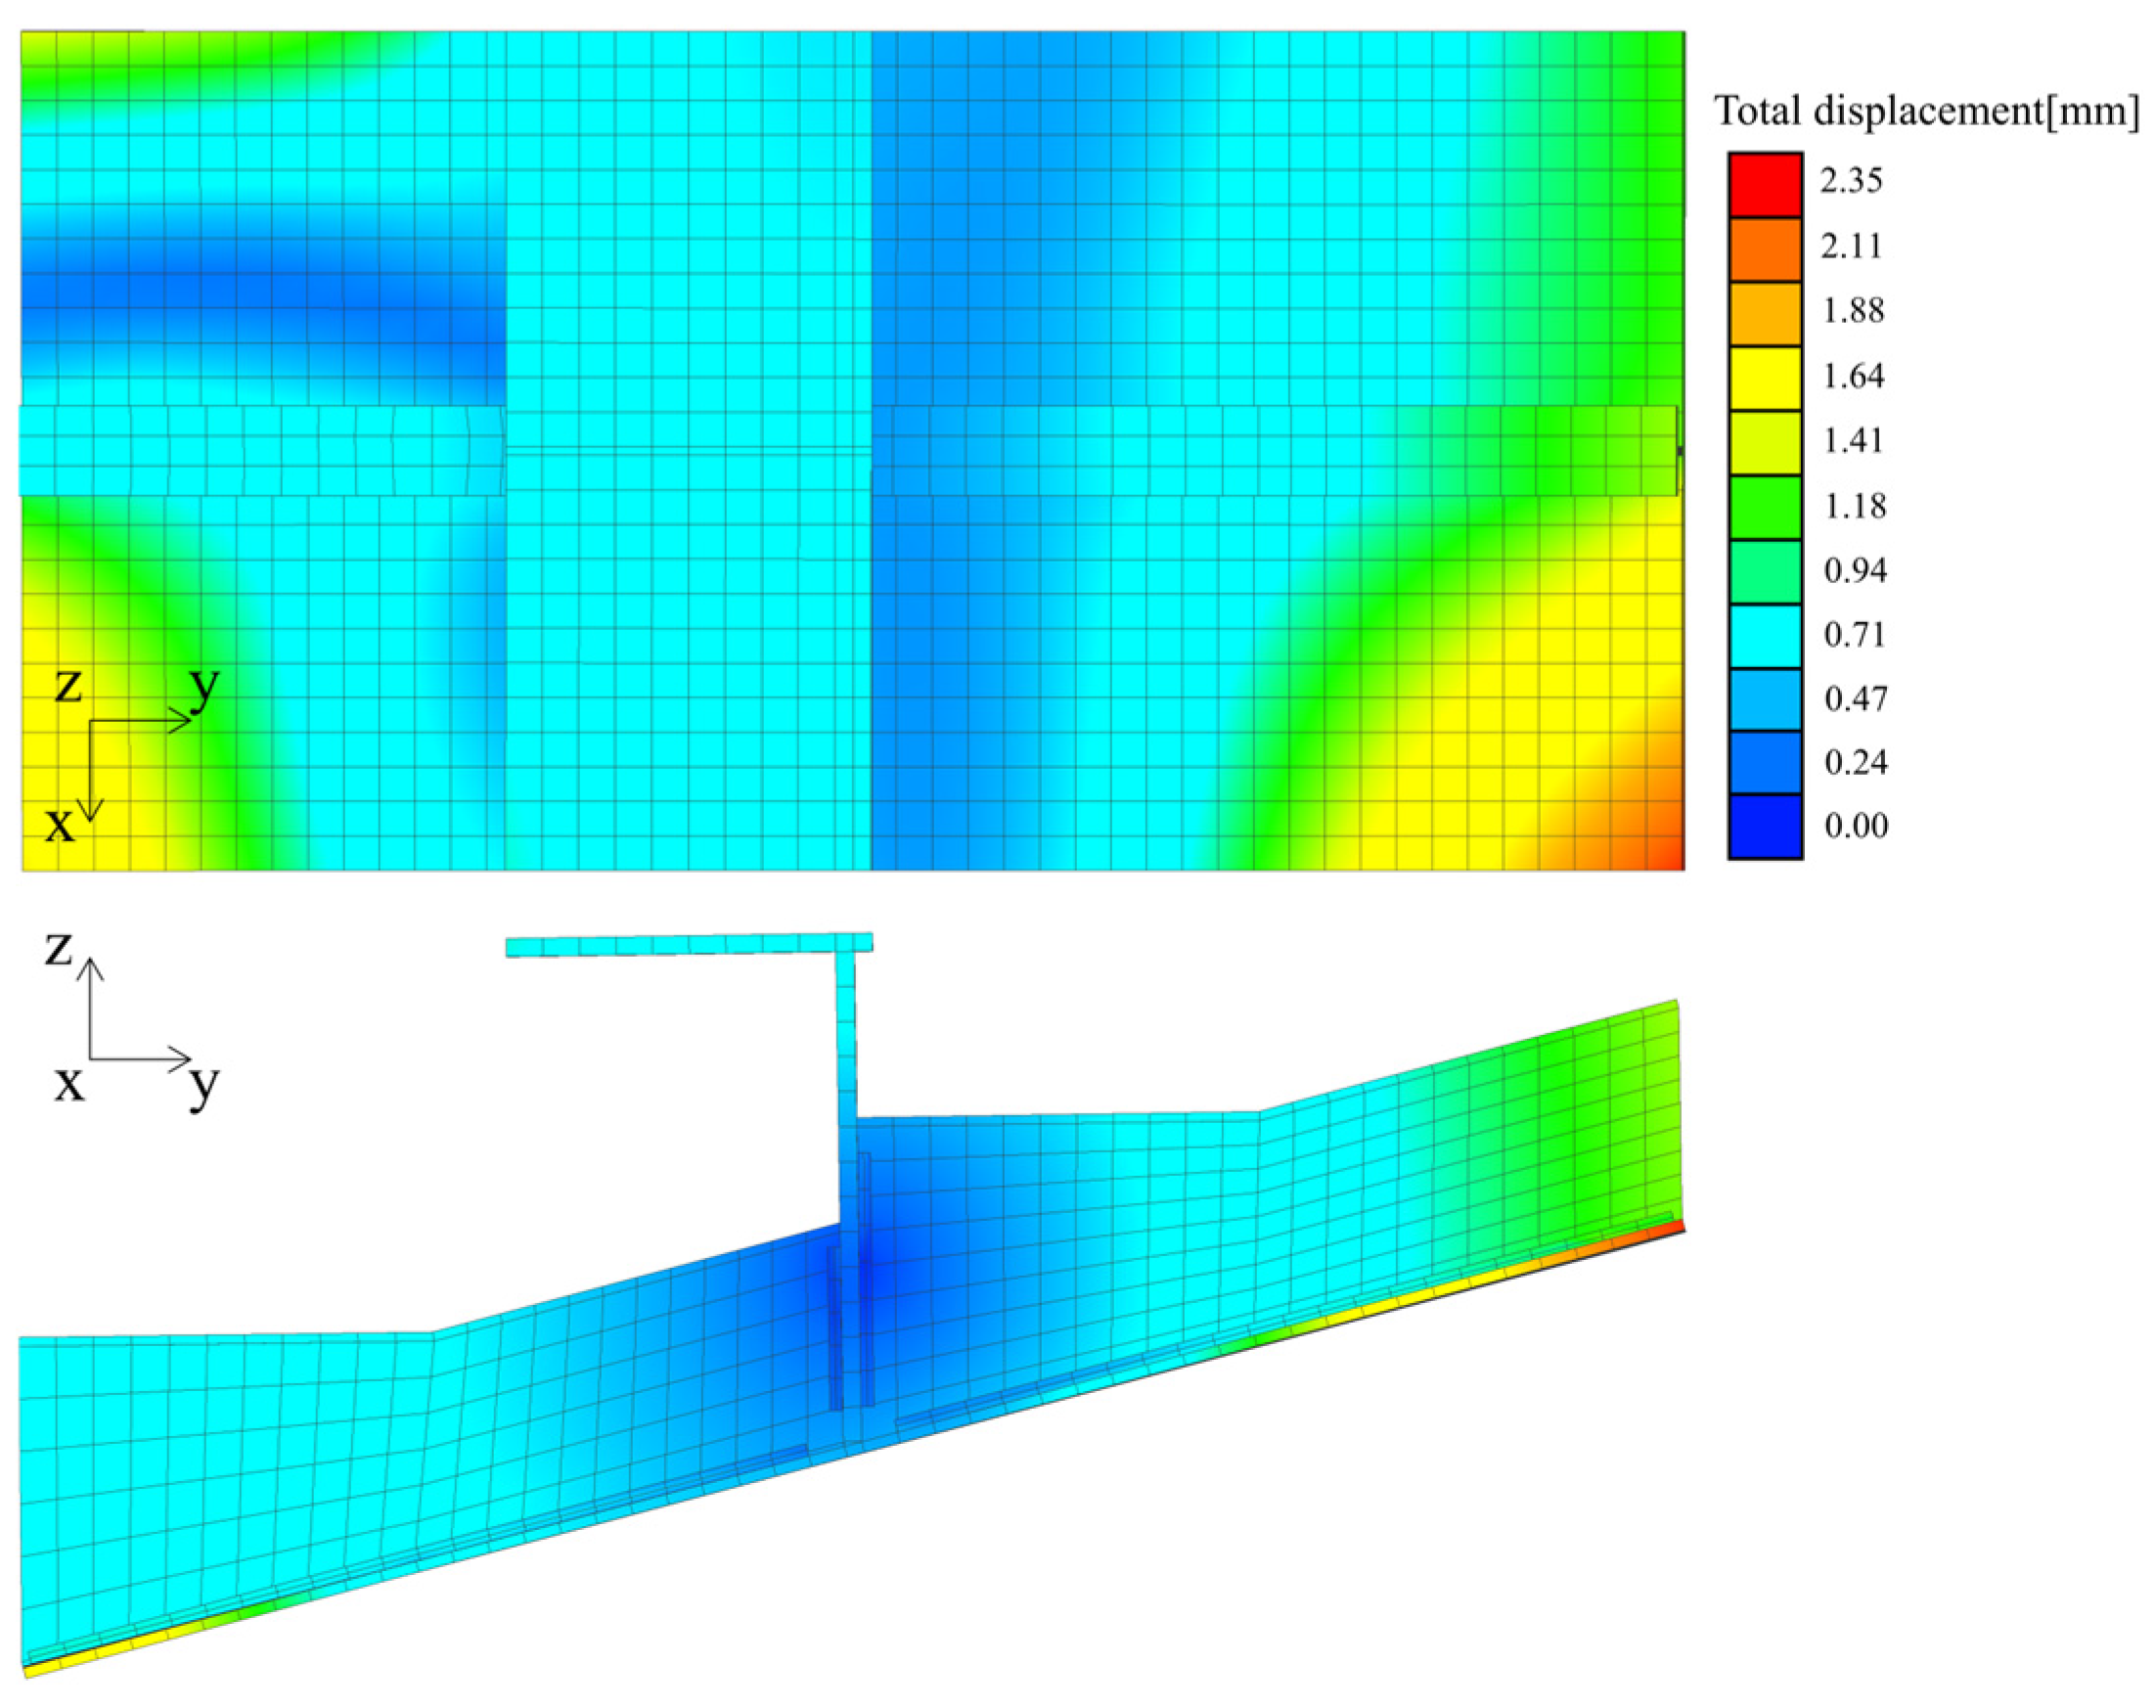
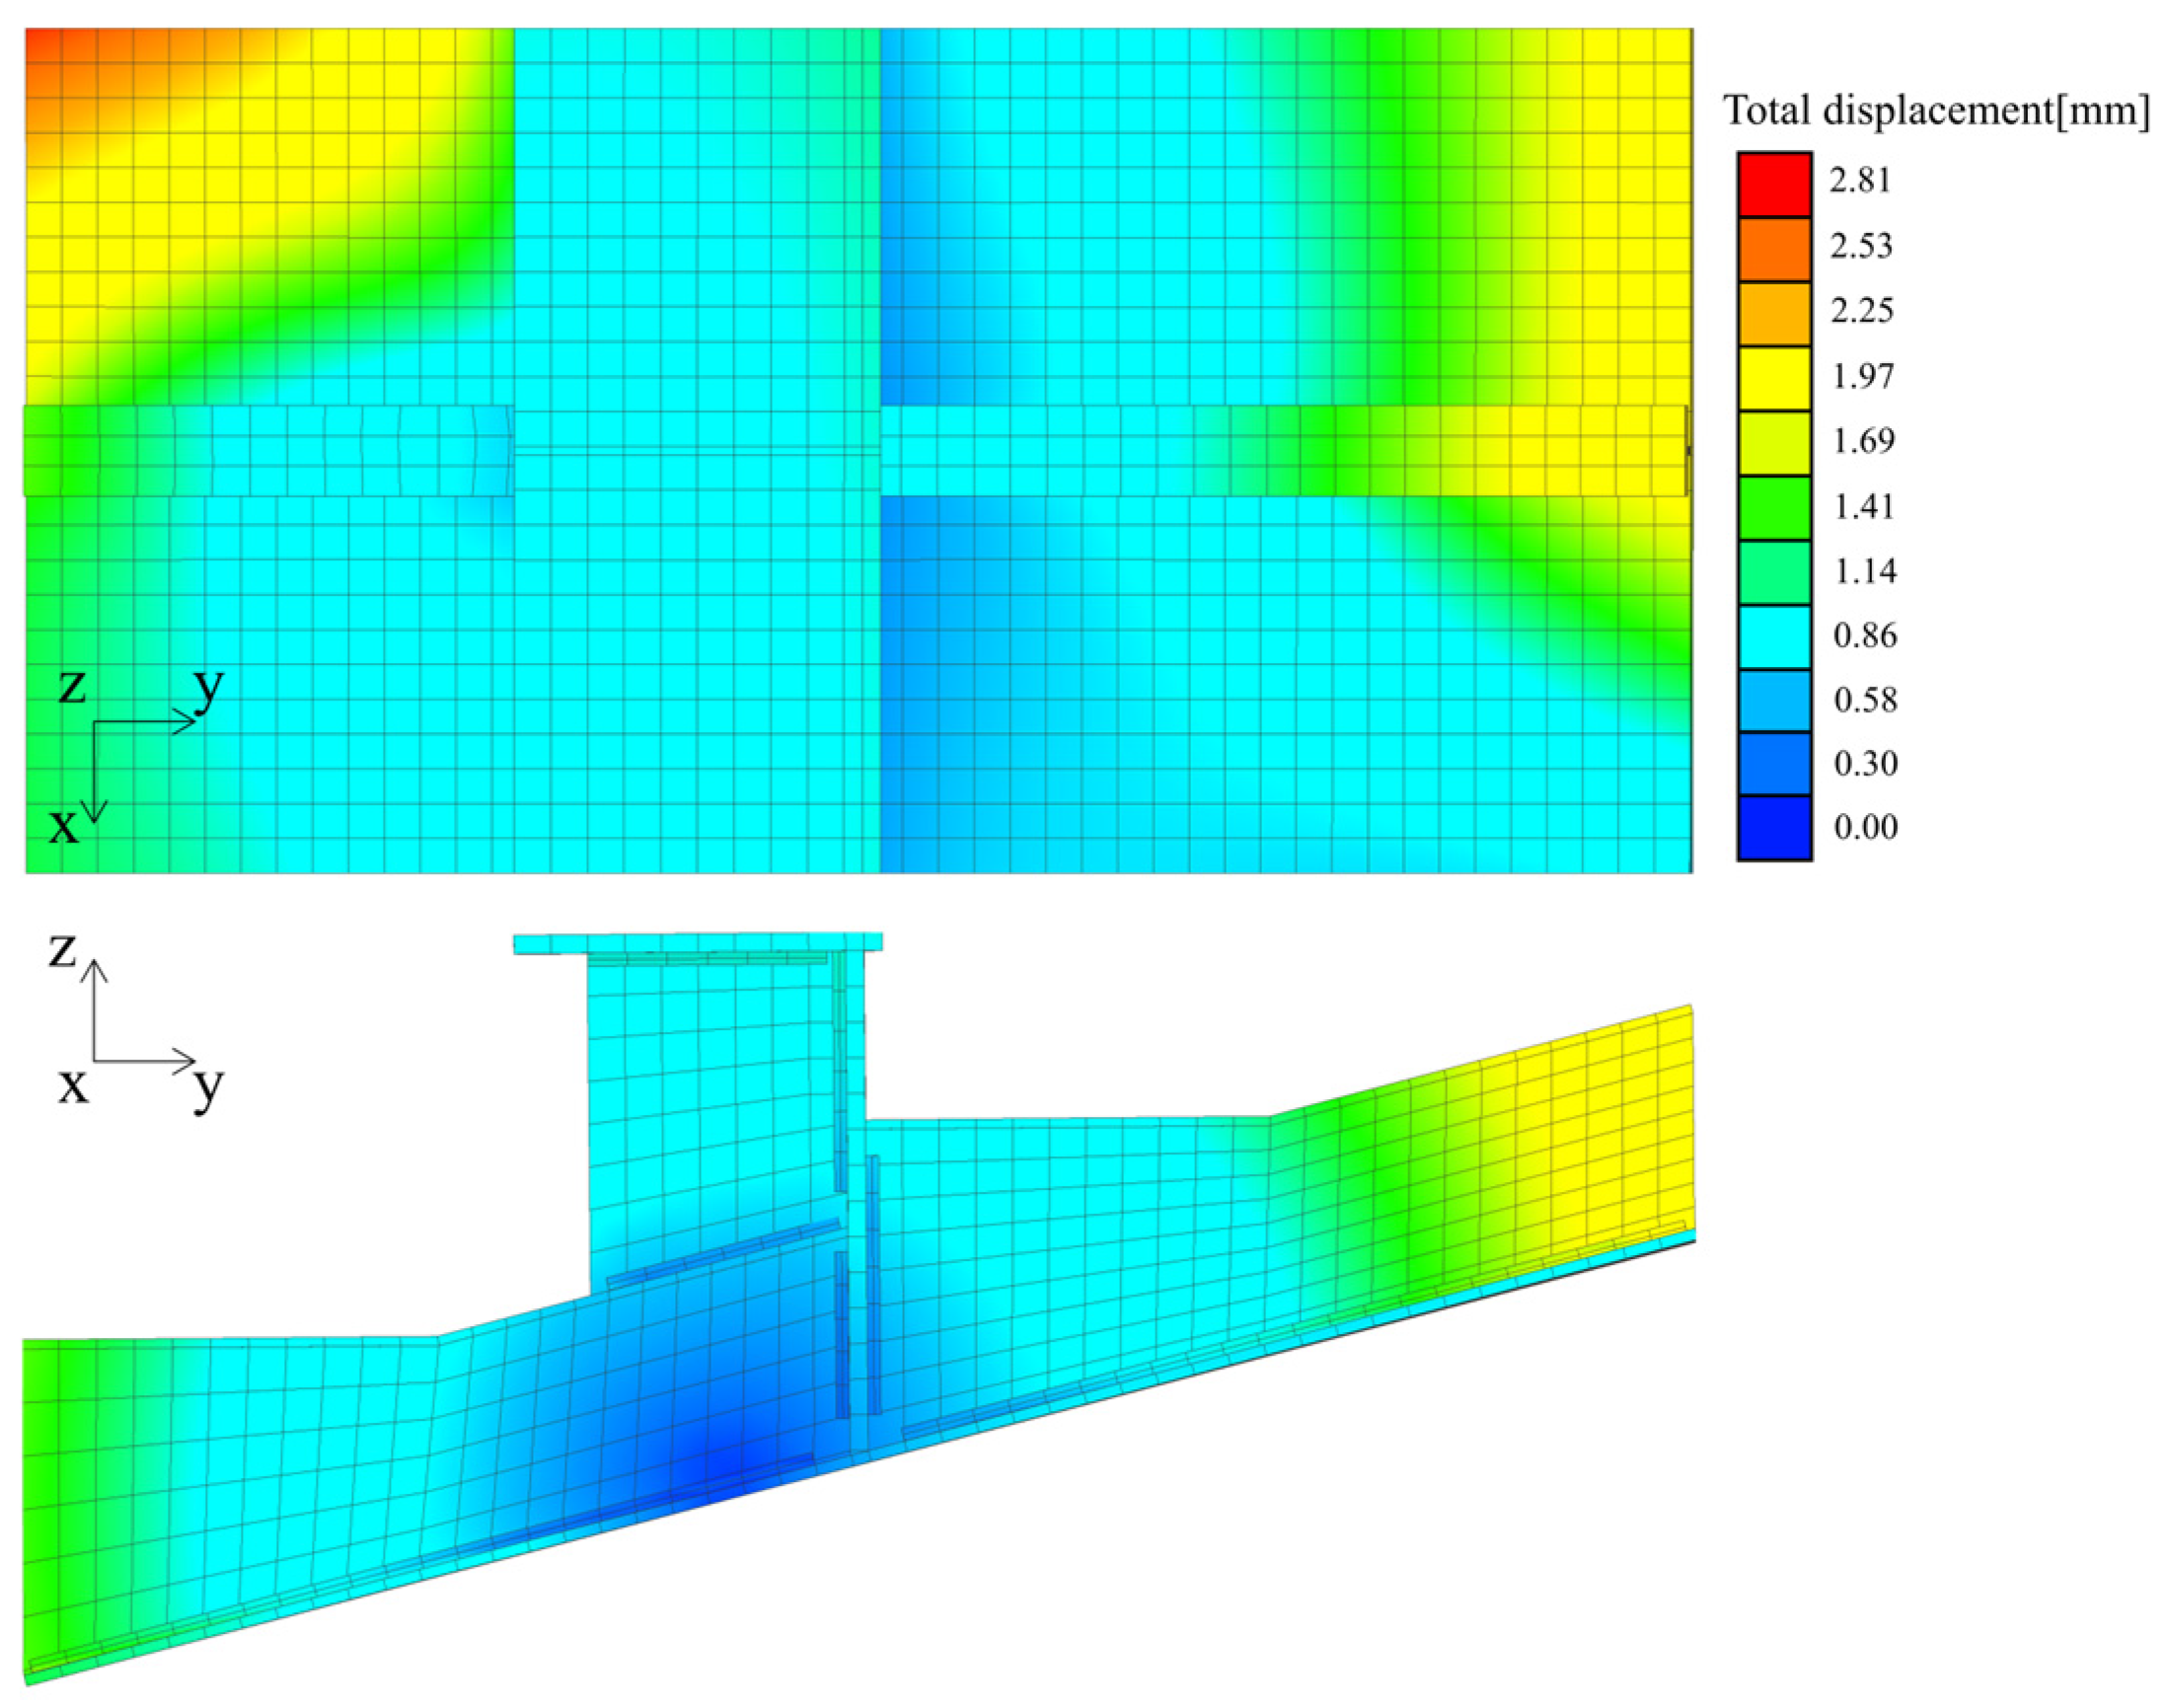
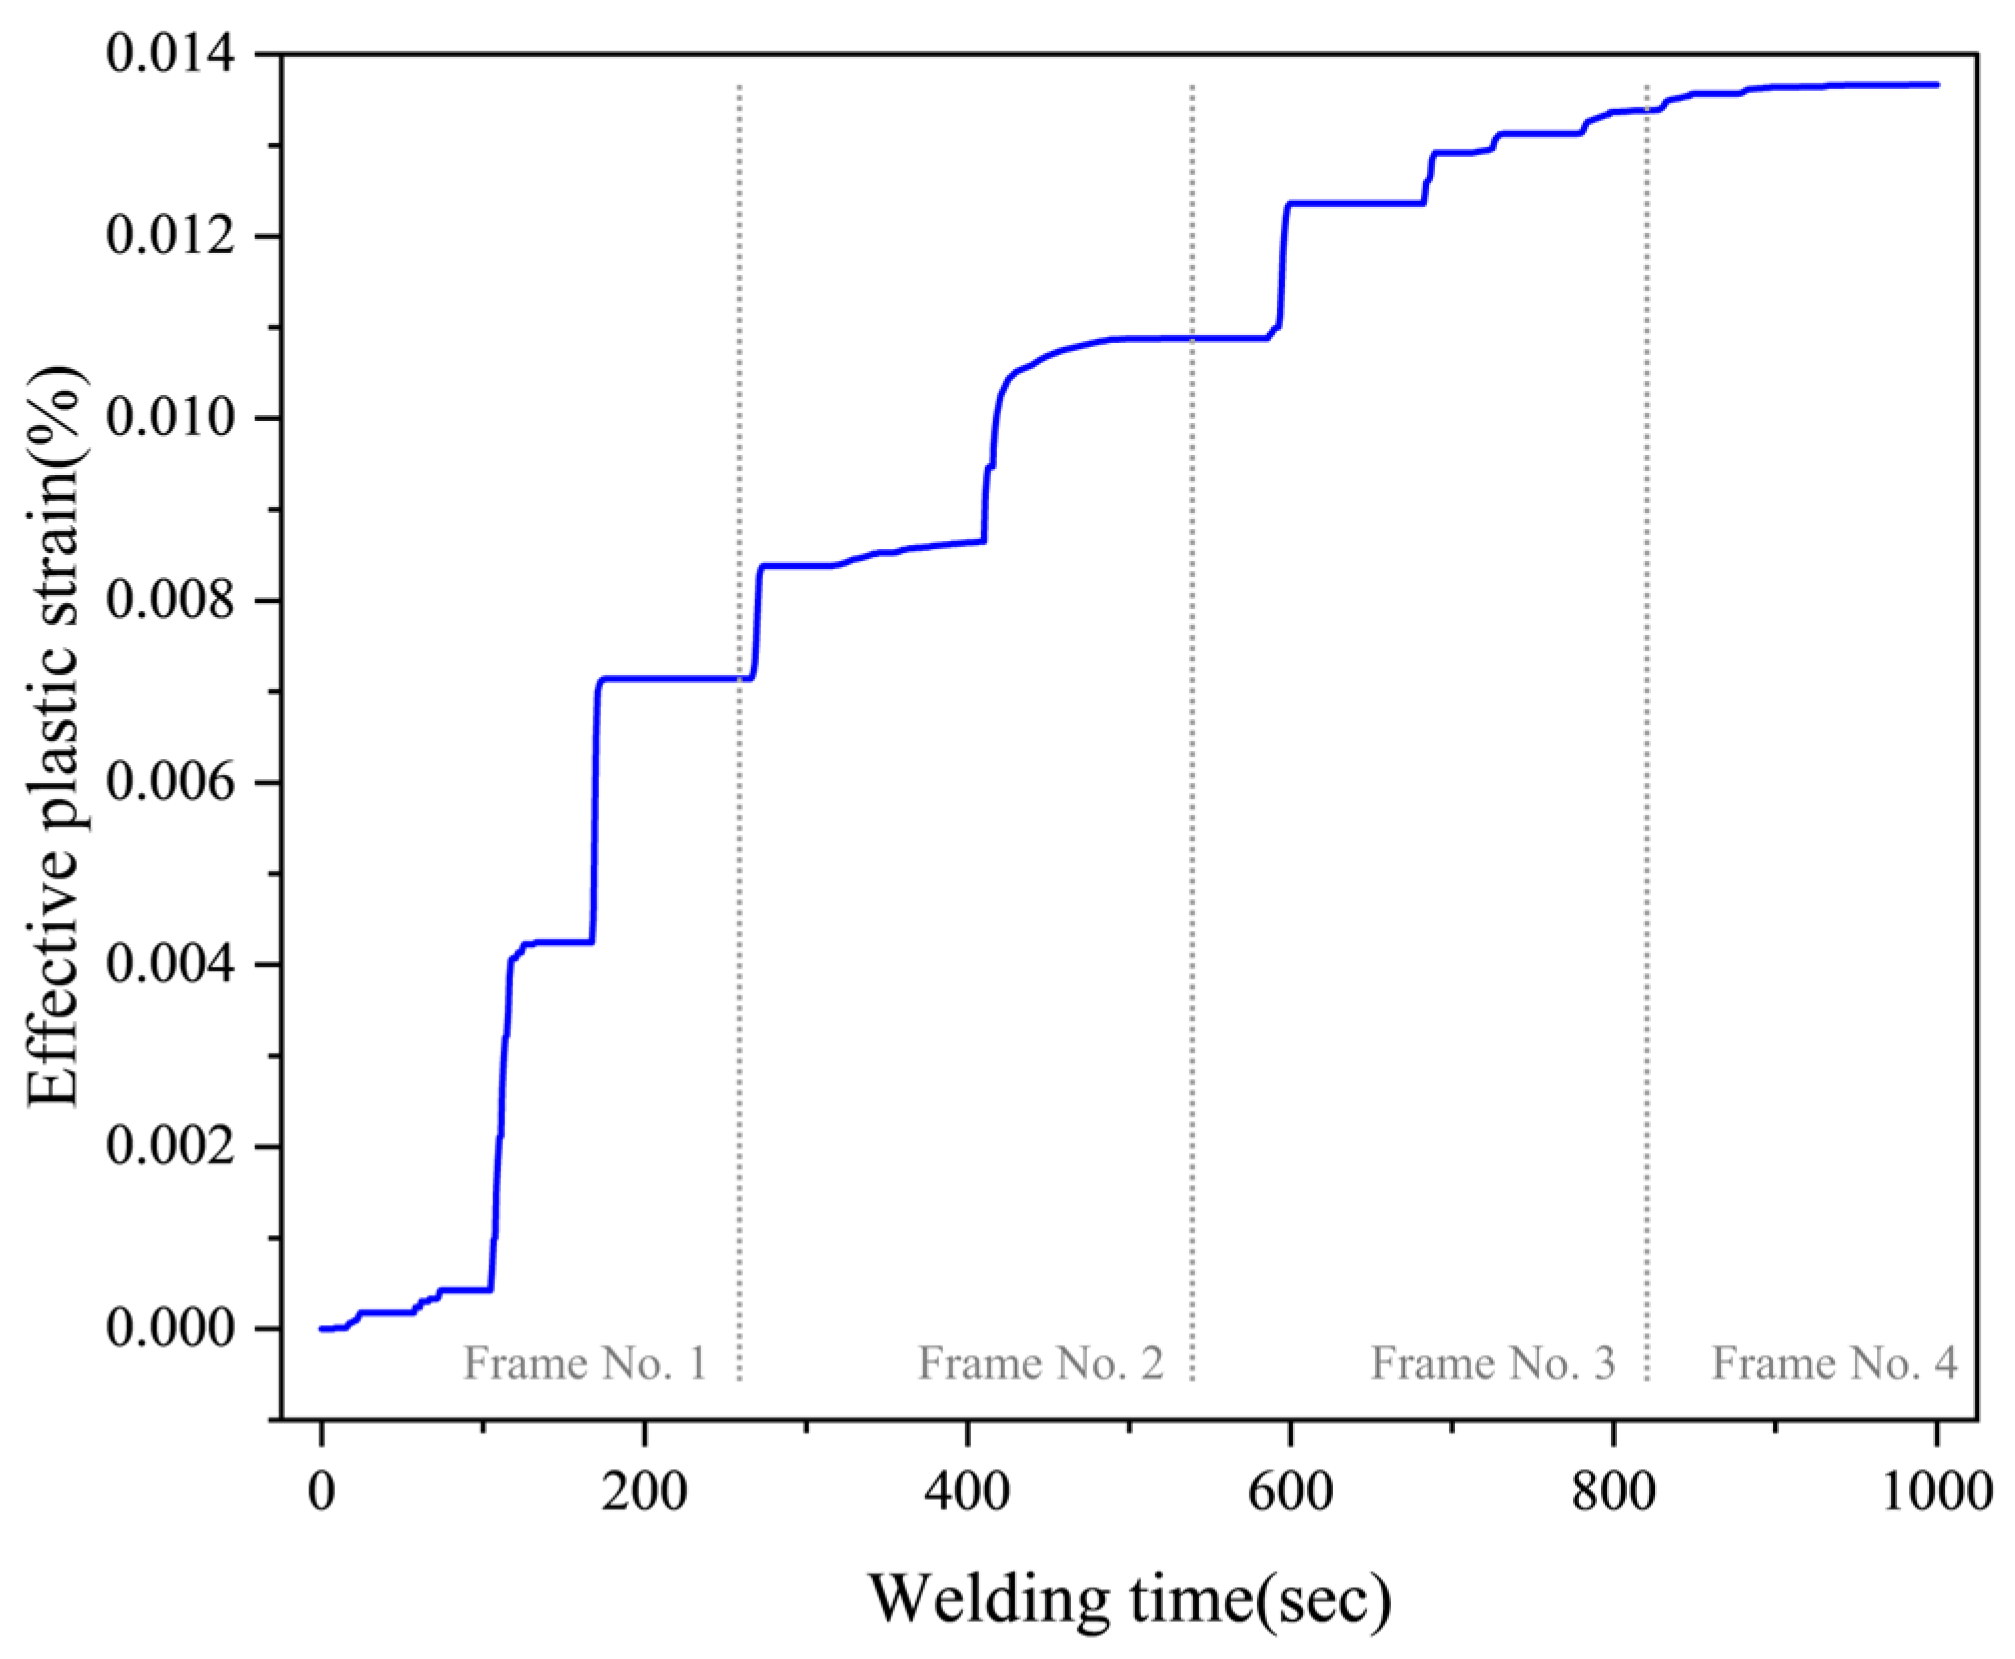
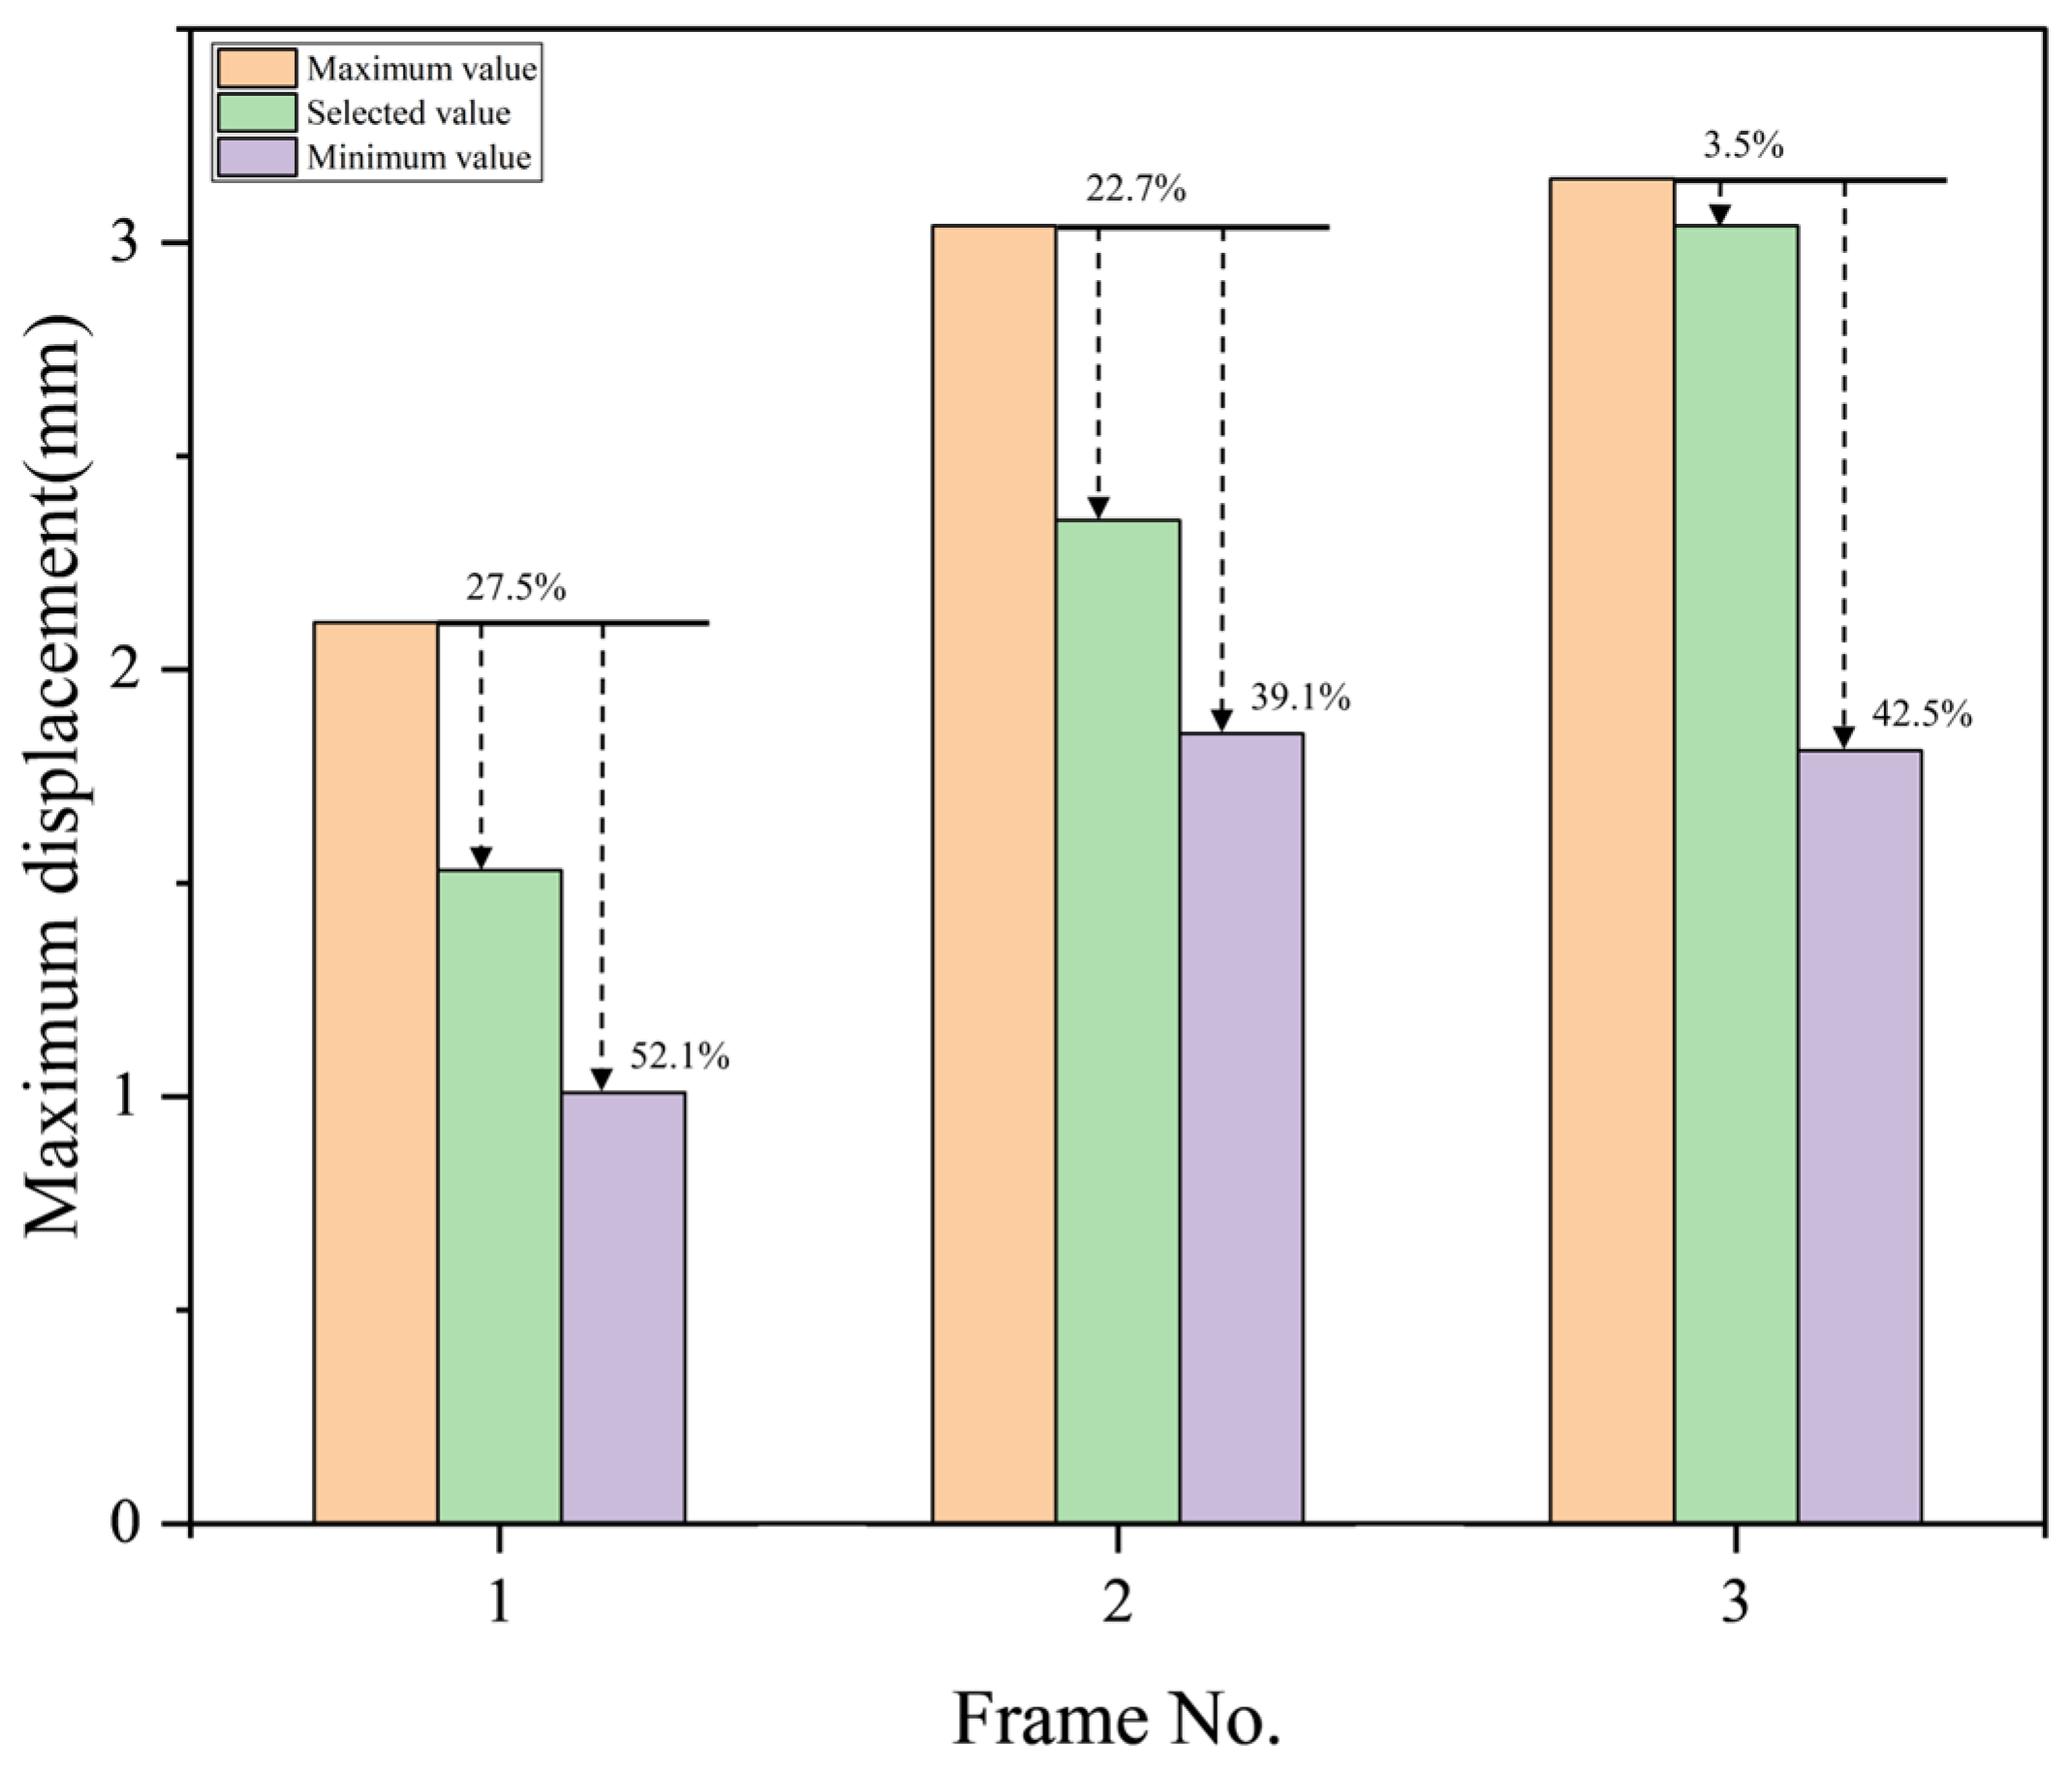
4.3. Simulation Results

To compare and analyze the effect of the welding sequence on the weld deformation, the deformation could be analyzed through the displacement results, but the displacement measured the deformation in a localized location and included the deformation in the elastic region. Since the displacement at one location could not be representative of the deformation for the entire structure, the effective plastic strain, which can represent the total deformation, was derived as a result of the deformation caused by the welding sequence of the simplified transverse model. The effective plastic strain is calculated with Equation (6):
2 3 i = 1 3 ( i j p ) 2
where i j p is the strain tensor of the material as it deforms, representing the strain in a three-dimensional space. According to the simulation results of frame 1, the maximum displacement showed a minimum of 1.01 mm and a maximum of 2.11 mm, depending on the welding sequence. The stress concentration was found to be at the end of the area where welding was performed. The effective plastic strain had the highest value in plan 4 and the lowest effective plastic strain in plan 11. The simulation results show that welding sequence plan 11 with the lowest effective plastic strain was the optimal welding sequence, resulting in a 4.8% reduction in effective plastic strain compared with the welding sequence with the highest effective plastic strain. Welding sequence plan 11, which was selected as the optimal welding sequence, showed a 27.5% reduction in the maximum displacement compared with the welding sequence which showed the maximum deformation. Figure 10 shows the effective plastic strain results of frame 1 according to the welding sequence conditions. Figure 11 shows the displacement simulation results of plan 11, which was selected as the optimal welding sequence.
According to the simulation results of the welding sequence for frame 2, including the simulation results of the welding deformation of frame 1, the maximum displacement showed a minimum deformation of 1.85 mm and a maximum deformation of 3.04 mm, depending on the welding sequence. The stress concentrations were at the ends of the area where the welds were performed, with an additional strain of 0.84–0.93 mm based on the displacement in frame 1. The effective plastic strain showed the highest value in plan 2 and the lowest effective plastic strain in plan 10. Weld sequence plan 10, with the lowest effective plastic strain, was the optimal welding sequence, with an effective plastic strain result 19.6% less than that of the welding sequence with the maximum effective plastic strain. Weld sequence plan 10 was selected as the optimal welding sequence, having a maximum displacement 22.7% less than the welding sequence with the maximum deformation. The effective plastic strain results for frame 2 are shown in Figure 12, and the displacement simulation results for welding sequence plan 10 for frame 2 are shown in Figure 13.
According to the simulation results for frame 3, which was performed after the simulations of frame 1 and 2 were completed, the maximum displacement showed a minimum of 1.81 mm and a maximum of 3.15 mm, depending on the welding sequence. The effective plastic strain had the highest value in plan 6 and the lowest effective plastic strain in plan 11. The simulation results show that weld sequence plan 11, with the lowest effective plastic strain, was the optimal welding sequence. The effective plastic strain was reduced by 13.2% compared with the welding sequence with the maximum effective plastic strain. Welding sequence plan 11, which was selected as the optimal welding sequence, had a 3.5% reduction in its maximum displacement compared with the welding sequence with the maximum deformation. Figure 14 shows the effective plastic strain results for frame 3. Figure 15 shows the displacement simulation results for plan 11, which was selected as the optimal welding sequence.
Finally, the simulation results for frame 4, performed after the simulation of frames 1–3 with minimal deformation was completed, showed a maximum displacement of 2.81 mm, and the stress concentration was found to be at the end of frame 2’s area. Figure 16 shows the displacement simulation results of the welding sequence conditions with minimal deformation. The effective plastic strain result was 0.013663%, and it was confirmed that there was no significant difference when compared with the minimum strain condition results of frames 2 and 3. Figure 17 shows the effective plastic strain results for a simplified transverse model of the aluminum hull bottom performed with the least deforming welding sequence conditions.

4.4. Results and Discussion

As a result of the welding simulation performed to compare and analyze the effect of the welding sequence on the weld deformation, it was found that there was a difference in the amount of deformation due to the welding sequence. The welding sequence condition which showed the least deformation was not the same for frames 1–3. The stress concentration results were all the same, with stress concentrated at the ends of the welded area. The minimum and maximum values of maximum displacement according to the welding sequence and the maximum displacement results for the optimal welding sequence conditions, selected based on the effective plastic strain results, are compared in Figure 18.
In frame 1, the change in welding sequence alone resulted in a decrease in the maximum displacement of about 52.1% and a decrease in the effective plastic strain of 4.8% in the minimum deformation condition compared with the maximum deformation condition. The simulation of the welding deformation of frame 1 showed that the effective plastic strain was relatively less when the first weld location was on the vertical plane than when it was on the bottom plane. The welds performed after the vertical plane of the front had lower effective plastic strain values if they were located at the rear rather than at the front. These results were attributed to the nature of frame 1, which involved welding unheated base metal, and the tendency of the deformation to be lopsided could be eliminated by alternating welding the front and rear to minimize the shrinkage stress generated by the weld bead.
In frame 2, the change in welding sequence alone resulted in a decrease in the maximum displacement of about 39.1% and a decrease in the effective plastic strain of 19.6% in the minimum deformation condition compared with the maximum deformation condition. Compared with the simulation results for frame 1, the percentage of maximum displacement decreased, but the effective plastic strain increased. These results were determined to be due to the welding of frame 1, performed before the welding of frame 2 in the actual welding process, which preheated the base material and reduced the shrinkage stress generated by the weld bead, resulting in a relatively small deviation in the maximum displacement. However, unlike the maximum displacement deviation in the elastic zone, which represents the deformation of the plastic zone by the actual weld, the effective plastic strain, which represents the deformation of the plastic zone by the actual weld, was found to increase with the number of welds, regardless of whether the base metal was preheated or not.
In frame 3, the maximum displacement was reduced by about 42.5% in the minimum deformation condition compared with the maximum deformation condition by changing the welding sequence alone. The effective plastic strain was reduced by 13.2%. In frame 3, the percentage increase in displacement was found to be lower compared with the simulation results of the weld deformation which occurred between the frame 1 and 2 conditions. This was determined to be due to the effect of the temperature deviation due to the preheating of the base metal being reduced as multiple welds were performed. The decrease in the percentage reduction of the effective plastic strain compared with frame 2 was due to the fact that the welding of frames 1 and 2 was performed in a butted position. Frame 3 was located higher than frames 1 and 2, and thus it was determined that this played a role in damping the deformation as the deformation occurred in the opposite direction of that which had previously appeared. Also, unlike frames 1 and 2, frame 3 had an additional side perpendicular to the bottom surface. It was determined that the growth trend of the effective plastic strain decreased due to the addition of a side supporting the vertical axis of the transverse model.
To analyze the effect of the welding sequence on deformation tendencies, the results for the effective plastic strain according to the welding sequence shown in frame 1 are presented in Figure 19. In frame 1, since preheating of the transverse model was not performed, the effect of the welding sequence on the deformation tendencies could clearly be observed. As seen in case 1 in Figure 19, the deformation varied depending on the welding order. The changes in effective plastic strain, which were divided into three parts based on the welding time, occurred because the welding length varied depending on the position of the transverse model. The results of the three effective plastic strain changes were categorized according to the lengths of the first and second welding positions. Additionally, case 2 shows the welding results for a shorter area. Under the welding sequence conditions, when the bottom surface, which was relatively longer than the vertical surface, was welded first, there was a significant change in the effective plastic strain. This confirms that the welding sequence causes changes in the effective plastic strain in areas with different weld lengths. In particular, in case 3, it was confirmed that there was a difference in effective plastic strain between the condition of welding a continuous side and the condition of welding the opposite side, two conditions under which the welding lengths of the “Short—Short—Long—Long” method were the same. These results quantitatively demonstrate that the welding sequence clearly affects welding deformation.
As a result of the simulation of weld deformation according to the welding sequence, it was found that regardless of the frame number, the welding sequence condition should start the weld based on the vertical plane rather than the bottom plane, and the second welding sequence should be performed on the opposite side of the plane where the first weld is located, which results in relatively less weld deformation. It was confirmed that in frames 1–3, the deformation was maximized when the first welding sequence was performed on the floor. Also, it was found that the maximum displacement was not minimized for the welding sequence conditions which minimized the effective plastic strain. These results indicate that the maximum displacement minimum condition for the welding sequence did not coincide with the effective plastic strain minimum condition, and the maximum displacement result was due to inclusion of the elastic region. The simulation results show that the maximum displacement of frame 4 was less than the maximum displacement of frame 3, indicating that as the number of welds increased, the plastic deformation increased, but the deformation in the elastic region could decrease.
The simulation results showed a maximum displacement difference of 52.1% to a minimum of 39.1% and an effective plastic strain difference of 19.6% to a minimum of 4.8%, depending on the frame, and these results indicate that the welding sequence is the main factor affecting the weld deformation of the structure. It is believed that welding deformation can be suppressed according to the welding sequence in actual welding.

5. Conclusions

In this study, a simulation model was developed based on the parameter conditions derived from the heat source dimensions and geometry obtained from the actual welding bead to predict the welding deformation for the transverse model of the aluminum hull bottom, and the following conclusions were drawn by predicting the deformation of a weld according to the welding sequence.
To review the appropriateness of the simulation conditions used in the deformation prediction model, the simulation results from the simplified weldment model were compared with the actual weld deformation measurements. As the welding-induced shrinkage stress acted on the weld bead, the deformation amount showed a similar tendency to the that for the welding-induced shrinkage stress acting on the weld bead, with deformation occurring in the upward direction where the welding was performed relative to the fixed center, showing a minimum difference of 0.07 mm and a maximum difference of 0.35 mm.
The results of the simulations confirmed the difference in the amount of deformation depending on the welding sequence. The welding sequence condition which showed the minimum deformation was not the same for frames 1–3, which were divided according to the transverse model geometry of the aluminum hull bottom. The stress concentration area was the same at the end of the area where welding was performed.
It was found that the maximum displacement could be reduced from a maximum of 52.1% to a minimum of 39.1% by changing the welding sequence condition, and the effective plastic strain could be reduced from a maximum of 19.6% to a minimum of 4.8%. Therefore, it was determined that welding sequence is a major factor affecting the welding deformation of a structure, and it is possible to suppress welding deformation according to the welding sequence of the actual welding.
The welding sequence conditions were selected based on the minimum effective plastic strain while simulating sequential weld deformation along the frame. The transverse model of the lower part of the aluminum hull, where all welds were completed, showed a maximum displacement of 2.81 mm and an effective plastic strain of 0.013663%.
In this study, it was shown that it is possible to predict the tendency of a weld to deform by using the dimensions of the heat source shape of the welded bead as a simulation condition. The simulation results show the difference in deformation of the welded structure depends on the welding sequence condition, and we believe that this can contribute to establishing welding conditions and deriving methods to reduce deformation.

Author Contributions

Conceptualization, J.K.; data curation, C.L.; formal analysis, S.W.; investigation, C.L.; methodology, C.L.; project administration, J.K.; software, S.W.; supervision, J.K.; writing—original draft, C.L.; writing—review and editing, C.L., S.W. and J.K. All authors have read and agreed to the published version of the manuscript.

Funding

This study was supported by the “Hydrogen Fuel Cell-Based Leisure Ship Construction Demonstration Project” in Jeollanam-do and Yeongam-gun.

Institutional Review Board Statement

Not applicable.

Informed Consent Statement

Not applicable.

Data Availability Statement

Data is contained within the article.

Conflicts of Interest

The authors declare no conflict of interest.

References

  1. Hosseinabadi, O.F.; Khedmati, M.R. A Rreview on Ultimate Strength of Aluminium Structural Elements and Systems for Marine Applications. Ocean Eng. 2021, 232, 109153. [Google Scholar] [CrossRef]
  2. Wang, X.; Yu, Z.; Amdahl, J. Ultimate Strength of Welded Aluminium Stiffened Panels Under Combined Biaxial and Lateral Loads: A Numerical Investigation. Mar Struct. 2024, 97, 103654. [Google Scholar] [CrossRef]
  3. Xu, S.; Ma, J.; Lv, Y.; Shen, W.; Wu, Y.; Li, M. Fatigue Strength of Welded Joints of Marine Aluminum Alloy Extrusion Stiffened Plate Considering Welding Effects. Ocean Eng. 2024, 310, 118755. [Google Scholar] [CrossRef]
  4. Xavier, J.R.; Vinodhini, S.P.; Ramesh, B. Optimizing Aluminum Alloy Performance for Marine Superstructures: Advanced Nanocomposite Coating for Enhanced Corrosion Resistance, Flame Retardancy, and Mechanical Strength. Polym. Degrad. Stab. 2024, 227, 110847. [Google Scholar] [CrossRef]
  5. Kleppe, S.; Aalberg, A.; Langseth, M.; Fyllingen, Ø. Buckling Behavior of a Transversely Stiffened Aluminum Beam Flange. Ocean Eng. 2024, 307, 117960. [Google Scholar] [CrossRef]
  6. Ahmed, S.; Rahman, R.A.U.; Awan, A.; Ahmad, S.; Akram, W.; Amjad, M.; Yahya, M.Y.; Rahimian Koloor, S.S. Optimization of Process Parameters in Friction Stir Welding of Aluminum 5451 in Marine Applications. J. Mar. Sci. Eng. 2022, 10, 1539. [Google Scholar] [CrossRef]
  7. Wu, C.; Kim, J.W. Numerical Prediction of Deformation in Thin-Plate Welded Joints Using Equivalent Thermal Strain Method. Thin-Walled Struct. 2020, 157, 107033. [Google Scholar] [CrossRef]
  8. Woo, D.; Kitamura, M.; Takezawa, A. Systematic method for positioning clamps and strongbacks based on their influence on welding displacements. Ocean Eng. 2020, 202, 107084. [Google Scholar] [CrossRef]
  9. Khajeian, A.; Mahmoudi, A.H.; Mehmanparast, A. Shot Peening Effects on Residual Stresses Redistribution of Offshore Wind Monopile Multi-Pass Weldments. Mar Struct. 2019, 66, 106–120. [Google Scholar] [CrossRef]
  10. Jang, H.L.; Ryu, H.; Kang, S. A Study on the Effects of Welding Deformation According to Weld Sequence in Overlay-Welded Structures. Metals 2024, 14, 684. [Google Scholar] [CrossRef]
  11. Sun, J.; Nitschke Pagel, T.; Dilger, K. Influence of Strain-Hardening Models and Slopes on the Predicted Residual Stresses in Structural Steel S235 Weldments. J. Mater. Res. Technol. 2022, 19, 4044–4062. [Google Scholar] [CrossRef]
  12. Wahidi, S.I.; Oterkus, S.; Oterkus, E. Simulation of a Ship’s Block Panel Assembly Process: Optimizing Production Processes and Costs through Welding Robots. J. Mar. Sci. Eng. 2023, 11, 1506. [Google Scholar] [CrossRef]
  13. Woo, D.; Kitamura, M. Numerical Prediction of Welding Distortion Considering Gravity Force on General Ship Grillage Structure by Elastic Finite Element Method Using Inherent Strain. J. Mar. Sci. Eng. 2020, 8, 454. [Google Scholar] [CrossRef]
  14. Bhatti, A.A.; Barsoum, Z.; Murakawa, H.; Barsoum, I. Influence of Thermo-Mechanical Material Properties of Different Steel Grades on Welding Residual Stresses and Angular Distortion. Mater. Des. 2015, 65, 878–889. [Google Scholar] [CrossRef]
  15. Kim, Y.; Kim, J.; Kang, S. A Study on Welding Deformation Prediction for Ship Blocks Using the Equivalent Strain Method Based on Inherent Strain. Appl. Sci. 2019, 9, 4906. [Google Scholar] [CrossRef]
  16. Yi, J.; Chen, Z.; Li, D.; Li, J.; Liu, J. Conditional generative adversarial network for welding deformation field prediction of butt-welded plates. J. Constr. Steel Res. 2022, 201, 107755. [Google Scholar] [CrossRef]
  17. Han, Y.H.; Lim, H.B.; Shin, T.S.; Yang, H.I. Prediction of Welding Deformation Using the Thermal Elastic–Plastic Finite Element Method by Considering Welding Interpass Temperature. Materials 2024, 17, 3656. [Google Scholar] [CrossRef]
  18. Li, L.; Luo, C.; Shen, J.; Zhang, Y. Numerical Prediction of Welding Deformation in Ship Block Subassemblies Via the Inhomogeneous Inherent Strain Method. J. Manuf. Process. 2022, 80, 860–873. [Google Scholar] [CrossRef]
  19. Murakawa, H.; Deng, D.; Ma, N.; Wang, J. Applications of inherent strain and interface element to simulation of welding deformation in thin plate structures. Comput. Mater. Sci. 2012, 51, 43–52. [Google Scholar]
  20. Lee, J.; Perrera, D.; Chung, H. Multi-Pass Welding Distortion Analysis Using Layered Shell Elements Based on Inherent Strain. J. Mar. Sci. Eng. 2021, 9, 632. [Google Scholar] [CrossRef]
  21. Ji, H.; Ma, J.; Wu, J. Analysis and Control of Welding Deformation for CFETR Vacuum Vessel PS2. Fusion Eng. Des. 2020, 154, 111521. [Google Scholar] [CrossRef]
  22. Wu, C.; Wang, C.; Kim, J.W. Welding Sequence Optimization to Reduce Welding Distortion Based on Coupled Artificial Neural Network and Swarm Intelligence Algorithm. Eng. Appl. Artif. Intell. 2022, 114, 105142. [Google Scholar] [CrossRef]
  23. Liu, B.; Yang, J.; Li, J.; Liao, X.; Yang, Q.; Zhang, J.; Hu, T.; Jiang, S. Research on Welding Deformation Control Technology of Battery Electric Vehicle Framed Aluminum Body. Prog. Nat. Sci. Mater. Int. 2024, 34, 108–121. [Google Scholar] [CrossRef]
  24. Meng, F.L.; Liu, A.G. Numerical Simulation for Residual Stress and Deformation of Surface Welding on Membrane Water-Wall. Appl. Mech. Mater. 2014, 490, 594–599. [Google Scholar] [CrossRef]
  25. Xu, F.; Zhao, Y.; Chen, J.; Liu, X.; Huang, Y. Experimental and Numerical Investigation on Residual Stress and Deformation of Welded I-Section Curved Steel Beams. Thin-Walled Struct. 2024, 199, 111821. [Google Scholar] [CrossRef]
  26. Moslemi, N.; Abdi, B.; Gohari, S.; Sudin, I.; Redzuan, N.; Ayob, A.; Ahmed, M.; Rhee, S.; Burvill, C. Influence of Welding Sequences on Induced Residual Stress and Distortion in Pipes. Constr. Build. Mater. 2022, 342, 127995. [Google Scholar] [CrossRef]
  27. Sun, J.; Dilger, K. Influence of Welding Sequence and External Restraint on Buckling Distortion in Thin-Plate Arc-Welded Joints. J. Adv. Join. Process. 2023, 8, 100157. [Google Scholar] [CrossRef]
  28. Wang, Y.; Feng, G.; Pu, X.; Deng, D. Influence of Welding Sequence on Residual Stress Distribution and Deformation in Q345 Steel H-Section Butt-Welded Joint. J. Mater. Res. Technol. 2024, 32, 1–12. [Google Scholar] [CrossRef]
  29. Gao, Z.; Han, B.; Li, L.; Ma, G.; Niu, S. Numerical Simulation of Residual Stress in Post internal-Welding Process of Bimetal Composite Pipe and Optimization of Welding Sequence. Int. J. Pres. Ves. Pip. 2022, 199, 104730. [Google Scholar] [CrossRef]
  30. Li, C.; Zhai, H.; Liu, Z.; Ma, J.; Ji, H.; Liu, Q. Suppressing Welding Deformation Instability of Vacuum Vessel Considering External Restraint and Welding Sequence. Fusion Eng. Des. 2023, 196, 114007. [Google Scholar] [CrossRef]
  31. Su, Y.; Yang, X.; Wu, D.; Meng, T.; Li, W.; Feng, W.; Vairis, A. Optimizing Welding Sequence of TIG Cross-Joint of Invar Steel Using Residual Stresses and Deformations. J. Manuf. Process. 2023, 105, 232–245. [Google Scholar] [CrossRef]
  32. Woo, D.; Kitamura, M.; Takezawa, A. Method to systemically order welding sequence to efficiently mitigate welding displacement of a general ship grillage structure. Ships Offshore Struct. 2019, 15, 753–768. [Google Scholar] [CrossRef]
  33. Pyo, C.; Jeong, S.M.; Kim, J.; Park, M.; Shin, J.; Kim, Y.; Son, J.; Kim, J.H.; Kim, M.H. A Study on the Enhanced Process of Elaborate Heat Source Model Parameters for Flux Core Arc Welding of 9% Nickel Steel for Cryogenic Storage Tank. J. Mar. Sci. Eng. 2022, 10, 1810. [Google Scholar] [CrossRef]
  34. Goldak, J.; Chakravarti, A.; Bibby, M. A New Finite Element Model for Welding Heat Sources. Metall. Trans. B 1984, 15, 299–305. [Google Scholar] [CrossRef]
Figure 1. Properties of Al5083 as a function of the temperature: (a) thermal conductivity; (b) expansion coefficient; (c) specific heat; and (d) latent heat.
Jmse 12 01604 g001
Figure 2. Goldak model and heat source geometry of the weld bead. (a) Heat distribution of Goldak model; (b) Heat source geometry and dimensions of the welding bead.
Jmse 12 01604 g002
Figure 3. Simulation model used to select arc efficiency conditions.
Jmse 12 01604 g003
Figure 4. Comparison of bead geometry with simulation results.
Jmse 12 01604 g004
Figure 5. Simulated and actual weld deformation measurement results.
Jmse 12 01604 g005
Figure 6. Welding deformation simulation location and FEM model for an aluminum hull.
Jmse 12 01604 g006
Figure 7. Simplified transverse model divided into frames.
Jmse 12 01604 g007
Figure 8. Welding sequence conditions by frame.
Jmse 12 01604 g008
Figure 9. Simulation boundary conditions.
Jmse 12 01604 g009
Figure 10. Effective plastic strain results for frame 1: (a) welding sequence conditions and (b) welding time conditions.
Jmse 12 01604 g010
Figure 11. The displacement simulation results for plan 11 in frame 1.
Jmse 12 01604 g011
Figure 12. Effective plastic strain results for frame 2: (a) welding sequence conditions and (b) welding time conditions.
Jmse 12 01604 g012
Figure 13. The displacement simulation results for plan 10 in frame 2.
Jmse 12 01604 g013
Figure 14. Effective plastic strain results for frame 3: (a) welding sequence conditions and (b) welding time conditions.
Jmse 12 01604 g014
Figure 15. The displacement simulation results for plan 11 in frame 3.
Jmse 12 01604 g015
Figure 16. Displacement simulation results for welding sequence conditions with minimal deformation.
Jmse 12 01604 g016
Figure 17. Effective plastic strain results for optimal weld sequence conditions.
Jmse 12 01604 g017
Figure 18. Maximum displacement results.
Jmse 12 01604 g018
Figure 19. Function of welding sequence on deformation tendency.
Jmse 12 01604 g019
Table 1. Chemical composition (wt.%) of Al5183 material.
FeMgSiAl
0.984.50.97Bal.
Table 2. Chemical composition (wt.%) of Al5083 material.
FeMgSiCuMnMgCrZnTiAl
0.294.80.060.030.674.80.10.010.02Bal.
Table 3. Process variables used in the experiment.
VariableLevel
Current (A)177
Voltage (V)20.7
Welding speed (cm/min)30
CTWD (mm)15
Bead working angle (°)45
Shielding gas 99.9% Ar
Flow rate (L/min)20
Table 4. Scheme design of welding sequence.
NumberWelding SequenceNumberWelding Sequence
11-2-3-472-1-3-4
21-2-4-382-1-4-3
31-3-2-492-3-1-4
41-3-4-2102-3-4-1
51-4-2-3112-4-1-3
61-4-3-2122-4-3-1
Disclaimer/Publisher’s Note: The statements, opinions and data contained in all publications are solely those of the individual author(s) and contributor(s) and not of MDPI and/or the editor(s). MDPI and/or the editor(s) disclaim responsibility for any injury to people or property resulting from any ideas, methods, instructions or products referred to in the content.

