Review

Fatigue Overview of Ship Structures under Induced Wave Loads

by
Pasqualino Corigliano
1,*,
Federico Frisone
1,
Claudia Chianese
2,
Marco Altosole
3,
Vincenzo Piscopo
4 and
Antonio Scamardella
4
1
Department of Engineering, University of Messina, 98166 Messina, Italy
2
Department of Structures for Engineering and Architecture, University of Naples Federico II, 80125 Naples, Italy
3
Department of Industrial Engineering, University of Naples Federico II, 80125 Naples, Italy
4
Department of Science and Technology, University of Naples Parthenope, 80143 Naples, Italy
*
Author to whom correspondence should be addressed.
J. Mar. Sci. Eng. 2024, 12(9), 1608; https://doi.org/10.3390/jmse12091608
Submission received: 7 August 2024 / Revised: 29 August 2024 / Accepted: 5 September 2024 / Published: 10 September 2024
(This article belongs to the Special Issue Advanced Studies in Marine Mechanical and Naval Engineering)

Abstract

:
Fatigue damage represents a key failure mode in ship structures. Such damage typically begins at vulnerable points in the structure, like welded joints, stress concentration areas, and cracks. Cyclic loading, particularly from waves, encountered by ships during their operational life is a major cause of fatigue damage, which is the main focus of this study. There are various methods to address different sea state conditions, though they can sometimes be approximate. This paper aims to review the most commonly used methods to highlight their strengths and weaknesses and to provide essential background knowledge for developing reliable theoretical and numerical models for predicting the fatigue life of ship structures exposed to various sea states over their lifetime. The primary theoretical approaches discussed include energy spectral methods in both time and frequency domains, which are used to quantify wave-related energy and amplitude characteristics and evaluate wave loads for predicting the fatigue life of structures and welded joints. The discussion also covers the determination of cyclic stress in specific structural details of the hull girder and welded joints to identify the relevant maximum stress range for subsequent fatigue studies conducted using finite element analysis.

1. Introduction

Ships and offshore structures are subject to continuous cyclic loads throughout their operational life. These loads can cause existing fatigue cracks in hull components to propagate, leading to fatigue failure over the years and compromising structural integrity. Once initiated, even low-stress cycles, which normally have negligible effects on intact components, can extend the crack and result in fracture. The most vulnerable structural elements are welded joints, which are extensively utilised in shipbuilding [1]. This review article distinguishes itself by not only summarising existing methodologies but also by pointing out the integration of advanced numerical techniques with traditional approaches to enhance fatigue life prediction accuracy. Moreover, it explores the implications of various sea states on welded joints and other critical areas, which are sometimes overlooked in conventional studies. The most common methodologies for defining load distribution and predicting structural responses induced by various sea states to evaluate the fatigue behaviour of ship structures are presented. Special attention is given to welded joints, the most critical areas for fatigue damage due to potential crack-like defects. The finite element method (FEM) used to identify and visualise fatigue failure mechanisms is also described.
The state-of-the-art discussions in this work can lay the groundwork for developing a future theoretical/numerical model to predict the fatigue life of ship structures through finite element analysis.
Section 2 provides an introductory classification of cyclic loads, focusing on wave-induced loads as the primary cause of fatigue failure in ship structures. It also covers the concepts of wave system spectral energy, wave modelling in both frequency and time domains, and the calculation of wave-induced loads. Section 3 describes the main theoretical fatigue strength assessment methods for estimating load distributions and predicting the fatigue life of structural components and welded joints. Section 4 examines collision damage in extreme sea states, including aspects of structural integrity breaches and environmental pollution. Section 5 discusses the material properties affecting the fatigue behaviour of ship structures, particularly with respect to welded joint characteristics. Finally, Section 6 focuses on developing reliable fatigue strength assessment criteria in both frequency and time domains for real-time monitoring of hull girder stresses.

2. Cyclic Loads

Cyclic loads play a vital role in the safety and endurance of ships. Over multiple cycles of extreme loading, the remaining structural capacity can be notably lower than the immediate collapse strength under a single load due to the reversal and build-up of plastic deformation, which permanently weakens the structural integrity [2]. The residual ultimate strength of hull structures subjected to cyclic loads is investigated using a nonlinear finite element method [3].
Cyclic loads are crucial for causing fatigue damage and thus are the primary input factor for any fatigue analysis. For ship structures, cyclic loads can be categorised into three types based on their frequency or period [4]:
  • Hydrodynamic loads induced by propulsion equipment on the hull: higher-frequency loads, caused by engines and propellers, resulting in forced vibrations with high number of load cycles, typically 1010 or more [5];
  • Loads due to varying loading conditions, cargo loading and unloading: low-frequency loads with very long periods resulting in hundreds to thousands of load cycles during the ship’s operational lifetime [6];
  • Waves loads: low-frequency loads usually on the order of 0.1 Hz. Over an operational lifetime of 25 years, the total number of cycles, induced by these loads, may vary between 107 and 108.
Table 1 summarises the key disadvantages associated with each type of cyclic loading on ship structures.

2.1. Wave-Induced Cyclic Loads

Studies have indicated that wave-induced loads are the main contributors to fatigue failure, particularly in the structural components of a ship’s sides and the longitudinal elements of the hull girder deck [4]. The movement of waves induces varying and complex loads on the structure. Low to medium frequency stresses, caused by oscillating wave forces and wave impacts (slamming), are critical for the fatigue lifespan of structural components. The fatigue life of ship structures is closely tied to wave characteristics, including wave height, period, and steepness. Various numerical and experimental studies have shown that these factors influence the frequency and amplitude of cyclic loads, resulting in different degrees of fatigue damage.

2.2. Wave Modelling: 1st and 2nd Irregular Wave Theory

The irregular and ever-changing nature of wave-induced fatigue loads makes their numerical estimation and analysis quite challenging. Since the sea surface is constantly shifting, statistical methods are essential to quantify wave characteristics and determine the wave loads that ships experience. Irregular wave theories play a crucial role in understanding and predicting the complex behaviour of ocean waves. Unlike idealised regular waves, real ocean waves are irregular, influenced by a variety of environmental factors, such as wind patterns, currents, and seabed topography. To model these unpredictable wave patterns, scientists and engineers often rely on first-order and second-order irregular wave theories, each of which provides unique insights and applications.
First-order irregular wave theory, often referred to as linear wave theory, is based on the premise that an irregular wave can be thought of as a combination of many simple sinusoidal waves. These component waves vary in frequency, amplitude, and phase, and their linear superposition creates the overall irregular wave pattern observed in the ocean. This approach simplifies the complexity of wave behaviour by assuming that the waves interact with each other in a linear manner, without influencing each other’s properties. This theory operates under specific assumptions. It presumes that the waves have small amplitudes relative to their wavelengths, making the linear approximation valid. It also typically assumes deep water conditions, where the depth of the water is much greater than the wavelength of the waves. Despite these limitations, first-order wave theory is widely used in many practical applications.
Prediction of the structural response in ship structures is closely linked to wave energy [6]. Wave energy can be directly measured using instruments like wave buoys and radars and then processed to obtain the wave spectrum for a particular sea location [7]. In case the measurements of the actual wave conditions are not available, standardised wave spectra derived from experimental data are used to approximate the sea state based on statistical parameters such as the significant wave height and peak wave period, predicted by numerical models, weather forecasts, or hindcasts [8,9]. Using Fourier analysis, irregular waves are broken down into a series of harmonic regular wave components, with their frequency, time, and amplitude defining the system’s wave energy density spectrum [10]. The wave spectrum can then be modelled according to one of several idealised formulations designed to closely represent real sea conditions. Some of these formulations are purely mathematical, while others are based on experimental research data. Many sea state spectra supported in either frequency or time domains are available in the literature.
By contrast, second-order irregular wave theory introduces a more sophisticated approach by accounting for the nonlinear interactions between wave components. Unlike first-order theory, which assumes that wave components do not interact, second-order theory recognises that waves in the ocean can influence each other in complex ways. These nonlinear interactions can lead to phenomena such as wave modulation, where some waves grow larger while others diminish, a process that can have significant implications for understanding extreme wave events. This theory also introduces the concept of “bound waves”, secondary waves generated by nonlinear interactions within the primary wave field. This adds another layer of complexity to wave prediction, as it allows for the modelling of more realistic wave profiles, including the common observation that ocean waves tend to have sharper crests and flatter troughs. Because of its ability to capture these nonlinear effects, second-order wave theory is particularly useful in scenarios where precision is paramount. It is often employed in predicting extreme waves, such as rogue waves, which pose significant risks to ships and offshore platforms. Additionally, this theory is crucial for detailed structural analysis, where understanding the precise wave forces acting on a structure can be the difference between safety and failure [11].

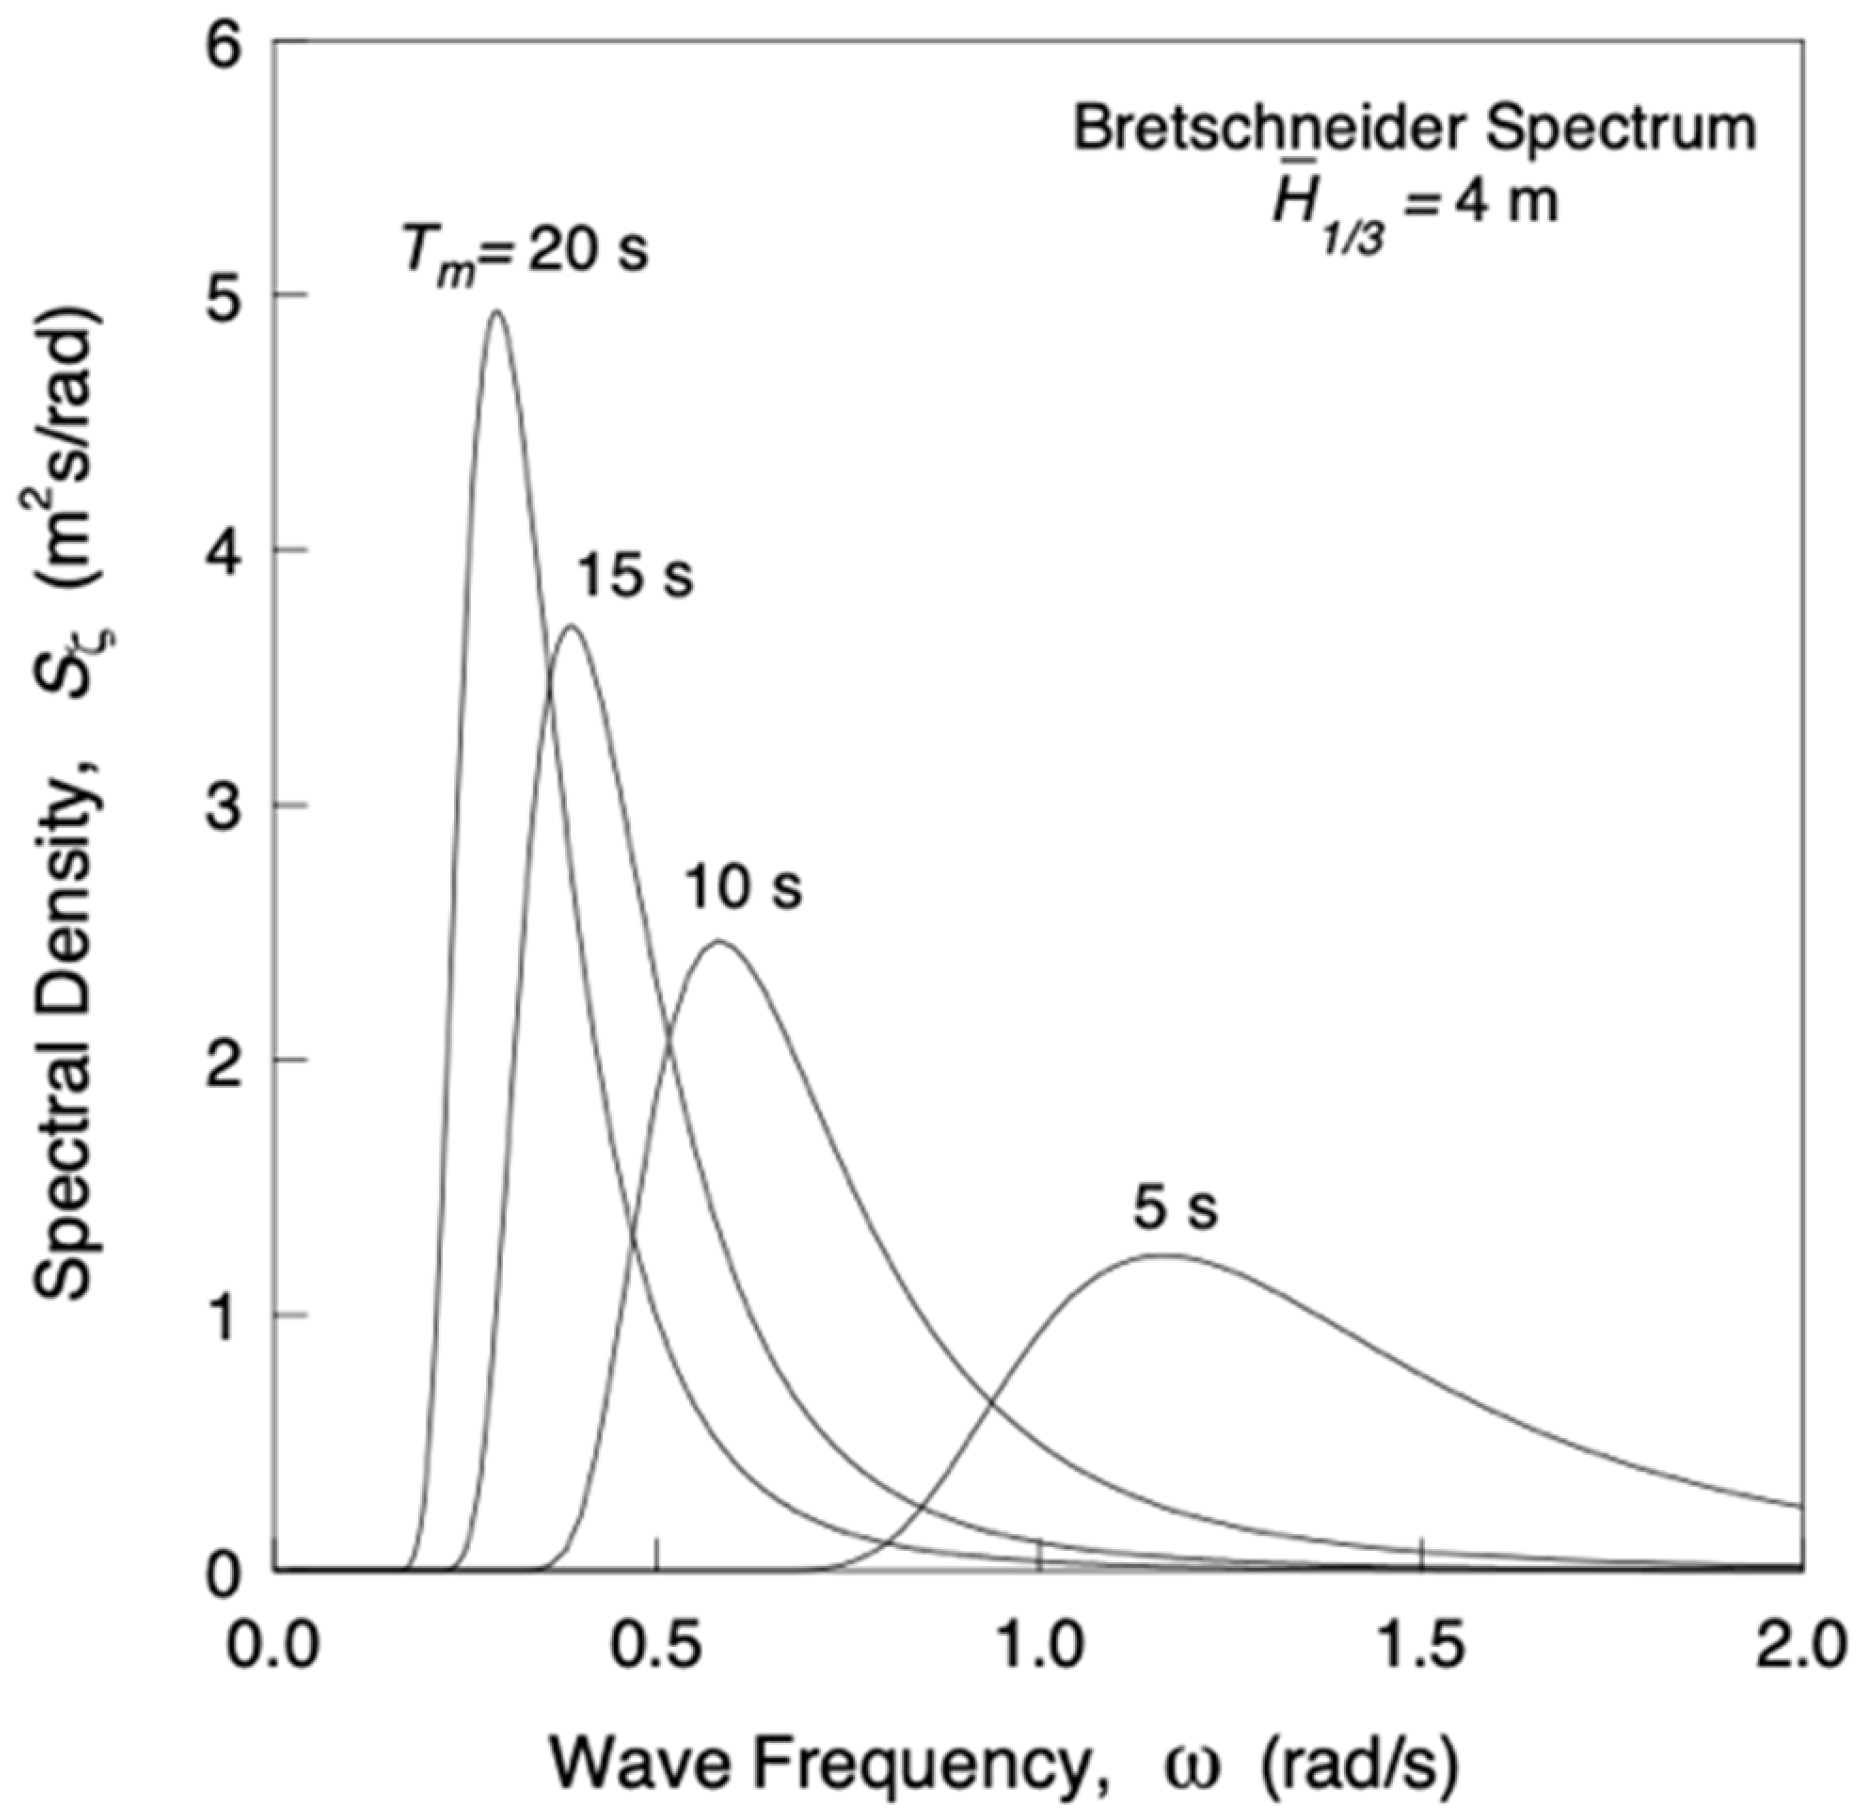
2.3. Frequency-Domain Spectra

Based on 1st linear wave theory, frequency-domain spectra illustrate the energy of a short-term sea state by representing the energy density of each harmonic regular wave component as a function of frequency. The energy spectral density of a sea state is essential information for any frequency-domain method to determine the loading history [1]. The total area under the spectrum curve is proportional to the total energy per unit surface area of the irregular wave system. While the energy spectrum can be empirically derived from recordings of irregular waves, theoretical wave spectra are preferred in ship design.
Among the theoretical spectra, the Bretschneider spectrum is the most commonly used for engineering applications (Figure 1). This spectrum is prevalent in wave analysis due to its applicability to both fully developed and developing or endangered sea states. Consequently, it is recommended for open ocean conditions and is often used to describe tropical storm waves in the Gulf of Mexico or typhoons in the South China Sea. The mathematical expression for this spectrum is given by the following Equation (1) [10]:
S ζ B ω = A ω 5 e B ω 4
where A and B are parameters that are defined by the characteristics of the wave system. These characteristics depend on the significant wave height H 1 3 , the zero-crossing wave period TZ, and the wind speed, which is measured at a standard height of 19.5 m above the free surface.
Two other more relevant types of wave spectrum are available in the frequency domain, although their use is rather limited for engineering purposes because of application restrictions.
The Pierson–Moskowitz spectrum, characterised by two parameters, is used for simulating random sea surfaces and is only applicable to fully developed seas. These conditions arise from the extended influence of a constant wind, which is not commonly achieved for spectral stability (Figure 2) [12]. Notably, the Pierson–Moskowitz spectrum can be seen as a specific case of the Bretschneider spectrum, which is expressed mathematically by the following Equation (2):
S ζ ω = α g 2 ω 5 e β ( g / V W ω ) 4
where VW is the wind speed measured at a standard height of 19.5 m above sea level, and α and β are two parameters dependent on the significant wave height H 1 3 and the zero-cross wave period TZ, respectively.
The JONSWAP spectrum can be also incorporated into the Bretschneider one. This spectrum is used to reproduce the highest peaks and frequency shifts that occur in a limited-fetch storm, which otherwise could not be represented by the Bretschneider and Pierson–Moskowitz spectra, for the same energy of the sea state (Figure 3). For this reason, the JONSWAP spectrum is able to describe a developing storm situation much more accurately than the Bretschneider spectrum [13,14]. Its mathematical definition follows the expression (3):
S ζ J ω = 0.658 S ζ B ( ω ) γ exp ω ω m 2 / 2 σ 2 ω m 2
where S ζ B ( ω ) is the spectral density of the Bretschneider spectrum, ω m is the peak frequency, and γ is the overshoot parameter defined as the ratio of the maxima between the JONSWAP and the Bretschneider spectra.
Below, a comparative table (Table 2) is presented showing the pros and cons of different energy wave spectra, which highlights the main strengths and limitations of each one.
Even with their application limitations, the Pierson–Moskowitz and JONSWAP spectra hold significant value in oceanography due to their ability to precisely describe various sea states. Furthermore, their applicability can be broadened to encompass additional scenarios beyond those originally anticipated. The mathematical equations for these spectra, as can be observed, are relatively simple and are based on two main wave characteristics: the significant wave height H1/3 and the zero-crossing wave period TZ. Such wave parameters have been catalogued over time in the wave atlas “Global Wave Statistics” (Figure 4), based on more than 55 million observations from 1854 to 1984. The atlas covers the entire planet using a global grid of 104 sea areas, showing the probability of occurrence of height and period. Thus, any marine region globally can be effectively approximated using one of the previously mentioned theoretical spectra. Statistical and stochastic methods, which are frequently employed to estimate wave-induced forces in the analysis of marine and coastal structures, depend on precise sea state or wave characteristics. These are typically estimated through complex and computationally demanding numerical wave models. Recent advancements in machine learning techniques have been instrumental in addressing the computational difficulties associated with these methods. However, historical data from the specific region are still essential for accurately forecasting wave loads [15]. In this context, DNV has published a Recommended Practice (RP) that offers guidelines for modelling, analysing, and predicting environmental conditions, as well as for assessing environmental loads from wind, waves, and currents [16,17].

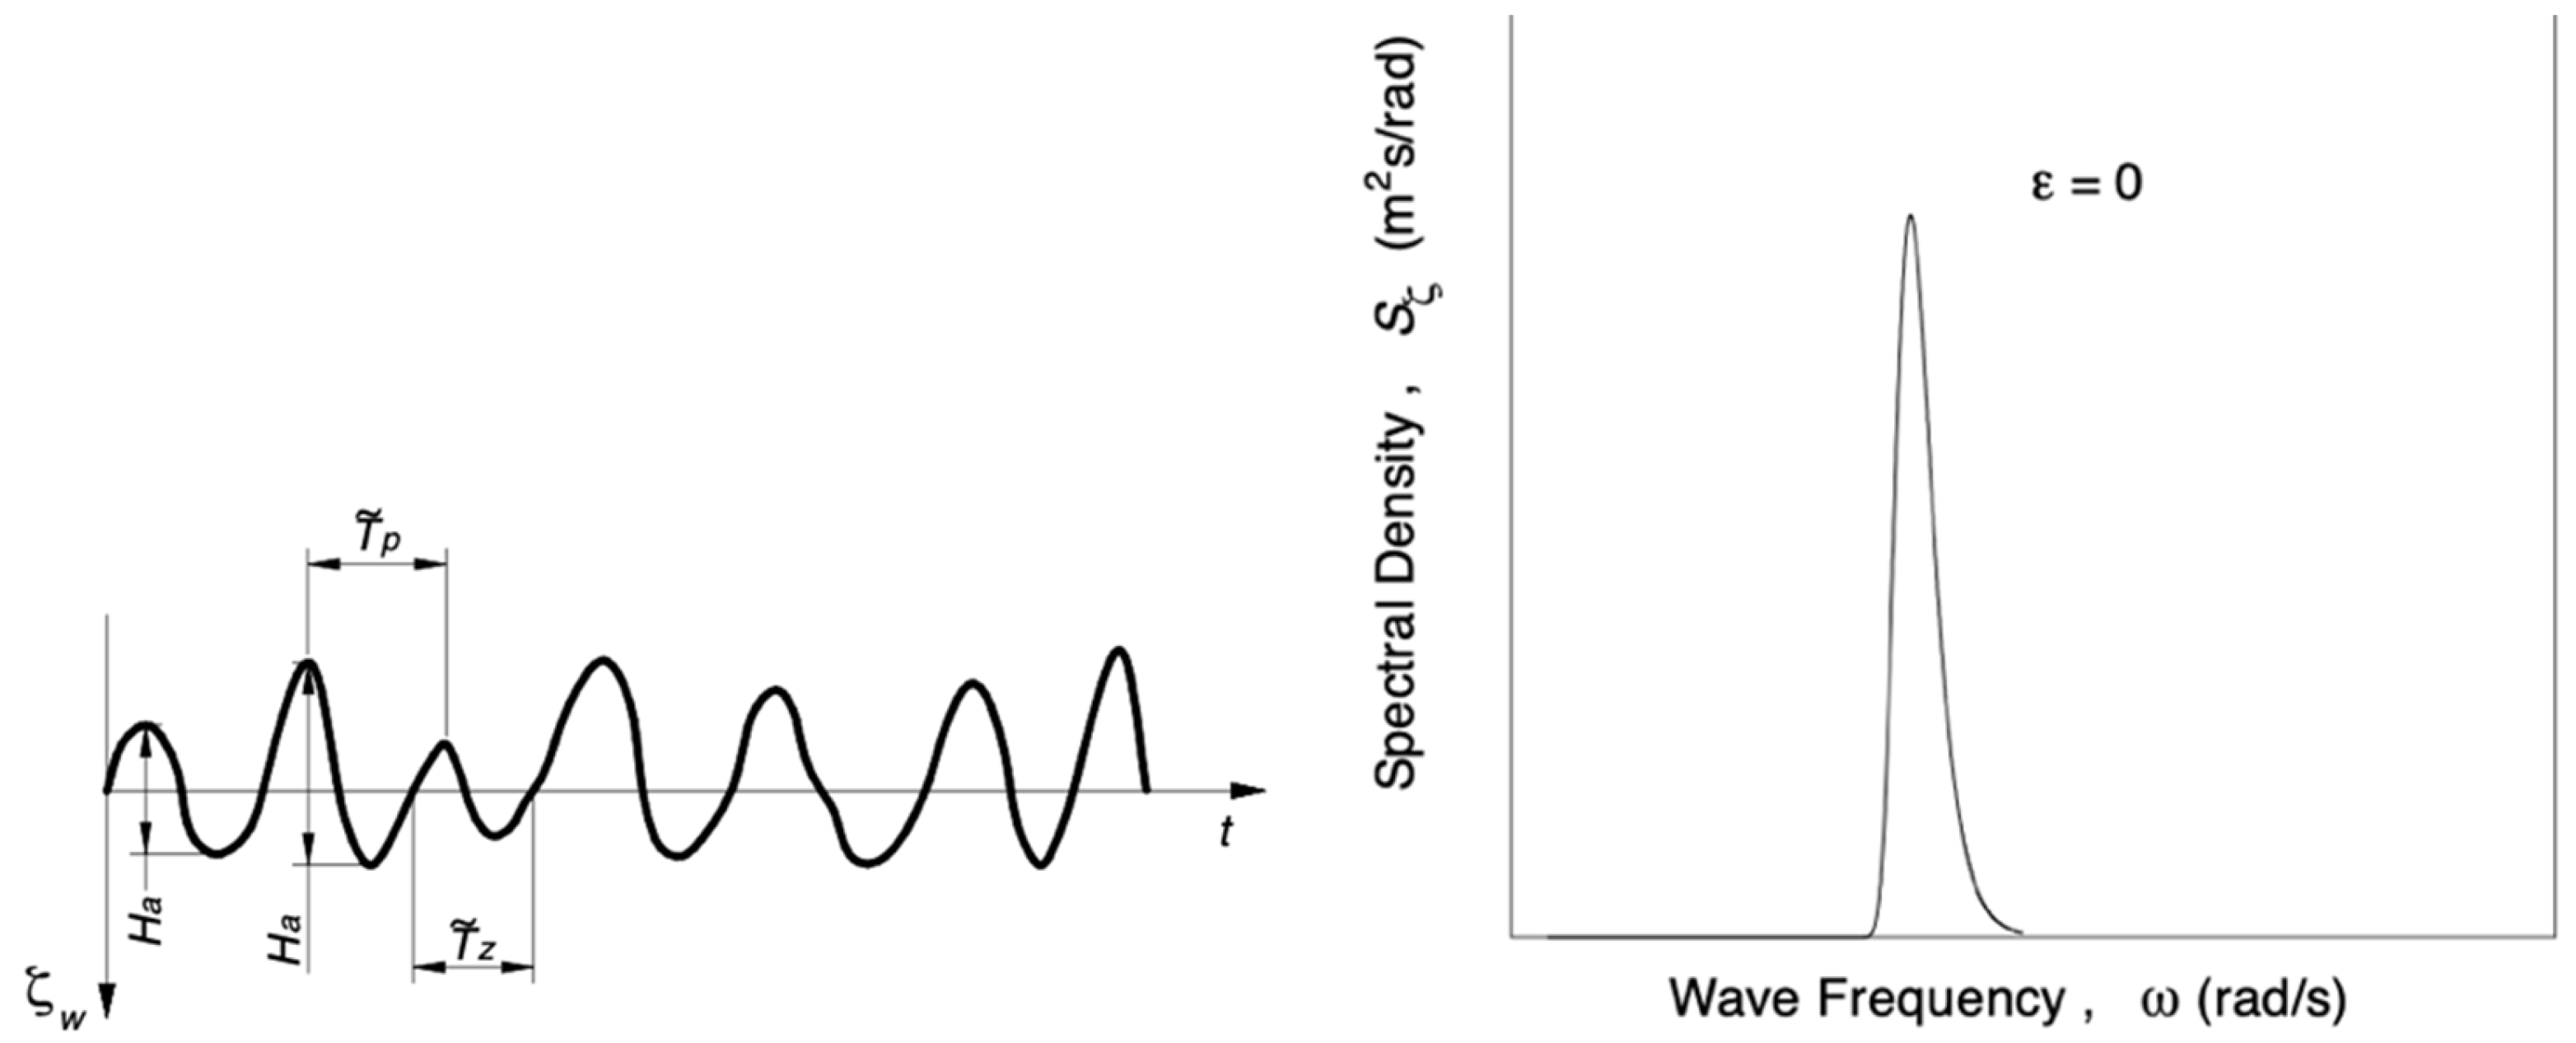
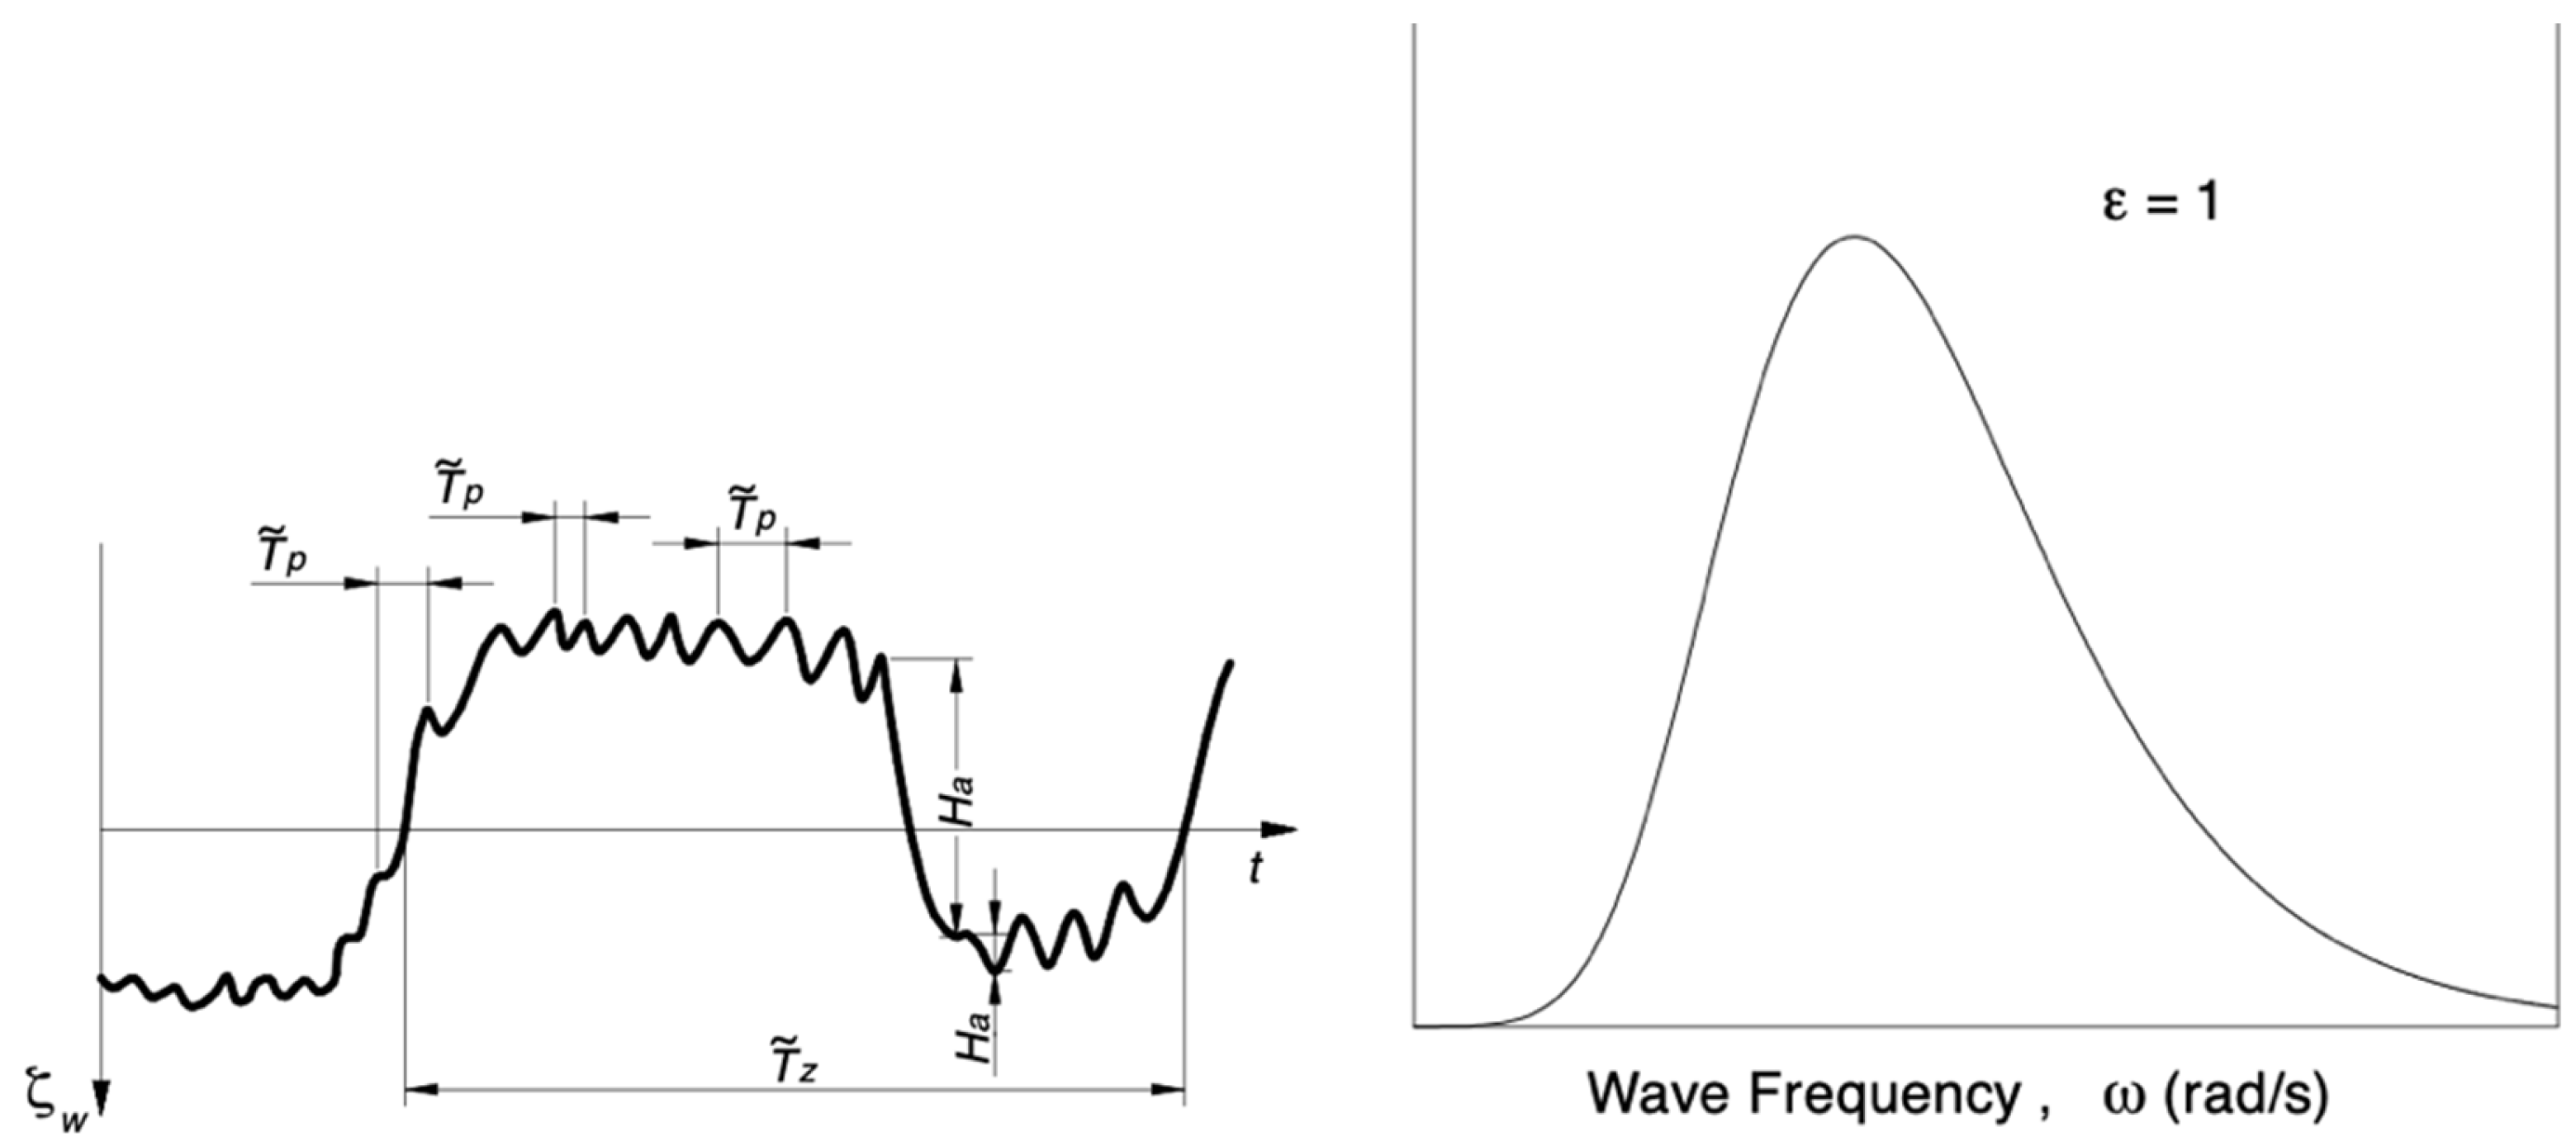
2.4. Time-Domain Series

A time series represents the wave amplitude as a function of time and wave period, and may comprise either narrow-band or wide-band processes. A narrow-band process may be thought of as a harmonic wave component of variable amplitude: wave energy is concentrated only in a rather narrow band of frequencies, while other frequencies have low energy, as shown in the related sea spectrum of Figure 5. The average time interval among peaks is therefore almost equal to the average zero-crossing period (Tp ≈ TZ).
A wide-band process, instead, contains energy on a wider range of frequencies [19]. In this case, the average time interval among peaks is far less than the average zero-crossing period (Tp << TZ) (Figure 6). It is observed that, although spectral and temporal descriptions of the sea are interchangeable, the reconstruction of a time series might not exactly match the characteristic quantities of the reference spectrum (e.g., HS, TZ). In this context, ad hoc techniques have been developed to improve matching accuracy, as discussed in [20].
In most engineering applications, wave-induced fatigue loads are represented by stress range distributions and time-domain stress histories. In a short-term sea state, the structural response is assumed to be a narrow-banded Gaussian process, and thus the load ranges follow a Rayleigh distribution. Correction may be performed to account for wide-banded conditions. The long-term load descriptions can be intended as the accumulation of a large number of short-term conditions. In this respect, it is noted that not all waves are well represented by theoretical spectral models [21].
In a time-domain series of sea waves, low-frequency components are particularly dangerous for ships and offshore structures. These low-frequency waves can lead to resonance with the natural frequencies of the vessel or structure, causing large-amplitude motions that significantly increase the stress on structural elements. This increased stress can aggravate fatigue damage, especially in critical areas. Two-directional and unsteady wave conditions can also contribute to the complexity of the sea state, further aggravating the loading conditions.
An accurate analysis of the spectral moments, associated with the time series of the heave and pitch motions exhibited by a containership, was carried out by Ascione et al. [22], based on the JONSWAP wave spectrum. The paper focuses on the application of two spectral analysis techniques, namely, Thomson and periodogram methods, with the aim of selecting the most suitable method with the minimum time duration so as to obtain a reliable assessment of the sea state parameters. Interestingly, the Thomson method turned out to perform better than the periodogram method, according to a time duration of 20 min. Also, Rossi et al. [23,24] monitored sea state conditions and parameters by applying and comparing different spectrum estimation techniques, based on the Welch, Thomson, and ARMA methods, to a set of random wave signals generated from a theoretical wave spectrum obtained by combining wind, sea, and swell components having the same prevailing direction, with different sets of significant wave heights, peaks, and periods. The aim of the work was to investigate the performance of the Welch and Thomson methods in terms of spectrum restitution and assessment of sea state parameters. Piscopo et al. [25] developed a new wave spectrum procedure, based on ship motion analysis, characterised by the following sea state parameters: wave peak period, significant wave height, and wave spectrum shape. The analysis was initiated from heave and pitch motion time series obtained from measurements onboard a containership. Heave and pitch motion time histories were also obtained by time-domain simulations, based on theoretical wave spectra, in order to investigate the incidence of time duration on sea state parameters.

2.5. Wave-Induced Ship Response: Strip Theory

Once the energy spectrum of the wave system is defined, the relationship between wave energy and the wave-induced ship response can be described in terms of ship motions and internal force distribution, e.g., horizontal and vertical bending moments, shear forces, and torsional moments.
Wave-induced loads and vertical motions of ships with nonzero forward speed can be directly computed in the frequency and time domains, considering nonlinear effects associated with large amplitude motions and hull flare shape. The method is based on the so-called strip theory, using singularities distributed on the cross-sections that satisfy the linear free surface condition [26].
Strip theory is a linear superposition approach that derives its name from the technique employed whereby the ship is idealised as a wall-sided body made up of a series of prismatic sections or strips. In the first place, the ship is assumed to be a slender body of width and draft much smaller than its length, having cross-sections gradually varying in shape along the longitudinal direction. Considering moderate advance speeds and sufficiently high frequencies, the velocity of fluid particles in the transverse direction can be then deemed much higher than that in the longitudinal one. The three-dimensional problem is therefore broken down into a series of two-dimensional problems where the forces and motions of each strip can be solved independently and then integrated along the length of the ship to provide the response of the whole vessel. Despite its basic assumptions, the method has wide application in the hydrodynamic field owing to its practicality and a reduced computational effort compared to 3D panel-based approaches.
An important advantage of the strip theory comes also from the assumption of linearity that makes it possible to utilise the spectral method. In this way, ship responses (motions and stresses) to regular waves are linear and so superposition may be used to determine the overall response to an irregular sea state [27].

3. Fatigue Strength Assessment Approaches

The fatigue strength of ship structures is a complex and highly uncertain issue. The unpredictable nature of wave-induced fatigue loads complicates their numerical estimation and analysis. Dong et al. [6] identified the sources of uncertainty in the spectral description of wave elevation in a stationary short-term sea state. Theoretical models were formulated to quantify the uncertainty of the stress response variance due to different wave characteristics and spectrum shape. Therefore, a precise characterisation of these loads is critical for conducting accurate fatigue damage and crack growth assessments.
The determination of these loads can be approached using 1st or 2nd irregular wave theory. The 1st irregular wave theory (linear wave theory), extensively analysed in this work, is based on three main methods: the simplified method, the deterministic method, and the direct calculation method. Each method involves four key steps: identifying fatigue loads, calculating the long-term distribution of stress ranges, determining the structure’s fatigue capacity, and evaluating fatigue damage. Second-order forces, which arise from the interaction between different wave components, are more complex and can have significant implications for the ship’s behaviour, particularly in terms of slow-drift motions and mooring forces [28].

3.1. Simplified Deterministic Method

The simplified method utilises the two-parameter Weibull probability distribution to characterise the long-term stress range distribution for ship structural components. This approach, often referred to as ‘deterministic’, involves analysing a substantial number of specific (deterministic) load cases. It serves as a simplified alternative to spectral-based methods, which use short-term wave spectra; instead, it relies on deterministic wave height and period to describe sea states [29].
Although simplified fatigue assessment methods vary among classification societies, they generally follow four key steps: determining fatigue loads, calculating the long-term distribution of stress ranges, evaluating the structure’s fatigue capacity, and assessing fatigue damage. These methods are typically applied to local details and are suitable for urgent cases. Branko Blagojević [30] conducted a comparison of various simplified procedures used by classification societies for assessing ship structural details, including connections in the hopper tank, topside tank, and double bottom of a bulk carrier. The study highlights that minor changes in the shape parameter of the Weibull stress probability distribution can significantly impact the fatigue life of structural components.

3.2. Direct Calculation Method

The direct calculation method is widely recognised as the most commonly used technique in fatigue analysis [31,32]. It can be divided into two categories: time-domain (TD) and frequency-domain (FD) methods.
The TD method can incorporate nonlinearities such as slamming and whipping effects, making it appropriate for determining the fatigue stress time history of a structure under actual sea conditions by simulating a range of sea states within a hydrodynamic framework. The FD method is a statistical approach known as spectral fatigue analysis. This technique estimates fatigue damage based on an irregular sea state, using a probability statistical function applied to the stress range of a structural component caused by wave loading. This stress range is typically modelled using a narrow-banded Rayleigh distribution, assuming a rigid-body ship.
A notable advantage of the FD method is its lower computational demand compared to the TD method. However, the TD method may be preferred for long-term fatigue assessments as it provides a more realistic calculation of pressure loads [33]. Unlike FD analysis, the TD method directly computes wave loads within its hydrodynamic framework, which are then used in finite element (FE) analysis to produce stress time histories at critical points.
Yue et al. [34] also proposed a hybrid method that integrates both frequency- and time-domain approaches. This hybrid method addresses the limitations of spectral-based methods, such as narrow-band approximation, by utilising rainflow counting instead [35]. The findings suggest that this hybrid approach offers fatigue damage predictions similar to those from time-domain analysis, though it tends to underestimate fatigue life near amidship. As a result, the hybrid method has not been widely adopted for ship fatigue assessments due to insufficient research.
The rainflow counting method is a primary technique used to identify and count the stress cycles from a complex stress history. It is particularly useful when dealing with irregular, non-repetitive loading patterns, and it is based on 5 main steps:
  • Transform the stress history: Begin by plotting the stress time history of the material or structure, typically in the form of a stress–strain curve. The stress is plotted on the vertical axis, while time or load cycles is plotted on the horizontal axis.
  • Identify peaks and valleys: Identify all the local maxima (peaks) and minima (valleys) in the stress history. These points are critical as they represent the potential turning points where stress cycles begin and end.
  • Rainflow counting process: Imagine the stress time history is a mountain range with rainwater flowing down the slopes. The “rainflow” process then involves tracing the flow of this “water” from each peak or valley, pairing it with corresponding valleys or peaks that represent the completion of a stress cycle. Specifically, from each peak, “water” flows downhill to the next valley, unless it encounters a higher peak or lower valley on the way, in which case the cycle is terminated and a new cycle begins. Each completed flow from a peak to a valley, or from a valley to a peak, is counted as one half-cycle. Two half-cycles are paired to form a full cycle.
  • Cycle counting and stress range: Once all possible flows have been traced, count the number of full cycles and half-cycles. For each cycle, calculate the stress range, which is the difference between the peak and valley stresses. Record these cycles and their corresponding stress ranges, as they represent the loading history the material has experienced.
  • Histogram construction: The final step is to create a histogram or matrix that shows the number of cycles for each stress range. This data can then be used in fatigue analysis to estimate the cumulative damage using methods such as Miner’s rule, which relates the number of cycles to the material’s fatigue life.

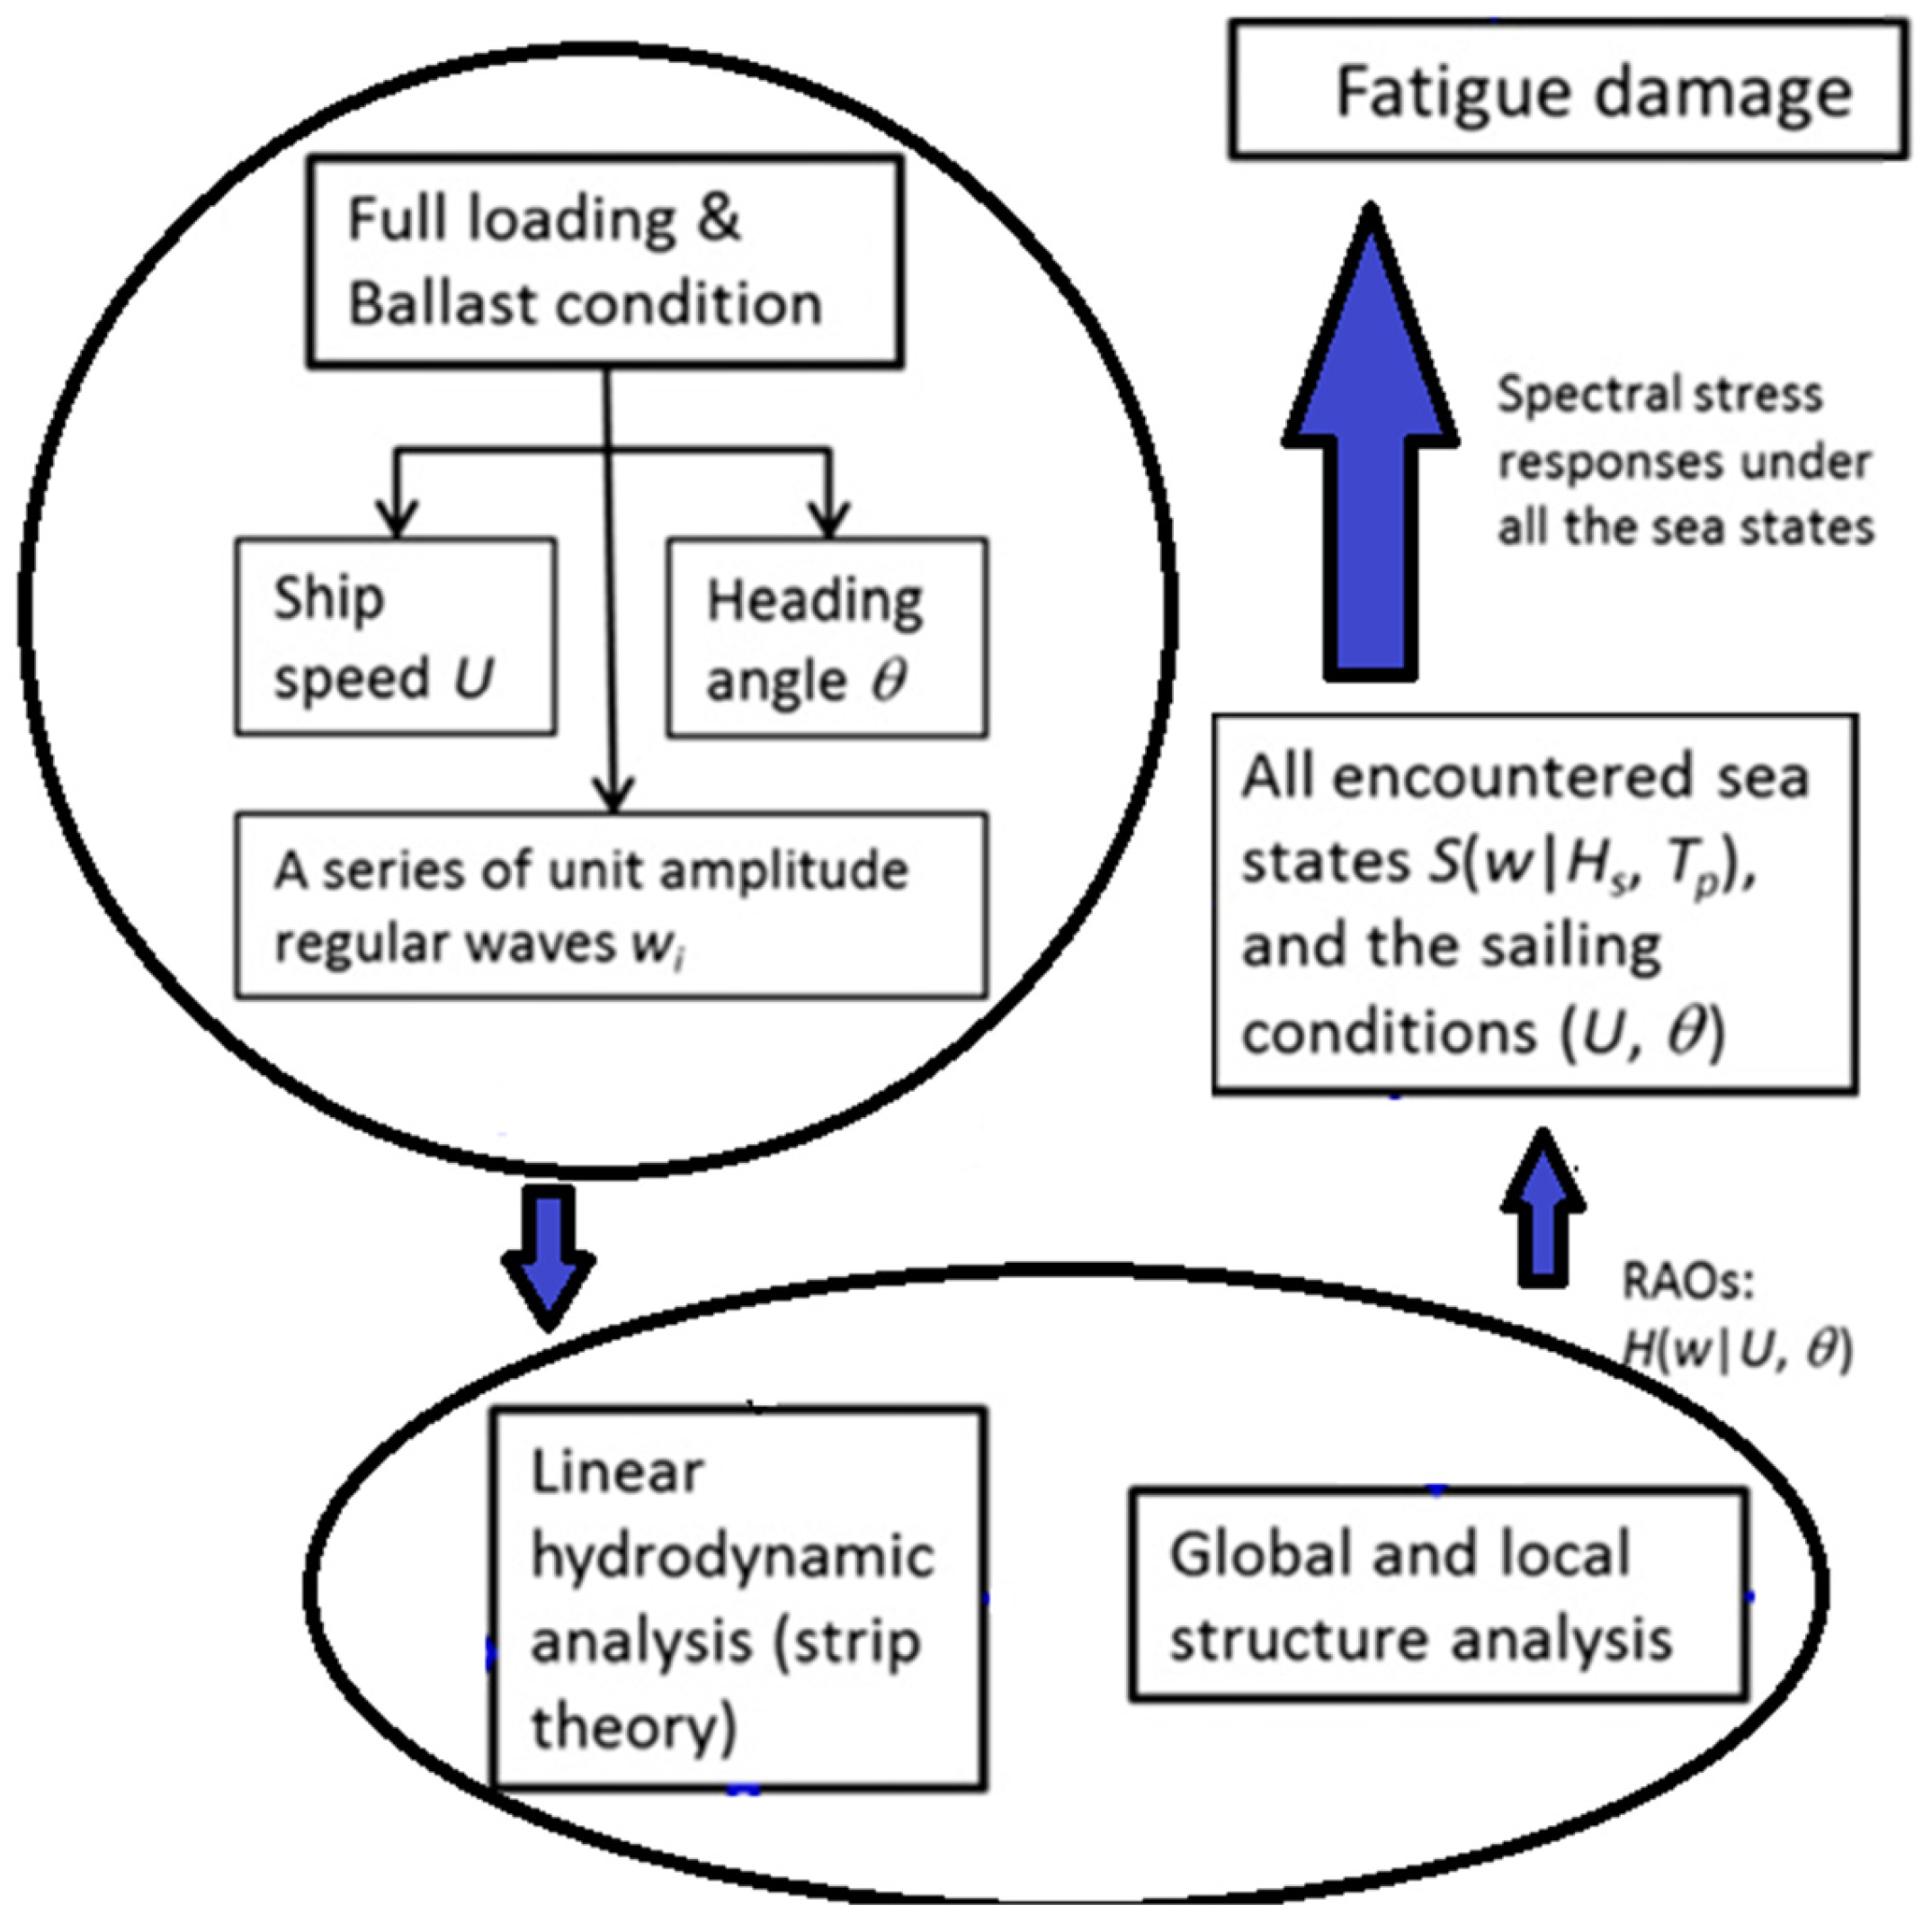
3.2.1. Frequency-Domain Analysis

In conventional ship fatigue design, the direct calculation method is commonly used to determine wave loads under various loading and operational conditions. Structural analysis may be carried out using finite element analysis (FEM) or simplified beam theory to evaluate the structural stress response. Typically, this response is analysed using linear methods within the frequency domain [36,37,38].
The frequency-domain spectral-based method relies on three key assumptions [34]:
  • Linear wave theory: Irregular waves are modelled as a combination of regular wave components, with their energy described by a short-term wave spectrum.
  • Linear relationship: A linear relationship exists between the waves and the ship’s structural response, which allows for the use of transfer functions to describe the ship’s dynamic characteristics.
  • Narrow-band approximation: Stress ranges within each short-term sea state are assumed to follow a Rayleigh distribution, with cycle counting based on the zero up-crossing period of short-term structural stress responses. It should be noted that this assumption is not applied in the hybrid method.
According to linear wave theory, the time history of an irregular wave A(t) can be viewed as a combination of multiple regular wave components through the application of Fourier analysis (4):
A t = i = 1 N A i c o s ( k i x ω i t + ε i )
where Ai denotes the amplitude of the i-th regular wave component, while ωi, ki, and εi represent the wave frequency, wave number, and phase for the i-th harmonic wave component, respectively. The stationary sea state is defined by one of the wave spectra previously discussed.
An essential assumption in the frequency domain is the linear relationship between the waves and the ship’s structural response. Ship motions and wave loads can be calculated through a linear hydrodynamic analysis, such as strip theory, followed by a structural analysis. The response of the structure to irregular waves can be approximated as a combination of responses to individual regular wave components. This approximation is captured by the structural stress transfer function, which represents the ratio of the structural response (output) to the wave load (input) [39,40].
The modulus of this transfer function, known as the response amplitude operator (RAO), acts as a scaling factor linking the wave spectrum S(ω) with the stress power spectral density (PSD), as shown in the following Equation (5) [41]:
S σ ω H s , T z , θ = R A O ω θ 2 · S ( ω | H s , T z )
For any given sea state defined by parameters such as significant wave height HS, wave period TZ, and wave spectrum S(ω), the short-term stress response in the frequency domain (expressed as stress power spectral density) can be derived by combining the wave spectrum with the response amplitude operator (RAO) [36]. The linear model directly provides the response spectrum of wave-induced resistance from the wave spectrum and transfer function [42]. Calculating the transfer function for wave spectra can be complex. To simplify this, Yang et al. [12] developed a mathematical model that enables rapid and efficient determination of the spectral transfer function and the corresponding wave power spectrum. Additionally, Nielsen et al. [43] introduced a straightforward method to enhance and fine-tune the accuracy of transfer function predictions.
To account for second-order effects due to 2nd irregular wave theory, researchers often employ quadratic transfer functions (QTFs). QTFs provide a mathematical framework for quantifying the nonlinear interactions between pairs of wave components, integrating the interactions of wave spectral components over all frequency pairs. One method for experimental determination of the QTF involves a large number of bi-chromatic wave conditions in order to cover the two-dimensional frequency space that defines the QTF. This approach is crucial for accurately predicting the forces acting on a ship in a realistic, irregular sea state [44].
In numerical modelling of ship structures subjected to cyclic loads from wave action, several important coefficients or factors have to be considered to accurately predict structural responses and potential fatigue damage:
  • Stress concentration factors (SCFs): These factors adjust for increased stress around features such as welds and notches, highlighting areas prone to higher stress and potential fatigue issues.
  • Wave load coefficients: These coefficients describe the magnitude and distribution of forces exerted by waves on the structure, essential for modelling the actual loading conditions experienced by the ship.
  • S–N curves (stress–number of cycles): These curves illustrate the relationship between cyclic stress amplitude and the number of cycles to failure for a material, helping to estimate the fatigue life of structural components under different stress conditions.
  • Material properties: Characteristics such as Young’s modulus, yield strength, ultimate tensile strength, and fatigue strength define how well the material can endure cyclic loading without failing.
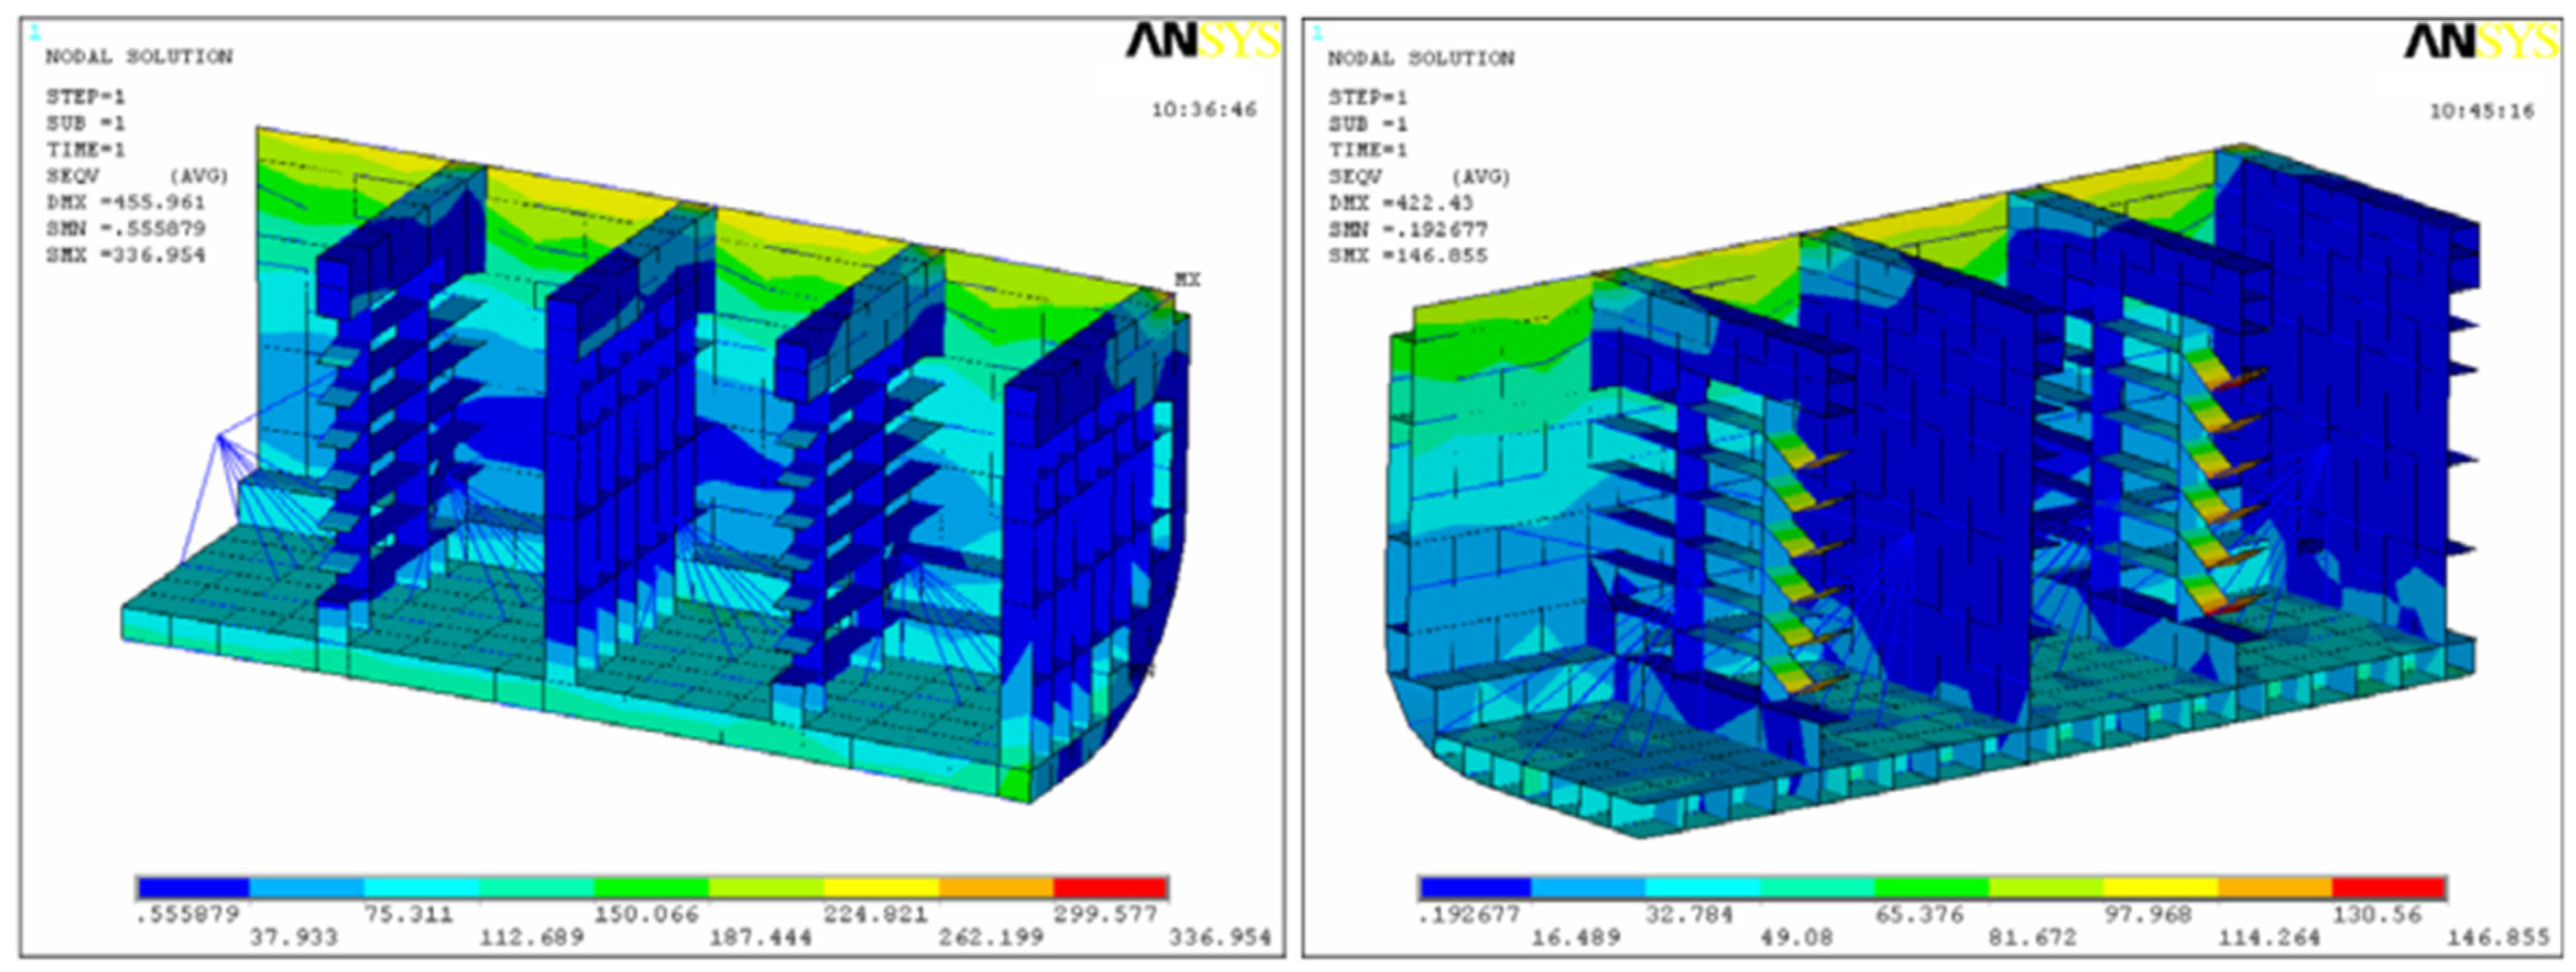
To determine potential damage, the stress ranges and cycles calculated from the model are compared against the material’s fatigue life as indicated by S–N curves. If the stress cycles surpass the allowable limits, the structure may be at risk of fatigue damage. Additionally, cumulative damage models, such as Miner’s rule, are used to ensure that the total damage across all stress cycles does not exceed a critical threshold.
Figure 7 outlines the procedure for frequency-domain analysis: Begin by representing an irregular sea state as a combination of regular waves through Fourier analysis, based on a theoretical wave spectrum. Assuming a linear relationship between the waves and the ship’s structural response, ship motions and wave loads are computed using the strip theory approximation, followed by global and structural analysis to evaluate the stress range on the structure. By integrating the spectrum of each sea state with the corresponding transfer function, the short-term structural response (stress power spectral density) of the ship structure can be determined. The final step involves defining the fatigue behaviour using the methodologies outlined in the subsequent section (Figure 7).

3.2.2. Case Studies

A very interesting case study was carried out by Ringsberg et al. [45], who examined the application of the direct calculation method through both frequency- and time-domain fatigue analysis for a 4400 TEU container ship navigating in severe sea conditions. The study aimed to pinpoint the ship’s critical fatigue-prone areas using linear and nonlinear finite element analysis techniques. The goal was to assess whether wave-induced loads could cause cyclic plastic deformation in specific regions during long-term fatigue assessments and to determine if a strain-based fatigue assessment approach is necessary compared to the conventional stress-based method. Hydrodynamic simulations were performed in both frequency and time domains. For the frequency-domain analysis, wave loads were modelled using the Pierson–Moskowitz spectrum, with 19 frequencies and 24 wave directions, and a significant wave height of HS = 1 m. These results were then used in a linear finite element analysis with Sestra software [46], followed by a full-ship fatigue analysis using Stofat software [47]. Time-domain analyses were carried out with significant wave heights of HS = 6 m and HS = 7 m, conditions typical of the North Atlantic route during winter (December to March). Results from these analyses were applied to both linear elastic FE analyses using Sestra and Abaqus, and nonlinear FE analyses using Abaqus, to explore the nonlinear structural response of local sub-model details. The frequency-domain fatigue analysis indicated that, for all wave directions (0°, 15°, and up to 180°), critical fatigue locations were identified at the midship hatch corners, the engine room bulkhead, and the bilge region. An example of FE sub-modelling from a full-ship model to detailed local model is reported in Figure 8 and Figure 9 [48]. Sometimes a required specimen-scale detail is needed for nonlinear analyses, as reported in [49].
The full-ship fatigue analysis in the frequency domain, performed in [45], shows that, for all wave directions 0°–15° and up to 180°, the fatigue critical locations are located in the midship hatch corners, the engine room bulkhead, and the bilge region (Figure 10).
The linear finite element analysis (FEA) of local details was conducted using hydrodynamic loads over a 20 min time-domain simulation (with a time step of 0.5 s) based on the Pierson–Moskowitz wave spectrum, considering significant wave heights of HS = 6.0 and 7.5 m and maintaining a constant ship speed of 23 knots. The maximum stress was found in the cut-out region of the outer side-shell surface. The stress time histories revealed that the material’s yield stress (σy = 277 MPa) was surpassed only for a significant wave height of HS = 7.5 m.
The same finite element analysis (FEA) in the time domain was conducted again with a nonlinear material model to examine the degree of accumulated plastic strain on the structural detail under study, using a stress ratio of −1 and peak stress matching the highest stress response from the linear analysis. Only a few elements around the cut-out exhibited plastic strain accumulation, and the material response reached elastic shakedown. Therefore, this structural detail should not be regarded as critical for strain-based fatigue evaluation.
Li et al. [33] performed a comprehensive fatigue assessment of ship side-shell structures using nonlinear time-domain hydrodynamic simulations followed by linear FEA, focusing on a Panamax container vessel navigating the North Atlantic. The study presented a comparison between linear and nonlinear simulations, revealing slight variations and showing that the time step length’s impact in linear FEA is minimal. Comparing the spectral method and the time-domain procedure, the spectral method suggested a fatigue life of 7.1 years, while the time-domain method indicated 6.7 years. Thus, the time-domain procedure is considered more realistic than the commonly used spectral method in the frequency domain. Another recent study by Fajiri et al. [50] detailed the fatigue life of ship structures using a numerical procedure based on the finite element method (FEM) using ANSYS software of on midship section zone, as reported in Figure 11 where the red numbers and circles are the critical areas. This study aimed to assess the effects of geometric shape and material type on the fatigue behaviour of ship structural components, employing both nominal stress and hot spot stress approaches. The variable loading applied to each sample included three conditions: zero-based, zero mean, and ratio. Structural samples were taken from various ship locations representing the most fatigue-sensitive areas. According to prior literature, the midship is the most prone to fatigue failure. Five types of sample models were considered.
The methodology employed in this research was the stress-life approach, focusing on the linear region below the material’s yield point. This study examined four material types: high-strength low-alloy steel (HSLA) SAE 950X, medium-carbon steel, SAE 316L, and SAE 304L. For each model, mesh convergence was carried out using various mesh sizes, with the mesh in the area of interest being three times finer than the global mesh.
In general, stress calculation is particularly sensitive to the size of the mesh, especially near areas of stress concentration or singularities such as notches, sharp edges, or other geometric discontinuities. The precision of stress calculations is closely tied to the size of these elements: a finer mesh allows for a more detailed representation of the stress distribution, especially in regions where stress changes rapidly. Away from singularities, stress results typically stabilise as the mesh is refined, leading to reliable and consistent values. However, in the vicinity of singularities or areas with high-stress concentrations, stress values may continue to increase as the mesh is made finer, often without reaching a physically meaningful convergence. At locations like notches, where stress concentrations naturally occur, the stress values are particularly dependent on mesh size. A coarse mesh might not accurately capture the peak stresses, potentially leading to an underestimation. On the other hand, a finer mesh might predict significantly higher stresses near the notch, sometimes incorrectly suggesting the presence of a singularity. Designers must find an appropriate balance between accuracy and computational efficiency.
The finite element method (FEM) analysis revealed that the bottom structural components (geometry 4) experienced the highest stress, measuring 312.67 MPa in the neck area, as reported in Figure 12. There was an inverse relationship between the stress value in the structure and the predicted fatigue life. It was found that the bottom-stiffened panel had a short fatigue life of only 88,806 cycles before failure, whereas the side-stiffened panels (geometry 5) posed the lowest fatigue failure risk.
As can be seen, the meshes in this paper were plate elements. Plate elements are a type of finite element that is particularly useful for modelling thin structures subjected to out-of-plane loads, such as bending and torsion. However, they could be not well suited for accurately determining the stress at notch parts. Plate elements are designed under the assumption that the thickness of the structure is much smaller than its other dimensions. They primarily model bending behaviour and assume that the stress across the thickness of the plate is uniform. This assumption does not hold true near notches or other stress concentration points where the stress distribution is highly non-uniform and complex. Notches introduce sharp geometric discontinuities that lead to high-stress gradients through the thickness and around the notch. Plate elements cannot adequately capture these three-dimensional stress variations because they simplify the geometry and behaviour into a two-dimensional approximation. However, in this case, the author carried out a simplified analysis with plate elements because the focus was on understanding the general stress distribution and load paths rather than capturing precise stress values at the notch.
Geometry 2 was used to assess the impact of material type on fatigue analysis. The four materials examined were HSLA SAE 950X, medium-carbon steel, SAE 316L, and SAE 304L, and the S–N curves [50] are shown in Figure 13. Although HSLA is a relatively new material and not as commonly used in marine applications as SAE 316L and 304L, medium-carbon steels have favourable mechanical properties but are not very often used for marine structures.
Medium-carbon steel demonstrates the highest fatigue resistance among all the materials considered, although it lacks corrosion resistance. HSLA also exhibits good fatigue resistance, with a minimum fatigue life of 225,710 cycles. SAE 316L and SAE 304L are widely used in the marine industry due to their anti-corrosion properties, but they have lower fatigue resistance. Fatigue life results of different material types of geometry 4 are depicted in Figure 14 [50].
Fricke et al. [51] conducted a comparative study on various fatigue strength assessment procedures according to the standards of eight classification societies (ABS, RINA, DNV, GL, KR, LR, NK, RS). The study focused on a welded detail of the longitudinal hatch coaming of a Panamax container vessel subjected to global bending loads. The results revealed significant discrepancies in the fatigue life of the structural component, as predicted by the different procedures, with a range from 1.8 to 20.7 years. This variation can be attributed to the differing stress approaches (nominal, hot spot, notch stress), local stress determination, and S–N curves employed by the methodologies.
Regulatory outcomes were compared with results from load calculations based on the spectral method, using the North Atlantic wave climate. This comparison revealed that, despite predictions of a short fatigue life for the component, practical experience showed no fatigue issues. This indicates that both simplified and direct fatigue analysis methods can sometimes yield overly conservative results. Full-scale measurements taken during a naval vessel’s sea trial were also compared to computed stress spectra and associated fatigue damage predictions using linear frequency-domain hydrodynamic and finite element analysis codes [52]. Similarly, Boulougouris et al. [53] analysed the wave-induced vertical bending moment against the class-imposed design loads for a 4250 TEU container ship. Drummen et al. [54] conducted experimental and numerical investigations of fatigue damage due to wave-induced vibrations in a containership in head seas. Their experiments, performed with a flexible ship model, and numerical predictions using nonlinear hydroelastic strip theory showed that wave-induced vibrations contributed approximately 40% of the total fatigue damage. However, the numerical method overestimated the total fatigue damage by 50%.
Sun et al. [55] examined the wave loads and structural stresses of a 5500 TEU container ship. They obtained maximum motions and loads, movement amplitudes under unit regular waves, load conversion functions, and RAOs for the midsection at different angles. Long-term wave loads were calculated using spectrum theory and compared with classification rules values. They used the Pierson–Moskowitz wave spectrum and the IACS WP/S committee’s recommended wave frequency table for calculations. The finite element analysis, conducted using ANSYS software, showed that the maximum vertical bending moment occurred 103 m to 162 m from the after perpendicular, as reported in Figure 15.
Additionally, various studies have introduced methods to predict the cyclic ultimate strength of a ship subjected to alternate bending moments in hogging and sagging conditions. These methods forecasted the collapse behaviour of a ship hull structure under several cycles of extreme loads [56,57,58].
Paik et al. [59] introduced a novel approach to calculate the design values for hull girder loads induced by waves on ships. This method assessed the design values for wave-induced vertical bending moments for three types of vessels: a VLCC class tanker, a 9300 TEU container ship, and a 22,000 TEU container ship. The analysis of wave loads on ships is also linked with the design load values specified by classification society standards. It was assumed that the wave direction was uniformly distributed, while the significant wave height and wave period were probabilistically described based on North Atlantic Ocean sea states. A two-parameter Weibull distribution was used for the significant wave height (6):
f x = β α x α β 1 exp x α β
where α = 1.914 and β = 3.854.
For the zero-crossing wave period, a normal distribution was adopted (7):
f x = 1 σ 2 π exp x μ 2 2 σ 2
where μ = 8.862 and σ = 1.638.
After characterising the probability density functions for all random variables, a sampling technique was employed to generate a set of wave event scenarios, with 100 scenarios selected in this study.
For each scenario, the maximum sagging wave-induced bending moment components were computed under full load conditions, using a two-parameter log-logistic distribution, as detailed below (8):
f x = β α x α β 1 1 + x α β 2
where α = 0.5065 and β = 0.3488.
The results from this new method were subsequently compared with the IACS 2010 regulations to assess the design values of wave-induced vertical bending moments for merchant cargo ships, including oil tankers, showing a high level of agreement. In 2021, Akbar et al. [60] conducted a study on the strength of plated-hull structures against hydrostatic and hydrodynamic forces, using a 600 TEU container ship as a case study. This research thoroughly examined how variations in parameters such as material type, hull thickness, and ship draft affected stress and strain, comparing these differences across conditions. The simulation involved four materials: ASTM A131 Grade AH36, ASTM A131 Grade AH32, AISI 1020, and AISI 1035. The findings indicated that ASTM A131 Grade AH36 exhibited a deformation value of 51.14 mm, which was within acceptable limits. ASTM A131 Grade AH32 showed identical deformation characteristics to Grade AH36, suggesting comparable strength between these materials. For AISI 1020 and AISI 1035, the deformation values were below permissible limits, confirming their suitability for design use.
Samson and Ogbonnaya [61] utilised International Standards to calculate hull strength for offshore structures. Ship classification societies, such as Det Norske Veritas, American Bureau of Shipping, and Lloyd’s Register, have established standardised calculation procedures for hull load, strength requirements, hull plating thickness, and the design of reinforcing elements.
Jankowsky and Bogdaniuk [62] conducted an intriguing study on predicting wave-induced stresses in ship structures. Their paper details a method for forecasting wave loads and stresses to meet classification rule requirements. Their use of the Weibull probability distribution for approximating numerical probability density functions showed good results for bending moments and side frame stresses but was less effective for sloshing and stresses in hatch covers. To better determine the safety levels of corrugated bulkheads and hatch covers, they suggested that a longer simulation time is needed for more accurate numerical probability distribution. Lang et al. [63] investigated fatigue assessment by comparing a ship motion-based data-driven model with a direct fatigue calculation method. They explored a machine learning approach for evaluating fatigue in a 2800 TEU container vessel. Ship motion data was used to develop a machine learning model, which was then compared with fatigue damage predictions from full-scale measurements and direct fatigue calculations. The machine learning model demonstrated superior predictive accuracy over the traditional spectral method, which often fails to capture the nonlinear increase in fatigue damage under severe sea conditions. Folso and Dogliani [64] examined how probabilistic modelling of sea states impacts fatigue damage calculations across four ships. Their damage estimation approach employed the Miner–Palmgren fatigue damage formulation and a spectral method to calculate stress process variances. They noted that assessing fatigue life under multiaxial loading sometimes necessitates multiaxial fatigue failure criteria defined in both time and frequency domains. Nieslony et al. [65] reviewed methods for determining parameters in frequency domain criteria, including a critical plane approach and other stress-invariant-based proposals.
The following table (Table 3) provides a comparative overview of fatigue strength assessment approaches described before: simplified deterministic method, direct calculation methods (time domain and frequency domain), and finite element analysis techniques (linear and nonlinear). This summary highlights the key pros and cons of each method to aid in selecting the most appropriate approach based on specific project needs and constraints.

3.3. Fatigue Damage Analysis

Once the stress distribution is determined through the abovementioned methods, the fatigue assessment of ship structures is typically carried out using the following approaches:
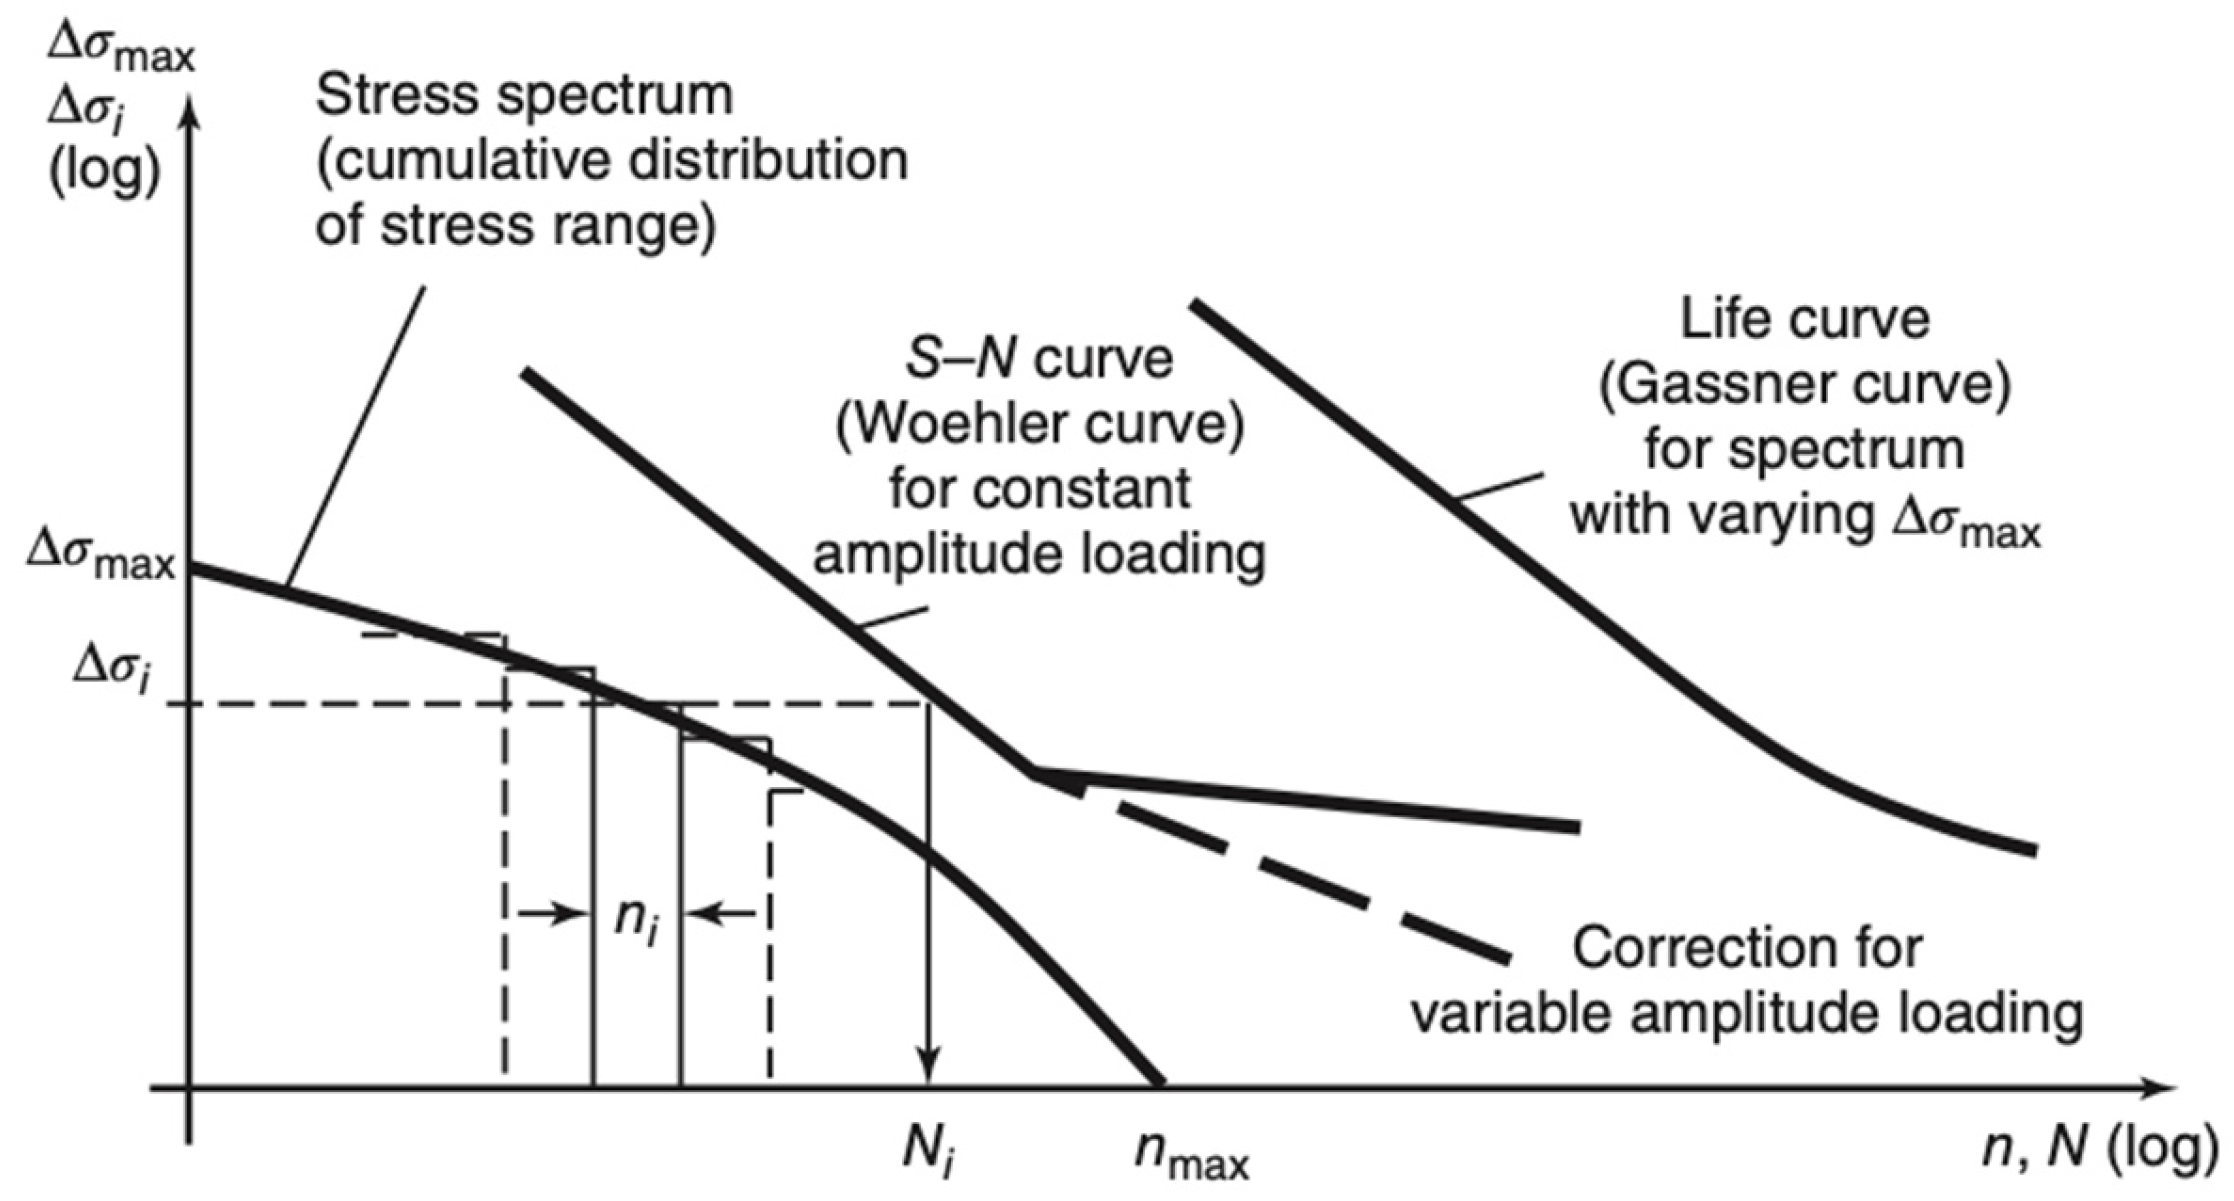
  • S–N approach, using appropriate Woehler S–N curves. For constant amplitude loading, these curves are used directly. In cases of variable amplitude loading, they are combined with the Palmer–Miner damage accumulation hypothesis;
  • Crack propagation approach: This method typically utilises the Paris–Erdogan law to assess the crack propagation phase until a defined failure criterion is reached. The initial crack phase may be disregarded if a pre-existing crack is assumed, or if there is already an existing crack [4].
Fatigue damage analysis involves assessing the progressive structural deterioration of materials subjected to cyclic loading. The analysis typically uses mathematical formulations to estimate the cumulative damage and predict the lifespan of the material. One common approach is the Palmgren–Miner rule, which assumes that damage accumulates linearly. The rule is expressed as follows (9):
D = n i N i
where n i is the number of cycles applied at a certain stress level, and N i is the number of cycles to failure at that same stress level. When D reaches 1, failure is predicted. Advanced formulations might incorporate nonlinear damage accumulation, considering factors like load interaction effects, material properties, and environmental conditions. These formulations address the limitations of linear models like the Palmgren–Miner rule, which assumes that damage accumulates uniformly regardless of the sequence or magnitude of loads. In reality, materials often exhibit complex behaviour under cyclic loading, where damage accumulation is influenced by factors such as load sequence, amplitude, and environmental conditions. Unlike the linear Palmgren–Miner approach, nonlinear models often use damage curve models that define the relationship between damage and the number of cycles in a more complex manner. For example, the damage might accumulate rapidly at first and then slow down, or vice versa, depending on the material and loading conditions. The Coffin–Manson relation is an example of a nonlinear approach, which is particularly useful for low-cycle fatigue. The Coffin–Manson relation is expressed as the following Equation (10):
Δ ϵ p = ϵ f ( 2 N f ) c
where Δ ϵ p is the plastic strain range, ϵ f is the fatigue ductility coefficient, N f is the number of cycles to failure, and c is the fatigue ductility exponent. This relationship emphasises the nonlinear relationship between strain amplitude and fatigue life, especially in scenarios where plastic deformation is significant.

3.3.1. S–N Approach

Fatigue damage is typically assessed using the Palmgren–Miner cumulative damage rule along with S–N curves, which are based on fatigue test results for specific materials and structural components. The Palmgren–Miner rule offers a method for estimating the fatigue life of a structure subjected to repetitive loading conditions [66]. It operates under the assumption that fatigue damage accumulates in a linear manner, summing up partial damages from various stress levels until the total damage reaches a critical point, leading to failure [67].
The primary parameter for evaluating fatigue damage is the stress range Δσ of individual loading cycles. This range helps determine the average stress value σm, which can be obtained through measurement or simulation using different methods, as discussed earlier (Figure 16) [4].
The S–N curve method combined with the Palmgren–Miner linear summation rule is a widely used approach for calculating fatigue damage [68]. The S–N curve illustrates the relationship between cyclic stress amplitude and the number of cycles until failure. The horizontal axis shows the number of cycles to failure on a logarithmic scale, while the vertical axis (which can be either linear or logarithmic) displays the stress amplitude of the cycles.
These S–N curves are obtained from fatigue tests performed on material samples subjected to cyclic stress with constant amplitude. Figure 17 demonstrates the basic principles of the S–N approach, featuring a Weibull-based stress spectrum with a maximum stress range Δσmax and the total number of load cycles nmax.
The spectrum is subdivided into i blocks for numerical analysis, each containing ni cycles. The S–N curve, describing the fatigue life for constant amplitude loading, is usually expressed above the knee point by the following Equation (11):
log N = log K − m log Δσ
where N represents the number of load cycles endured, Δσ is the stress range, K is a constant, and k is the slope exponent. After the knee point, the slope exponent adjusts to 2 m−1 to account for variable amplitudes; the life curve illustrates the number of stress cycles N that can be sustained for the same stress spectrum with varying maximum stress range Δσmax [4].
Various approaches exist for the S–N curve, with differences primarily arising from the type of stress parameter used: nominal stress, hot spot stress, structural stress, and notch stress:
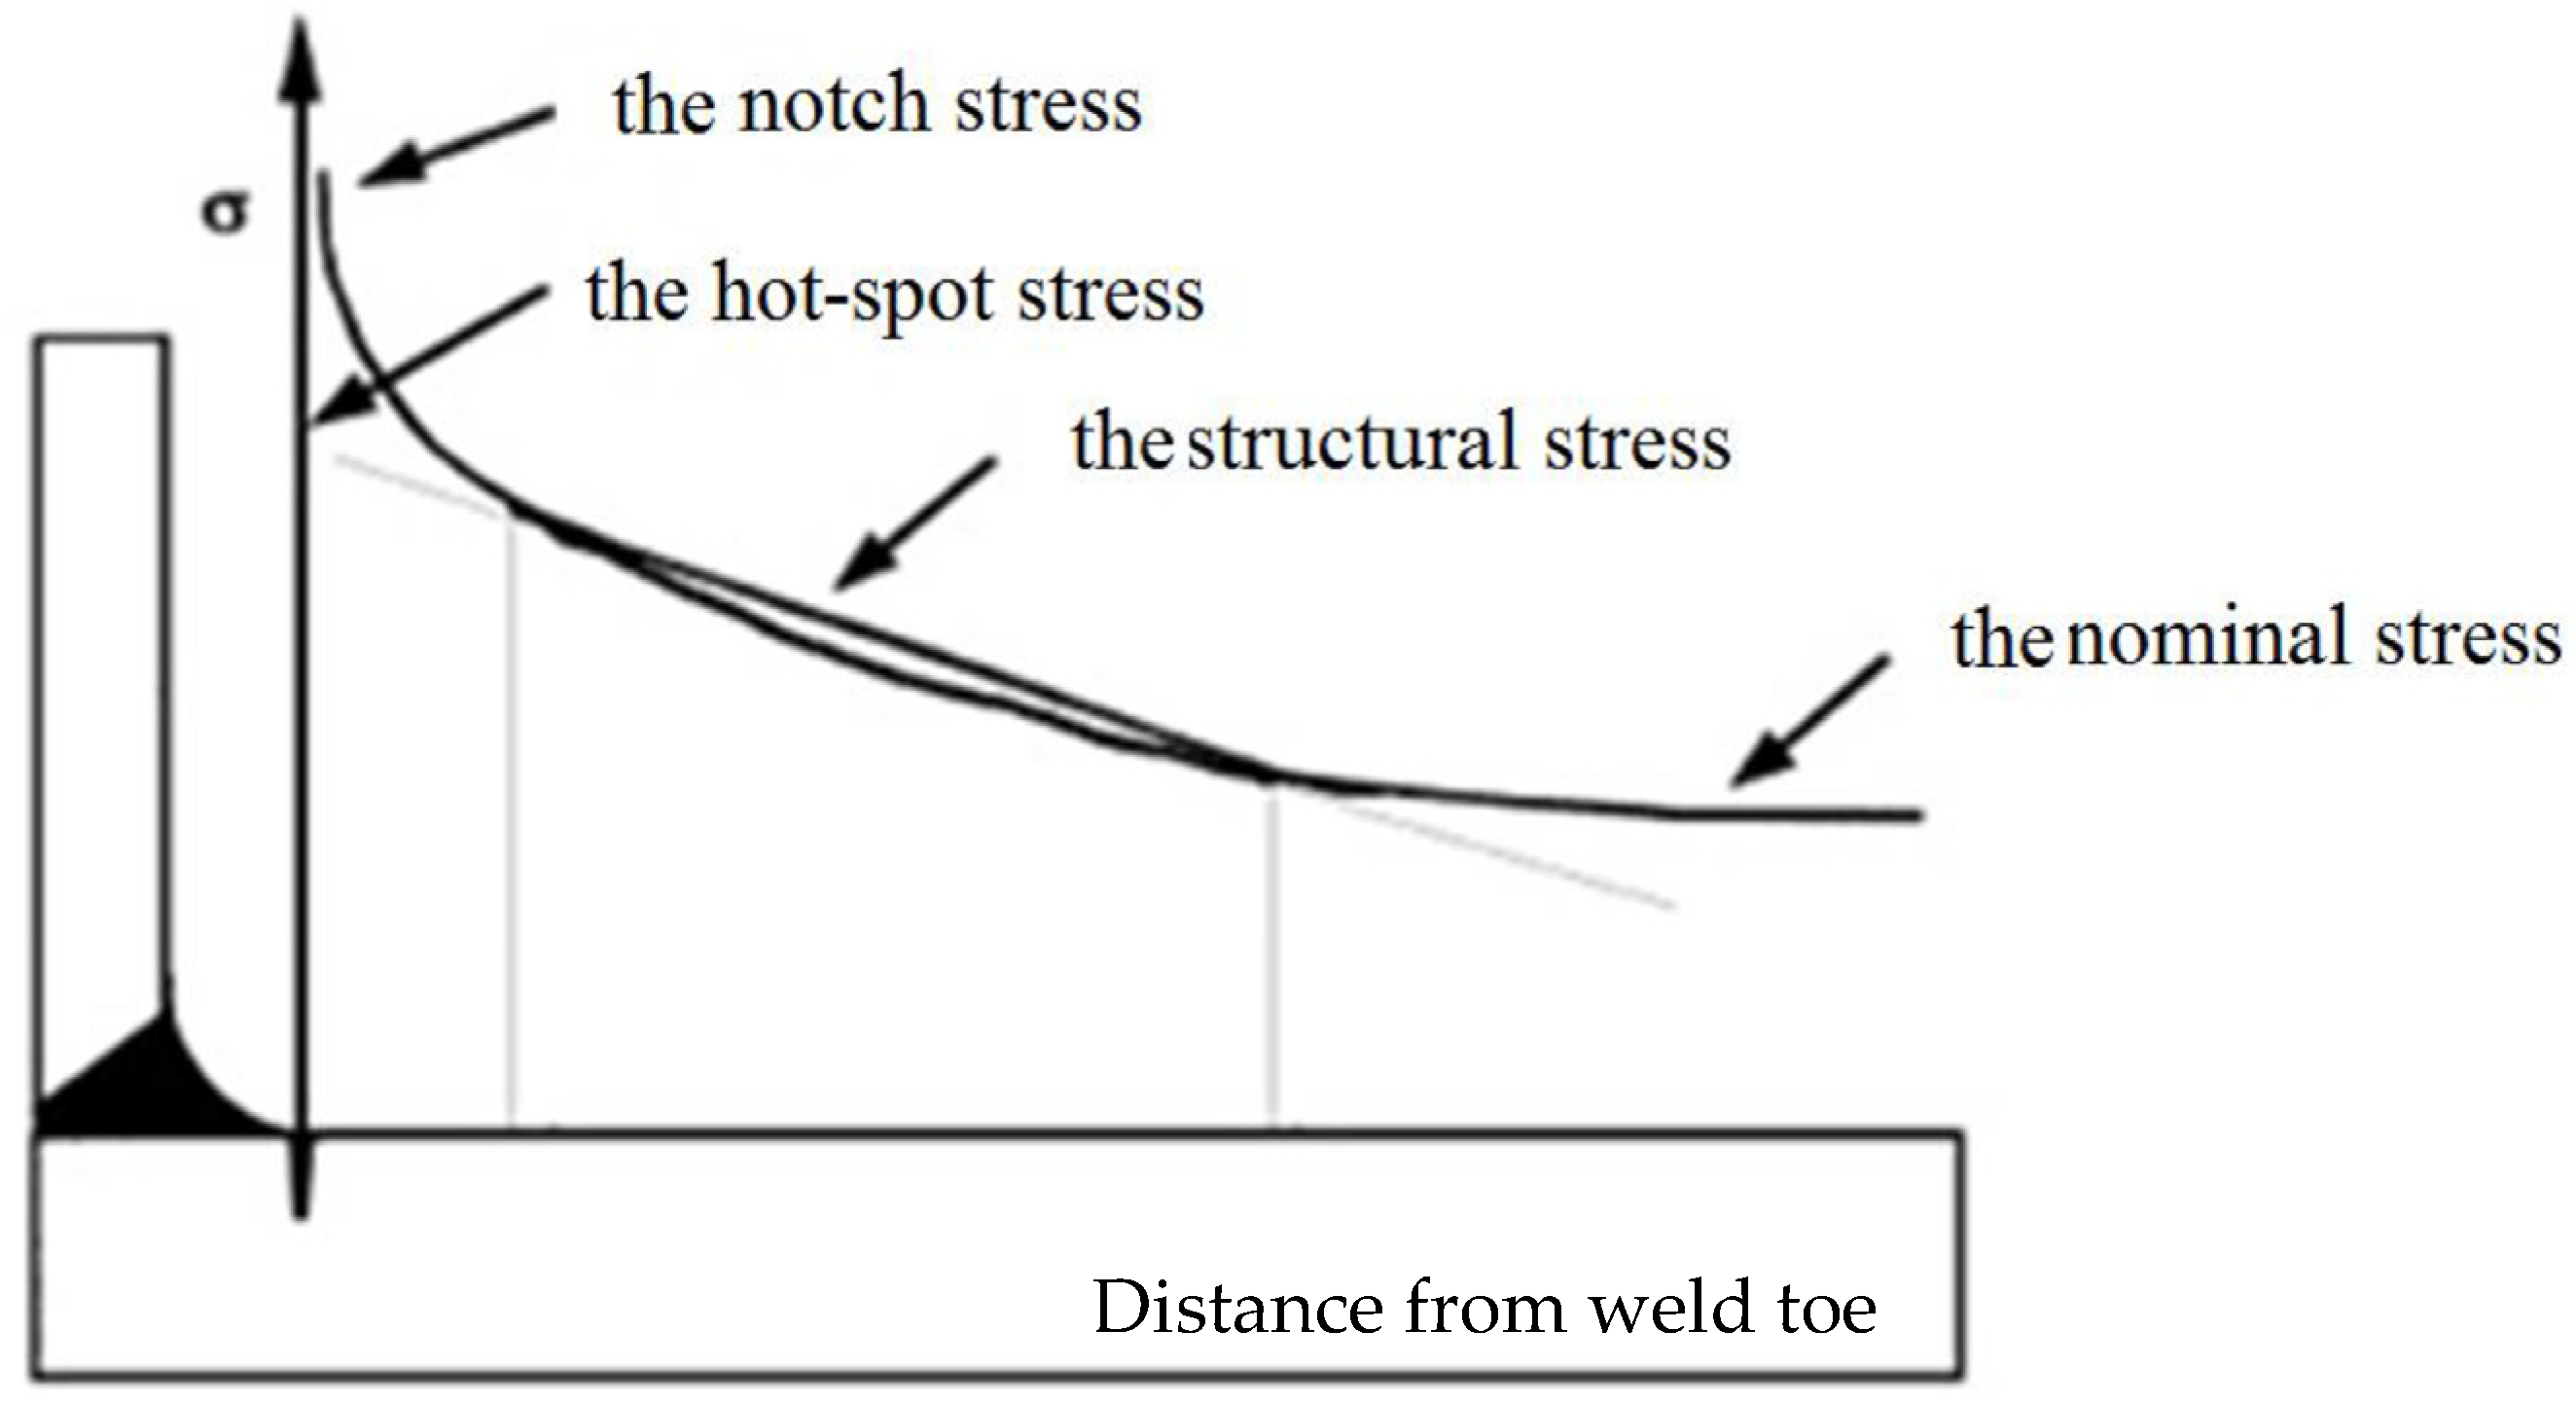
  • Nominal stress: This is the basic stress calculated by dividing the applied load by the cross-sectional area of the component. It assumes a uniform distribution of stress, ignoring any local effects due to the presence of the weld or geometric discontinuities. Nominal stress provides a general understanding of the loading condition but does n t account for stress concentrations.
  • Hot spot stress: Also known as geometric stress, this type considers the stress concentration effects caused by the overall shape and design of the structure near the weld, but it does not include the micro-level details of the weld itself. Hot spot stress is critical for evaluating the fatigue life of welded structures, particularly in areas where the geometry leads to increased stress but is not sharply localised.
  • Structural stress: Structural stress builds on nominal stress by incorporating the influence of stress concentrations at a macro level, such as those caused by welds or large geometric features. It offers a more detailed perspective than nominal stress by factoring in the structural effects of the weld toe but does not delve into the fine-scale details of stress distribution near the weld.
  • Notch stress: This stress type specifically addresses the high stress concentrations at sharp geometric features, such as the weld toe, where microscopic imperfections can lead to significant stress intensification. Notch stress is particularly important for assessing the likelihood of crack initiation and growth, making it crucial for predicting fatigue failure in welded joints. Accurately capturing notch stress often requires advanced modelling techniques due to the steep stress gradients present at these critical points.
To evaluate stress concentrations caused by the local geometry of welds, the notch stress approach is used, which defines stress as the locally increased peak stress at notches, weld toes, or cut-out edges [30,69]. Figure 18 shows the variations in stress according to these approaches at a weld toe.

3.3.2. Crack Propagation Approach
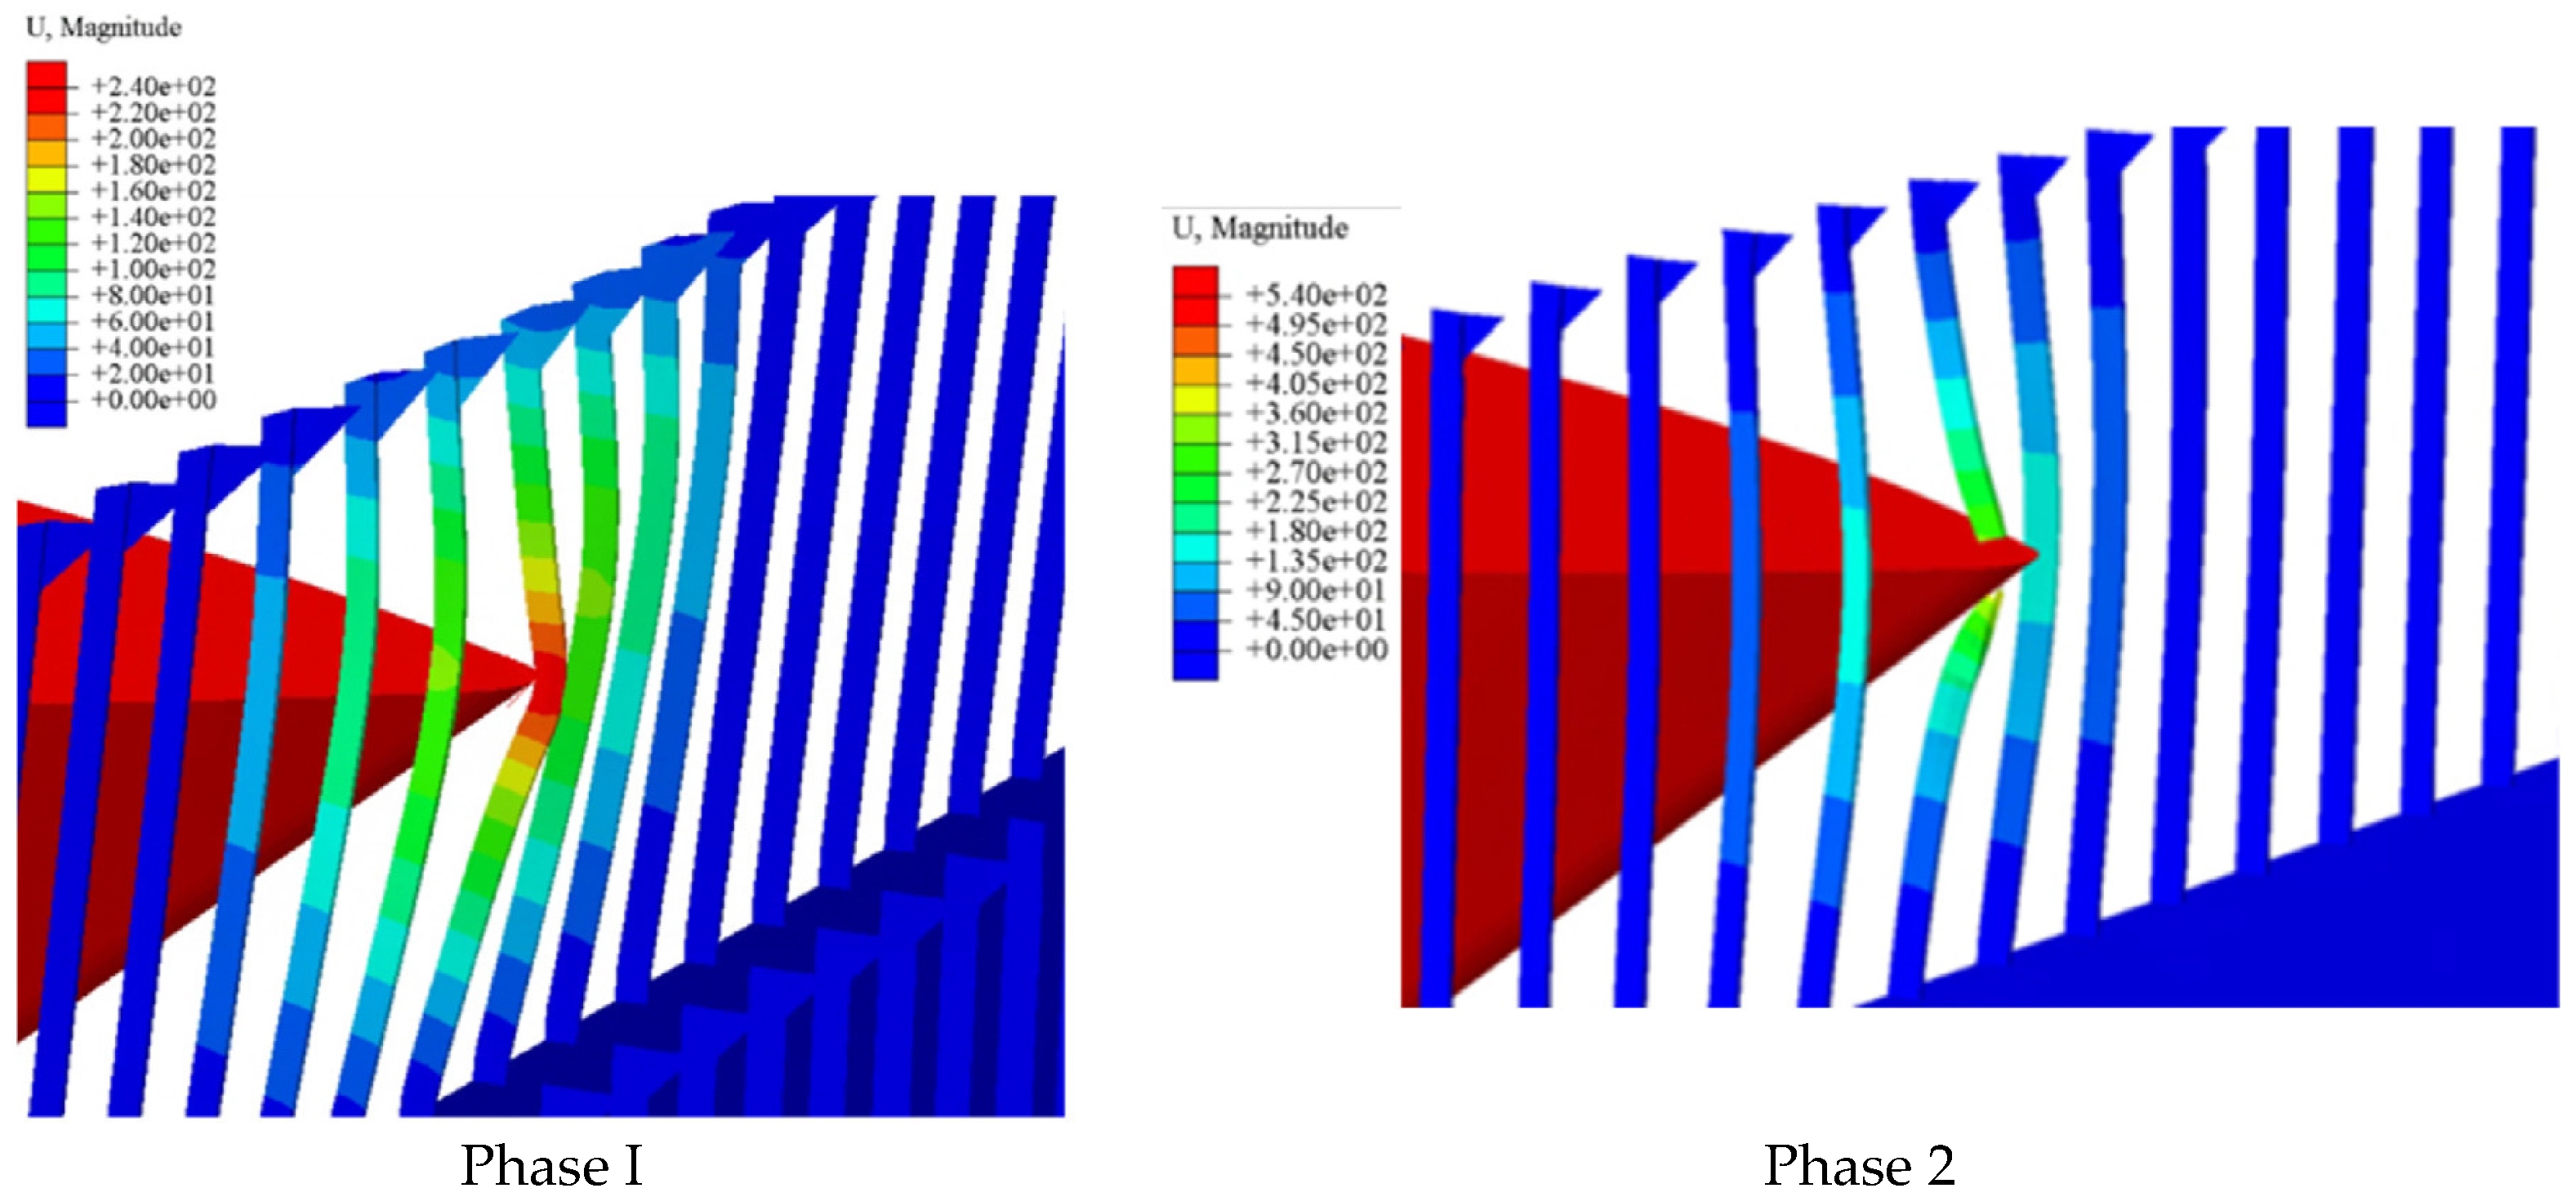
A limitation of the S–N curve method is its inability to forecast the initiation and growth of cracks. To address this shortcoming, fatigue crack propagation methods grounded in fracture mechanics are utilised for evaluating welded joints, particularly when cracks are detected either during the construction phase or through in-service inspections [70,71].
These crack propagation methods operate on the principle that imperfections are likely to be present in welded structures. Research has demonstrated that predictions of fatigue life are significantly influenced by the size of initial cracks. Over time, these approaches have evolved and become more refined, and they are now incorporated into certain codes. Essential inputs for assessing fatigue life using fracture mechanics include crack dimensions, material parameters for crack growth, and the applied stress ranges.
Doshi and Vhanmane [68] presented a methodology of evaluation of fatigue life of the longitudinal stiffener and transverse web frame connection on an oil tanker, using fracture mechanics. This study showed that the fatigue life predictions based on fracture mechanics are very conservative, in accordance with the predictions delivered by S–N curves.

4. Collision

Preventing collisions is essential for ensuring navigation safety at sea. Assessing the risk of collisions, especially in congested waters, is crucial for early warning and managing maritime traffic. A study of medium-sized tankers [72] highlights that collisions are the primary cause of tanker incidents, with grounding as the second most common cause. The likelihood of collisions increases significantly under extreme sea conditions. Although the effect of waves on such incidents has been explored, it has been studied in a limited number of cases [73].
For vessels with a high risk of environmental pollution, such as oil tankers, collision damage is particularly significant. A collision involving an oil tanker can lead to substantial oil spills, resulting in severe economic and environmental damage. Significant damage from collisions or groundings can elevate fluctuating stress levels and cause stress concentrations around irregularly shaped damage areas. As a result, even minor damage can lead to the development and propagation of fatigue cracks, weakening the structural integrity. In scenarios where a damaged ship encounters large wave amplitudes, the accumulation of damage can lead to low-cycle fatigue, which should be considered a major failure mode associated with ultimate or accidental limit states [74].
The IACS Harmonized Common Structural Rules (CSR-H) (IACS, 2013) are designed to evaluate the hull girder’s ultimate bending capacity in a damaged state under sea conditions, ensuring that it meets the criteria for residual strength. The vertical bending moment used in the ultimate strength assessment of the hull girder in its damaged state is calculated using the following Equation (12):
M D = γ S D M S W D + γ w D M w v
where MSW-D represents the allowable still water bending moment, Mwv is the rule vertical wave bending moment, γSD = 1.1 is the partial safety factor for the still water bending moment (SWBM) in the damaged condition, and γWD = 0.67 is the partial safety factor in damaged condition [75].
The fatigue assessment of damaged vessels using direct calculation methods has been explored by several researchers [76,77]. Cheng et al. proposed a method that combines both quantitative and visual approaches to assess changes in collision risk based on velocity space and collision risk characteristics [78]. Lee et al. [79] utilised a computational tool employing a two-dimensional linear approach to forecast hydrodynamic loads on damaged ships. Additionally, experimental tests on ship models were conducted to estimate hydrodynamic loads under various design scenarios. The theoretical predictions were then validated against experimental results. For intact conditions, predictions were made for a 20-year period at sea state 5, while for damaged conditions, predictions were based on 96 h of exposure at sea state 3. It was found that, although some cross-sections did not suffer structural damage, the total loads on these sections could increase significantly after damage compared to the original intact design loads. The comparison between theoretical and experimental results showed that, in damage scenarios, the two-dimensional linear method aligned reasonably well with measurements for vertical and horizontal bending moments. However, there were notable discrepancies between predicted and measured dynamic torsion moments, likely due to the effects of sloshing in the damaged compartments. Generally, the accuracy for predicting vertical bending moments was found to be better than that for horizontal bending moments. Another interesting study by Shi et al. [80] introduced a quantitative risk analysis method combining complex network theory with the decision-making trial and evaluation laboratory (DEMATEL) approach to examine the progression of ship collision incidents. By identifying risk influential factors (RIFs) and analysing the evolution model for ship collisions, the study utilised the topological features of complex networks. The research results highlighted key RIFs and offered insights into preventing ship collisions. Zhang et al. [81] developed a new analytical method to quickly assess the responses of side structures affected by a rigid raked bow in right-angle ship collisions resulting in significant indentation. Their approach involved numerical simulations to investigate the deformation mechanisms of primary structural components. The side structure was analysed by dividing it into crucial components, and a new model was created to evaluate hull shell plating and stiffeners under severe lateral impact (Figure 19).
Haris and Amdahl proposed a simplified analytical procedure to analyse ship collisions, considering the interaction between the deformations of the impacting and impacted vessels. They used finite element software LS-DYNA for numerical simulations, generating virtual experimental data for various collision scenarios and validating the method. This simplified approach allows for rapid and accurate analysis of right-angle ship-to-ship collisions, taking only a few hours compared to the days required for full numerical simulations. The simplified method’s accuracy varies between 2 and 13% compared to numerical simulations. Similar analyses were conducted in other studies [82,83], using both analytical and finite element approaches to examine model-scale and full-scale collision events. Zhang et al. [84] performed 18 experimental tests and one full-scale collision, presenting energy absorption–penetration and collision force–penetration curves. The finite element simulations confirmed that the analytical method consistently matched the experimental results.

5. Welded Joints

As discussed in the previous chapter, cyclic wave motions create variable and intricate loadings on structures, which can lead to fatigue damage. Welded joints, commonly used in the marine industry, are often the weakest part of the structure due to the potential presence of crack-like defects.
Material properties of the joint area, where fatigue cracks are initiated and propagated, are one of the most important influencing factors. Nowadays, ship structures are generally built with high tensile strength steel: particularly, AH36, a common steel for shipbuilding that is typically used in general structures due to its good weldability and moderate strength; DH36, preferred for parts of the ship that require higher strength with reduced weight, such as the hull; and EH36, a shipbuilding steel that offers an excellent combination of strength and toughness, good weldability, and formability, available in prefabricated sections and heavy plates for hull construction and superstructure design. These types of materials improve the static strength of the structures but cannot improve the fatigue strength, especially in welded joints of plates and girder. Welded connections are generally preferred to rivetted, bolted, or adhesive [85] connections in steel structures, due to their characteristics of low cost, aesthetics, and geometrical flexibility. However, the complex nature of the welding process—usually associated with induced defects, residual stresses, and microstructural distortion—implies that the fatigue resistance at the welded connection areas is always inferior in comparison to the other types of joints [86]. For this reason, they represent a key point of major interest in the study of the fatigue failure mode of ship structures.
Time-domain or frequency-domain fatigue analysis approaches may be employed to assess the fatigue damage of welded structures exposed to random loadings. As indicated in the previous paragraphs, the frequency-domain approach requires knowing the total stress distribution around the weld toe, evaluated by traditional methods as nominal stress, hot spot stress, and notch stress. As presented in the Kalu and Liang review [87], an alternative weld stress evaluation method exists, called the equilibrium equivalent structural stress (EESS), proposed by Kyuba and Dong [88]. This method decomposes the weld toe stress distribution into three stress components: balanced primary membrane stress σm, bending stress σb, and self-equilibrating nonlinear stress σnl.
Welding processes modify the material and mechanical properties in that specific area and introduce a residual stress field [89] due to microstructural factors, with the local mechanical properties depending on the base material (BM), the heat-affected zone (HAZ), and the welded zone (WZ) [90], as shown in Figure 20. Consequently, welded joints become critical areas regarding fatigue damage due to the presence of possible crack-like defects [91].
Fatigue crack creation and propagation in welded joints are strongly influenced by different factors: welding geometry, material, residual stress, environment, welding method, filler material, and post-weld heat treatment [92]. Corigliano and Crupi [93] analysed the low-cycle fatigue behaviour of welded joints commonly used in shipbuilding, using the digital image correlation technique, which is a non-contact full-field technique. They showed that fatigue crack creation and propagation are strongly influenced by geometrical weld parameters and weld imperfections, such as misalignment, weld radius, flank angle, and weld thickness. The quality of the weld is crucial. Poorly executed welds can introduce stress concentrations and reduce fatigue life.
The material of the areas from which the crack begins to spread is also an important influencing factor. The fatigue crack initiation life is strongly related to that material’s properties.
Residual stresses, induced by the fabrication process, also have a significant impact on the fatigue life of welded joints. The welding-induced residual stresses can increase the stress of local stress–strain cycles, reducing the fatigue strength [94]. However, some post-weld treatment processes can introduce a favourable weld geometry that decreases residual stresses and improves fatigue strength.
A very interesting and recent study was carried out by Böhm and Kowalski [1] on the fatigue life estimation of explosive cladded transition joints using the spectral method. Transition joints between steel and aluminum are widely used in the shipbuilding industry, with different techniques. One of these is the explosive bonding technique, used to join two different types of material that otherwise could not be welded directly.
Fatigue tests were performed for specimens consisting of two welded plates on each side of the joint in steel Grade D and aluminum A5083, with a tension–compression cycle ratio = −1. The power spectral density (PSD) of the loading history is a crucial source of information for any frequency domain.
Finite element analysis was performed to assess the stresses inside the transition joint, using Goldak distribution for the heat source shape. The results of the simulation were presented in the form of normal stress distribution.
In order to calculate the fatigue life with the use of the frequency defined methods, we need to calculate the PSD of the Pierson–Moskowitz model, obtained from the recorded time series during tests. Then, the spectrum will be used to calculate its spectral moments.
Stress history material property tests of this type of transition joints were also analysed by Corigliano et al. [95]. A strain-based fatigue assessment of a butt-welded ship structural joint was studied by Dong et al. [96]. Another interesting study was also carried out by Makris et al. [97] regarding a spectral fatigue analysis of ship structures based on a stochastic crack growth state model. The proposed paper modelled both the randomness in the experienced sea states and the corresponding random sequence of the sea states that are encountered by the ship and contribute to fatigue accumulation. The article developed a fatigue assessment method that combined the usage of stochastic models to describe the fatigue process, while spectral analysis was employed to describe the fatigue loading. The combination of those two techniques was achieved by establishing a state model where time is treated as a discretised parameter. The proposed method also offered a robust process to generate realistic crack growth scenarios, which can be employed further for the development of structural monitoring systems. A recent study of Kowalsky et al. [98] proposed the fatigue strength of new explosively welded steel-aluminum transition joints used in ships. The paper presented the results of tension–compression fatigue tests of this new type of joint with a titanium Grade 1 interlayer. The paper discussed the advantages of the use of this type of connector in comparison with the classical approach of using bolted joints as connectors between non-weldable materials in ships.

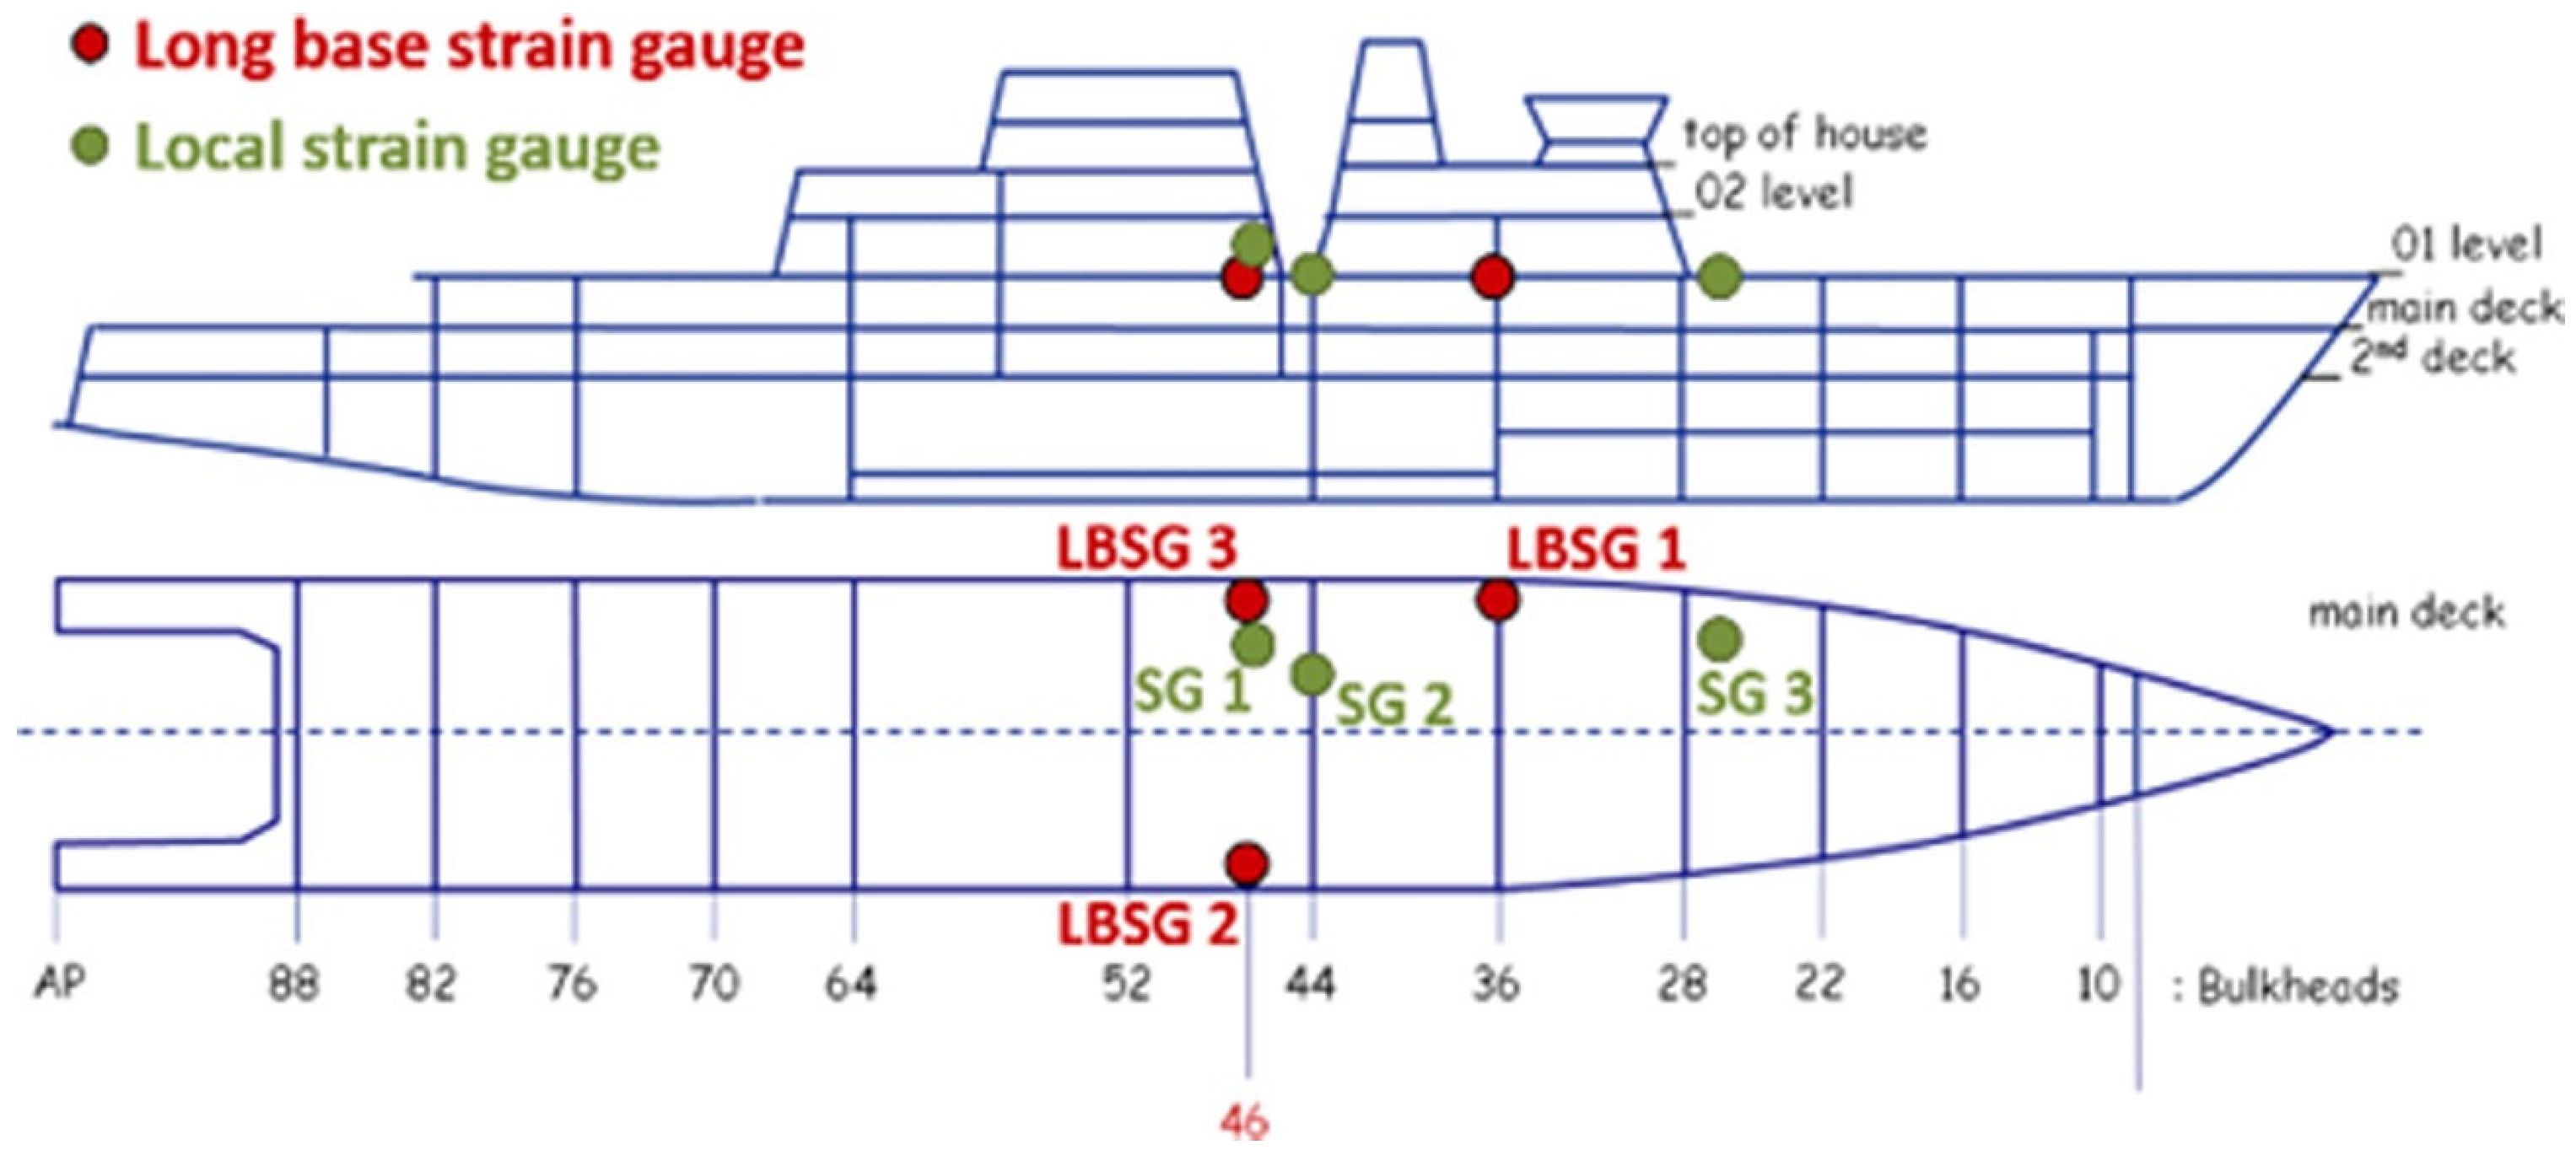
6. Onboard Monitoring of Hull Girder Stresses

Most past research activities focused on the development of reliable fatigue strength check criteria both in the frequency and time domains. Nevertheless, during the last two decades, a growing interest in the almost real-time monitoring of hull girder stresses was recognised, thanks to the wide development of data collection systems for hull girder continuous monitoring and the assessment of voyage performance.
Common non-destructive methods used for onboard monitoring of hull girder stresses include:
  • Strain gauges: These devices are mounted directly onto the hull to measure strain and stress in real time, providing continuous monitoring of structural conditions.
  • Acoustic emission testing (AET): This technique listens for the energy released from developing cracks or defects, enabling early detection of structural issues.
  • Ultrasonic testing (UT): High-frequency sound waves are employed to identify internal defects or changes in material properties, such as thickness variations in crucial areas.
  • Magnetic particle testing (MPT): This method is used to detect surface and near-surface flaws by applying magnetic particles to the surface and observing any disruptions in the magnetic field.
In this respect, Nielsen et al. [99] carried out a wide measurement campaign of hull girder stresses in a containership, with the main aim of determining the stress ranges and fatigue damage rates evaluated by the rainflow counting method, the Palmgren–Miner damage rule, and a faster fatigue analysis based on spectral methods in the time domain. They also combined full-scale measurements of onboard accelerations and hull girder stresses to evaluate the sea state parameters experienced by the ship along its route. Finally, they proved that by combining the estimated sea state parameters with a purposely developed fatigue damage prediction procedure, the estimate of fatigue damage rates could be provided to the onboard decision support system. Thompson [100] developed a virtual hull monitoring approach based on the full-scale measurements of hull girder stresses carried out onboard a naval vessel and compared the stresses measured by the strain gauges with the calculated values obtained by the wave spectra experienced by the ship along its route, based on wave hindcast data. Guachamin-Acero and Yandún [101] developed some criteria for route selection to reduce fatigue damage under directional bimodal and multimodal wave spectra. Chen et al. [102] proposed a new approach to assess the hull girder stresses based on estimated wave spectra. Hageman and Thompson [103] investigated the structural response of frigate by virtual hull monitoring after retrieving the wave conditions from two wave hindcast models and from the measurement of ship motions, based on the wave buoy analogy (Figure 21). The estimated hull girder stresses, obtained by the three wave datasets, were compared with strain measurements. They also estimated the accumulated fatigue damage at a midship bracket and carried out a sensitivity analysis of fatigue damage accumulation. They concluded that the fatigue damage assessment based on wave hindcast data agreed with the relevant values obtained by the strain measurements. Finally, VanDerHorn et al. [104] developed a digital twin model for the monitoring fatigue damage by combining vessel operational data and hindcast data with computational models to monitor the fatigue cumulative damage over time.

7. Conclusions

As discussed, the main cause of fatigue failure can be attributed to wave-induced loads. The fatigue life of ship structures is closely related to wave characteristics such as wave height, period, and steepness. To describe wave characteristics and define wave loads to which ships are subjected, the application of statistical methods is necessary. By means of Fourier analysis, irregular waves are decomposed into a series of harmonic regular wave components. The energy density of each harmonic regular component of the system is represented by an energy density spectrum in the time and frequency domains. In ship design, it is always preferable to use idealised wave spectra defined by theoretical formulae. As highlighted, the most widely used spectrum for engineering purposes is the Bretschneider spectrum, because it has the advantage of being valid for both fully developed sea and developing or endangered seas in the frequency domain. Despite their application restrictions, Pierson–Moskowitz and JONSWAP spectra still have great oceanographic importance because their application validity can also be extended to include cases other than those initially envisaged. Thanks to these theoretical spectra, every sea region in the world can be described with a very good approximation.
Once the energy spectrum of a wave system is defined, it is possible to describe the relationship between wave energy and wave-induced ship responses, in terms of ship motion and load distribution. Structural load determination can be categorised by different methods, but the frequency-domain method is the most extensively used method in fatigue analysis procedures. It is a statistical fatigue analysis technique based on the dynamic loading approach, known as spectral fatigue analysis, using strip theory approximations.
Finally, once the stress distribution is determined, in most cases, fatigue damage is calculated using the Palmgren–Miner cumulative damage rule in combination with S–N curves for the material, structural details, and welded joints.
The fatigue analysis procedure just described should be the background knowledge for the development of future theoretical/numerical models for predicting the fatigue life of ship structures subjected to different sea states. Several key guidelines should be followed to develop this model:
  • Detailed load representation: It is essential to capture the stochastic nature of sea states by incorporating wave spectrum data, ship speed, heading, and operational profiles, including the random distribution of wave heights and periods.
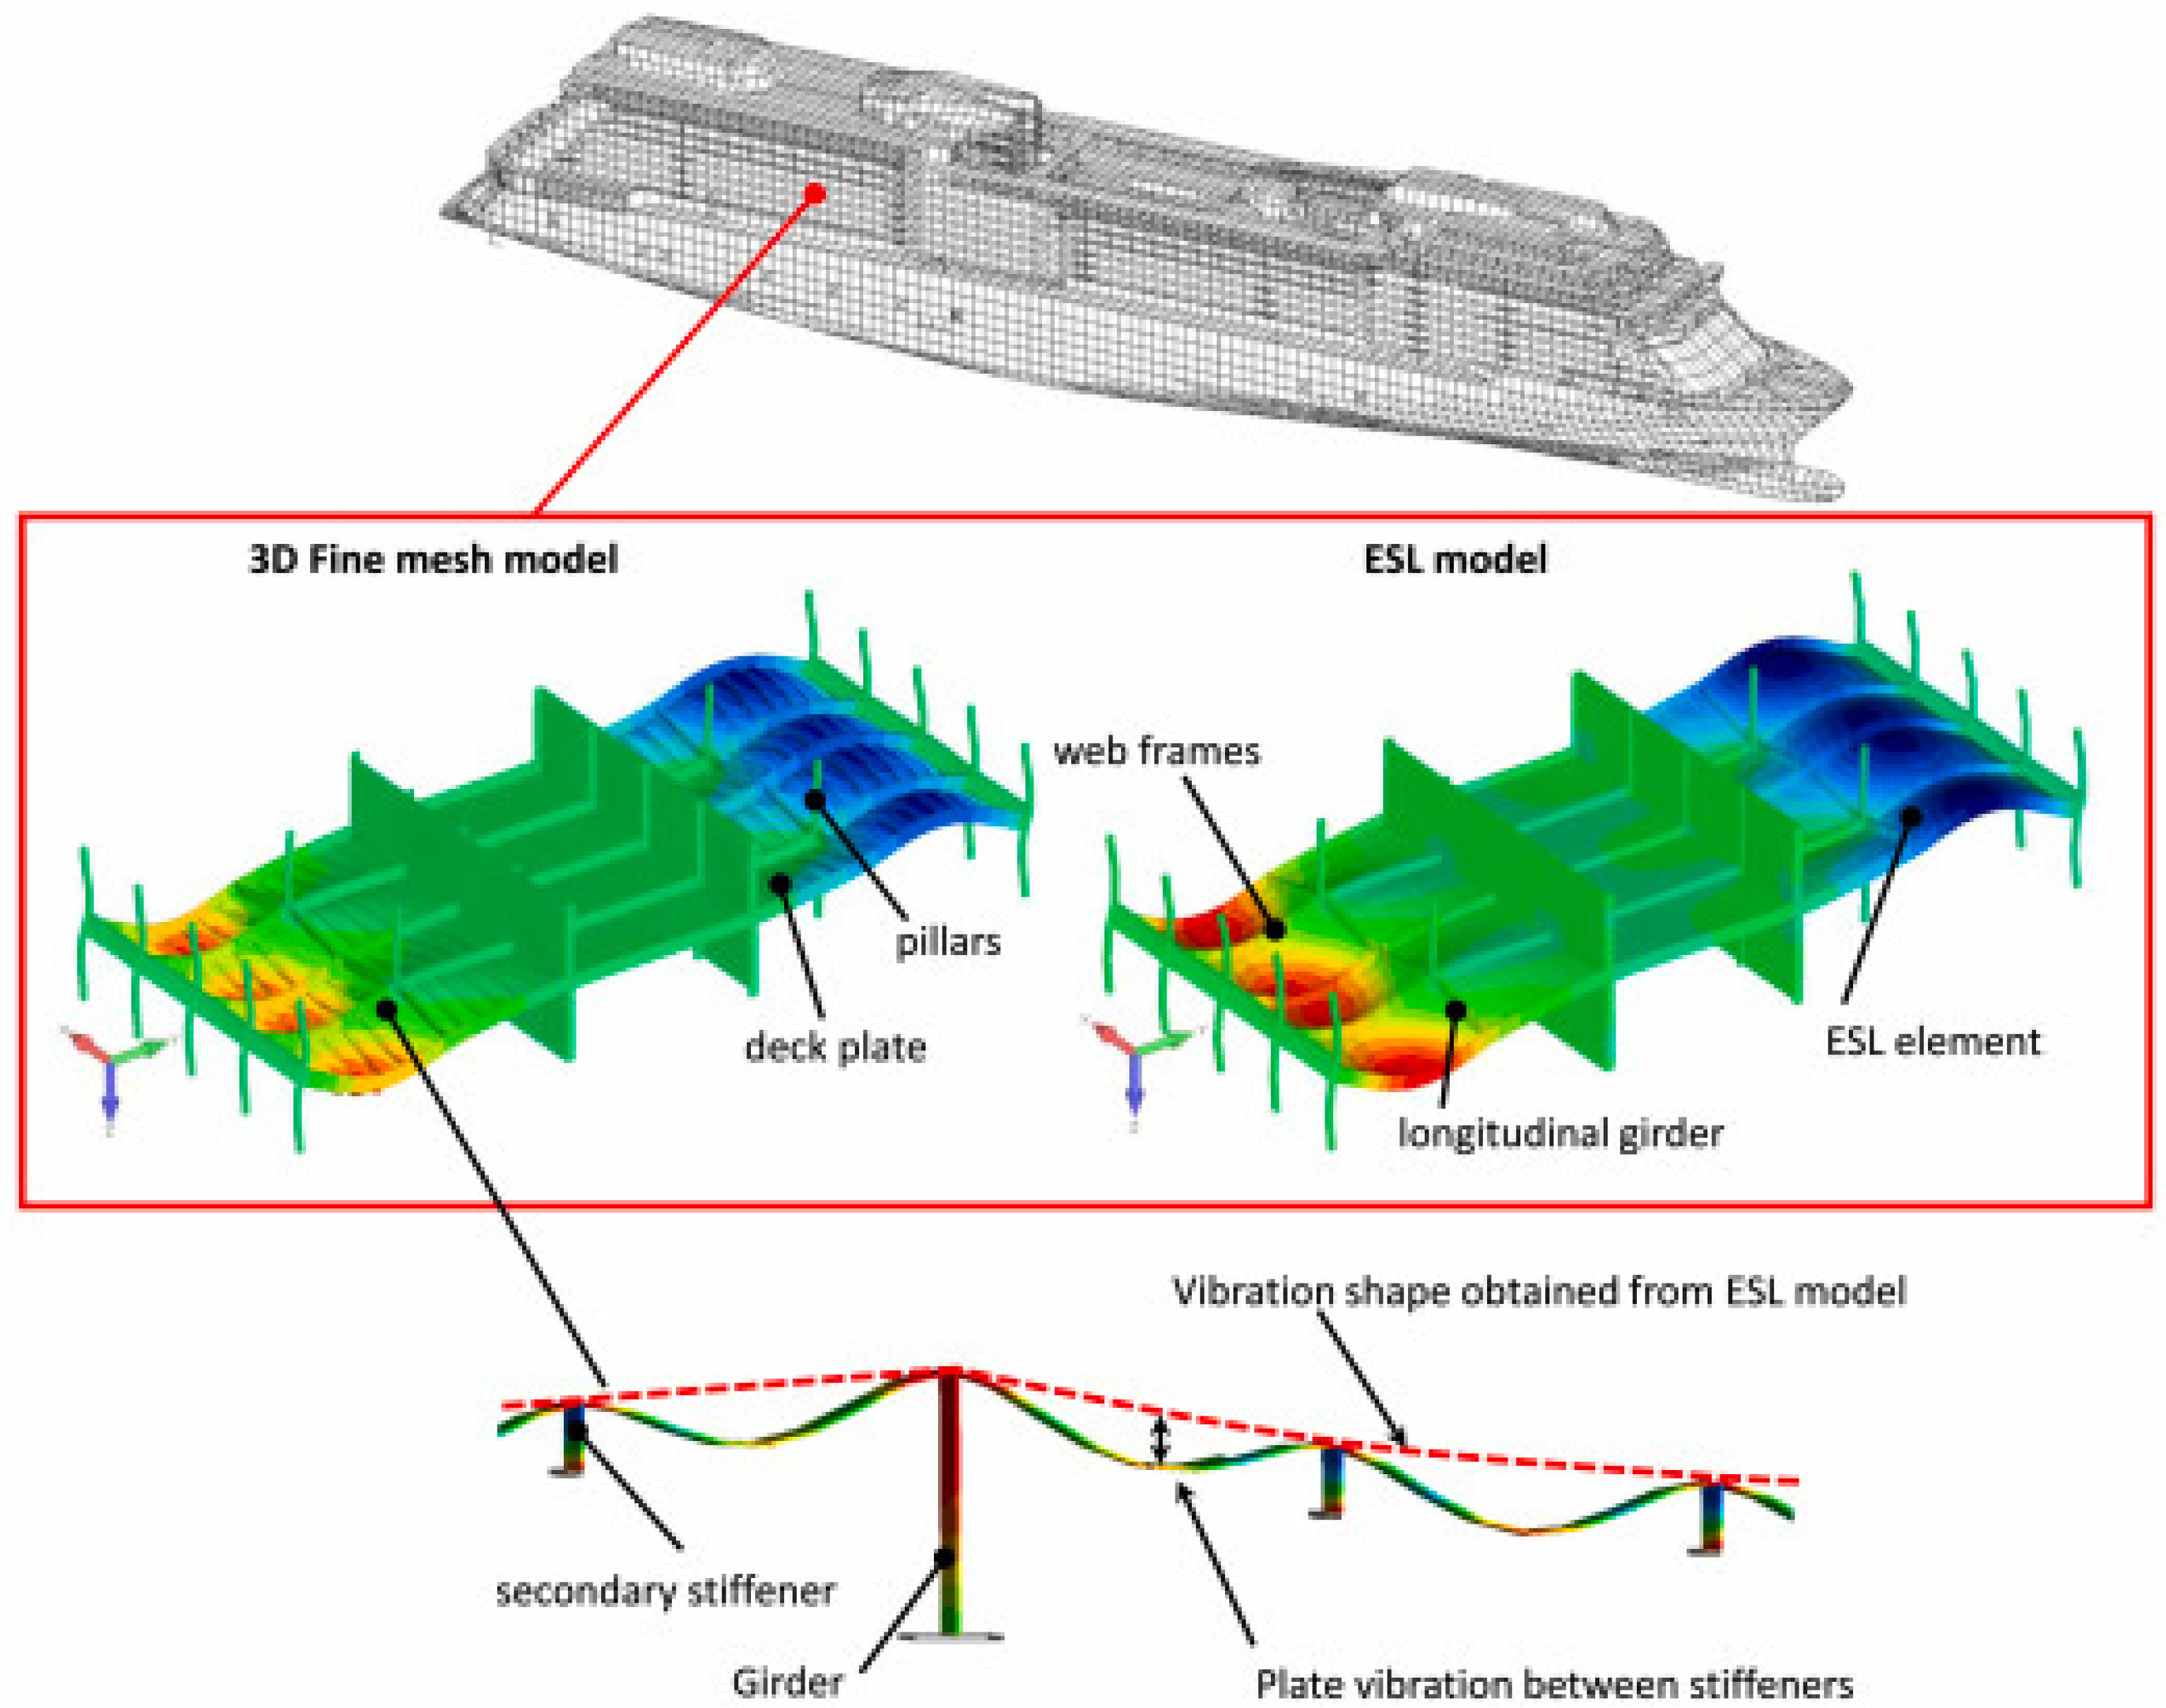
  • Structural response analysis: Implement advanced methods, such as finite element analysis (FEA), to simulate the structural response of the ship under dynamic loading conditions, considering both global hull girder stresses and local stress concentrations.
  • Material fatigue characteristics: Integrate material-specific S–N curves or more advanced fatigue models (e.g., strain–life or crack growth models) that account for the influence of corrosion, temperature, and load frequency.
  • Cumulative damage assessment: Use appropriate damage accumulation models, like Miner’s rule or more advanced nonlinear models, to assess cumulative fatigue damage under variable amplitude loading.
  • Validation and calibration: Validate the model with experimental data or full-scale measurements, and calibrate it to ensure accuracy in predicting fatigue life under real operating conditions.
  • Computational efficiency: Ensure the model is computationally efficient for practical use, possibly by employing surrogate models or reduced-order modelling techniques.
By following these guidelines, a robust and reliable theoretical/numerical model can be developed for predicting the fatigue life of ship structures under varying sea states, ensuring improved safety and performance over the vessel’s operational life.

8. Bibliometric Analysis

The paper addresses fatigue damage as a critical failure mode in ship structures, focusing on the effects of cyclic loading due to wave-induced forces during a ship’s operational life. The review covers methods to assess fatigue under varying sea conditions, highlighting energy spectral methods and finite element analysis for predicting fatigue life in ship structures, particularly in welded joints and stress concentration areas.
The selected bibliography of 105 papers reflects a strong and growing interest in the study of fatigue in ship structures over recent decades. The increasing concern over maritime safety and the need for reliable ship design models have supplied extensive research in this domain. The paper’s bibliography reflects extensive collaboration across institutions and borders, with many studies resulting from joint efforts between universities, research institutes, and industry partners. Such collaborations have been critical in advancing the understanding of ship fatigue under wave loads. The timeline of the cited works suggests that the development of methods for analysing wave-induced fatigue has accelerated, particularly in the last 20 years, in line with advances in computational modelling and numerical simulation technologies.
The bibliography showcases a diverse range of methodological approaches, including experimental studies, theoretical models, and numerical simulations. This diversity highlights the complexity of the problem and the need for a multifaceted approach to accurately predict fatigue life. A significant proportion of the cited works come from prolific researchers and research groups who have consistently contributed to the field. These key contributors have established foundational models and methods that have been widely adopted and built upon by subsequent studies. Several papers explore finite element analysis (FEA) for detailed stress analysis in welded joints and other critical areas of ship hulls, providing a micro-level view that complements the macro-level wave load assessments. Future research is suggested to focus on refining existing models and developing new approaches that can better account for the variability in sea states and ship operational conditions, or developing tools that, even if approximated, can real-time monitor the fatigue life of the ship structure by counting the number of waves that cause a stress that goes beyond the fatigue limit in critical locations. The bibliometric analysis reveals that the study of fatigue in ship structures under wave-induced loads is a well-established and actively evolving field. The review paper contributes by synthesising the strengths and weaknesses of existing methods, offering valuable insights for the development of more reliable predictive models.

Author Contributions

Conceptualization, P.C.; writing—original draft preparation, P.C., F.F., C.C., M.A., V.P. and A.S.; writing—review and editing, P.C., F.F., C.C., M.A., V.P. and A.S.; visualization, P.C., F.F., C.C., M.A., V.P. and A.S.; supervision, P.C., M.A. and V.P. All authors have read and agreed to the published version of the manuscript.

Funding

This study was supported by the Research Project PRIN_2022PNRR_P2022Y3PBY_001 “MADELEINE”, CUP J53D23001980006, and projects funded under the National Recovery and Resilience Plan (NRRP), Mission 4 Component C2 Investment 1.1 by the European Union—NextGenerationEU.

Conflicts of Interest

The authors declare no conflict of interest.

References

  1. Böhm, M.; Kowalski, M. Fatigue Life Estimation of Explosive Cladded Transition Joints with the Use of the Spectral Method for the Case of a Random Sea State. Mar. Struct. 2020, 71, 102739. [Google Scholar] [CrossRef]
  2. He, X.; Soares, C.G. Experimental Study on the Dynamic Behavior of Beams under Repeated Impacts. Int. J. Impact Eng. 2021, 147, 103724. [Google Scholar] [CrossRef]
  3. Xia, T.; Yang, P.; Li, C.; Hu, K. Numerical Research on Residual Ultimate Strength of Ship Hull Plates under Uniaxial Cyclic Loads. Ocean Eng. 2019, 172, 385–395. [Google Scholar] [CrossRef]
  4. Fricke, W. Fatigue and Fracture of Ship Structures. In Encyclopedia of Maritime and Offshore Engineering; Wiley: New York, NY, USA, 2017; pp. 1–12. [Google Scholar]
  5. Ræstad, A.E.; Gjestland, T. Propeller- and Thruster-Induced Noise and Vibration. In Encyclopedia of Maritime and Offshore Engineering; Wiley: New York, NY, USA, 2017; pp. 1–14. [Google Scholar]
  6. Dong, Y.; Garbatov, Y.; Guedes Soares, C. Review on Uncertainties in Fatigue Loads and Fatigue Life of Ships and Offshore Structures. Ocean Eng. 2022, 264, 112514. [Google Scholar] [CrossRef]
  7. Rossi, G.B.; Cannata, A.; Iengo, A.; Migliaccio, M.; Nardone, G.; Piscopo, V.; Zambianchi, E. Measurement of Sea Waves. Sensors 2022, 22, 78. [Google Scholar] [CrossRef]
  8. Holm Gjeraker, A. Response Amplitude Operator Estimation and Wave Modeling Sensitivity; NTNU: Trondheim, Norway, 2021. [Google Scholar]
  9. de Hauteclocque, G.; Maretic, N.V.; Derbanne, Q. Hindcast Based Global Wave Statistics. Appl. Ocean Res. 2023, 130, 103438. [Google Scholar] [CrossRef]
  10. Nabergoj, R. Fondamenti Di Tenuta Della Nave al Mare; Radoslav NABERGOJ: Trieste, Italy, 2010. [Google Scholar]
  11. Liu, C.M.; Hwung, H.H.; Yang, R.Y. On the Study of Second-Order Wave Theory and Its Convergence for a Two-Fluid System. Math. Probl. Eng. 2013, 2013, 253401. [Google Scholar] [CrossRef]
  12. Yang, W.; Liang, Y.; Leng, J.; Li, M. The Autocorrelation Function Obtained from the Pierson-Moskowitz Spectrum. In Proceedings of the 2020 Global Oceans 2020: Singapore—U.S. Gulf Coast, Biloxi, MS, USA, 5–31 October 2020. [Google Scholar]
  13. Prendergast, J.; Li, M.; Sheng, W. A Study on the Effects of Wave Spectra on Wave Energy Conversions. IEEE J. Ocean Eng. 2020, 45, 271–283. [Google Scholar] [CrossRef]
  14. McNatt, J.C.; Porter, A.; Ruehl, K. Comparison of Numerical Methods for Modeling the Wave Field Effects Generated by Individual Wave Energy Converters and Multiple Converter Wave Farms. J. Mar. Sci. Eng. 2020, 8, 168. [Google Scholar] [CrossRef]
  15. Kumar, N.K.; Savitha, R.; Al Mamun, A. Ocean Wave Characteristics Prediction and Its Load Estimation on Marine Structures: A Transfer Learning Approach. Mar. Struct. 2018, 61, 202–219. [Google Scholar] [CrossRef]
  16. Recommended Practice Det Norske Veritas DNV-RP-C205. Environmental Conditions and Environmental Loads. April 2014. Available online: https://www.dnv.com/ (accessed on 6 August 2024).
  17. Class Guideline. Fatigue and Ultimate Strength Assessment of Container Ships Including Whipping and Springing; DNV AS: Oslo, Norway, 2021. [Google Scholar]
  18. Nielsen, U.D.; Ikonomakis, A. Wave Conditions Encountered by Ships—A Report from a Larger Shipping Company Based on ERA5. Ocean Eng. 2021, 237, 109584. [Google Scholar] [CrossRef]
  19. Benasciutti, D.; Tovo, R. Spectral Methods for Lifetime Prediction under Wide-Band Stationary Random Processes. Int. J. Fatigue 2005, 27, 867–877. [Google Scholar] [CrossRef]
  20. Acanfora, M.; Rizzuto, E. Time Domain Predictions of Inertial Loads on a Drifting Ship in Irregular Beam Waves. Ocean Eng. 2019, 174, 135–147. [Google Scholar] [CrossRef]
  21. Ringwood, J.; Bacelli, G.; Fusco, F.; Ringwood, J.V. Control, Forecasting and Optimisation for Wave Energy Conversion. IFAC Proc. Vol. 2014, 47, 7678–7689. [Google Scholar] [CrossRef]
  22. Ascione, S.; Gaglione, S.; Piscopo, V.; Scamardella, A. Incidence of Parametrized Methods for Spectral Analysis of Ship Motion. In Proceedings of the 2023 IEEE International Workshop on Metrology for the Sea; Learning to Measure Sea Health Parameters, MetroSea 2023—Proceedings, La Valletta, Malta, 4–6 October 2023; pp. 170–175. [Google Scholar]
  23. Rossi, G.B.; Crenna, F.; Piscopo, V.; Scamardella, A. Comparison of Spectrum Estimation Methods for the Accurate Evaluation of Sea State Parameters. Sensors 2020, 20, 1416. [Google Scholar] [CrossRef]
  24. Rossi, G.B.; Crenna, F.; Berardengo, M.; Piscopo, V.; Scamardella, A. Investigation on Spectrum Estimation Methods for Bimodal Sea State Conditions. Sensors 2021, 21, 2995. [Google Scholar] [CrossRef]
  25. Piscopo, V.; Scamardella, A.; Gaglione, S. A New Wave Spectrum Resembling Procedure Based on Ship Motion Analysis. Ocean Eng. 2020, 201, 107137. [Google Scholar] [CrossRef]
  26. Fonseca, N.; Guedes Soares, C. Time-Domain Analysis of Large-Amplitude Vertical Ship Motions and Wave Loads. J. Ship Res. 1998, 42, 139–153. [Google Scholar] [CrossRef]
  27. Phelps, B.P. Aft-010-315-Determination of Wave Loads for Ship Structural Analysis; Defence Science and Technology Organisation: Chaklala, Pakistan, 1997. [Google Scholar]
  28. Journée, J.M.J.; Massie, W.W. Offshore Hydromechanics; Delft University of Technology: Delft, The Netherlands, 2001. [Google Scholar]
  29. Liu, Y.; Ren, H.; Feng, G.; Sun, S. Simplified Calculation Method for Spectral Fatigue Analysis of Hull Structure. Ocean Eng. 2022, 243, 110204. [Google Scholar] [CrossRef]
  30. Blagojević, B.; Domazet, Ž. Simplified Procedures for Fatigue Assesement of Ship Structures Simplified Procedures for Fatigue Assessement of Ship Structures. January 2002. Available online: https://www.researchgate.net/publication/310363752_SIMPLIFIED_PROCEDURES_FOR_FATIGUE_ASSESEMENT_OF_SHIP_STRUCTURES (accessed on 1 August 2024).
  31. Li, Z.; Mao, W.; Ringsberg, J.W. An Efficient Direct Calculation Approach for Fatigue Assessment of Container Ships Concerning Bending and Warping Stresses; American Society of Mechanical Engineers: New York, NY, USA, 2014. [Google Scholar]
  32. Li, Z.; Mao, W.; Ringsberg, J.W.; Johnson, E.; Storhaug, G. A Comparative Study of Fatigue Assessments of Container Ship Structures Using Various Direct Calculation Approaches. Ocean Eng. 2014, 82, 65–74. [Google Scholar] [CrossRef]
  33. Li, Z.; Ringsberg, J.W.; Storhaug, G. Time-Domain Fatigue Assessment of Ship Side-Shell Structures. Int. J. Fatigue 2013, 55, 276–290. [Google Scholar] [CrossRef]
  34. Yue, J.; Yang, K.; Peng, L.; Guo, Y. A Frequency-Time Domain Method for Ship Fatigue Damage Assessment. Ocean Eng. 2021, 220, 108154. [Google Scholar] [CrossRef]
  35. Ariduru, S. Fatigue Life Calculation by Rainflow Cycle Counting Method. Master’s Thesis, Graduate School of Natural and Applied Sciences of Middle East Technical University, Ankara, Turkey, 2004. [Google Scholar]
  36. Mao, W. Development of a Spectral Method and a Statistical Wave Model for Crack Propagation Prediction in Ship Structures. J. Ship Res. 2014, 58, 106–116. [Google Scholar] [CrossRef]
  37. Cui, W.; Wang, F.; Huang, X. A Unified Fatigue Life Prediction Method for Marine Structures. Mar. Struct. 2011, 24, 153–181. [Google Scholar] [CrossRef]
  38. Choung, J.-M.; Kim, K.-S.; Nam, J.-M.; Koo, J.-B.; Kim, M.-S.; Shim, Y.-L.; Urm, H.-S. Study on Applicability of Frequency Domain-Based Fatigue Analysis for Wide Band Gaussian Process II: Wide Band Prediction Models. J. Soc. Nav. Archit. Korea 2012, 49, 359–366. [Google Scholar] [CrossRef]
  39. Jung, B.-H.; Ahn, I.-G.; Seo, S.-K.; Kim, B.-I. Fatigue Assessment of Very Large Container Ships Considering Springing Effect Based on Stochastic Approach. J. Ocean Eng. Technol. 2020, 34, 120–127. [Google Scholar] [CrossRef]
  40. Senjanović, I.; Malenica, Š.; Tomašević, S. Hydroelasticity of Large Container Ships. Mar. Struct. 2009, 22, 287–314. [Google Scholar] [CrossRef]
  41. Bocquet, S. Ocean Wave Autocorrelation Function. Appl. Math. Comput. 2022, 426, 127114. [Google Scholar] [CrossRef]
  42. Garbatov, Y.; Georgiev, P. Carbon Intensity Assessment of a Bulk Carrier Operating in Different Sea State Conditions. J. Mar. Sci. Eng. 2024, 12, 119. [Google Scholar] [CrossRef]
  43. Nielsen, U.D.; Mounet, R.E.G.; Brodtkorb, A.H. Tuning of Transfer Functions for Analysis of Wave–Ship Interactions. Mar. Struct. 2021, 79, 103029. [Google Scholar] [CrossRef]
  44. Li, H.; Bachynski-Polić, E.E. Analysis of Difference-Frequency Wave Loads and Quadratic Transfer Functions on a Restrained Semi-Submersible Floating Wind Turbine. Ocean Eng. 2021, 232, 109165. [Google Scholar] [CrossRef]
  45. Ringsberg, J.W.; Li, Z.; Tesanovic, A.; Knifsund, C. Linear and Nonlinear FE Analyses of a Container Vessel in Harsh Sea State. Ships Offshore Struct. 2015, 10, 20–30. [Google Scholar] [CrossRef]
  46. Sesam User Manual. Sestra, Valid from Sestra Version 10.14.0; Including Copying or Recording, without the Prior Written Consent of DNV AS. DNV. Available online: https://sesam.dnv.com/download/userdocumentation/sestra-um.pdf (accessed on 1 August 2024).
  47. STOFAT. Fatigue Damage Calculation of Welded Plates and Shells, Valid from Program Version 4.1-00; DNV GL: Oslo, Norway, 2021; Available online: https://sesam.dnv.com/download/userdocumentation/stofat_um.pdf (accessed on 1 August 2024).
  48. Avi, E.; Laakso, A.; Romanoff, J.; Remes, H.; Lillemäe-Avi, I. Coarse Mesh Finite Element Model for Cruise Ship Global and Local Vibration Analysis. Mar. Struct. 2021, 79, 103053. [Google Scholar] [CrossRef]
  49. Kondo, A.; Kasahara, T.; Kanda, A. A Simplified Finite Element Model of Riveted Joints for Structural Analyses with Consideration of Nonlinear Load-Transfer Characteristics. Aerospace 2021, 8, 196. [Google Scholar] [CrossRef]
  50. Fajri, A.; Prabowo, A.R.; Muhayat, N. Assessment of Ship Structure under Fatigue Loading: FE Benchmarking and Extended Performance Analysis. Curved Layer. Struct. 2022, 9, 163–186. [Google Scholar] [CrossRef]
  51. Fricke, W.; Cui, W.; Kierkegaard, H.; Kihl, D.; Koval, M.; Mikkola, T.; Parmentier, G.; Toyosada, M.; Yoon, J.-H.; Hamburg-Harburg, T.U. Comparative Fatigue Strength Assessment of a Structural Detail in a Containership Using Various Approaches of Classification Societies. Mar. Struct. 2002, 15, 1–13. [Google Scholar] [CrossRef]
  52. Thompson, I. Validation of Naval Vessel Spectral Fatigue Analysis Using Full-Scale Measurements. Mar. Struct. 2016, 49, 256–268. [Google Scholar] [CrossRef]
  53. Li, M.; Boulougouris, E.; Lazakis, I.; Theotokatos, G. Analysis of the Wave-Induced Vertical Bending Moment and Comparison with the Class Imposed Design Loads for 4250 TEU Container Ship. In Proceedings of the International Conference of Maritime Safety and Operations 2016, Glasgow, UK, 13–14 October 2016. [Google Scholar]
  54. Drummen, I.; Storhaug, G.; Moan, T. Experimental and Numerical Investigation of Fatigue Damage Due to Wave-Induced Vibrations in a Containership in Head Seas. J. Mar. Sci. Technol. 2008, 13, 428–445. [Google Scholar] [CrossRef]
  55. Sun, Q.; Zhou, H.; Gu, Q.; Yuan, H. Study on the Wave Loads and Structural Stresses of Container Ship. J. Phys. Conf. Ser. 2018, 1064, 012033. [Google Scholar] [CrossRef]
  56. Liu, B.; Guedes Soares, C. Ultimate Strength Assessment of Ship Hull Structures Subjected to Cyclic Bending Moments. Ocean Eng. 2020, 215, 107685. [Google Scholar] [CrossRef]
  57. Li, S.; Hu, Z.; Benson, S. Progressive Collapse Analysis of Ship Hull Girders Subjected to Extreme Cyclic Bending. Mar. Struct. 2020, 73, 102803. [Google Scholar] [CrossRef]
  58. Kuznecovs, A.; Ringsberg, J.W.; Johnson, E.; Yamada, Y. Ultimate Limit State Analysis of a Double-Hull Tanker Subjected to Biaxial Bending in Intact and Collision-Damaged Conditions. Ocean Eng. 2020, 209, 107519. [Google Scholar] [CrossRef]
  59. Paik, J.K.; Lee, D.H.; Kim, S.J.; Thomas, G.; Ma, M. A New Method for Determining the Design Values of Wave-Induced Hull Girder Loads Acting on Ships. Ships Offshore Struct. 2019, 14, 63–90. [Google Scholar] [CrossRef]
  60. Akbar, M.S.; Prabowo, A.R.; Tjahjana, D.D.D.P.; Tuswan, T. Analysis of Plated-Hull Structure Strength against Hydrostatic and Hydrodynamic Loads: A Case Study of 600 TEU Container Ships. J. Mech. Behav. Mater. 2021, 30, 237–248. [Google Scholar] [CrossRef]
  61. Samson, N.; Ogbonnaya, E. Calculation for Hull Strength Construction in Offshore Structures (A Case Study of 5000 t Work Barge). West Afr. J. Ind. Acad. Res. 2013, 8, 3–12. [Google Scholar]
  62. Jankowski, J.; Bogdaniuk, M. Simulation of Wave Loads and Dynamic Stresses in Ship Hulls in Irregular Waves. Available online: https://citeseerx.ist.psu.edu/document?repid=rep1&type=pdf&doi=b59eed6e2879a36813fce807b2797fcab4607ed4 (accessed on 25 June 2024).
  63. Lang, X.; Wu, D.; Tian, W.; Zhang, C.; Ringsberg, J.W.; Mao, W. Fatigue Assessment Comparison between a Ship Motion-Based Data-Driven Model and a Direct Fatigue Calculation Method. J. Mar. Sci. Eng. 2023, 11, 2269. [Google Scholar] [CrossRef]
  64. Assessment of the Effect of Probabilistic Modeling of Sea-States in Fatigue Damage Calculations. J. Ship Ocean. Technol. 1999, 3, 1–12.
  65. Niesłony, A.; Böhm, M.; Owsiński, R. Formulation of Multiaxial Fatigue Failure Criteria for Spectral Method. Int. J. Fatigue 2020, 135, 105519. [Google Scholar] [CrossRef]
  66. Chen, N.Z.; Wang, G.; Guedes Soares, C. Palmgren-Miner’s Rule and Fracture Mechanics-Based Inspection Planning. Eng. Fract. Mech. 2011, 78, 3166–3182. [Google Scholar] [CrossRef]
  67. Kim, H.S. Theory and Practical Procedure for Predicting S-N Curves at Various Stress Ratios. J. Compos. Biodegrad. Polym. 2019, 7, 57–72. [Google Scholar] [CrossRef]
  68. Doshi, K.; Vhanmane, S. Probabilistic Fracture Mechanics Based Fatigue Evaluation of Ship Structural Details. Ocean Eng. 2013, 61, 26–38. [Google Scholar] [CrossRef]
  69. Su, W.; Cao, Q.; Cui, G.; Chen, Z. Investigations on Fatigue Life of Tube Connections Based on International Codes of Pressure Vessel. Materials 2023, 16, 231. [Google Scholar] [CrossRef] [PubMed]
  70. Zhang, P.; Li, J.; Zhao, Y.; Li, J. Crack Propagation Analysis and Fatigue Life Assessment of High-Strength Bolts Based on Fracture Mechanics. Sci. Rep. 2023, 13, 14567. [Google Scholar] [CrossRef] [PubMed]
  71. Voreux, O. Fatigue Crack Propagation Modeling Using a Local Approach to Fracture. Available online: https://hal.science/hal-02332845 (accessed on 30 July 2024).
  72. Eliopoulou, E.; Papanikolaou, A.; Eliopoulou, E.; Diamantis, P.; Papanikolaou, A. Casualties of Medium Size Tankers. In Proceedings of the SNAME 3rd International Symposium on “Ship Operations, Management and Economics”, Athens, Greece, 7–8 October 2011. [Google Scholar] [CrossRef]
  73. Antão, P.; Soares, C.G. Analysis of the Influence of Human Errors on the Occurrence of Coastal Ship Accidents in Different Wave Conditions Using Bayesian Belief Networks. Accid. Anal. Prev. 2019, 133, 105262. [Google Scholar] [CrossRef] [PubMed]
  74. Gledić, I.; Parunov, J.; Prebeg, P.; Ćorak, M. Low-Cycle Fatigue of Ship Hull Damaged in Collision. Eng. Fail. Anal. 2019, 96, 436–454. [Google Scholar] [CrossRef]
  75. Temarel, P.; Bai, W.; Bruns, A.; Dessi, D.; Dhavalikar, S.; Structures, M.; Gl, D.; Papanikolaou, N.A.; Parunov, J.; Song, K.H. Prediction of Wave-Induced Loads on Ships: Progress and Challenges. Ocean. Eng. 2016, 119, 274–308. [Google Scholar] [CrossRef]
  76. Li, Z.; Ringsberg, J.W. Direct Calculation of Fatigue Damage of Ship Structure Details. In Proceedings of the ASME 2011 30th International Conference on Ocean, Offshore and Arctic Engineering, Rotterdam, The Netherlands, 19–24 June 2011. [Google Scholar]
  77. Xu, W.; Hua, Z.; Ren, H.; Li, C.; Li, W. Analysis of the Direct Calculation Method of Ship Fatigue Damage Considering Slamming Load. Chin. J. Ship Res. 2022, 17, 264–272. [Google Scholar] [CrossRef]
  78. Cheng, Z.; Chen, P.; Mou, J.; Chen, L. Novel Collision Risk Measurement Method for Multi-Ship Encounters via Velocity Obstacles and Temporal Proximity. Ocean Eng. 2024, 302, 117585. [Google Scholar] [CrossRef]
  79. Lee, Y.; Chan, H.-S.; Pu, Y.; Incecik, A.; Dow, R.S. Global Wave Loads on a Damaged Ship. Ships Offshore Struct. 2012, 7, 237–268. [Google Scholar] [CrossRef]
  80. Shi, J.; Liu, Z.; Feng, Y.; Wang, X.; Zhu, H.; Yang, Z.; Wang, J.; Wang, H. Evolutionary Model and Risk Analysis of Ship Collision Accidents Based on Complex Networks and DEMATEL. Ocean Eng. 2024, 305, 117965. [Google Scholar] [CrossRef]
  81. Zhang, Y.; Yuan, Y.; Zhou, J.; Tang, W. A New Analytical Model to Evaluate Ship Side Collisions with Large Indentation Considering Interaction Effects between Structural Components. Mar. Struct. 2024, 95, 103596. [Google Scholar] [CrossRef]
  82. Fan, W.; Yuan, W.C. Numerical Simulation and Analytical Modeling of Pile-Supported Structures Subjected to Ship Collisions Including Soil-Structure Interaction. Ocean Eng. 2014, 91, 11–27. [Google Scholar] [CrossRef]
  83. Liu, B.; Guedes Soares, C. Assessment of the Strength of Double-Hull Tanker Side Structures in Minor Ship Collisions. Eng. Struct. 2016, 120, 1–12. [Google Scholar] [CrossRef]
  84. Zhang, S.; Villavicencio, R.; Zhu, L.; Pedersen, P.T. Ship Collision Damage Assessment and Validation with Experiments and Numerical Simulations. Mar. Struct. 2019, 63, 239–256. [Google Scholar] [CrossRef]
  85. Corigliano, P.; Ragni, M.; Castagnetti, D.; Crupi, V.; Dragoni, E.; Guglielmino, E. Measuring the Static Shear Strength of Anaerobic Adhesives in Finite Thickness under High Pressure. J. Adhes. 2021, 97, 783–800. [Google Scholar] [CrossRef]
  86. Barsoum, Z. Guidelines for Fatigue and Static Analysis of Welded and Un-Welded Steel Structures; TRITA-SCI-RAP; KTH Royal Institute of Technology: Stockholm, Sweden, 2020; ISBN 978-91-7873-478-8. [Google Scholar]
  87. Kalu, U.; Liang, X. An Equivalent Structural Stress-Based Frequency-Domain Fatigue Assessment Approach for Welded Structures under Random Loading. Materials 2023, 16, 7420. [Google Scholar] [CrossRef]
  88. Kyuba, H.; Dong, P. Equilibrium-Equivalent Structural Stress Approach to Fatigue Analysis of a Rectangular Hollow Section Joint. Int. J. Fatigue 2005, 27, 85–94. [Google Scholar] [CrossRef]
  89. Erny, C.; Thevenet, D.; Cognard, J.-Y.; Körner, M. Fatigue Life Prediction of Welded Ship Details. Mar. Struct. 2012, 25, 13–32. [Google Scholar] [CrossRef]
  90. Corigliano, P. On the Compression Instability during Static and Low-Cycle Fatigue Loadings of AA 5083 Welded Joints: Full-Field and Numerical Analyses. J. Mar. Sci. Eng. 2022, 10, 212. [Google Scholar] [CrossRef]
  91. Corigliano, P.; Crupi, V. Review of Fatigue Assessment Approaches for Welded Marine Joints and Structures. Metals 2022, 12, 1010. [Google Scholar] [CrossRef]
  92. Corigliano, P.; Cucinotta, F.; Guglielmino, E.; Risitano, G.; Santonocito, D. Thermographic Analysis during Tensile Tests and Fatigue Assessment of S355 Steel. Procedia Struct. Integr. 2019, 18, 280–286. [Google Scholar] [CrossRef]
  93. Corigliano, P.; Crupi, V.; Pei, X.; Dong, P. Structural strain approach for low-cycle fatigue life prediction of ship welded joints. In Sustainable Development and Innovations in Marine Technologies; CRC Press: Boca Raton, FL, USA, 2019. [Google Scholar] [CrossRef]
  94. Berto, F.; Vinogradov, A.; Filippi, S. Application of the Strain Energy Density Approach in Comparing Different Design Solutions for Improving the Fatigue Strength of Load Carrying Shear Welded Joints. Int. J. Fatigue 2017, 101, 371–384. [Google Scholar] [CrossRef]
  95. Corigliano, P.; Crupi, V.; Guglielmino, E.; Mariano Sili, A. Full-Field Analysis of AL/FE Explosive Welded Joints for Shipbuilding Applications. Mar. Struct. 2018, 57, 207–218. [Google Scholar] [CrossRef]
  96. Dong, Y.; Garbatov, Y.; Guedes Soares, C. Strain-Based Fatigue Reliability Assessment of Welded Joints in Ship Structures. Mar. Struct. 2021, 75, 102878. [Google Scholar] [CrossRef]
  97. Makris, P.; Silionis, N.; Anyfantis, K.N. Spectral Fatigue Analysis of Ship Structures Based on a Stochastic Crack Growth State Model. Int. J. Fatigue 2023, 176, 107878. [Google Scholar] [CrossRef]
  98. Kowalski, M.; Böhm, M.; Rozumek, D.; Kurek, A.; Correia, J. Fatigue Strength of New Explosively Welded Steel-Aluminum Transition Joint Used in Ships. Ocean Eng. 2023, 288, 115990. [Google Scholar] [CrossRef]
  99. Nielsen, U.D.; Jensen, J.J.; Pedersen, P.T.; Ito, Y. Onboard Monitoring of Fatigue Damage Rates in the Hull Girder. Mar. Struct. 2011, 24, 182–206. [Google Scholar] [CrossRef]
  100. Thompson, I. Virtual Hull Monitoring of a Naval Vessel Using Hindcast Data and Reconstructed 2-D Wave Spectra. Mar. Struct. 2020, 71, 102730. [Google Scholar] [CrossRef]
  101. Chen, X.; Okada, T.; Kawamura, Y.; Mitsuyuki, T. Estimation of Directional Wave Spectra and Hull Structural Responses Based on Measured Hull Data on 14,000 TEU Large Container Ships. Mar. Struct. 2021, 80, 103087. [Google Scholar] [CrossRef]
  102. Guachamin-Acero, W.; Portilla-Yandún, J. A Study on Vessel Fatigue Damage as a Criterion for Heading Selection by Application of 2D Actual Bimodal and JONSWAP Wave Spectra. Ocean Eng. 2021, 226, 108822. [Google Scholar] [CrossRef]
  103. Hageman, R.B.; Thompson, I. Virtual Hull Monitoring Using Hindcast and Motion Data to Assess Frigate-Size Vessel Stress Response. Ocean Eng. 2022, 245, 110338. [Google Scholar] [CrossRef]
  104. VanDerHorn, E.; Wang, Z.; Mahadevan, S. Towards a Digital Twin Approach for Vessel-Specific Fatigue Damage Monitoring and Prognosis. Reliab Eng. Syst. Saf. 2022, 219, 108222. [Google Scholar] [CrossRef]
Figure 1. Bretschneider spectrum for different values of the peak period [10].
Jmse 12 01608 g001
Figure 2. Pierson–Moskowitz spectrum for three wave heights [1].
Jmse 12 01608 g002
Figure 3. Comparison between JONSWAP and Bretschneider spectra [14].
Jmse 12 01608 g003
Figure 4. “Global Wave Statistics” sea areas [18].
Jmse 12 01608 g004
Figure 5. Narrow-band time series and the related frequency spectrum [10].
Jmse 12 01608 g005
Figure 6. Wide-band time series and the related frequency spectrum [10].
Jmse 12 01608 g006
Figure 7. Spectral calculation procedure for ship fatigue assessment adopted in [36].
Jmse 12 01608 g007
Figure 8. Sub-modelling from full-ship model to detailed local model [48].
Jmse 12 01608 g008
Figure 9. Coarse model to detailed local model [49].
Jmse 12 01608 g009
Figure 10. Fatigue critical location for different wave directions [50].
Jmse 12 01608 g010
Figure 11. Geometry locations on midship section model [50].
Jmse 12 01608 g011
Figure 12. Alternating stress and fatigue life results for bottom structural components (geometry 4) [50].
Jmse 12 01608 g012aJmse 12 01608 g012b
Figure 13. S–N curves of four investigated materials [50].
Jmse 12 01608 g013
Figure 14. Fatigue life results of different material types of geometry 4 [50].
Jmse 12 01608 g014aJmse 12 01608 g014b
Figure 15. Stress distribution diagram at A.P. 103 m~162 m under the vertical bending moment [55].
Jmse 12 01608 g015
Figure 16. Time-domain stress history for wave-induced loads [4].
Jmse 12 01608 g016
Figure 17. S–N approach [4].
Jmse 12 01608 g017
Figure 18. Different types of stresses on a welded toe [69].
Jmse 12 01608 g018
Figure 19. Deformation mode of the broken stiffener in phase I and phase II [81].
Jmse 12 01608 g019
Figure 20. Hardness measures results and identification of the three zones (WM, HAZ, BM) [91].
Jmse 12 01608 g020
Figure 21. Virtual hull monitoring strain gauges installed onboard the vessel [103].
Jmse 12 01608 g021
Table 1. Cyclic loading impact on ship structures.
Loading TypeImpact on the Structures
Hydrodynamic Loads (Propulsion Equipment on Hull)Causes cyclic stresses that can lead to fatigue cracking in the hull, particularly near the propeller and shaft areas.
Loads Due to Varying Loading ConditionsResults in uneven stress distribution, increasing the risk of localised fatigue and potential structural failure.
Wave LoadsInduces cyclic loading that can cause progressive fatigue damage over time, especially in rough seas, leading to potential structural integrity issues.
Table 2. Pros and cons of different energy wave spectra.
Wave SpectrumProsCons
Pierson–MoskowitzRepresents fully developed seas based on wind speed.Assumes idealised conditions (fully developed seas), which may not always match real-world situations.
BretschneiderWidely used for representing general sea states (fully developed and developing or endangered sea).Less accurate for very young or rapidly changing seas, as it doesn’t account for varying fetch and duration.
JONSWAPAccounts for fetch-limited sea conditions, providing a more realistic representation of actual sea states.More complex and requires additional parameters (like peak enhancement factor), making it less straightforward to use.
Table 3. Fatigue assessment approaches: pros and cons.
Fatigue Assessment
Approach
ProsCons
Simplified Deterministic MethodSimplicity: Easy to use with straightforward calculations and fewer data requirements.Oversimplification: May not capture complex load histories or stress distributions accurately.
Fast: Provides quick results, suitable for preliminary design and screening.Limited Accuracy: May lack accuracy in predicting fatigue life for complex geometries or loading conditions.
Standardisation: Often based on established guidelines and standards, making it widely accepted.No Detailed Analysis: Does not consider dynamic effects or transient loading in detail.
Cost-effective: Requires minimal computational resources and data.Assumptions: Often based on simplifications and assumptions that may not apply to all scenarios.
Direct Calculation Method (Time Domain)Detailed Analysis: Provides a thorough analysis of the time history of loading, capturing transient effects.Computationally Intensive: Requires significant computational resources, especially for long time histories.
Accuracy: Can model complex load histories and interactions between different loading components.Data Intensive: Requires detailed and accurate input data, which can be challenging to obtain.
Comprehensive: Allows for detailed evaluation of stress and strain responses over time.Complexity: Can be complex to implement and interpret, requiring specialised knowledge and software.
Versatility: Suitable for analysing real-world load conditions and dynamic effects.Time-consuming: Computationally expensive and time-consuming, especially for large-scale models.
Direct Calculation Method (Frequency Domain)Efficiency: Can efficiently analyse cyclic loading and periodic signals using frequency-domain techniques.Limited Scope: May not be suitable for non-stationary or highly transient loading conditions.
Simplifies Analysis: Useful for problems where load spectra can be represented as a sum of harmonic components.Assumptions: Assumes linear elastic behaviour and may not accurately model nonlinear or complex responses.
Fast Computation: Typically faster than time-domain methods for periodic or stationary signals.Frequency-Dependent: Requires transformation from time-domain data to frequency-domain data, which may introduce errors.
Linear Finite Element
Analysis
Detailed Analysis: Provides detailed stress and strain distributions, useful for complex geometries.Linear Assumptions: Assumes linear elastic material behaviour, which may not be accurate for all materials.
Versatility: Can model complex structures and loading conditions with high accuracy.Complex Setup: Requires detailed modelling and meshing, which can be time-consuming and complex.
Accuracy: Provides good results for linear problems and small deformations.Limited for Nonlinear: Not suitable for problems involving significant plastic deformation or complex material behaviour.
Nonlinear Finite Element AnalysisComplex modelling: Can model complex material behaviors, large deformations, and nonlinear effects.Computationally Intensive: Requires significant computational power and time, particularly for large models.
Accuracy: Provides high accuracy for complex, real-world problems involving plasticity, damage, and more.Complexity: More complex to set up and interpret, requiring advanced knowledge and expertise.
Versatility: Can handle a wide range of loading conditions and material models.Resource Demanding: Requires extensive computational resources and longer analysis times.
Detailed Results: Offers a detailed analysis of the structure’s behaviour under various loading conditions.Cost: Higher cost in terms of software, hardware, and analysis time.
Disclaimer/Publisher’s Note: The statements, opinions and data contained in all publications are solely those of the individual author(s) and contributor(s) and not of MDPI and/or the editor(s). MDPI and/or the editor(s) disclaim responsibility for any injury to people or property resulting from any ideas, methods, instructions or products referred to in the content.

